Planet Reliability Metrics: Astrophysical Positional Probabilities for Data Release 25 KSCI-19108-001 Stephen T. Bryson and Timothy D. Morton February 28, 2017 NASA Ames Research Center Moffett Field, CA 94035
KSCI-19108-001Stephen T. Bryson and Timothy D. Morton
February 28, 2017
NASA Ames Research Center
Moffett Field, CA 94035
KSCI-19108-001: Astrophysical Positional Probabilities February 28, 2017
Prepared by: Date: February 28, 2017Stephen T. Bryson, Kepler Science Office
Approved by: Date: February 28, 2017Michael R. Haas, Kepler Science Office Director
Approved by: Date: February 28, 2017Natalie Batalha, Kepler Project Scientist
2
KSCI-19108-001: Astrophysical Positional Probabilities February 28, 2017
Document Control
OwnershipThis document is part of the Kepler Project Documentation that is controlled by the KeplerProject Office, NASA/Ames Research Center, Moffett Field, California.
Control LevelThis document will be controlled under KPO @ Ames Configuration Management system.Changes to this document shall be controlled.
Physical LocationThe physical location of this document will be in the KPO @ Ames Data Center.
Distribution RequestsTo be placed on the distribution list for additional revisions of this document, please addressyour request to the Kepler Science Office:
Michael R. HaasKepler Science Office DirectorMS 244-30NASA Ames Research CenterMoffett Field, CA [email protected]
The correct citation for this document is: S. T. Bryson and T. Morton, 2017, Planet ReliabilityMetrics: Astrophysical Positional Probabilities for Data Release 25, KSCI-19108-001
3
KSCI-19108-001: Astrophysical Positional Probabilities February 28, 2017
Preface
This document is very similar to KSCI-19092-003, Planet Reliability Metrics: AstrophysicalPositional Probabilities, which describes the previous release of the astrophysical positionalprobabilities for Data Release 24. The important changes for Data Release 25 are:
• The computation of the astrophysical positional probabilities uses the Data Release 25processed pixel data for all Kepler Objects of Interest.
• Computed probabilities now have associated uncertainties, whose computation is de-scribed in §4.1.3.
• The scene modeling described in §4.1.2 uses background stars detected via ground-basedhigh-resolution imaging, described in §5.1, that are not in the Kepler Input Catalog orUKIRT catalog. These newly detected stars are presented in Appendix B.
Otherwise the text describing the algorithms and examples is largely unchanged from KSCI-19092-003.
Revision History:
Date Revision Revision Description Page(s)
2/28/17 KSCI-19108-001 Initial Release
4
KSCI-19108-001: Astrophysical Positional Probabilities February 28, 2017
Contents
1 Introduction 6
2 A Probabilistic Approach to Background False Positive Identification 10
3 From Likelihood to Probability 11
4 Implementation 124.1 Modeling the Transit Signal on a Known Star . . . . . . . . . . . . . . . . . 12
4.1.1 Measuring the Location of a Transit Source in the Kepler Pipeline . . 124.1.2 Modeling Transit Sources . . . . . . . . . . . . . . . . . . . . . . . . 134.1.3 Computing the Likelihood for Each Star . . . . . . . . . . . . . . . . 15
KSCI-19108-001: Astrophysical Positional Probabilities February 28, 2017
1 Introduction
This document describes the Kepler astrophysical positional probabilities (APP) table forData Release 25 (DR25) hosted at the Exoplanet Archive1. This table lists the stars withthe highest probability of being co-located with the source of an observed transit, as well asthe probability of the transit being on an unknown background source. The position of thetransit signal source relative to the target star is found in the KOI tables at the ExoplanetArchive. The probabilities provided in the APP table measure how likely it is that a star’slocation matches the location of the transit signal – they do not measure the probability thatthe transit signal is consistent with a planet orbiting that star.
For each star known to be near a Kepler Object of Interest (KOI), we compute the relativeprobability that the star is co-located with the transit source on the sky. We also compute theprobability that the transit source is due to an unknown background source, relative to theprobability for the known stars. These probabilities are relative in the sense that if one starhas twice the probability of another, then the first star is twice as likely to be co-located withthe transit source. Or if the probability for a star is twice the probability of the background,then that star is twice as likely to be the source of the transit as an unknown backgroundsource.
For a particular KOI, the relative probability is computed for stars that fall on the pixelsassociated with that KOI. These stars are provided by the catalogs described in §5. TheAPP table reports those probabilities for the KOI host, for the two stars with the highestprobability, one of which may be the host star, and the background probability. Each ofthese probabilities is given an uncertainty, whose computation is described in §4.1.3.
Example uses of the APP relative probabilities include:
• Automatic identification of which background star is the source of the transit signal.
• Identification of spurious offsets by modeling bias in the offset measurements.
• Assessing the probability that the transit is a false positive when there is a backgroundstar very close to the KOI host star.
The first two use cases are discussed futher in §5.4. The relative probability that the transitsignal source is co-located with the KOI host star is also of interest for exoplanet statisticalstudies. Derived planet properties depend critically on the details of the star that the planetorbits, and the planet properties reported in the Kepler planet candidate tables assume thatthe planet orbits the KOI host. So the probability that the transit signal is co-located withthe host star, given in the APP table, provides a measure of the reliability that the derivedplanet properties are correct.
The reliability of the relative probabilities varies from KOI to KOI, and some KOIs will nothave computed probabilities. These probabilities are computed using the results of centroidanalysis of Kepler data as described in §4.1.1. The quality of the computed probabilitiesdepends on the quality of the centroid data, and when the data is of low quality, for example
1http://exoplanetarchive.ipac.caltech.edu
6
KSCI-19108-001: Astrophysical Positional Probabilities February 28, 2017
when the transit S/N is very low, the resulting probabilities may be unreliable. The APPtable provides a metric measuring the quality of the host star probability computation, whichcan be used to exclude unreliable probability computations. For many KOIs these centroidsare unavailable or are known to be invalid, such as when the KOI host star is saturatedor highly crowded. When the centroids are unavailable or invalid the probabilities are notcomputed, and the probability computation is declared to have failed.
The ability of the relative probabilities to distinguish between two known stars is deter-mined by the accuracy of the underlying centroid data, which is in turn driven by the transitS/N. In some cases a star will have a relative probability near one while another star 1 arcsecaway will have a probability near zero. In other cases, where the centroid measurements havelower spatial precision, the stars must be several arcsec apart to have different probabilities.The smallest distance that can be distinguished is 0.2 arcsec due to an observed centroidnoise floor (see §4.1.3).
A simple alternative a priori probability of the transit signal being co-located with thetarget star is provided in the APP table for use in computing statistics when the probabilitycomputation is of low quality or has failed completely. This a priori probability is simply thefraction of KOIs whose transit signals are known to be offset from the KOI host star, whichis a strong function of Galactic latitude (see §5.3). This a priori probability should be usedstatistically, and should not be applied to the analysis of individual KOIs.
When the relative probability computation fails only the fields Kepler ID, KOI name anda priori probability are set.
The APP table has the following structure. Archive variable names are given in paren-theses.
• Identification parameters:
– Kepler ID (kepid) of the KOI host star.
– KOI name (kepoi name) of the transit signal being analyzed.
– Period (pp koi period) used in computing the relative probabilities. Not set whenthe probability computation fails.
– Epoch (pp koi time0bk) used in computing the relative probabilities. Not setwhen the probability computation fails.
– Transit depth (pp koi depth) in ppm used in computing the relative probabilities.Not set when the probability computation fails.
• Host star probabilities:
– Relative probability that the transit is co-located with the KOI host star(pp host rel prob, pp host rel prob err), or not set when the relative probabilitycomputation fails.
– A priori probability that the transit is co-located with the KOI host star(pp host prior prob), to be used when the relative probability computation fails.This is computed for all KOIs.
7
KSCI-19108-001: Astrophysical Positional Probabilities February 28, 2017
– Host star relative probability source flag (pp host prob prov). This flag takesone of the following values:
∗ PROB: The relative probability score is computed using the method de-scribed in this document.
∗ MATCH: The host star relative probability is set to zero because this KOIhas been determined to be a period-epoch match and the parent is not amongthe known stars used in the relative probability computation (Coughlin et al.,2014).
∗ FPWG: The relative probability computation failed but the host star relativeprobability is set to zero because the Kepler False Positive Working Group(FPWG) (Bryson et al., 2016) has examined this object and determined thatthe transit source is not co-located with the KOI host star. The state of thisflag reflects false positive determinations by the FPWG prior to January 1,2017.
∗ FAILED: The relative probability computation failed and there is no alter-native source of relative probabilities.
– Relative probability quality (pp host prob score). This quality value rangesfrom 0 to 1, and a value below about 0.3 indicates that the relative probabilitycomputation is likely to be untrustworthy.
• The Two Highest Relative Probability Stars: The two known stars with thehighest probability of being co-located with the transit signal source. There may beonly one known star considered in the probability computation. Several parameters aregiven for each star:
– Identifier of the star (pp 1hi starid, pp 2hi starid). This may be a catalognumber or a reference flag
– Star right ascension (pp 1hi ra, pp 2hi ra) in degrees
– Star declination (pp 1hi dec, pp 2hi dec) in degrees
– Star Kepler magnitude (pp 1hi kepmag, pp 2hi kepmag). Depending on thesource of information for this star, the Kepler magnitude uncertainty may be aslarge as two magnitudes.
– Relative probability that the transit is co-located with this star (pp 1hi rel prob,pp 1hi rel prob err, pp 2hi rel prob, pp 2hi rel prob err).
– The modeled transit depth (pp 1hi mod depth, pp 2hi mod depth) in parts permillion that best reproduces the observed transit depth used in the relative prob-ability computation described in §4.1.2. We do not expect this modeled depthto be accurate, but we provide it because it can indicate possible planetary-sizetransiting objects on stars other than the host star. This modeled depth dependscritically on the accuracy of the catalog used to model the flux around the KOIhost star and may be significantly in error. Therefore depths as large as 3 million
8
KSCI-19108-001: Astrophysical Positional Probabilities February 28, 2017
ppm are reported, so the modeled star may have to contribute negative flux inorder to reproduce the observed depth. Stars whose modeled depths are greaterthan 3 million ppm are rejected from consideration by the relative probabilitycomputation. The probability computation is itself relatively insensitive to suchlarge errors.
– Star provenance flag (pp 1hi prob prov, pp 2hi prob prov) indicates the sourceof the position and magnitude information for this star.
• Background Relative Probability (pp unk rel prob, pp unk rel prob err): The rel-ative probability that the transit source is co-located with an unknown backgroundobject rather than a known star, described in §4.2.
• Background Density (pp bkgd density): The modeled density of background sourcesfrom Morton and Johnson (2011) used in the computation of the background relativeprobability.
The stars considered in the relative probability computation are from several sources.These sources are the Kepler Input Catalog (Brown et al., 2011), the UKIRT catalog (Lawrenceet al., 2007) and various high-resolution imaging studies (see §5.1 and Appendix B). Thesource for a particular star is denoted by “KIC”, “UKIRT” or “hires” in their ID, followedby the catalog identifier (The UKIRT catalog identifier is called “source ID” in the UKIRTcatalog)2.
Every KOI in the APP table that has a successful relative probability computation (Hoststar relative probability source flag = PROB) has an APP report giving a table of all starsthat are considered in the relative probability computation. Each report also has a figure perstar, showing its position relative to the target star and, when possible, contours showing theobserved and modeled position distributions described in §4.1.3. These reports are availableat the Exoplanet Archive.
The rest of this document describes the computation of the astrophysical position prob-abilities. §2 introduces and motivates the basic approach. In §3 we describe how probabilityis derived from likelihood via Bayesian hypothesis testing, and §4 describes the implemen-tation. Specifically, §4.1.1 summarizes how transit locations are computed from the PRF-fittechnique. §4.1.2 describes how transits are modeled on each known star. §4.1.3 derives thelikelihoods from the modeled and observed data via smooth bootstrap techniques, with math-ematical details given in appendix A. The likelihood of the transit source being an unknownbackground object is treated in §4.2. Results are given in §5, starting with a discussion ofwhere the probability computation is unreliable. §5.4 illustrates the current method with afew examples.
2For instructions to access the UKIRT catalog, see http://keplergo.arc.nasa.gov/ToolsUKIRT.shtml.
9
KSCI-19108-001: Astrophysical Positional Probabilities February 28, 2017
2 A Probabilistic Approach to Background False Pos-
itive Identification
The Kepler Mission detects transiting exoplanets as well as background false positives thatare observationally separated from the target star (Koch et al., 2010). The most commonmethod for identifying background false positives is deriving the transit source location fromvarious centroid techniques, and flagging a KOI as a false positive if its transit source locationis more than 3σ from the target star (Bryson et al., 2013). Using the 3σ threshold makesit very unlikely that a transit signal on the target star will be misidentified as being on abackground source. This 3σ threshold has been used to identify offset false positives in theKOI tables at the Exoplanet Archive (Burke et al., 2014; Mullally et al., 2015; Coughlin etal., 2016). This threshold is, however, somewhat crude and has the following weaknesses:
• Methods that measure centroids are subject to unknown systematic biases.
• When there are one or more known field stars within 3σ of the target star, applyingthe 3σ threshold does not account for any field stars that may be consistent with thedata.
• The reliability of the claim that the transit signal is on the target star is interestinglydifferent when the measured signal source position is, for example, 1σ vs. 2.8σ fromthe target star, but both cases pass the threshold.
• The rate of background binaries depends strongly on Galactic latitude (Bryson et al.,2013), but this is not reflected in the threshold.
Generally speaking, there is more information available about the location of a transit signalthan a single position and a 3σ circle. This paper presents an analysis of the position of transitsignals measured by Kepler using this additional information to compute the probability thatthe transit source is on a known star. These probabilities often provide more insight thanthe 3σ approach.
Several methods are used by the Kepler Mission to identify background false positivesby determining that the observed position of the transit signal is not consistent with thetarget star position, as described in Bryson et al. (2013). In this paper we concentrate onthe PRF-fit difference image technique (summarized in §4.1), which is the most robust andprovides the highest precision. This method measures the position of a transit signal relativeto the target star for each Kepler observational quarter by analyzing the pixel flux valuesfor all transits in that quarter (see §4.1 for details). These measurements are subject tovarious systematic errors, in addition to photometric shot noise, which results in quarter-to-quarter variations of the measured centroid position. Averaging individual transits within aquarter is possible because Kepler’s exceptional pointing stability means that each transit’sflux variations stay on the same pixels. Across quarters, however, the stars fall on differentpixels, preventing averaging at the pixel level.
The offset of the transit signal from the target star is estimated via an average of the quar-terly offset measurements. Bryson et al. (2013) describes how this average is computed as a
10
KSCI-19108-001: Astrophysical Positional Probabilities February 28, 2017
χ2 minimizing fit. This average, however, may not represent the true location of the transitsource. Quarter-to-quarter systematics produce scatter in the quarterly position measure-ments, which can be thought of as a sampling of an unknown distribution of positions. Thebest estimate of the transit source location is given by the average of this unknown underly-ing distribution. The statistical bootstrap is an effective method of producing a distributionof averages of the measured quarterly transit location relative to the target star. The tra-ditional bootstrap method provides the distribution of averages as a set of discrete points.We convert these points to a continuous distribution with the smooth bootstrap technique3,which uses kernel density estimation techniques. We produce a continuous distribution ofaverage observed positions Do (x, y) for the transit location and, via modeling of the transiton each star s, continuous modeled distributions Ds (x, y). The models are based on stellarcatalogs, observed transit parameters, the effective PSF of the Kepler instrument, and knownnoise sources as described in §4.1. We consider the degree of overlap of these distributionsas a measure of the likelihood that a transit on star s is consistent with the observed transitlocation. We define the likelihood that the transit is on star s as the integral over the productof the distributions: Ls =
∫Do (x, y)Ds (x, y) dx dy. Because Do and Ds are densities Ls
has units of arcsecond−2.We compare the likelihood Ls that the transit is on star s with the likelihood Lt that the
transit is on star t by computing the ratio Hst = Ls
Lt. All stars known to fall on the pixels
collected for the target star are considered, as well as an unknown background. Similar tothe treatment in Gregory (2010), we convert the hypothesis ratios Hst into probabilites in§3.
This modeling approach addresses the above described weaknesses of the 3σ thresholdapproach in several ways:
• Systematic crowding bias is accounted for, so long as that crowding is due to knownstars.
• A continuous probability estimate more clearly describes borderline cases such as whenthere are stars within 3σ of the target star.
• The background binary density is accounted for so, for example, KOIs at low Galacticlatitude are more likely to be due to background objects.
3 From Likelihood to Probability
Hypothesis testing considers the ratio Hst = Ls
Lt, where Ls was defined in §2. Hypothesis s is
considered more likely than hypothesis t if Hst > 1.The hypotheses ratios satisfy Hst = H−1ts , so there is a large amount of redundancy among
the various Hst. In particular, thinking of Hst as a matrix for bookkeeping purposes, any
3See, for example, http://www.anawida.de/teach/SS12/compStat/Boots/smoothboot/smoothboot.pdf orEfron, B. and Tibshirani, R. J. (1994)
11
KSCI-19108-001: Astrophysical Positional Probabilities February 28, 2017
element can be expressed in terms of the elements of a specified column. For example, wecan express any of the Hst in terms of the first column Hs1:
Hst =LsLt
=LsL1
L1
Lt= Hs1H1t =
Hs1
Ht1
.
We eliminate this redundancy and convert each column into a set of relative probabilities bynormalizing each column by its sum: for each column t,
Hst → Hst ≡Hst∑wHwt
=LsLt
1∑wLw
Lt
=Ls∑w Lw
. (1)
These normalized hypothesis ratios Hst are independent of column: Hst = Hsw for any t andw, and
∑s Hst = 1. So we can define the probability of hypothesis s relative to the other
hypotheses as Rs = Ls∑w Lw
. Rs can be interpreted as a probability because 0 ≤ Rs ≤ 1 and∑sRs = 1.
4 Implementation
4.1 Modeling the Transit Signal on a Known Star
4.1.1 Measuring the Location of a Transit Source in the Kepler Pipeline
To set the context for how the transit signals are modeled and the resulting positions aremeasured, we briefly summarize how observed transit signal positions are measured relative tothe target star. The Kepler Pipeline uses the Kepler Pixel Response Function (PRF), whichprovides a model of how the flux from a star falls on CCD pixels, given a star’s positionand magnitude. The transit source location is measured using the PRF-fit difference imagemethod, which we describe briefly in the next paragraph. For details see Bryson et al. (2013).
An observed transit signal associated with a target star is identified and characterizedfrom the flux light curve obtained by summing the pixels in an optimal photometric aperturearound that target star (Jenkins et al., 2010, 2017). This photometric aperture is a subset ofa larger pixel mask collected for each target star (Bryson et al., 2010b). For each quarter thatcontains transits, the in-transit cadences are identified. All pixels associated with this targetstar are then averaged over the in-transit cadences, creating the average in-transit image.Cadences on either side of each transit in a quarter are similarly used to create an averageout-of-transit image. Subtracting the in-transit image from the out-of-transit image createsthe difference image for each quarter. Assuming that the transit signal is the only sourceof flux variation between the in- and out-of-transit images, the difference image provides adirect image of the transit source. The location of that transit source is measured by fittinga PRF model to the difference image, which determines the star position for which the PRF-modeled flux distribution best matches the difference image pixel values. Though this PRFfit provides a formal propagated uncertainty based on the input pixel value uncertainties, itdoes not include the systematics described below.
12
KSCI-19108-001: Astrophysical Positional Probabilities February 28, 2017
The quarterly offset of the transit source from the target star is obtained by subtractingthe position of the target star from the position of the transit source obtained from thePRF-fit to the difference image. The uncertainty of this offset is computed via standardpropagation of errors. The position of the target star is obtained from a PRF fit to theout-of-transit image. Using the PRF fit of the out-of-transit image to measure the targetstar position is preferred over the input catalog target star position because systematic PRFfit errors due to inaccuracies in the PRF model are generally common to both the differenceimage and out-of-transit fits, and will often cancel out. In addition, the target star positionin the input catalog has several sources of inaccuracy, such as unaccounted for proper motion.Using the PRF fit to the out-of-transit image assumes, however, that the target star is well-isolated so that this fit position gives the actual position of the target star. Crowding due tobackground stars will introduce a bias into the out-of-transit PRF fit position that is typicallynot present in the difference image. This introduces a crowding bias into the measurementof the transit source offset relative to the target star. One of the motivations for the workin this paper is to estimate this crowding bias for each target star. In extreme cases whenthere is another star of comparable or greater brightness near the target star, the PRF fitwill typically return an incorrect target star position. For example, the PRF fit may returna value between the target star and that bright, nearby star, or may lock on to the positionof the nearby star. If the out-of-transit PRF fit gives a target star location that is more thantwo arc seconds from the target star’s catalog location, then the transit location offsets areconsidered invalid and the APP computation will be marked as “FAILED”.
The PRF fit to the difference image is subject to various other systematics (Van Cleve etal., 2016), particularly due to flux variations other than the transit source, which introducenoise into the difference image. The result is that the quarterly offsets of the transit signallocation relative to the target star will have some scattered distribution. While this scatteris statistically near-Gaussian (in particular it is zero-mean) when averaged over all targets,it may be far from Gaussian for specific target stars.
4.1.2 Modeling Transit Sources
For each target star, in each quarter in which transits occur, we create a synthetic out-of-transit image for the pixels in that target star’s pixel mask using techniques similar to thosedescribed in Bryson et al. (2010b). Specifically, stellar catalogs and the Kepler PRF model(Bryson et al., 2010a) are used to add the flux from each star that is in or near the mask tothe pixels in the synthetic image, scaled by that star’s catalog flux. A star that is not in themask is included if it is near enough to contribute flux to pixels in the mask according to thePRF model. The specific catalog used depends on the star and is identified in each targetstar’s APP report.
The flux uncertainty σOOTi of each out-of-transit pixel i is taken to be the observed
uncertainty σobsi computed by the Kepler pipeline (Jenkins et al., 2017). To compute the
uncertainty of the difference image pixels, we estimate the non-photometric component ofthe σOOT
i by subtracting in quadrature the out-of-transit image’s photometric uncertainty
13
KSCI-19108-001: Astrophysical Positional Probabilities February 28, 2017
σphot,OOTi from the observed pixel uncertainty σobs
i : σpixi =
√(σobsi
)2 − (σphot,OOTi
)2. Here
σphot,OOTi =
√fOOTi /
√N is the Poisson photon noise for each pixel with flux fi, scaled by
the square root of the number of out-of-transit cadences N .For each star s in the target star’s pixel mask, an in-transit image is created by the same
method as for the out-of-transit image, but with the flux of star s scaled by (1− ds) where dsis the fractional depth of the simulated transit/eclipse if it were to occur on that star. Thesimulated depth ds for each quarter is set by finding the value of ds that best reproduces theobserved depth dobs in that quarter. First, the depth fit is seeded with the simple dilution-based estimate dobs ftarget/
∑s fs where ftarget is the flux of the target star and fs is the flux
of star s (the target star is included in the sum over s). When the seed estimate of ds isless than one, the ds that matches dobs is computed via a nonlinear Levenberg-Marquardtfit (Levenberg, 1944; Marquardt, 1963). This observed depth is not corrected for dilutionby other flux in the aperture. When the seed estimate of ds is greater than one, ds is setequal to the seed value. This simulated depth is strongly dependent on the accuracy of theKepler magnitudes of the stars used to model the flux on the pixels and can be inaccurate.We conservatively allow the depth to be as great as 3 (implying a reduction in the fluxof the star by 300%). Stars whose modeled depth is greater than 3 are not considered inthe probability computation and should be considered to have probability zero. We do notsimulate transits on stars outside the pixel mask because centroid measurements for suchstars are unreliable and can be very misleading.
The uncertainty of the modeled difference image pixels is estimated as
√(σOOT
i )2
+ (σITi )
2,
where σITi =
√(σphot,ITi
)2+(σpixi
)2is the estimated uncertainty of the in-transit image.
Here σphot,ITi =
√f ITi /√N is the Poisson photon noise for each in-transit image pixel with
flux f ITi , scaled by the square root of the number of out-of-transit cadences N , and σpix
i is thatpixel’s non-photometric noise estimated from the out-of-transit image as described above.
The result is that for each quarter we have a simulated average out-of-transit image anda collection of average in-transit images, with each difference image modeling the transit ona different known star in the target star’s pixel mask. Each pixel of these average images hasassociated estimated uncertainties. The reader may ask why we did not build the simulatedin-transit image from the observed out-of-transit image by injecting transit signals in theout-of-transit pixels. Simulated transits are placed on known stars at their catalog positions,and these catalog positions often disagree with the actual star positions due to, e. g., catalogerror and proper motion. Constructing the out-of- and in-transit images using the samecatalog positions guarantees that the difference image is consistent with the out-of-transitimage, eliminating the possibility of introducing biases in the modeling.
Similar to the observational data described in §4.1.1, a PRF fit is performed on themodeled out-of-transit image in each quarter q in which there is a transit, and, for each stars, on the modeled in-transit images. Taking the quarterly difference between the PRF fitsof the in- and out-of-transit PRF fits gives us observed offsets ∆o,q = (∆RA,∆DEC)o,q with
covariance matrix Σo, and modeled offsets ∆s,q = (∆RA,∆DEC)s,q with covariance matrix Σs
14
KSCI-19108-001: Astrophysical Positional Probabilities February 28, 2017
for each star s in the target star’s pixel mask. In the next section we use these quarterlyoffsets to estimate distributions of the average observed and modeled offsets.
4.1.3 Computing the Likelihood for Each Star
The observed offsets of a transit signal location from the target star can be thought of asthe sampling of an unknown distribution of offsets. The average of these observed offsetsgives an estimate of the transit source location relative to the target star. If the transits wereobserved at a different time, we would get a different sampling of the unknown underlyingdistribution, with a different estimate of the transit source location. In this section weconstruct a distribution of these average offsets for both the observed and modeled transits.The overlap of the observed modeled distributions (see §5.4 for examples), defined as theintegral of the product of the distributions, is the likelihood that the modeled star is thesource of the transit.
For each collection of observed quarterly offsets (∆RA,∆DEC)o,q and modeled quarterlyoffsets (∆RA,∆DEC)s,q with their associated uncertainties, we construct a continuous distri-bution of mean average offsets using the smooth bootstrap technique. The smooth bootstrapstarts with a conventional ensemble of bootstrap averages, and replaces each average valuewith a Gaussian distribution, similar to kernel density estimation (Silverman, 1986). Gaus-sian distributions are very convenient because products of Gaussians are Gaussians, andGaussians lend themselves to explicit integration.
Given Q quarterly offsets ∆o,q or ∆s,q, where Q is the number of quarters with a transitfor the target, the bootstrap method generates an ensemble of N resampled offset sets,each of length Q, via resampling with replacement. The likelihood formula Eqn. 5 scalesas N2, which puts a practical limitation on the size of the bootstrap ensemble. We setN = 500 unless Q < 5, in which case we include every permutation of the data includingrepetitions (so N = QQ). Because Q ≤ 17 this usually provides a sufficient sampling for thebootstrap estimate. However, as described below, we perform the likelihood computation20 times with different bootstrap ensembles, providing a measure of the dependence of theprobability computation on the bootstrap ensemble. The set of averages bk, k = 1 . . . N , ofeach resampled set returned by the bootstrap method provides N average offsets. Each bkis a two-dimensional vector with components giving the average RA and Dec offsets for eachresampling. We denote the ensemble based on the observed offsets as bo,k and those basedon the modeled offsets for each star s as bs,k.
We smooth the bootstrap ensemble using a normalized two-dimensional Gaussian for eachbootstrap average bk
G (x,bk,Σ) =1√
det (2πΣ)exp
[−1
2(x− bk)
T Σ−1 (x− bk)
](2)
where x and bk are two-dimensional vectors (RA and Dec offsets in our case), and Σ isthe covariance matrix that determines the smoothing, based on the covariance matrix of theoriginal offsets Σo or Σs depending on whether we are smoothing the observed or modeled
15
KSCI-19108-001: Astrophysical Positional Probabilities February 28, 2017
distribution. We choose a two-dimensional generalization of Scott’s rule-of-thumb (Scott,1992):
Σo = N−2
d+4 Σo, Σs = N−2
d+4 Σs (3)
where N is the number of averages in the bootstrap ensemble bk and, in our case, d = 2.To account for an observed small residual bias in centroid offsets described in Bryson et al.(2013), a noise floor term of (0.2/3 arcsec)2 is added to the diagonal terms of Σo and Σs.This imposes a minimum size on the bootstrap distributions.
We define our smooth bootstrap distributions of the observed and modeled average offsetsas
Do (x) =1
N
N∑k=1
G (x,bo,k,Σo) , Ds (x) =1
N
N∑k=1
G (x,bs,k,Σs) . (4)
With this definition∫Do (x) dx =
∫Ds (x) dx = 1, where dx is the two-dimensional RA and
Dec area element.We show in appendix A that our desired likelihood for the star s based on the smooth
bootstrap technique is given by
Ls =
∫Do (x)Ds (x) dx =
1
N2
N∑k=1
N∑j=1
G (bo,j,bs,k,Σo + Σs) (5)
This likelihood is computed 20 times using different randomly chosen bootstrap ensembles,and the final likelihood is computed as the average of these 20 trials, with the standarddeviation providing an error estimate. We’ve found that using more than 20 trials does notprovide significantly different results.
From these likelihoods we compute the probability that the star is in the same sky positionas the transit source relative to other known stars as Rs = Ls∑
w Lw, where the sum includes
the likelihood of the background described in the next section. The error in Rs is computedusing standard propagation of errors. When Rs < 10−30, we set Rs = 0 in the table.
4.2 The Background Likelihood
We model the hypothesis that the transit signal is due to an eclipse on an unknown back-ground binary star using the background model of Morton and Johnson (2011). This modelvaries with target star Kepler magnitude and Galactic latitude. The Kepler magnitude depen-dence is due to this model’s requirement that the background binaries produce a detectabletransit-like signal when diluted by the target star. For a specific target star’s pixel aperturethis model is sufficiently slowly varying that we can take it as locally constant. We define bas the model background binary density per square arcsecond, evaluated for the target star.
To estimate b we use Equation (14) and Table 1 from Morton and Johnson (2011). Wenote that this table as published has the column values reversed: the absolute values of c0should be the largest and those of c4 should be the smallest. For the targets modeled in thispaper, b ranges from 1.6×10⁻⁶ to 5.1×10⁻⁵ background binaries per square arcsecond, witha median of 1.1× 10⁻⁵.
16
KSCI-19108-001: Astrophysical Positional Probabilities February 28, 2017
Given b, in order to satisfy the requirement that our distributions are normalized wedefine the background distribution as
Dbgd (x) =
{b, r ≤ 1√
πb
0, r > 1√πb
(6)
where r =√x2 + y2. So Dbgd (x) = b in a circle of radius R0 = 1/
√πb, is zero outside this
circle, and∫Dbgd (x) dx dy = 1. The smallest radius for this circle occurs when b is largest,
where R0 = 79 arcseconds or about 20 Kepler pixels. A 20 pixel radius is larger than thelargest pixel mask for a non-saturated target star, so this normalization is appropriate forcomparison with the normalized Gaussians we use to compute our likelihoods.
The background likelihood is Lbgd =∫DbgdDodx, and because b vanishes outside the
circle of radius R0, the product in the integrand vanishes as well. This is plausible becausefor any reasonable measurement of the centroid position, Do should essentially vanish outsidea circle that is considerably smaller than 79 arcseconds: the pixel mask for a 12th magnitudestar typically has a radius of about 25 arcseconds. Therefore no information is lost byimposing a background model that vanishes outside a circle of radius ≥ 79 arcseconds. Wedemonstrate this by assuming that Do is a Gaussian with a diagonal covariance matrix withequal entries, so Do becomes a function of r only. Then the likelihood of the backgroundhypothesis is
Lbgd =
∫DbgdDodx =
∫ ∞0
DbgdDo dr = b
∫ R0
0
Do dr. (7)
Now∫∞0Do dr = 1 and
∫ R0
0Do dr =
∫∞0Do dr −
∫∞R0Do dr = 1−
∫∞R0Do dr, so
Lbgd = b
(1−
∫ ∞R0
Do dr
). (8)
If we make the conservative assumption that the uncertainty of Do is 5 arcseconds (see Fig33 of Bryson et al. (2013)), then
∫∞R0Do dr ≈ 10−110, which can be neglected. Because
this example is computed based on the highest background density and largest reasonablemeasurement uncertainty, we can generally take Lbgd = b. While this analysis made varioussimplifying assumptions, a more realistic analysis is not expected to significantly change theresults. The error in the background probability is determined by the propagation of theerror in the individual likelihoods described at the end of §4.1.3.
5 Results
The purpose of the methods described in this paper is to compute the relative probabilitythat
• the transit signal source is likely to be in the same location as the target star
• the transit source is likely to be in the same location as a known star other than thetarget star
17
KSCI-19108-001: Astrophysical Positional Probabilities February 28, 2017
• the transit source is likely to be in the background population of unknown stars.
The relative probabilities described in this paper have been computed for identified KOIs(Thompson et al., 2017) that have the following properties:
• The Kepler magnitude is dimmer than 10, because PRF fitting breaks down for brightertargets, which are highly saturated.
• The PRF fit to the observed out-of-transit image, which measures the position of thetarget star (see §4.1.1), is within 2 arcsec of the catalog position of the target star.When this condition is violated, either there is sufficient crowding to invalidate thecentroid data or the target star catalog position is incorrect, invalidating the modelingbehind the relative probability computation.
• PRF-fit centroids were successfully computed by the Kepler pipeline. The PRF fittingprocess often fails for low S/N transit signals.
KOIs not satisfying these criteria are marked “FAILED” in the APP table and no relativeprobabilities are available.
5.1 Input Stellar Catalogs
For creation of the synthetic scene we use the Kepler Input Catalog (KIC) (Brown et al., 2011)(6,517,562 objects) supplemented by the UKIRT catalog (Lawrence et al., 2007) (5,972,148objects) and an assortment of high-resolution imaging studies (873 objects). The UKIRTcatalog was federated with the KIC by removing stars already in the KIC and estimatingKepler magnitudes from the UKIRT J magnitudes assuming all stars are on the main se-quence. The errors on the UKIRT-based Kepler magnitudes can be as large as 2 magnitudes.Objects discovered by the high-resolution imaging studies are described and presented inAppendix B.
5.2 Host Star Relative Probability Quality
There are several ways in which the computed probabilities can be misleading. We concen-trate on the two most common problem cases:
• Transits with S/N < 10 often do not have enough signal in each pixel of the differenceimage to produce a reliable PRF fit.
• Crowding by bright field stars can invalidate the probability analysis. Most of thesecases are removed by marking KOIs whose PRF-fit target star positions are more than2 arcsec from their catalog positions as “FAILED”, but bias may remain in other cases.
We indicate the host star relative probability quality using Relative Probability Quality, anumerical score that measures the likelihood of these problems. This score ranges from 0 to1, and we recommend trusting the probabilities reported for the target star when this score
18
KSCI-19108-001: Astrophysical Positional Probabilities February 28, 2017
is about 0.3 or above. Relative Probability Quality is the product of two metrics, each ofwhich is normalized to range from 0 to 1:
• Difference Image Quality which measures how well the transit signal differenceimage resembles a star. In each quarter we compute the correlation of the fitted PRFmodel with the pixel data (Bryson et al., 2013). The difference image quality metric isthe number of quarters where the correlation is > 0.7 divided by the total number ofquarters in which a transit was observed.
• Local Crowding which compares the flux in the target star’s optimal aperture withthe flux outside the optimal aperture in the star’s pixel mask. When the flux outsidethe optimal aperture exceeds that in the optimal aperture by about a factor of two, thenthe PRF fit to the out-of-transit image is considered unreliable. The local crowdingmetric uses the inverse of this ratio with a non-linear sigmoid function to produce acrowding score between 0 and 1, with 1 indicating that most of the flux is from theoptimal aperture, and 0.5 indicating that about the same amount of flux is inside theoptimal aperture as outside.
5.3 Host Star a priori Probability
When the host star relative probability quality score described in §5.2 is below threshold,there are several alternatives. When possible, the user should examine the transit datato make a determination of the quality of the centroid measurements using the concepts inBryson et al. (2013). When this is not possible, such as when many targets are being analyzedfor a statistical study, or when examination shows that there is essentially no information onthe transit signal source location, we recommend using the a priori target star probabilityvalues supplied in the table. These are based on the observation that the probability of aKepler object of interest being on the target star depends sensitively on Galactic Latitude(Bryson et al., 2013). Both the observed offset false positive fraction shown in Figure 1 andmodeling (Morton and Johnson, 2011) indicate such a dependence on Galactic latitude. Thisfraction’s dependence on Galactic latitude is relatively insensitive to target star and transitproperties. The a priori target star probability is a fit to the fraction of KOIs that are onthe target star to the total number of KOIs at a given Galactic latitude.
5.4 Examples
The confirmed planet Kepler-11c is shown in Figure 2. In this example the observed centroidsare clustered around the KOI host star KIC 6541920, so the target star is near the centerof the bootstrap distribution of observed averages, shown by the green contours. Modelingthe transit on the target star produces a distribution of averages, shown by the magentacontours, that is also nearly centered on the target star. The overlap of the observed (green)and modeled (magenta) distributions leads to a large likelihood and a 100% probability thatthe transit signal is co-located with the target star.
19
KSCI-19108-001: Astrophysical Positional Probabilities February 28, 2017
4 6 8 10 12 14 16 18 20 220
0.1
0.2
0.3
0.4
0.5
0.6
Galactic latitude
Frac
tion
of K
OIs
offs
et fr
om h
ost s
tar
datafit
Figure 1: Blue: The fraction of KOIs that have been identified as background false positivesvia offsets from their KOI host stars as a function of Galactic Latitude. The error barsshow the 1σ Poisson uncertainty. Red: the fit used to compute the KOI host star a prioriprobability. The fit is y = 0.775× 10(−0.0556x) where x is the Galactic latitude in degrees.
20
KSCI-19108-001: Astrophysical Positional Probabilities February 28, 2017
A background false positive, KOI 109.01, associated with a known background star isshown in Figure 3. In this case the green contours, showing the distribution of observedaverages, are very near the background star KIC 4752452 and very far from the KOI hoststar KIC 4752451, indicating that the KOI host is unlikely to be the source of the transitsignal. The KOI host star has a probability of zero, while there is a 98.9% relative probabilitythat the transit source is at the location of KIC 4752452. Because the green observed contourshave only a small overlap with the magenta contours obtained by modeling the transit onKIC 4752452, the background has a probability of 1.1%.
Figure 4 shows the interesting case of KOI-582.01, where an apparent offset in the cen-troids from the KOI host star turns out to be spurious, caused by centroid bias due tocrowding by a bright star outside the figure. This bias is revealed by modeling the transiton the KOI host star KIC 9020160. The modeled magenta contours show that the expecteddistribution of averages is offset from KIC 9020160 in the same direction and distance as thegreen observed contours. Therefore the original disposition of KOI-582.01 as a false positivebecause its measured centroid offset is more than 3σ from the target star (shown by the cyancircle) is incorrect.
21
KSCI-19108-001: Astrophysical Positional Probabilities February 28, 2017
−1.5 −1 −0.5 0 0.5 1 1.5−1.5
−1
−0.5
0
0.5
1
1.5
KIC 6541920, 13.709
E <− (arcsec)
N −
> (a
rcse
c)
Figure 2: Results of the probability analysis for KOI-157.01 (confirmed planet Kepler-11c)with target star KIC 6541920, Kepler magnitude 13.709. In this example the transit signallocation is strongly consistent with the target star. The distribution of averages of theobserved transit positions Do is rendered as green contours, while the magenta contoursshow the distribution Dtarget with the transit modeled on the target star. The target staris shown as a red asterisk, the black crosshairs are the observed quarterly transit locations,and the light grey dashed crosshairs are the modeled transit locations. In this example themodeled transit locations are very tightly clustered so the magenta contours are close to thetarget star. The magenta crosshair and cyan circle show the χ2 average position and 3σradius produced by the data validation module of the Kepler pipeline (Jenkins et al., 2017),used in conventional planet candidate vetting (Coughlin et al., 2016).
22
KSCI-19108-001: Astrophysical Positional Probabilities February 28, 2017
−4 −3 −2 −1 0 1 2 3 4−1
0
1
2
3
4
5
6
7
8
KI
KIC 4752452, 17.4822 UKIRT 44117917829611
hiresKIC 22000139, 14.6816 KIC 4752451, 12.385
E <− (arcsec)
N −
> (a
rcse
c)
−4 −3 −2 −1 0 1 2 3 4−1
0
1
2
3
4
5
6
7
8
KI
KIC 4752452, 17.4822 UKIRT 44117917829611
hiresKIC 22000139, 14.6816 KIC 4752451, 12.385
E <− (arcsec)
N −
> (a
rcse
c)
Figure 3: Results of the probability analysis for KOI-109.01 with target star KIC 4752451,Kepler magnitude 12.385. In this example the transit signal location is strongly inconsistentwith the target star, and is consistent with the 17th magnitude field star KIC 4752452,shown by a blue asterisk. Top: the transit modeled on the target star KIC 4752451, so themodeled magenta contours and the observed green contours are very far apart. Bottom: thetransit modeled on KIC 4752452, with the modeled magenta contours slightly overlappingwith the green observed contours. Though the overlap is small, it is large enough for a 98.9%probability that the transit is co-located with KIC 4752452, while the background probabilityis 1.1%. See Figure 2 for a description of elements of the figure.
23
KSCI-19108-001: Astrophysical Positional Probabilities February 28, 2017
−1 −0.5 0 0.5 1 1.5 2−2
−1.5
−1
−0.5
0
0.5
1
KIC 9020160, 14.808
E <− (arcsec)
N −
> (a
rcse
c)
Figure 4: Results of the probability analysis for KOI-582.01 with target star KIC 9020160,Kepler magnitude 14.808. In this example the transit signal location is more than 3σ awayfrom the target star, as indicated by the cyan circle offset to the SW. The conclusion that thetransit source is offset from the target star is reinforced by the location of the black crosshairsshowing the quarterly transit offsets. The observed distribution shown by the green contoursis also offset, consistent with the 3σ circle. But the observed distribution is consistent withthe modeled distribution shown by the magenta contours, which are offset from the targetstar due to crowding bias caused by a bright nearby star outside the figure. Therefore itwould be incorrect to declare this KOI to be a background false positive. See Figure 2 for adescription of elements of the figure.
24
KSCI-19108-001: Astrophysical Positional Probabilities February 28, 2017
Appendix A
We use the notation of §4.1.3. Our desired likelihood for each star s is the integral of theproduct
Ls =
∫Do (x)Ds (x) dx. (9)
The product of two Gaussians is the Gaussian
G (x,bo,j,Σo)G (x,bs,k,Σs) = cj,kG (x,mj,k,Φ) (10)
where
cj,k = G (bo,j,bs,k,Σo + Σs) (11)
mj,k =(Σ−1o + Σ−1s
)−1 (Σ−1o bo,j,+Σ−1s bs,k
)Φ =
(Σ−1o + Σ−1s
)−1.
so
Ls =
∫Do (x)Ds (x) dx
=1
N2
∫ N∑k=1
N∑j=1
G (x,bo,k,Σo)G (x,bs,j,Σs) dx
=1
N2
∫ N∑k=1
N∑j=1
cj,kG (x,mj,k,Φ) dx
=1
N2
N∑k=1
N∑j=1
cj,k (12)
because∫G (x,mj,k,Φ) dx = 1.
25
KSCI-19108-001: Astrophysical Positional Probabilities February 28, 2017
Appendix B
This appendix describes the detection of 873 objects via high-resolution imaging by Adamset al. (2012), Dressing et al. (2014), Wolfgang (2015), the Robo-AO program (Law et al.,2014; Baranec et al., 2016; Ziegler et al., 2016) and the Kepler follow-up observation program(Furlan et al., 2016). These sources used a variety of telescopes and observed in a variety ofcolors, so the federation of these results with the KIC/UKIRT and each other was challenging.In some cases the authors provided Kepler magnitude estimates. In other cases Keplermagnitudes were estimated using methods that depend on the available colors as describedbelow.
Data about the 873 objects detected by high-resolution imaging are provided as positionand magnitude offsets from the target star. Nearby “background” objects detected by high-resolution imaging may be bound companions of the target star in the KIC. In some cases,such as KOI-284, the KIC entry for the target star is resolved into two nearly equal-brightnessstars, one of which is taken by the observer to be the target star. In such cases differentobservers sometimes make different choices for which imaged star is the target star, makingthe offsets reported by one observer inconsistent with the offsets reported by another. Thesecases are identified via manual inspection, and are resolved by rejecting one of the observer’sdata.
In several cases the same new star was identified by several observers, but with slightlydifferent positions and magnitudes. Observations that cluster within 0.5 arcsec of each otherand whose Kepler magnitude estimates are within 4 magnitudes of each other (due to thelarge Kepler magnitude uncertainties in some of the conversions from other bandpasses)are considered to be the same background object. Clusters containing a KIC or UKIRTstar are identified with that KIC or UKIRT star and are removed. The position of eachremaining cluster is defined as the average of the position estimates in that cluster. TheKepler magnitude of each remaining cluster is the flux average of the Kepler magnitudeestimates in that cluster. The resulting cluster positions and Kepler magnitudes are usedto define new background objects considered in addition to the KIC and UKIRT stars. TheKIC and UKIRT catalogs were not modified.
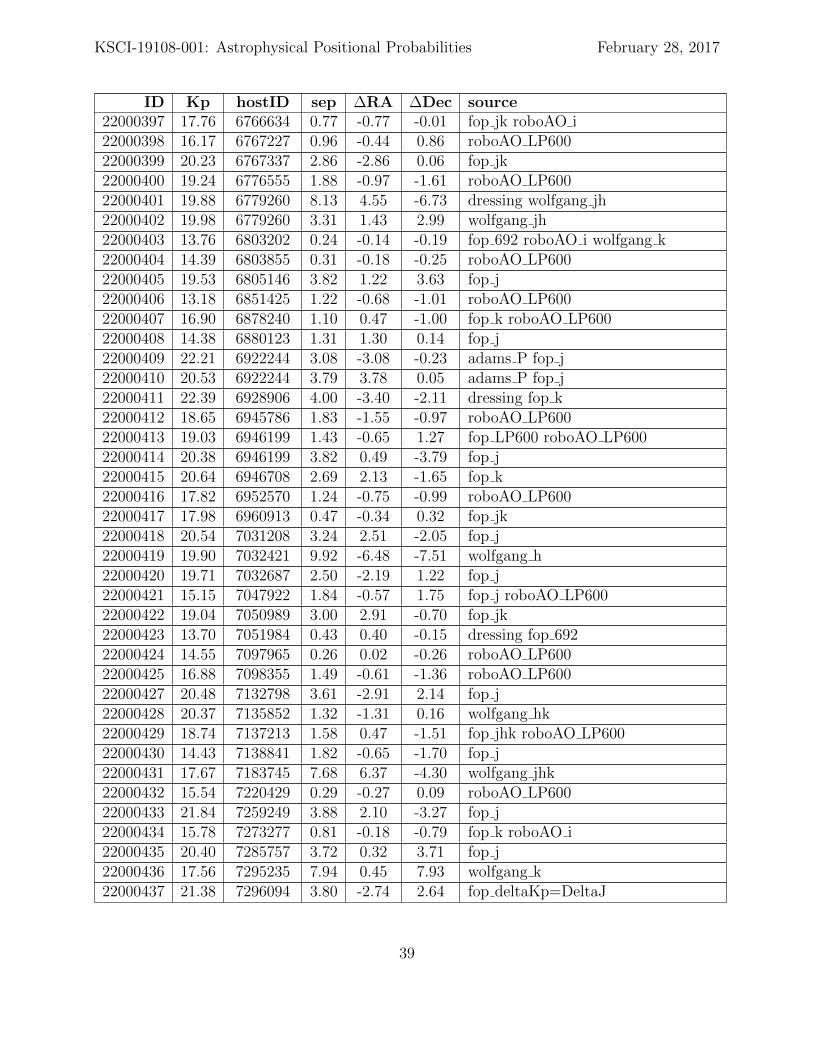
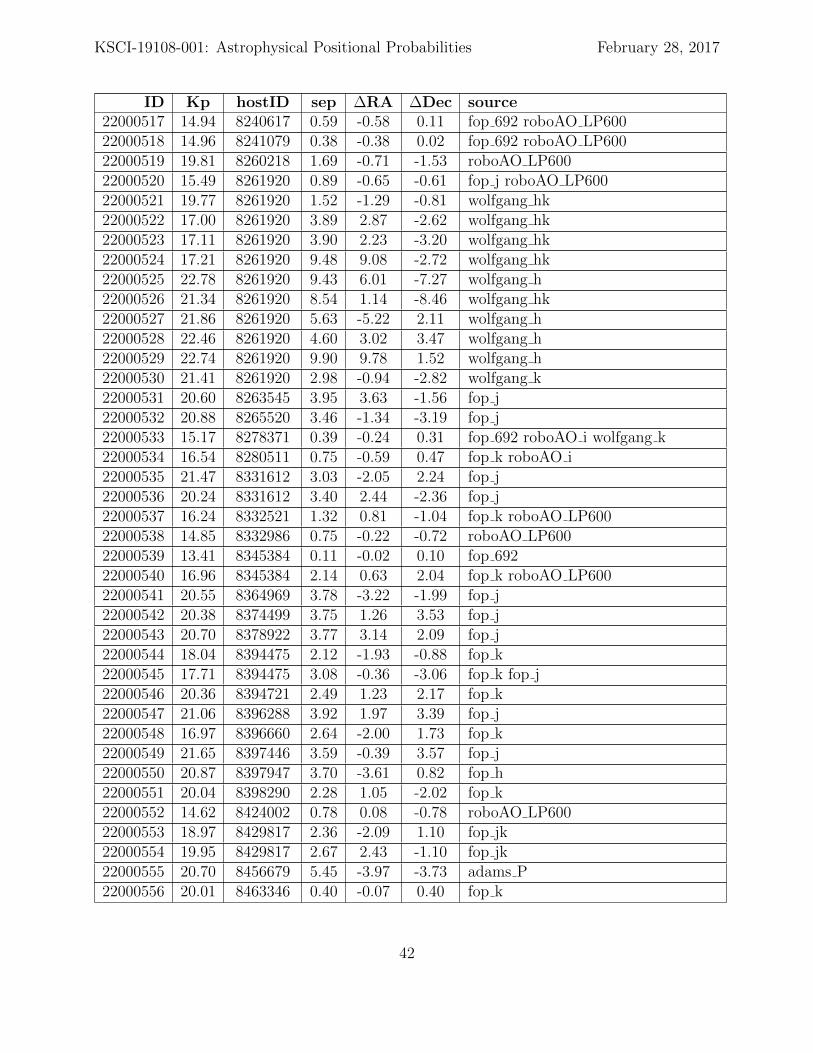
The table below gives data for the 873 objects defined via this clustering algorithm.
• ID is the assigned number of the object. This number appears in the table and figuresprepended with “hires”.
• Kp is the Kepler magnitude for the object, defined as above.
• hostID is the KIC ID of the target star used as the reference for delta RA and deltaDec.
• sep is the separation in arcsec of this object from the target star identified by hostID.
• ∆RA is the delta RA in arcsec of this object from the target star identified by hostID.
• ∆Dec is the delta Dec in arcsec of this object from the target star identified by hostID.
26
KSCI-19108-001: Astrophysical Positional Probabilities February 28, 2017
• source provides the source of the observational data for this object as a list of referenceand magnitude codes for the observations defining this object. Each reference has itsown magnitude codes.
– adams (Adams et al., 2012), which provides estimated Kepler magnitude. Themagnitude codes give the instrument used for the observation.
∗ P Was observed with the Aries instrument.
∗ A Was observed with the Pharo instrument.
– dressing (Dressing et al., 2014), which provides estimated Kepler magnitude.Only one instrument and color was used so there are no magnitude codes.
– fop (Furlan et al., 2016), which uses a variety of instruments and colors thatvary from observation to observation. The Kepler magnitude estimate for a stardepends on the available colors in which that star was observed. Some colorsare preferred over others, so the following magnitude codes are listed in orderof preference. The error in the estimated Kepler magnitude grows from ∼ 0.03magnitudes at the top to more than 2 magnitudes at the bottom of the list. Ifa code later in this list is used, this means the colors for earlier codes are notavailable.
∗ gri: Two or more of g, r, or i magnitudes are available. g magnitude isavailable when the target star has g magnitude in the KIC and (in orderof preference) deltaVmag, deltaVF555W, or deltaBmag is provided, which istaken as delta g magnitude. r magnitude is available when the target star hasr magnitude in the KIC and deltaVF775W is provided, which is taken as deltar magnitude. i magnitude is available when the target star has i magnitudein the KIC and deltaImag is provided. Then Kepler magnitude is estimatedusing Equation 2 of Brown et al. (2011).
∗ 692: Delta692 is provided, which can be taken as delta Kepler magnitudeand added to the target star’s Kepler magnitude.
∗ LP600: DeltaLP600 is provided, which can be taken as delta Kepler mag-nitude and added to the target star’s Kepler magnitude.
∗ LP562: DeltaLP562 is provided, which can be taken as delta Kepler mag-nitude and added to the target star’s Kepler magnitude.
∗ jhk: Delta j, delta h and delta k are provided and the KIC supplies j, hand k magnitudes. Estimate the Kepler magnitude using the formulas in theAppendix of Howell et al. (2012) when these magnitudes are in the requiredranges.
∗ jk: Delta j and delta k are provided and the KIC supplies j and k magnitudes.Estimate the Kepler magnitude using the formulas in the Appendix of Howellet al. (2012) when these magnitudes are in the required ranges.
27
KSCI-19108-001: Astrophysical Positional Probabilities February 28, 2017
∗ j: Delta j is provided and the KIC supplies j magnitude. Estimate the Keplermagnitude using the formulas in the Appendix of Howell et al. (2012).
∗ k: Delta k is provided and the KIC supplies k magnitude. Estimate theKepler magnitude by interpolating a second-order polynomial fit of all KIC kmagnitudes to Kepler magnitude.
∗ h: Delta h is provided and the KIC supplies h magnitude. Estimate theKepler magnitude by interpolating a second-order polynomial fit of all KIC hmagnitudes to Kepler magnitude.
∗ i: Delta i is provided and the KIC supplies i magnitude. Estimate theKepler magnitude by interpolating a second-order polynomial fit of all KIC imagnitudes to Kepler magnitude.
∗ deltaKp=DeltaV: Delta v is provided but the KIC does not supply a vmagnitude. Delta v is taken as delta Kepler magnitude and added to thetarget star’s Kepler magnitude.
∗ deltaKp=DeltaZ: Delta z is provided but the KIC does not supply a zmagnitude. Delta z is taken as delta Kepler magnitude and added to thetarget star’s Kepler magnitude.
∗ deltaKp=Delta880: Delta880 is provided but the KIC does not supply acorresponding magnitude. Delta880 is taken as delta Kepler magnitude andadded to the target star’s Kepler magnitude.
∗ deltaKp=DeltaJ: Delta j is provided but the KIC does not supply a jmagnitude. Delta j is taken as delta Kepler magnitude and added to thetarget star’s Kepler magnitude.
– roboAO (Law et al., 2014; Baranec et al., 2016; Ziegler et al., 2016), which usestwo colors: LP600 and i.
∗ LP600: deltaLP600 is provided, which can be taken as delta Kepler magni-tude and added to the target star’s Kepler magnitude.
∗ i: Delta i is provided and the KIC supplies i magnitude. The Kepler magni-tude is estimated by interpolating a second-order polynomial fit of all KIC imagnitudes to Kepler magnitude.
∗ deltaiEqDeltaKp: Delta i is provided but the KIC does not supply ani magnitude. Delta i is taken as delta Kepler magnitude and added to thetarget star’s Kepler magnitude.
– wolfgang (Wolfgang, 2015) provides estimated Kepler magnitude based on ob-servations in one or more of j, h and/or k. The color codes indicate which of thesecolors was used for the Kepler magnitude estimate: jhk, hk, jk, jh, j, h, k.
28
KSCI-19108-001: Astrophysical Positional Probabilities February 28, 2017
KSCI-19108-001: Astrophysical Positional Probabilities February 28, 2017
ID Kp hostID sep ∆RA ∆Dec source22000874 16.80 12785320 2.01 2.01 -0.11 fop i
51
KSCI-19108-001: Astrophysical Positional Probabilities February 28, 2017
References
Adams, E., et al. 2012, AJ, 144, 2
Baranec, C., et al. 2016, ApJ 152, 1
Brown, T. M., et al. 2011, ApJ 142, 112
Bryson, S. T., et al. 2010a, ApJ 713, L97
Bryson, S. T., et al. 2010b, Proc. SPIE 7740, 77401D
Bryson, S. T., et al. 2013, PASP 125, 889
Bryson, S., et al. 2016, The Kepler Certified False Positive Table, KSCI-19093-002
Burke, C. J., et al. 2014, ApJS 210, 19
Coughlin, J., et al. 2014, ApJ 147, 119
Coughlin, J., et al. 2016, ApJS 224, 12
Dressing, C., et al. 2014, AJ, 148, 5
Efron, B. and Tibshirani, R. J. 1994, An Introduction to the Bootstrap, CRC Press
Furlan, E., et al. 2016, AJ, in press (arxiv:1612.02392)
Gregory, P. 2010, Bayesian Logical Data Analysis for the Physical Sciences, Cambridge Uni-versity Press
Howell, S., et al. 2012, ApJ 746, 2
Jenkins, J., et al. 2010, Proc. SPIE 7740, 77400D
Jenkins, J., et al. 2017, Kepler Data Processing Handbook, KSCI-19081-002
Koch, D., et al. 2010, ApJ 713, L79
Law, N. M., et al. 2014, ApJ 791, 1
Lawrence, A., et al. 2007, MNRAS 379, 1599
Levenberg, K. 1944, Quarterly of Applied Mathematics 2, 164
Marquardt, D. W. 1963, Journal of the Society for Industrial and Applied Mathematics, 11,431
Morton, T. D., and Johnson, J. A. 2011, ApJ 738, 170
Mullally, F., et al. 2015, ApJS 217, 31
52
KSCI-19108-001: Astrophysical Positional Probabilities February 28, 2017
Scott, D. W. 1992, Density Estimation: Theory, Practice and Visualization, John Wiley &Sons, New York, Chichester
Silverman, B. W. 1986, Density Estimation for Statistics and Data Analysis, Chapman &Hall, London
Thompson, S., et al. 2017, in prep.
Van Cleve, J., et al. 2016, Kepler Data Characteristics Handbook, KSCI-19040-005
Wolfgang, A., 2015, Leveraging the Power of a Planet Population, UC Santa Cruz: Astron-omy & Astrophysics. Retrieved from: http://escholarship.org/uc/item/08k2g3tb