Contents lists available at ScienceDirect Planetary and Space Science journal homepage: www.elsevier.com/locate/pss Initial SAM calibration gas experiments on Mars: Quadrupole mass spectrometer results and implications Heather B. Franz a,b, ⁎ , Melissa G. Trainer b , Charles A. Malespin b,d , Paul R. Mahaffy c , Sushil K. Atreya e , Richard H. Becker f , Mehdi Benna a,b , Pamela G. Conrad b , Jennifer L. Eigenbrode b , Caroline Freissinet a,b , Heidi L.K. Manning g , Benito D. Prats b,h , Eric Raaen b , Michael H. Wong e a Center for Research and Exploration in Space Science & Technology, UMBC, NASA Goddard Space Flight Center, Greenbelt, MD 20771, United States b Planetary Environments Laboratory, NASA Goddard Space Flight Center, Greenbelt, MD 20771, United States c Solar System Exploration Division, NASA Goddard Space Flight Center, Greenbelt, MD 20771, United States d Goddard Earth Sciences Technology and Research, USRA, NASA Goddard Space Flight Center, Greenbelt, MD 20771, United States e Department of Climate and Space Sciences, University of Michigan, Ann Arbor, MI 48109, United States f School of Physics and Astronomy, University of Minnesota, Minneapolis, MN 55455, United States g Concordia College, Moorhead, MN 56562, United States h SGT, Inc., Greenbelt, MD 20770, United States ARTICLE INFO Keywords: Mars Atmosphere Isotopes Mars Science Laboratory Sample Analysis at Mars Investigation Calibration ABSTRACT The Sample Analysis at Mars (SAM) instrument suite of the Mars Science Laboratory (MSL) Curiosity rover is equipped to analyze both martian atmospheric gases and volatiles released by pyrolysis of solid surface materials, with target measurements including chemical and isotopic composition (Mahaffy et al., 2012). To facilitate assessment of instrument performance and validation of results obtained on Mars, SAM houses a calibration cell containing CO 2 , Ar, N 2 , Xe, and several fluorinated hydrocarbon compounds (Franz et al., 2014; Mahaffy et al., 2012). This report describes the first two experiments utilizing this calibration cell on Mars and gives results from analysis of data acquired with the SAM Quadrupole Mass Spectrometer (QMS). These data support the accuracy of isotope ratios obtained with the QMS (Conrad et al., 2016; Mahaffy et al., 2013) and provide ground-truth for reassessment of analytical constants required for atmospheric measurements, which were reported in previous contributions (Franz et al., 2015, 2014). The most significant implication of the QMS data involves reinterpretation of pre-launch contamination previously believed to affect only CO abundance measurements (Franz et al., 2015) to affect N 2 abundances, as well. The corresponding adjustment to the N 2 calibration constant presented here brings the atmospheric volume mixing ratios for Ar and N 2 retrieved by SAM into closer agreement with those reported by the Viking mission (Owen et al., 1977; Oyama and Berdahl, 1977). 1. Introduction The Sample Analysis at Mars (SAM) instrument suite, which includes a Quadrupole Mass Spectrometer (QMS), Gas Chromatograph (GC), and Tunable Laser Spectrometer (TLS), was designed to perform precise in situ measurements of the chemical and isotopic composition of the martian atmosphere and volatiles associated with surface materials (Mahaffy et al., 2012; Webster and Mahaffy, 2011). SAM measurements of volume mixing ratios (VMR) for the most abundant martian atmospheric species were initially computed with empirical calibration constants derived from pre-launch data (Franz et al., 2014). These constants were later revised on the basis of laboratory experi- ments and instrument performance during the first Mars year of SAM operations (Franz et al., 2015). The later report described enhanced modeling of instrument background, pressure-related behavior, and mass interferences that improved calculations of VMR for the minor atmospheric species O 2 and CO. At the time of its publication, explanation for the difference in ratio of Ar to N 2 obtained by SAM (Mahaffy et al., 2013) and Viking (Owen et al., 1977; Oyama and Berdahl, 1977) remained an outstanding question of interest, but prior to execution of the calibration cell experiment, insufficient data were available to assign this difference to a SAM instrument effect with confidence (Franz et al., 2015). The first two experiments utilizing the SAM calibration cell on Mars http://dx.doi.org/10.1016/j.pss.2017.01.014 Received 2 December 2016; Accepted 26 January 2017 ⁎ Correspondence to: Center for Research and Exploration in Space Science & Technology, UMBC, NASA Goddard Space Flight Center, Code 699, Greenbelt, MD 20771, United States. E-mail address: [email protected](H.B. Franz). Planetary and Space Science 138 (2017) 44–54 Available online 27 January 2017 0032-0633/ Published by Elsevier Ltd. MARK
Transcript
Contents lists available at ScienceDirect
Planetary and Space Science
journal homepage: www.elsevier.com/locate/pss
Initial SAM calibration gas experiments on Mars: Quadrupole massspectrometer results and implications
Heather B. Franza,b,⁎, Melissa G. Trainerb, Charles A. Malespinb,d, Paul R. Mahaffyc,Sushil K. Atreyae, Richard H. Beckerf, Mehdi Bennaa,b, Pamela G. Conradb,Jennifer L. Eigenbrodeb, Caroline Freissineta,b, Heidi L.K. Manningg, Benito D. Pratsb,h,Eric Raaenb, Michael H. Wonge
a Center for Research and Exploration in Space Science & Technology, UMBC, NASA Goddard Space Flight Center, Greenbelt, MD 20771, United Statesb Planetary Environments Laboratory, NASA Goddard Space Flight Center, Greenbelt, MD 20771, United Statesc Solar System Exploration Division, NASA Goddard Space Flight Center, Greenbelt, MD 20771, United Statesd Goddard Earth Sciences Technology and Research, USRA, NASA Goddard Space Flight Center, Greenbelt, MD 20771, United Statese Department of Climate and Space Sciences, University of Michigan, Ann Arbor, MI 48109, United Statesf School of Physics and Astronomy, University of Minnesota, Minneapolis, MN 55455, United Statesg Concordia College, Moorhead, MN 56562, United Statesh SGT, Inc., Greenbelt, MD 20770, United States
A R T I C L E I N F O
Keywords:MarsAtmosphereIsotopesMars Science LaboratorySample Analysis at Mars InvestigationCalibration
A B S T R A C T
The Sample Analysis at Mars (SAM) instrument suite of the Mars Science Laboratory (MSL) Curiosity rover isequipped to analyze both martian atmospheric gases and volatiles released by pyrolysis of solid surfacematerials, with target measurements including chemical and isotopic composition (Mahaffy et al., 2012). Tofacilitate assessment of instrument performance and validation of results obtained on Mars, SAM houses acalibration cell containing CO2, Ar, N2, Xe, and several fluorinated hydrocarbon compounds (Franz et al., 2014;Mahaffy et al., 2012). This report describes the first two experiments utilizing this calibration cell on Mars andgives results from analysis of data acquired with the SAM Quadrupole Mass Spectrometer (QMS). These datasupport the accuracy of isotope ratios obtained with the QMS (Conrad et al., 2016; Mahaffy et al., 2013) andprovide ground-truth for reassessment of analytical constants required for atmospheric measurements, whichwere reported in previous contributions (Franz et al., 2015, 2014). The most significant implication of the QMSdata involves reinterpretation of pre-launch contamination previously believed to affect only CO abundancemeasurements (Franz et al., 2015) to affect N2 abundances, as well. The corresponding adjustment to the N2
calibration constant presented here brings the atmospheric volume mixing ratios for Ar and N2 retrieved by SAMinto closer agreement with those reported by the Viking mission (Owen et al., 1977; Oyama and Berdahl, 1977).
1. Introduction
The Sample Analysis at Mars (SAM) instrument suite, whichincludes a Quadrupole Mass Spectrometer (QMS), Gas Chromatograph(GC), and Tunable Laser Spectrometer (TLS), was designed to performprecise in situ measurements of the chemical and isotopic compositionof the martian atmosphere and volatiles associated with surfacematerials (Mahaffy et al., 2012; Webster and Mahaffy, 2011). SAMmeasurements of volume mixing ratios (VMR) for the most abundantmartian atmospheric species were initially computed with empiricalcalibration constants derived from pre-launch data (Franz et al., 2014).These constants were later revised on the basis of laboratory experi-
ments and instrument performance during the first Mars year of SAMoperations (Franz et al., 2015). The later report described enhancedmodeling of instrument background, pressure-related behavior, andmass interferences that improved calculations of VMR for the minoratmospheric species O2 and CO. At the time of its publication,explanation for the difference in ratio of Ar to N2 obtained by SAM(Mahaffy et al., 2013) and Viking (Owen et al., 1977; Oyama andBerdahl, 1977) remained an outstanding question of interest, but priorto execution of the calibration cell experiment, insufficient data wereavailable to assign this difference to a SAM instrument effect withconfidence (Franz et al., 2015).
The first two experiments utilizing the SAM calibration cell on Mars
http://dx.doi.org/10.1016/j.pss.2017.01.014Received 2 December 2016; Accepted 26 January 2017
⁎ Correspondence to: Center for Research and Exploration in Space Science & Technology, UMBC, NASA Goddard Space Flight Center, Code 699, Greenbelt, MD 20771, United States.E-mail address: [email protected] (H.B. Franz).
Planetary and Space Science 138 (2017) 44–54
Available online 27 January 20170032-0633/ Published by Elsevier Ltd.
were performed in July and December 2015 (on MSL mission Sols 1042and 1204) and designated SAM experiments #25274 and #25321,respectively. For simplicity in this manuscript, we will refer to them asCG1 and CG2 (i.e., Calibration Gas 1 and 2). These experimentsprovided opportunities to assess the continued robustness of thecalibration constants through their application to a gas mixture ofknown chemical and isotopic composition. Results of QMS analysis ofthe calibration gas suggested a need to update the constant required forcalculation of atmospheric N2 abundance, while indicating accurateretrieval of CO2 and Xe isotope ratios.
SAM experiment design and analysis are supported by efforts usinglaboratory facilities at the NASA Goddard Space Flight Center (GSFC).The SAM breadboard and test bed models incorporate quadrupole massspectrometers fabricated at GSFC to the same design as the flight modeland controlled with identical electronics and flight software, renderingthese instruments high-fidelity facsimiles of SAM. The breadboardemploys the SAM prototype QMS in a laboratory setting that allowsflexibility in plumbing configuration for a range of experimentssupporting both atmospheric and solid sample analyses. The test bedcomprises a replica of SAM, including all instrument and gas processingsystem components. The test bed is housed in an environmentalchamber that simulates martian ambient conditions. All experimentsexecuted on Mars, including those using the calibration cell, are firstperformed on the SAM test bed for script validation. For the studiesdescribed here, both instruments utilized operating parameters analo-gous to those of the flight model as implemented in ground calibrationor on Mars.
2. QMS calibration
The following subsections about SAM QMS calibration providecontext for the calibration gas experiments but are not intended torepresent a comprehensive discussion. The reader is referred toprevious contributions for detailed treatment of the calibration per-formed prior to these experiments (Franz et al., 2015, 2014).
2.1. Pre-launch calibration
Prior to its integration with Curiosity, the SAM suite was subjectedto pre-launch calibration of all components. QMS calibration includedtuning of the mass analyzer, derivation of detector correction functions,and determination of empirical calibration constants for VMR measure-ments through analysis of calibration gas mixtures of known composi-tion (Franz et al., 2014). These calibration constants effectively accountfor differences in tuning across the mass range and between regions ofdifferent RF frequency that produce differences in number of ionsdetected for the same absolute abundance, even when differences inionization efficiency for chemical species are considered. They ulti-mately allow determination of CO2, Ar, O2, N2 and CO VMR in themartian atmosphere through the ratio of a key “marker” fragment ofeach molecule to 40Ar and the relationship
F c[X]/[Ar] = ⋅c /Xi/Ar i 40, (1)
where X is the atmospheric species, FXi/Ar is the calibration constant forthat species at the ion fragment i, and ci and c40 are the counts at mass/charge (m/z) ratio i and 40, respectively (Franz et al., 2014). Themarker fragment for each species relevant to the calibration cellexperiment is given in Table 2. In addition, relevant constants forCO2 isotopic measurements were informed by independent analysis ofthe isotopic composition of CO2 in the calibration gas mix by dual inletisotope ratio mass spectrometry on a Thermo Scientific MAT 253 atGSFC (Franz et al., 2014). CO2 from the same source tank was includedin the onboard calibration cell utilized on Mars and described in thismanuscript.
Constants derived during pre-launch calibration using an equimolarmixture (“EQ mix”) of CO2, N2, Ar and O2 (Franz et al., 2014) were used
to calculate the martian atmospheric composition reported in Mahaffyet al. (2013). However, a modification was required for the constantused to calculate CO abundance due to an apparent change ininstrument background at m/z 12 (C+, fragment of CO2 and CO) onMars compared to ground calibration (Franz et al., 2014). Becauselimited data were available to establish the new m/z 12 baseline at thattime, only an upper limit for CO abundance was reported by Mahaffyet al. (2013).
2.2. Calibration refinement
After monitoring QMS performance throughout the nominal MSLmission of one Mars year, the SAM team determined that some updatesto the calibration constants and data reduction procedures were neededto address minor changes in QMS parameters and instrument artifactsthat had arisen since pre-launch calibration. The updates accounted forslight changes in tuning at m/z relevant to atmospheric measurements,pressure-dependent production of CO2
++ ions at m/z 22, and oxygenfragments from CO2 that affect O2 VMR calculations (Franz et al.,2015). The availability of data covering a full Mars year also allowedbetter characterization of the change in instrument background at m/z12, making precise measurements of CO VMR possible (Franz et al.,2015).
An unexpected result of initial SAM atmospheric analyses was theretrieval of 40Ar/14N ~0.5 (Mahaffy et al., 2013), which differed fromthe values of 0.3 and 0.35 reported by the Viking team (Owen et al.,1977; Oyama and Berdahl, 1977). The marker fragment used tocompute N2 VMR is m/z 14 (Franz et al., 2014), comprised ofapproximately 40% N+ ions and 60% N2
++ ions (Wong et al., 2013).There is also a minor contribution from CO++ ions generated from COand CO2 in the martian atmosphere, but their abundance compared toions at m/z 14 sourced from nitrogen is negligible. Calibrationperformed with pure nitrogen gas on the SAM test bed indicated nopressure effect on N2
++ production, as seen with CO2++ ions (Franz
et al., 2015). Since the species responsible for the m/z 12 backgroundduring ground calibration was not identified, although an organiccompound was considered likely, we evaluated the relative behavior ofratios computed between m/z 12, 13 and 14 and m/z 22 and 40 todetermine whether a similar change in background might be evident atm/z 14, thus affecting N2 VMR retrievals (Franz et al., 2014). However,the behavior of these ion fragments alone did not provide sufficientclarity concerning this issue, likely reflecting trace quantites of residualterrestrial N2 in the system that blurred the trend in ratios involving m/z 14. Further evaluation of the N2 calibration constant was deferreduntil execution of calibration gas experiments on Mars (Franz et al.,2015).
3. Calibration gas experiments
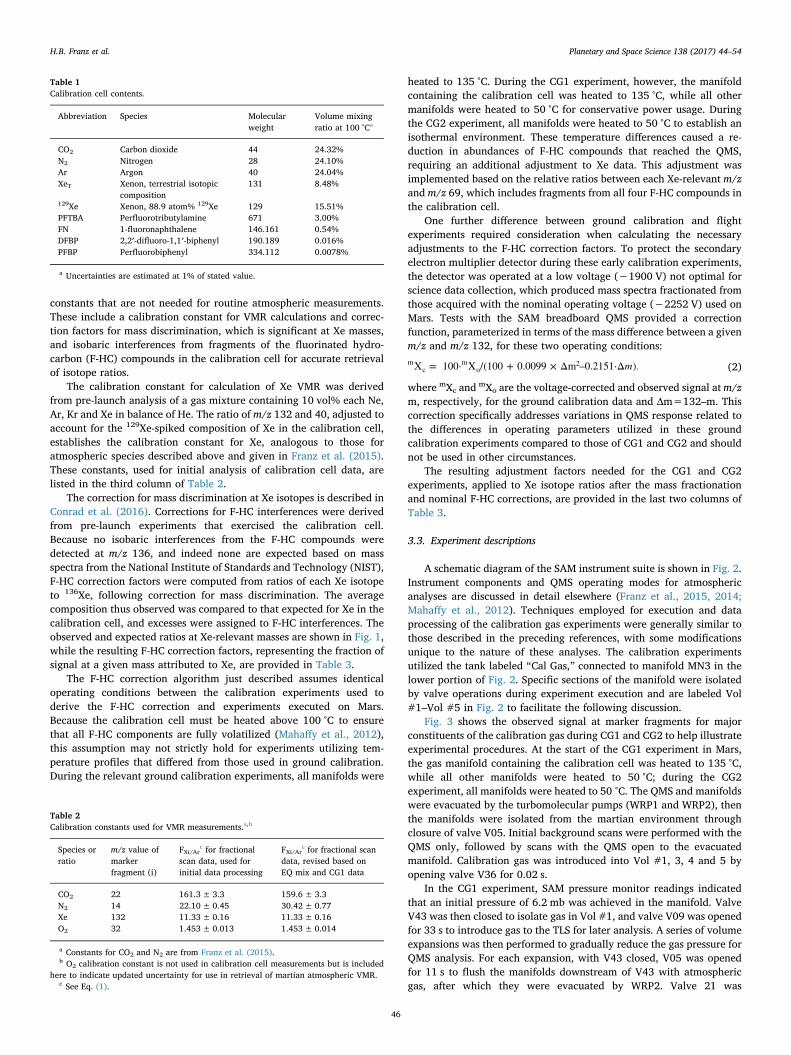
3.1. Calibration cell contents
The SAM calibration cell, with volume of 4.76 mL, contains approxi-mately equimolar abundances of CO2, N2, Ar and Xe and trace quantitiesof several fluorinated hydrocarbon compounds (Table 1) (Mahaffy et al.,2012). Xenon in the cell is spiked with excess 129Xe for clear differentia-tion from indigenous martian Xe. Perfluorotributylamine (PFTBA) pro-vides a standard for mass calibration and sensitivity during QMS tuning.The remaining compounds, 1-fluoronaphthalene (FN), 2,2′-difluoro-1,1′-biphenyl (DFBP), and perfluorobiphenyl (PFBP), serve as additionalstandards for QMS mass resolution and for relative retention times duringgas chromatographic (GC) analyses on columns designed to detect high-molecular weight organic compounds.
3.2. Additional calibration for Xe measurements
Analysis of Xe data from the calibration cell requires application of
H.B. Franz et al. Planetary and Space Science 138 (2017) 44–54
45
constants that are not needed for routine atmospheric measurements.These include a calibration constant for VMR calculations and correc-tion factors for mass discrimination, which is significant at Xe masses,and isobaric interferences from fragments of the fluorinated hydro-carbon (F-HC) compounds in the calibration cell for accurate retrievalof isotope ratios.
The calibration constant for calculation of Xe VMR was derivedfrom pre-launch analysis of a gas mixture containing 10 vol% each Ne,Ar, Kr and Xe in balance of He. The ratio of m/z 132 and 40, adjusted toaccount for the 129Xe-spiked composition of Xe in the calibration cell,establishes the calibration constant for Xe, analogous to those foratmospheric species described above and given in Franz et al. (2015).These constants, used for initial analysis of calibration cell data, arelisted in the third column of Table 2.
The correction for mass discrimination at Xe isotopes is described inConrad et al. (2016). Corrections for F-HC interferences were derivedfrom pre-launch experiments that exercised the calibration cell.Because no isobaric interferences from the F-HC compounds weredetected at m/z 136, and indeed none are expected based on massspectra from the National Institute of Standards and Technology (NIST),F-HC correction factors were computed from ratios of each Xe isotopeto 136Xe, following correction for mass discrimination. The averagecomposition thus observed was compared to that expected for Xe in thecalibration cell, and excesses were assigned to F-HC interferences. Theobserved and expected ratios at Xe-relevant masses are shown in Fig. 1,while the resulting F-HC correction factors, representing the fraction ofsignal at a given mass attributed to Xe, are provided in Table 3.
The F-HC correction algorithm just described assumes identicaloperating conditions between the calibration experiments used toderive the F-HC correction and experiments executed on Mars.Because the calibration cell must be heated above 100 °C to ensurethat all F-HC components are fully volatilized (Mahaffy et al., 2012),this assumption may not strictly hold for experiments utilizing tem-perature profiles that differed from those used in ground calibration.During the relevant ground calibration experiments, all manifolds were
heated to 135 °C. During the CG1 experiment, however, the manifoldcontaining the calibration cell was heated to 135 °C, while all othermanifolds were heated to 50 °C for conservative power usage. Duringthe CG2 experiment, all manifolds were heated to 50 °C to establish anisothermal environment. These temperature differences caused a re-duction in abundances of F-HC compounds that reached the QMS,requiring an additional adjustment to Xe data. This adjustment wasimplemented based on the relative ratios between each Xe-relevant m/zand m/z 69, which includes fragments from all four F-HC compounds inthe calibration cell.
One further difference between ground calibration and flightexperiments required consideration when calculating the necessaryadjustments to the F-HC correction factors. To protect the secondaryelectron multiplier detector during these early calibration experiments,the detector was operated at a low voltage (−1900 V) not optimal forscience data collection, which produced mass spectra fractionated fromthose acquired with the nominal operating voltage (−2252 V) used onMars. Tests with the SAM breadboard QMS provided a correctionfunction, parameterized in terms of the mass difference between a givenm/z and m/z 132, for these two operating conditions:
mX = 100⋅ X /(100 + 0.0099 × Δm –0.2151⋅Δ ),cm
om 2 (2)
where mXc and mXo are the voltage-corrected and observed signal at m/zm, respectively, for the ground calibration data and Δm=132–m. Thiscorrection specifically addresses variations in QMS response related tothe differences in operating parameters utilized in these groundcalibration experiments compared to those of CG1 and CG2 and shouldnot be used in other circumstances.
The resulting adjustment factors needed for the CG1 and CG2experiments, applied to Xe isotope ratios after the mass fractionationand nominal F-HC corrections, are provided in the last two columns ofTable 3.
3.3. Experiment descriptions
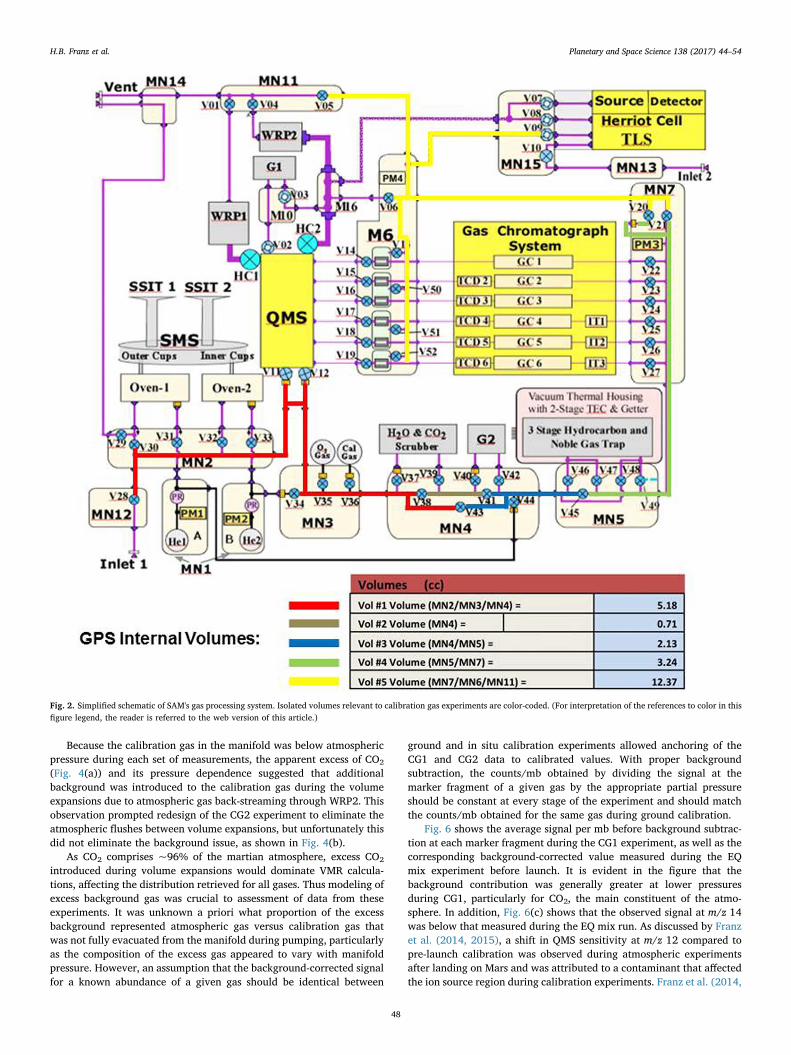
A schematic diagram of the SAM instrument suite is shown in Fig. 2.Instrument components and QMS operating modes for atmosphericanalyses are discussed in detail elsewhere (Franz et al., 2015, 2014;Mahaffy et al., 2012). Techniques employed for execution and dataprocessing of the calibration gas experiments were generally similar tothose described in the preceding references, with some modificationsunique to the nature of these analyses. The calibration experimentsutilized the tank labeled “Cal Gas,” connected to manifold MN3 in thelower portion of Fig. 2. Specific sections of the manifold were isolatedby valve operations during experiment execution and are labeled Vol#1–Vol #5 in Fig. 2 to facilitate the following discussion.
Fig. 3 shows the observed signal at marker fragments for majorconstituents of the calibration gas during CG1 and CG2 to help illustrateexperimental procedures. At the start of the CG1 experiment in Mars,the gas manifold containing the calibration cell was heated to 135 °C,while all other manifolds were heated to 50 °C; during the CG2experiment, all manifolds were heated to 50 °C. The QMS and manifoldswere evacuated by the turbomolecular pumps (WRP1 and WRP2), thenthe manifolds were isolated from the martian environment throughclosure of valve V05. Initial background scans were performed with theQMS only, followed by scans with the QMS open to the evacuatedmanifold. Calibration gas was introduced into Vol #1, 3, 4 and 5 byopening valve V36 for 0.02 s.
In the CG1 experiment, SAM pressure monitor readings indicatedthat an initial pressure of 6.2 mb was achieved in the manifold. ValveV43 was then closed to isolate gas in Vol #1, and valve V09 was openedfor 33 s to introduce gas to the TLS for later analysis. A series of volumeexpansions was then performed to gradually reduce the gas pressure forQMS analysis. For each expansion, with V43 closed, V05 was openedfor 11 s to flush the manifolds downstream of V43 with atmosphericgas, after which they were evacuated by WRP2. Valve 21 was
a Constants for CO2 and N2 are from Franz et al. (2015).b O2 calibration constant is not used in calibration cell measurements but is included
here to indicate updated uncertainty for use in retrieval of martian atmospheric VMR.c See Eq. (1).
H.B. Franz et al. Planetary and Space Science 138 (2017) 44–54
46
subsequently closed and V43 was opened to allow calibration gas toexpand into Vol #1, 3 and 4. Each such expansion reduced the gaspressure approximately by half. After each expansion, valve V43 wasclosed to isolate Vol #1 from the downstream manifolds. While the gasin Vol #1 was analyzed by the QMS, the downstream manifolds wereflushed and evacuated to prepare for the next volume expansion.Through this procedure, measurements were performed at pressuresof 3.1 mb, 1.5 mb, 0.7 mb, and 0.4 mb, as calculated based on themanifold volumes shown in the table accompanying Fig. 2.
For QMS analyses, gas flowed from the manifold through a glasscapillary via valve V11 into the QMS ion source, which utilizes electronimpact ionization. During in situ experiments, the QMS scanned a set ofm/z values that were pre-selected on the basis of the calibration gascomposition. This “vector-scanning” approach allowed optimal timeresolution for m/z of interest (Franz et al., 2014). The QMS scanned forapproximately 25 min at each pressure during the CG1 experiment.
Upon completion of the fourth calibration gas analysis, the entiremanifold was flushed with martian atmospheric gas and then evacu-ated. Valve V43 was again closed to isolate Vol #1 from downstreammanifolds. A second set of QMS background scans was performed, afterwhich atmospheric gas was introduced to Vol #1 through valve V28.The atmospheric gas was then sampled by the QMS to allow evaluationof atmospheric measurements in the context provided by the precedingcalibration analyses.
The second calibration gas experiment (CG2) was performed inDecember 2015. The experimental design for CG2 included somemodifications intended to address complications encountered duringprocessing of CG1 data that suggested unexpected introduction ofatmospheric gas to the background during volume expansions, dis-cussed in Section 3.4 below. First, the manifold in Vol #3, 4 and 5 wasnot flushed with atmospheric gas after each volume expansion, but wassimply pumped by WRP2. Second, each analysis segment was increased
to approximately 26 min, but only three pressures were sampled in thisexperiment: 2.9, 1.4 and 0.7 mb (Fig. 3).
3.4. Data processing
Data acquired at each operating pressure were corrected forpressure effects, detector dead time and instrument background bymethods similar to those described previously (Franz et al., 2015,2014). All results utilized integrated peak areas for a given m/z±0.4(Franz et al., 2014). A proportional background model was usedinitially, analogous to that typically employed for analysis of atmo-spheric gas, with background proportions established by extrapolationof trends observed in the background region at the start of theexperiment to the time of calibration gas introduction. Since this gasmixture was processed through each successive volume expansion, theproportions of background and calibration gas were nominally expectedto remain constant throughout the calibration measurements.
3.5. VMR calculations
At the highest pressure of each experiment, the signal at m/z 40saturated the QMS detector, so no VMR calculations were possible forthose analysis regions. However, volume mixing ratios of the majorcalibration species (CO2, Ar, N2, and Xe) were computed at eachsubsequent pressure by application of Eq. (1) with the calibrationconstants given in Table 2. VMR obtained from initial processing of CG1data did not match the actual calibration gas composition, as shown inFig. 4(a). In particular, the CO2 VMR was significantly higher thanexpected and increased as the calibration gas pressure decreased, whilethe N2 VMR was lower than expected. Three possible sources of errorwere considered: (1) leakage from the calibration cell since loading, (2)inadequate modeling of background contributions during initial dataprocessing, and (3) errors in the calibration constants.
If leakage across the seat of valve V36 that connects the calibrationgas cell to the manifold had occurred, mass-dependent fractionation ofthe gases could have altered the composition of the remaining mixture.The pressure measured during introduction of calibration gas to themanifold in CG1 was in line with the trend established during pre-flightexperiments and did not suggest significant leakage from the calibra-tion cell. However, a V36 leak rate of up to 5×10⁻⁹ atm·cc/s for Hewas estimated during pre-launch testing. Assuming relative leak ratesproportional to the square root of mass of relevant species, the majorgas composition of the calibration cell was modeled from the time ofloading to its first use on Mars, a period of 2575 days. The modelpredicted slight decreases in CO2, N2 and Ar VMR and a slight increasein Xe VMR, as shown in Fig. 5. Comparison of modeling results in Fig. 5with VMR results of Fig. 4(a) indicates that a leak of this rate from thecalibration cell alone cannot explain the deviations from expected VMRencountered in initial processing of CG1 data.
Fig. 1. Pre-flight calibration data used to derive correction factors for isobaric interferences from fluorinated hydrocarbon (F-HC) fragments at Xe masses: (a) All Xe isotopes, (b) Detail ofminor isotopes. Excess signal above that expected for the known Xe isotopic composition of the calibration gas was attributed to F-HC fragments.
Table 3Correction factors for F-HC interferences at Xe masses.
Xe mass F-HC correctionfactor
Additional adjustment for observed F-HCabundances relative to ground calibrationa
a Average values for multiple pressure regimes of each experiment.
H.B. Franz et al. Planetary and Space Science 138 (2017) 44–54
47
Because the calibration gas in the manifold was below atmosphericpressure during each set of measurements, the apparent excess of CO2
(Fig. 4(a)) and its pressure dependence suggested that additionalbackground was introduced to the calibration gas during the volumeexpansions due to atmospheric gas back-streaming through WRP2. Thisobservation prompted redesign of the CG2 experiment to eliminate theatmospheric flushes between volume expansions, but unfortunately thisdid not eliminate the background issue, as shown in Fig. 4(b).
As CO2 comprises ~96% of the martian atmosphere, excess CO2
introduced during volume expansions would dominate VMR calcula-tions, affecting the distribution retrieved for all gases. Thus modeling ofexcess background gas was crucial to assessment of data from theseexperiments. It was unknown a priori what proportion of the excessbackground represented atmospheric gas versus calibration gas thatwas not fully evacuated from the manifold during pumping, particularlyas the composition of the excess gas appeared to vary with manifoldpressure. However, an assumption that the background-corrected signalfor a known abundance of a given gas should be identical between
ground and in situ calibration experiments allowed anchoring of theCG1 and CG2 data to calibrated values. With proper backgroundsubtraction, the counts/mb obtained by dividing the signal at themarker fragment of a given gas by the appropriate partial pressureshould be constant at every stage of the experiment and should matchthe counts/mb obtained for the same gas during ground calibration.
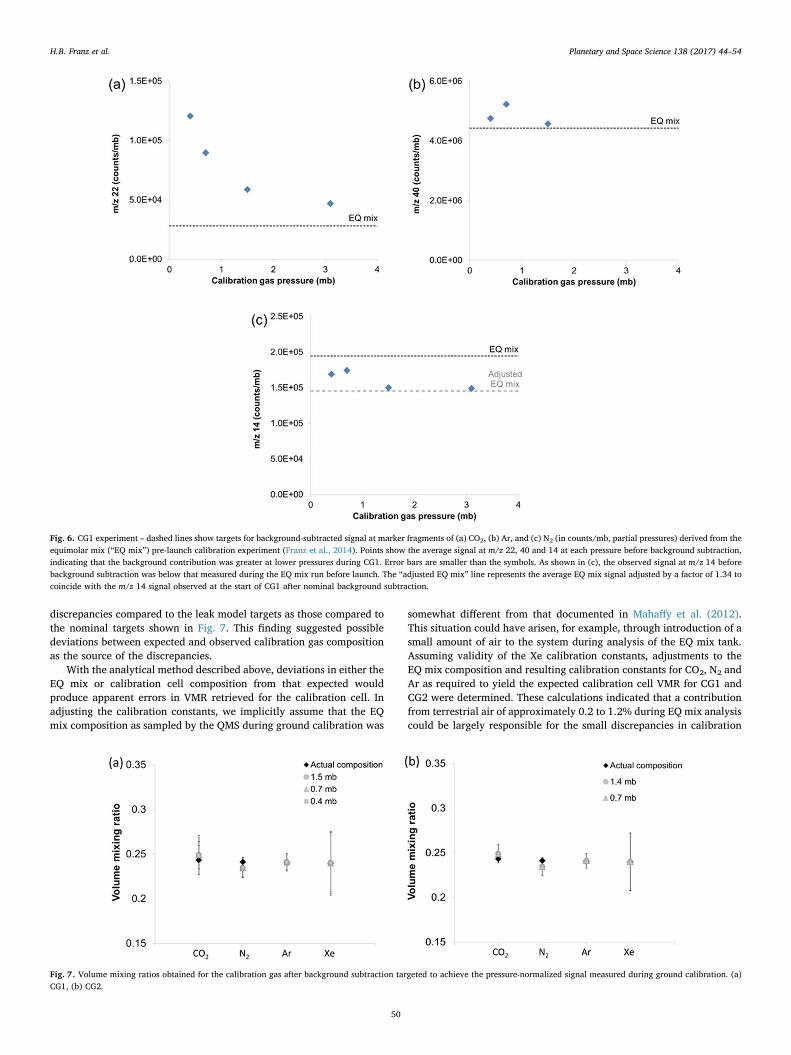
Fig. 6 shows the average signal per mb before background subtrac-tion at each marker fragment during the CG1 experiment, as well as thecorresponding background-corrected value measured during the EQmix experiment before launch. It is evident in the figure that thebackground contribution was generally greater at lower pressuresduring CG1, particularly for CO2, the main constituent of the atmo-sphere. In addition, Fig. 6(c) shows that the observed signal at m/z 14was below that measured during the EQ mix run. As discussed by Franzet al. (2014, 2015), a shift in QMS sensitivity at m/z 12 compared topre-launch calibration was observed during atmospheric experimentsafter landing on Mars and was attributed to a contaminant that affectedthe ion source region during calibration experiments. Franz et al. (2014,
Fig. 2. Simplified schematic of SAM's gas processing system. Isolated volumes relevant to calibration gas experiments are color-coded. (For interpretation of the references to color in thisfigure legend, the reader is referred to the web version of this article.)
H.B. Franz et al. Planetary and Space Science 138 (2017) 44–54
48
2015) considered the possibility that fragments of the same contami-nant may have also affected m/z 14, leading to erroneous results for N2
VMR determined for the martian atmosphere (Mahaffy et al., 2013).The data presented in Fig. 6(c) provide evidence supporting thispossibility. After modeling of the nominal proportional background,the average signal observed at m/z 14 during the highest pressure stageof CG1, which incurred minimal contribution from excess background,was used as the target value for m/z 14 signal in the following analysis,with a corresponding adjustment to the N2 calibration constant.
Based on the known calibration cell composition, subtraction of thebackground at each species required to achieve the target pressure-normalized QMS signal established by EQ mix data allowed evaluation
of the calibration constants. This was accomplished in the followingmanner. At each pressure in the CG1 and CG2 experiments, theappropriate background signal was subtracted from marker fragmentsfor CO2, N2 and Ar to achieve the adjusted counts/mb from groundcalibration, as just described. The background signal for Xe wasdetermined as that required to achieve the expected Xe VMR for thecalibration gas after correction for contributions from F-HC compoundsand adjustment for F-HC abundances compared to ground calibration asdiscussed in Section 3.2, then the resulting VMR for CO2, N2 and Arwere evaluated. As shown in Fig. 7, the calibration constants, afterappropriate adjustment to the N2 calibration constant, retrieved theexpected composition of the calibration cell within estimated uncer-tainties. However, small discrepancies in the expected VMR remainedeven after this modification. With the initial background issues largelyresolved, a leak from the calibration cell and uncertainties in calibra-tion gas composition were investigated as possible sources of thesesmall discrepancies.
Data for CG1 and CG2 do not indicate a He leak rate of5×10−9 atm·cc/s across V36, as shown in Fig. 6, because the observedsignal at m/z 132 was insufficient to support Xe VMR of ~27% aspredicted by the leak model. The maximum leak allowed by the data isconstrained by the observed m/z 132 signal before backgroundsubtraction, which for the P2 region of CG1 would yield approximately24.6% Xe. Our leak model estimates that this Xe VMR would beproduced by a He leak of 8.2×10⁻¹⁰ atm·cc/s. However, when resultsof this model were applied to VMR calculations for the calibration cellusing the method just described, the VMR retrieved displayed similar
Fig. 3. QMS signal observed at marker fragments for major calibration gas constituents.(a) CG1, (b) CG2. The curve in the m/z 40 trace in the P1 region indicates detectorsaturation, thus no VMR calculations are performed for this pressure regime.
Fig. 4. Volume mixing ratios obtained from initial processing of calibration gas experiments using Eq. (1) and the calibration constants given in Table 1. (a) Experiment CG1, July 2015.(b) Experiment CG2, December 2015.
Fig. 5. Calibration cell composition modeled assuming leak rate across V36 of5×10−9 atm·cc/s for He and mass-dependent fractionation of calibration gases for2575 days after cell loading. Error bars are smaller than the symbols.
H.B. Franz et al. Planetary and Space Science 138 (2017) 44–54
49
discrepancies compared to the leak model targets as those compared tothe nominal targets shown in Fig. 7. This finding suggested possibledeviations between expected and observed calibration gas compositionas the source of the discrepancies.
With the analytical method described above, deviations in either theEQ mix or calibration cell composition from that expected wouldproduce apparent errors in VMR retrieved for the calibration cell. Inadjusting the calibration constants, we implicitly assume that the EQmix composition as sampled by the QMS during ground calibration was
somewhat different from that documented in Mahaffy et al. (2012).This situation could have arisen, for example, through introduction of asmall amount of air to the system during analysis of the EQ mix tank.Assuming validity of the Xe calibration constants, adjustments to theEQ mix composition and resulting calibration constants for CO2, N2 andAr as required to yield the expected calibration cell VMR for CG1 andCG2 were determined. These calculations indicated that a contributionfrom terrestrial air of approximately 0.2 to 1.2% during EQ mix analysiscould be largely responsible for the small discrepancies in calibration
Fig. 6. CG1 experiment – dashed lines show targets for background-subtracted signal at marker fragments of (a) CO2, (b) Ar, and (c) N2 (in counts/mb, partial pressures) derived from theequimolar mix (“EQ mix”) pre-launch calibration experiment (Franz et al., 2014). Points show the average signal at m/z 22, 40 and 14 at each pressure before background subtraction,indicating that the background contribution was greater at lower pressures during CG1. Error bars are smaller than the symbols. As shown in (c), the observed signal at m/z 14 beforebackground subtraction was below that measured during the EQ mix run before launch. The “adjusted EQ mix” line represents the average EQ mix signal adjusted by a factor of 1.34 tocoincide with the m/z 14 signal observed at the start of CG1 after nominal background subtraction.
Fig. 7. Volume mixing ratios obtained for the calibration gas after background subtraction targeted to achieve the pressure-normalized signal measured during ground calibration. (a)CG1, (b) CG2.
H.B. Franz et al. Planetary and Space Science 138 (2017) 44–54
50
cell VMR seen in Fig. 7, with additional contributions from uncertain-ties in the measured m/z 14 background from CG1 and calculationsinvolving Xe. The revised calibration constants generated by thisprocedure are provided in the last column of Table 2, with resultingcalibration cell VMR shown in Fig. 8 and listed in Table 4.
The possibility that a small air leak may have impacted EQ mixanalysis and the original calibration constants used to retrieve martianatmospheric VMR suggests that the O2 calibration constant, which isnot exercised during calibration cell analyses, may also have beenaffected because terrestrial air contains ~21% O2. Although we cannotcalculate a precise adjustment to the O2 calibration constant using CG1and CG2 data, we can evaluate the potential impact of terrestrial airduring EQ mix sampling based on the adjustments required for the CO2
and N2 calibration constants. The range of air contribution during EQmix analysis suggested by the required CO2 and N2 adjustments restrictsthe corresponding change in the ratio of m/z 40 and 32 to factors of1.001–1.009. The latter value would place the revised O2 calibrationconstant just above the upper limit provided by its current uncertainty.We have thus adjusted the uncertainty on the O2 calibration constantfrom ±0.013 to ±0.014, as shown in Table 2, to encompass thisrange of possibilities.
3.6. Isotope ratios
Other key results provided by the calibration cell experimentsinvolved computation of CO2 and Xe isotope ratios for the calibrationgas. As the CG2 experiment experienced some signal instability at m/z45 and 46 that compromised isotopic calculations, only CO2 isotoperesults for the CG1 experiment are discussed. Calculation of nitrogenand argon isotope ratios were compromised by difficulties modelingbackground contributions from F-HC compounds and HCl produced byhigh chlorine contents of solid materials processed by SAM (Glavinet al., 2013), respectively, so no results for those isotope systems are
presented.
3.6.1. CO2 isotopesSAM QMS data allow calculation of both carbon and oxygen isotope
ratios of CO2. They are reported as delta values (δ13C and δ18O) thatrepresent per mil deviations from reference standards:
δ C = 1000⋅[( C/ C) /( C/ C) − 1]V13 13 12
sample13 12
−PDB (3)
and
δ O = 1000⋅[( O/ O) /( O/ O) − 1],V18 18 16
sample18 16
−SMOW (4)
where the reference standard for carbon is Vienna Pee Dee Belemnite(V-PDB) and that for oxygen is Vienna Standard Mean Ocean Water (V-SMOW).
Carbon isotope ratios are computed by several methods duringroutine SAM atmospheric analyses. The most straightforward calcula-tion involves the ratio of background-corrected signal observed at m/z12 and 13, providing a direct measurement of 13C/12C. However, thosem/z were affected by interferences from F-HC compounds during thecalibration cell experiments. Other methods for calculation of 13C/12Cutilize the signal at m/z 45 and require correction for interferences fromthe isotopologue 12C16O17O. As this in turn requires knowledge of theoxygen isotopic composition, we will discuss those calculations first,then return to carbon isotopes.
Oxygen isotope ratios of CO2 would nominally be computed fromthe signal observed at m/z 44 and 46. Due to detector saturation at m/z44, however, the signal for the major isotopologue at m/z 44 must beestimated from m/z 22 using the calibration constant provided by Franzet al. (2015). Corrections to this estimation are required to account forwidening of the peak area at m/z 22 since pre-flight calibration, asdiscussed in Franz et al. (2015). The average changes in relative peakareas on Mars compared to ground calibration at m/z relevant to VMR
Fig. 8. VMR obtained with calibration constants modified on assumption of deviations between expected and measured EQ mix composition during derivation of original constants, aswell as the adjustment to the N2 calibration constant to address effects of a filament contaminant inferred to be present during early experiments on Earth and Mars.
Table 4Effects of applying revised calibration constants to VMR calculations for CG1 and CG2.
H.B. Franz et al. Planetary and Space Science 138 (2017) 44–54
51
calculations were factored into the revised calibration constants givenby Franz et al. (2015). This approach is sufficient for addressing effectson VMR calculations but not for isotope ratios, in which we areinterested in deviations at a much smaller scale. Thus changes in peakareas were not factored into the calibration constant for estimation ofm/z 44 from 22 given by Franz et al. (2015) because optimalcalculations of CO2 isotope ratios are achieved by correcting for theactual ratios of peak areas in each individual experiment. This isaccomplished by computing the normalized peak areas at m/z±0.4 form/z 22 and 46 (or m/z 22 and 45 for carbon isotope ratios) andcorrecting the measured ratios according to the difference in this ratiocompared to that observed during ground calibration.
Accurate calculation of oxygen isotope ratios from the signal thusestimated or observed at m/z 44 and 46 requires correction for isobaricinterferences from isotopologues containing 17O and 13C. A correctionalgorithm was derived using an approach similar to that of previousworkers (Coleman, 2004; Craig, 1957; Thode et al., 1949), yielding thefollowing expression:
FR =( ×m46/m44 – R − 2⋅ R⋅ R) / 2,18peak
17 2 13 17 (5)
where 18 R=18O/16O, Fpeak is a correction factor for normalized peakareas described above, m46 is the signal observed at m/z 46, m44 is theestimated signal at m/z 44 based on the observed m/z 22,17R=17O/16O, and 13R=13C/12C. For calibration cell analyses, thesecorrections incorporated values of 17R and 13R based on the knownisotopic composition of CO2 provided by measurements during groundcalibration (Franz et al., 2014). For analyses of martian atmosphericdata, iterations between carbon and oxygen isotope ratio calculations,with the assumption that Δ17O=0.32% for Mars (Franchi et al., 1999),are performed until convergence is achieved for 17R and 13R values.
A similar approach yielded the following expression for calculationof carbon isotope ratios from m/z 22 and 45:
FC =( × m45/m44–2⋅ R),13peak
17 (6)
where Fpeak is a correction factor for normalized peak areas as describedabove, m45 is the signal observed at m/z 45, m44 is the estimatedsignal at m/z 44 based on the observed m/z 22, and 17R=17O/16Oexpected for calibration cell, as before.
Prior to derivation of the algorithm to correct for pressure effects inproduction of CO2
++ ions discussed in Franz et al. (2015), anexpression was derived to allow calculation of CO2 carbon isotopiccomposition from data observed at m/z 45 and 46 alone, withappropriate corrections for oxygen isotopic composition:
RR = (m45⋅ R + 2⋅m45⋅ R − 2⋅m46 × )/(m46 − 2⋅m45⋅ R),13 17 2 18 17 17 (7)
where relevant quantities are the same as those already defined for Eqs.(5) and (6). Corrections for relative normalized peak areas at m/z 45and 46 may also be applied, but the QMS tuning at these m/z is quitesimilar and this correction usually changes results by only a few per milor less. The expression in Eq. (7) was useful in cross-comparisonbetween QMS and TLS measurements of δ13C during the earliest SAMexperiments on Mars (Mahaffy et al., 2013), when QMS analyses usingm/z 45 and 46 relied upon TLS values for oxygen isotopic composition,and offers ongoing verification of δ13C calculated from m/z 12 and 13and m/z 22 and 45.
Calculation of the CO2 isotopic composition from the calibration gasexperiments was challenging due to the introduction of excess back-ground from atmospheric CO2 during volume expansions, as discussedin Section 3.4. This is illustrated in Fig. 9, which shows the 13C/12Cratio calculated during initial data analysis using the nominal propor-tional background model. It is evident in the figure that the 13C/12C ofthe calibration gas (actual δ13C=−42.67±0.06%) was affected byintroduction of progressively greater proportions of atmospheric CO2
(δ13C≈45%, Mahaffy et al., 2013) as the calibration gas pressure wasdecreased. This result is consistent with increasing background from
atmospheric CO2 apparent in VMR calculations, as discussed in Section3.4. However, the isotopic composition determined for the highestpressure region of CG1, which was least affected by excess background,provides a coarse validation of the QMS capability to retrieve CO2
isotope ratios. Application of the nominal proportional backgroundmodel produced δ18O of 7.0±14.8% (compared to the actual δ18O of6.61±0.06%), δ13C of −36.3±25.9% from m/z 22 and 45, and δ13Cof −40.6± 25.5% from m/z 45 and 46. Note that the uncertaintiesreported here include error propagation through all data corrections;the standard deviation of the mean for the measured ratios isapproximately ± 2% for both δ13C and δ18O. As the gas mixture inthe manifold had already been altered by introduction of some atmo-spheric gas during the volume expansion prior to initial sampling of thecalibration gas by the QMS, it is not surprising that these values reflectslight enrichments in heavy isotopes compared to the compositionexpected for the calibration gas due to the presence of atmospheric CO2
that is not taken into account in this background model. Nevertheless,as the measured values of δ13C and δ18O match the expected valueswithin ~6% or less despite inadequate correction for atmospheric gasin the background, these results validate the accuracy of QMSmeasurements of CO2 isotope ratios.
Further validation of the measured CO2 isotopic composition wasachieved after correction for excess background gas by comparison ofresults for δ13C and δ18O obtained from m/z 22, 45 and 46 with thoseobtained for δ13C from m/z 45 and 46 using the known oxygen isotopiccomposition for the calibration cell. This was accomplished by anextension of the VMR analysis described in Section 3.4. After subtrac-tion of the m/z 22 background necessary to achieve the same signal incounts/mb as observed in the EQ mix experiment, the backgrounds atm/z 45 and 46 were calculated as those required for accurate retrievalof δ13C and δ18O from m/z 22, 45 and 46. Using these same backgroundvalues, δ13C was calculated from m/z 45 and 46 for comparison. In allfour pressure regimes of CG1, this effort produced an error of ~3% orless in the δ13C obtained from m/z 45 and 46, a value well within theuncertainty typically determined for QMS measurements of δ13C andδ18O that provides a constraint on the magnitude of mass discrimina-tion at CO2 isotopologues.
3.6.2. Xe isotopesCalculation of Xe isotope ratios from QMS data is nominally
straightforward, as described by Conrad et al. (2016), with ratios ofbackground-subtracted signal at relevant m/z requiring only a correc-tion for mass discrimination. The background at each relevant m/z was
Fig. 9. CO2 carbon isotopic composition measured during initial analysis of CG1 data atm/z 22 and 45. Error bars are omitted for clarity. The figure illustrates that as thecalibration gas pressure decreased with successive volume expansions, the calculated13C/12C rose due to increasing contribution from atmospheric gas in the background thatwas not properly removed, a finding consistent with initial VMR results indicating excessbackground CO2.
H.B. Franz et al. Planetary and Space Science 138 (2017) 44–54
52
based on the background at m/z 132 computed during VMR calcula-tions, assuming the same relative abundance compared to m/z 132 asmeasured at the start of the experiment, before correction for F-HCcompounds. This method was devised in an effort to account forpotential contributions from both Xe and F-HC compounds in thebackground. As described in Section 3.2, Xe isotopic analyses of datafrom the calibration cell experiments required additional corrections toaccount for isobaric interferences from F-HC compounds and tempera-ture differences between ground calibration and experiments on Mars,listed in Table 3. All ratios are also corrected for differences innormalized peak areas, as already discussed for CO2 isotopes above.
Fig. 10 shows the average of Xe isotope ratios measured for multiplepressure regimes of each experiment, after applying corrections for F-HC compounds. Error bars incorporate uncertainties in the F-HCcorrection factors and are therefore larger than those for enrichmentexperiments measuring Xe in the atmosphere (Conrad et al., 2016). Asseen in the figure, all measured ratios are within uncertainty of thoseexpected for the calibration cell, validating the QMS capability tomeasure Xe isotope ratios.
4. Implications for martian atmospheric composition
Because data from the atmospheric measurement regions of the CG1and CG2 experiments were affected by high backgrounds due toresidual calibration gas that compromised calculation of minor species,we do not report those results here. Rather, we assess the impact of themodified calibration constants given in Table 2 on the VMR retrievedfor the martian atmosphere by reprocessing data acquired during twoearly SAM experiments reported previously (Franz et al., 2015; Mahaffyet al., 2013). These experiments (#25012 and #25027) were executedon sols 45 and 77 at solar longitudes of 175° and 193°, respectively.Results are given in Table 5, with previously reported results utilizingcalibration constants described in Section 2.2 for comparison (Franzet al., 2015).
As expected, the N2 VMR is impacted most significantly by therevised calibration constants, raising the weighted average for thesetwo experiments to approximately 2.8 vol%. The weighted average forAr VMR is approximately 2.1 vol%. When normalized to average annualpressure to remove seasonal effects due to the CO2 condensation-sublimation cycle (Harri et al., 2014), the resulting N2 and Ar VMR of2.6 vol% and 1.9 vol%, respectively, may be compared with thosereported for Viking measurements (Owen et al., 1977; Oyama andBerdahl, 1977). With or without pressure normalization, the averagerevised ratio of 40Ar/14N for these two experiments is 0.37± 0.01, avalue between the previously reported SAM result of 0.51±0.01(Franz et al., 2015; Mahaffy et al., 2013) and the values of 0.3 (Owenet al., 1977) and 0.35±0.08 (Oyama and Berdahl, 1977) reported formultiple Viking instruments.
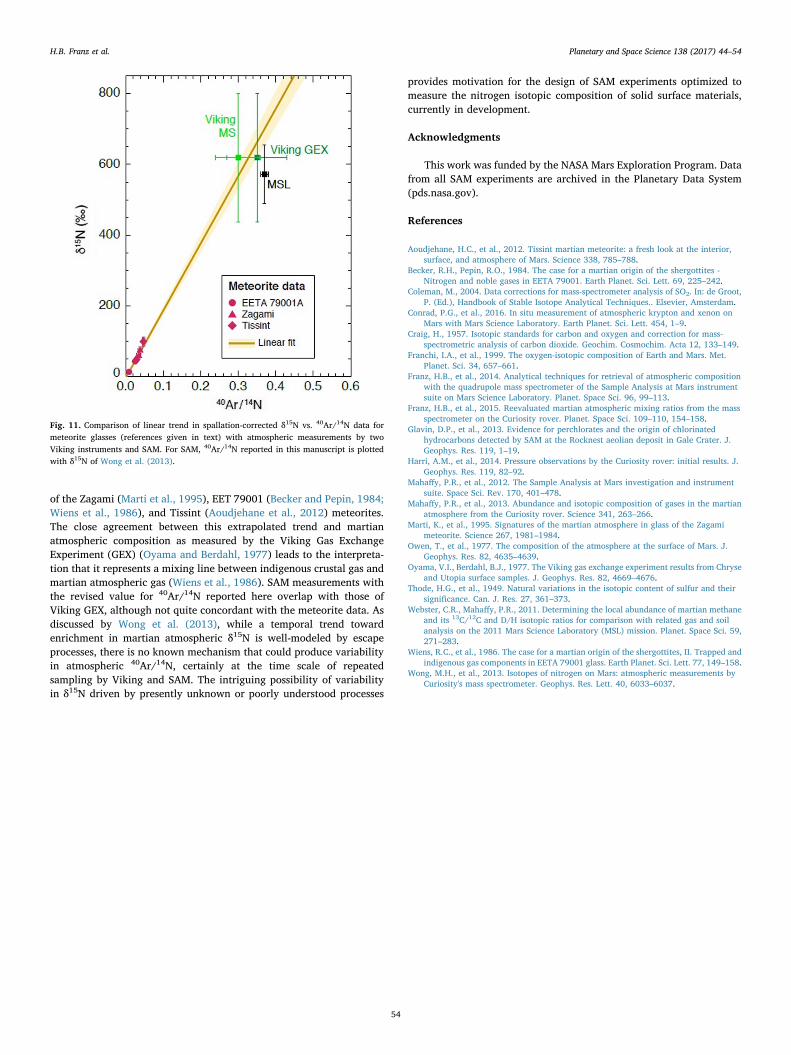
It is of interest to compare SAM results for δ15N vs. 40Ar/14N withthose observed in martian atmospheric gas released through thermalprocessing of meteorite shock melt glasses, as shown in Fig. 11. Thisfigure illustrates a linear trend in composition of gas trapped in glasses
Fig. 10. Xe isotope ratios measured for the calibration cell experiments. (a) All isotopes, CG1; (b) Detail of minor isotopes, CG1; (c) All isotopes, CG2; (d) Detail of minor isotopes, CG2.Error bars on observed values include uncertainties associated with F-HC corrections and are thus larger than those for measurements of atmospheric Xe.
Table 5Effects of applying revised N2 calibration constant to VMR calculations for data acquiredon MSL sols 45 and 77 (at solar longitudes of 175° and 193°, respectively).
Species VMR with refined calibrationconstants (Franz et al., 2015)
a Weighted mean and associated uncertainty for each compound.
H.B. Franz et al. Planetary and Space Science 138 (2017) 44–54
53
of the Zagami (Marti et al., 1995), EET 79001 (Becker and Pepin, 1984;Wiens et al., 1986), and Tissint (Aoudjehane et al., 2012) meteorites.The close agreement between this extrapolated trend and martianatmospheric composition as measured by the Viking Gas ExchangeExperiment (GEX) (Oyama and Berdahl, 1977) leads to the interpreta-tion that it represents a mixing line between indigenous crustal gas andmartian atmospheric gas (Wiens et al., 1986). SAM measurements withthe revised value for 40Ar/14N reported here overlap with those ofViking GEX, although not quite concordant with the meteorite data. Asdiscussed by Wong et al. (2013), while a temporal trend towardenrichment in martian atmospheric δ15N is well-modeled by escapeprocesses, there is no known mechanism that could produce variabilityin atmospheric 40Ar/14N, certainly at the time scale of repeatedsampling by Viking and SAM. The intriguing possibility of variabilityin δ15N driven by presently unknown or poorly understood processes
provides motivation for the design of SAM experiments optimized tomeasure the nitrogen isotopic composition of solid surface materials,currently in development.
Acknowledgments
This work was funded by the NASA Mars Exploration Program. Datafrom all SAM experiments are archived in the Planetary Data System(pds.nasa.gov).
References
Aoudjehane, H.C., et al., 2012. Tissint martian meteorite: a fresh look at the interior,surface, and atmosphere of Mars. Science 338, 785–788.
Becker, R.H., Pepin, R.O., 1984. The case for a martian origin of the shergottites -Nitrogen and noble gases in EETA 79001. Earth Planet. Sci. Lett. 69, 225–242.
Coleman, M., 2004. Data corrections for mass-spectrometer analysis of SO2. In: de Groot,P. (Ed.), Handbook of Stable Isotope Analytical Techniques.. Elsevier, Amsterdam.
Conrad, P.G., et al., 2016. In situ measurement of atmospheric krypton and xenon onMars with Mars Science Laboratory. Earth Planet. Sci. Lett. 454, 1–9.
Craig, H., 1957. Isotopic standards for carbon and oxygen and correction for mass-spectrometric analysis of carbon dioxide. Geochim. Cosmochim. Acta 12, 133–149.
Franchi, I.A., et al., 1999. The oxygen-isotopic composition of Earth and Mars. Met.Planet. Sci. 34, 657–661.
Franz, H.B., et al., 2014. Analytical techniques for retrieval of atmospheric compositionwith the quadrupole mass spectrometer of the Sample Analysis at Mars instrumentsuite on Mars Science Laboratory. Planet. Space Sci. 96, 99–113.
Franz, H.B., et al., 2015. Reevaluated martian atmospheric mixing ratios from the massspectrometer on the Curiosity rover. Planet. Space Sci. 109–110, 154–158.
Glavin, D.P., et al., 2013. Evidence for perchlorates and the origin of chlorinatedhydrocarbons detected by SAM at the Rocknest aeolian deposit in Gale Crater. J.Geophys. Res. 119, 1–19.
Harri, A.M., et al., 2014. Pressure observations by the Curiosity rover: initial results. J.Geophys. Res. 119, 82–92.
Mahaffy, P.R., et al., 2012. The Sample Analysis at Mars investigation and instrumentsuite. Space Sci. Rev. 170, 401–478.
Mahaffy, P.R., et al., 2013. Abundance and isotopic composition of gases in the martianatmosphere from the Curiosity rover. Science 341, 263–266.
Marti, K., et al., 1995. Signatures of the martian atmosphere in glass of the Zagamimeteorite. Science 267, 1981–1984.
Owen, T., et al., 1977. The composition of the atmosphere at the surface of Mars. J.Geophys. Res. 82, 4635–4639.
Oyama, V.I., Berdahl, B.J., 1977. The Viking gas exchange experiment results from Chryseand Utopia surface samples. J. Geophys. Res. 82, 4669–4676.
Thode, H.G., et al., 1949. Natural variations in the isotopic content of sulfur and theirsignificance. Can. J. Res. 27, 361–373.
Webster, C.R., Mahaffy, P.R., 2011. Determining the local abundance of martian methaneand its 13C/12C and D/H isotopic ratios for comparison with related gas and soilanalysis on the 2011 Mars Science Laboratory (MSL) mission. Planet. Space Sci. 59,271–283.
Wiens, R.C., et al., 1986. The case for a martian origin of the shergottites, II. Trapped andindigenous gas components in EETA 79001 glass. Earth Planet. Sci. Lett. 77, 149–158.
Wong, M.H., et al., 2013. Isotopes of nitrogen on Mars: atmospheric measurements byCuriosity's mass spectrometer. Geophys. Res. Lett. 40, 6033–6037.
Fig. 11. Comparison of linear trend in spallation-corrected δ15N vs. 40Ar/14N data formeteorite glasses (references given in text) with atmospheric measurements by twoViking instruments and SAM. For SAM, 40Ar/14N reported in this manuscript is plottedwith δ15N of Wong et al. (2013).
H.B. Franz et al. Planetary and Space Science 138 (2017) 44–54