55
Gustavo Fernandes Araujo ITAU UNIBANCO Planning and Performance Study in the Consolidation of Mainframe CECs

Gustavo Fernandes Araujo
ITAU UNIBANCO
Planning and Performance Study in the
Consolidation of Mainframe CECs

Session objectives
This study aims to present the process, tools,
planning and performance impacts during
Mainframe CECs consolidation.

Session summary
AgendaConclusion
Performance
Evaluation
Introduction
Tools
And
Planning

Session summary
AgendaConclusion
Performance
Evaluation
Introduction
Tools
And
Planning

Better utilization of computational resources
CPU
Channels
Reduction of physical CECs
Reduction in investment and effort to upgrade technology
Less utilization of physical space
Reduction in energy consumption
Single management point
Drivers
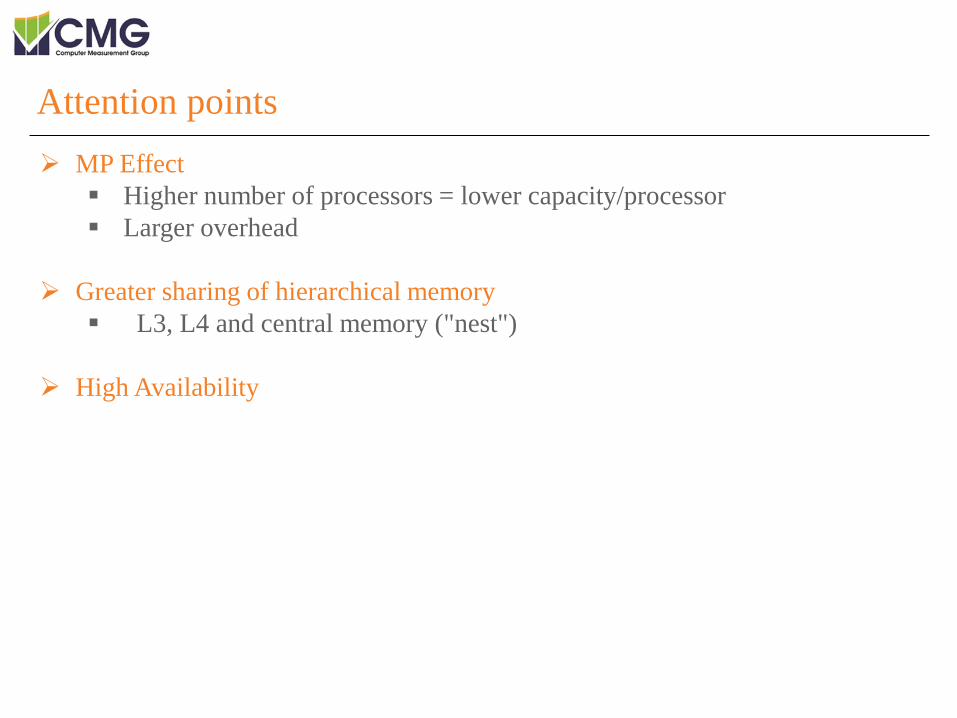
Attention points
MP Effect
Higher number of processors = lower capacity/processor
Larger overhead
Greater sharing of hierarchical memory
L3, L4 and central memory ("nest")
High Availability

-If one processor can do X amount of work, 16 processors all working together
cannot do an amount of work equal to 16 times the work. […] There’s a bunch
of other stuff that has to happen to allow those 16 processors to successfully work
together.
- There is a certain amount of measurable overhead (e.g., coordinate storage,
data access) required to keep everyone running safely across all 16 processors.
Source: http://www.ibmsystemsmag.com/mainframe/administrator/performance/compression-
zEDC/What-Is-a-Multiprocessor-Effect-/
MP Effect – What is the effect of multiprocessing?

MIPS and MSU per CP
MP Effect - z13
Model CPs MIPS/CP
z13-701 1 1.695
z13-7E1 141 791
Difference -53%

Technological update process - Step 1 - SWAP
zEC12 z13
LPAR 1 – Online Workload
LPAR 2 – Batch Workload
LPAR 3 – Batch Workload
LPAR 4 – GDPS
LPAR Y – Coupling Facility

Technological update process - Step 2 - Consolidation
z13
LPAR 1 – Online Workload
LPAR 2 – Batch Workload
LPAR 3 – Batch Workload
LPAR 4 – GDPS
LPAR Y – Coupling Facility
zEC12
LPAR 5 – Online Workload

Technological update process - Step 2 - Consolidation
z13
LPAR 1 – Online Workload
LPAR 2 – Batch Workload
LPAR 3 – Batch Workload
LPAR 4 – GDPS
LPAR Y – Coupling Facility
zEC12
LPAR 5 – Online Workload
z13
LPAR 1
LPAR 2
LPAR 3
LPAR 4
LPAR 5
LPAR Y
The consolidation was
performed without MIPS
acquisition
Session summary
AgendaConclusion
Performance
Evaluation
Introduction
Tools
And
Planning
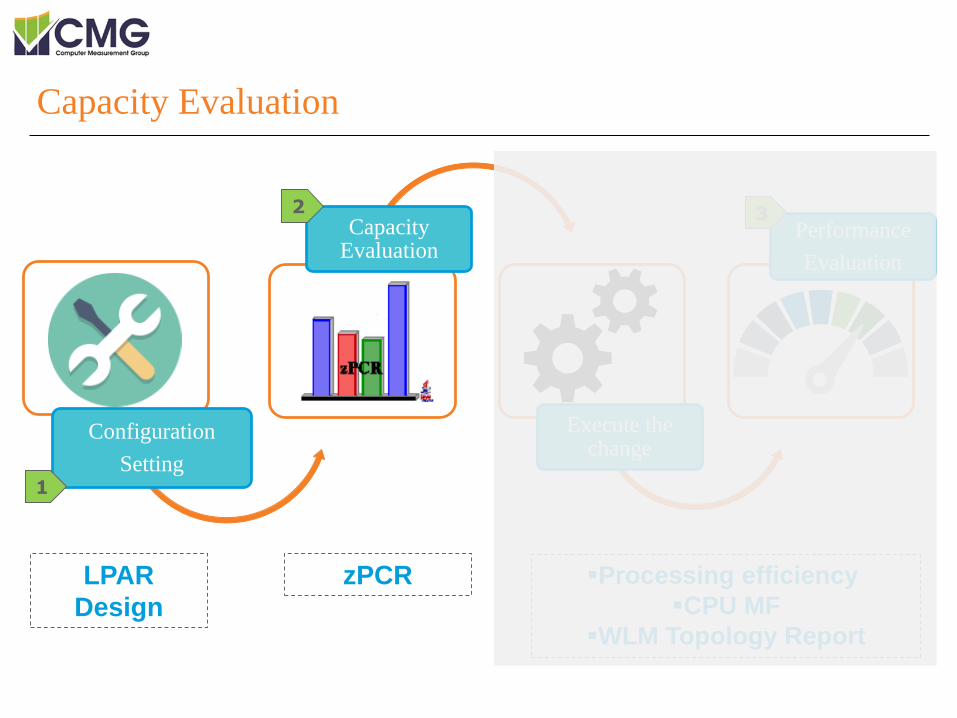
Configuration
Setting
CapacityEvaluation
Execute thechange
Performance
Evaluation
LPAR
Design
zPCR
1
2 3
Processing efficiency
CPU MF
WLM Topology Report
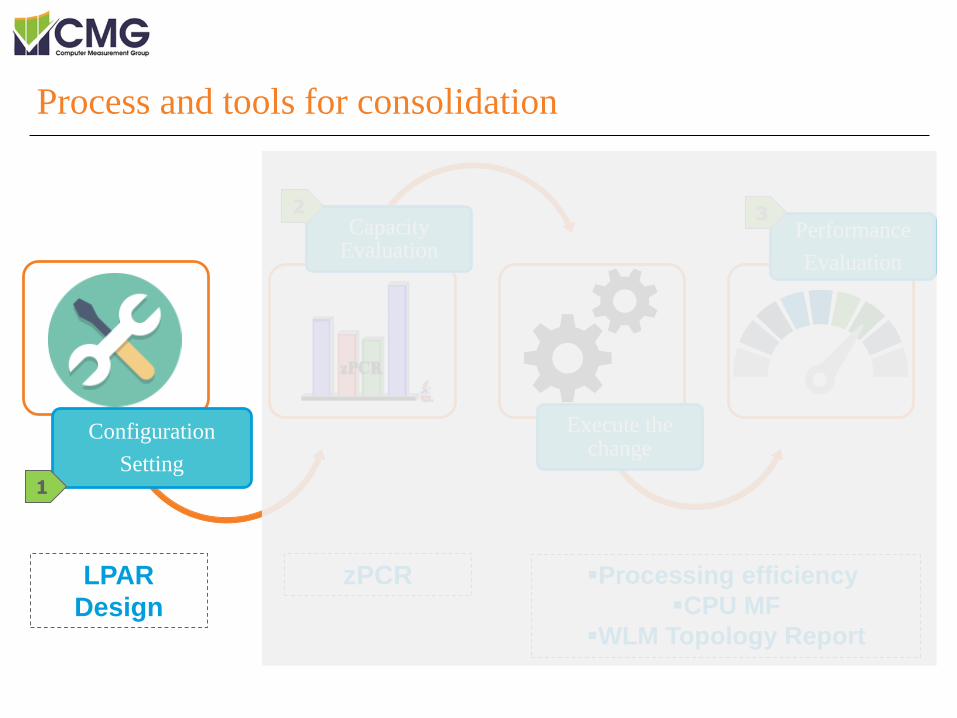
Process and tools for consolidation

Configuration
Setting
CapacityEvaluation
Execute thechange
Performance
Evaluation
LPAR
Design
zPCR
1
2 3
Processing efficiency
CPU MF
WLM Topology Report
Process and tools for consolidation

Configuration
Setting
CapacityEvaluation
Execute thechange
Performance
Evaluation
LPAR
Design
zPCR
1
2 3
Processing efficiency
CPU MF
WLM Topology Report
Process and tools for consolidation

Configuration
Setting
CapacityEvaluation
Execute thechange
Performance
Evaluation
LPAR
Design
zPCR
1
2 3
Processing efficiency
CPU MF
WLM Topology Report
Process and tools for consolidation

Configuration
Setting
CapacityEvaluation
Execute thechange
Performance
Evaluation
LPAR
Design
zPCR
1
2 3
Processing efficiency
CPU MF
WLM Topology Report
Configuration

Configuration
Setting
Evaluate the amount of physical
processors before and after the
change and study how to
distribute the processors in the
new configuration.
In a consolidation: try to ensure
the same amount of Vertical High
logical processors before and after
the change.
Tool: LPAR Design
Configuration Setting - Objective
1
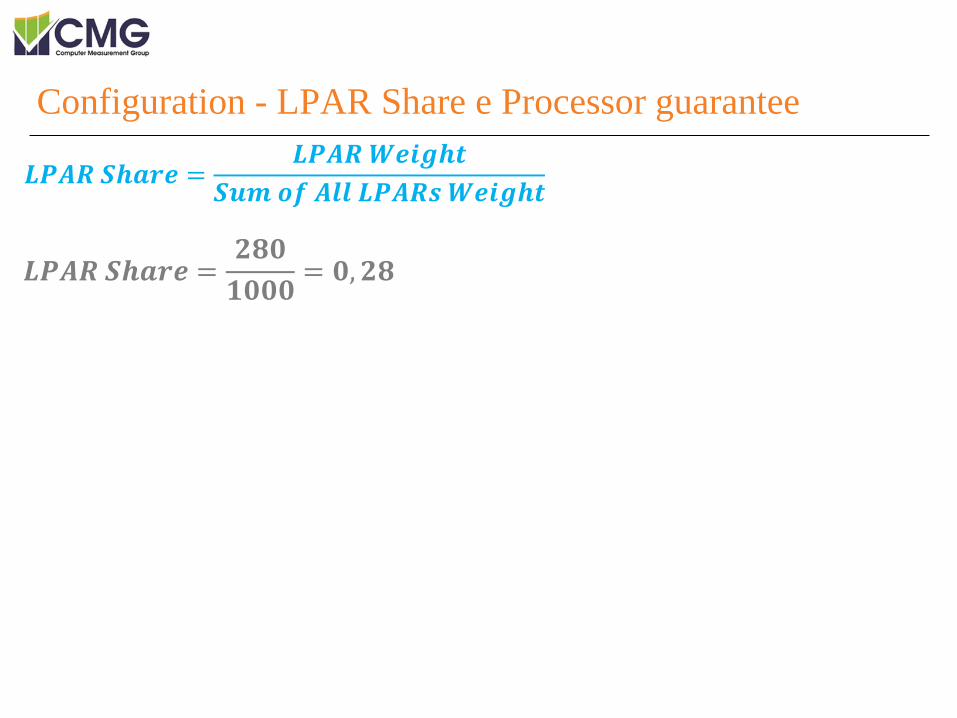
𝑳𝑷𝑨𝑹 𝑺𝒉𝒂𝒓𝒆 =𝑳𝑷𝑨𝑹 𝑾𝒆𝒊𝒈𝒉𝒕
𝑺𝒖𝒎 𝒐𝒇 𝑨𝒍𝒍 𝑳𝑷𝑨𝑹𝒔 𝑾𝒆𝒊𝒈𝒉𝒕
𝑳𝑷𝑨𝑹 𝑺𝒉𝒂𝒓𝒆 =𝟐𝟖𝟎
𝟏𝟎𝟎𝟎= 𝟎,𝟐𝟖
Configuration - LPAR Share e Processor guarantee

𝑳𝑷𝑨𝑹 𝑺𝒉𝒂𝒓𝒆 =𝑳𝑷𝑨𝑹 𝑾𝒆𝒊𝒈𝒉𝒕
𝑺𝒖𝒎 𝒐𝒇 𝑨𝒍𝒍 𝑳𝑷𝑨𝑹𝒔 𝑾𝒆𝒊𝒈𝒉𝒕
𝑷𝒓𝒐𝒄𝒆𝒔𝒔𝒐𝒓 𝑮𝒖𝒂𝒓𝒂𝒏𝒕𝒆𝒆 = 𝑺𝒉𝒂𝒓𝒆𝒅 𝑷𝒉𝒚𝒔𝒊𝒄𝒂𝒍 𝑪𝑷𝒔 𝒙 𝑳𝑷𝑨𝑹 𝑺𝒉𝒂𝒓𝒆
𝑳𝑷𝑨𝑹 𝑺𝒉𝒂𝒓𝒆 =𝟐𝟖𝟎
𝟏𝟎𝟎𝟎= 𝟎,𝟐𝟖
𝑷𝒓𝒐𝒄𝒆𝒔𝒔𝒐𝒓 𝑮𝒖𝒂𝒓𝒂𝒏𝒕𝒆𝒆 = 𝟑𝟐 𝒙 𝟎,𝟐𝟖 = 𝟖,𝟗𝟔
The processor guarantee ensures the minimum capacity for each LPAR.
PR/SM polarizes the logical processors based on the processor guarantee.
Configuration - LPAR Share e Processor guarantee

Logical processors are classified/biased as Vertical High (VH), Vertical Medium
(VM) or Vertical Low (VL).
The Vertical High processors have 100% of the share of a physical processor,
defining a high affinity between logical and physical.
The Vertical Medium processors share physical processors with other Vertical
Mediums and Vertical Lows.
The Vertical Low processors are only used when there is additional demand and
other partitions do not use their minimum capacity. Out of this situation, these
processors are placed in the "parked" status by z/OS.
Configuration - PR/SM and HiperDispatch Mode

The polarization of the logical processors is based on the Processor Guarantee
1. If the decimal number of the processor guarantee is ≥ 0,5 = the vertical high
processors will be the integer number and there will be 1 vertical medium
Configuration - PR/SM and HiperDispatch Mode
𝐏𝐫𝐨𝐜𝐞𝐬𝐬𝐨𝐫 𝐆𝐮𝐚𝐫𝐚𝐧𝐭𝐞𝐞 = 𝟑𝟐 𝐱 𝟎,𝟐𝟖 = 𝟖,𝟗𝟔 = 𝟖 𝐕𝐇+ 𝟏𝐕𝐌

The polarization of the logical processors is based on the Processor Guarantee.
1. If the decimal number of the processor guarantee is ≥ 0,5 = the vertical high
processors will be the integer number and there will be 1 vertical médium:
2. If the decimal number of the processor guarantee is < 0,5 = the vertical high
processors will be the integer number minus one and there will be 2 vertical
mediums:
Configuration - PR/SM and HiperDispatch Mode
𝐏𝐫𝐨𝐜𝐞𝐬𝐬𝐨𝐫 𝐆𝐮𝐚𝐫𝐚𝐧𝐭𝐞𝐞 = 𝟑𝟐 𝐱 𝟎,𝟐𝟖 = 𝟖,𝟗𝟔 = 𝟖 𝐕𝐇+ 𝟏𝐕𝐌
𝐏𝐫𝐨𝐜𝐞𝐬𝐬𝐨𝐫 𝐆𝐮𝐚𝐫𝐚𝐧𝐭𝐞𝐞 = 𝟑𝟐 𝐱 𝟎,𝟐𝟔 = 𝟖,𝟑𝟐 = 𝟕 𝐕𝐇+ 𝟐𝐕𝐌
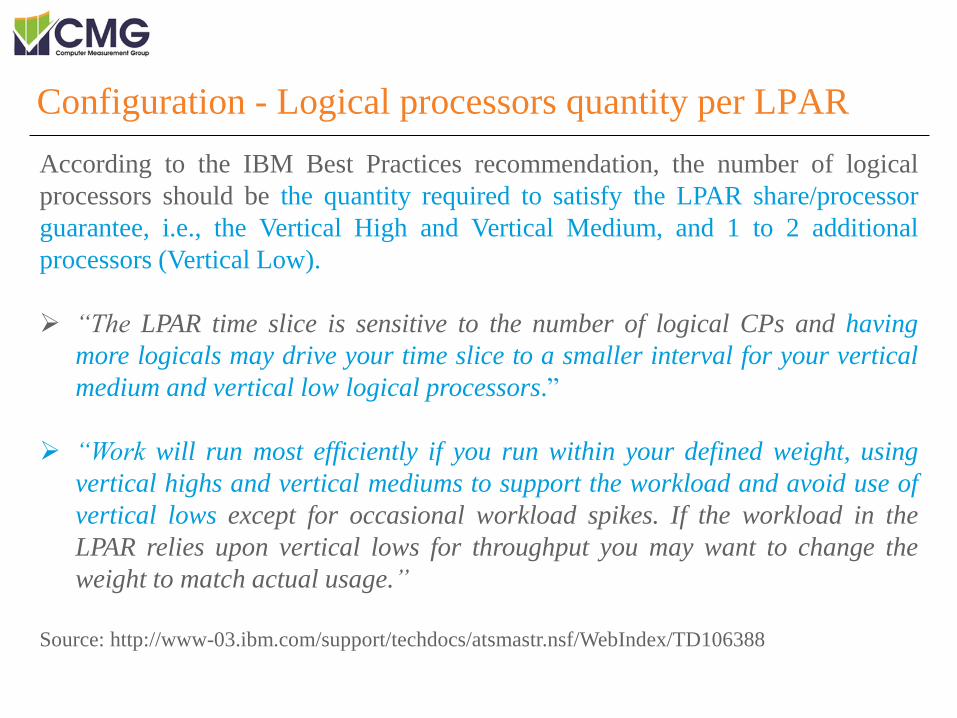
According to the IBM Best Practices recommendation, the number of logical
processors should be the quantity required to satisfy the LPAR share/processor
guarantee, i.e., the Vertical High and Vertical Medium, and 1 to 2 additional
processors (Vertical Low).
“The LPAR time slice is sensitive to the number of logical CPs and having
more logicals may drive your time slice to a smaller interval for your vertical
medium and vertical low logical processors.”
“Work will run most efficiently if you run within your defined weight, using
vertical highs and vertical mediums to support the workload and avoid use of
vertical lows except for occasional workload spikes. If the workload in the
LPAR relies upon vertical lows for throughput you may want to change the
weight to match actual usage.”
Source: http://www-03.ibm.com/support/techdocs/atsmastr.nsf/WebIndex/TD106388
Configuration - Logical processors quantity per LPAR

LPAR Design is a tool to assist in the determination of LPAR configuration.
Inputs
CEC model
weight and logical processors of each LPAR
Outputs
LPAR share and processor guarantee
minimum number of logical processors per partition
polarization of logical processors in HiperDispatch mode
Benefits: identification of improvement opportunities and easy recognition of
configuration mistakes.
https://www-03.ibm.com/systems/z/os/zos/features/wlm/WLM_Further_Info_Tools.html
Configuration - LPAR Design

Configuration - LPAR Design

Configuration - LPAR Design

Configuration - LPAR Design

Configuration - LPAR Design

Configuration - Physical Processors
Quantity of
Physical
Processors
Sum of the physical processors
of the individual CECs before
consolidation
Number of physical
processors of the CEC after
consolidation
Increase of 8% in the number of
physical processors after consolidation
z13 zEC12 z13
Configuration
Setting
CapacityEvaluation
Execute thechange
Performance
Evaluation
LPAR
Design
zPCR
1
2 3
Processing efficiency
CPU MF
WLM Topology Report
Capacity Evaluation
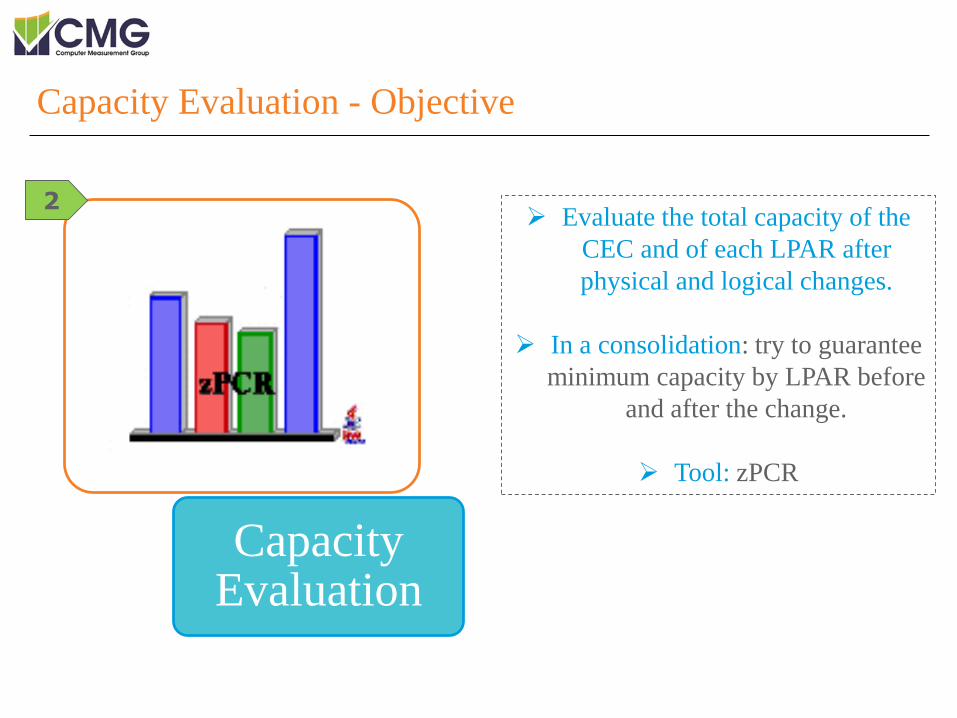
CapacityEvaluation
Evaluate the total capacity of the
CEC and of each LPAR after
physical and logical changes.
In a consolidation: try to guarantee
minimum capacity by LPAR before
and after the change.
Tool: zPCR
Capacity Evaluation - Objective
2

Capacity - LSPR
LSPR = Large Systems Performance Reference
LSPR data represents IBM's assessment of the relative capacity of different
model processors.
The method analyzes a set of benchmark workloads and specific system control
programs in an unrestricted environment.

Capacity - LSPR Workload Categories
The capacity of each processor model is published in 3
different categories. In zPCR, there are 2 additional sub
categories.
Low: low utilization of hierarchical memory.
Average: median utilization of hierarchical memory.
High: high utilization of hierarchical memory.

Capacity - zPCR
zPCR is a tool designed to provide an estimate of capacity for IBM System z
processors.
Inputs
physical and logical configuration of the CEC and LPARs
level of utilization of specialized processors
workload category - low / low-avg / average / avg-high / high
Output
estimation of total CEC capacity
LPAR capacity estimation: minimum (based on processor guarantee) and
maximum (based on logical processors)
Benefits
the estimation is more precise since it is based on the specific configuration and
workload of each LPAR/CEC.
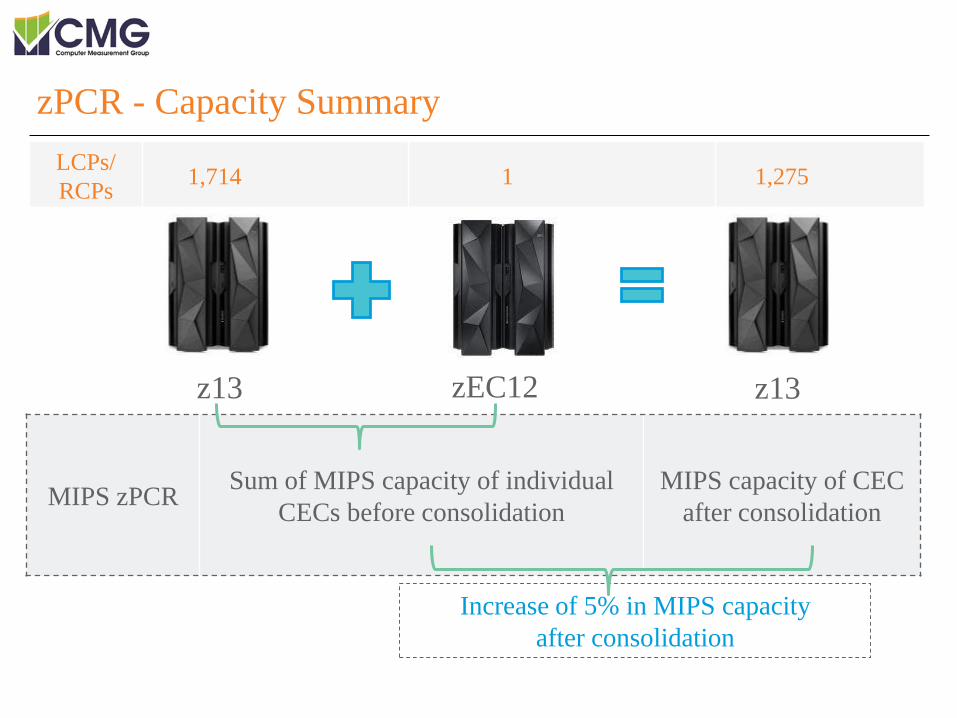
zPCR - Capacity Summary
MIPS zPCRSum of MIPS capacity of individual
CECs before consolidation
MIPS capacity of CEC
after consolidation
Increase of 5% in MIPS capacity
after consolidation
LCPs/
RCPs1,714 1 1,275
z13 zEC12 z13

Configuration
Setting
CapacityEvaluation
Execute thechange
Performance
Evaluation
LPAR
Design
zPCR
1
2 3
Processing efficiency
CPU MF
WLM Topology Report
Performance Evaluation
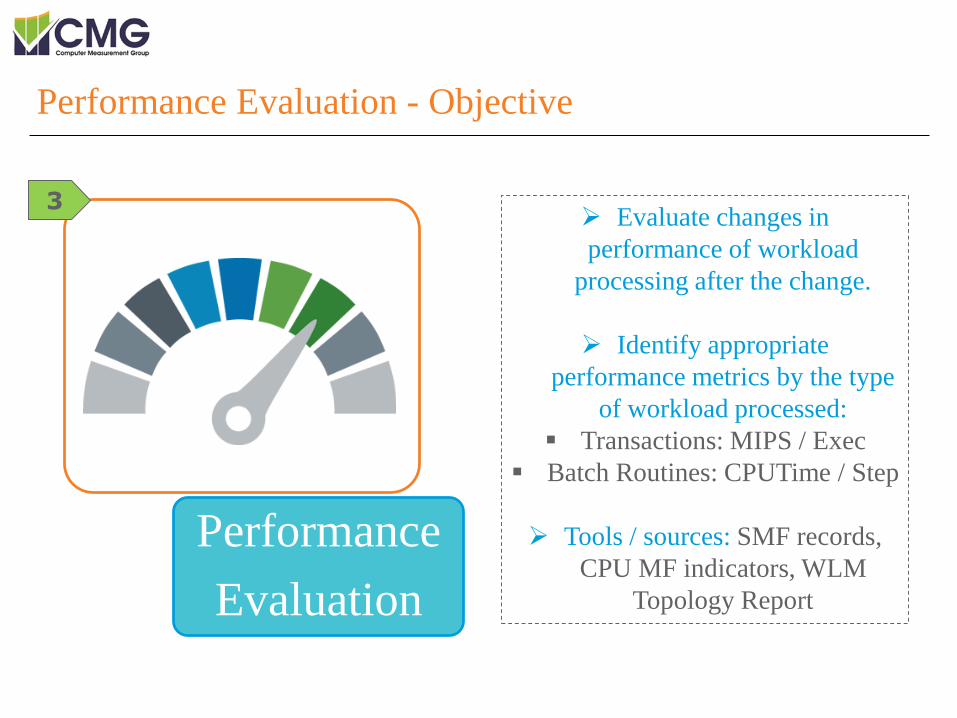
Performance
Evaluation
Evaluate changes in
performance of workload
processing after the change.
Identify appropriate
performance metrics by the type
of workload processed:
Transactions: MIPS / Exec
Batch Routines: CPUTime / Step
Tools / sources: SMF records,
CPU MF indicators, WLM
Topology Report
Performance Evaluation - Objective
3

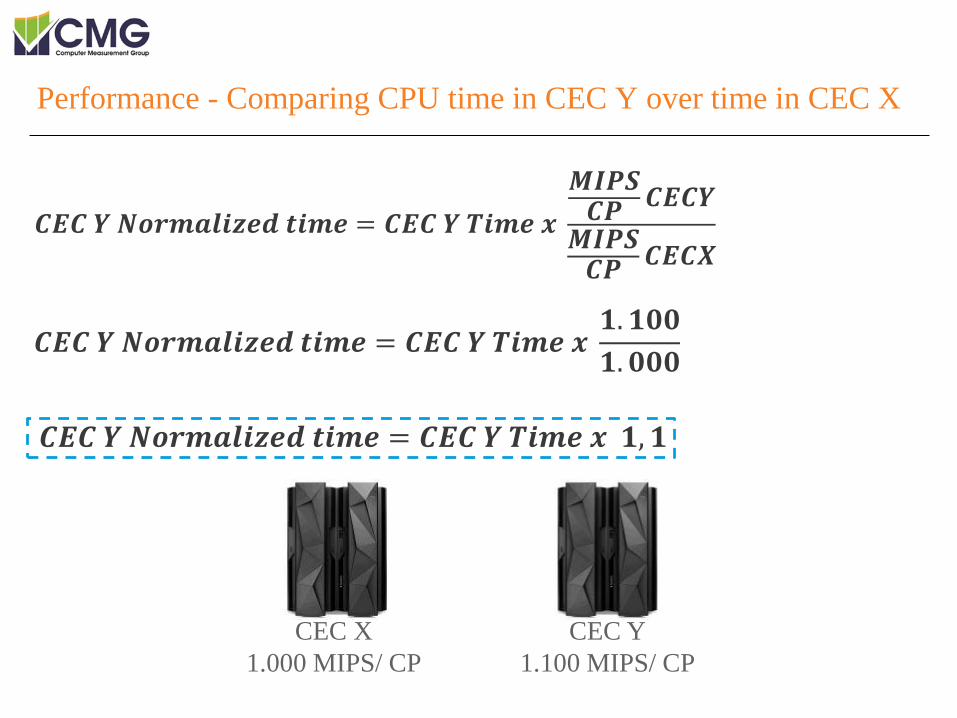
Performance – How to analyze efficiency in different CEC models
How to compare efficiency by analyzing CPU time consumption?
To compare the processing time of a transaction/routine between machines of
different models, it is necessary to normalize the time based on the
capacity/processor of each CEC. Example:
CEC Y presents capacity per processor 10% higher than CEC X
If the transaction/routine consumes the same amount of CPU time on the two
machines, in practice it consumed 10% more MIPS in the CEC Y.
CEC X
1.000 MIPS/ CP
CEC Y
1.100 MIPS/ CP
𝑪 𝑪 𝒐𝒓𝒎𝒂𝒍𝒊 𝒆𝒅 𝒕𝒊𝒎𝒆 𝑪 𝑪 𝒊𝒎𝒆 𝒙
𝑷𝑺𝑪𝑷 𝑪 𝑪
𝑷𝑺𝑪𝑷 𝑪 𝑪
Performance - Comparing CPU time in CEC Y over time in CEC X
CEC X
1.000 MIPS/ CP
CEC Y
1.100 MIPS/ CP
𝑪 𝑪 𝒐𝒓𝒎𝒂𝒍𝒊 𝒆𝒅 𝒕𝒊𝒎𝒆 𝑪 𝑪 𝒊𝒎𝒆 𝒙 𝟏 𝟏𝟎𝟎
𝟏 𝟎𝟎𝟎
𝑪 𝑪 𝒐𝒓𝒎𝒂𝒍𝒊 𝒆𝒅 𝒕𝒊𝒎𝒆 𝑪 𝑪 𝒊𝒎𝒆 𝒙 𝟏 𝟏

Performance - CPU MF Indicators
CPU MF Indicators are generated by the component HIS - Hardware
Instrumentation Service.
CPI = CPU Cycles per Instruction
L1MP = Percentage of times the processor did not find the data / instruction in
the level 1 cache (L1)
RNI - Relative Nest Intensity = reflects the distribution and latency of searches
for data / instruction in shared caches and central memory
RNI and LIMP are used to determine the Workload LSPR Category.
The indicators are written in SMF 113 and supported by the Tivoli Support
Decision (TDS) product.

Performance – WLM Topology Report
SMF 99 (14) collects data from the HiperDispatch topology, and the WLM
Topology Report Tool processes this data and produces reports for analysis.
Inputs
SMF 99 - subtype 14
Output
the association of logical processors with physical processors, indicating in
which books, drawers, nodes and chips they are being dispatched
polarization (VH, VM, VL) and type (GP, zIIP, etc.) of each processor
Benefits
to understand how PR/SM is allocating logical processors in the physicals
to observe topology changes when there are configuration changes
to help explain performance changes

Performance - Processors per Drawer at z13

Session summary
AgendaConclusion
Performance
Evaluation
Introduction
Tools
And
Planning

LPAR 1 - Online Workload
Results
It was increased the "Processor Guarantee" to provide 1 additional Vertical
High logical processor.
It was identified an increment of the Minimum Capacity by zPCR.
It was observed an average improvement of 14% in the consumption of MIPS
by execution of the transactions during the online period.
It was noticed a discreet increase in L1MP, CPI and RNI indicators.
No change in the Workload Category was observed.
The more shared hierarchical memory resulted in an increase of RNI.
LPARProcessor
Guarantee
Minimun
Capacity
zPCR
Efficiency CPI L1MP RNIWorkload
Category
LPAR1 +1,01 +7,7% - 14% +8,7% +6,3% +11,4% No change

LPAR 2 - Batch Workload
Results
It was slightly increased the "Processor Guarantee".
No change in zPCR Minimum Capacity was observed.
It was identified an improvement in normalized CPU consumption per routine
step.
A discreet increase in L1MP, CPI indicators was observed, as well as an
improvement in RNI.
No change in the Workload Category was observed.
LPARProcessor
Guarantee
Minimun
Capacity
zPCR
Efficiency CPI L1MP RNIWorkload
Category
LPAR2 +0,35 +0,7% -5,9% +0,7% +2,5% -8,5% No change

Multiplier Factor L3P L4LP L4RP MEMP RNI
2,3 0,40 1,60 3,50 7,50 -
Change after
consolidation-0,00 +0,01 +0,02 -0,12 -0,10
LPAR 2 - Batch Workload
z13 RNI formula
(v3.33 do CP3KEXTR – 01/03/17)
RNI
LPAR 2 was reallocated to Drawer 2 which had a lower cache utilization level
(less physical processors allocated in the drawer).
It was observed a reduction of searches in the central memory (worst offender
of the RNI), and an increase of searches in the cache level L4. This resulted in
the improvement of RNI.

LPAR 3 - Batch Workload
Results
The Processor Guarantee was increased to provide 1 logical processor Vertical
High.
It was identified an increment of the Minimum Capacity by zPCR.
It was observed an improvement of 16% in normalized CPU consumption by
routine step.
It was identified a discreet increase in L1MP, CPI indicators, as well as an
improvement of RNI.
No change in the Workload Category was observed.
LPARProcessor
Guarantee
Minimun
Capacity
zPCR
Efficiency CPI L1MP RNIWorkload
Category
LPAR3 +0,89 +70% -16% +6,2% +16,6% -4,1% No change

Summary results table
LPARProcessor
Guarantee
Minimun
Capacity
zPCR
Efficiency CPI L1MP RNIWorkload
Category
LPAR1 +1,01 +7,7% - 14% +8,7% +6,3% +11,4% No change
LPAR2 +0,35 +0,7% -5,9% +0,7% +2,5% -8,5% No change
LPAR3 +0,89 +70% -16% +6,2% +16,6% -4,1% No change

Session summary
AgendaConclusion
Performance
Evaluation
Introduction
Tools
And
Planning

Recommendations / Best Practices
Always define the configuration using the LPAR Design tool, aiming to optimize
the quantity of Vertical High processors.
Use zPCR tool to perform capacity analysis, and as far as possible, maximize the
total capacity of the CEC and the minimum capacity of each LPAR.
Always normalize CPU time consumption to analyze performance between
different CEC models.
Monitor significant modifications of CPU MF indicators. Try to Avoid cross-
drawer as much as possible.
Each workload can respond differently to configuration changes.
Special attention to LPAR that is alone in the CEC and is consolidated in another
CEC with other LPARs.

Conclusions
The process of CEC consolidation can improve the performance of workload
processing due to the greater quantity of physical processors for the same amount
of MIPS LSPR of the CEC after consolidation.
It was observed performance improvement with increase of Vertical High
processors and Minimum Capacity by zPCR.
A worsening of CPU MF indicators will not always result in deterioration of
MIPS consumption efficiency.
It is possible to reduce the number of CECs of a Sysplex through consolidation
without presenting performance losses.

Session reference links
Planning Considerations for HiperDispatch Mode Version 2; Steve Grabarits, Gary
King, Bernie Pierce; 2011
z/OS: Planning Considerations for HiperDispatch Mode; Kathy Walsh, Steve
Grabarits; 2011
Configuring LPARs for Performance; Kathy Walsh; 2013
Processor Migration Capacity Analysis in a Production Environment; Katy Walsh;
2015
IBM z13 Overview and Related Tidbits; Tim Raley; 2015
ITSO – z System Hardware Workshop; BIRD; 2015.
The Relatively New LSPR and The IBM z13 Performance Brief; Gary King; 2015
z13 Performance Large System Update; Matthias Bangert; 2015
z13 HiperDispatch - New MCL Bundle Changes Vertical CP Assignment for Certain
LPAR Configurations; Bradley Snyder; 2016
Number of Logical CPs Defined for an LPAR; Kathy Walsh; 2016
Large Systems Performance Reference - Document Number SC28-1187-19; 2016
zPCR User’s Guide; Version 9.0e, 2017

Special Thanks
Celso Yano Ishii - ITAU UNIBANCO
Edson Issamu Yabusaki - ITAU UNIBANCO
Carolina Souza Joaquim - IBM

THANK YOU!!!
Contacts
https://www.linkedin.com/in/gustavo-fernandes-araujo-4179555a


