Planning for electric vehicles Michael A P Taylor, Peter Pudney, Rocco Zito, Nicholas Holyoak, Amie Albrecht and Raluca Raicu 12 th WCTR, July 11-15, 2010 – Lisbon, Portugal 1 PLANNING FOR ELECTRIC VEHICLES – CAN WE MATCH ENVIRONMENTAL REQUIREMENTS, TECHNOLOGY AND TRAVEL DEMAND? Michael A P Taylor, Peter Pudney, Rocco Zito, Nicholas Holyoak, Amie Albrecht and Raluca Raicu Institute for Sustainable Systems and Technologies, University of South Australia, Adelaide, Australia ABSTRACT This paper discusses the feasibility for adopting electric vehicles (EV) for urban transport, replacing conventional private vehicles. Considerations need to be made of the potential greenhouse gas benefits of EV, the ability for EV to be used as direct replacements for present day vehicles, and the infrastructure and power supply implications of a wholesale shift to electric powered private transport. The paper presents the results of a feasibility study conducted for two major Australian cities, Sydney and Adelaide. The overall conclusion is that introduction of current technology electric vehicles could impact significantly on daily journeys made within a 100 km charge range. The case studies show that the large majority of motorised journeys are accomplished within this range, an observation expected to provide a similar result for other Australian metropolitan areas – and perhaps other cities as well. In addition, it must be emphasised that for a maximum benefit from electric vehicles, electricity should be acquired from renewable sources. The study findings should have implications for the adoption of EV technology in other cities around the world INTRODUCTION The Garnaut report on the impacts of climate change on the Australian economy was released in September 2008. A major recommendation in the report concerned the need to limit CO 2 in the atmosphere to no more than 450 ppm. Per capita emissions trajectories necessary to achieve this are shown in Figure 1, which is taken from Garnaut (2008). The implication of this graph is that, for Australia, per capita CO 2 emissions need to be reduced to 60 per cent of 2000 levels by 2020, and to five per cent of 2000 levels by 2050. Indeed, the trajectories continue to decrease beyond 2050. Transport accounts for about 14 per cent of CO 2 emissions in Australia, and about half of this is due to private cars and light commercial
Transcript
Planning for electric vehicles Michael A P Taylor, Peter Pudney, Rocco Zito, Nicholas Holyoak, Amie Albrecht and Raluca Raicu
12th WCTR, July 11-15, 2010 – Lisbon, Portugal
1
PLANNING FOR ELECTRIC VEHICLES – CAN WE MATCH ENVIRONMENTAL
REQUIREMENTS, TECHNOLOGY AND TRAVEL DEMAND?
Michael A P Taylor, Peter Pudney, Rocco Zito, Nicholas Holyoak, Amie Albrecht and Raluca Raicu
Institute for Sustainable Systems and Technologies, University of South Australia, Adelaide, Australia
ABSTRACT
This paper discusses the feasibility for adopting electric vehicles (EV) for urban transport,
replacing conventional private vehicles. Considerations need to be made of the potential
greenhouse gas benefits of EV, the ability for EV to be used as direct replacements for
present day vehicles, and the infrastructure and power supply implications of a wholesale
shift to electric powered private transport. The paper presents the results of a feasibility study
conducted for two major Australian cities, Sydney and Adelaide. The overall conclusion is
that introduction of current technology electric vehicles could impact significantly on daily
journeys made within a 100 km charge range. The case studies show that the large majority
of motorised journeys are accomplished within this range, an observation expected to
provide a similar result for other Australian metropolitan areas – and perhaps other cities as
well. In addition, it must be emphasised that for a maximum benefit from electric vehicles,
electricity should be acquired from renewable sources. The study findings should have
implications for the adoption of EV technology in other cities around the world
INTRODUCTION
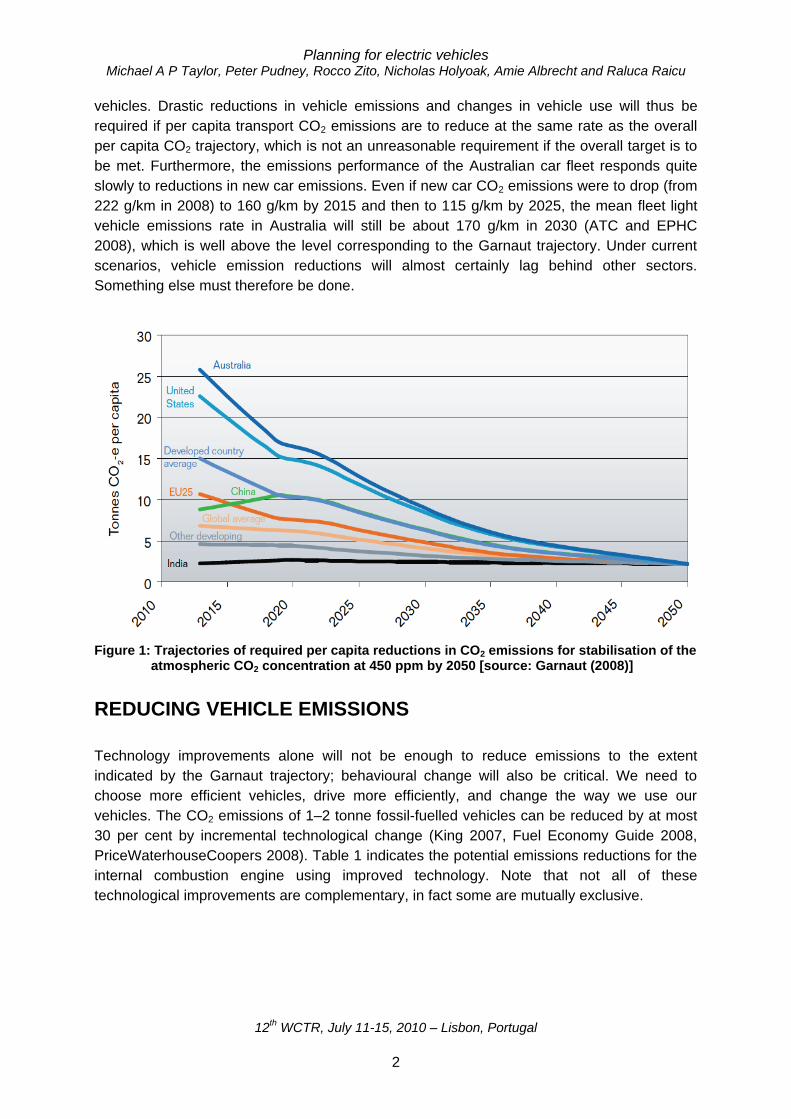
The Garnaut report on the impacts of climate change on the Australian economy was
released in September 2008. A major recommendation in the report concerned the need to
limit CO2 in the atmosphere to no more than 450 ppm. Per capita emissions trajectories
necessary to achieve this are shown in Figure 1, which is taken from Garnaut (2008). The
implication of this graph is that, for Australia, per capita CO2 emissions need to be reduced to
60 per cent of 2000 levels by 2020, and to five per cent of 2000 levels by 2050. Indeed, the
trajectories continue to decrease beyond 2050. Transport accounts for about 14 per cent of
CO2 emissions in Australia, and about half of this is due to private cars and light commercial
Planning for electric vehicles Michael A P Taylor, Peter Pudney, Rocco Zito, Nicholas Holyoak, Amie Albrecht and Raluca Raicu
12th WCTR, July 11-15, 2010 – Lisbon, Portugal
2
vehicles. Drastic reductions in vehicle emissions and changes in vehicle use will thus be
required if per capita transport CO2 emissions are to reduce at the same rate as the overall
per capita CO2 trajectory, which is not an unreasonable requirement if the overall target is to
be met. Furthermore, the emissions performance of the Australian car fleet responds quite
slowly to reductions in new car emissions. Even if new car CO2 emissions were to drop (from
222 g/km in 2008) to 160 g/km by 2015 and then to 115 g/km by 2025, the mean fleet light
vehicle emissions rate in Australia will still be about 170 g/km in 2030 (ATC and EPHC
2008), which is well above the level corresponding to the Garnaut trajectory. Under current
scenarios, vehicle emission reductions will almost certainly lag behind other sectors.
Something else must therefore be done.
Figure 1: Trajectories of required per capita reductions in CO2 emissions for stabilisation of the
atmospheric CO2 concentration at 450 ppm by 2050 [source: Garnaut (2008)]
REDUCING VEHICLE EMISSIONS
Technology improvements alone will not be enough to reduce emissions to the extent
indicated by the Garnaut trajectory; behavioural change will also be critical. We need to
choose more efficient vehicles, drive more efficiently, and change the way we use our
vehicles. The CO2 emissions of 1–2 tonne fossil-fuelled vehicles can be reduced by at most
30 per cent by incremental technological change (King 2007, Fuel Economy Guide 2008,
PriceWaterhouseCoopers 2008). Table 1 indicates the potential emissions reductions for the
internal combustion engine using improved technology. Note that not all of these
technological improvements are complementary, in fact some are mutually exclusive.
Planning for electric vehicles Michael A P Taylor, Peter Pudney, Rocco Zito, Nicholas Holyoak, Amie Albrecht and Raluca Raicu
12th WCTR, July 11-15, 2010 – Lisbon, Portugal
3
Table 1: Potential reductions in CO2 emissions for liquid fossil fuel vehicles using improved technologies
Engine stop/start without regenerative braking 3-4
Incremental technology improvement is already available. For instance, King (2007) found
that, for the UK, choosing the best-in-class vehicle in any market segment could reduce CO2
emissions by an average of 25 per cent. A similar analysis for Australia, using data from
Greenwheels (2008), indicates that the best-in-class CO2 emissions are 20-50 per cent lower
than the 222 g/km recommended target for new vehicles in 2010.
In addition, vehicle size and mass have a significant effect on vehicle energy use and CO2
emissions. Figure 2 shows the relationship between vehicle mass and CO2 emissions for
new cars currently available in Australia. The CO2 emissions data is from the Green Vehicle
Guide (2008). Vehicle masses were obtained from manufacturer websites by Valenzisi and
Dawson (2008). In the graph, colour is used to indicate fuel type: green is petrol/electric
hybrid, purple is diesel, red is petrol and orange is LPG. Trend lines are shown for
petrol/electric hybrid, diesel and petrol vehicles (there is insufficient data to draw a trend line
for LPG). The trend lines are:
Hybrid: mC OE 105.06.26)( 2
Diesel: mC OE 122.078.2)( 2
Petrol: mCOE 152.061.2)( 2
where E(CO2) (g/km) is the CO2 emissions rate per unit distance and m is the vehicle mass
(kg). The graph also illustrates the (sometimes substantial) variations in emissions
performance between different vehicles of similar mass and fuel type.
Planning for electric vehicles Michael A P Taylor, Peter Pudney, Rocco Zito, Nicholas Holyoak, Amie Albrecht and Raluca Raicu
12th WCTR, July 11-15, 2010 – Lisbon, Portugal
4
Figure 2: CO2 emission rates and vehicle mass for new vehicles in Australia, 2008 [green is
petrol/electric hybrid, purple is diesel, red is petrol and orange is LPG]
We need to move quickly towards low-emission and zero-emission vehicles. For city driving
– up to about 150 km per day – electric vehicles may be ideal because they can be
recharged using renewable energy with almost no emissions. Long-distance travel, and in
particular freight transport, will still require the high energy density and fast refuelling
capability of liquid fuels, and perhaps gaseous fuels1. Plug-in hybrid vehicles, which use
electricity for short journeys and liquid fuels for long journeys, provide a good compromise for
vehicles that can be used for a mix of long and short journeys.
In Australia, about half of all new vehicles are sold to fleet operators. Encouraging fleet
owners to purchase low-emission vehicles could have a significant impact on vehicle
emissions2. Irrespective of the technologies, we need vehicle emissions targets that will
encourage the large reductions in CO2 emissions necessary for sustainability in the transport
sector.
ELECTRIC VEHICLES
One technology that can contribute to attaining sustainable transport is that of electric
vehicles, including electric-assisted bicycles, electric scooters and motorcycles, and electric
1 The 2008 Academy of Technological Sciences and Engineering (ATSE) Symposium on Alternative Transport
Fuels for Australia concluded that gaseous fuels and biofuels derived from non-food sources were going to play
an increasing role in long distance transport. 2 One issue here is the current high cost of electric vehicles. At present an electric vehicle is likely to cost about
twice as much as an equivalent conventionally fuelled vehicle. In the longer term this price differential should
reduce as production levels for electric vehicles increase. Before then, however, incentive schemes such as the
purchase price subsidy scheme operating in Japan, with support from both the national government and
prefectures, may need to be considered. This is an area for ongoing monitoring and further research
Planning for electric vehicles Michael A P Taylor, Peter Pudney, Rocco Zito, Nicholas Holyoak, Amie Albrecht and Raluca Raicu
12th WCTR, July 11-15, 2010 – Lisbon, Portugal
5
passenger vehicles. The main advantage of electric vehicles is that they can be recharged
using electricity generated from clean, renewable energy sources and at a lower
environmental and monetary cost than a petrol or diesel car. Electric vehicles are not a new
idea; many of the first mass-produced cars were electric. The main disadvantage of electric
vehicles is that they have limited range and long recharge times compared to fossil-fuelled
vehicles, and so cannot match the versatility of conventional cars. However, recent advances
in lithium ion battery technologies, as well as concerns about emissions from conventional
vehicles, indicate that electric vehicles are becoming viable again, particularly for the short
commutes that make up a large part of the trips made by conventional cars. Plug-in hybrid
technologies using energy from the electricity grid for short trips, supplemented by energy
from petrol or diesel for longer trips are a reasonable compromise for vehicles that must be
used for a combination of long and short trips. However, they are more complicated than
comparable diesel or pure electric vehicles, and will have higher emissions than diesel
vehicles on long trips (because they are carrying a heavy battery that is not being used), and
higher emissions than a pure electric vehicle on short trips (because they are carrying a
heavy motor that is not being used).
Gaines et al (2007) calculated total life-cycle emissions for different energy pathways used to
power a midsized car for urban and suburban driving. The emissions include those
associated with vehicle production, use and disposal, and include one battery change for
vehicles using batteries. The drive systems considered were petrol, diesel, petrol-electric
hybrid, petrol-electric plug-in hybrid, and hydrogen fuel cell. The energy pathways considered
were:
1. refined oil, from various sources, used to provide petrol for conventional and hybrid cars,
diesel for conventional cars, and to generate electricity to recharge plug-in hybrids
2. natural gas, used to provide compressed natural gas and Fischer-Tropsch diesel for use in
conventional cars, to generate electricity to recharge plug-in hybrids, and to generate
hydrogen for fuel cell vehicles
3. coal, used to produce Fischer-Tropsch diesel for conventional cars, and to generate electricity
for plug-in hybrids
4. farmed trees, used to generate ethanol (E85) for use in conventional cars and plug-in hybrids,
and to generate electricity for recharging plug-in hybrids
5. wind and solar, to generate electricity for plug-in hybrids and hydrogen for fuel cell vehicles.
The most efficient energy pathway for each fuel is shown in Table 2 (Gaines et al, 2007).
Note that the last row in this table is the emissions from a standard petrol-engine car, for
comparison. Gaines et al (2007) also gave emissions from other pathways. The life-cycle
emissions from a plug-in hybrid recharged from a new standard coal-fired power station was
258 g/km, which is about the same as for a petrol car.
Planning for electric vehicles Michael A P Taylor, Peter Pudney, Rocco Zito, Nicholas Holyoak, Amie Albrecht and Raluca Raicu
12th WCTR, July 11-15, 2010 – Lisbon, Portugal
6
Table 2: Most efficient passenger car energy pathways for alternative fuel sources [source: Gaines et al (2007)]
Lifecycle greenhouse
gas emissions rate
(g/km)
Energy pathway
40 Wind and solar electricity generation, plug-in hybrid
40 Combined cycle electricity generation from farmed trees, plug-in hybrid
142 Natural gas combined cycle electricity generation, plug-in hybrid