Vanguard Research June 2018 Planning for health care costs in retirement Vanguard engaged Mercer Health and Benefits to develop a new model to forecast health care costs for U.S. retirees. Vanguard believes that retirement planning frameworks should be adapted as follows: ■ Planning for annual health care insurance premiums and out-of-pocket expenses at retirement should be distinct from planning for long-term care expenses. ■ Some research on health care costs in retirement estimates these expenses as a lifetime lump sum. We believe that a better planning framework considers these costs as annual expenses personalized to an individual’s health status, coverage choices, retirement age, and loss of any employer subsidies. For a typical 65-year-old woman, the Mercer-Vanguard model predicts an annual health care expense of $5,200 in 2018. ■ During their working years, some individuals should save at higher rates to account for potential future incremental health care spending. Workers with generous employer health care benefits that may not be offered in retirement and those at higher risk of chronic conditions because of their family history or current health status should target higher replacement ratios. ■ Long-term care costs represent a separate planning challenge given the wide distribution of potential outcomes. Half of individuals will incur no long-term care costs—but there is a small but meaningful risk that costly care will be required for multiple years. Mercer Health and Benefits: Derek Guyton, FSA, MAAA, FCA; Jennifer Leming, FSA, MAAA Vanguard: Stephen M. Weber, CFP ® ; Jacklin Youssef, CFP ® , MST; Jean A. Young, CPA, MST
Transcript
Vanguard Research June 2018
Planning for health care costs in retirement
Vanguard engaged Mercer Health and Benefits to develop a new model to forecast health care costs for U.S. retirees. Vanguard believes that retirement planning frameworks should be adapted as follows:
■ Planning for annual health care insurance premiums and out-of-pocket expenses at retirement should be distinct from planning for long-term care expenses.
■ Some research on health care costs in retirement estimates these expenses as a lifetime lump sum. We believe that a better planning framework considers these costs as annual expenses personalized to an individual’s health status, coverage choices, retirement age, and loss of any employer subsidies. For a typical 65-year-old woman, the Mercer-Vanguard model predicts an annual health care expense of $5,200 in 2018.
■ During their working years, some individuals should save at higher rates to account for potential future incremental health care spending. Workers with generous employer health care benefits that may not be offered in retirement and those at higher risk of chronic conditions because of their family history or current health status should target higher replacement ratios.
■ Long-term care costs represent a separate planning challenge given the wide distribution of potential outcomes. Half of individuals will incur no long-term care costs—but there is a small but meaningful risk that costly care will be required for multiple years.
Mercer Health and Benefits: Derek Guyton, FSA, MAAA, FCA; Jennifer Leming, FSA, MAAAVanguard: Stephen M. Weber, CFP ®; Jacklin Youssef, CFP ®, MST; Jean A. Young, CPA, MST
1 PwC Employee Financial Wellness Survey, 2016. Responses are based on the views of 1,600 full-time employed adults representative of the U.S. population by age and gender. Respondents could choose up to two answers to this question.
2 Fronstin, Paul, and Dallas Salisbury, 2003. Retiree Health Benefits: Savings Needed to Fund Health Care in Retirement, EBRI Issue Brief No. 254, Employee Benefit Research Institute; available at www.ebri.org/pdf/briefspdf/0203ib.pdf.
3 Fronstin, Paul, and Jack VanDerhei, 2017. Savings Medicare Beneficiaries Need for Health Expenses: Some Couples Could Need as Much as $350,000, EBRI Notes 38(1), Employee Benefit Research Institute; available at www.ebri.org/publications/notes/.
4 Munnell, Alicia H., Mauricio Soto, Anthony Webb, Francesca Golub-Sass, and Dan Muldoon, February 2008. Health Care Costs Drive Up the National Retirement Risk Index. Center for Retirement Research at Boston College, No. 8-3; available at crr.bc.edu/category/briefs/.
5 Webb, Anthony, and Natalia Zhivan, March 2010. What Is the Distribution of Lifetime Health Care Costs From Age 65? Center for Retirement Research at Boston College, No. 10-4; available at crr.bc.edu/category/briefs/.
6 U.S. Department of Health and Human Services, Assistant Secretary for Planning and Evaluation (ASPE) Research Brief, revised February 2016. Long-Term Services and Supports for Older Americans: Risks and Financing, Table 2; available at aspe.hhs.gov/reports. The results of the brief are derived from analyses using the Urban Institute’s DYNASIM3, a dynamic microsimulation model designed to analyze retirement and aging issues over time.
7 Genworth 2017 Cost of Care Survey, conducted by CareScout®, May–June 2017.8 For a description of the model, see the Appendix on page 22. Mercer’s participation should not be inferred to indicate that it believes that other points of view on this
topic are invalid.2
Health care costs in retirement
Academics and industry experts have placed a spotlight on health care costs that U.S. households can expect to incur during retirement. Most Americans understand that annual health care costs have been growing faster than inflation for some time; workers are attuned to this phenomenon as they experience rising premiums and out-of-pocket (OOP) costs within their current employer benefits. At the same time, they may be cognizant that they will likely consume more health care services each year as they age. Pre-retirees and retirees are concerned about how health care costs will affect their retirement and how they will pay for them. Thirty-eight percent of baby boomers surveyed listed health care costs as a top fear about retirement; this was higher than fears of running out of money.1
As presented by leading experts, the numbers are alarming. The Employee Benefit Research Institute (EBRI), since at least 2003, has been quantifying the amount individuals will need to have saved to cover total health care premiums and OOP health care costs throughout retirement.2 The EBRI analysis has evolved over the years. This analysis has focused on the figure for a 65-year-old couple desiring a 90 percent chance of having enough savings to cover total health care expenses in retirement. That figure is a daunting $265,000.3 The Boston College Center for Retirement
Research (BC CRR) has also modeled, since at least 2008, the amount individuals will need to have saved to cover premiums and OOP health care costs throughout retirement.4 The most recent BC CRR analysis estimates that a typical 65-year-old couple will spend $197,000 to cover total health care expenses in retirement.5
The EBRI and BC CRR estimates do not factor in any long-term care expenses. About half of individuals will incur paid long-term care.6 Long-term care includes adult day care, homemaker services, home health aides, assisted living facilities, and nursing home care. Long-term care costs are justifiably a primary worry for many U.S. retirees given that the national average for private room nursing home care exceeds $8,000 per month.7
To better understand the financial planning implications of annual health care costs and long-term care expenses, Vanguard has partnered with Mercer Health and Benefits to develop a proprietary model to forecast the range of health care costs for both pre-retirees and retirees.8 For a typical 65-year-old woman, the Mercer-Vanguard model predicts an annual health care expense of $5,200 in 2018 if purchasing a Medicare Supplemental Plan F and a standard prescription drug plan. Based on our analysis, we propose several important changes to the way that health care costs are typically discussed and modeled:
1. Health care cost factors. Understanding how an individual’s annual health care costs will change at retirement requires understanding the impact of key personal attributes, including health status, coverage choices, geography, income, and loss of employer subsidies. Routine health care costs include insurance premiums and OOP costs, but not expenses associated with paid long-term care.
2. Replacement ratios. Replacement ratios—the percentage of pre-tax income at retirement that individuals will need to maintain their current lifestyle—are commonly used to provide estimates of retirement spending needs, which in turn are used to estimate required saving rates. For some workers, accounting for changes in health care costs will result in higher replacement ratios than many traditional defaults, especially if their employer offers generous health care benefits.
3. Annual cost framing. The expression of annual health care costs as a lump sum is not a useful framework for discussing retiree health care expenses. Instead, individuals should focus on annual costs, especially the incremental annual changes they will experience at retirement and at Medicare enrollment.
4. Substitution effects. Health care costs are likely to increase during retirement because of both increased health care consumption and faster-than-inflation growth. Planning frameworks need to balance this growth against substitution effects that occur when retirees spend less in other consumption categories as they age.
5. Long-term care. Long-term care costs represent a separate planning challenge. They should be explicitly addressed as part of the retirement planning process. Individuals need to understand that there is a low but real probability they will experience a high-cost long-term care event.
In this paper, we begin by discussing the personal factors that influence annual health care costs. We then discuss how these factors may require some individuals to plan for higher replacement ratios. Next, we discuss how framing annual health care costs as an incremental change, at retirement and at Medicare eligibility, is a more practical approach than focusing on daunting lump-sum estimates. Then we address how retiree spending substitution effects counteract the growth in health care costs after retirement. Finally, we discuss planning for potential long-term care expenses.
Health care cost factors
Retiree health care costs vary from person to person. Financial plans should factor in the personal characteristics of each retirement investor. Factors that can significantly affect costs include:
• Health status and risk.
• Medicare coverage choice.
• Retirement age.
• Employer subsidies.
• Geography.
• Medicare surcharges.
In the following sections, we discuss each factor individually.
9 Chronic Conditions Among Medicare Beneficiaries, Chartbook, 2012 Edition. Baltimore, Md.: Centers for Medicare and Medicaid Services.4
Health status and risk
One of the largest factors in understanding potential costs is the volume of health care services a given person will consume. Individuals with chronic medical conditions consume the majority of care.9 In the Mercer-Vanguard health care cost model, 12 conditions were chosen, based on a mix of prevalence and cost from chronic-condition data provided by the Centers for Medicare and Medicaid Services (CMS), to use in establishing a retiree’s likely health status. Our model considers both the individual’s medical history and parental medical history in establishing the retiree’s likely health status. The conditions used in our model are:
• Alzheimer’s disease, senile dementia, and related disorders.
• Chronic obstructive pulmonary disease.
• Cancer (colorectal, breast, prostate, lung).
• Asthma.
• Osteoporosis.
Certain health conditions have more impact on future health care costs, and most chronic conditions will have manifested symptoms by one’s 50s or 60s. In addition, one’s smoker status and number of doctor visits were factors chosen to classify risk.
The Mercer-Vanguard health care cost model divides people into three risk categories: high, medium, and low. High-risk individuals are assumed to incur health care costs associated with those in the top quartile. Typically, high-risk individuals in our model are smokers, visit the doctor frequently, or have two or more of the chronic conditions listed above. Low-risk individuals are generally free of chronic conditions and incur costs associated with those in the bottom quartile. Medium-risk individuals incur costs associated with the middle two quartiles.
An individual using only traditional Medicare with Part D prescription drug coverage incurs the widest range of potential annual health care costs in a given year. This is why nine in ten individuals choose some form of additional coverage. Throughout this paper, unless otherwise noted, we choose to model a woman because women have slightly higher lifetime costs on average. However, the gender difference in those costs is less than 2 percent.
Our model suggests that a medium-risk 65-year-old woman living in a median-cost area, using only traditional Medicare with Part D, could expect to pay between about $3,200 and $6,600 for premiums and out-of-pocket medical, dental, and vision costs in 2018 (Figure 1). At the median, she could expect to pay about $3,900. However, that same woman assuming a low-risk profile could expect median annual costs about 15% lower than our medium-risk baseline, with little variation from year to year if low risk was maintained. On the other hand, a high-risk individual would expect costs to be over 90% higher, with the possibility that expenses in some years would exceed five times the medium-risk baseline.
10 Mercer’s 2016 National Survey of Employer-Sponsored Health Plans and Frank McArdle, Tricia Neuman, and Jennifer Huang, Retiree Health Benefits at the Crossroads—Overview of Health Benefits for Pre-65 and Medicare-Eligible Retirees, April 2014. The Henry J. Kaiser Family Foundation; available at www.kff.org/medicare.
11 Plan F is the most comprehensive supplemental plan and generally covers both deductibles and coinsurance payments for Parts A and B; Part D prescription drug coverage is purchased separately.
12 Plan N covers the Part A deductible as well as the Part A and B coinsurance amounts. The Part B deductible is not covered, but most plans require a copay instead. Part D coverage is purchased separately. 5
Medicare coverage choice
Coverage decisions made by Medicare-eligible retirees also affect annual health care costs. A retiree faces many coverage options, including these common choices:10
• Traditional Medicare with prescription drug coverage only (Parts A, B, and D), used by 12% of Medicare enrollees.
• Traditional Medicare with prescription drug coverage with a supplemental Medigap plan, used by 21% of enrollees.11,12
• Medicare Advantage Plan with prescription drug coverage (Parts C and D), used by 32% of enrollees.
• Traditional Medicare with employer-sponsored coverage, used by 35% of enrollees.
These coverages differ in cost and comprehensiveness, and retirees need to make trade-off decisions when selecting a plan. Total health care costs under different Medicare coverages may vary based on health status (Figure 2, on page 6). Some individuals may consider paying higher premiums to reduce the risk of extreme or less predictable out-of-pocket costs. Others, especially those who expect to remain healthy, may experience lower costs in most years by opting for a less extensive supplemental policy, or none at all. The trade-off is that they may experience years with much higher costs. Waiting until supplemental coverage is needed may not be advisable, as many carriers will not provide the option to buy that coverage after an individual becomes sick—outside of the initial Medicare enrollment period—or will charge higher rates.
Figure 1. Median annual health care costs vary widely by individual health risk category
Source: Mercer-Vanguard health care cost model, 2018.
An
nu
al h
ealt
h c
are
cost
s
0
$25,000
$3,000 $3,200
Median: $7,600
Median: $3,400
$3,200
Median: $3,900
$3,500
$3,800$4,900
$13,300
Low risk Medium risk High risk
$21,000
$4,300
$6,600
$3,400
$4,600
Total health care costs by risk for a 65-year-old woman under traditional Medicare, 2018
13 Jacobson, Gretchen, Anthony Damico, Tricia Neuman, and Marsha Gold. Medicare Advantage 2017 Spotlight: Enrollment Market Update, June 2017. The Henry J. Kaiser Family Foundation; available at www.kff.org/medicare.
14 Final 2017 Open Enrollment Period (OEP) State-Level Public Use File, Centers for Medicare and Medicaid Services, www.CMS.gov.15 Health insurance subsidies vary based on income and family size. Depending on income as expressed in ranges from 100% to 400% of the poverty threshold,
the subsidies limit the cost of insurance to between 2% and 10% of income for the second-lowest-cost Silver plan. For an overview of health insurance subsidies, see Explaining Health Care Reform: Questions About Health Insurance Subsidies, November 2017. The Henry J. Kaiser Family Foundation; available at www.kff.org/health-reform/.6
A cost-effective choice, used by about one-third of Medicare recipients, is a Medicare Advantage plan.13 These are private plans that are approved by the government and can vary greatly in their coverage details, provider networks, and costs. They must cover everything that original Medicare does and may also provide additional coverage, including dental and vision. Individuals who purchase a Medicare Advantage plan cannot buy a supplemental plan, but Medicare Advantage plans may have a yearly limit on out-of-pocket costs that varies by plan. Some plans may have an additional premium above the Part B premium, but many do not. Medicare Advantage plans typically produce lower out-of-pocket costs for enrollees, but in certain instances they may also be more costly. However, the choice of health care provider may be restricted to a particular network.
Retirement age
The absence or presence of subsidized coverage for retirees under age 65 can significantly affect retirement planning. Those who retire before 65 need to have a strategy to bridge their health care coverage between retirement and Medicare.
Individuals without access to employer retiree health care benefits will probably use private insurance. Most people now get this type of coverage on public marketplace exchanges, typically purchasing either a Bronze (23% of enrollees) or Silver (71%) plan.14 The premium cost of a typical Bronze or Silver plan at age 64 is about twice the cost of most Medicare coverage at age 65 that is not subsidized by an employer (Figure 3). Individuals may be eligible for a cost-sharing subsidy based on their income.15
Employees of large employers, in particular, may have access to employer-sponsored and perhaps even employer-subsidized retiree health benefits. About one in four large employers offers such a plan on an ongoing basis, covering nearly two-thirds of the cost of pre-Medicare retiree insurance at the median. An additional 13% of large employers offer this coverage to a closed group of current or future retirees. This reflects the ongoing trend of fewer employers offering employer-subsidized retiree health benefits. Our model projects that a 64-year-old retiree could pay premiums of about $4,200 per year for employer-sponsored coverage.
Figure 2. Total health care costs under different Medicare coverage options vary by health status
Source: Mercer-Vanguard health care cost model, 2018.
Incremental change and the loss of employer subsidies in retirement
Before retirement, a person’s employer often subsidizes a substantial portion of employee and dependent health care costs. On average, employers that provide health care benefits spend about $5,300 per year per worker for employee-only coverage.16 When these subsidies disappear at retirement, the retiree could incur additional costs.
Our 65-year-old woman, on average, would have paid $1,300 annually in health care insurance premiums while working (Figure 4). The premiums for Medicare with Supplemental Plan F at age 65 could be expected to be $3,600, almost three times the employer-sponsored cost. The increment for employees with more generous coverage could be even more. When pre-Medicare private coverage is needed, that cost difference could be considerably higher.
Figure 3. Presence or lack of subsidized coverage for pre-Medicare retirees can significantly affect costs
Figure 4. With the loss of employer subsidies, retirees need to cover additional insurance expenses
Source: Mercer-Vanguard health care cost model, 2018.
* Health insurance subsidies vary based on income and family size.Source: Mercer’s 2016 National Survey of Employer-Sponsored Health Plans, Mercer-Vanguard health care cost model, 2018.
Med
ian
co
st
$7,400 $8,000
$4,200 $3,600
$7,400 $8,000
$4,200 $3,600
$6,300 $4,800
$1,300 $1,600
$13,100$9,400
$1,500 $2,900
Bronze (age 64)
Silver (age 64)
Employer-sponsoredcoverage(age 64)
Medicare(age 65)
Employer-sponsoredcoverage(age 64)
Medicare(age 65)
Medium risk High risk
$13,700
$6,500$5,700
$17,400
$20,500
$5,200$5,500
$12,800
Premiums Out-of-pocket costs (including dental and vision)
Marketplace coverageBronze (age 64)
Silver (age 64)
Marketplace coverage
Average annual premiums,by type of insurance, 2018$600
$1,300
$2,300
$8,000
$3,600
Employee coverageHigh subsidy
Employee coverageMedian subsidy
Employee coverageLow subsidy
Marketplace coverageSilver plan*
Medicare withSupplemental Plan F
16 Mercer’s 2016 National Survey of Employer-Sponsored Health Plans.
8
Geography
Where a retiree chooses to live during retirement also affects projected health care costs. Geography does not affect Medicare Part B premiums, but it may affect Part D premiums. It also affects the cost of private insurance, such as marketplace public exchange plans, Medicare Advantage premiums, and supplemental Medicare policy premiums. Some of these differences are due to variation in the cost of living or the cost of medical services and the level of federal funding. Some are due to differences in the insurance providers that serve each state.
If an individual chooses Plan F, the largest cost variance arises from premiums, and the variance in out-of-pocket costs is minimal. In 2017, annual Plan F premiums ranged from $1,488 up to $3,348, more than twice the lowest cost (Figure 5). The median was just over $1,800.
Medicare surcharges
Another factor affecting Medicare Part B and Part D premiums is income. Medicare premiums are subsidized by the government. As retirees reach higher levels of income, those subsidies are reduced, in the form of higher Part B and Part D premiums. Figure 6 shows these surcharges for 2018.
Figure 5. Projected premium costs differ by where a retiree lives
Source: Mercer-Vanguard health care cost model, 2018.
Annual premiumfor least-expensiveSupplementalPlan F available,by zip code
Highest$3,348
Lowest$1,488
17 Liu, Hui, and Debra J. Umberson, September 2008. The Times They Are a Changin’: Marital Status and Health Differentials from 1972 to 2003, The Journal of Health and Social Behavior 49(3); available at www.ncbi.nlm.nih.gov/pmc/articles/PMC3150568/.
18 Based on a comparison of the Society of Actuaries RP-2014 Employee mortality tables and RP-2014 Healthy Annuitant mortality tables for ages 65 to 80, October 2014 (revised November 2014). 9
Other factors affecting costs
Although the underlying data available for the Mercer-Vanguard health care cost model did not allow us to adjust for the following factors, studies have indicated that these affect a retiree’s routine health care costs:
• Marital status. Being married has been shown to be beneficial to the health of the retired couple. Not only is longevity higher for married individuals, but marriage has also been shown to be correlated with a better health status.17 In addition, joint coverage options may be available to married couples that differ from separate individual policies.
• Age at retirement. Evidence is emerging that individuals who work past age 65 have better longevity and health. For example, working individuals have greater longevity as a group than retirees of the same age.18
Personalizing health care cost estimates
Planning for routine health care costs in retirement should be an element of a comprehensive retirement planning strategy. The exact nature of the changes in annual health care costs becomes clearer as retirement approaches. Each individual has a combination of factors that affect health care costs. High-risk health status has the potential to greatly increase costs. Choosing traditional Medicare with no supplemental coverage may lower costs at the median, but it increases the variability of potential costs. Medicare surcharges can dramatically increase premiums for high-income retirees. On the other hand, cost-of-living differences due to geography usually have less impact on health care costs. Individuals should consider how all of their personal attributes will affect their costs.
Although the median annual health care cost was estimated as $5,200, the range of estimated 2018 annual health care costs for our 65-year-old woman varies from $3,000 to $26,200 (Figure 7, on page 10).
Figure 6. Medicare Part B and Part D premium surcharges for 2018
2016 modified adjusted gross income* 2018 annual premium per person
Individual tax return Joint tax returnMarried filing separately tax return Part B Part D
$85,000 or less $170,000 or less $85,000 or less $1,608 Plan premium
Above $85,000 up to $107,000
Above $170,000 up to $214,000
NA $2,250 Plan premium
+ $156
Above $107,000 up to $133,500
Above $214,000 up to $267,000
NA $3,215 Plan premium
+ $403
Above $133,500 up to $160,000
Above $267,000 up to $320,000
NA $4,180 Plan premium
+ $650
Above $160,000 Above $320,000 Above $85,000 $5,143 Plan premium
+ $898
* Modified adjusted gross income is adjusted gross income plus any nontaxable Social Security benefits, tax-free interest income, and excluded foreign income. In 2019 a new income bracket will take effect for individuals with incomes above $500,000 and couples with incomes above $750,000.
19 U.S. Government Accountability Office, March 2016. Retirement Security: Better Information on Income Replacement Rates Needed to Help Workers Plan for Retirement ; available at www.gao.gov/products/GAO-16-242.10
Implications for replacement ratios
Retirement savers, especially those who are many years away from retirement, often have a difficult time envisioning what their retirement spending needs will be. However, projected spending is a critical input for determining the savings rate needed to maintain a comparable standard of living in retirement. Financial planners, understanding this difficulty, often instead use a replacement ratio, which is a percentage of pre-tax income at retirement that an individual will need to maintain their desired lifestyle. Typically, retirement plans use replacement ratios of 70% to 85%.19
However, the wide variation in incremental health care costs that individuals will encounter at retirement suggests that blindly accepting these default ranges may not be a good idea for some retirement savers. Incremental changes in spending at retirement can be small for those who have employer benefits that
completely cover costs both pre- and post-retirement or who are in particularly good health. At the other extreme, some individuals have high medical costs or lose generous subsidies and may incur incremental costs in the thousands of dollars. Where the incremental increase is high, retirement savers may need to increase replacement ratios and therefore their savings rate.
Aon Consulting’s often-cited 2008 Replacement Ratio Study suggests a replacement ratio of 75% to 85% (Figure 8). But what did this baseline case assume for incremental change in health care costs? In the baseline case, an employee making $60,000 per year was assumed to have an annual health care cost increase of $1,086. Aon also modeled a “worst case” health care cost change, which assumed that an individual would face an additional cost of $4,800 per year at retirement. These assumptions resulted in higher replacement ratios. Ten years after the study, however, it is not hard to envision scenarios in which the “worst case” increase
Figure 7. The range of annual health care costs for a 65-year-old woman, 2018
Income below $85,000 Income above $160,000
Health risk
Low Medium High Low Medium High Low Medium High Low Medium High
Geography, cost of living
Low Medium High Low Medium High Low Medium High Low Medium High
Supplemental coverage
None None None Plan F Plan F Plan F None None None Plan F Plan F Plan F
20 Fronstin, Paul, and Jack VanDerhei, 2017. Savings Medicare Beneficiaries Need for Health Expenses: Some Couples Could Need as Much as $350,000, EBRI Notes 38(1), Employee Benefit Research Institute; available at www.ebri.org/publications/notes/.
21 U.S. Bureau of Labor Statistics Consumer Expenditure Survey 2015–2016; available at www.bls.gov/cex.22 This is the median life expectancy for a nonsmoking 65-year-old woman in average health, according to the Society of Actuaries and the American Academy of
Actuaries Longevity Illustrator, available at www.longevityillustrator.org/.
could be double that assumption, or $9,600 per year. Under this scenario, replacement ratios could rise to 90% or higher.
This implies that employers who provide retirement savings plan automatic enrollment and generous health care subsidies should target higher replacement ratios leading to higher savings rate targets. But if there are also generous retiree health care benefits, such an increase might not be necessary.
Framing costs in annual terms
What exactly does it mean that a female retiree might spend a total of $143,000 or more on health care?20 That figure certainly sounds high, perhaps overwhelming. But is it? When any annual recurring expense is framed as a lump sum rather than an annual flow, it can quickly become daunting.
Consider that, according to the U.S. Bureau of Labor Statistics (BLS), the average one-person household age 65 and above spends $16,903 per year on food, clothing, and shelter combined.21 This cost seems reasonable. But what if we convert it into a lump sum estimate? If we assume growth with inflation and a 24-year time horizon, we find that the individual will need over $400,000 just to pay for food, clothing, and shelter.22 BLS reports that average total spending on all categories is $30,948 per year. This means our individual would need over $740,000 to cover future living expenses. In that context, $143,000 for health care seems small!
Figure 8. Higher projected incremental health care costs have implications for retirement savings targets
Sources: Aon Consulting’s 2008 Replacement Ratio Study and Vanguard.
85%81% 78% 77% 77% 78%
94%88%
84% 82% 82% 82%
105%97%
91% 89% 87% 87%
$40,000
Replacement ratioPercentage of pre-taxincome at retirementneeded to maintaincurrent lifestyle
Income atretirement $50,000 $60,000 $70,000 $80,000 $90,000
Aon baseline case, 2008Annual health care costincrease: $1,086
Aon worst case, 2008Annual health care costincrease: $4,800
New worst case, 2018Annual health care costincrease: $9,600
23 The National Center for Biotechnology Information, at www.ncbi.nlm.nih.gov.24 Jaconetti, Colleen M., Jonathan R. Kahler, Kelly McShane, and Nathan Zahm, 2018. Vanguard’s Roadmap to Financial Security: A Framework for Decision-Making in
Retirement. Valley Forge, Pa.: The Vanguard Group; available at vanguard.com. Vanguard’s framework separates retirement spending needs into four categories of decreasing importance: (1) basic living expenses (needs), (2) contingency expenses (unpredictable, often expensive needs), (3) discretionary expenses (wants), and (4) bequests.12
When converting a potential stream of payments into a lump sum, we must make assumptions about how long those payments will continue. In this case, the length of time is determined by life expectancy. However, life expectancy estimates are inherently uncertain. For example, an average healthy 65-year-old woman has a life expectancy of 24 years—meaning there is a 50% chance she will live that long. Using estimates from the Mercer-Vanguard health care cost model, she could incur lifetime costs of about $200,000 if she lives exactly 24 years more, to age 89. The chance is also 50%, however, that she could either die by age 81 or live to age 95 or older. If so, she would spend either less than $120,000 or else more than $272,000 on annual health care costs over her remaining lifetime. This range is wide and accounts for only 50% of the possible outcomes. This is why retirement planning professionals should focus on annual spending plans.
The wide range in lifetime medical costs in this example results only from the number of years an individual consumes health care—it does not account for differences in personal characteristics. Sometimes, lifetime health care projections complicate the issue by combining life expectancy assumptions with health status. This can lead to the conclusion that people in poor health will pay less for health care, because they will live fewer years.23 However, when you examine those costs through the framework of annual costs, it is clear that the planning problem is that people in poor health incur higher annual health care costs.
Vanguard believes that a better approach to framing health care expenses in retirement is to separate them into two categories: annual health care expenses and long-term care expenses. Routine medical expenses, premiums, and out-of-pocket costs should be treated the same as other basic living expenses—as an annual amount.24 Although out-of-pocket costs vary from year to year, over time for many individuals they should follow a fairly predictable pattern and fall within a reasonably predictable range, once the individual factors discussed earlier are taken into account. However, for a small percentage of retirees, out-of-pocket costs can be very high.
It is important to note that when we talk about framing costs in annual terms, we are not talking about long-term care expenses. Long-term care expenses are unpredictable, and many retirees will never incur them. Planning for these expenses should recognize that they represent a contingency that may need to be paid for at any time. We address long-term care expenses in more detail later in this paper.
Health care cost growth
Recall that the Mercer-Vanguard health care cost model projects that a typical 65-year-old woman living in a median-cost area could expect to pay about $5,200 for premiums and out-of-pocket medical, dental, and vision costs in 2018 for traditional Medicare with Supplemental Plan F. But how could those costs change over time? By age 85, our retiree could expect her annual health care consumption to double in real dollars (Figure 9).
There are two reasons why growth in health care costs is so pronounced. The first is that such costs have historically grown faster than inflation (Figure 10). Although their growth has recently moderated
Figure 9. Retirees can expect to spend more on health care as they grow older
Source: Mercer-Vanguard health care cost model, 2018.
somewhat, health care costs are projected to keep growing faster than inflation for the foreseeable future. The second reason is that people generally spend more on health care as they age. Simply put, all other factors being equal, an 85-year-old will consume more health care services than a 65-year-old. However, annual health care costs tend to level off, or even decline, at the highest ages.
The reasons why health care costs have grown faster than inflation include a shift to costlier services and the emergence of new treatments and prescription drugs.
Figure 11 shows the projected rates of health care inflation used in the Mercer-Vanguard health care cost model. Our model assumes that eventually the health care cost trend will run closer to inflation, in order to be economically sustainable and prevent national health care expenditures from consuming an unreasonable portion of U.S. economic output (as measured by Gross Domestic Product).
For pre-Medicare populations, our 2018 trend assumption of 6.6% is based on Mercer’s experience for similar populations for medical, prescription drug, and administrative costs and is graded down over time to a 4.5% annual trend. Trend assumptions for Medicare-eligible populations are based on per capita cost trends for Parts A, B, and D as established by the CMS in its 2017 Medicare Trustees Report. These are blended together with an assumed administrative cost inflation of 4%. The 2018 blended Medicare retiree trend assumption of 5.6% eventually grades down to 4.3% in 2091. To convert projections into 2018 dollars, our model assumes a constant Consumer Price Index of 2.6%.
Figure 10. Health care costs have historically grown faster than inflation
Figure 11. Mercer-Vanguard health care model growth assumptions
Source: U.S. Department of Labor, Bureau of Labor Statistics.
Note: Growth assumptions for Medicare-eligible populations are from the 2017 Medicare Trustees Report.Source: Mercer-Vanguard health care cost model, 2018.
In�
atio
n
–4
4
0
8
12
16%
1970 1980 1990 2000 2010 2017
CPI for Medical Care Consumer Price Index
Pro
ject
ed g
row
th
0
6
7%
5
4
3
2
1
Pre-Medicare population Medicare-eligible population Consumer Price Index2018 2020 2022 2024 2026 2028 2030 2032 2034 2036 2038 2040
25 David Blanchett also found declines in spending using data from the RAND Health and Retirement Study; see Blanchett, David, May 2014, Exploring the Retirement Consumption Puzzle, Journal of Financial Planning 27(5), available at www.onefpa.org/journal/pages/may14-exploring-the-retirement-consumption-puzzle-.aspx. Others who have documented declines in household spending in retirement include Michael D. Hurd and Susann Rohwedder (see Hurd, Michael D., and Susann Rohwedder, April 2008, The Retirement Consumption Puzzle: Actual Spending Change in Panel Data, NBER Working Paper No. 13929; available at www.nber.org/papers/w13929.pdf), and John Karl Scholz, Ananth Seshadri, and Surachai Khitatrakun (see Scholz, Karl, Ananth Seshadri, and Surachai Khitatrakun, August 2006, Are Americans Saving “Optimally” for Retirement?, Journal of Political Economy 114[4]; available at www.ssc.wisc.edu/~scholz/Research/Optimality.pdf).
26 Rappaport, Anna, 2017. Shocks and the Unexpected: An Important Factor in Retirement. Society of Actuaries; available at www.soa.org/Files/resources/research-report/2017/shocks-inexpected-factor-retirement.pdf.14
Substitution effects
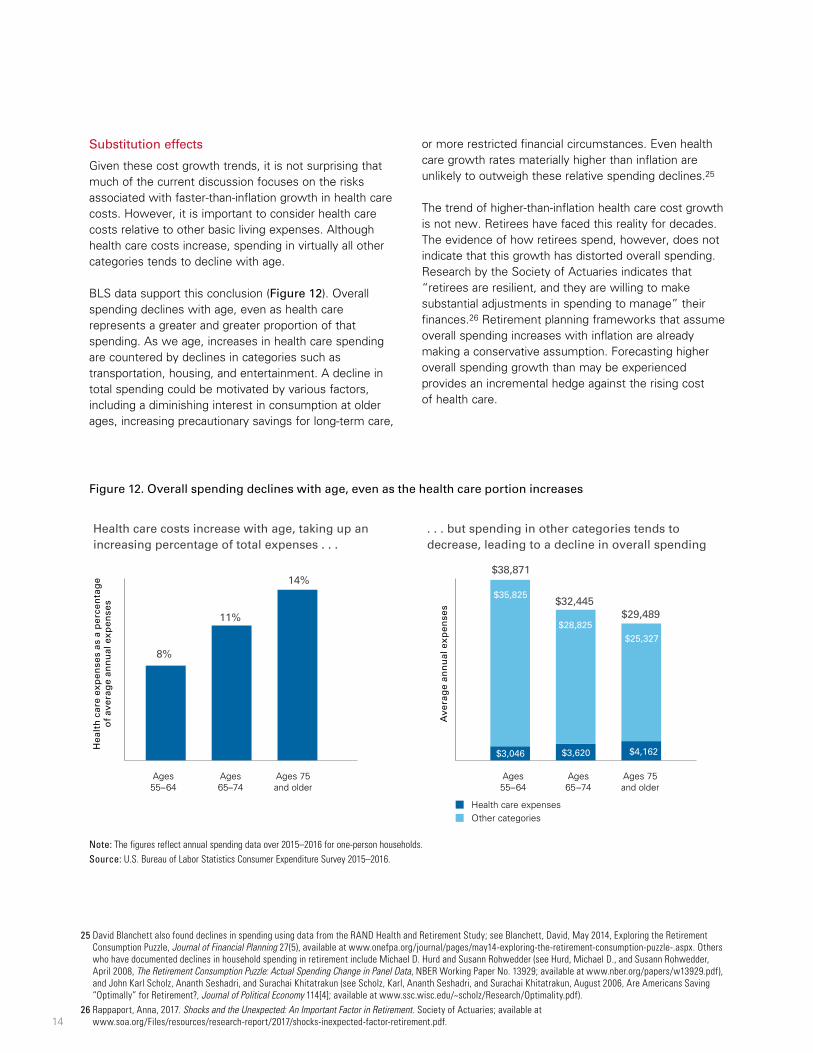
Given these cost growth trends, it is not surprising that much of the current discussion focuses on the risks associated with faster-than-inflation growth in health care costs. However, it is important to consider health care costs relative to other basic living expenses. Although health care costs increase, spending in virtually all other categories tends to decline with age.
BLS data support this conclusion (Figure 12). Overall spending declines with age, even as health care represents a greater and greater proportion of that spending. As we age, increases in health care spending are countered by declines in categories such as transportation, housing, and entertainment. A decline in total spending could be motivated by various factors, including a diminishing interest in consumption at older ages, increasing precautionary savings for long-term care,
or more restricted financial circumstances. Even health care growth rates materially higher than inflation are unlikely to outweigh these relative spending declines.25
The trend of higher-than-inflation health care cost growth is not new. Retirees have faced this reality for decades. The evidence of how retirees spend, however, does not indicate that this growth has distorted overall spending. Research by the Society of Actuaries indicates that “retirees are resilient, and they are willing to make substantial adjustments in spending to manage” their finances.26 Retirement planning frameworks that assume overall spending increases with inflation are already making a conservative assumption. Forecasting higher overall spending growth than may be experienced provides an incremental hedge against the rising cost of health care.
Figure 12. Overall spending declines with age, even as the health care portion increases
Note: The figures reflect annual spending data over 2015–2016 for one-person households.Source: U.S. Bureau of Labor Statistics Consumer Expenditure Survey 2015–2016.
Hea
lth
car
e ex
pen
ses
as a
per
cen
tag
eo
f av
erag
e an
nu
al e
xpen
ses
Ave
rag
e an
nu
al e
xpen
ses
$3,046 $3,620 $4,162
$35,825
$28,825 $25,327
$38,871
$32,445$29,489
8%
11%
14%
Ages55–64
Ages65–74
Ages 75and older
Ages55–64
Ages65–74
Ages 75and older
Health care expensesOther categories
Health care costs increase with age, taking up anincreasing percentage of total expenses . . .
. . . but spending in other categories tends todecrease, leading to a decline in overall spending
27 Kahler, Jonathan R., Andrew Clarke, and Maria A. Bruno, 2017. HSAs: An Off-Label Prescription for Retirement Saving. Valley Forge, Pa.: The Vanguard Group; available at vanguard.com. 15
How should people think about planning for annual health care costs in retirement?
Planning considerations will vary depending on a person’s life stage and health status. Planning should focus on a personalized annual process rather than a hypothetical lump sum.
• Understand costs. Individuals should understand how health status and other personal factors might affect their annual health care costs. Coverage choices should be informed by health status. Higher-income retirees will be subject to Medicare surcharges. Individuals retiring before age 65 need a strategy for bridging to Medicare.
• Understand employer subsidies. Individuals should understand the difference in the coverage cost they pay now and what they will have to spend in retirement. Is their current health care heavily subsidized by their employer? Does the individual have employer-subsidized retiree health benefits? Instead of lifetime lump-sum projections, individuals should focus on the incremental change in their annual costs.
• Retirement savers could target higher replacement ratios. Some retirement savers may encounter a large incremental change in health care costs when they retire. Individuals who have generous employer subsidies or are in poorer health may want to save at higher rates to offset these factors.
• Consider using health savings accounts. Health savings accounts can be used as a means to save, in a highly tax-efficient manner, for unforeseen health care expenses in retirement.27 It should be emphasized that these accounts can be used as retirement savings and investing vehicles rather than as a “checking account.” Investors can save in these accounts today, while paying current out-of-pocket costs from wages. This strategy can reduce the incremental change to overall costs that a retiree would experience by forgoing other current spending to pay for current health care costs. This also reduces the impact of future health care costs by having earmarked tax-free savings.
• Retirees should consider Medicare enrollment options carefully and revisit them annually. Decisions involving the choice between traditional Medicare coverage only, traditional Medicare with a supplement, or Medicare Advantage depend on each retiree’s needs and circumstances. There is much more to consider than just the trade-off of premiums and out-of-pocket expenses. Retirees should assess their situation each year and make adjustments accordingly. However, the opportunity to adjust may be limited. Although retirees can enroll in or change supplemental plans after the initial enrollment period, underwriting rules may prove difficult to overcome if a retiree’s health has worsened, and they can mean significant increases in the premiums or even denial of coverage. Medicare Advantage and prescription drug plans can be reassessed yearly.
Long-term care costs present a far different type of retirement planning challenge than annual health care costs. They are unpredictable, sometimes large, sometimes zero, and rarely covered by health insurance other than long-term care policies, which are increasingly difficult to obtain or afford.
The total amount someone might pay for long-term care represents a combination of whether the person will need care and, if so, what type and for how long. About half of the elderly can expect no costs for paid long-term care (Figure 13).28 Another quarter can expect to incur costs of less than $100,000. However, 15% can expect costs exceeding one-quarter of a million dollars.
Long-term care services help individuals with activities of daily living (ADLs): bathing, dressing, toileting, transferring (that is, getting out of a bed or chair), continence, and eating. The Health Insurance Portability and Accountability Act (HIPAA) established that someone needing assistance with two or more of these activities for 90 days or more is consuming long-term care. HIPAA
also established that the same is true for someone with severe cognitive impairment who requires substantial supervision for safety reasons.
Long-term care can be further categorized as temporary or ongoing. Temporary long-term care is episodic and shorter in duration, lasting only weeks or months. Examples include rehabilitation after a hospital stay or recovery from an injury or surgery. In these instances, the individual recovers and no longer requires long-term care services. Another example is hospice care arising from a terminal medical condition, which is temporary because the end of life is imminent. Temporary long-term care costs may be covered by Medicare.
In contrast, ongoing long-term care is many months or even years in duration. Examples include assistance with ADLs associated with cognitive decline, permanent disability, and other chronic conditions. The most common situation leading to ongoing long-term care is dementia. Stroke, Parkinson’s disease, and osteoarthritis are also common reasons for needing long-term care.29 Once begun, ongoing long-term care is generally consumed for the rest of a person’s life.
Figure 13. Costs for paid long-term care vary considerably
Source: Assistant Secretary for Planning and Evaluation (ASPE) Issue Brief, Long-Term Services and Supports for Older Americans: Risks and Financing, ASPE Research Brief, revised February 2016, Table 5.
Almost halfof retirees canexpect to incurno long-termcare costs.
26% of retireescan expect somelong-term care costsup to $100,000.
15% of retireescan expect to pay overa quarter-million dollarsin long-term care costs.
28 John Bailey Jones et al., using data from the Health and Retirement Study, find that 60% of women and 70% of men who are not in a nursing home at age 70 never have an extended nursing home stay; see Jones, John Bailey, Mariacristina De Nardi, Eric French, Rory McGee, and Justin Kirschner, May 2018, The Lifetime Medical Spending of Retirees, NBER Working Paper No. 24599, available at www.nber.org/papers/w24599.
29 Van Rensbergen, Gilberte, and Tim Nawrot, July 2010. Medical Conditions of Nursing Home Admissions. BMC Geriatrics 10(46); available at www.ncbi.nlm.nih.gov/pmc/articles/PMC2912913/.
30 National Care Planning Council, Guide to Long Term Care Planning—About Long Term Care; available at www.longtermcarelink.net/eldercare/long_term_care.htm/. 17
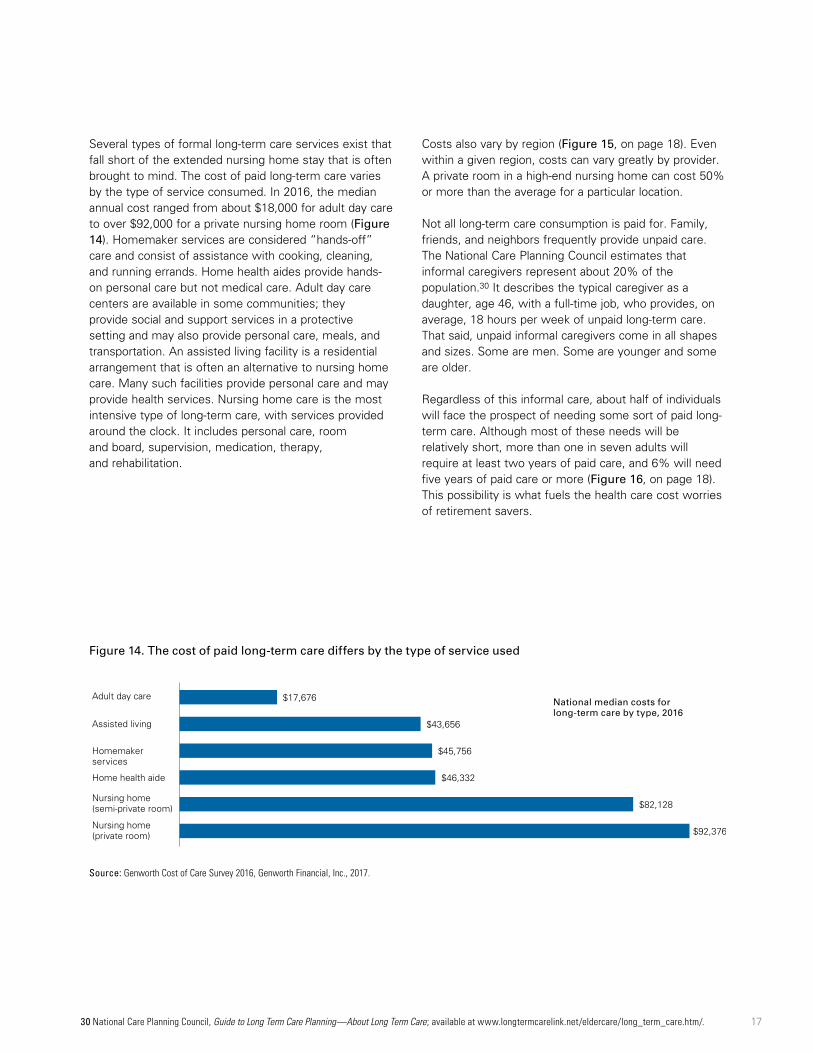
Several types of formal long-term care services exist that fall short of the extended nursing home stay that is often brought to mind. The cost of paid long-term care varies by the type of service consumed. In 2016, the median annual cost ranged from about $18,000 for adult day care to over $92,000 for a private nursing home room (Figure 14). Homemaker services are considered “hands-off” care and consist of assistance with cooking, cleaning, and running errands. Home health aides provide hands-on personal care but not medical care. Adult day care centers are available in some communities; they provide social and support services in a protective setting and may also provide personal care, meals, and transportation. An assisted living facility is a residential arrangement that is often an alternative to nursing home care. Many such facilities provide personal care and may provide health services. Nursing home care is the most intensive type of long-term care, with services provided around the clock. It includes personal care, room and board, supervision, medication, therapy, and rehabilitation.
Costs also vary by region (Figure 15, on page 18). Even within a given region, costs can vary greatly by provider. A private room in a high-end nursing home can cost 50% or more than the average for a particular location.
Not all long-term care consumption is paid for. Family, friends, and neighbors frequently provide unpaid care. The National Care Planning Council estimates that informal caregivers represent about 20% of the population.30 It describes the typical caregiver as a daughter, age 46, with a full-time job, who provides, on average, 18 hours per week of unpaid long-term care. That said, unpaid informal caregivers come in all shapes and sizes. Some are men. Some are younger and some are older.
Regardless of this informal care, about half of individuals will face the prospect of needing some sort of paid long-term care. Although most of these needs will be relatively short, more than one in seven adults will require at least two years of paid care, and 6% will need five years of paid care or more (Figure 16, on page 18). This possibility is what fuels the health care cost worries of retirement savers.
Figure 14. The cost of paid long-term care differs by the type of service used
Source: Genworth Cost of Care Survey 2016, Genworth Financial, Inc., 2017.
National median costs forlong-term care by type, 2016
Figure 15. Costs for nursing home care vary by location
Source: Mercer-Vanguard health care cost model, 2018.
Nursing home private room care annual cost,by zip code
HighestOver $200,000
Median 97,500
LowestUnder $52,000
Figure 16. About half of individuals will need some paid long-term care
Source: Assistant Secretary for Planning and Evaluation (ASPE) Issue Brief, Long-Term Services and Supports for Older Americans: Risks and Financing, ASPE Research Brief, revised February 2016, Table 2.
Projected use of long-term careFor people turning age 65 between 2015 and 2019
More than one in sevenadults will require at leasttwo years of paid long-term care
None <1 1 to <2 2 to <5 5+
Years
53%
23%
9% 10%6%
58%
22%
9% 8%3%
48%
23%
10% 11%8%
All peopleMenWomen
31 Family Caregiver Alliance, National Center on Caregiving. Women and Caregiving: Facts and Figures: Who Are the Caregivers?; available at www.caregiver.org/women-and-caregiving-facts-and-figures. 19
The incidence and duration of paid long-term care varies by gender. Nearly six in ten men can expect to consume no paid long-term care, while more than half of women can expect to consume it. Women also are more than twice as likely to require paid long-term care for five or more years. This is not because men are healthier than women. Elderly men are more likely to be married than women, largely because of gender differences in life expectancy. As a result, 65% of informal caregivers are women.31 Thus, men are more likely to receive a greater portion of care in an unpaid, informal fashion.
In some circumstances, Medicare will pay for long-term care services, but only for a short time and under specific conditions. For example, Medicare will cover up to 100 days of care as long as that period follows at least three days of being hospitalized and as long as you need skilled medical care for your treatment. The vast majority of those who need long-term care will have at least a
portion paid by Medicare, but given the limited nature of what Medicare pays, it covers only 10% of long-term care costs (Figure 17). Individuals requiring long-term care, either at home or in a facility, will need to find funding elsewhere. A last-resort payer is Medicaid, which pays about one-third of long-term care costs, covering about one in three people who use paid long-term care. To qualify for Medicaid for long-term care, the patient must, with some exceptions, deplete all other assets. For affluent retirees, any extended period of paid long-term care will likely be paid out of pocket.
Figure 17. A majority of long-term care costs are paid out of pocket
Sources: Vanguard, based on data from the Assistant Secretary for Planning and Evaluation (ASPE) Issue Brief, Long-Term Services and Supports for Older Americans: Risks and Financing, ASPE Research Brief, revised February 2016, Table 3B and Table 5.
Percentage of those with long-term care who use this type of fundingFor people turning age 65 between 2015 and 2019
72% of long-termcare users pay somecosts out of pocket . . .
Percentage of long-term care costs paid
91% 10%
35%
14%
72%
8%
34%
1%
53%
3%
Medicare
Medicaid
Other public sources
Out-of-pocket
Private insurance
. . . and those out-of-pocket funds cover, onaverage, 53% of the costs.
Percentageof those withlong-term carewho use thistype of funding
For people turning age 65 between 2015 and 2019
72% of long-termcare users pay somecosts out of pocket . . .
Percentageof long-termcare costs paid
91%
35%
14%
72%
8%
Medicare
Medicaid
Other publicsources
Out-of-pocket
Private insurance . . . and those out-of-pocket funds cover, onaverage, 53% of the costs.
32 Ameriks, John, Joseph Briggs, Andrew Caplin, Matthew D. Shapiro, and Christopher Tonetti, revised May 2017. Long-Term Care Utility and Late-in-Life Saving 2017; available at ebp-projects.isr.umich.edu/VRI/papers.html.20
How should retirees plan for long-term care costs?
Retirees need to confront the possibility of an extended, expensive long-term care stay. Even if the probability of incurring expensive care is relatively low, the number is of a magnitude that is hard to ignore. Individuals should consider these factors when evaluating how likely they are to need long-term care and at what cost:
• Unpaid care options. What sources of unpaid care would the individual have access to if needed? Are spouses, children, or friends available, capable, and willing to provide support, at least for a portion of the care?
• Acceptable types of care. What types of facilities and services are available? Would the individual be content using them? Would the individual prefer a private room in a nursing home?
• What goes away? Long-term care expenses may substitute for some other expenses. What expenses might disappear? Will a large travel budget no longer apply? Will a stay at a nursing home negate the need to pay for other housing costs? Certainly long-term care can be expensive, but individuals should really not be concerned with the absolute cost as much as the incremental additional cost over and above their previous expenses.
• Understand Medicaid. A catastrophic long-term care event could deplete one’s assets. People should therefore understand Medicaid rules well in advance of such a situation. Those who believe that Medicaid may be part of their long-term care planning should consult with an elder law attorney.
Once individuals have gone through this scenario analysis, they can begin to get a sense of what magnitude of cost they want to plan for. Then they need to consider how they could meet potential long-term care costs. Funding sources include:
• Financial assets. The biggest source of long-term care funding is private out-of-pocket spending. Most affluent retirement investors will probably want to plan explicitly to pay out of pocket for long-term care, should the need arise. Assets should serve as both a source of annual income and as a contingency reserve for large, unexpected expenses. The contingency reserve covers both long-term care expenses and other health care costs that may not be sufficiently covered by insurance. A retirement plan that spends down a portfolio without consideration for the possible need for long-term care spending puts a retiree’s financial stability at risk. Some retirees are reluctant to spend freely from investments during retirement because they are reserving against this possibility.32
• Role of the home. Home equity may serve as part of a contingency reserve for nursing home stays. Married retirees, however, need to consider a surviving spouse’s continued use of the home as a place to live.
• Income annuities. Single premium income annuities and qualified longevity annuity contracts may be worth considering for some married retirees, not so much as a source of funding for long-term care, but rather as insurance for a surviving spouse. A guaranteed source of income to supplement Social Security for a surviving spouse can be a way to lessen the severity of the financial effects of a low-probability, high-cost long-term care event that significantly reduces assets.
• Long-term care insurance. Long-term care insurance pays for only a small portion of care in the U.S. Such policies have historically been expensive, and most have benefit caps that may reduce the usefulness of insurance in the most severe scenarios. However, as the market evolves, new policy types may emerge that individuals should evaluate. For now, traditional long-term care insurance policies remain a relatively small player in the paid long-term care space.
Individual health and family history will significantly affect health care consumption in retirement. In addition, consumption of health care rises with age, and health care costs rise faster than inflation. People have become increasingly concerned about the effect that health care costs during retirement may have on financial security.
Planning for annual health insurance premiums and out-of-pocket expenses at retirement should be distinct from planning for long-term care expenses. Framing annual health care costs as a large lump sum is behaviorally distracting and fails to highlight the essential factors associated with planning for these annual costs. We believe that a better approach is to forecast annual expenses personalized to an individual’s attributes. Costs may increase substantially at retirement because of the possible loss of employer health insurance premium subsidies. Health care costs are also influenced by a range of factors over which retirees have varying degrees of control, such as plan choice, geography, income, retirement age, and health status.
An understanding of personal health care cost factors provides a baseline with which individuals can predict incremental anticipated costs. During their working years, some individuals should save at higher rates to account for potential future incremental health care spending. Workers with generous employer health care benefits and those at higher risk of chronic conditions because of either their current health status or their parental history should target higher replacement ratios.
Long-term care costs may actually be the biggest concern for most retirement planning scenarios, because the consumption of long-term care varies significantly. Half of individuals will incur no costs, and a quarter will consume less than $100,000. However, 15% will consume more than $250,000. Individuals should plan for these potential costs. Factors such as individual health, family history, and presence of support networks will inform each person’s desired long-term care need.
22
Appendix. Mercer-Vanguard health care cost forecasting model methodology description
Introduction
The health care cost forecasting model provides likelihoods of estimated lifetime and annual health care costs expected in retirement, in addition to estimates of long-term care costs. It relies on numerous assumptions and underlying data sources. All estimates are based on the information available at a point in time and are subject to unforeseen and random events. Therefore, any projection must be interpreted as having a likely range of variability from the estimate. Mercer built this model exclusively for Vanguard. Mercer is not responsible for use of this model by any other parties. This report is based on our understanding of applicable law and regulations as of January 2018.
Structure of the model
Our intent was to capture and forecast all types of health care costs (other than over-the-counter drugs) that retirees may encounter during their lifetime. These costs include:
• Insurance premiums.
• Contributions to employer-sponsored plans.
• Required Medicare premiums.
• Out-of-pocket costs.
A standard actuarial forecasting approach was used to produce an estimate of the year-by-year costs (except for long-term care) that would be encountered during a person’s lifetime, both before and after retirement. Our key assumptions were:
• The current level of costs for each type of health care expenditure.
• The real inflation rate for each or the expected annual increase in per capita costs, as appropriate.
• The variation in costs by age, as appropriate.
In addition, for most of the costs we looked at not only the average cost but also the possible range of those costs, matching them to probability distributions where appropriate. This allowed a more nuanced analysis of potential health care costs for retirees and people planning for retirement. Although the model certainly does not capture every possible individual situation, it does allow us to analyze the costs in most situations.
The model inputs and key assumptions are described in more detail below.
Long-term care
Lifetime long-term care costs—from Table 6B of Long-Term Services and Supports for Older Americans: Risks and Financing Research Brief, published July 2015 by the U.S. Department of Health and Human Services—was fit to a probability distribution by each income quintile provided. The resulting lifetime costs are adjusted by an assumed Consumer Price Index (CPI) to the starting projection year. The costs were further adjusted based on gender, health status, and marital status, developed from the same study. Lastly, an area factor developed from the Genworth 2017 Cost of Care Survey and the Society of Actuaries’ incidence factors was applied.
Annual health care costs
The model forecasts health care costs separately for premium-related costs such as Medicare premiums, payments to insurers for an open-market plan, or contributions paid toward employer-sponsored coverage and out-of-pocket costs that the retiree pays through plan cost-sharing (for example, deductibles and copays).
Medicare premium costs
Estimated Part B premiums and Part D income-related monthly adjustment amounts (Part D-IRMAA) are determined based on income at retirement (as provided by the model user) and 2018 Part B and Part D premiums by income.
Health insurance costs
Individuals have two sources for obtaining health care coverage: (1) an employer-sponsored plan, wherein the member typically receives an employer subsidy and pays the required contributions, or (2) the individual insurance market, wherein the member typically pays the entire
23
premium. When known, contributions paid for employer-sponsored health insurance are used. Otherwise, benchmark data from Mercer’s 2016 employer survey is used for the required contributions for employer-sponsored coverage. If open-market individual coverage is chosen, the lowest-cost premium based on plan choice, area, and a given age bucket is used.
For pre-Medicare individual coverage, we have limited the open-market plan choices to Silver and Bronze, as the majority of enrollment is in these plans. For Medicare-eligible retiree plan designs, we have limited our analysis to Medicare, a characteristic Medicare Advantage plan with prescription drug coverage (MAPD), Medicare Supplemental Plan F, Medicare Supplemental Plan N, and traditional Medicare with a standard prescription drug plan (PDP). The Mercer-Vanguard health care cost model does not include low-Income premium or cost-sharing subsidies for MAPD.
Out-of-pocket costs
For out-of-pocket costs, we were unable to identify any one aggregate data source for all coverages and groups. Because the data come from multiple sources, there may be some inconsistencies in the populations that we are unable to easily determine. For the active worker and pre-Medicare costs, we have broken down out-of-pocket costs by low (25th percentile), medium (25th to 75th percentile), and high risk (75th percentile). We have split the Medicare-eligible population by the same percentile breaks.
Mercer used a 2016 internal active data set for over-age-50 populations, which represents roughly 22 million claim records. These costs were used to project active and pre-Medicare out-of-pocket costs. For Bronze and Silver estimated out-of-pocket costs, we have adjusted claims based on the cost share that an average person is expected to pay (40% of total costs in the Bronze plan and 30% for the Silver plan) and available premium information. For the Medicare-eligible population, Mercer used the 2010 Medicare 5% sample (excluding those participants who were dual-eligible for Medicaid and institutional members). Mercer’s prescription-drug normative claim projected to 2018 (a total exposure of
approximately 355,000 lives) was used to estimating a member’s out-of-pocket cost under the standard Part D design.
Mercer’s benchmarking on cost and contributions was used for vision and dental coverage. Given the lower costs of these coverages in proportion to medical and prescription drug claims, as well as the limited data, only average costs were used.
Claims factor loads
Health status impact
Based on inputs provided by a user of the model, individuals are classified by health status. Although a person’s health status will not change over time for purposes of this modeling, out-of-pocket costs will still fluctuate based on the distribution of expenditures for the person’s risk tier.
Factor adjustments
Per capita claims are adjusted with trend and aging. Per capita claims and contributions are adjusted to a given year using assumed real trend factors. All trends are net of CPI in order to present costs in current dollars. Trends differ depending on the coverage (Part A, Part B, and Part D, dental, vision, and so forth). After these estimated out-of-pocket costs have been adjusted by aging and trend, area costs are applied.
The Mercer-Vanguard health care cost model is also based on requirements arising under the Affordable Care Act as it existed on this paper’s publication date. These requirements could change or be clarified in a manner that may materially affect the analysis and resulting determinations.