UX: the Next Big Thing for Transit? Craig Nelson, Associate, Steer Davies Gleave L os Angeles is on the cusp of change. With new infrastructure projects in the pipeline, what could the city's transit agencies learn from user experience (UX) research? In 2016, Los Angeles opened a new rail line to the beach, extended the Gold Line light rail system and introduced bikeshare to five of its cities. e future looks positive, with Measure M (a recently approved half-cent sales tax) set to fund a number of large-scale rail and roads projects over the next fifty years. I’ve lived in Los Angeles for two years now, and have noticed and welcomed the way new urban mobility is being discussed.. One area that people like to talk about is technology, particularly self- driving vehicles and how we will ‘subscribe’ to transportation in future—put simply, we won’t own vehicles, but instead use transportation as a service. In order for all this to be achieved, we are going to have to put the user first. We’ve already seen this with companies such as Uber. eir app makes hailing a cab stress free, and they ‘iterate’ all the time— applying tweaks on a weekly basis. Getting to this level of simplicity has meant placing the user experience (or UX) at the center of the design process. It’s a constant feedback process—design, test, iterate and repeat—and is the key to the growth of their company. It also means that they are constantly capturing data points—about how their users engage with the app, as well as the trips they take. Uber has continued this design process with their driverless vehicle pilot in Pittsburgh: the user, sitting in the back of a Volvo XC90, is placed in the middle of the experience. Uber’s process is different to the way Google is testing its vehicles— with emphasis on machine learning and logging driverless, without a member of the public providing feedback. is got me thinking—what could a transit agency learn from this? How can we ‘onboard’ new transit users and get them to try an alternative mode? How can agencies then learn by capturing and analyzing the data that they collect—and make their riders happy? At the moment a number of real and perceived pain points prevent people from even considering transit—even those that live close to express bus or railway lines. In many cases, the enthusiasm for transit vastly outweighs the actual usage. From anecdotes and surveys, many people cite safety as a major barrier, alongside the cleanliness of vehicles and stations— the rider experience can be perceived as somewhat challenging, and vastly different from that offered by Uber and Lyft. Others suggest that they are too disconnected from the network—they live too far from a bus stop or rail station and it’s quicker to drive. Payment can also be difficult, and is often one of the trickiest aspects of new rider ‘onboarding’ to overcome. Los Angeles has the TAP smart ticketing system, but, to many, it’s a complicated barrier that they’d rather do without. Trip planning information—the simple answers to ‘what options are available’ and ‘when is my bus/train leaving’ can also be forbidding to a new user. Many of these barriers to entry could be solved through user experience research and design, as well as the capture of data points and feeding them back into the design and planning process. In This Issue UX: the Next Big ing for Transit? . .1 Designing and Evaluating Land Use Regulations and Transportation Infrastructure using Urban Simulation and Data Science. . . . . .2 Pokémon Go Reinvents Spatial Planning . . . . . . . . . . . .4 Visualizing the Metabolism of a City Using Open Data . . . . . . . . .6 Building a 3D GIS Framework for Planning . . . . . . . .8 Creating Healthier and Smarter Cities: Connecting Cities and Healthcare through Patient Engagement . . . . . . . . . . . . . 11 e Continuing Evolution of Planning Web Technology: Harnessing the Power of Change . . 12 (cont. on page 5) TODAY planning & technology issue no. 114 SPRING 2017
Transcript
UX: the Next Big Thing for Transit?Craig Nelson, Associate, Steer Davies Gleave
L os Angeles is on the cusp of change. With new infrastructure projects in the pipeline, what could the
city's transit agencies learn from user experience (UX) research?
In 2016, Los Angeles opened a new rail line to the beach, extended the Gold Line light rail system and introduced bikeshare to five of its cities. The future looks positive, with Measure M (a recently approved half-cent sales tax) set to fund a number of large-scale rail and roads projects over the next fifty years.
I’ve lived in Los Angeles for two years now, and have noticed and welcomed the way new urban mobility is being discussed.. One area that people like to talk about is technology, particularly self-driving vehicles and how we will ‘subscribe’ to transportation in future—put simply, we won’t own vehicles, but instead use transportation as a service.
In order for all this to be achieved, we are going to have to put the user first. We’ve already seen this with companies such as Uber. Their app makes hailing a cab stress free, and they ‘iterate’ all the time—applying tweaks on a weekly basis. Getting to this level of simplicity has meant placing the user experience (or UX) at the center of the design process. It’s a constant feedback process—design, test, iterate and repeat—and is the key to the growth of their company. It also means that they are constantly capturing data points—about
how their users engage with the app, as well as the trips they take.
Uber has continued this design process with their driverless vehicle pilot in Pittsburgh: the user, sitting in the back of a Volvo XC90, is placed in the middle of the experience. Uber’s process is different to the way Google is testing its vehicles—with emphasis on machine learning and logging driverless, without a member of the public providing feedback.
This got me thinking—what could a transit agency learn from this? How can we ‘onboard’ new transit users and get them to try an alternative mode? How can agencies then learn by capturing and analyzing the data that they collect—and make their riders happy?
At the moment a number of real and perceived pain points prevent people from even considering transit—even those that live close to express bus or railway lines. In many cases, the enthusiasm for transit vastly outweighs the actual usage.
From anecdotes and surveys, many people cite safety as a major barrier, alongside the cleanliness of vehicles and stations—the rider experience can be perceived as somewhat challenging, and vastly different from that offered by Uber and Lyft. Others suggest that they are too disconnected from the network—they live too far from a bus stop or rail station and it’s quicker to drive. Payment can
also be difficult, and is often one of the trickiest aspects of new rider ‘onboarding’ to overcome.
Los Angeles has the TAP smart ticketing system, but, to many, it’s a complicated barrier that they’d rather do without. Trip planning information—the simple answers to ‘what options are available’ and ‘when is my bus/train leaving’ can also be forbidding to a new user.
Many of these barriers to entry could be solved through user experience research and design, as well as the capture of data points and feeding them back into the design and planning process.
In This Issue
UX: the Next Big Thing for Transit? . .1
Designing and Evaluating Land Use Regulations and Transportation Infrastructure using Urban Simulation and Data Science. . . . . .2
Pokémon Go Reinvents Spatial Planning . . . . . . . . . . . .4
Visualizing the Metabolism of a City Using Open Data . . . . . . . . .6
Building a 3D GIS Framework for Planning . . . . . . . .8
Creating Healthier and Smarter Cities: Connecting Cities and Healthcare through Patient Engagement . . . . . . . . . . . . . 11
The Continuing Evolution of Planning Web Technology: Harnessing the Power of Change . . 12
(cont. on page 5)
todayplanning & technologyissue no. 114
SPRING 2017
Designing and Evaluating Land Use Regulations and Transportation Infrastructure using Urban Simulation and Data SciencePaul Waddell, Professor, City and Regional Planning, University of California, Berkeley
S cenario planning has become a widely used approach to engage communities in the process of
envisioning the future and collaboratively shaping a vision for the development of their communities. These efforts often generate a realization among participating citizens that historical development patterns, if used as the template for future development, would adversely impact various outcomes residents value, such as loss of open space, rapid growth in traffic, travel and emissions. While these are laudable objectives for a participatory visioning process, it leaves unanswered large questions about how to achieve the outcomes the community articulates as its objectives.
Urban modeling tools such as UrbanSim were designed to address the latter
question: how might alternative packages of land use regulations and transportation investments help to achieve a set of desired community objectives, taking into consideration how those policies and investments interact with the choices made by the individual and collective stakeholders that have some influence on the way cities actually develop over time? Not unlike the famous (and fun) SimCity game, UrbanSim tries to simulate how urban areas develop, and how those development patterns are shaped by public decisions that the user puts in as a policy scenario, and the cumulated and interacting decisions of millions of individuals, households, and businesses (including developers).
For the intrepid and technically inclined, UrbanSim is an open source software
package available online (www.github.com/UDST/urbansim), as part of the Urban Data Science Toolkit that also contains tools for computing accessibility metrics like walkscore using local streets and roadways (pandana) and transit networks (urbanaccess). For those less inclined to learn programming languages and write their own applications, a team of developers has been creating the UrbanSim Cloud Platform (www.urbansim.com) that enables hosting UrbanSim applications on the cloud, and creating scenarios and visualizing the results in 3D maps, in a web browser. UrbanSim model applications have been pre-built for approximately 400 metropolitan areas in the U.S., using public data and cloud computing to train the models on local data for each metro area. Other versions are being prepared for use anywhere in the world, and will include features to load and share local data, enabling more open planning efforts to build on each other.
UrbanSim is being used in operational planning in numerous metropolitan areas in the United States and internationally. In Paris, France it is being used to evaluate the impacts of the planned Grand Paris Express circumferential metro plan on urban development patterns in the Greater Paris region. In the San Francisco Bay area, it was used to develop two versions of
Over 4 million rental listings collected from November 2016 through March 2017, as rent per square foot.
the Sustainable Communities Strategies planning effort to coordinate land use and transportation investments. In the Bay Area application, we have done further research to evaluate the impacts of transit investments and upzoning around transit stations on the potential for displacement of low income renters, who also happen to be heavy transit users.
This displacement research, funded by the California Air Resources Board, required development of much more detailed treatment of zoning policies, and modeling of development and prices of renter and owner-occupied housing stock, at a parcel level of detail. This level of detail has also made it possible to undertake measurement of the impacts of pedestrian scale land use and transportation networks, and how households and businesses value pedestrian and transit accessibility in making location choices. We are now focusing on adding much more robust models of real estate
development and redevelopment using pro forma analysis to examine how alternative zoning policies interact with accessibility to shape what kinds of real estate projects pencil out, and in particular, how housing affordability is impacted.
We are now in the process of incorporating daily data collection from rental listings and housing sales transactions, to develop continuously updated models of rents and sale prices that better reflect the ongoing and rapidly changing dynamics in metropolitan housing markets. See http://www.ual.berkeley.edu/ for more information on this project, funded by the MacArthur Foundation, and the initial research paper from this work is published online in the Journal of Planning Education and Research. Our objective with this work is to develop online tools to support planning efforts to address a growing housing affordability crisis in many communities. More information on the UrbanSim Cloud Platform is available at www.urbansim.com.
Pedestrian and Transit Network, and Time-Based Job Access in the San Francisco East Bay Area
L ike it or not—Pokémon Go is a game changer. A number of months after it's release, this location-based app
has turned the gaming world on it's head and has created a global tribe of urban explorers. This post will concentrate on how and why this colourful, monster-packed game could also change the spatial planning field, the spatial planning profession and the built environment.
Pokémon Go is a location based gaming app in which users navigate the real world using a representative 3D map in order to search for and capture imaginary creatures called Pokémon. The Pokémon world contains geo-tagged locations known as PokéStops (usually located in public places) where players can battle each other
using their mobile phones. When players do encounter Pokémon in various settings the creatures are superimposed onto a real-world backdrop using augmented reality and smartphone camera technology.
From technological perspective, Pokémon Go is particularly impressive because it combines augmented reality, mobile devices and gaming together with global navigation satellite system (GNSS) positioning. From a geospatial perspective it is even more so. It uses maps which are arguably richer than
either OpenStreetMap or Google maps combined, makes use of geotagging and geofencing for locations, and provides layers of real-world and made-up geospatial data in order to give spaces a whole new dimension.
So what, you might ask, is the connection between the spatial planner and the Pokémon/GIS developer? Well, the spatial planner plans space - he or she decides what should be built where and when it should be built. When making decisions planners try to ensure that spaces are equitable, healthy, safe, inclusive and liveable and their work has far-reaching and long-lasting implications. In doing so planners also confront (and battle) their very own Pokémon in the shape of engineers, architects, developers, community members and policy-makers.
Like these spatial planners the developers behind Pokémon Go are creating new spaces and places. Instead of doing so through policy, zoning and urban design guidelines they are re-imagining spaces through layers of spatial information which is then used by the Pokémon hunters. They are managing to 'activate' spaces which were previously passive and in doing so they are reinventing the built environment.
If the right steps are taken then Pokémon Go has massive potential for planners and for the spatial planning discipline as a whole. Up until now planners have formulated solutions in the real world - through community engagement, policy changes, development plans, urban design strategies and planning enforcement
measures. The arrival of Pokémon Go indicates that the virtual realm is a new battle ground which planners should consider and enter if the discipline is to stay relevant. As well as the potential for creating new urban environments and
for revitalising existing ones, Pokémon Go could provide planners with a new way of engaging with and consulting urban dwellers who may not be involved in standard community consultation processes.
Of key importance is that the new virtual realm will require planners to learn about and engage with the technology and data which was used to create Pokémon Go. With the right skills, tools and a healthy dose of imagination planners could use potentially under-utilised public-domain data to create similar apps which will help reinvent local and wider communities.
What Pokémon Go really demonstrates is that the spatial planning, geospatial and gaming worlds are starting to converge and that planning professionals need to keep up with and better understand the above-mentioned technology and data. Despite this obvious challenge, games like Pokémon Go now allowing everyone to explore and appreciate the world in an entirely new way.
Exciting times ahead.
Originally published on Niall ’s personal blog geobreadbox.com ( July 2016). You can sign up for updates and forthcoming learning resources here.
Niall is an Irish-based Irish/Australian citizen who also works by correspondence for the School for Built Environment at Curtin University, Perth, Australia. Niall ’s background is in geography and urban planning and he has used geospatial technology to support decision-makers in the energy and infrastructure sectors.
Let’s take the payment issue. Why ask the user, who may already use their smartphone to pay for groceries, to sign up to another payment system? Why not allow them to pay for their ticket using a tap of their smartphone? For those who don’t have smartphones, ask them (and be sure to include potential riders) what pain points slow their travel or even prevent them from using transit.
What about that disconnect issue? Transit agencies are working more closely with rideshare and bikeshare companies to integrate first and last mile solutions and, again, payment should be seamless. Partnerships with companies who put
the customer first are potentially a very powerful way of encouraging people to leave their cars at home.
There are also a host of apps out there for trip planning—while many of them are excellent they are suited to existing commuters and keep all the useful user data behind closed doors, so why do transit agencies invest money in websites that fail users?
Steer Davies Gleave’s work in Seattle and San Diego has focused first on the user (both existing and new) and asked them how they interact with the network using online tools and the issues they experience. Take this knowledge and design
accordingly—be bold and look at new ways of presenting information, as well as monitoring impacts through data analysis.
While it is exciting that there are a number of planned infrastructure projects could open up new commute options, agencies in Los Angeles will need to up their UX game. They need to start asking their customers questions, and understanding how they can learn from the step change in user experience that companies such as Uber have created (and the ways that they leverage the data created)—in that way, they may have a better chance of capturing those who are open, but may otherwise never give transit a go.
Visualizing the Metabolism of a City Using Open DataSteve Pepple, Senior Product Designer, OpenGov
W hat makes a place vibrant and livable? How can we use open data, social media, and maps
to explore vibrancy and activity in urban space to inform planning decisions.
Last year, the urban design team Perkins + Will in San Francisco, lead by Gerry Tierney and Noah Friedman, created a innovation grant to work with Steve Pepple (@stevepepple), a Bay Area designer and technologist, to explore how real-time data and media about urban
space would inform urban planning and civic engagement in the design process.
Cities are living and constantly changing organism, so the team explored the analogy of metabolism, the chemical change in cell by which energy is provide for vital processes and activities. Specifically, we explored how vibrancy flows from infrastructure for more basic needs.
Basic needs of a community extend to characteristics of urban space that we can measure with performance indicators:
population density; local economy; mix of residential, retail, cultural, and open spaces; access to education, culture, and rapid transit; access to places that promote health, mental well-being, and fun.
There is a proliferance of data about cities, include user-generated media, open data published by municipalities and agencies, and internet of things data collected by sensors. Array of Things in Chicago, for example, acts as a fitness tracker for the city, collecting data about weather, air quality, noise, light, and pedestrian counts. Combining all this data can tell planners about practically anything about urban space and how people are using it.
The Perkins + Will team used open data to explore the relationship between
density of transit, housing, open spaces, amenities, restaurants, and social activity. They captured data at the regional level and looked a several neighborhoods in San Francisco and Oakland to explore trends.
The team used open data from Mapzen’s transit API and Google Places, to see the connection between population density, transportation, and cultural establishments, such as restaurants, theaters, and shops. The helps to visualize the circulatory or connective tissue of an urban area.
Then the team analyzed hyper-local, real-time media to understand places and pathways of people’s activity in urban spaces. A digital reflection of city life. Our basics senses (sight and sound) allow us to identify neighborhoods and pockets of cities that are full of life, activity, and energy.
The result is software that allows planners to explore these and other data layers in a real-time map. If your are interested in using our tools for analyzing transit, places of interests, and social media on a project, contact Steve Pepple (@stevepepple).
Heat maps of transit frequency by stop, cultural amenities, such as stores and restaurants, activity in social media.
Building a 3D GIS Framework for PlanningEric Brady: GIS Manager, Bergman Associates
T he Cape Cod Commission (CCC) is a regional planning agency supporting the needs of local
communities on Cape Cod, MA. The Commission’s goal is to “keep a special place special,” supporting planning to address the pressures of population growth, economic changes, seasonal visitors and the need for environmental sustainability.
In the summer of 2016, the Commission embarked on an ambitious project to 3D model every structure on the peninsula and implement a dynamic 3D GIS modelling software to support the many different visualization and analysis needs of the Commission’s planning team. The Commission’s GIS Director Anne Reynolds says “We didn’t want to lose the time and effort put into developing our existing GIS datasets, so we really looked for a tool that could leverage our geodatabase and existing planning datasets.”
Most of Cape Cod is dominated by buildings of two stories or fewer. With few exceptions, the taller buildings were built prior to the 20th Century and typically as larger residential structures. That history and expected scale is built into town regulations in a way that makes conversations about greater density and taller buildings difficult. Those same
restrictions also make investment difficult for developers who want to invest and provide affordable housing and commercial opportunities to encourage effective community growth. Executive Director Paul Niedzwiecki says “A vital component in advancing the conversation on greater density is the ability to visualize what that density would look like within the current community environment. An interactive 3D framework allows stakeholders to understand scale and density relative to their street, neighborhood and downtown.”
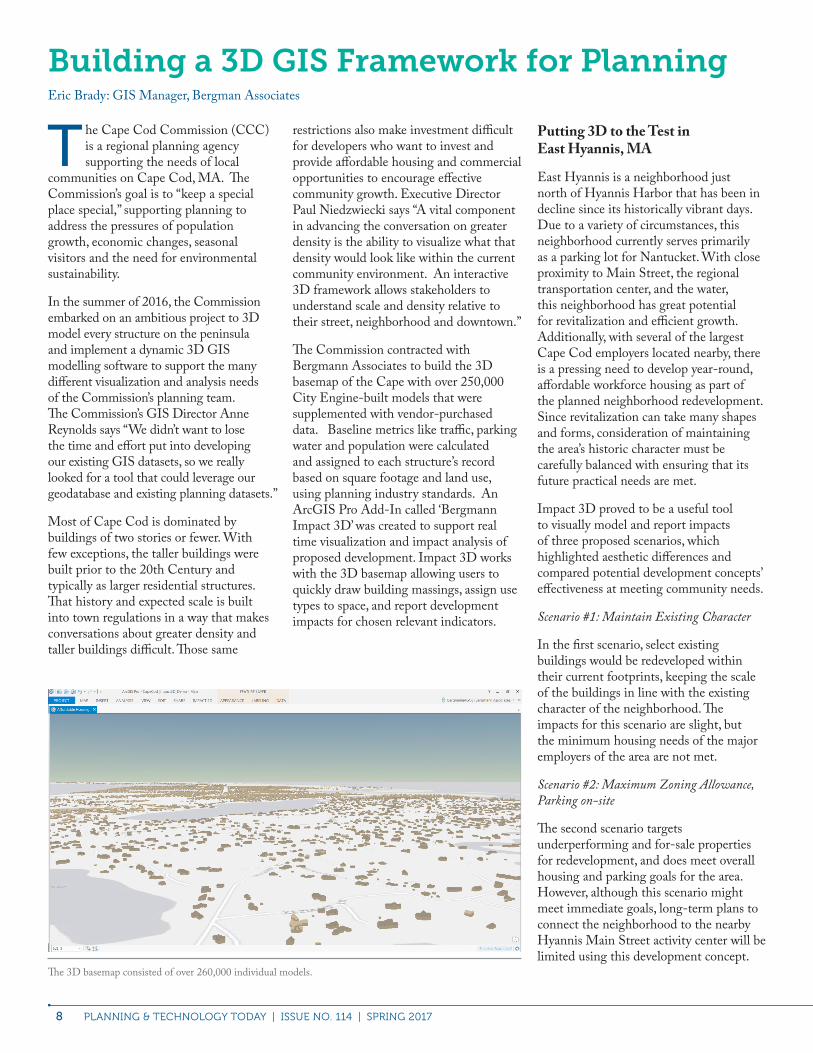
The Commission contracted with Bergmann Associates to build the 3D basemap of the Cape with over 250,000 City Engine-built models that were supplemented with vendor-purchased data. Baseline metrics like traffic, parking water and population were calculated and assigned to each structure’s record based on square footage and land use, using planning industry standards. An ArcGIS Pro Add-In called ‘Bergmann Impact 3D’ was created to support real time visualization and impact analysis of proposed development. Impact 3D works with the 3D basemap allowing users to quickly draw building massings, assign use types to space, and report development impacts for chosen relevant indicators.
Putting 3D to the Test in East Hyannis, MA
East Hyannis is a neighborhood just north of Hyannis Harbor that has been in decline since its historically vibrant days. Due to a variety of circumstances, this neighborhood currently serves primarily as a parking lot for Nantucket. With close proximity to Main Street, the regional transportation center, and the water, this neighborhood has great potential for revitalization and efficient growth. Additionally, with several of the largest Cape Cod employers located nearby, there is a pressing need to develop year-round, affordable workforce housing as part of the planned neighborhood redevelopment. Since revitalization can take many shapes and forms, consideration of maintaining the area’s historic character must be carefully balanced with ensuring that its future practical needs are met.
Impact 3D proved to be a useful tool to visually model and report impacts of three proposed scenarios, which highlighted aesthetic differences and compared potential development concepts’ effectiveness at meeting community needs.
Scenario #1: Maintain Existing Character
In the first scenario, select existing buildings would be redeveloped within their current footprints, keeping the scale of the buildings in line with the existing character of the neighborhood. The impacts for this scenario are slight, but the minimum housing needs of the major employers of the area are not met.
Scenario #2: Maximum Zoning Allowance, Parking on-site
The second scenario targets underperforming and for-sale properties for redevelopment, and does meet overall housing and parking goals for the area. However, although this scenario might meet immediate goals, long-term plans to connect the neighborhood to the nearby Hyannis Main Street activity center will be limited using this development concept.
The 3D basemap consisted of over 260,000 individual models.
Finally, scenario three considers the way the neighborhood interacts with the surrounding area and what a successful community needs in the long term. This scenario attempts to recreate a historic grid and leverage the under-utilized interior parcels by threading a multiuse path through the midsection of the neighborhoods, connecting the hospital and ferry parking lots to the nearby historic downtown and harbor.
Unlike the other scenarios, significant commercial space is added and buildings are more densely clustered, maintaining footprints similar to the existing buildings and helping to preserve the architectural character of the neighborhood.
The Advantages to 3D GIS for Planning
While each of these plans is still in a review phase, the use of ArcGIS Pro and Impact 3D has allowed the Commission to quickly develop and share plans with stakeholders early in the planning process.
Deputy Director Kristy Senatori notes, “With a 3D Planning framework we are able to take the plans of our development partners and quickly create representative visualizations, impact analytics and work with our constituents to ensure plans meet the needs of a diverse audience of stakeholders.” Although in the past such scenario planning may have involved a complex network of GIS staff and applications, 3D visualization and database management have been built into a robust yet user-friendly tool that seamlessly operates in conjunction with the Commission’s existing Esri platform.
Creating Healthier and Smarter Cities: Connecting Cities and Healthcare through Patient EngagementNader Afzalan, PhD, Chair, American Planning Association-Technology Division,Visiting Assistant Professor, University of Redlands and Chethan Sarabu, MD, Clinical Informatics Fellow, Stanford Medicine, Pediatrician
W e present a novel collaborative strategy for rethinking citizen engagement at the intersection
of planning and healthcare. Citizen engagement has been always challenging for planning organizations due to various considerations, including the organizations’ limited resources or the citizens’ lack of interest in participation. This challenge still exist even in the era of smart cities when organizations and citizens are commonly using new technologies to facilitate collaboration (Afzalan & Evans-Cowley, 2015). New communication technologies (e.g. online participatory tools and social media) can greatly help the planning organizations by providing more accessible engagement opportunities for citizens and ready-to-use data for planners. On the other hand, they may create challenges. For example, cities and planning organizations may not be ready for big data analysis or may not be fully aware of ethical and privacy issues of engaging citizens
through online technologies (Afzalan, 2015). To deal with this complexity, cities need to find partners to help them with this challenging and time consuming process through inter-organizational collaborations. In this essay, we suggest a framework for connecting ideas of citizen engagement and patient engagement to discuss how cities and healthcare organizations can collaborate on a joint mission: creating healthier communities.
We suggest the development of a participatory GIS application to facilitate the communication between healthcare organizations and cities. The web-GIS application would allow patients to share their ideas, likes, and dislikes about their neighborhood by creating comments on a map, when they are waiting for their doctor visit. The application could also display other place-based information for the doctor, such as neighborhood walkability, crime rate, pollution, noise level, or
demography. The comments gathered from patients could be used by their primary care doctor to explore whether and how the environmental factors may be related to patients’ health. For example, air pollution may be the culprit that frequently sends a patient with asthma to the emergency room even if they take their medication. Understanding this geographic based information is important for a physician in order to provide more targeted advice. Ultimately the physician and patient would like to move upstream and mitigate this air pollution in the first place. That is generally beyond the scope of what the healthcare organization can do and requires going to the city or county. A web-GIS tool would allow information gathered from patients to be shared in a de-identified way with the city to incorporate into their decision making process. If many residents of a particular neighborhood are affected by asthma, the city can use this information to come up with feasible strategies to respond to the issue. The web- GIS application helps the doctors, the hospital administrators, and the planners make decisions that will positively impact community health. While the hospitals will benefit from this process by learning more about patients’ living environment (Macintyre et al, 2002) , they will be a great collaborator in helping cities create healthier neighborhoods.
References:
Afzalan, N. (2015). Participatory Plan Making: Whether And How Online Participatory Tools Are Useful. Colorado Denver.
Afzalan, N., & Evans-Cowley, J. (2015). Planning and Social Media: Facebook for Planning at the Neighbourhood Scale. Planning Practice & Research, 30(3), 270–285.
Macintyre, S., Ellaway, A., & Cummins, S. (2002). Place effects on health: how can we conceptualise, operationalise and measure them?. Social science & medicine, 55(1), 125-139.
From patient engagement to citizen engagement for community health
The Continuing Evolution of Planning Web Technology: Harnessing the Power of ChangeWilliam Riggs, Ph.D., California Polytechnic State University, San Luis Obispo
Emerging technologies are fundamentally changing how we plan, develop, and manage our
cities, as cities around the globe continue to urbanize and become more smart and connected. Given trends of increasing mobile use, local governments and public bodies officials (and particularly city planners) are continually being require to adopt and use new technologies to plan, communicate and engage with citizens—in essence an ec. In this context we partnered with the American Planning Association Information Technology Division to evaluate and benchmark the use of web technology in city planning departments across the United States, looking both at web use trends as of 2017 and how they have changed since 2015 (Riggs, Steins, & Chavan, 2015).
Using 11 key indicators, discussed in
more depth in a peer-reviewed articles by Cabral, Chavan, Clarke, & Greacen (2012) and Riggs (2016), to evaluate over 600 cities across the United States Chris Steins (Urban Insight, Inc.), Abhijeet Chavan (Planetizen) and I found substantive changes in how planners are communicating with the public. One of the most pronounced changes was the move towards response design of websites. Responsive web design is the gold standard for building a website, given that as of 2015 more people access the Internet via mobile phones and tablets than desktop computers. It allows for information to adapt to various screen sizes and devices. 59 percent of planning departments now have a mobile responsive website. This is a dramatic rise of 44 percent; up from 15 percent in 2015.
Our team saw similar increases use
of social media, online GIS tools and e-permitting capacity. With regard to use of social media, 14 percent of all cities have some form of dedicated social media for planning; this was up from 10 percent in 2015. This trend was more pronounced, however for large cities, where use has almost doubled—increasing from 17 to 32 percent. The number of cities with GIS property lookup capability rose 7 percent to 47 percent as we predicted, up from 40 percent. Finally, there was also a large increase in online permitting available. While the majority of cities (65 percent) do not support online permitting, there was a dramatic increase in the number of cities offering such services. 35 percent of the cities surveyed had online permitting capacity which was up from 21 percent.
More details can be found in our full report, accessible on Planetizen at: https://www.planetizen.com/node/90628/. Yet these results warrant thoughtful action. Given increasing change, planners and policy makers should expect to see continued evolution of how we do business. City planning is one of the most intimate forms of government in how it engages with citizens about the components that frame where they live. And in an era were data and mobile access is continuing to proliferate, we anticipate that this evolution will not only continue but accellerate. Web-based tools for planning are becoming more refined and defined. In the last few years planners have seen tools such as RideScout evolve in to Moovel, Mindmixer transition to mySidewalk and conduits such as Loopnet and OpportunitySpace give way to tools such as Oppsites.
In this light, civil servants of all types (not just planners) my team suggests the following actionable responses.
• If you are building a new website, be certain that it uses responsive design ad consider using a content management system to facilitate mobile delivery of information.
• If you are considering updating the city's zoning code or general plan, budget and plan-for the use of an appropriate online / digital publishing platform.
• Explore online permitting and online geographic information systems as they
Zoning Code Management Systems Used on City Planning Department Websites by City Size
become increasingly available through evolving technological tools.
• Consider identifying a tech-savvy team member to champion new approaches and technology.
The field of civic technology, "civic tech," has grown significantly in the last five years, and consistent with Moore’s Law this growth will continue. Planners and policy makers ultimately need to be continuing to education themselves about the latest innovations and tools and exploring what they mean to practice. While they may not hold all the answers or ever supplant the power of the face-to-face public meeting, by staying nimble to these changes and understanding new tools, our professional can best harness their power.
References:
Cabral, J. E., Chavan, A., Clarke, T. M., & Greacen, J. (2012). Using Technology to Enhance Access to Justice. Harvard Journal of Law & Technology, 26, 241.
Riggs, W. (2016). Mobile responsive websites and local planning departments in the US: Opportunities for the future. Environment and Planning B: Planning
and Design, 265813516656375. https://doi.org/10.1177/0265813516656375
Riggs, W., Steins, C., & Chavan, A. (2015). City Planning Department Technology
Benchmarking Survey 2015. Retrieved May 20, 2015, from http://www.planetizen.com/node/73480/city-planning-department-technology-benchmarking-survey-2015
City Planning Departments with Dedicated Social Media Channels by City Size