18
Planning.Maryland.gov MARYLAND’S HISPANIC POPULATION AND THOSE ELIGIBLE TO VOTE
| Date post: | 24-Dec-2015 |
| Category: |
Documents |
| Upload: | alban-little |
| View: | 214 times |
| Download: | 1 times |

Planning.Maryland.gov
MARYLAND’S HISPANIC POPULATION AND THOSE ELIGIBLE TO VOTE
Planning.Maryland.gov
GROWTH IN MARYLAND’S HISPANIC POPULATION
Hispanics had both the largest numeric gain and the largest percentage increase in population in Maryland over the 2000 to 2012 period. During this 12-year period, the Hispanic population grew by just over 284,000, or almost 125 percent.
Planning.Maryland.gov
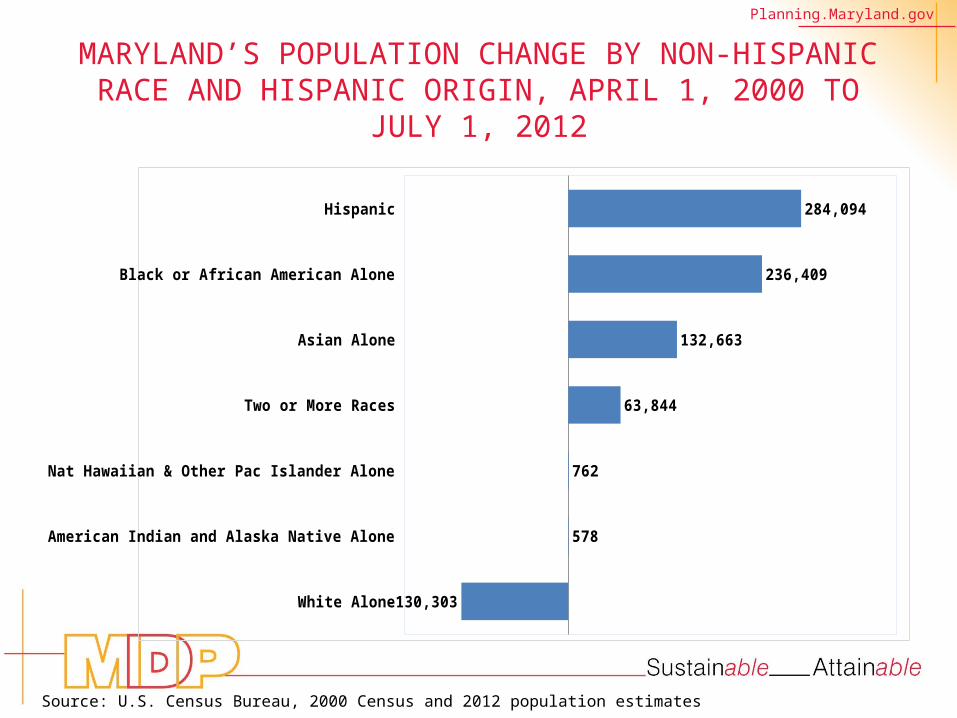
MARYLAND’S POPULATION CHANGE BY NON-HISPANIC RACE AND HISPANIC ORIGIN, APRIL 1, 2000
TO JULY 1, 2012
White Alone
American Indian and Alaska Native Alone
Nat Hawaiian & Other Pac Islander Alone
Two or More Races
Asian Alone
Black or African American Alone
Hispanic
-130,303
578
762
63,844
132,663
236,409
284,094
Source: U.S. Census Bureau, 2000 Census and 2012 population estimates

Planning.Maryland.gov
MARYLAND’S PERCENT POPULATION CHANGE BY NON-HISPANIC RACE AND HISPANIC ORIGIN, APRIL 1,
2000 TO JULY 1, 2012
White Alone
American Indian and Alaska Native Alone
Black or African American Alone
Nat Hawaiian & Other Pac Islander Alone
Asian Alone
Two or More Races
Hispanic
-3.9%
4.2%
16.0%
37.6%
62.0%
102.1%
124.6%
Source: U.S. Census Bureau, 2000 Census and 2012 population estimates

Planning.Maryland.gov
GROWTH IN MARYLAND’S HISPANIC POPULATION
Put into the context of overall population change for Maryland during this time period, Hispanics made up nearly one-half (48.3%) of the total net change in population (588,047)between 2000 and 2012.

Planning.Maryland.gov
HISPANIC GROWTH AS A PERCENT OF TOTAL NET POPULATION GAIN IN MARYLAND, APRIL 1, 2000 TO
JULY 1, 2012
48%52%
Hispanic Share All Other Share
Source: U.S. Census Bureau, 2000 Census and 2012 population estimates
Planning.Maryland.gov
GROWTH IN MARYLAND’S HISPANIC POPULATION
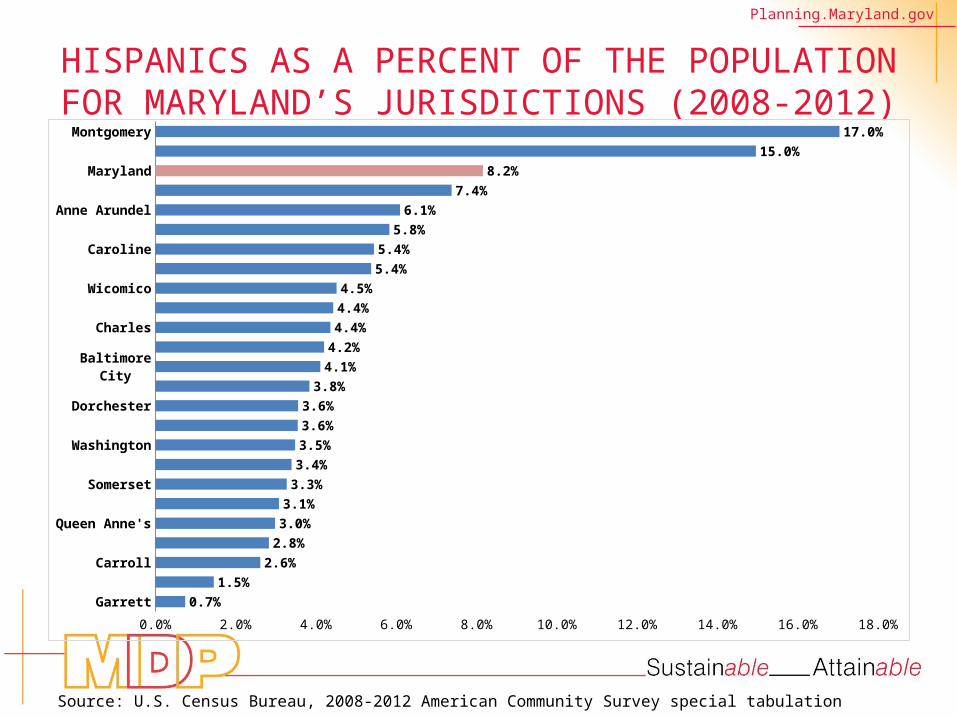
But because the growth of Hispanics in Maryland is a recent phenomenon, the Hispanic share of the overall population is only just over 8 percent in 2012, although for two jurisdictions, Montgomery (17.0%) and Prince George’s (15.0%) counties, it’s much higher.
Planning.Maryland.gov
HISPANICS AS A PERCENT OF THE POPULATION FOR MARYLAND’S JURISDICTIONS (2008-2012)
GarrettAllegany
CarrollCalvert
Queen Anne'sWorcesterSomerset
CecilWashington
HarfordDorchester
St. Mary'sBaltimore City
BaltimoreCharles
KentWicomico
TalbotCarolineHoward
Anne ArundelFrederickMaryland
Prince George'sMontgomery
0.0% 2.0% 4.0% 6.0% 8.0% 10.0% 12.0% 14.0% 16.0% 18.0%0.7%
1.5%2.6%
2.8%3.0%3.1%
3.3%3.4%3.5%3.6%3.6%
3.8%4.1%4.2%
4.4%4.4%4.5%
5.4%5.4%
5.8%6.1%
7.4%8.2%
15.0%17.0%
Source: U.S. Census Bureau, 2008-2012 American Community Survey special tabulation

Planning.Maryland.gov
MARYLAND’S VOTING-ELIGIBLE HISPANIC POPULATION
While Hispanics are a growing share of the State’s population, they are not yet proportionately represented in the voting-eligible population because they tend to 1) have a higher proportion of their population under age 18, and 2) a majority of Hispanics statewide over the age of 18 are not citizens.

Planning.Maryland.gov
PERCENT OF THE POPULATION LESS THAN 18 YEARS OF AGE BY RACE/HISPANIC ORIGIN FOR MARYLAND,
2008-2012
White Alone Asian Alone Black or African American Alone Hispanic or Latino0.0%
5.0%
10.0%
15.0%
20.0%
25.0%
30.0%
35.0%
19.9%
22.3%
25.8%
31.6%
Source: U.S. Census Bureau, 2008-2012 American Community Survey special tabulation

Planning.Maryland.gov
PERCENT OF HISPANICS AGES 18+ WHO ARE CITIZENS BY MARYLAND JURISDICTION (2008-2012)
CarolineDorchester
Prince George'sWicomico
KentQueen Anne's
MarylandMontgomery
Baltimore CityTalbot
BaltimoreAnne Arundel
WorcesterFrederick
HowardCarroll
WashingtonSomerset
CharlesHarford
AlleganyGarrett
St. Mary'sCecil
Calvert
0.0% 10.0% 20.0% 30.0% 40.0% 50.0% 60.0% 70.0% 80.0% 90.0%26.0%
33.3%33.5%
41.6%42.2%
43.2%46.9%47.1%
48.5%50.0%
51.8%52.8%
55.1%56.8%
64.9%66.3%66.5%66.9%
72.1%76.1%
77.1%79.3%79.8%80.0%
83.6%
Source: U.S. Census Bureau, 2008-2012 American Community Survey special tabulation

Planning.Maryland.gov
Planning.Maryland.gov
MARYLAND’S VOTING ELIGIBLE HISPANIC POPULATION
Therefore, while Hispanics make up just over 8 percent of Maryland’s overall population, they make up 7 percent of those 18 and over, and just under 4 percent of those who are age 18 and over and who are citizens.
For Montgomery County, where Hispanics make up more than one out of six of the total population, those eligible to vote are less than one out of 10. For Prince George’s County, Hispanics are 15 percent of the total population but only a bit more than 5 percent of the voting eligible population.

Planning.Maryland.gov
HISPANICS AGES 18 AND OVER AS A PERCENT OF THE TOTAL POPULATION AGES 18 AND OVER (2008-2012)
GarrettAllegany
CarrollCalvert
Queen Anne'sWorcester
CecilWashington
SomersetDorchester
HarfordSt. Mary'sBaltimore
Baltimore CityCharles
WicomicoKent
CarolineTalbot
HowardAnne Arundel
FrederickMaryland
Prince George'sMontgomery
0.0% 2.0% 4.0% 6.0% 8.0% 10.0% 12.0% 14.0% 16.0% 18.0%0.6%
1.4%2.2%2.3%
2.5%2.5%
2.8%2.8%2.9%3.0%3.0%
3.3%3.6%
3.8%3.8%3.8%3.8%
4.4%4.5%
5.2%5.3%
6.4%7.3%
13.4%15.7%
Source: U.S. Census Bureau, 2008-2012 American Community Survey special tabulation

Planning.Maryland.gov
HISPANICS ELIGIBLE TO VOTE AS A PERCENT OF ALL ELIGIBLE VOTERS BY MARYLAND JURISDICTION,
(2008-2012)
GarrettDorchester
AlleganyQueen Anne's
CarolineWorcester
CarrollKent
WicomicoWashington
Baltimore CityCalvert
BaltimoreSomerset
CecilTalbot
HarfordSt. Mary's
CharlesAnne Arundel
HowardMarylandFrederick
Prince George'sMontgomery
0.0% 1.0% 2.0% 3.0% 4.0% 5.0% 6.0% 7.0% 8.0% 9.0% 10.0%0.5%
1.0%1.1%1.1%1.2%
1.4%1.5%
1.7%1.7%
1.9%2.0%2.0%2.0%2.0%
2.3%2.3%2.4%
2.7%2.8%
2.9%3.7%3.7%
3.9%5.3%
9.2%
Source: U.S. Census Bureau, 2008-2012 American Community Survey special tabulation

Planning.Maryland.gov
MARYLAND’S VOTING-ELIGIBLE HISPANIC POPULATION
In the next couple of decades, however, Hispanics will become a greater force in the electorate, as those under age 18 become 18 and over, and since the vast majority of those now under age 18 are already citizens (89.7%).

Planning.Maryland.gov
PERCENT OF HISPANICS UNDER AGE 18 WHO ARE CITIZENS, BY MARYLAND JURISDICTION, 2008-2012
BaltimoreMontgomery
DorchesterPrince George's
FrederickAllegany
MarylandCarroll
Anne ArundelBaltimore City
WicomicoWashington
WorcesterTalbot
HowardCarolineHarfordCharles
Queen Anne'sCecil
CalvertKent
St. Mary'sSomerset
Garrett
80.0% 85.0% 90.0% 95.0% 100.0% 105.0%87.5%
88.0%88.6%
88.9%89.3%
89.6%89.7%89.8%
90.1%91.2%
93.1%93.1%93.2%
94.7%95.1%
95.7%96.0%
97.4%98.0%
98.5%100.0%100.0%100.0%100.0%100.0%
Source: U.S. Census Bureau, 2008-2012 American Community Survey special tabulation

Planning.Maryland.gov
From the 2008-2012 5-Year American Community Survey ACS)
This is a special tabulation providing data on the citizen voting age population and other data from the 2008_2012 5-year American Community Survey (ACS). The ACS is the replacement for the decennial census long form. This is the fourth release of this special tabulation of ACS data. The first used the 2005-2009 5-year ACS data, the second used the 2006-2010 5-year ACS data, and the third used the 2007-2011 5-year ACS data. Data from all four releases are available on the Census Bureau’s Redistricting Office web site, http://www.census.gov/rdo/data/voting_age_population_by_citizenship_and_race_cvap.html
CITIZEN VOTING AGE POPULATION (CVAP) SPECIAL TABULATION


