66
Plant Optimization & Performance Software

Plant Optimization & Performance Software
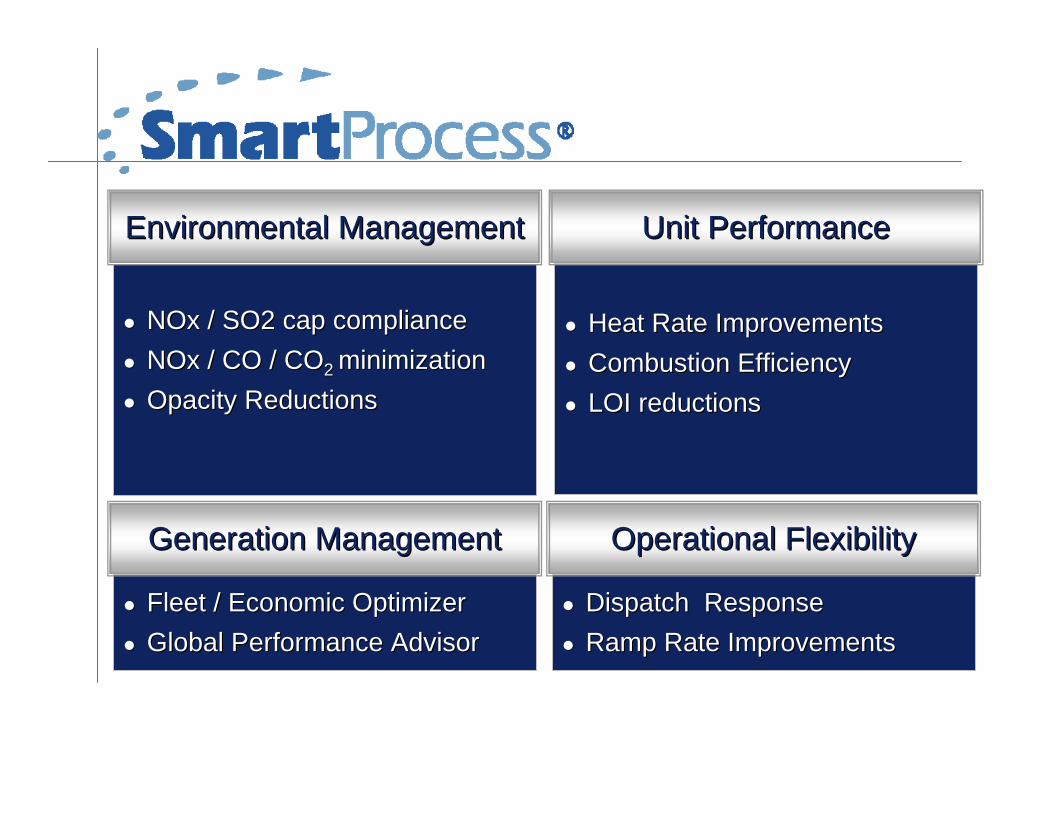
NOx / SO2 cap compliance NOx / SO2 cap compliance NOx / CO / CONOx / CO / CO2 2 minimizationminimizationOpacity ReductionsOpacity Reductions
Environmental ManagementEnvironmental Management
Heat Rate ImprovementsHeat Rate ImprovementsCombustion EfficiencyCombustion EfficiencyLOI reductions LOI reductions
Unit PerformanceUnit Performance
Dispatch Response Dispatch Response Ramp Rate ImprovementsRamp Rate Improvements
Operational FlexibilityOperational Flexibility
Fleet / Economic OptimizerFleet / Economic OptimizerGlobal Performance AdvisorGlobal Performance Advisor
Generation ManagementGeneration Management

A Comprehensive Suite of Intelligent A Comprehensive Suite of Intelligent Software Modules Designed to Improve Software Modules Designed to Improve Plant PerformancePlant Performance
Combustion Optimizer
Steam Temperature Optimizer
Sootblower Optimizer
Economic Optimizer
Fleet Optimizer
Cyclone Boiler Optimizer
Unit Response Optimizer
SCR and FGD Optimizer
Fluidized Bed Optimizer
Enterprise Data Server
Precipitator Optimizer
Global Performance Advisor

BenefitsBenefitsBenefitsHeat rate improvements 1/2% to 1 1/2%NOx Reductions 15% to 35% Opacity Reductions 15% to 30%Increased Capacity 1% to 2%1% of MCR per minute improvement in ramp rateReduced tube leaks and associated forced outagesImprove fleet management capabilitiesOptimize plant environmental equipment such as SCRs and scrubbers

AES Alliant Energy Ameren Energy Generating American Electric Power Constellation Power Source Generation Dairyland Power Cooperative Duke Power Dynegy Power Generation Eastman Kodak (Tennessee Eastman) Edison Mission Energy Electric Energy Inc. Elektrownia im. T. Kosciuszki S.A. Elektrownia Kozienice, S.A. Entergy Louisiana Florida Power & Light Grand River Dam Authority Keyspan Energy Korea Electric Power Corporation (KEPCO) MidAmerican Energy Mirant Corporation Nevada Power Panda Energy International PSEG Power Public Service of New Hampshire Saudi Electric Company Seminole Electric Cooperative Sempra Energy Resources Southern California Edison University of Michigan We Energies Xcel Energy Zespol Elektrownia Ostroleka, S.A.
Years of experience in process control design, implementation, and field installationYears of experience in process control design, Years of experience in process control design, implementation, and field installationimplementation, and field installation
With more than 200 SmartProcess With more than 200 SmartProcess installations on many different installations on many different
control systems, Emerson is the control systems, Emerson is the market leadermarket leader in advanced control.in advanced control.

Automated testing tools for quick, efficient implementation
Closed loop integration – Integrates directly with any DCS or can be deployed via other protocols like OPC or
OSISoft PI
Browser-based user interfaces
Advanced control and optimization solutions incorporate fuzzy logic, neural networks, model predictive
control, and optimization engines designed specifically for the power industry needs
What makes SmartProcess different?What makes SmartProcess different?What makes SmartProcess different?

What makes SmartProcess different?What makes SmartProcess different?What makes SmartProcess different?
Dynamic routines that steady-state approaches cannot match – Optimizer runs every 10 to 20 seconds,
outperforming all other comparable products
Versatility to optimize for multiple objectives under varying conditions
DCS platform independent
Adapts and learns changing plant conditions

What makes SmartProcess different?What makes SmartProcess different?What makes SmartProcess different?
Easily upgraded with base plant control system upgrades/migrations
Data validation tools and comprehensive supportcapabilities available
No daily maintenance – SmartProcess self adapts to the subtle long term changes in the plant dynamics
DeploymentDeploymentDeploymentPlatform independence allows SmartProcess to be implemented on Ovation, WDPF or any other distributed control systemIntegration by Emerson Process Management personnel – Each team includes a boiler/combustion expert, a DCS field
engineer to perform DCS changes, and a neural network/optimization expert for model building and on-line tuning
Implementation includes an initial site analysis, and can be completed in less than 3 monthsNon-intrusive implementation (I.e. no outage required, can be easily turned on or off)Low maintenance costs - 1 year 100% support– No runtime fees– No maintenance fees

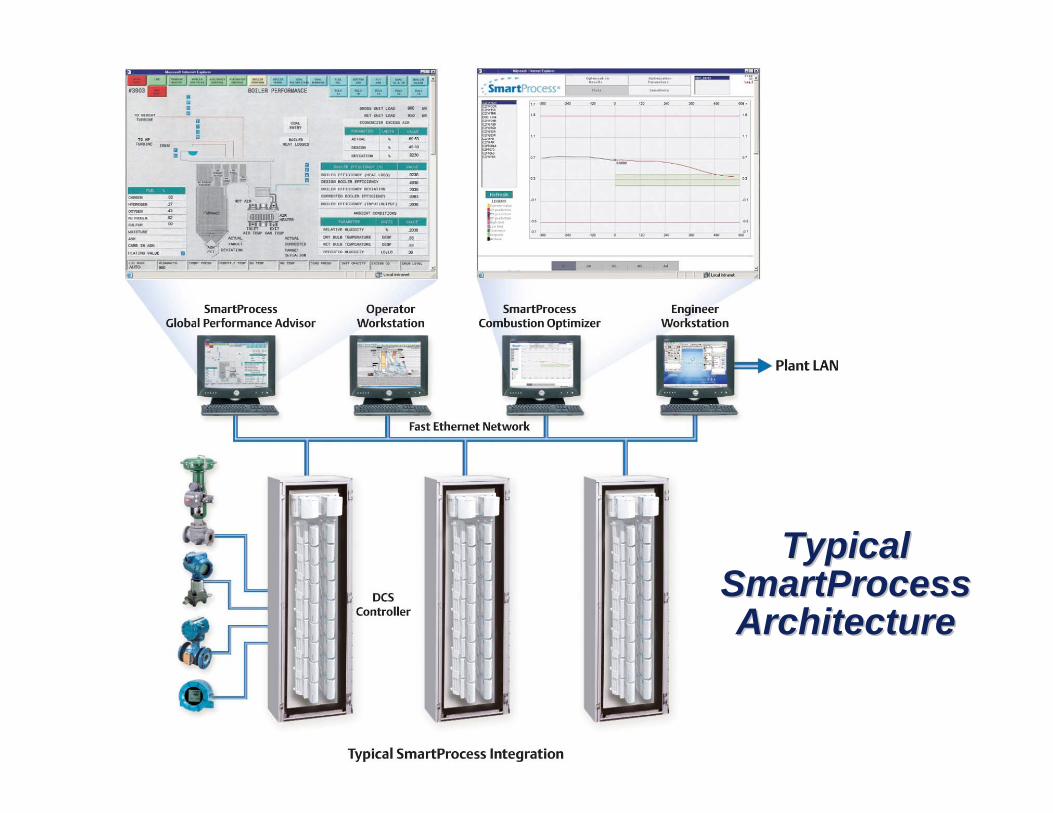
Typical SmartProcess Architecture
Typical Typical SmartProcess SmartProcess ArchitectureArchitecture
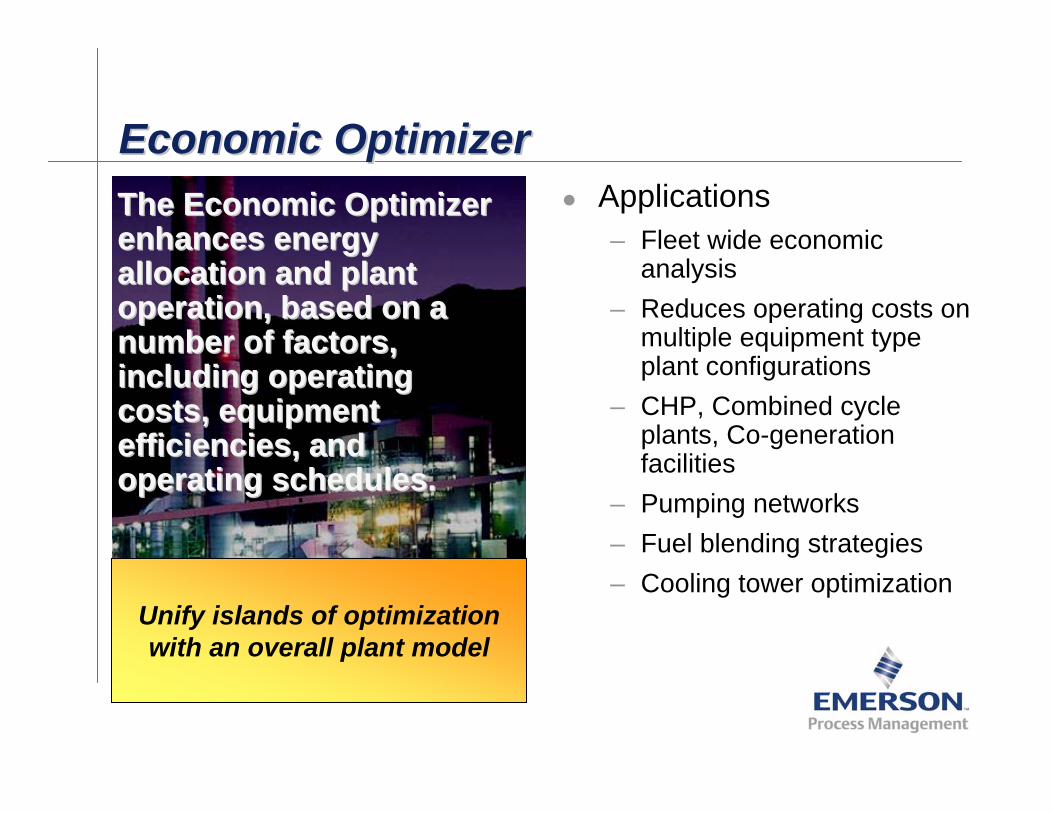
The Economic Optimizer The Economic Optimizer enhances energy enhances energy allocation and plant allocation and plant operation, based on a operation, based on a number of factors, number of factors, including operating including operating costs, equipment costs, equipment efficiencies, and efficiencies, and operating schedules.operating schedules.
Economic OptimizerEconomic OptimizerEconomic OptimizerApplications– Fleet wide economic
analysis– Reduces operating costs on
multiple equipment type plant configurations
– CHP, Combined cycle plants, Co-generation facilities
– Pumping networks– Fuel blending strategies– Cooling tower optimization
Unify islands of optimization with an overall plant model

Fleet OptimizerFleet OptimizerFleet Optimizer
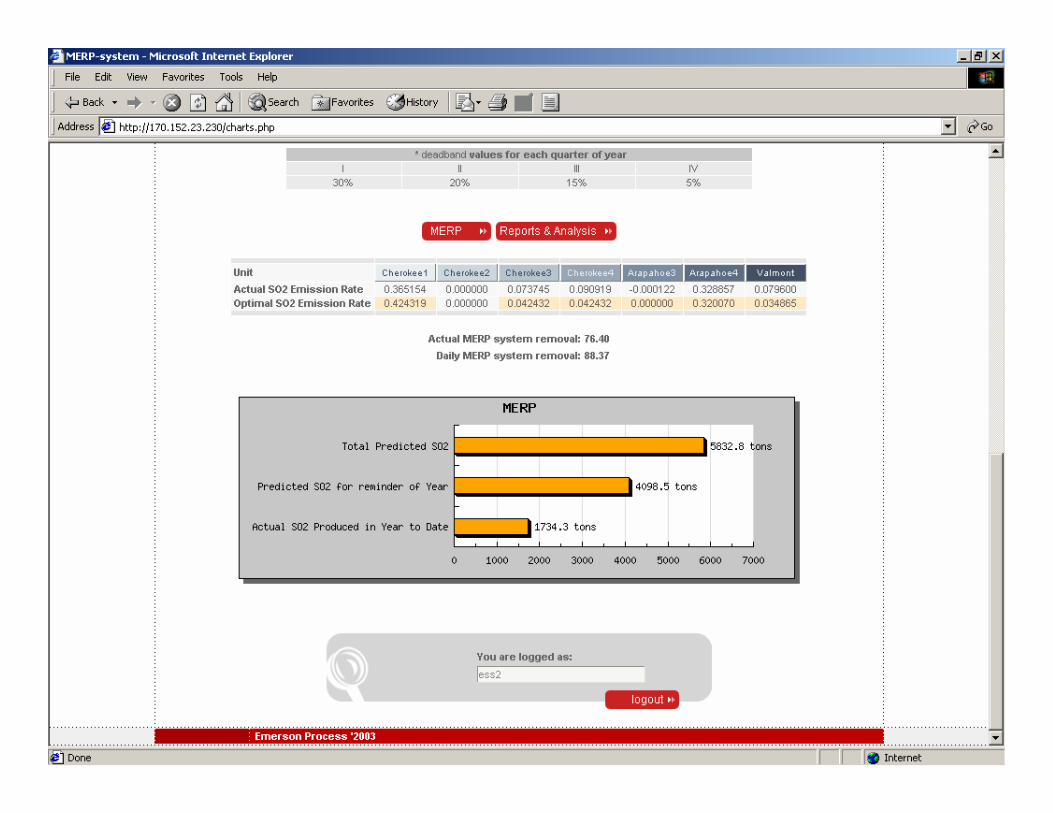
The Fleet Optimizer The Fleet Optimizer manages manages environmental environmental compliance on a compliance on a fleetfleet--wide scale with wide scale with portal technologyportal technology..
Results– Replicates and/or
diversifies calculations used for business decisions
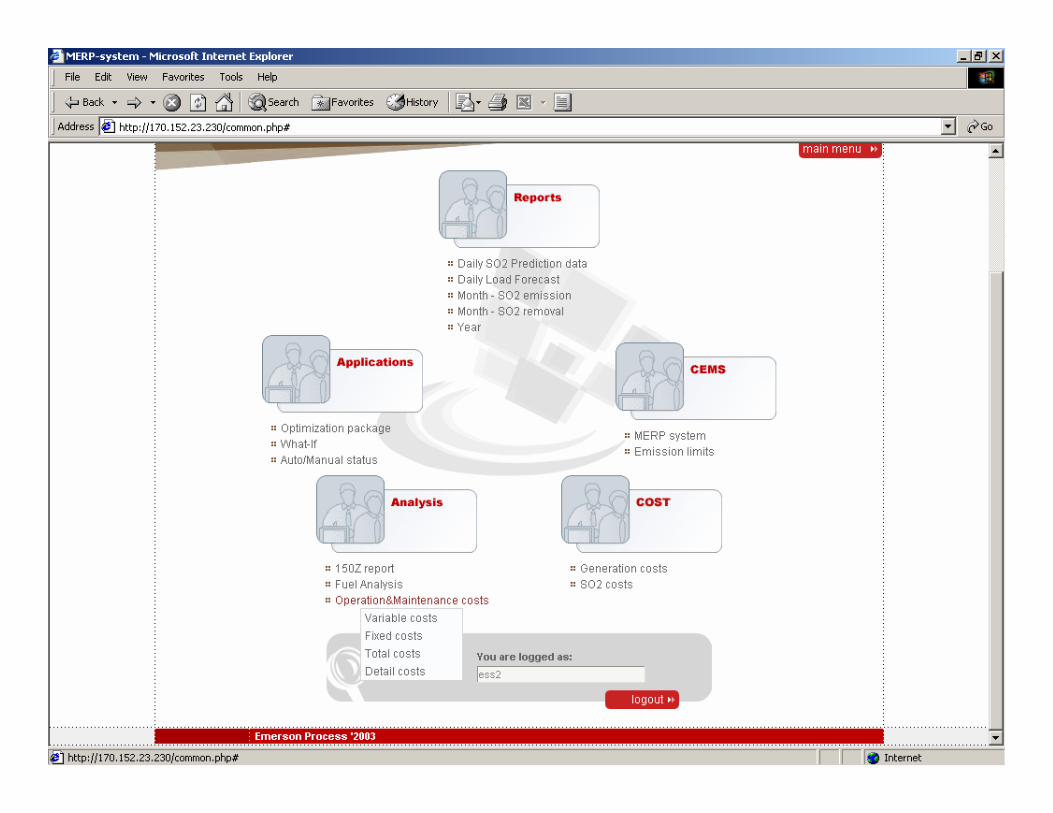
– Provides reporting for O&M costs and real time heat rate
– Predicts emission cap compliance based on load forecasts
– Actively optimizes plant settings to achieve desired compliance target margins
– Provides data redundancy of key variablesOperate cost-effectively while
achieving SO2 or NOx compliance.

Optimizing Fleet-Wide ControlOptimizing FleetOptimizing Fleet--Wide ControlWide ControlThe Fleet Emissions Optimizer uses data from multiple areas of the plant for fleet to achieve industry objectives.
Environmental ComplianceDecreased Operations CostsIncreased Profitability SmartProcess
Standalone Server

The Fleet Emissions Optimizer collects data from segregated areas throughout the fleet…The Fleet Emissions Optimizer collects data The Fleet Emissions Optimizer collects data from segregated areas throughout the fleetfrom segregated areas throughout the fleet……
Operating Labor CostsHeat Rate PenaltiesMaintenance CostsCurrent Emissions RateEmissions Cap ComplianceChanging Plant Conditions
…… and tracks and tracks fleet performance fleet performance over time to over time to create an create an efficiency curve efficiency curve that adjusts with that adjusts with daily operations daily operations and plans for and plans for future scenarios.future scenarios.

Fleet Emissions Optimization ObjectivesFleet Emissions Optimization Fleet Emissions Optimization ObjectivesObjectives
Determine optimum SO2 emission rate for FGD systems so that the total amount of SO2 produced does not exceed the yearly capReport and control for removal efficiency >70% Optimize for the most cost effective flue gas scrubbing

Fleet Optimizer ArchitectureFleet Optimizer ArchitectureFleet Optimizer Architecture
Enterprise Data Server
DCS or DAS
Enterprise Data Serverconnect
Enterprise Data ServerClient Terminals

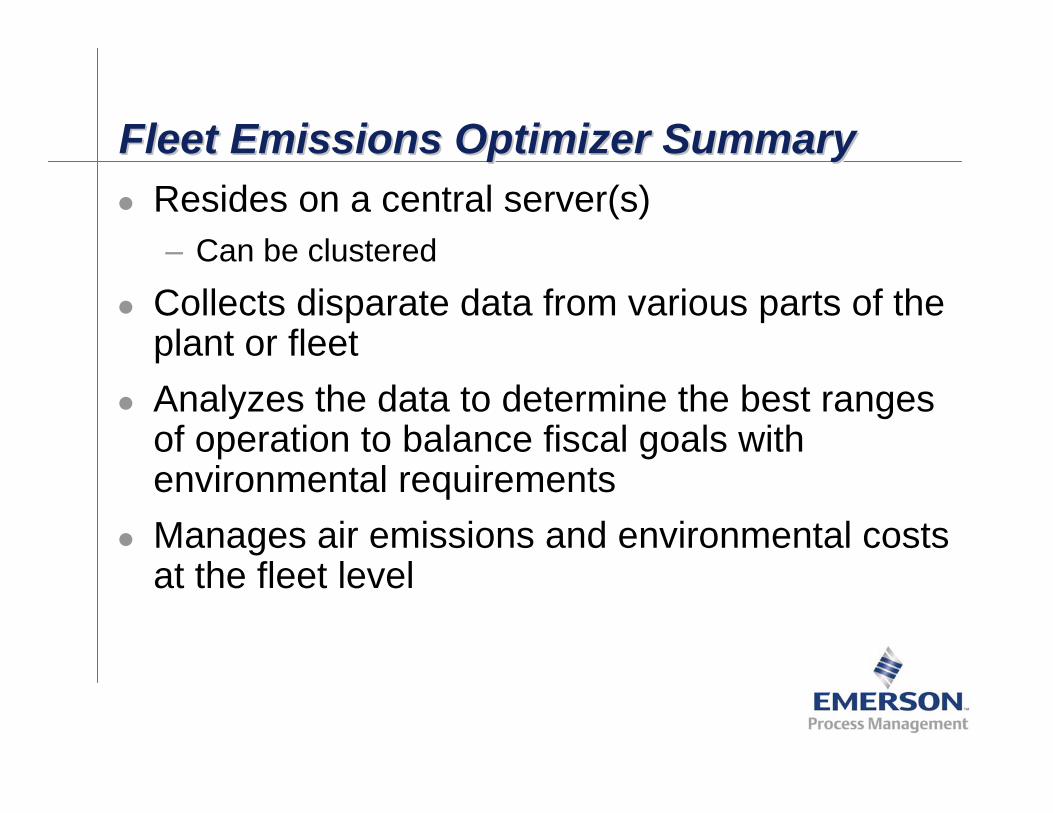
Fleet Emissions Optimizer SummaryFleet Emissions Optimizer SummaryFleet Emissions Optimizer SummaryResides on a central server(s)– Can be clustered
Collects disparate data from various parts of the plant or fleetAnalyzes the data to determine the best ranges of operation to balance fiscal goals with environmental requirementsManages air emissions and environmental costs at the fleet level

Plant CUnits 3 & 4
Performance calculationsUser input dataDistributed Link
DCS Link
WWW
Plant A1 & 2
Performance calculationsUser input dataDistributed Link
DCS Link
WWW
Plant B Unit 5
Performance calculationsUser input dataDistributed LinkDCS Link
WWW
Performance calculationsUser input dataDistributed LinkDCS Link
WWW
HQ
LinuxApplication serverOracle or my SQLData StorageDistributed LinkELD@SolutionFuel Policy@Solution
Web serverInterface generatorDistributed LinkPortal@Solution
PC ClientsUser input data
GUI
Customerintranet
WWW
Plant A3 & 4
WWW


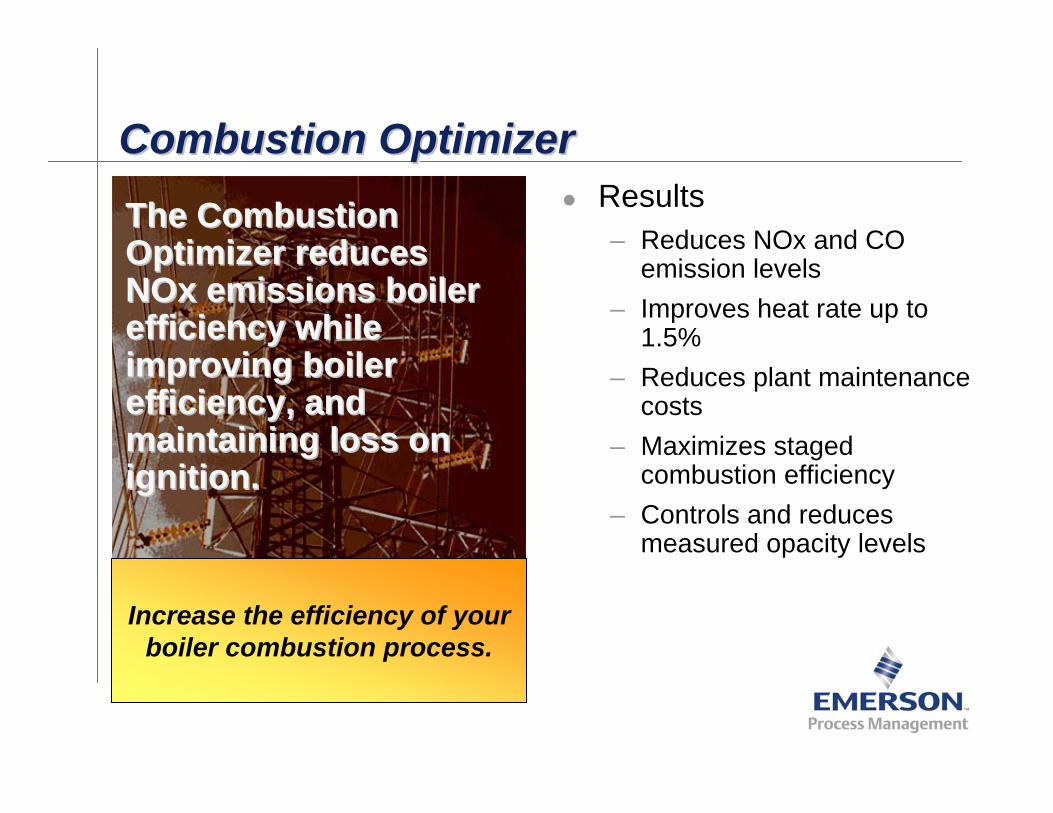
Combustion OptimizerCombustion OptimizerCombustion OptimizerResults– Reduces NOx and CO
emission levels– Improves heat rate up to
1.5%– Reduces plant maintenance
costs– Maximizes staged
combustion efficiency– Controls and reduces
measured opacity levels
The Combustion The Combustion Optimizer reduces Optimizer reduces NOx emissions boiler NOx emissions boiler efficiency while efficiency while improving boiler improving boiler efficiency, and efficiency, and maintaining loss on maintaining loss on ignition.ignition.
Increase the efficiency of your boiler combustion process.

Combustion Optimizer tools:SmartEngineCombustion Optimizer Combustion Optimizer tools:SmartEnginetools:SmartEngine
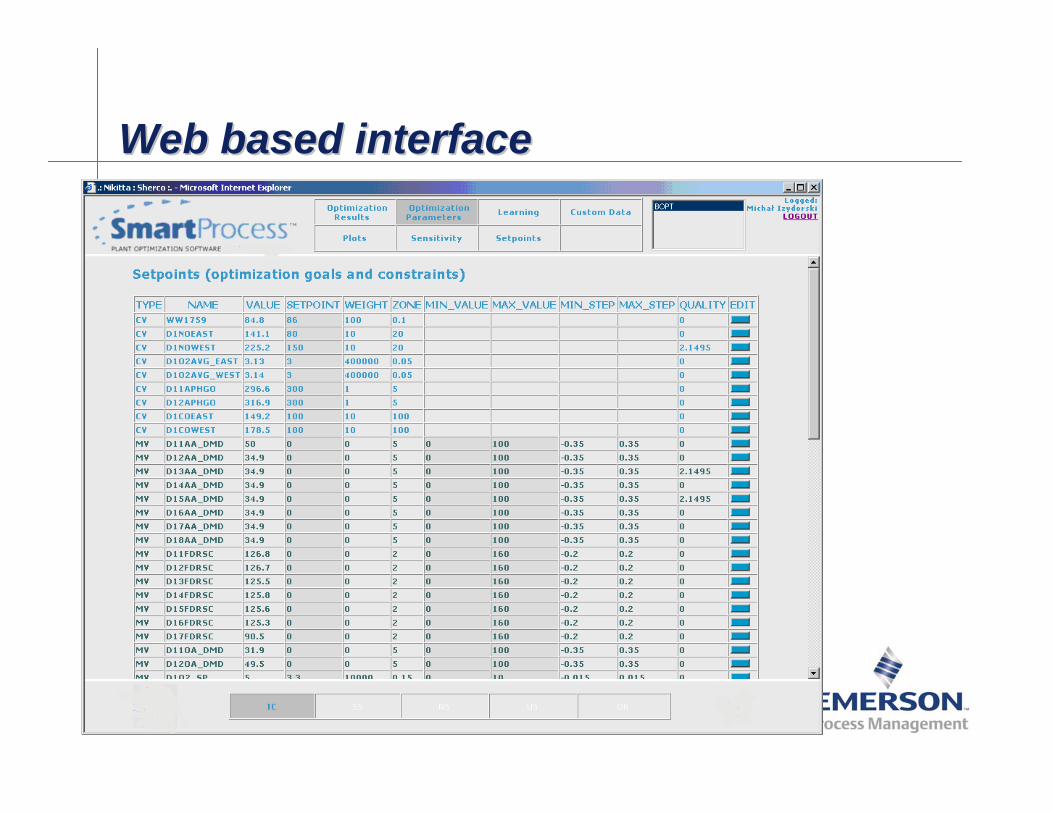
Web based interfaceWeb based interfaceWeb based interface

Sensitivity Analysis User interfaceSensitivity Analysis User interfaceSensitivity Analysis User interface

Case StudyPlant Optimization – Midwest Utility Unit #2Case StudyCase StudyPlant Optimization Plant Optimization –– Midwest Utility Unit #2Midwest Utility Unit #2
20.1% Average NOx Improvements 1% HR Improvements at high loadsIssues driving the need for change– 2003 emissions mandate to maintain NOx
below 0.13 #/mmBTU– Avoid installing SCR– Sell/Trade NOx credits
4 month project cycleNo outage requiredPayback of 9 months on NOx improvements 8 months on (>$400K) from Heat rate improvement
Company: AEG
Site: Newton Station
Application: NOx OptimizationSteam TempOptimization
Unit: Unit #2Location: Newton, IL, USAMW: 615Boiler: Alstom (CE)Turbine: GEPrimary Fuel: Coal

Midwest Utility Unit #2 NOx Optimization Results Overview – NOx Mode (100%)Midwest Utility Unit #2 NOx Optimization Midwest Utility Unit #2 NOx Optimization Results Overview Results Overview –– NOx Mode (100%)NOx Mode (100%)
NOx reduction
40
45
50
55
60
65
70
75
80
200 300 400 500 600 700
Load [MW]
NOx
[ppm
] NOx_on
NOx_off
Change in Heat Rate
9300.00
9400.00
9500.00
9600.00
9700.00
9800.00
9900.00
10000.00
10100.00
200 300 400 500 600 700
Load [MW]
Hea
t Rat
e [B
tu/K
wh]
Heat rate_on
Heat rate_of f
NOx Reduction
Maintain Heat rate
CO e m is s ion_IV Y_ON
0
50
100
150
200
250
300
350
400
450
500
200 300 400 500 600 700
Load [Mw]
CO
[ppm
]
CO_avg
CO_char
Below Average CO Levels

Midwest Utility Unit #2 NOx Optimization Results Overview – HR Mode (100%)Midwest Utility Unit #2 NOx Optimization Midwest Utility Unit #2 NOx Optimization Results Overview Results Overview –– HR Mode (100%)HR Mode (100%)
Net Unit Heat Rate
10139
9619
1021310157
9723
10328
9400
9600
9800
10000
10200
10400
250 450 600
unit load [MW]
Hea
t Rat
e [B
TU/k
Wh]
IVY ONIVY OFF
Net Unit Heat Rate improvement
0.17
1.07 1.11
0.0
0.2
0.4
0.6
0.8
1.0
1.2
250 450 600
unit load [MW]
impr
ovem
ent [
%]
Ave. of 1% improvement in Heat Rate over the
typical Load range of 450 to 600 MW equals
$407,000
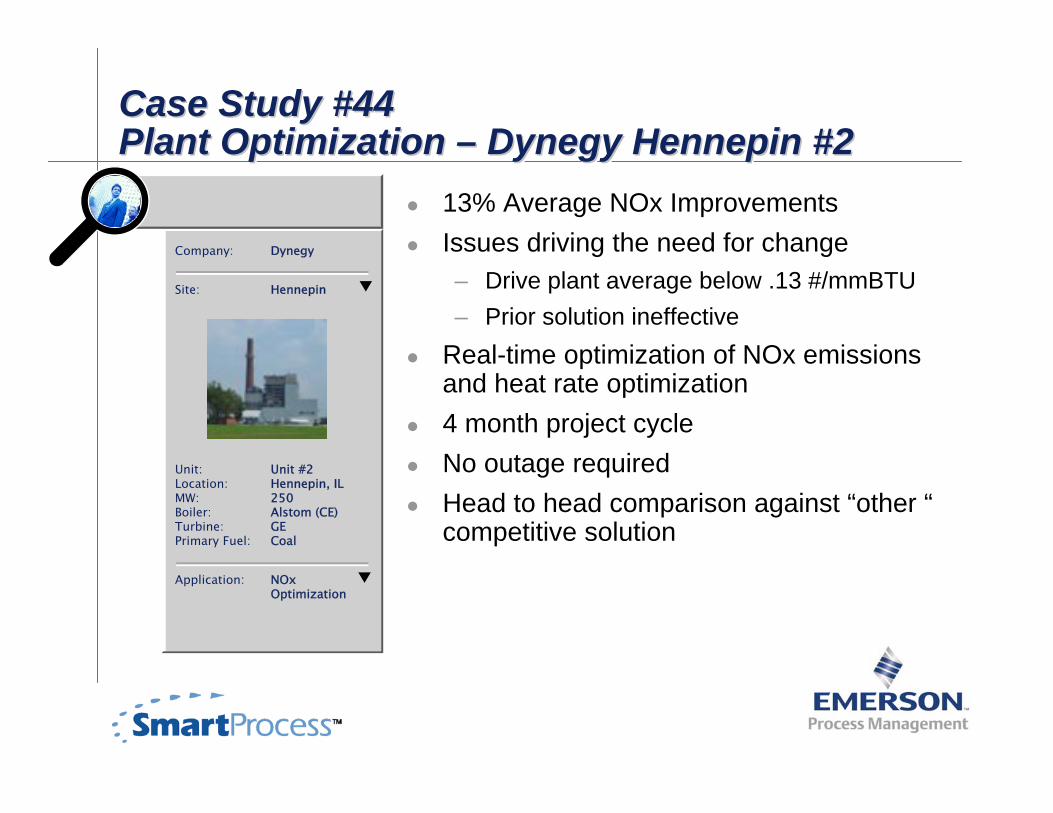
Case Study #44Plant Optimization – Dynegy Hennepin #2Case Study #44Case Study #44Plant Optimization Plant Optimization –– Dynegy Hennepin #2Dynegy Hennepin #2
13% Average NOx Improvements Issues driving the need for change– Drive plant average below .13 #/mmBTU– Prior solution ineffective
Real-time optimization of NOx emissions and heat rate optimization4 month project cycleNo outage requiredHead to head comparison against “other “competitive solution
Company: Dynegy
Site: Hennepin
Application: NOx Optimization
Unit: Unit #2Location: Hennepin, ILMW: 250Boiler: Alstom (CE)Turbine: GEPrimary Fuel: Coal

Recent BCO results for NOXRecent BCO results for NOXRecent BCO results for NOX
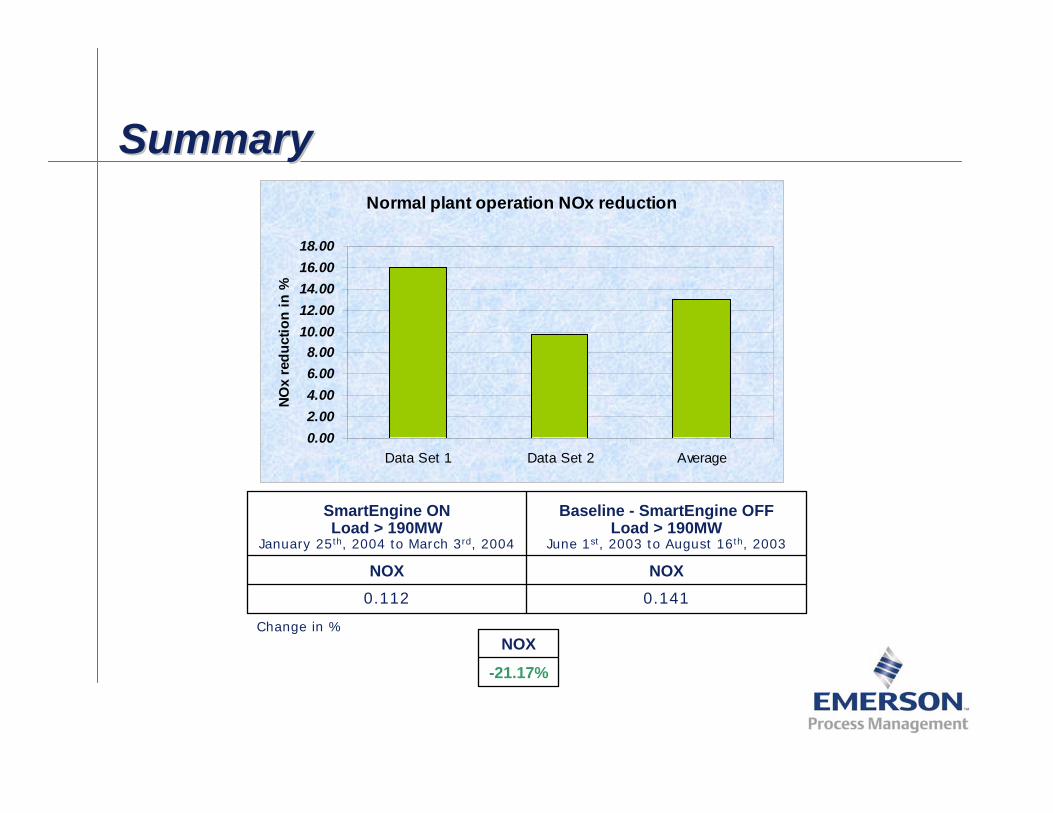
SummarySummarySummary
0.1410.112
NOXNOX
Baseline - SmartEngine OFFLoad > 190MW
June 1st, 2003 to August 16th, 2003
SmartEngine ONLoad > 190MW
January 25th, 2004 to March 3rd, 2004
Change in %
-21.17%
NOX
Normal plant operation NOx reduction
0.002.004.006.008.00
10.0012.0014.0016.0018.00
Data Set 1 Data Set 2 Average
NO
x re
duct
ion
in %

Steam Temperature OptimizerSteam Temperature OptimizerSteam Temperature OptimizerResults– Improves ramp rates up to
1% of MCR per minute– Minimizes temperature
variations by up to 75%– Controls spray valves, tilts,
pass dampers, for accurate temperature
– Multivariable control strategy to maintain optimum steam temperature
Improve steam temperature for faster ramp rates.
The Steam Temperature The Steam Temperature Optimizer provides Optimizer provides precise responses to precise responses to disturbances for accurate disturbances for accurate temperature control.temperature control.

Results!!Results!!Results!!STO Auto
90 MW ramp-6 To +9
Auto
25 MW ramp-35 To +25

Sootblower OptimizerSootblower OptimizerSootblower OptimizerResults– Delivers optimal cleanliness,
resulting in a 0.5% heat rate improvement
– Decreases soot accumulation– Improves overall boiler
efficiency– Balances blowing sequences– Minimizes unnecessary steam
usage– Reduces opacity spikes– Reduces NOx formations– Enhances steam temperature
variabilityEnsure efficient sootblowing.
The Sootblower Optimizer The Sootblower Optimizer uses an intelligent uses an intelligent modeling tool to develop modeling tool to develop heat rate absorption heat rate absorption models that accurately models that accurately reflect the numerous reflect the numerous interrelationships of interrelationships of various heat transfer various heat transfer sections.sections.

Sootblower Control IllustrationSootblower Control IllustrationSootblower Control Illustration
Master Sequencer
Scheduler
Blower

SmartEngine SootblowerSmartEngineSmartEngine SootblowerSootblower

Soot blower signature analysisSoot blower signature analysisSoot blower signature analysis
baseline

Status tool and ReportsStatus tool and ReportsStatus tool and Reports

Case Study: Sootblower OptimizationSouthern California Edison - Mohave Unit #1Case Study: Sootblower OptimizationCase Study: Sootblower OptimizationSouthern California Edison Southern California Edison -- Mohave Unit #1Mohave Unit #1
Heat transfer rate increases– 8-10 % water wall and div superheaters– 6-7% final superheater and front reheat– 2-4% rear reheat and economizer
Opacity reductionIssues driving the need for change:– Reduced opacity spikes during sootblowing
and load rampsReal-time sootblower optimization 5 month project cycleNo outage requiredEstimated payback of 8 months
Company: Southern California Edison
Site: Mohave Station
Application: Steam Temperature Optimization
Unit: Unit #1Location: Laughlin, NV MW: 800Boiler: Alstom (CE)Turbine: GEPrimary Fuel: Coal

Result : Stack opacityResult : Stack opacityResult : Stack opacity
Opacity-Megawatt Ratio
0
0.005
0.01
0.015
0.02
0.025
0.03
0.035
(% O
paci
ty /
MW
)
July August Sep1~13 Sep14~26
ISB On
Gas Co-firing
Normal
Operational Procedures

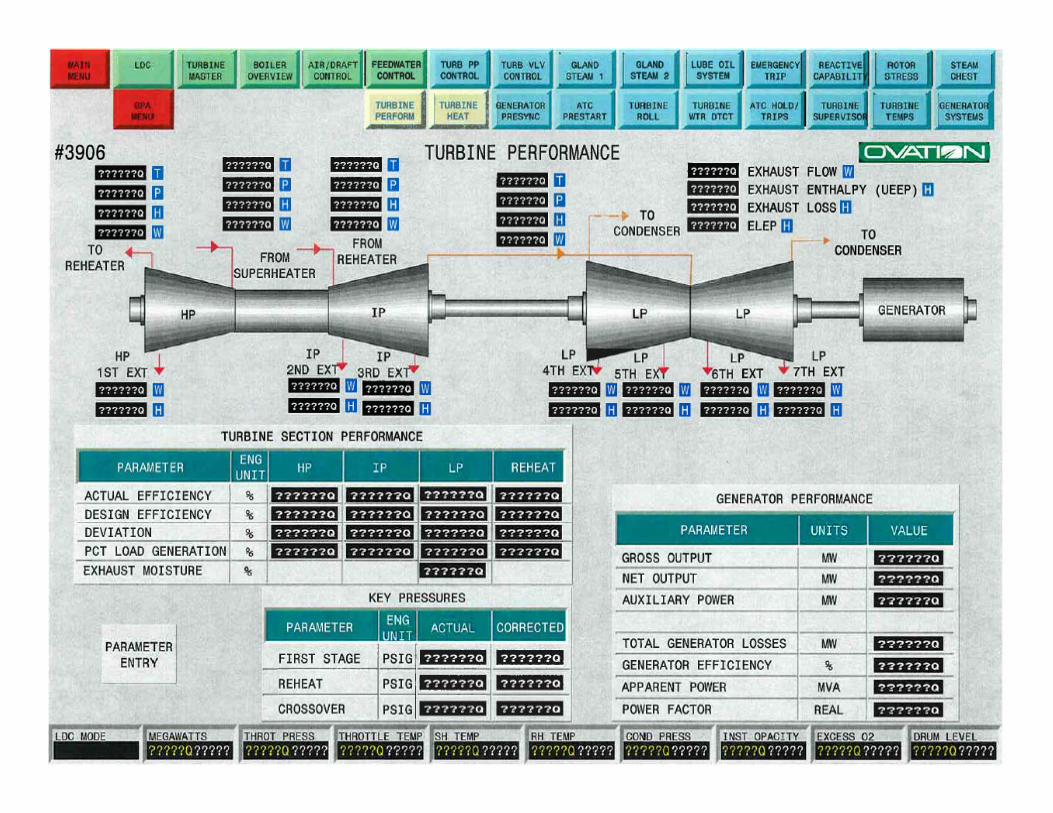
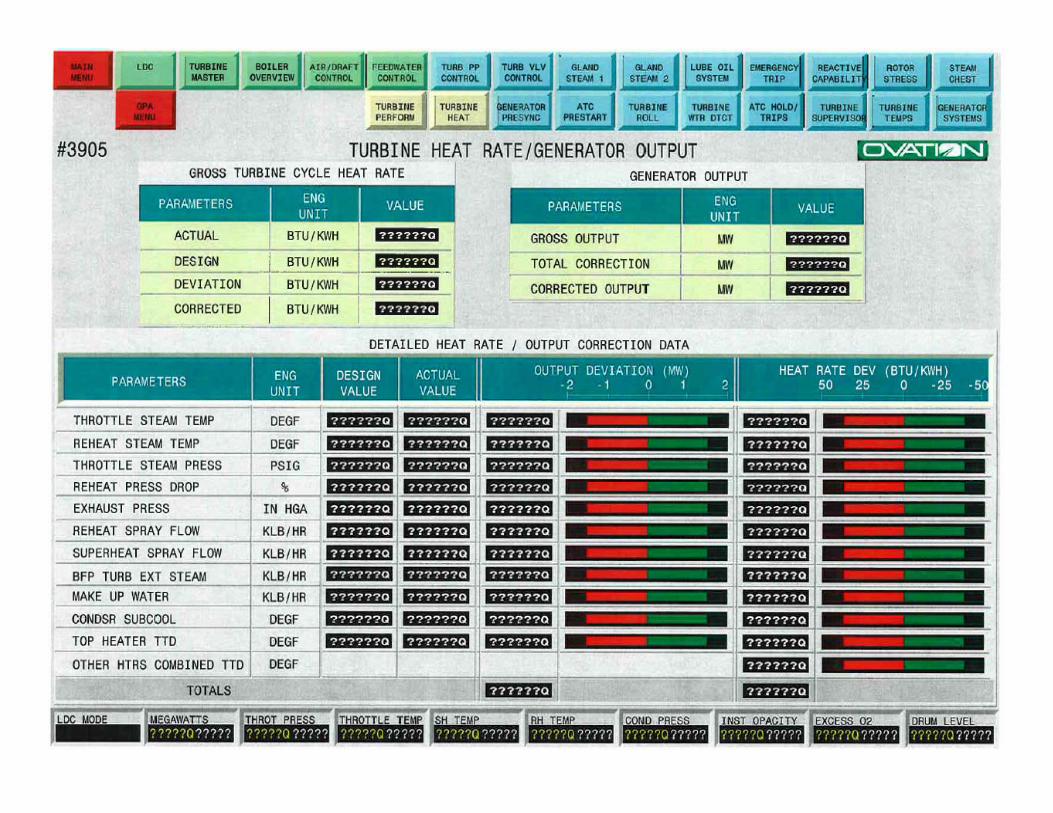
Global Performance AdvisorGlobal Performance AdvisorGlobal Performance AdvisorResults– Reduces operating costs by
tracking unit heat rate penalty costs over time and indicating dollars lost due to equipment performance deviations
– Calculates net unit heat rate and tracks heat rate deviations
– Displays deviations and cost of deviations to help operators determine corrective action or flag equipment repair and maintenance needs.Monitor and benchmark plant
performance.
The Global Performance The Global Performance Advisor allows operators Advisor allows operators to identify controllable to identify controllable losses, track equipment losses, track equipment performance against performance against design specifications, and design specifications, and quickly identify quickly identify problematic process areas problematic process areas to reduce operating costs.to reduce operating costs.
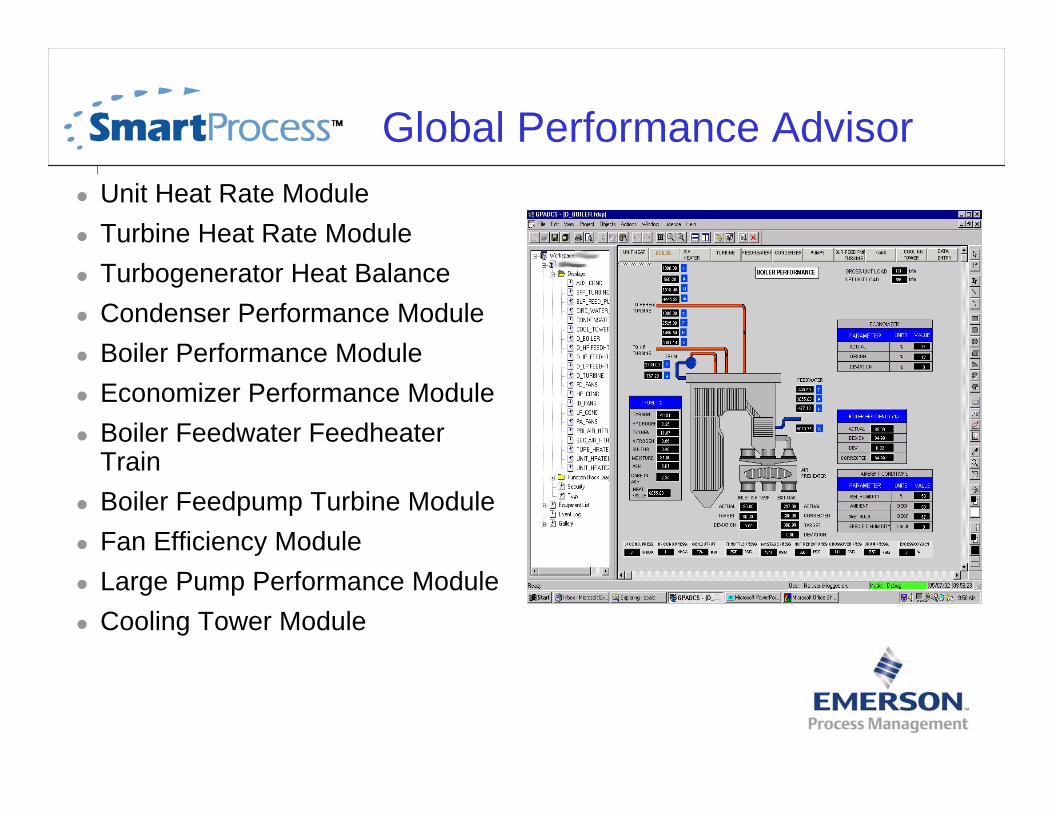
Global Performance AdvisorUnit Heat Rate ModuleTurbine Heat Rate ModuleTurbogenerator Heat Balance Condenser Performance Module Boiler Performance ModuleEconomizer Performance ModuleBoiler Feedwater FeedheaterTrainBoiler Feedpump Turbine ModuleFan Efficiency ModuleLarge Pump Performance ModuleCooling Tower Module

Condenser Design Data ScreenCondenser Design Data ScreenCondenser Design Data Screen


Fully, Configured Dynamic Link Library ContainingFully, Configured Dynamic Link Library ContainingPlantPlant--Specific Performance CalculationsSpecific Performance Calculations
Large Pump Performance Module
Cooling Tower Module
Turbine Heat Rate Module
Unit Heat Rate Module
Condenser Performance Module
TG Heat Balance & Efficiency Module
Combustion Turb. Performance Module
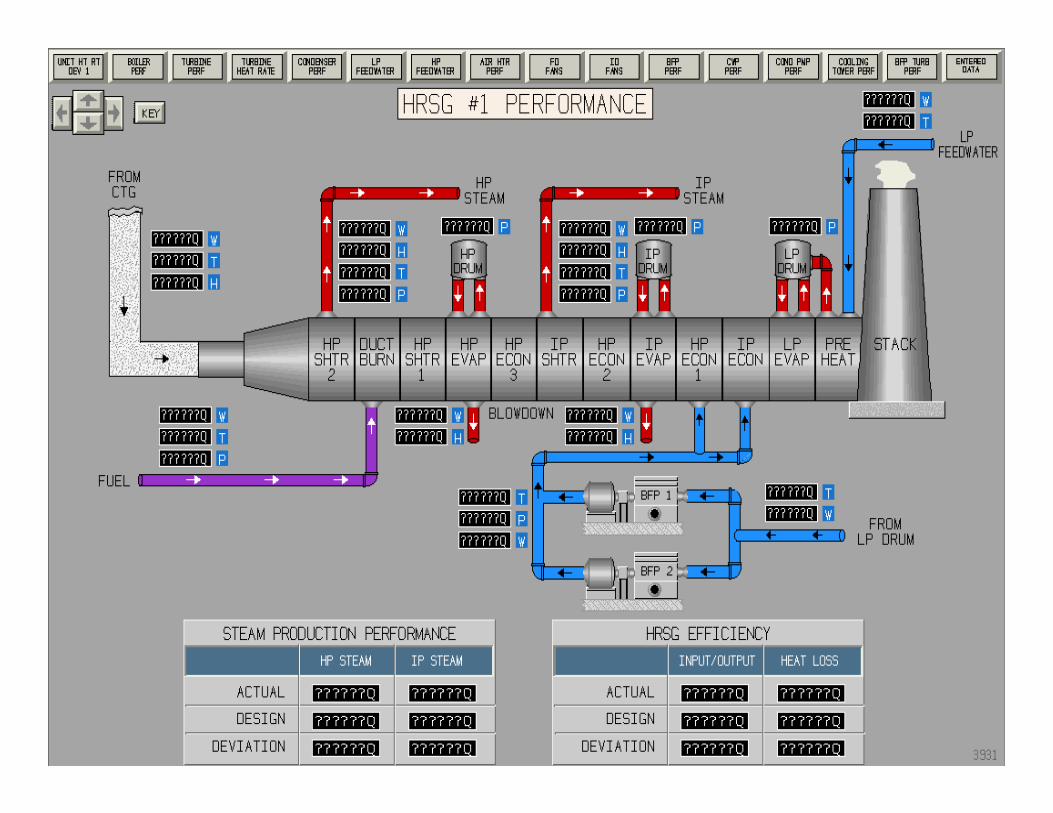
HRSG Performance Module


Typical Ovation GPATypical Ovation GPATypical Ovation GPA
GPAGPA / Operator
Station
OperatorStation
Engineer/DeveloperStudio
Fast Ethernet Network
Ovation I/O
Plant LAN
Ovation Controllers

Enterprise Data Server (EDS) Integration SoftwareEnterprise Data Server (EDS) Enterprise Data Server (EDS) Integration SoftwareIntegration Software
Up to 100,000 process point capabilityOperates on various systems, including Linux, Windows NT, Windows 2000, Windows 95, and Sun SolarisAll-in-one capabilities: alarms, visualization, reports, calculations, archival data storage, optimization, and advanced analysisGathers data from the entire enterprise or multiple sources in one placeUnified source of data for analysis, calculations, and process optimizationFlexible source for visualization and reporting
The Enterprise Diagnostic Server (EDS) collects and processes plant data. It allows users to access current and historical data gathered from control systems and other plant data sources.
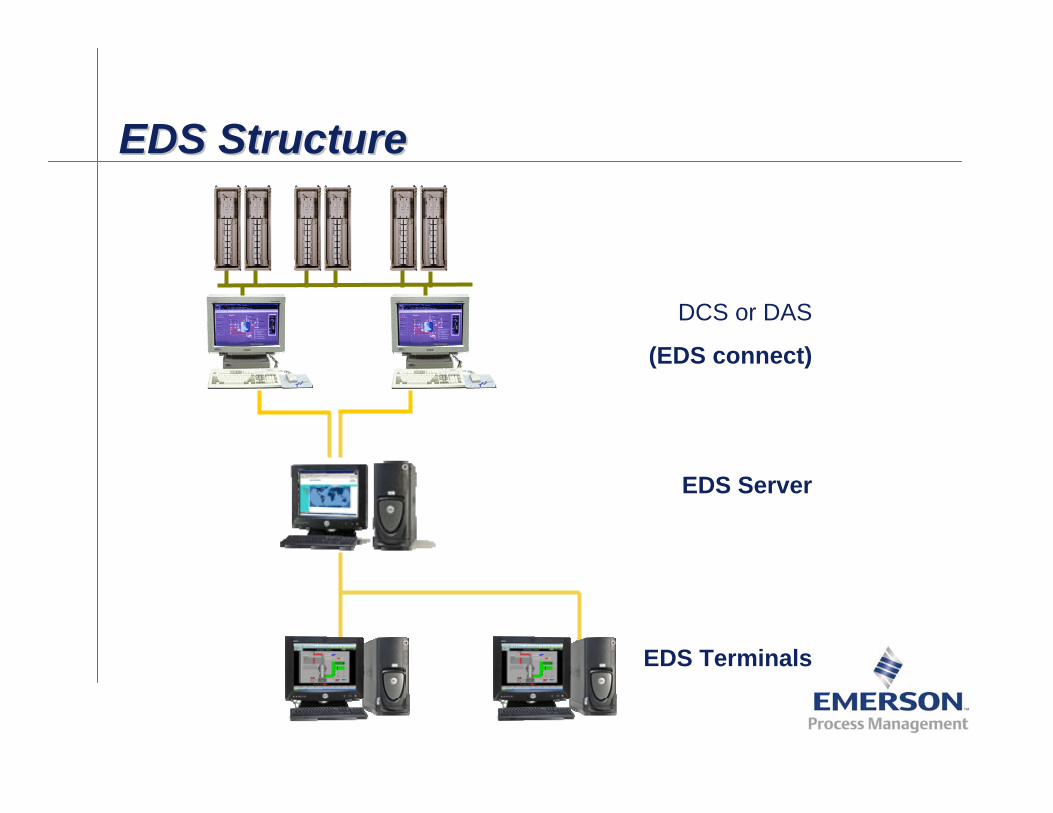
EDS StructureEDS StructureEDS Structure
DCS or DAS
(EDS connect)
EDS Server
EDS Terminals

Performance Monitoring System Data Validation and SubstitutionPerformance Monitoring System Performance Monitoring System Data Validation and SubstitutionData Validation and Substitution
Developed as standalone algorithm with OPC interfaceLoad data step has data analysis for bad data, unrecognized values, unknown error tags, overlapping and lack of data samplesNeural model for key sensors such as fuel flows, feedwater flows, etc.Traditional approaches to secondary sensors, such as substitute values, curves, etc.Full scale replacement data via ULS module


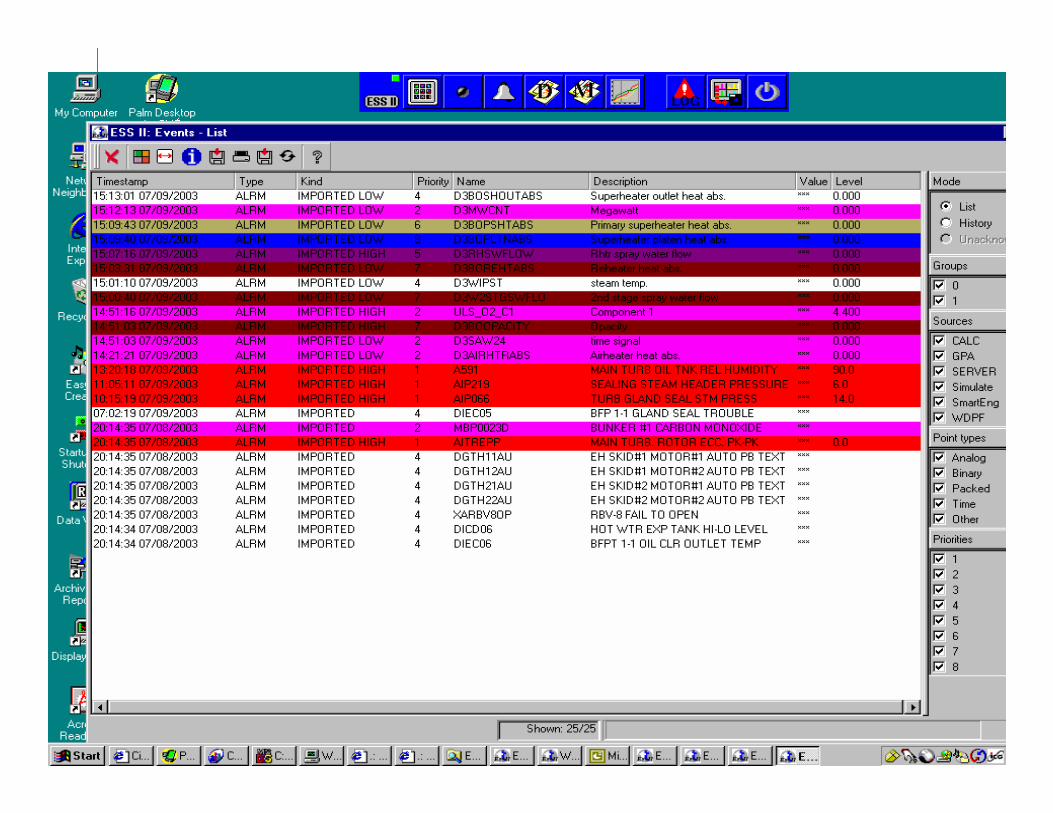

Reporting functionsReporting functionsReporting functions

Point list and helpPoint list and helpPoint list and help
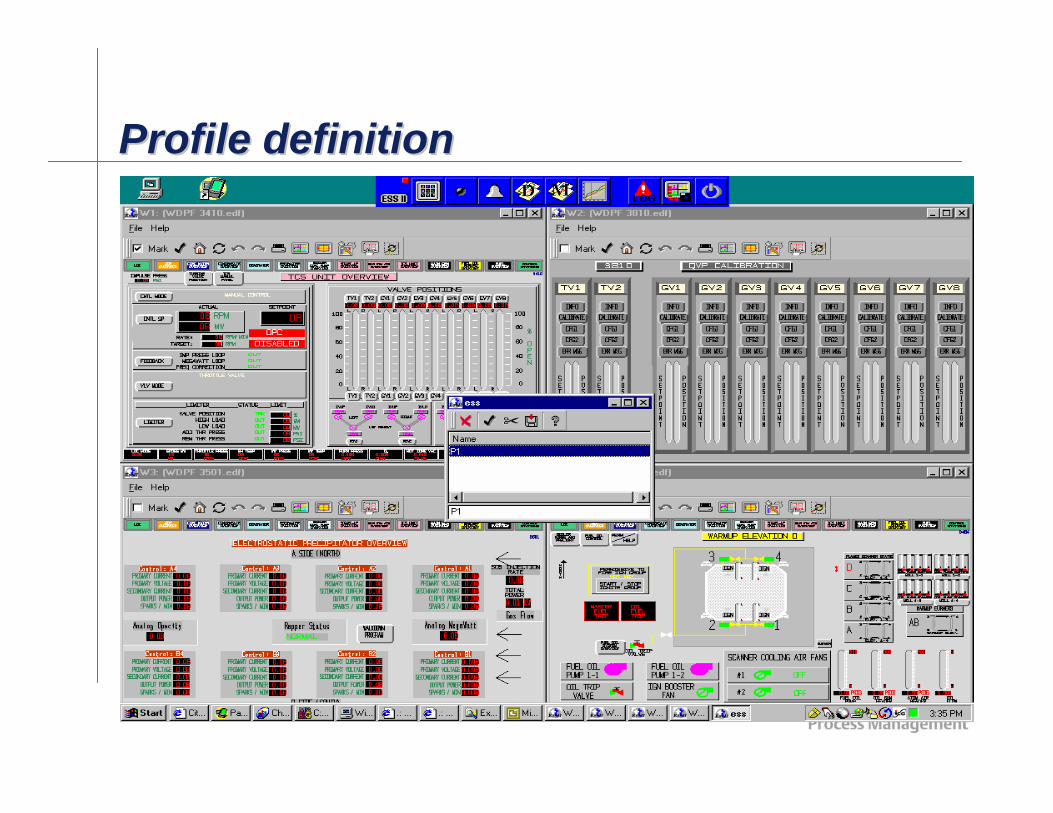
Profile definitionProfile definitionProfile definition

Questions?Questions?


