Comprehensive Summaries of Uppsala Dissertations from the Faculty of Science and Technology 559 _____________________________ _____________________________ Plant Population Dynamics of Dodonaea angustifolia and Olea europaea ssp. cuspidata in Dry Afromontane Forests of Ethiopia BY TESFAYE BEKELE ACTA UNIVERSITATIS UPSALIENSIS UPPSALA 2000
Transcript
Comprehensive Summaries of Uppsala Dissertationsfrom the Faculty of Science and Technology 559
Plant Population Dynamics of Dodonaea angustifolia and
Olea europaea ssp. cuspidata in Dry Afromontane Forests of Ethiopia
BY
TESFAYE BEKELE
ACTA UNIVERSITATIS UPSALIENSISUPPSALA 2000
Dissertation for the Degree of Doctor of Philosophy in Plant Ecology presented at Uppsala University in 2000
ABSTRACT
Tesfaye Bekele 2000. Plant Population Dynamics of Dodonaea angustifolia and Olea europaea ssp.cuspidata in Dry Afromontane Forests of Ethiopia. Acta Universitatis Upsaliensis. Comprehensive Summariesof Uppsala Dissertations from the Faculty of Science and Technology 559. 47 pp. Uppsala.ISBN 91-554-4781-3.
Human disturbance has led to excessive deforestation and to a very limited forest cover in the Afromontanezone of Ethiopia, which forms a large part of the country. Thus urgent conservation measures are required toameliorate the situation. Understanding the natural regeneration processes and the dynamics of plantpopulations of tree and shrub species has a practical application in the restoration of these habitats.
The present study focuses on the population dynamics and regeneration of an early successional shrubDodonaea angustifolia and a late successional tree Olea europaea ssp. cuspidata in southern Wello, Ethiopia.Population structure and dynamics, regeneration and seed banks in dry Afromontane habitats were considered.
For both species, three population structure patterns were identified: 1) high density, reversed J-shapestructure with many seedlings and few large individuals, 2) lower density, unimodal structure with higherproportions of plants of intermidiate size, 3) high density with higher proportions of large plants , in somecases bimodal with small and large individuals. Vegetation type and protection time were found to have asignificant effect on the population structure of both species. Dodonaea can establish itself on degraded land,once the disturbance has ceased
Projection matrix analysis on observations from permanent plots in Dodonaea populations in protected andunprotected sites resulted in one declining population, and one increasing in the protected site and decliningpopulations at the unprotected site. The overall projected growth rate in Dodonaea calculated from a pooledmatrix indicated positive population growth. The factors influencing the population growth, recruitment andsurvival are discussed.
The persistence of Olea populations seems to depend on the more stable environmental conditions in latersuccessional stages of forest vegetation. There are possibilities of natural regeneration of Olea if regeneratingindividuals still occur in the area. Rainfall seasonality is a dominant factor in regulating establishment,recruitment, survival and growth, particularly during the seedling stage. Moreover, shade and herbivory arefactors that need consideration. Since Olea grows better under shade than in the open sun, successfulregeneration for this species relies on shade from other plants and on protection from grazing, at least duringthe seedling stage.
Most of the species that germinated from the seed banks were herbs and grasses with very few shrub andtree species. There was low correspondence between species composition of the seed banks and that of thestanding vegetation.
Spatial and temporal variation in demographic parameters among populations of Dodonaea and Olea canbe attributed to human and environmental influence. Under protection, both Dodonaea and Olea seem to havea possibility to regenerate naturally. Further research should consider factors mentioned in detailedinvestigations of other dominant Afromontane forest species.
Key words: Demography, Dodonaea angustifolia, Elasticity, Establishment, Germination, Naturalregeneration, Olea europaea ssp. cuspidata, Population structure, Recruitment, Seed bank, Survival.
Tesfaye Bekele, Uppsala University, Evolutionary Biology Centre, Department of Plant Ecology, Villavägen14, SE-752-36 Uppsala, Sweden
Tesfaye Bekele 2000ISSN 1104-232XISBN 91-554-4781-3Printed in Sweden by University Printers, Ekonomikum, Uppsala 2000
To my parents,brothers and sister
This thesis is based on the following four papers, which will be referred to in the summary by their
Roman numerals (I – IV).
I. Tesfaye Bekele & Karin Bengtsson. Population structure of the early successional shrubDodonaea angustifolia and the late successional tree Olea europaea ssp. cuspidata in theAfromontane zone in Ethiopia. Maniusript.
II. Kebrom Tekle & Tesfaye Bekele 2000. The role of soil seed banks in the Rehabilitation ofDegraded Hillslopes in Southern Wello, Ethiopia. Biotropica 32 : 23-32.
III. Tesfaye Bekele, Karin Bengtsson and Ingvar Backéus. Demography of the shrub Dodonaea
angustifolia in Afromontane forest in Wello, Ethiopia.
Maniuscript.
IV. Tesfaye Bekele. Recruitment, survival, and growth of Olea europaea ssp. cuspidata seedlingsand juveniles in dry Afromontane forests in northern Ethiopia. Maniuscript.
Paper II is reproduced with kind permition from the Journal
In paper I the co-author was involved in the planning and participated in the field work. Both of usshared responsiblility for analysis and writing. Paper II both authors shared responsibilities. Paper III,co-authors were involved in planning, part of the field work, data analysis and writing.
TABLE OF CONTENTS
INTRODUCTION
Seasonal and inter-annual climatic influences 7Antropogenic influences on the Afromontane vegetation 8Plant population dynamics 9Objectives of the study 10
MATERIALS AND METHODS 10
Study area 10Study species 14Sampling Methods and Data Analysis 15
Population structure 15Seed banks 16Demography 17Survivorship and recruitment rates 18Population projection matrices 19Field germination experiment 20
The high-altitude forests of Ethiopia form part of the Afromontane forestzone (White 1983) which covers most of the highlands of Africa. Morethan half of the African highlands are found in Ethiopia (Grosjean &Mersserli 1990). The Ethiopian highlands constitute more than 45% ofthe total area of the country (Anon 1997), and since the climatic andecological conditions are more suitable than in the lowlands, 88% of thehuman population and 60% of the livestock are concentrated in thesehighlands (Constable & Belshaw 1989).
In dry Afromontane forests, the succession after disturbance leads tovarious seral stages. Without the influence of anthropogenic factors thevegetation of pioneer species like Euclea racemosa and Dodonaeaangustifolia leads to Juniperus-Olea forest vegetation (Kebrom et al.1997) or other Afromontane forest types (Friis (1992). The regenerationof most of the dominant high forest species in the Afromontane zone isunder shade of mature forest (Pohjonen 1989). The formation of aseedling-sapling bank under the forest canopy is the major regenerationroute (Demel 1997). Therefore, studies of natural regeneration of thedominant species in dry Afromontane forests are relevant forrehabilitation and conservation purposes. Knowledge of factorsinfluencing the dynamics in natural populations will lead to a betterunderstanding of the regeneration processes of trees, and has practicalapplications in the management of forest tree species (Still 1996).Regeneration dynamics of tropical trees are still poorly known (Condit etal. 1996) especially in the case of species of tropical dry forest (Gerhardt& Hytteborn 1992).
Seasonal and inter-annual climatic influences
Seasonal variation in the distribution of rainfall is one of the mostimportant and dominant ecological factors in tropical dry forests.Generally as few as two to three dry months period are sufficient to alterthe composition and structure of the forest ecosystem (Murphy & Lugo1986). Dry forests appear to show both spatial and seasonal variation ofmicrosites (Gerhardt 1994). Topographic, climatic, and edaphicproperties of a dry forest are important factors influencing the ecosystemdegradation and rehabilitation process (Murphy & Lugo 1986, Daniel1990, Gerhardt & Hytteborn 1992, Tamrat 1994). The influence ofseasonal and inter-annual climatic variation in East Africa and in thehighlands of Ethiopia is reported by several authors (e.g. Helldén &Eklundh 1988, Tewolde 1988, Eklundh 1996, 1998).
8
Anthropogenic influence on the Afromontane vegetation
Pichi-Sermolli (1957), stated that the montane evergreen shrublands ofNortheast tropical Africa are the result of the removal of the original highforest vegetation. However, the degree of human influence and the extentto which the structure and composition of African forests has beenmodified since the pre-agricultural time is largely unknown (Hamilton1992). Forest and woodland was said occupy up to 40 % of the land areain Ethiopia, but it is not certain if this area was fully covered with forestwithin historical times (Anon. 1997).
The human disturbance in the Afromontane zone in Ethiopia startedaround 5000 years BP with the inception of agriculture (Anon. 1997).The major forest destruction on Mount Badda in Arsi region (Ethiopia)for example occurred around 1850 BP suggesting extensive deforestationin the Afromontane forests. Dodonaea is found among the species withincreasing pollen quantities, which is believed to be associated to humandisturbances on the vegetation (Bonnefille & Hamilton 1986). Carbondating of charcoal buried in the agricultural highlands in Wello datesback to 2450 BP (Hurni 1987). Besides deforestation for fuel and houseconstruction, the inception of agricultural activities has very muchinfluenced the natural vegetation of the Ethiopian highlands in generaland that of Wello in particular for several thousands of years (eg. Hurni1982, Tewolde 1988, Mesfin 1991, Demel 1996). At the end of the 17th
century a change in land holding system in northern Ethiopia alsoresulted in a total lack of responsibility for uncultivated rural land(Tewolde 1989). Local people could herd their animals and collectfirewood and other products from uncultivated rural lands withoutrestrictions (Tewolde 1989, Anon 1997).
In recent times, there has been a dramatic decline of forest coverindicating rapidly vanishing forest resources in the country. Aklog (1990)for example noted that the high forest vegetation of Ethiopia coveredabout 3.4% of the country in the 1960s. The decline continued to around2.4% by 1990 (Rodgers 1992).
The depletion of the natural vegetation in many parts of the countryhas led to the threatening, decline, and extinction of many plant species.Ensermu et al. (1992) listed 120 threatened endemic plant species fromEthiopia. Out of these, 35 species were from dry Afromontane forestsand six of them were associated to Juniperus-Olea forests. The gene-poolof wild Coffea arabica is also at risk because of dwindling montaneforests (Tewolde 1990).
9
In such circumstances where many endemic plant species are at risk,protected forest remnants (both state and community forests) are of veryhigh importance for the conservation of biological diversity. They willnot only contribute to the supply of construction material, fuelwood,medicines, the conservation of soil and water and the habitat for wildanimals but will also serve as a genetic reserve.
To restore the degraded hillsides in the country reforestation withmainly exotic trees such as species of Eucalyptus, Cupressus andPinus have been practised for some decades. However, these are notwith out problems. A study on the role of exotic conifer plantations inrehabilitating degraded tropical forest in Uganda (Fimbel & Fimbel1996) showed that regeneration beneath plantation stands was poorcompared to that of the natural forests. Studies of plantations in someparts of Ethiopia by Lisanework & Michelsen (1994) and Michelsen etal. (1996) also showed the associated problems with plantations.Despite the problems of using these exotic plant species forreforestation, they can facilitate the establishment of native forestspecies and this practice is also found to play an important role inrestoring and accelerating natural regeneration of native forest species(e.g. Lübbe & Geldenhuys 1991, Parrota 1992, Geldenhuys 1997).
Pohjonen (1989) argued that the dry, hilly and badly eroded bare areasin the highlands of Ethiopia could be transformed into vegetatedshrublands, provided that they are protected from human interference.This argument was further supported by field studies in southern Wello(Kebrom 1998). A succession from Dodonaea-Acacia dominated bushinto Juniperus-Olea dominated high forest could be facilitated throughintervention of enrichment planting (Pohjonen 1989).
Plant population dynamics
Demographic studies in plant populations provide useful informationon population dynamics and can also be used to examine the biotic andabiotic factors affecting the plant population dynamics. The informationobtained through demographic studies could thus be used in restorationof degraded lands. Many researchers emphasise the need for studying andunderstanding the population dynamics of rare, endangered or key stonespecies to find the best way of managing and preserving them within orout of their natural habitat.
The contribution of demographic studies in assessing the status of apopulation (e.g. Burgman et al. 1993, Shemske et al. 1994) and the roleof plant population studies in examining demographic variation inrelation to temporal and spatial environmental variation, succession and
10
nature management has provided important insights (e.g. Menges 1990,Bengtsson 1993, O'Connor 1993, 1994). Moreover, Silvertown & Franco(1993) mention the importance of succession and environmental factors(such as grazing and fire) in altering the relative sensitivity of populationgrowth to changes in fecundity, survival and growth.
Matrix modelling is one of the recommendable methods for analysis ofthe demographic components of the population dynamics of plant species(Alvarez-Buylla & Garcia-Barrios 1993, Alvarez-Buylla et al. 1996).This gives the possibility of identifying the life history stages that havegreatest impact on population growth rate and enables the investigationof the biological processes that most strongly affect the population andthe designing of efficient recovery measures (Schemske et al. 1994,Caswell 2000, de Kroon et al. 2000). A demographic approach can alsobe used to study the regeneration of plant species and factors affectingthe spatial and temporal patterns in population size structure.
Objectives of the study
The focus of this study is to examine the population ecology ofDodonaea angustifolia (hereafter Dodonaea), an early successionalshrub, and Olea europaea ssp. cuspidata (hereafter Olea), a latesuccessional tree. Both species are important in the Afromontane zone ofthe Ethiopian highlands. The study, which is part of a research project onnatural regeneration of degraded areas of southern Wello, aims at:
1. Describing the patterns of population structure of Dodonaea andOlea in different habitats and their changes over time,
2. Assessing the possible role of soil seed banks for the ecologicalrehabilitation of degraded areas in Afromontane zone,
3. Studying the demography of Dodonaea in different populationsand discussing the implications for conservation andmanagement of the Afromontane forest area,
4. Investigating the regeneration characteristics of Olea in naturaland experimental populations.
MATERIALS AND METHODS
STUDY AREA
Topography and soilThis study was carried out in southern Wello, Ethiopia, (11°00′- 11°30′ Nand 39° 30′- 40°00′ E). The location of the study sites is shown in Fig. 1.The study area is generally characterised by rough topography with
11
mountains, deeply incised valleys, escarpments and plateaus. SouthernWello, which ranges from 1500 to 3500 m a.s.l. (MPED 1993), is in mostparts covered by volcanic rocks, mainly basalts of Tertiary age(Anon.1988).
The major soil types in southern Wello are Cambisols, Arenosols,Lithosols and Vertisols (Anon. 1988, MPED 1993). Due to excessiveerosion, large areas are covered by shallow soil. Almost 80% of the area
2
10
20
20 40
Fig. 1. Location of the study sites in Southern Wello, Ethiopia. � = Approximate location ofSouthern Wello. The study plots are scattered within the 11 sites indicated on this map.
12
has a soil depth less than 20 cm leading to low soil productivity and lowwater holding capacity during periods of irregular rainfall (Henrickson etal. 1983, Barber 1984, Constable & Belshaw 1989, Hurni 1988).
Climate
The distribution of rainfall in southern Wello is characterised by wetseasons that mostly occur from July to September (big rainy season),locally known as "Kiremt", and February to May (small rainy season),locally known as "Belg". The small rainy season is erratic and highlyvariable. There is a long dry period from the end of September toFebruary, and a short dry spell in June. Altitude has a decisive influenceon temperature and rainfall. Rainfall generally increases and temperaturedecreases with altitude (Abebe 1977, Daniel 1990). The rainfall of theDessie and Kombolcha stations during the study period is presented in(Fig. 2).
Natural vegetation
The natural vegetation of the study area is broadly classified asJuniperus procera forest or "dry single dominant Afromontane forest"with J. procera and/or Olea as dominant species (Friis 1992, Mesfin1990). At higher elevations remnants of the original Afromontane forestoccur as secondary forest with Juniperus procera, Olea and Podocarpusfalcatus among the dominant trees. Kebrom et al. (1997) also describedvarious types of seral communities These include shrublands withregenerating pioneer species such as Dodonaea and Euclea racemosa andother species such as Rhus natalensis, Dovyalis verrucosa and Acaciasieberiana Grasslands also occur, which are grazed or cut for fodder.Very degraded sites have little cover of herbaceous species (Arenarialeptoclados, Justicia sp. and Hypoestes forskaolii) and are characterisedby shallow soils or stony outcrops (Kebrom et al. 1997).
Human population
According to the 1994 census (CSA 1995), South Wello administrativeregion had 2.1 million inhabitants. The population increase from 1970 to1994 is about 81% (CSO 1974, CSA 1995). This clearly shows thepressure on the natural vegetation, since 90% of the people live in ruralareas and are engaged in rain fed crop production and animal husbandry.The seriousness of this situation in the highlands of Ethiopia wasemphasised by Messerli et al. (1990).
13
O N D J F M A M J J A S0
100
200
300
400
500
Rai
nfal
l (m
m)
O N D J F M A M J J A S0
100
200
300
400
500
Rai
nfal
l (m
m)
O N D J F M A M J J A S0
100
200
300
400
500
Rai
nfal
l (m
m)
O N D J F M A M J J A S0
100
200
300
400
500
Rai
nfal
l (m
m)
Fig. 2. Monthly rainfall at Dessie (a) and Kombolcha (b) during 1994-95 and 1995-96.Data were obtained from the National Meteorological Services Agency, Addis Ababa
a)
b)
1994-95 1995-96
14
STUDY SPECIES
Dodonaea angustifolia L. f. (Sapindaceae) a small tree or shrub,commonly up to 8 m high, widely distributed within and below theAfromontane zone and occurs throughout the tropics and subtropics(Leenhouts 1983, Friis 1992). It was earlier included in Dodonaeaviscosa. It grows at the altitudes between 800 and 2650 m a.s.l. and inareas with a rainfall range of 500-1500 mm/year (Friis 1992). It grows ina variety of habitats and rapidly colonises open areas of recently clearedforests, invades overgrazed bushlands and fallow lands and is usuallyfound in rocky and stony sites. It can withstand fires to an amazingdegree (Beentje 1994, Hedberg & Edwards 1989). Succession of bushyvegetation of pioneer species like Dodonaea and Acacia abyssinica maylead to mature Afromontane forests (cf. Pohjonen 1989).
Dodonaea is an evergreen shrub and without thorns and buttresses.The diaspore is a winged nut about 1.5 cm in diameter. It produces largenumbers of small seeds (about 100 seeds/g) and the seeds are dormant(Demel 1991, Azene 1993). It could be used to reclaim land, and is alsogood as hedge species and for sand binding (Azene et al. 1993, Beentje1994). It is not much browsed except when there is a shortage of otherpalatable plants (Tesfaye B. pers. obs.). The wood is hard and, amongother things, is used for firewood, as fencing material and also formaking hut roofs in rural areas. In addition to its possible use forreforestation it is therefore a valuable addition for the supply of woodand other needs of the community. According to Jansen (1981),Dodonaea is known to have a medicinal value as wound dressing for skindisease in cattle, and in humans as a cure for sore throats and forlowering fever.
Olea europaea L. ssp. cuspidata (Wall. ex DC.) Ciffieri (synonym:Olea africana Mill.), the wild olive tree, is a species widely distributed indry forest in Ethiopia. It is found in dry forests and forest marginsbetween 1250 and 3100 m a.s.l. and is usually around 15 m high thoughit can reach in some places up to 25 m in height (Legesse 1993, Friis1992). Olea is a long-lived tree. It shows strong xeromorphiccharacteristics and as an adult tree it can survive dry microclimaticconditions (Coetzee 1978). It is widely used for house construction,fences and for making household furniture. The bark, the wood, theleaves and the roots are burnt to produce a distinctive smoke used forfermenting and flavouring of traditional beverages "Tela" and “Irgo”(yoghurt) (Legesse 1995). Olea also has medicinal value. In southeasternEthiopia, the processed wood sap is used for curing skin disease andmental problems, and its smoke is used as an insect repellent (Demel
15
1996). In Kenya the root or the bark decoction is used as a remedy formalaria (Beentje 1994). Detailed medicinal values of Olea is presentedby Rizk & Gamal (1995). The diverse use of the species has led to itsextensive exploitation in Ethiopia and other East African countries (Dale& Greenway 1961, Jones 1991, Legesse 1995).
SAMPLING METHODS AND DATA ANALYSIS
Population structure (Paper I)
A total of 38 plots (5 m x 20 m) distributed over 11 sites in southernWello (Fig. 1) were surveyed for occurrence and population sizestructure of Dodonaea and Olea. The same sites were also included in aninvestigation of the soil seed bank (Kebrom & Tesfaye 2000) and forclassification of the standing vegetation (Kebrom et al. 1997).
The vegetation of the study sites was classified into eight vegetationtypes by Kebrom et al. (1997). We grouped seven of these in three maincategories: (1) Forest: Juniperus-Olea forest and O. europaea woodlandon high altitudes (19 plots; types 3 and 4 in Kebrom et al. 1997). MatureO. europaea trees are present but grazing pressure and the degree ofprotection are varying. Dodonaea may occur but is seldom regenerating.(2) Shrubland: Open shrubland with Euclea racemosa, Dodonaea,Pterolobium stellatum and Jasminium floribundum on lower altitudes (12plots; types 1, 2 and 5 in Kebrom et al. 1997). Dodonaea can bedominating but also sparse depending on grazing pressure. Olea mayremain as re-sprouting stumps of cut trees. (3) Grassland: Protected orgrazed grassland on lower altitudes (7 plots) (types 6 and 7 in Kebrom etal. 1997). These are degraded areas dominated by grass, some withAcacia spp. and some with high grazing pressure. Dodonaea and Oleaare seldom found.
Most of the plots (34) were situated in areas that had been undergovernmental protection during time periods of varying lengths toprevent deforestation, and 11 plots were also initially fenced in between1991 and 1994 and guarded by locally engaged field assistants.
Dodonaea and Olea plants were censused in 1993 and in 1998. Plantheight, flowering, fruiting and the number of cut or browsed individualswere recorded. Based on height, the size structure in each population ofthe two species was defined in four classes. The reason for choosingheight was that most of the individuals were small with stem diametersbelow 5 cm. For Dodonaea the height classes were: (1) <10 cm (2) 10-30cm, (3) 30-75 cm, (4) >75 cm. For Olea the classes were: (1) <10 cm, (2)10-50 cm, (3) 50-150 cm, (4) >150 cm. Altitude, slope, degree of erosion
16
and information on duration of protection were measured and collectedfor each plot.
The population size structures per species, year and plot, treated asindependent samples, were grouped into three categories with theaverage-linkage clustering method using squared Euclidean Distancemeasure (MINITAB 1997). To avoid effects of density the number ofindividuals in the different height classes was calculated as proportionsof the total number of individuals within each plot.
Changes in population size (unstructured) between years were testedwith Wilcoxon's signed rank test for matched samples. The effects oftime between censuses of 1993 to 1998, vegetation types, duration ofprotection and fencing on population size structures in Dodonaea andOlea were tested with G-tests on different subsets of the overall data.
Seed banks (Paper II)
For a soil seed bank study, ten soil samples from each of 49 plots (20m x 20 m) were studied using the seedling emergence method (Kropác1966, Roberts 1981). The samples were collected at 5 cm depth and 2 mintervals along a 20 m line. Roots and pebbles were removed from thesoil samples. All samples were spread in pots with a surface area of 134cm2 at a depth of 2 cm on top of sterilised sand. Identified seedlings wereremoved from the pots while the others were either left to grow in theoriginal pots or transplanted to bigger ones until they could be identified.
To examine the seed bank characteristics of different vegetation types,the study plots were grouped into four classes, namely forests,shrublands, grasslands and degraded lands. Seedling density for theidentified species, and for their life-forms were examined. The similaritybetween the species composition in the seed bank and that of the standingvegetation was calculated using Sørensen’s similarity index (Sørensen1948). The correlation between number of species in the seed bank andthat of the standing vegetation was calculated using Spearman’s rankcorrelation coefficient. To examine the differences in seedling densityamong vegetation classes, the Kruskal-Wallis test was used. ANOVAwas used for differences in species richness and diversity (Zar 1984).Species diversity in the different vegetation classes was calculated usingthe Shannon-Wiener index (Magurran 1991).
Species in the seed bank were grouped according to their geographicalorigin. Accordingly, three groups were formed: a) native species thathave been in the region for a long time, b) exotic species that havearrived recently and c) uncertain species that could not be easilycategorised into native or exotic. The soil seed bank flora was compared
17
with the flora of the standing vegetation acquired from Kebrom et al.(1997).
Demography (Papers III & IV)
A demographic approach was used to analyse the dynamics andregeneration of both study species. The sampling methods and theanalyses are given for both species except where mentioned for specificspecies.
Demographic data were collected from seven permanent plots of 6 m x15 m area. The plots were subdivided into nine subplots of 2 m x 5 meach. Five of these subplots (corners and centre of the plot) werecensused on seven occasions from October 1994 to October 1996. In oneof the permanent plots, both species were monitored.
These permanent plots were selected based on the population structuresurvey of both species (see paper I). Descriptions of the sites are given inTable 1.
Species Plot Altitude Site conditions
Olea1 2590 Dense forest with old trees dominated by Juniperus and Olea.
It is protected by the government.2 2230 Juniperus –Olea forest. Isolated small patch protected by the
government.3 2300 Dense secondary regrowth of Juniperus and Olea; previously
degraded land and regenerated after the protection with someconservation measures. It is under protection of thegovernment.
4 2520 Juniperus and Olea forest with scattered old trees. Protected bythe government.
5 2110 With scattered Acacia. The site is devoid of mature trees ofJuniperus and Olea. Established within a fenced blocks of anarea of 30x30 m 2 for field germination experiment.
Dodonaea1 2300 Near Olea plot 3 above. But, is an open part of the forest with
few large trees, and shrubs dominating. Hereafter named as"protected-open".
2 2300 The same as Olea plot 3. Since it is with closed canopyhereafter named as "protected-closed".
3 1860 The area was protected for 14 years until 1991 and the naturalvegetation was recovering. After 1991the area started to beconverted to farmland and grazing fields. This plot is locatedon steep slope hillside, and hereafter named as "disturbed -slope".
4 1780 The area is dominated by Carissa edulis, Euclea racemosa andDodonaea It was also protected for 14 years until 1991. Hereafter named as "disturbed-rocky".
Table 1. Description of the sites of the permanent demographic plots for Ddodonaea angustifolia andOlea europaea ssp. cuspidata in southern Wello, Ethiopia. The location of these permanent plots areindicated in Fig. 1.
18
The first census took place in October after the big rainy season, thesecond in February after the long dry period and the third in June afterthe short rainy season in each year, representing periods of high, low andmoderate moisture availability within a year. The corners of the plots andsubplots were marked to define each subplot. Each individual plant wasgiven a unique number and its position was marked on a scaled map, sothat they could be relocated. Surviving, dead and new plants in eachconsecutive census were identified and recorded. Height of eachindividual plant was measured to the nearest centimetre; size categoriesdefined for Dodonaea and Olea are presented in Table 2.
Survivorship and recruitment rates (Papers III & IV)
Mortality rates for Dodonaea were calculated in each census intervalaccording to Sheil & May (1996) and was examined by factorial analysisof variance (ANOVA), after transforming the data to approximatenormality (Zar 1984). For Olea the stage specific mortality rate wascalculated as (1- the ∑ survival probabilities) for each size category(Bierzychudek 1982).
Differences in age specific survivorship of seedlings among cohortsestablished in October-February (long dry), February-June (moderatelywet) and June-October (wet season) were analysed. For both Dodonaeaand Olea seedling cohorts were pooled from all plots and were then
Table 2. Size classes defined for the demographic study of Dodonaea angustifolia andregeneration study of Olea europaea ssp. Cuspidata.
Size class Definition for the class Size class Definition for theclass
Stage 1 Seedlings and individualsfrom the first census attaining amaximum of 10 cm height
Small seedlings Bearing cotyledonleaves or ≤ 5 cm ofheight
Stage 2 Individuals between 10 and 25 cmheight
Large seedlings Height from 5 to 15cm
Stage 3 Non-reproductive and reproductiveindividuals between 25 and 75 cmHeight
Juveniles Height from 15 to200 cm
Stage 4 Reproductive and non-reproductiveIndividuals plants above 75 cm
- -
19
analysed for the differences among seasons. Survivorship curves weredrawn and the differences between the curves were statistically testedwith the log-rank test procedure according to Hutchings et al. (1991) andPyke & Thompson (1986).
Recruitment rates for both species were calculated according to Hall &Bawa (1993) as
ri = 100 [ln ((N0+ai)/N0)/ ti]
where N0 is the number of initial individuals at the first census, ai is thenumber of recruits added to the population at the time of the secondcensus and ti the census interval which is 1 year. The rate was tested fordifferences between plots, years and seasons and their interactions usingfactorial GLM (ANOVA) with resampling (Manly 1997) for Olea.
Population projection matrices (Paper III).
Lefkovitch matrices were used to analyse the demography ofDodonaea in different populations (Caswell 1989, Horvitz & Schemske1995, Lefkovitch 1965). A total of five projection matrices weredetermined for pooled populations and for each population over the two-year period 1994-1996.
The basic projection matrix model used in this study is:
n(t+1) = An(t)
where n (t) is a vector of all individuals in the population at time t,classified by stage categories, n (t+1) is the vector for the population atthe next time interval, and A is the transition matrix that indicates howindividuals in each stage category at one time may contribute to eachstage one time unit later (Caswell 1989). The size categories are definedin Table 2.
Estimates of fecundity for the transition matrix were calculated usingthe proportion of reproductive individuals per stage (3 and 4). Theprojected population growth rate (λ), stable stage distribution,reproductive and elasticity values were calculated from each of the fivematrices. The difference between the observed distribution and stablestage distribution was examined using the likelihood ratio, G (Sokal &Rohlf 1995). Matrices were analysed using PC-MATLAB (MathWorks1997) to obtain the eigenvalues, eigenvectors, sensitivities andelasticities.
20
Field germination experiment (Paper IV)
A field experiment was conducted to examine the effects of lightconditions and scarification on seed germination of Olea. Seeds weresown in four experimental plots of 1 m x 2.5 m on three occasions(February, June, and October of 1995; hereafter named as cohorts). Twoplots were under shade (mesh with the size 5 mm x 5 mm) and two werein open (light). In each plot, there were two subplots with treated(mechanical scarification with sandpaper) and untreated seeds. Thenumber of seeds sown in each subplot was 66. Germination, survival, height and number of leaves produced byestablished seedlings were recorded in June, October and February fromJune 1995 to October 1996. The experimental period covered 20 monthsfor the February cohort, 16 months for June cohort and 12 months forOctober cohort. In addition, a final census was done in January 1998.Analysis of variance (split-plot design) was performed separately foreach cohort to examine the effects of light, scarification and theinteraction between these treatments on germination, survival, growthand number of leaves.
RESULTS AND DISCUSSION
SEED BANKS
Seedlings from 71 species (62 dicots and 9 monocots) and 30 familiesgerminated in the glass house experiment from soil samples collected inthe 49 plots. Asteraceae, Caryophyllaceae, Fabaceae and Poaceaeaccounted for 62 percent of the seedlings. Seedling density ranged from391 seedlings/m2 to 7807 seedlings/m2. The mean seedling density in thevegetation classes ranged from 1309 to 2355 seedlings/m2. Seedlingdensity was higher in grasslands than in degraded areas (K = 33.2 p <0.003) and higher in shrublands than in degraded sites (K = 31.5, p <0.005).
Herbs comprised the majority of the seed bank species (75%),followed by grasses, climbers, shrubs and trees. Herbs were dominant inall the vegetation classes. Forest and shrubland soils had a very smallnumber of seedlings belonging to those tree and shrub species growingon the sites. In the forest sites, dominated by Olea and Juniperus trees,only two seeds of woody species germinated, one from each of these twospecies.
From the identified seedlings, 58% of the total number of species werefound to be native. All trees, climbers and shrubs were native species
21
together with 57% of the grasses and 49% of the herbs. Of the 41 nativespecies, the forests had the highest share (76%) compared to theshrublands, grasslands and degraded sites.
Forty-two species, most of them herbs, occurred both in the seed bankand in the standing vegetation. These represented 59 % of all species inthe seed bank but only about 16 % of the species in the standingvegetation (Table 3). Sørensen’s index gave an overall 26% floristicsimilarity between the standing vegetation and in the seed bank.
Dominant tree species in vegetation often do not have soil stored seedbanks (Garwood 1989). Dodonaea and Olea seedlings were observed inthe standing vegetation, but except for one seedling of Olea they wereabsent in the seed banks. Dodonaea was not found at all. All seeds in thesoil are not likely to germinate, which could be related to various reasons(see paper II). Dodonaea and Olea are both known to have high seeddormancy and long persistence (Jones 1991, Legesse 1993, Demel 1991,1996). Thus seed dormancy seems to be the most probable reason for theabsence or very few appearances of these species in the seed bank in thestudy area.
Species composition, abundance of seeds in the seed bank (Welling etal. 1988), seed ecology of the species under investigation and floristicsimilarity between seed banks and standing vegetation are importantclues to the possible contribution of the soil seed banks to regenerationprocesses. More than 30 tree species that were recorded in the standingvegetation did not occur in the seed bank of our study area. The absenceof these tree species in the seed bank may, probably, be due to short
Table 3. Number of species of the different life-forms occurring in the seed bankand in the standing vegetation.
NSBa = Number of species in the Seed bankNSEBb = Number of species exclusive to the seed bankNSCc = Number of species common to the seed bank and the standing vegetationNSEVd = Number of species exclusive to the standing vegetationNSVe = Number of species in the standing vegetation.
22
viability and dormancy. The fact that trees usually have persistentseedling banks and large seeds which can not be easily dispersed overlong distances (Demel & Granström 1995), reduces the possibilities ofregeneration from seed bank if the present forests are destroyed. So evenif the number of tree seedlings in the seed banks study were few, there isa chance of regeneration if the mature individuals are conserved.
Dodonaea angustifolia
Population structure
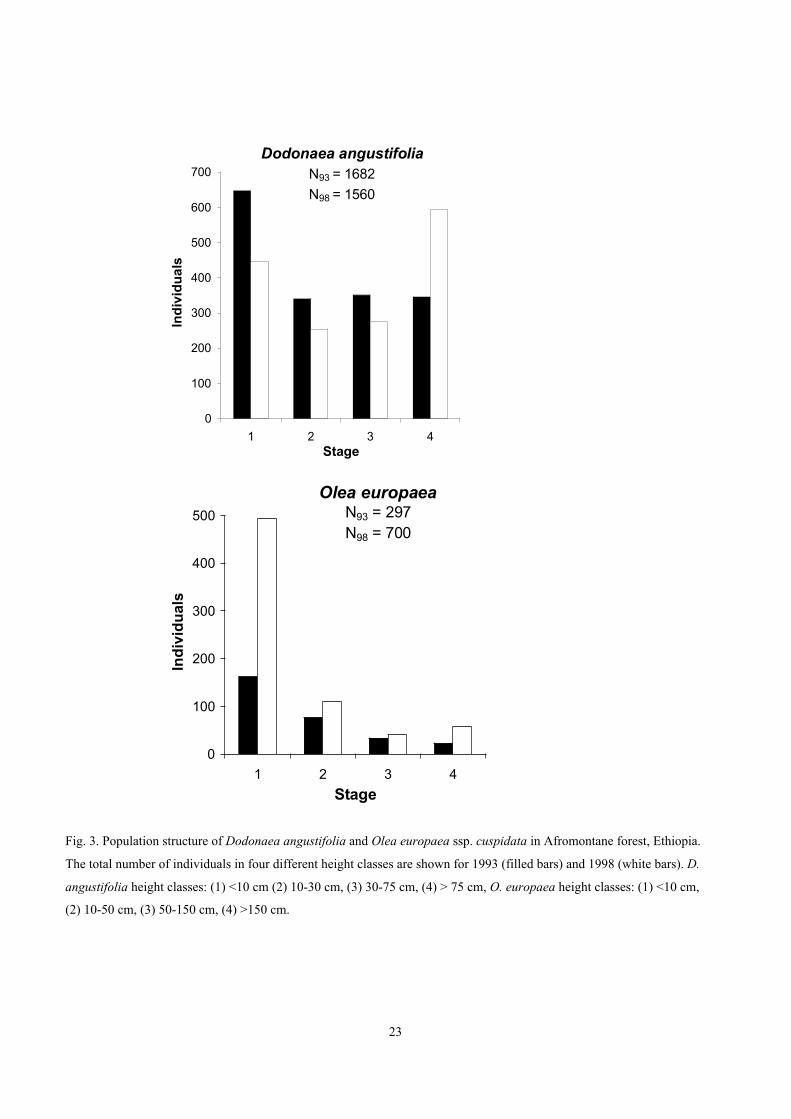
The overall size class distribution for pooled Dodonaea populations in1993 included a high number of small plants (<10 cm) and c. 50% lowernumbers in each of the three higher size classes (Fig. 3a). In 1998 theoverall structure was slightly bimodal (U-shape) with still a high numberof small plants but with the highest proportion of plants in class 4 i.e.taller than 75 cm (Fig. 3a).
Dodonaea occurred at least once in 22 plots, with densities rangingfrom 1 to 247 plants per plot (100 m2). The highest densities were foundin plots with longer protection time. The maximum height observed forDodonaea was 4.5 m and the maximum stem diameter was 7 cm.Chopped and browsed individuals accounted for 7% of the total numberof plants of both species in 1993 and 1.5% in 1998, but was found to beup to 50% in some sites.
From the result of the cluster analysis three different patterns ofpopulation size structure were distinguished (Fig. 4.). The first pattern,type 1, showed a positively skewed population structure with seedlingsand small plants dominating while larger sized individuals were few(reverse J-shape, see Fig. 4a). The second pattern, type 2, had higherproportions of individuals in the intermediate size class 3 (notillustrated) and smaller numbers in classes 1 and 4 (bell-shape orsometimes flat, see Fig. 4b). In the third pattern, type 3, the relativefrequencies were highest for class 4 (J-shape, see Fig. 4c). The threedistribution patterns, in particular type 2, also showed variation amongplots within stages (Fig. 4a-c).
Vegetation type had a significant influence on population structure ofDodonaea comparing two sites with the same protection regime (Table4). Duration of protection also had a significant effect on the sizestructure in plots within the same vegetation type on higher altitude(Table 4).
Dodonaea presents a shift over the census period of 52 months froman overall population structure dominated by small plants and seedlings
23
Dodonaea angustifoliaN93 = 1682
N98 = 1560
0
100
200
300
400
500
600
700
1 2 3 4Stage
Ind
ivid
ual
s
Olea europaeaN93 = 297N98 = 700
0
100
200
300
400
500
1 2 3 4
Stage
Ind
ivid
ual
s
Fig. 3. Population structure of Dodonaea angustifolia and Olea europaea ssp. cuspidata in Afromontane forest, Ethiopia.
The total number of individuals in four different height classes are shown for 1993 (filled bars) and 1998 (white bars). D.
angustifolia height classes: (1) <10 cm (2) 10-30 cm, (3) 30-75 cm, (4) > 75 cm, O. europaea height classes: (1) <10 cm,
(2) 10-50 cm, (3) 50-150 cm, (4) >150 cm.
24
Figure 4. Three types of population structure in Dodonaea angustifolia and Olea europaeassp. cuspidata in Afromontane forest in Ethiopia. Data were collected in 100m 2 plots at twooccasions, in 1993 and in 1998. The proportion of individuals in four different size stages areshown as averages calculated from the plots in each structure type. Error bars show standarddeviation. Size stages, based on height are: 1 = <10 cm, 2 = 10-30 cm, 3 = 30-75 cm, 4 = >75cm.
Type 2 (N=16)
0
0,2
0,4
0,6
0,8
1
1 2 3 4
Stage
Pro
po
rtio
n
Type 3 (N=15)
0
0,2
0,4
0,6
0,8
1
1 2 3 4
Stage
Pro
po
rtio
n
Type 1 (N=20)
0
0,2
0,4
0,6
0,8
1
1 2 3 4Stage
Pro
po
rtio
n
25
(reverse J-shape) to a more U-shaped pattern with numerous plants alsoin the largest size class. Since most study sites were continuouslyprotected between the two censuses the changes in overall structures canbe interpreted partly as effects of protection.
Table 4. Differences in population structure in Dodonaea angustifolia and Olea europaea ssp. cuspidatabetween different vegetation types, different duration of protection and fencing at sites in Afromontaneforest, Ethiopia. Plots (5 m x 20 m) were censuses in October 1993 and February 1998. G-tests werecarried for pooled plots within treatments. The number of plots was 6 for each factor, i.e. 3 for eachtreatment.
1993 1998G2 p G2 p
Forest vs. shrubland 55.83 <0.0001 43.13 <0.0001Site 11 – site 4(Dodonaea)
Long prot. vs. short prot. 37.57 <0.0001 174.29 <0.0001Site 7 - 11(Dodonaea)
Fenced vs. unfenced - - 3.73 0.29Site 11, 7 and 10(Olea)
The three structure patterns described were, to some extent, associatedwith different vegetation types and duration of protection. In foresthabitats the patterns were mainly of type 2 and 3 but some plots alsoshowed type 1 structures. Protection had different effects on differentpopulations, probably depending on vegetation type and status at thebeginning of protection. Studies in tropical dry forest, west African moistforests and savannah ecosystems have also indicated that size classdistribution may give an insight of past disturbances and successionaltrends (e.g. Murphy & Lugo 1986, Chapman & Chapman 1999, Swaineet al. 1987, Newbery & Gartlan 1996, Lykke 1998). However, the largevariation found among plots shows that the demography of Dodonaea isinfluenced by habitat characteristics and management on a smallgeographical scale. The species seems to have a good capacity toregenerate naturally under protection. The observed low numbers ofreally large individuals do not seem to be a major problem at the siteswhere Dodonaea were present at all. It is, however necessary to preventcutting of larger seed producing trees and also to regulate grazing andbrowsing, which most likely have a negative effect on seedlingestablishment and survival in this and other woody species in theAfromontane forest.
26
Demography
Survival and Recruitment rate
The annual mortality rates in Dodonaea among the four plots rangedfrom 10 to 53 % (Fig. 5). The mortality showed variation between thestages with Stage 1 differing significantly from stage 3 and stage 4 (F =5.62, P < 0.01). Stage specific mortality had no significant differenceamong the plots and between the years.
The annual recruitment rates varied among plots (Fig. 5). Therecruitment rate in the disturbed-rocky plots was very low in both yearswhile in the protected-open plot recruitment rate was higher than themortality rate (Fig.5). In the protected-closed plot the recruitment and themortality rates were more or less equal. In the disturbed-slope plotmortality was much higher than the recruitment and this was even morepronounced in the disturbed-rocky plot (Fig. 5).
Age specific survivorship for seedlings established during three
Fig. 5. The annual mortality and recruitment rates for Dodonaea angustifoliain four study plots in Afromontane habitats, Ethiopia. Protected-open (1),protected-closed (2), disturbed-slope (3), and disturbed-rocky (4). The blackbars represent mortality while the white bars recruitment.
0 1 2 3 4
Plots
0
10
20
30
40
50
60
70
Mor
talit
y an
d R
ecru
itmen
t
rate
(%
)
27
cohorts showed significant difference (Fig. 6) with the June-Octobercohort showing the lowest seedling survival. Seedlings established in
October-February had 45 % of their individuals surviving after 24months. The February-June cohort had 37 % surviving after 20 months.Generally, the mortality decreased with age for all cohorts.
Fig. 6. Stage specific mortality rates for Dodonaea angustifolia in four study sitesin Afromontane habitats, Ethiopia. 1994-95 ( black bars) and 1995-1996 (whitebars) for protected-open (a), protected-closed (b), disturbed-slope (c) anddisturbed-rocky plot. Size classes, based on height: 1= < 10 cm, 2 = 10-25, 3 =25-75 and 4 = >75 cm.
70
1 2 3 40
10
20
30
40
50
60
70
Mor
talit
y ra
te (
%)
0
10
20
30
40
50
60
70
70
M
orta
lity
rate
(%
)
a) b)
c) d)
28
Pooled matrix
The demographic transition rates varied substantially among the plots.However, the general trend was that the probabilities of individualssurviving and remaining in the same stage were high compared to theprobabilities of individuals growing to the next stage. The transition ratesof the protected-closed plot were different from the rest of the plots. Thisplot contained a high number of seedlings, but very few in stage 3 and noplants in stage 4 (Table 5).
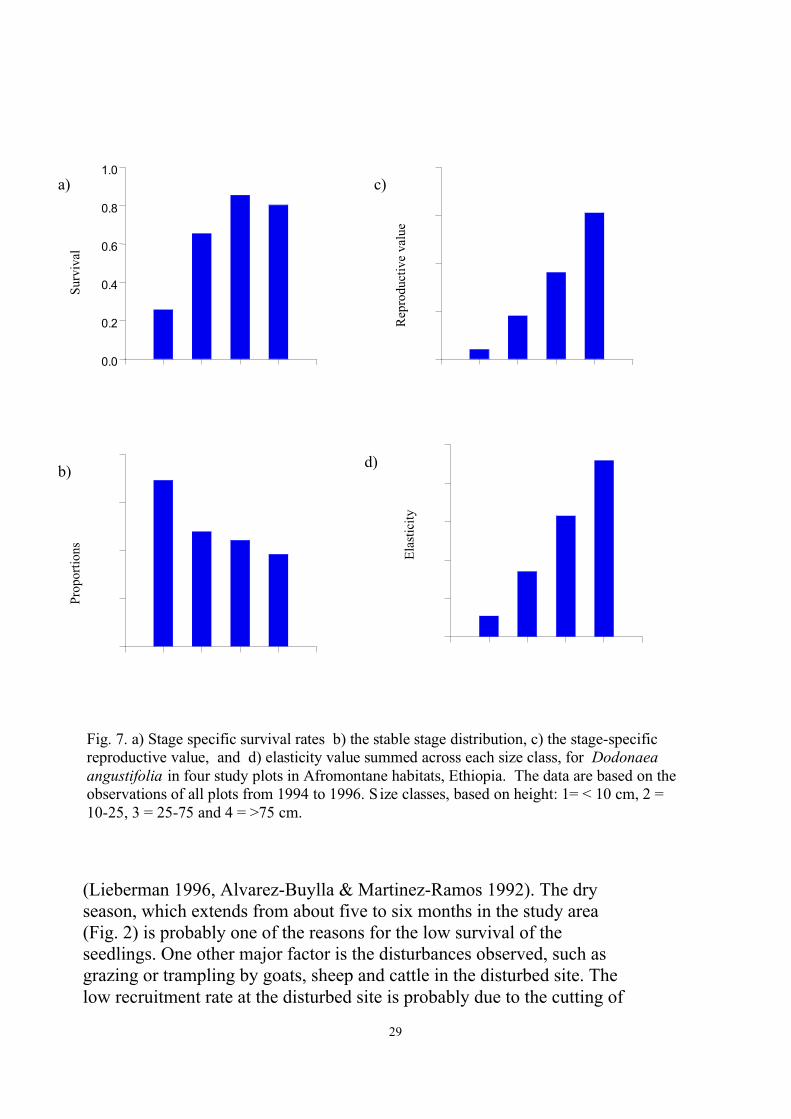
The pooled matrix constructed from observations in four plots and twoyears shows the overall population dynamics and the life-cycle ofDodonaea (Table 5, Fig 7). The stage-specific survival, the stable-stagedistribution, the reproductive values and the elasticity values variedacross the stages (Fig. 7).
Plot matrices
The population growth rates (λ) varied between the plots from 0.2916in the protected-closed plot to 1.1125 in the disturbed-slope plot. (Table6). The λ values for the disturbed-slope plot and disturbed-rocky plotwere both below 1 indicating declining populations (Table 6).
Mortality rates for Dodonaea decreased towards the higher sizecategories. Vulnerability of the small individuals and high survival of thelater life-cycle stages is common to many perennial plants (Harper 1977)and it is the smallest seedlings that face the highest mortality
Table 5. Transition probability and elasticity matrices of population dynamics of Dodonaeaangustifolia for pooled observations from all the plots from 1994-96. The population growth rate (λ)are shown in italics and fecundity values are shown in bold . Size classes, based on height: 1= <10 cm, 2 = 10-25, 3 = 25-75 and 4 = >75 cm.
29
(Lieberman 1996, Alvarez-Buylla & Martinez-Ramos 1992). The dryseason, which extends from about five to six months in the study area(Fig. 2) is probably one of the reasons for the low survival of theseedlings. One other major factor is the disturbances observed, such asgrazing or trampling by goats, sheep and cattle in the disturbed site. Thelow recruitment rate at the disturbed site is probably due to the cutting of
0.0
0.2
0.4
0.6
0.8
1.0
Sur
viva
l P
ropo
rtio
ns
Ela
stic
ity R
epro
duct
ive
valu
e
a) c)
b)d)
Fig. 7. a) Stage specific survival rates b) the stable stage distribution, c) the stage-specificreproductive value, and d) elasticity value summed across each size class, for Dodonaeaangustifolia in four study plots in Afromontane habitats, Ethiopia. The data are based on theobservations of all plots from 1994 to 1996. S ize classes, based on height: 1= < 10 cm, 2 =10-25, 3 = 25-75 and 4 = >75 cm.
30
the shrub for use by humans. The potential reproductive part of thepopulation is constantly removed, which results in very few seedproducing individuals.
Dodonaea is mostly found at the edges or in open parts of the forestand not under closed canopy (Hedberg & Edwards 1989, Pohjonen 1989)as is common among pioneer species. In the protected-open plot theDodonaea population is growing and recruitment rate exceeds mortalityrate, which indicates good regeneration and population growth underprotection. However, as the canopy of the forest closes, the populationdeclines as has occurred in the protected-closed plot. The population
Table 6. Transition matrices of population dynamics for Dodonaeaangustifolia for transition period from 1994-96 in southern Wello, Ethiopia.a) protected-open, b) protected-closed, c) disturbed-slope and d) disturbed-rocky plot. The population growth rates (λ) is shown in Italics and fecundityvalues are shown in bold. Size classes, based on height: 1= < 10 cm, 2 = 10-25, 3 = 25-75 and 4 = >75 cm.
31
growth in the protected site seems to be dependent on the existence ofopen patches containing reproductive individuals, which are sources ofseeds for both the open and closed patches of the forest.
The decline in population size in the disturbed site resulted from acombination of lack of reproduction and mortality. In this site, after 14years of protection the vegetation again suffered from cutting and heavygrazing. Since the main tree species, such as Juniperus procera and Oleahave almost disappeared over time, shrubs such as Dodonaea are thetargets for the daily needs of the rural people and are also supplyingmajor urban centres with fuelwood where the demand for wood is high.Hence selective cutting of the larger, reproductive Dodonaea shrubsseems to have a negative effect on the population growth rate. Tramplingof cattle might also have contributed to the high mortality observed.
In the disturbed-slope plot stages 3 and 4 dominated both in theobserved and stable stage distributions. This pattern of distribution ismainly due to the disturbance caused by cattle. There may also bedifferences in local climatic conditions, since the site is at lower altitudeand at the periphery of the lowlands and gets less rainfall.
It is clear that Dodonaea does not readily endure severe disturbance.Protection of degraded areas is therefore a necessary prerequisite forrecovery. Once the disturbance has ceased, Dodonaea may grow onhighly eroded, stony and rocky hillsides (Pohjonen 1989, Hedberg &Edwards 1989 and own observations). This ability to colonise barrenareas suggests that it could be used at early stages of restoration ofnatural forest, before reintroduction of species such as Juniperus andOlea.
Olea europaea ssp. cuspidata
Population structure
The total Olea population had a skewed size distribution with highernumbers of individuals in class 1 than in the other stages (reverse J-shape) in both years, although the number of small plants wasparticularly high in 1998 (Fig. 3b). The maximum height for Olea was15.5 m and the maximum d.b.h. was 47 cm. Olea also showed the threesize structure patterns found for Dodonaea (Fig. 4). The number of Oleaindividuals increased in most plots over the period.
Vegetation type had a significant influence on population structure.Fencing had no significant effect on the population structure in Oleawhen comparing fenced plots with unfenced plots (Table 4) with at least40 individuals. However, fencing and protection had a clear effect on
32
population density in Olea as the number of individuals increased from1993 to 1998 in almost all plots.
The population structure for Olea in 1993 had slightly higherproportions of small plants than larger plants and in 1998 this reverse J-shaped pattern was very distinct. Olea maintained mainly the type 1(reverse J-shape) structure between years, indicating continuous highregeneration and stable mortality rates. Since most study sites werecontinuously protected between the two censuses the changes in overallstructures can be interpreted partly as effects of protection. Newrecruitment of Olea seedlings occurred, either through distant seeddispersal or from a persistent soil seed bank, during the census period inrecently fenced plots. The seed regeneration within these plots shows thepotential for recovery of the forest vegetation with the help fromprotection measures.
Regeneration
Establishment and Survival
Seedlings of Olea were established in all seasons during the two yearsin three of the four sites (Fig. 8) and showed marked variations amongthe sites and seasons. The establishment shows a tendency to beassociated with the moderately wet and the wet seasons.
Age specific survivorship of the seedling cohorts of Olea establishedduring the long dry, moderately wet and wet seasons differedsignificantly. The mortality rate decreased with age for all cohorts. Thiswas particularly obvious for the seedlings established during the long dryand moderately wet season.
Stage specific survival varied markedly among small seedlings, largeseedlings and juveniles and among sites. The small seedlings had thelowest survival probability while the juveniles had the highest. Juvenilesurvival was consistently high. Mortality was higher among small andlarge seedlings than among juveniles. Site 2 had the highest seedlingmortality (94%) of all the plots in both years.
33
Site 1
Ld Mw W Ld Mw W0.01
0.10
1.00
See
dlin
g de
nsity
(no
. /m
2 )
See
dlin
g de
nsity
(no
. /m
2 )
See
dlin
g de
nsity
(no
. /m
2 )
Seed
ling
dens
ity (
no. /
m2
)
Fig. 8. Establishment of seedlings ( no./ m 2 ) of Olea europaea ssp. cuspidata fromplots of 50 m2 each, in Southern Wello ( Ethiopia). The establishment was during thelong dry (October to February, 'Ld' ), moderatly wet (February to June, 'Mw') and wet(June to October 'W') seasons from Oct. 1994 to Oct. 1996 at site 1, site 2 , site 3 andsite 4
1994-95 1995-961994-95 1995-96
N= 64N=19
N=328N=196
34
Recruitment rates differed significantly among the seasons and amongsites (p < 0.05 and p<0.001); (Table 7). There were also significantseason x site and season x site x year interactions. The long dry seasonhad the lowest recruitment and differed significantly from the moderatelywet and wet seasons. Site 2 had the lowest recruitment rate while site 3had the highest.
Density
Small seedlings dominated at all sites in 1994-95 and at sites 3 and 4in 1995-96. Large seedlings dominated at sites 1and 2 in 1995-96. Thedensity of Olea individuals in different size classes and in each of thefour sites is illustrated in Fig. 9.
Source of variation F df p
Season 5.856 2 0.001
Site 3.853 3 0.012
Year 1.076 1 0.320
Season x Site 3.827 6 0.006
Season x Year 1.428 2 0.243
Site x Year 2.603 3 0.0551
Season x Site x Year 5.920 6 0.001
Table 7. Analysis of variance results for the effects of season, site, year andthe interaction between these on recruitment rate (% yr -1 ) in Olea europaeassp. cuspidata populations in southern Wello, Ethiopia. Factorial GLMANOVA with resampling (5000) was used. The recruitment rate wascalculated following Hall and Bawa (1993).
35
Field germination experiment (Paper III)
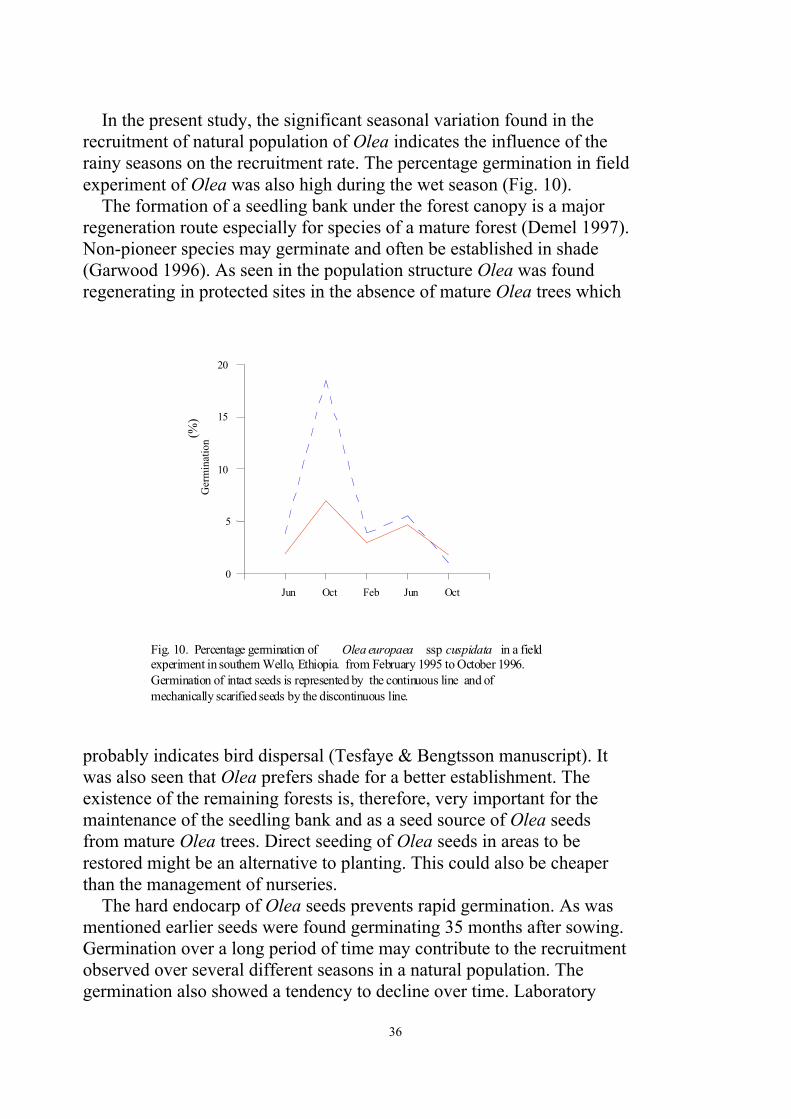
In the field experiment, Olea seed germination was high after the rainyseasons (Fig.10) for both intact and mechanically scarified seeds.Germination also continued until up to 35 months after sowing,confirming that Olea seeds can remain in the soil for a relatively longtime until adequate moisture is available for germination.
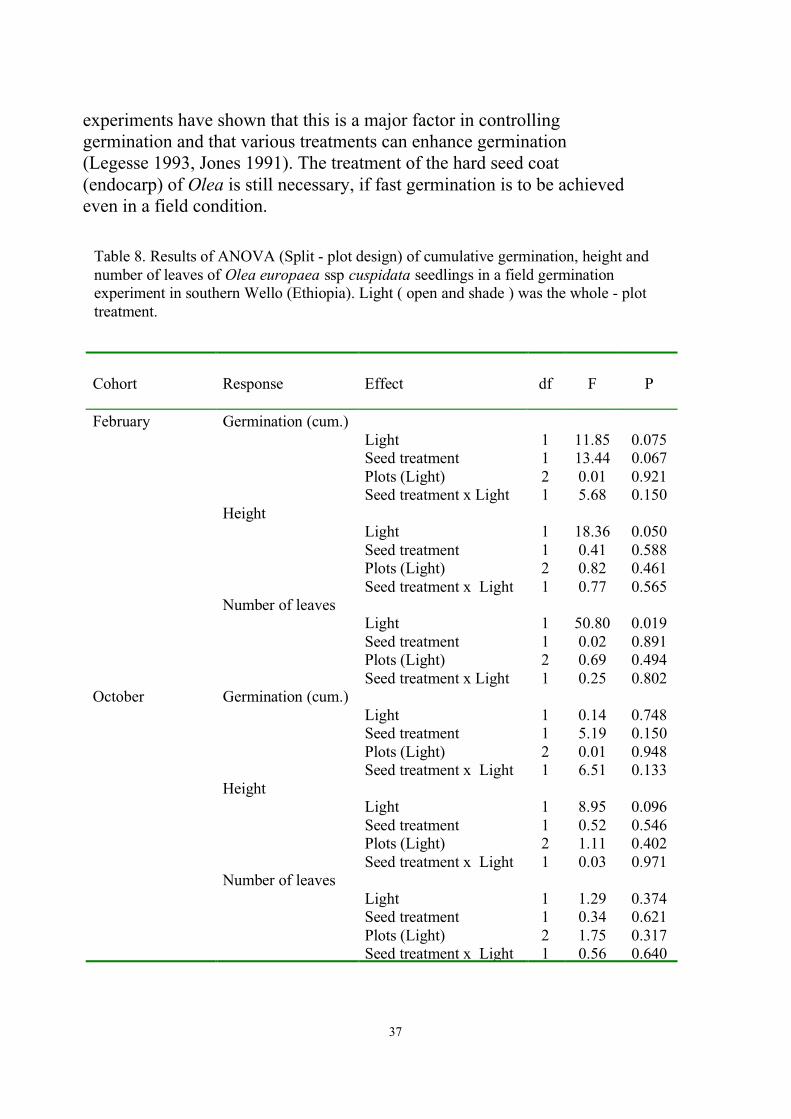
In both open and shade treatments the scarified seeds showed highercumulative germination in the February cohort. Seedlings in shadeattained higher height than in open and the effect of light on height wassignificant (p < 0.05) in the February cohort, but not in the Octobercohort (Table 8). Seedlings in shade also showed a higher number ofleaves than in open (Table 8).
Sd Ls Ju
0.10
1.00
Den
sity
(no
./m2 )
(Lo
g N
)
Sd Ls Ju
0.10
1.00
Sd Ls Ju
0.10
1.00
D
ensi
ty (
no./m
2 )
(
Log
N)
Sd Ls Ju
0.10
1.00
Fig. 9. Density (no./ m 2) of small seedlings (Sd), large seedlings (Ls) andjuveniles (Ju) of Olea europaea ssp. cuspidata ). from site 1, site 2, site 3,andsite 4 in southern Wello (Ethiopia). The Black bars represent 1994-95 whilethe grey bars represent 1995-96.
site 1 Site 2
Site 3Site 4
N (1994-95) = 70
N (1995-96) = 64
N (1994-95) = 89
N (1995-96) = 12
N (1994-95) = 290
N (1995-96) = 128
N (1994-95) = 189
N (1995-96) = 77
36
In the present study, the significant seasonal variation found in therecruitment of natural population of Olea indicates the influence of therainy seasons on the recruitment rate. The percentage germination in fieldexperiment of Olea was also high during the wet season (Fig. 10).
The formation of a seedling bank under the forest canopy is a majorregeneration route especially for species of a mature forest (Demel 1997).Non-pioneer species may germinate and often be established in shade(Garwood 1996). As seen in the population structure Olea was foundregenerating in protected sites in the absence of mature Olea trees which
probably indicates bird dispersal (Tesfaye & Bengtsson manuscript). Itwas also seen that Olea prefers shade for a better establishment. Theexistence of the remaining forests is, therefore, very important for themaintenance of the seedling bank and as a seed source of Olea seedsfrom mature Olea trees. Direct seeding of Olea seeds in areas to berestored might be an alternative to planting. This could also be cheaperthan the management of nurseries.
The hard endocarp of Olea seeds prevents rapid germination. As wasmentioned earlier seeds were found germinating 35 months after sowing.Germination over a long period of time may contribute to the recruitmentobserved over several different seasons in a natural population. Thegermination also showed a tendency to decline over time. Laboratory
Fig. 10. Percentage germination of Olea europaea ssp cuspidata in a fieldexperiment in southern Wello, Ethiopia. from February 1995 to October 1996.Germination of intact seeds is represented by the continuous line and ofmechanically scarified seeds by the discontinuous line.
Jun Oct Feb Jun Oct
0
5
10
15
20
Ger
min
atio
n (%
)
37
experiments have shown that this is a major factor in controllinggermination and that various treatments can enhance germination(Legesse 1993, Jones 1991). The treatment of the hard seed coat(endocarp) of Olea is still necessary, if fast germination is to be achievedeven in a field condition.
Cohort Response Effect df F P
February Germination (cum.)Light 1 11.85 0.075Seed treatment 1 13.44 0.067Plots (Light) 2 0.01 0.921Seed treatment x Light 1 5.68 0.150
Number of leavesLight 1 1.29 0.374Seed treatment 1 0.34 0.621Plots (Light) 2 1.75 0.317Seed treatment x Light 1 0.56 0.640
Table 8. Results of ANOVA (Split - plot design) of cumulative germination, height andnumber of leaves of Olea europaea ssp cuspidata seedlings in a field germinationexperiment in southern Wello (Ethiopia). Light ( open and shade ) was the whole - plottreatment.
38
CONCLUSIONS
The environmental and anthropogenic factors responsible for thevariation in Afromontane vegetation affect the dynamics of Dodonaeaand Olea. Dodonaea thrives in newly protected open areas but disappearsin later stages of succession. Olea grows better in shade and remains as adominant tree later in the succession.
The study has given an insight into the different successionalcharacters of the habitats and the possible implications for naturalregeneration. Exotic trees have been used in Ethiopia as nurse crops forthe establishment of native forest species, because seedlings of late-successional tree species planted in open areas in many cases die ordevelop poorly. Indigenous, early successional trees and shrubs couldpotentially play a similar role in forest rehabilitation with a goal tofacilitate natural successional processes. Dodonaea is a promisingspecies in this respect. Its ability to colonise barren areas suggests that itcould be used at early stages of restoration of natural forest, beforereintroduction of species such as Juniperus procera and Olea europaea.It can, however, not readily endure severe ongoing disturbance.Protection of degraded areas is therefore a necessary prerequisite.
Olea was found to regenerate vigorously, despite high seedlingmortality, suggesting that natural regeneration will not be difficultprovided regenerating individuals still occur in the area. Regeneration ofOlea was seen also in early stages of protection., but such individuals arelikely to become stunted, and Olea regeneration should therefore not beattempted until the area is vegetated.
Rainfall seasonality appears to be a dominant factor regulatingestablishment, recruitment, survival and growth, thus, if seeding isneeded, it should take place during periods with adequate soil moisture.
A similar approach to the one used in this study on other species wouldprovide important information for further silvicultural and ecologicaldevelopment. Studies are needed, e.g. on the early successional speciesAcacia abyssinica and the late successional species Juniperus proceraand Podocarpus falcatus.
An assessment of the population structure and status of native plantspecies is a first step to obtain information on the natural populations andfactors affecting them. However, long-term demographic studies are alsoneeded to obtain more detailed knowledge of the species that have apotential use in restoration. Such studies may also give information onhow to use these species in a sustainable way.
39
In a broader context, the natural regeneration and conservation in thefragmented Afromontane forests in most mountain habitats of Ethiopiaand the eventual rehabilitation of the degraded areas may be successfulonly if there are possibilities of arresting the degrading anthropogenicfactors. In this connection hillside closures (making free from human andanimal intervention), reduction of human influences such as clearing ofvegetation, cattle grazing, and implementation of conservation measures(such as plantation of tree and shrub seedlings native as well as exotic)are important. However, as was also observed in most parts of the studyarea, such and other measures will not be successful without theparticipation of the local people. This, in turn, would be possible only ifpeople get the possibility of finding their daily needs without using theareas that need to be restored.
ACKNOWLEDGEMENTS
First of all, I would like to sincerely thank my supervisors IngvarBackéus and Karin Bengtsson, for their support, which enabled me toaccomplish this work. I have enjoyed their hospitality and they were inseveral occasions to my field sites facing the difficult task of countingtiny seedlings in high mountain forests of Ethiopia. I am grateful to them.
I am very thankful to Jon Ågren for his guidance and scientific advice.He was always supportive to me. I am grateful to Eddy van der Maareland Marijke van der Maarel for their hospitality and advice. I owe thanksto Jerry skoglund and his family for their hospitality. Thanks to HåkanRidin, Johan Ehrlén, Karin Gerhartd, Bengt Carlsson, Staffan Karlssonand Brita Sevensson for fruitful scientific discussions.
I am very thankful to Zerihun Woldu. He invited me to the researchand allowed me to explore and learn field ecology. I am very muchgrateful. Tamrat Bekele and Demel Teketay shared their ampleknowledge of the Afromontane forests. I have enjoyed learning fromthem, thankyou. Tekle Haimanot and Mulugeta thanks for your help infield data collection.
My warmest thanks to Kebrom Tekle and Yosef Tekle Giorgis notonly for their help in scientific issues, but also their brotherhood andsharing my ups and downs. I am deeply thankful.
Ulla Johansson, Ulla Maria, Willy Jungskär and Staefan Björklundwere always ready to help me in administative and computer relatedissues. I am very grateful.
The department of Biology, Addis Ababa University providedadministrative and logistics support. The staff members of the
40
department welcomed me and gave me all the support I needed. Thanks.I sincerely thank all professionals in Zonal and district offices of theMinistry of Agriculture in South Wello for introducing me to the sitesand helping me in the fields.
My warm thanks for all friends and colleagues at the department ofplant ecology, for several scientific and social companion and goodfriendship. My office mates Urban, Henrik, Sebastian and KerstinWallström are thanked for being friendly and caring.
Special thanks goes to my friends Aster, Bisrat, Shewaye and Tesfayefor their support and love. I sincerely thank Alemayhu, Alay, Derege,Fasil, Mesay, Mulugeta, Nigatwa, Tasew, Tesfahun, Solomon and mycolleagues at ESTC for encouraging me. I am highly grateful to TesfayeBiftu and his family for encouraging me and giving me the support Ineeded.
Thanks to my friends, Atalay, Adamu, Almaz, Belay, Getachew,Dawit, Demeke, Elias, Firdu, Habte mariam, Mulugeta, Teibe, Tegegne,Tsegaye, Wasihun, Wegayehu, Wubeshet, Yohanes, Zenebe, Zenebechfor your friendship, hospitality and company during my stay in Sweden.
My highest gratitude goes to my parents Memre Bekele Anbessa andW/ro Meaza Checole, my brothers and sister for their love and unlimitedsupport.
Financial support was obtained from the Swedish InternationalDevelopment Agency (Sida), which I gratefully acknowledge.
REFERENCES
Abebe Asrat 1977. Rainfall analysis in mountainous areas with special reference toconditions in Ethiopia. Agric. Univ. Wageningen, The Netherlands. 39 pp.
Aklog Laike 1990. Forest resources and MOA forestry development and legislation,In: National conservation strategy conference Document, Ethiopia's experience inconservation and development, Vol 3. ONCCP, Addis Ababa.
Alvarez-Buylla, E.R. & Garcia-Barrios, R. 1993. Models of patch dynamics inTropical forests. Trends in Ecol. and Evol. 8: 201-204.
Alvarez-Buylla, E. R., Garcia-Barrios, R., Lara-Moreno, C. & Martinez-Ramos, M.1996. Demographic and genetic models in conservation biology: Application andperspectives for tropical rain forest tree species. Ann. Rev. Ecol. Syst. 27: 387-421.
Anon. 1988. National Atlas of Ethiopia. Ethiopian Mapping Authority, Addis Abeba,Ethiopia. 81 pp.
41
Anon. 1997. National Conservation Strategy of Ethiopia: The resource base, itsutilisation and planning for sustainability. Environmental Protection Authority andMinistry of Economic Co-operation. Addis Ababa Vol. I. 138 pp.
Azene Bekele-Tesemma, Birnie, A. & Tengnäs, B. 1993. Useful trees and shrubs forEthiopia. Regional Soil Conservation Unit (RSCU), Sida. Nairobi. 747 pp.
Barber, R. 1984. An assessment of the dominant soil degradation processes in theEthiopian highlands. Min. of Agriculture, Addis Abeba, Ethiopia.
Beentje, H.J. 1994. Kenya trees, shrubs and lianas. National Museums of Kenya,Nairobi. 722 pp.
Bengtsson, K. 1993. Fumana procumbens on Öland: Population dynamics of adisjunct species at the northern limit of its range. J. Ecol. 81: 745-758.
Bierzychudek, P. 1982. The demography of Juck-In-The-Pulpit, A forest perennialthat changes sex. Ecol. Monogr. 52: 335-351.
Bonnefille, R. & Hamilton, A. 1986. Quaternary and late tertiary history of Ethiopianvegetation. Symb. Bot. Ups., Uppsala, 26(2): 48-63.
Burgman, M. A., Ferson, S., Akcakaya, H. R. 1993. Risk assessment in conservationbiology. Chapman & Hall, London. 309 pp.
Caswell, H. 2000. Prospective and Retrospective perturbation analysis: Their roles inconservation Biology. Ecol. 81: 619-627.
Caswell, H. 1989. Matrix Population Models. Sinauer Ass. Inc., Sunderland,Massachusetts. 328 pp.
Central Statistical Authority (CSA) 1995. Report on land utilisation. Agriculturalsample survey 1991/92, Statistical bulletin 134. CSA, Addis Abeba, Ethiopia.
Central Statistical Office (CSO - currently CSA). 1974. Results of national samplesurvey 1970 (second round): Estimates of population in Wello, Vol. 2. CSO, AddisAbaba.
Chapman, C. A. & Chapman, L. J. 1999. Forest restoration in an abandonedAgricultural land: a case study from East Africa. Conserv. Biol. 13: 1301-1311.
Condit, R. Hubbell, S. P. & Foster, R. B. 1996. Changes in tree species abundance inneo-tropical forest: Impact of climate change. J. Trop. Ecol. 12: 231-256.
Constable, M. & Belshaw, D. 1989. The Ethiopian Highlands Reclamation Study(EHRS): major findings and recommendations. pp 142-179 in Proceedings of theNational workshop on food strategies for Ethiopia, Addis Ababa.
42
Coetzee, J. A. 1978. Phytogeographical aspects of the montane forests of the chain ofmountains on the eastern side of Africa. pp. 482-494 in Troll, C. and Lauer, W.(eds). Geological relations between the Southern Temperate zone and the Tropicalmountains. Wiesbaden. 563 pp.
Dale, I. R. & Greenway, P. J. 1961. Kenya trees & shrubs. Buchanan’s Kenya Est.Ltd., Nairobi. 654 pp.
Daniel Gamachu 1990. Some patterns of altitudinal variation of climatic elements inthe mountainous regions of Ethiopia. pp. 65-78 in Messerli, B., & Hurni, H. (eds).African Mountains and Highlands: Problems and Perspectives. Walsworth press,Inc. Marceline. 439 pp.
Demel Teketay 1991. Problems associated with raising trees from seeds: TheEthiopian experience. In Lieth, H. & Lohmann, M. (eds). Restoration of TropicalForest Ecosystem. pp. 91-100. Kluwer Academic Publishers. Dordrecht, TheNetherlands. 269 pp.
Demel Teketay & Granström, A. 1995. Soil seed banks in dry Afromontane forests ofEthiopia. J. Veg. Sci. 6: 777-786
Demel Teketay. 1996. Seed ecology and regeneration in dry Afromontane forests ofEthiopia. Ph.D. dissertation, Swedish University of Agricultural Sciences. Umeå,Sweden. 175 pp.
Demel Teketay. 1997. Seedling populations and regeneration of woody species in dryAfromontane forests of Ethiopia. Forest Ecology and Management 98: 149-165.
Eklundh, L. 1996. AVHRR NDVI for monitoring and mapping of vegetation anddrought in East African environments. Ph.D. dissertation. Lund university,Sweden. 187 pp.
Eklundh, L. 1998. Estimating relations between AVHRR NDVI and Rainfall in EastAfrica at 10-day and monthly time scales. Int. J. Remote Sensing 19: 563-568.
Fimbel, R. A. & Fimbel, C. C. 1996. The role of exotic conifer plantations inrehabilitating degraded tropical forest lands: A case study from the Kibale forest inUganda. Forest Ecology and Management. 81: 215-226.
Friis, I. 1992. Forests and forest trees of North-east tropical Africa. Kew Bull. Add.Ser. 15: 1-396.
Garwood, N. C. 1996. Functional morphology of tropical tree seedlings. pp. 59-129 in Swaine,M. D. (ed.). The ecology of tropical forest tree seedlings. UNESCO, Paris.
43
Garwood, N. C. 1989. Tropical Soil Seed Banks: A Review. pp. 149-209. In M. A. Leck, V. T.Parker, and R. L. Simpson (eds.). Ecology of Soil Seed Banks. Academic press, London,England.
Geldenhuys, C. J. 1997. Native forest regeneration in pine and Eucalyptusplantations in Northern province, South Africa. For. Ecol. Managem. 99: 101-115
Gerhardt, K. & Hytteborn, H. 1992. Natural dynamics and regeneration methods intropical dry forests - an introduction. J. Veg. Sci. 3:361-364.
Gerhardt, K. 1994. Seedling Development of four tree species in secondary Tropicaldry forest in Guanacaste, Costa Rica. Ph.D. Dissertation. Uppsala. University.
Grosjeaen, M. Messerli, B. 1990. African Mountains and Highlands: Potential andconstraints. pp.33-48. in Mersserli, B., Hurni, H. (eds). African mountains andHighlands: Problems and Perspectives. Walsworth press, Inc. Marceline. 439 pp.
Hall, P. & Bawa, K. 1993. Methods to assess the impact of extraction of non-timbertropical forest products on plant populations. Economic Botany 47: 234-47.
Hamilton, A. C. 1992. History of forests and climate. pp. 17-25. in Sayer, J. A.,Harcourt, C. S. & Collins N. M. (eds.). The conservation atlas of Tropical forests.Africa. New York IUCN. 288 pp.
Harper, J. L. 1977. Population biology of plants. Academic press. New York. 892 pp.
Hedberg, I. & Edwards, S. (eds). 1989. Flora of Ethiopia. Vol 3. Addis Ababa Univ.,Addis Ababa. , Ethiopia and Uppsala University, Uppsala, Sweden.659 pp.
Helldén, U. & Eklundh, L. 1988. National drought impact monitoring. A NOAANDVI and precipitation data study of Ethiopia. Lund studies in geography. LundUniversity press. No.15. 55 pp.
Henrickson, B., Sultan Tilimo, Ross, S., Wijntje-Bruggeman, H. Y. & Fitssum Fitwe.1983. Provisional soil depth map of Ethiopia. Ministry of Agriculture, AddisAbeba.
Horvitz, C. C. & Schemske, D. W. 1995. Spatio-temporal variation in demographictransitions of a tropical understory herb: Projection matrix analysis. Ecol. Monogr.65: 155-192.
Hurni, H. 1982. Climate and the dynamics of altitudinal belts from the last coldperiod to the present day: Semien mountains, Ethiopia. G13, Vol. 2. Univ. ofBerne.
Hurni, H. 1987. Erosion - productivity - conservation systems in Ethiopia. Proc. 4thIntern. Conf. on Soil Conservation, Venezuela, pp. 2-20.
Hurni, H. 1988. Degradation and conservation of soil resources in the Ethiopian
44
highlands. Mountain Res. and Developm. 8: 123-130.
Hurni, H. 1993. Land degradation, famine and land resource scenarios in Ethiopia.pp. 27-61 in Pimentel, D. (ed.). World Soil Erosion and Conservation. PressSyndicate, Univ. Cambridge, England.
Hutchings, M. J., Booth, K. D. & Waite, S. 1991. Comparison of survivorship by thelogrank test: Criticisms and alternatives. Ecology 72: 2290-2293.
Jansen, P. C. M. 1981. Spices, Condiments and Medicinal plants in Ethiopia. Pudoc,Wageningen, the Netherlands. 277 pp.
Jones, P. S. 1991. Restoration of Juniperus procera and Olea europaea ssp.cuspidata woodlands in Eritrea. Ph.D. diss., Univ. Stirling, Scotland. 304 pp.
Kebrom Tekle, Backéus, I., Skoglund, J. and Zerihun Woldu 1997. Vegetation on hillslopes in southern Wello, Ethiopia: Degradation and regeneration. Nord. J. Bot.17: 483-493.
Kebrom Tekle 1998. Ecological Rehabilitation of Degraded Hill Slopes in southernWello, Ethiopia. Compr. Summ. of Uppsala Diss. Fac. Sc. and Techn. 363: 1-36.
Kroon, H. de, Groenendael, J. van & Ehrlén, J. 2000. Elasticities: A review ofmethods and model limitations. Ecol. 81: 607-618.
Kroon, H. de, Plaiser, A., & Groenendael, J. van 1986. Elasticity: The relativecontribution of demographic parameters to population growth rate. Ecol. 67: 1427-1431.
Kropác, Z. 1966. Estimation of weed seeds in arable soil. Pedobiologia 6: 105-128
Leenhouts, P. W. 1983. Notes on the Extra-Australian species of Dodonaea(Sapindaceae). Blumea 28: 271-289.
Lefkovitch, L. P. 1965. The study of population growth in organisms grouped bystages. Biometrics 21: 1-18.
Legesse Negash 1993. Investigations on the germination behaviour of wild oliveseeds and the nursery establishment of the germinants. Ethiop. J. Sci., 16: 71-81.
Legesse Negash 1995. Indigenous trees of Ethiopia. Biology, uses and propagationtechniques. SLU Reprocentralen Umeå, Sweden. 285 pp.
Lieberman, D. 1996. Demography of tropical tree seedlings: A Review. pp 131-138in Swaine, M. D. (ed). The ecology of tropical forest tree seedlings. UNESCO,Paris. 340 pp.
Lisanework Nigatu & Michelsen, A. 1994 Litterfall and nutrient release by
45
decomposition in tree plantations compared with a natural forest in the Ethiopianhighland. Forest Ecology and Management 65: 149-164.
Lykke, A. M. 1998. Assessment of species composition change in savanna vegetationby means of woody plants' size class distributions and local information. Biodiv.and Conserv. 7: 1261-1275.
Lübbe, W. A. & Geldenhus, C. J. 1991. Regeneration patterns in planted and naturalforest stands near Knysana, Southern cape. S. Afr. For. J. 159: 43-50.
Manly, B. F. J. 1997. Randomisation, Bootstrap, and Monte Carlo methods inBiology. Chapman & Hall, London. 399 pp.
Magurran, A. E. 1991. Ecological diversity and its measurement. Chapman and Hall,London, England. 179 pp.
Menges, E. S. 1990. Population viability analysis for an endangered plant. Conserv.Biol. 4: 52-62.
Messerli, B. Hurni, H. Bekure Wolde-Semait, Shibru Tedla, Ives, J. D.& MesfinWolde-mariam. pp 7-15. in Messerli, B., & Hurni, H. (eds.). African mountainsand Highlands: African Mountains and Highlands: Problems and Perspectives.Walsworth press, Inc. Marceline. 439 pp.
Mesfin Taddese. 1990. An illustrated guide to the trees and shrubs in the Red Crossproject (UMCC-UPP) areas in Wello, Ethiopia. Ethiopian Red Cross Society.Addis Ababa. 181 pp.
Mesfin Wolde Mariam. 1991. Suffering under the God’s environment: A verticalstudy of the predicament of peasants in North-Central Ethiopia. Walsworth,Marceline. 220 pp.
Michelsen, A., Lisanework Nigatu & Friis, I. 1994. Impacts of the plantations in theEthiopian highland on soil fertility, shoot and root growth, nutrient utilisation andmycorrhizal colonisation. Forest Ecology and Management 61: 299-324.
MPED (Ministry of Planning and Economic Development) 1993. A preliminarysurvy on utilization & conservation of natural resources in southern Wello, Dessie.152 pp.
MINITAB 1997. Statistical Software, Release 12 for Windows. Minitab Inc. StateCollege, PA, USA.
Murphy, P,G. and Lugo, A. E. 1986. Ecology of tropical dry forest. Ann. Rev. Ecol.Syst. 17: 67-88.
O'Connor, T. G. 1993. The influence of rainfall and grazing on the demography ofsome African savannah grass: a matrix modelling approach. J. appl. Ecol. 30: 119-132.
46
O'Connor, T. G. 1994. Composition and population response of an African savannagrassland to rainfall and grazing. J. appl. Ecol. 31: 155-171.
Parrotta, J. A. 1992. The role of plantation forests in rehabilitating degraded tropicalecosystems. Agriculture, Ecosystem and Environment 41: 115-133.
Pichi-Sermolli, R. E. G. 1957. Una carta geobotanica dell' Africa Orientale (Eritrea,Etiopia, Somalia). A geobotanical map of East Africa Eritrea, Ethiopia,Somaliland. Webbia 13: 15-132.
Pohjonen, V. 1989. Establishment of fuel wood plantations in Ethiopia. SilvaCarelica 14: 1-388.
Pyke, D. A. & Thompson, J. N. 1986. Statistical analysis of survival and removal rateexperiments. Ecol. 67: 240-245.
Roberts, H. A. 1981. Seed banks in soil. Adv. appl. Biol. 6: 1-55.
Rodgers, A. 1992. Eastern Africa. pp 143-160 in Sayer, J. A., Harcourt, C. S. &Collins N. M. (eds.). The conservation Atlas of Tropical Forests. Africa. Simon &Schuster, New York.
Rizk Abdel-Fattah. M. & El-Ghazaly Gamal 1995. Medicinal and Poisonous plants ofQuatar. Scientific and Applied research centre, Univ. of Quatar.
Schemske, D. W, Husband, B. C. & Ruckelshaus, M. H. 1994. Evaluating approachesto the conservation of rare and endangered plants. Ecol. 75: 584-606.
Shea, K., Rees, M. & Wood, S. N. 1994. Trade-offs, elasticities and the comparativemethod. J. Ecol. 82: 949-957.
Sheil, D. & May, R. M. 1996. Mortality and recruitment rate evaluations inheterogeneous tropical forests. J. Ecol. 84: 91-100.
Silvertown, J. & Franco, M. 1993. Plant demography and habitat: A comparativeapproach. Plant Species Biol. 8: 67-73.
Sokal, R. R. & Rohlf, F. J. 1995. Biometry (3rd ed.). W. H. Freeman and Co. NY.887 pp.
Sørensen, T. A. 1948. A method of establishing groups of equal amplitude in plantsociology based on similarity of species content, and its application to analyses ofthe vegetation on Danish commons. Biol. Skr. Kongl. Danske Vidensk. Selsk. 5: 1-34.
Still, M. J. 1996. Rates of mortality and growth in three groups of Dipterocarpseedlings in Sabah, Malasia. pp. 315-332 in Swaine, M. D. (ed). The ecology oftropical forest tree seedlings. UNESCO, Paris. 340 pp.
47
Swaine, M. D., Lieberman, D. & Putz, F. E. 1987. The dynamics of tree populationsin tropical forest: a review. J. Trop. Ecol. 3:359-366.
Tamrat Bekele 1994. Phytosociological and ecology of a humid Afromontane foreston the central plateau of Ethiopia. J. Veg. Sci. 5: 87-98.
Tewolde Berhan G. Egziabher 1990. The importance of Ethiopian forests in theconservation of Arabica coffee Gene-pools. pp 65-72 in Proceedings of the twelfthplenary meeting of AETFAT, Hamburg. 484 pp.
Tewolde Berhan G. Egziabher 1989. The environmental variables which led to theecological crisis in Ethiopia. Coenoses 4: 61-67.
Tewolde Berhan G. Egziabhier 1988. Vegetation and Environment of the mountainsof Ethiopia: Implication for utilization and conservation. Mountain Res. andDevelopm. 8: 211-216.
Welling, C. H., Pederson, R. L. and van der Valk, A. G.. 1988. Recruitment from theseed bank and the development of emergent zonation during a draw-down in aprairie wetland. J. Ecol. 76: 483-496.
White, F. 1983. The vegetation of Africa. A descriptive Memoir to Accompany theUNESCO/ AETFAT/ UNSO Vegetation map of Africa. Paris: UNESCO.
Zar, J. H. 1984. Biostatistical Analysis. Prentice Hall, Englewood Cliffs, U.S.A. 718pp.