Page 1 of 8 11 March 2010 A comprehensive range of market research reports by award-winnin g economists and analysts are exclusively available for download from www.rhbinvest.com Recom : Overweight(Maintained) Table 1 : Plant ation Sector Valuations FY EPrice Fair Value EPS * (sen) EPS growth (% ) P ER (x ) P/NTA (x ) P/CF (x ) GDY (% ) Re c (RM/ s) (RM/ s) FY10 FY11 FY10 FY11 FY10 FY11 FY10 FY10 FY10 KLK Sep 17.02 19.50 97.8 125.1 38.1 28.0 17.4 13.6 3.1 14.0 2.9 OP IOI Corp Jun 5.54 6.65 27.9 31.5 -13.0 13.0 19.9 17.6 4.0 17.4 2.2 OP CBIP Dec 2.82 3.30 41.2 49.7 42.6 20.6 6.8 5.7 1.4 5.5 6.0 OP Sime Darby Jun 8.82 9.85 40.7 51.6 8.5 26.8 21.7 17.1 2.4 15.6 2.5 OP IJMP^ Mar 2.55 2.05 13.8 16.7 34.8 21.3 18.5 15.2 1.7 14.6 2.0 UP Genting Plantation # Dec 6.68 5.85 40.3 46.8 34.0 16.0 16.6 14.3 1.8 15.0 1.6 UP Sector Avg 5.1 22.0 19.8 16.3 ^ FY10-11 valuations refer to those of FY11-12 # Formerly known as Asiatic *Normalised ♦Stock levels fall.As expected, Malaysia’s CPO production continued to fall in Feb 10 by 12.4% mom and 2.6% yoy. Exports also fell 11.6% mom but rose 2.7% yoy, resulting in lower closing CPO stock levels (-10.9% mom) to 1.78m tonnes. Stock/usage ratio fell back to 9.5% (from 9.8% in Jan 10), nearing the 7-year average of 9.1% and is expected to moderate further going forward. ♦All neutral price forecasts, except one. The speakers on second day of the 2010 POC proved to be more bearish than the first, with the exception of one speaker, who had the most bullish forecast of all the speakers in the conference. All but one of the price forecasts given were relatively neutral, with only Chris deLavigne projecting prices to stretch to RM3,500/tonne in 2010 and 2011/12, although he expects volatility to be seen in both directions. We note that most of the price forecasts today (with the exception of Chris deLavigne) are in line with our forecasts.♦Five recent developments affecting the palm oil industry last month: (1) South American soybean crops still on track; (2) Eight vegetable oil production forecasts; (3) Supply problems for palm oil continue; (4) Crude oil price on rising trend again; and (5) Further narrowing of discounts with soyoil and rapeseed oil. ♦Risks include: (1) a significant change in crude oil price trend; (2) weather abnormalities; (3) change in emphasis on implementing global biofuel mandates and trans-fat policies; (4) significant changes in trade policies of vegetable oil importing or exporting countries; and (5) a faster or slower-than-expected global economic recovery. ♦Forecasts and Investment Case. Despite the seemingly conflicting views expressed by today’s speakers, most of the price forecasts given were in line with our price view for the year. As such, we maintain our average CPO price assumptions of RM2,500/tonne for 2010 and RM2,700/tonne for 2011. We maintain our Overweight stance on the sector as a whole and reiterate our recommendation for investors to stick with the more liquid stocks given the anticipated volatile market conditions in 2010. We maintain our Outperform recommendations on IOIC, KLK, Sime Darby and CBIP , and Underperform recommendation on Genting Plantations and IJMP .Corporate Highlights Sector Update Plantation Neutral Price Forecasts Amid Positive Monthly Plantation Statistics Chart 1. CPO vs soyoil and rapeseed oil prices 100 300 500 700 900 1,100 1,300 1,500 1,700 90 91 92 93 94 95 96 97 98 99 00 01 02 03 04 05 06 07 08 09 10 US$/tonne CPO So y Oi l Ra pe se edOi l Chart 2. CPO vs crude oil prices 0 20 40 60 80 100 120 140 160 J a n - 0 0 A p r - 0 0 J u l - 0 0 O c t - 0 0 J a n - 0 1 A p r - 0 1 J u l - 0 1 O c t - 0 1 J a n - 0 2 A p r - 0 2 J u l - 0 2 O c t - 0 2 J a n - 0 3 A p r - 0 3 J u l - 0 3 O c t - 0 3 J a n - 0 4 A p r - 0 4 J u l - 0 4 O c t - 0 4 J a n - 0 5 A p r - 0 5 J u l - 0 5 O c t - 0 5 J a n - 0 6 A p r - 0 6 J u l - 0 6 O c t 0 6 J a n - 0 7 A p r - 0 7 J u l - 0 7 O c t - 0 7 J a n - 0 8 A p r - 0 8 J u l - 0 8 O c t - 0 8 J a n - 0 9 A p r - 0 9 J u l - 0 9 O c t - 0 9 J a n - 1 0 C r u d e o i l p r i c e s ( U S $ / b a r r e l ) 0 200 400 600 800 1000 1200 1400 C P O s p o t p r i c e s ( U S $ / t o n n e ) Cr udeOi l(US$/b ar rel) CP O(US$ /t onn e) Correlation factor of0.9x in 2007 narrowed to 0.75x in 1H08, and rose again to 0.95x in 2H08. Correlation factor started normalising to 0.7x from Dec-08, but rose again from Sep- 09 onwards to close to 1x Hoe Lee Leng (603) 92802184 [email protected]11 March 2010 RHB Research Institute Sdn Bhd A member of the RHB Banking Group Company No: 233327 -M M a l a s i a M A R K E T D A T E L I N E P P 7 7 6 7 / 0 9 / 2 0 1 0 ( 0 2 5 3 5 4 )
A comprehensive range of market research reports by award-winning economists and analysts are exclusivelyavailable for download from w w w. r h b i n v e s t . c o m
Sector Avg 5.1 22.0 19.8 16.3^ FY10-11 valuations refer to those of FY11-12 # Formerly known as Asiatic *Normalised
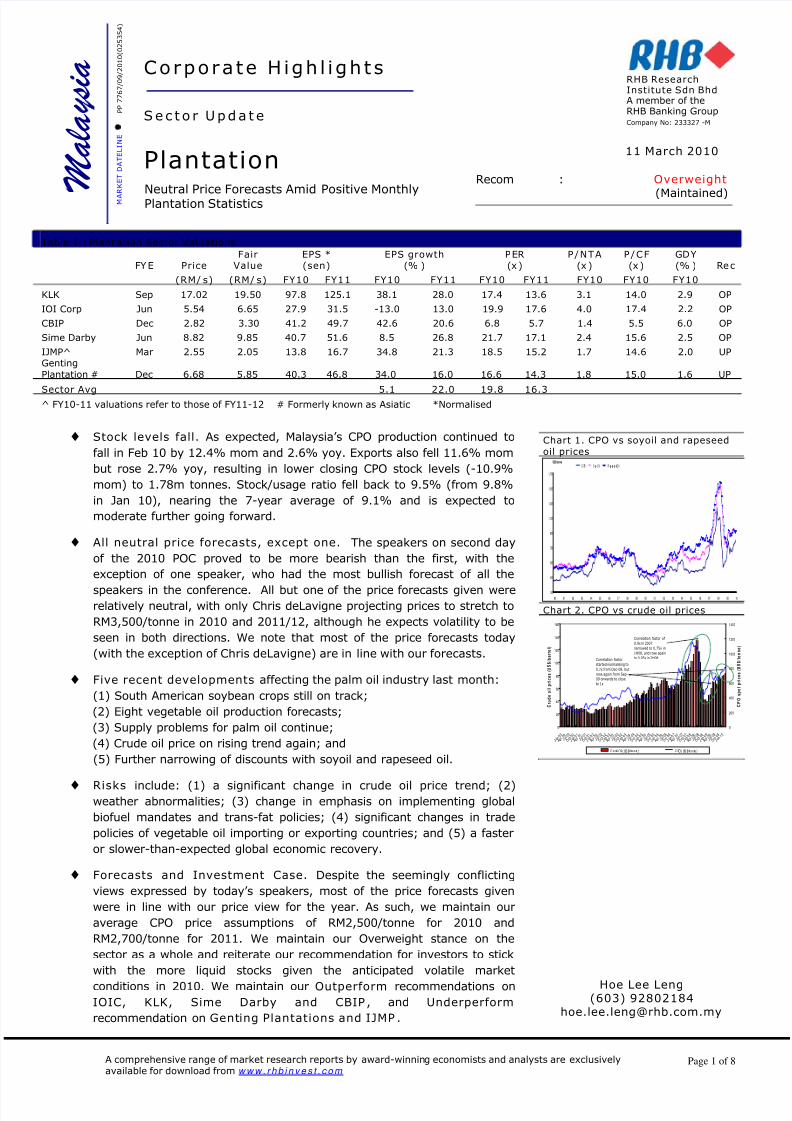
♦ Stock levels fall. As expected, Malaysia’s CPO production continued tofall in Feb 10 by 12.4% mom and 2.6% yoy. Exports also fell 11.6% mombut rose 2.7% yoy, resulting in lower closing CPO stock levels (-10.9%mom) to 1.78m tonnes. Stock/usage ratio fell back to 9.5% (from 9.8%in Jan 10), nearing the 7-year average of 9.1% and is expected tomoderate further going forward.
♦ All neutral price forecasts, except one. The speakers on second dayof the 2010 POC proved to be more bearish than the first, with theexception of one speaker, who had the most bullish forecast of all the
speakers in the conference. All but one of the price forecasts given wererelatively neutral, with only Chris deLavigne projecting prices to stretch toRM3,500/tonne in 2010 and 2011/12, although he expects volatility to beseen in both directions. We note that most of the price forecasts today(with the exception of Chris deLavigne) are in line with our forecasts.
♦ Five recent developments affecting the palm oil industry last month:(1) South American soybean crops still on track;(2) Eight vegetable oil production forecasts;(3) Supply problems for palm oil continue;(4) Crude oil price on rising trend again; and(5) Further narrowing of discounts with soyoil and rapeseed oil.
♦ Risks include: (1) a significant change in crude oil price trend; (2)weather abnormalities; (3) change in emphasis on implementing globalbiofuel mandates and trans-fat policies; (4) significant changes in tradepolicies of vegetable oil importing or exporting countries; and (5) a fasteror slower-than-expected global economic recovery.
♦ Forecasts and Investment Case. Despite the seemingly conflictingviews expressed by today’s speakers, most of the price forecasts givenwere in line with our price view for the year. As such, we maintain ouraverage CPO price assumptions of RM2,500/tonne for 2010 andRM2,700/tonne for 2011. We maintain our Overweight stance on thesector as a whole and reiterate our recommendation for investors to stickwith the more liquid stocks given the anticipated volatile marketconditions in 2010. We maintain our Outperform recommendations onIOIC, KLK, Sime Darby and CBIP , and Underperform recommendation on Genting Plantations and IJMP .
A comprehensive range of market research reports by award-winning economists and analysts are exclusivelyavailable for download from w w w. r h b i n v e s t . c o m
Monthly Statistics
♦ Drop in production and stock levels... As expected, Malaysia’s CPO production continued to fall in Feb 10 by12.4% mom and 2.6% yoy to 1.16m tonnes. Exports also fell 11.6% mom but rose 2.7% yoy to 1.29m tonnes,while imports fell back 64% mom to 0.05m tonnes. As a result, closing CPO stock levels fell 10.9% mom to1.78m tonnes in Feb 10 (from 2.0m tonnes in Jan 10), although on a yoy comparison, this was still 14% higher.Most notably, the mom decline in exports was mainly to China (-20.3%), Japan (-21.3%), Pakistan (-43.3%) andUS (-28.9%); partially offset by an increase to Bangladesh (+269.0%), Benin (+25.4%), Egypt (+43.3%), India(+19.5%), UAE (+247.5%) and the EU (+14.9%). The yoy increase in exports was mainly to China (+54.1%),Bangladesh (>600%), Benin (+46.2%), UAE (+7.2%), US (+2.9%) and the EU (+39.9%); partially offset by adecline to Egypt (-30.7%), India (-31.4%) and Pakistan (-14.0%).
♦ … leading to another fall in stock/usage ratios. As a result of the lower CPO stock levels, stock/usage ratiofell back to 9.5% (from 9.8% in Jan 10), which is nearing the 7-year average of 9.1%. We expect this tomoderate further going forward as the weak seasonal production period continues and as exports pick up furtheron an improved economic outlook.
A comprehensive range of market research reports by award-winning economists and analysts are exclusivelyavailable for download from w w w. r h b i n v e s t . c o m
Notes From P alm Oil Conference
♦ All neutral price forecasts, except one. The speakers on second day of the 2010 POC (Palm and Lauric OilsConference) proved to be more bearish than the first, with the exception of one speaker, who had the mostbullish forecast of all the speakers in the conference. Price forecasts given by five speakers today, including MrHarald Sauthoff from Cognis GmBH, Mr. Chris de Lavigne from Frost & Sullivan, Mr Ambono Janurianto from PTBakrie Sumatera Plantations, Dr James Fry from LMC International and Mr Thomas Mielke from Oil World. All but
one of the price forecasts given were relatively neutral, with only Chris deLavigne projecting prices to stretch toRM3,500/tonne in 2010 and 2011/12, although he expects volatility to be seen in both directions. We note thatmost of the price forecasts today (with the exception of Chris deLavigne) are in line with our forecasts.
♦ Price forecasts summarised. The summary of the price forecasts are in Table 2 below:
Table 2: CPO Price Forecasts From Ind ustry Experts For 2010 Overall View
Harald Sauthoff Vice President, Cognis GmBH
RM2,400-2,800/tonne, with an average of RM2,600/tonne for CY2010
Neutral with bearishundertone
Chris deLavigneAsian Director, Frost & Sullivan
No specific forecast for the year.Projects CPO prices to get back to RM3,500/tonne quickerthan expected in 2010 and especially in 2011/12
Expects volatility to continue.
Bullish
Ambono JanuriantoPresident Director, PT Bakrie Sumatra Plantations
RM2,400-2,800/tonne Neutral
Dr. James FryChairman, LMC International Ltd
No specific price forecast, but expects prices to fall afterseasonal peak in 2HCY2010If crude oil @ US$78/barrel, CPO @ RM2,600/tonneIf crude oil @ US$71/barrel, CPO @ RM2,450/tonne
Neutral with bearishundertone
Thomas MielkeExecutive Director, Oil World
RM2,400-2,900/tonne, with an average of RM2,550/tonne for CY2010
Neutral
Source: POC 2009 Handouts, RHBRI
♦ Tw o different analytical styles. Today’s speakers seemed to have two different styles of analysis, focusing on:(1) the basic fundamental factors affecting vegetable oils based on demand and supply prospects; and (2) theglobal economic scenario and the relationship between vegetable oils and mineral oils. Thomas Mielke of OilWorld and Ambono Janurianto of Bakrie Sumatra focused more on the basic fundamental factors affectingvegetable oils, while Harald Sauthoff of Cognis, Chris deLavigne of Frost & Sullivan and Dr. James Fry of LMCInternational focused more on the global economic scenario and the relationship between vegetable and mineraloils.
♦ Fundamental analysis based on vegetable oil S&D prospects… The two speakers here focused very muchon supply and demand scenarios of vegetable oils, in particular palm oil. Mr Thomas Mielke believes that whiledemand and supply fundamentals of CPO remain strong, CPO prices could be close to the peak at current levelsunless new bullish factors materialise in the form of abnormal weather impacts resulting in supply constraints.This however, does not mean that Mr Mielke believes there is downside potential for prices, as he expects currentCPO prices to be well supported and to trade in a narrow price band of RM2,400-2,900/tonne for CY2010. Hisanalysis is based on the expectation that the stock/usage ratio of the world’s 17 oils and fats will continue to fallfor the second year in a row to 10% in Aug/Sept 2010 (from 11% in 2009), as consumption is expected to rise by6.5m tonnes versus production of 5.9m tonnes. Demand growth is expected to come from both food (60%) andnon-food (40%) industries and there is expected to be a rising dependence on palm oil, given that exports of soya oil, rapeseed oil and sunflower oil are shrinking. In the longer term, Mr Mielke remains bullish on CPO’sprospects, and projects that CPO production would need to rise by a CAGR of 12-13% p.a. in the next five yearsto 2015 to meet demand, as production of soybean oil falls by a similar amount.
♦ … resulting in neutral short-term price forecasts, but positive long-term outlook. Mr Ambani Januriantoalso believes the future prospects of CPO remain bullish, especially in view of Indonesia’s regulations whichinclude: (1) a scaled CPO export tax regime based on prices; (2) a limitation on CPO exports of 50% by 2015 and30% by 2020 to promote domestic downstream processing; (3) a territorial landscape plan which only allowsgrowth of plantation area of 200,000ha/year from 2009 onwards (from 300,000ha/year); (4) a biodiesel mandateof 2.5-3% in 2010, rising to 5-7% in 2015, 10% in 2020 and 20% in 2025; and (5) a biodiesel subsidy of
A comprehensive range of market research reports by award-winning economists and analysts are exclusivelyavailable for download from w w w. r h b i n v e s t . c o m
US$120/tonne which started in Jan 2009. With these regulations in place and assuming they are adhered to,Indonesia may not necessarily see huge significant increases in CPO exports in the coming years, thus resulting instronger CPO prices in the longer term. For 2010 however, Mr Janurianto expects CPO prices to range betweenRM2,400-2,800/tonne.
♦ Analysis based on global economic outlook w hich governs commodities prices… Mr Harald Sauthoff andDr. James Fry both believe that the global economy could be facing a double-dip situation currently, especially
when the stimulus packages are completed and/or withdrawn and governments start tightening their budgets. Inthis scenario, the US$ would start strengthening again and commodity prices will soon be affected and in Dr Fry’sview, this may happen within the next 6-12 months. Both Mr Sauthoff and Dr Fry believe that current vegetableoil prices are too high to begin with, based on their expectations of crude oil prices and the relationship betweencrude and mineral oil prices. Although both speakers gave fairly neutral CPO price forecasts for the year, of RM2,400-2,800/tonne for Mr Sauthoff and RM2,450-2,600/tonne for Dr Fry (depending on where crude oil pricesare), the longer-term outlooks expressed have more bearish undertones, based on their expectations for aslower-than-expected global economic recovery.
♦ … resulting in tw o very different price forecasts. Although Mr Chris deLavigne is in agreement with MrSauthoff and Dr Fry that the current global economy and commodity markets have been propped up bygovernment money over the last six months, he believes that the US$ would not strengthen, but start to weaken
again on the back of another bursting of an asset bubble. He believes this could happen as early as June/July2010 and continue through to 2011, thereby resulting in commodity prices rising again on the back of bothfundamental and financial demand. While he believes that the fundamental demand for vegetable oils willcontinue to grow, especially with biofuel policies in place, he believes that financial/speculation demand could alsobe higher than expected. As such, Mr deLavigne expects the choppy historical crude oil and vegetable oil pricesseen in 2007/8 to repeat itself with prices expected to rise especially in 2011/2012, projecting that CPO pricescould get back to RM3,500/tonne sooner than expected.
Recent Developments
♦ Five recent developments. Over the recent month, there have been five main developments affecting the palmoil industry which we would like to highlight, including:
(1) South American soybean crops still on track;
(2) Eight vegetable oil production forecasts;
(3) Supply problems for palm oil continue;
(5) Crude oil price on rising trend again; and
(6) Further narrowing of discounts with soyoil and rapeseed oil.
( 1 ) S o u t h A m e r i c a n so y b e a n c r o p s st i l l o n t r a c k - Ne u t r a l
⇒ South America’s record soybean crop started coming into the market in Feb 2010 already, with high exportscoming out from Brazil, while Argentinean exports are expected to start rising from April 2010 onwards. Despitewidespread infestation of the Asian rust fungus and other diseases, Oil World continues to expect South America’ssoybean production to rise by 32.3% yoy to 128.8m tonnes in 2010, due to higher harvested soybean area andthe impact of rainfall received in Dec/Feb 2009/10. As mentioned in our previous report dated 11 Feb 2010, weare not too worried about the large upcoming soybean crop, given that a significant share of this increase wouldbe earmarked for biodiesel production in South America and will not be available on the soya oil export market.In addition, we highlight the increasing risk of a strike of Argentine farmers, as one of the major farmer unions isreportedly pushing for a general strike in an effort to change government agricultural policy to liberalise wheatexports and reduce export taxes on soybeans and other commodities.
A comprehensive range of market research reports by award-winning economists and analysts are exclusivelyavailable for download from w w w. r h b i n v e s t . c o m
( 2 ) 8 v e g e t a b l e o i l p r o d u c t i o n f o r e c a s t s – Po s i t i v e
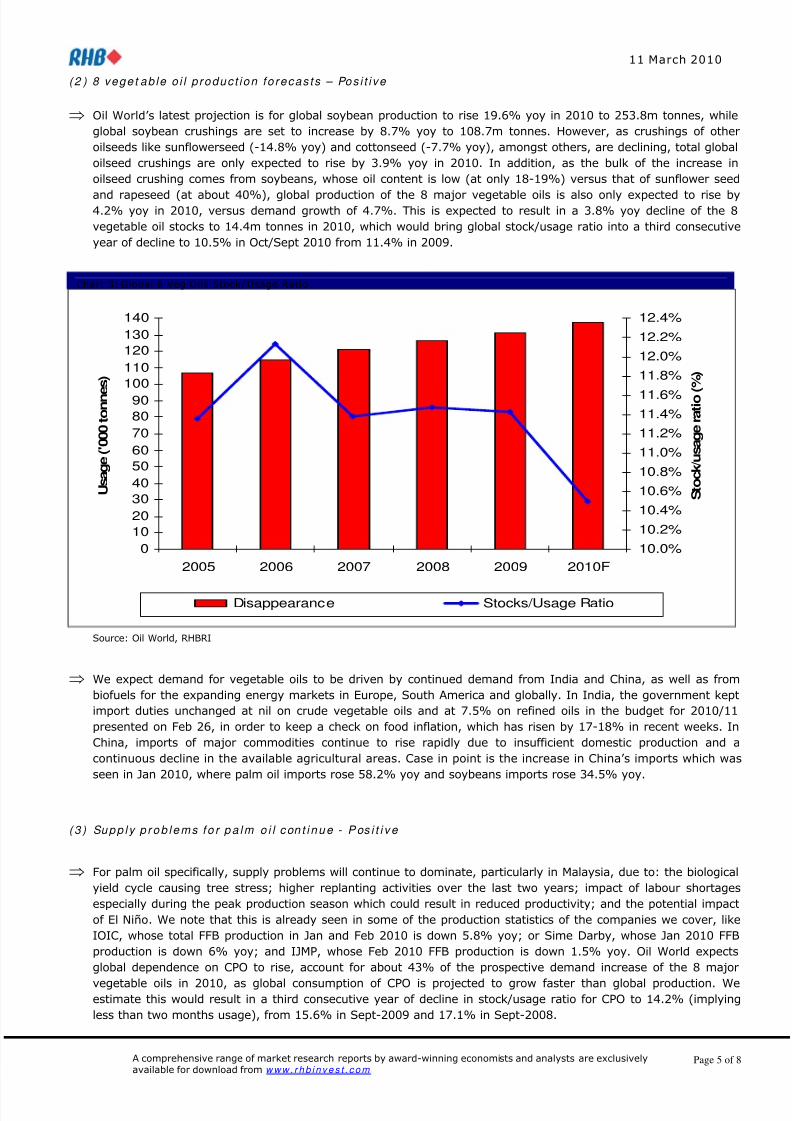
⇒ Oil World’s latest projection is for global soybean production to rise 19.6% yoy in 2010 to 253.8m tonnes, whileglobal soybean crushings are set to increase by 8.7% yoy to 108.7m tonnes. However, as crushings of otheroilseeds like sunflowerseed (-14.8% yoy) and cottonseed (-7.7% yoy), amongst others, are declining, total globaloilseed crushings are only expected to rise by 3.9% yoy in 2010. In addition, as the bulk of the increase inoilseed crushing comes from soybeans, whose oil content is low (at only 18-19%) versus that of sunflower seed
and rapeseed (at about 40%), global production of the 8 major vegetable oils is also only expected to rise by4.2% yoy in 2010, versus demand growth of 4.7%. This is expected to result in a 3.8% yoy decline of the 8vegetable oil stocks to 14.4m tonnes in 2010, which would bring global stock/usage ratio into a third consecutiveyear of decline to 10.5% in Oct/Sept 2010 from 11.4% in 2009.
Chart 3: Global 8 Veg Oils Stock/ Usage Ratio
0102030405060708090
100110120130140
2005 2006 2007 2008 2009 2010F
U s a g e
( ' 0 0 0 t o n n e s )
10.0%10.2%
10.4%10.6%10.8%
11.0%11.2%11.4%11.6%
11.8%12.0%12.2%
12.4%
S t o c k / u s a g e r a t i o
( % )
Disappearance Stocks/Usage Ratio
Source: Oil World, RHBRI
⇒ We expect demand for vegetable oils to be driven by continued demand from India and China, as well as frombiofuels for the expanding energy markets in Europe, South America and globally. In India, the government keptimport duties unchanged at nil on crude vegetable oils and at 7.5% on refined oils in the budget for 2010/11presented on Feb 26, in order to keep a check on food inflation, which has risen by 17-18% in recent weeks. InChina, imports of major commodities continue to rise rapidly due to insufficient domestic production and acontinuous decline in the available agricultural areas. Case in point is the increase in China’s imports which wasseen in Jan 2010, where palm oil imports rose 58.2% yoy and soybeans imports rose 34.5% yoy.
( 3 ) Su p p l y p r o b l e m s f o r p a l m o i l c on t i n u e - P os i t i v e
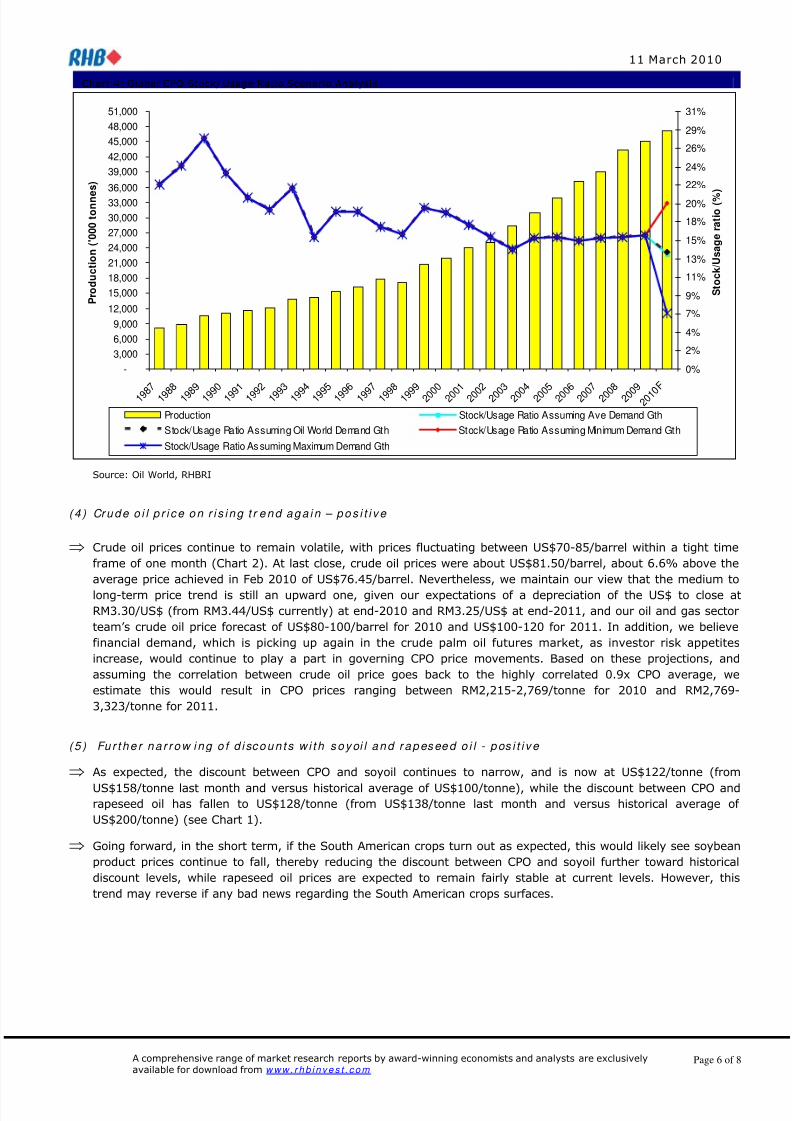
⇒ For palm oil specifically, supply problems will continue to dominate, particularly in Malaysia, due to: the biologicalyield cycle causing tree stress; higher replanting activities over the last two years; impact of labour shortagesespecially during the peak production season which could result in reduced productivity; and the potential impactof El Niño . We note that this is already seen in some of the production statistics of the companies we cover, likeIOIC, whose total FFB production in Jan and Feb 2010 is down 5.8% yoy; or Sime Darby, whose Jan 2010 FFBproduction is down 6% yoy; and IJMP, whose Feb 2010 FFB production is down 1.5% yoy. Oil World expectsglobal dependence on CPO to rise, account for about 43% of the prospective demand increase of the 8 major
vegetable oils in 2010, as global consumption of CPO is projected to grow faster than global production. Weestimate this would result in a third consecutive year of decline in stock/usage ratio for CPO to 14.2% (implyingless than two months usage), from 15.6% in Sept-2009 and 17.1% in Sept-2008.
A comprehensive range of market research reports by award-winning economists and analysts are exclusivelyavailable for download from w w w. r h b i n v e s t . c o m
Chart 4: Global CPO Stock/ Usage Ratio Scenario Analysis
Production Stock/Usage Ratio Assuming Ave Demand GthStock/Usage Ratio Assuming Oil World Demand Gth Stock/Usage Ratio Assuming Minimum Demand GthStock/Usage Ratio Assuming Maximum Demand Gth
Source: Oil World, RHBRI
( 4 ) Cr u d e o i l p r i c e o n r i s i n g t r e n d a g a i n – p o s i t i v e
⇒ Crude oil prices continue to remain volatile, with prices fluctuating between US$70-85/barrel within a tight timeframe of one month (Chart 2). At last close, crude oil prices were about US$81.50/barrel, about 6.6% above theaverage price achieved in Feb 2010 of US$76.45/barrel. Nevertheless, we maintain our view that the medium tolong-term price trend is still an upward one, given our expectations of a depreciation of the US$ to close atRM3.30/US$ (from RM3.44/US$ currently) at end-2010 and RM3.25/US$ at end-2011, and our oil and gas sectorteam’s crude oil price forecast of US$80-100/barrel for 2010 and US$100-120 for 2011. In addition, we believefinancial demand, which is picking up again in the crude palm oil futures market, as investor risk appetitesincrease, would continue to play a part in governing CPO price movements. Based on these projections, andassuming the correlation between crude oil price goes back to the highly correlated 0.9x CPO average, weestimate this would result in CPO prices ranging between RM2,215-2,769/tonne for 2010 and RM2,769-3,323/tonne for 2011.
( 5 ) Fu r t h e r n a r r o w i n g o f d i sc o u n t s w i t h s o y oi l a n d r a p es ee d o i l - p os i t i v e
⇒ As expected, the discount between CPO and soyoil continues to narrow, and is now at US$122/tonne (from
US$158/tonne last month and versus historical average of US$100/tonne), while the discount between CPO andrapeseed oil has fallen to US$128/tonne (from US$138/tonne last month and versus historical average of US$200/tonne) (see Chart 1).
⇒ Going forward, in the short term, if the South American crops turn out as expected, this would likely see soybeanproduct prices continue to fall, thereby reducing the discount between CPO and soyoil further toward historicaldiscount levels, while rapeseed oil prices are expected to remain fairly stable at current levels. However, thistrend may reverse if any bad news regarding the South American crops surfaces.
A comprehensive range of market research reports by award-winning economists and analysts are exclusivelyavailable for download from w w w. r h b i n v e s t . c o m
Forecasts
♦ CPO price forecasts maintained. Despite the seemingly conflicting views expressed by today’s speakers, mostof the price forecasts given were in line with our price view for the year. As such, we maintain our average CPOprice assumptions of RM2,500/tonne for 2010 and RM2,700/tonne for 2011. YTD average spot prices of CPO of approximately RM2,550/tonne is in line with our projections, which assumes stronger CPO prices in the first half of the year versus the second half, following the CPO production cycle. We believe fundamental factors like the
current seasonally weak CPO production output, the impact of higher replanting activities in Malaysia over the lasttwo years, the impact of current weather abnormalities, the start of implementation of biofuel policies in manycountries in 2010 and the continuation of favourable trade tariffs, will continue to support stronger CPO prices inthe near term, while financial demand will continue to be one of the factors governing CPO and crude oil pricemovements in the medium term.
Risks
♦ Main risks include: (1) a significant change in crude oil price trend resulting in significant movement of CPOand other vegetable oils prices; (2) weather abnormalities resulting in an over- or under-supply of vegetableoils; (3) change in emphasis on implementing global biofuel mandates and trans-fat policies; (4) significantchanges in trade policies of vegetable oil importing or exporting countries; and (5) a faster or slower-than-expected global economic recovery, resulting in a higher- or lower-than-expected growth in demand forvegetable oils.
Valuations and Recommendations
♦ Overweight stance on sector maintained. We maintain our Overweight stance on the sector as a wholeand reiterate our recommendation for investors to stick with the more liquid stocks given the anticipatedvolatile market conditions in 2010. We maintain our Outperform recommendations on IOIC, KLK, SimeDarby and CBIP , and Underperform recommendation on Genting Plantations and IJ MP (see Table 3).
Table 3. Valuation Bases
CompanyFair Value
(RM/ share) Valuation Methodology
GentingPlantations
5.85 Target 14.5x PER CY10 earnings.
CBIP 3.30 Target PER of 8x CY10 for the oil mill engineering division and 12x CY10 for the plantation division.
IJMP 2.05 Target 14.5x PER CY10 earnings
IOIC 6.65 Target PER of 18x CY10 for the plantation division, 12.5x CY10 for the manufacturing division and13.5x CY10 for the property development and investment property divisions (on fully diluted basis).
KLK 19.50 Target PER of 18x CY10 for the plantation division, 12.5x CY10 for the manufacturing division, 13.5xCY10 for the property division and zero value less potential provisions for the retail division.
Sime Darby 9.85 10% discount to SOP comprising: target PER of 18x CY10 for the plantation division, 15x CY10 for theenergy & utilities division, 13.5x CY10 for the heavy equipment and property divisions and 12x CY10for the motor and other small divisions.
Source: RHBRI
Table 4: Impact of every RM100/tonne increase in CPO price