36
Plasmid expression in stressed bacteria Marín Llauradó, Ariadna Curs 2014-2015 Directors: Jordi García-Ojalvo, Letícia Galera Laporta GRAU EN ENGINYERIA BIOMÈDICA Treball de Fi de Grau

Plasmid expression in stressed
bacteria
Marín Llauradó, Ariadna
Curs 2014-2015
Directors: Jordi García-Ojalvo, Letícia Galera Laporta
GRAU EN ENGINYERIA BIOMÈDICA
Treball de Fi de Grau
GRAU EN ENGINYERIA EN
xxxxxxxxxxxx

Plasmid expression in stressed bacteria
Author: Ariadna Marín Llauradó
Supervisors: Jordi Garcia-Ojalvo
Letícia Galera Laporta

2
ABSTRACT
Plasmids are small double-stranded DNA molecules that are present in a high variety of bacteria. They usually encode non-essential proteins, such as antibiotic resistances or toxins, which can become an advantage during the course of infection. Even though the behaviour of bacteria under stress has been widely studied, the dynamics underlying the expression and copy number of plasmids under these conditions have yet to be characterized.
We have cloned into two plasmids with different nominal copy numbers a construct that contains a fluorescent protein gene (YFP) regulated by an inducible promoter. After transformation of these plasmids into two different Bacillus subtilis strains, one with a chromosomal integration of the same construct and a wild-type one, we have studied the changes in fluorescence levels produced by variations in stress conditions.
Flow cytometry results show an increased level of YFP expression from the high-copy plasmids in cells under stress, in comparison to those that grow in common LB medium. Transformed cells give rise to two populations with different fluorescence values; the first one presents similar expression to that of cells with only a chromosomal copy of the construct while the second shows higher fluorescence levels.

3
INTRODUCTION
Bacteria are prokaryotes, single-celled organisms that don’t present a nucleus, mitochondria or other organelles surrounded by a membrane. They have a typical length of few micrometres and can have many different shapes, such as rods, spheres or spirals. Bacterial cells present three main architectural regions: appendices that allow movement (flagella or pili), an envelope (formed by a capsule, a cell wall and a plasma membrane) and cytoplasm, which contains the genome and other cellular components, such as ribosomes (responsible for protein synthesis), polymerases and proteins.
Bacteria can be found all around the biosphere; in other words, in any place a eukaryote (an organism with cell nucleus and membrane-bound organelles) can inhabit. Moreover, they can also live in all kinds of extreme environments (polar ice, acidic hot-springs, deep terrestrial subsurface), as well as within higher forms of organisms. They have plenty of beneficial effects on the environment. They take up CO2 and transform it into organic material, produce O2 and fixate N2 into the soil, allowing plants to use it. Even within a host organism, microbes carry out important functions. In a healthy human being, the surfaces of the body (skin and mucous membranes) are inhabited by different types of bacteria. They protect our organism against harmful pathogens, help with the digestion of multiple nutrients and stimulate cell growth and production of antibodies (1).
However, some bacterial cells are pathogens themselves, meaning that they are capable of causing disease to plants, animals or humans. These cells can invade surface tissues or even internal tissues that bacteria should not reach, such as the lung or the blood vessels. They produce toxins that are noxious to the organism and, in some cases, can cause death.
Infections have been greatly decreased through the twentieth century (at least in developed countries) due to an improvement in sanitary conditions and immunization (vaccination campaigns). The gravity of these diseases and the complications that arise from them have also been decreased thanks to antibiotic treatment. Antibiotics are substances that either kill bacterial cells or inhibit its growth (bacteriostatic agents). They generally act by means of inhibiting cell wall synthesis, nucleic acid metabolism or protein synthesis, as well as by disrupting the cellular membrane. Their repeated use through the years has lead to an increase of antibiotic resistant bacteria, which have reached alarming numbers. These bacteria contain genes that protect them

4
against the toxicity of antibiotics. The acquisition of these genes can be mediated by two different mechanisms. On the one hand, accumulation of mutations can lead to the appearance of resistance genes. On the other hand, these genes can be exchanged through a variety of transfer systems between bacteria; in fact, most species can take up DNA from what we could consider as a “global gene pool” (2).
One of these transference methods is the exchange of conjugative plasmids. Conjugation is a process where DNA is transferred through direct contact between two individuals. This genetic material is typically in the form of a plasmid: a small, circular, double-stranded molecule of DNA. They are replicated independently from the chromosome and many copies can be present on a single cell.
Plasmids usually carry genes which are not essential for the survival of the cell (those are present on the chromosome); however, they can help cells overcome stressful situations such as the presence of antibiotics (resistance genes) or increase their pathogenicity (coding for virulence factors). We must keep in mind that replicating a plasmid requires a lot of resources (energy, replication machinery, nucleotides, etc.), which might lead to the loss of the plasmid in the absence of stress. This loss occurs due to dilution. Plasmids are distributed between daughter cells during division, which can cause one cell to have fewer copies than its sister. This can eventually lead to cells that don’t receive any copy of the plasmid during division. Since they don’t have to replicate it, they spend less energy and become more efficient. The increased efficiency can suppose faster growth and division than that of cells with plasmids.
Therefore, for bacteria to keep the plasmids, an environmental pressure is needed. When those cells are infecting a person who is treated by an antibiotic, whose resistance gene is present on a plasmid that some of those cells present, these cells undergo positive selection. Their fitness will be higher than that of other cells, guaranteeing their survival, division and the subsequent spread of the infection.
When bacteria are subjected to this kind of environment, they are under stressful conditions. The dynamics of these plasmids when the cells are under such stress is something that is not yet well characterized. Knowing whether they stop replicating the plasmid or synthesizing its proteins in order to save energy or adopt a different strategy could help us to understand the survival of some cells over others when they are stressed.

5
This project aims at clarifying how plasmid copy number changes under stressful conditions with respect to favorable conditions, with availability of nutrients and without stress signals. Since we cannot directly measure the number of copies, fluorescence has been used as a proxy by means of flow cytometry and time-lapse fluorescence microscopy experiments.
Two different strains of Bacillus subtilis, a wild-type one and another with a copy of the Yellow Fluorescent Protein (YFP) gene integrated into the genome under Phyperspank promoter, have been used as starting point. These strains are named PY79 and control-α, respectively. Phyperspank is an inducible promoter activated by isopropyl β-D-1-thiogalactopyranosid (IPTG), a reagent commonly used in molecular biology, which allows us to control expression of YFP. This construct (Phyperspank-YFP) has been cloned into two plasmids, one that presents a high number of copies within the cell (pDG148) and another with a lower copy number (pHP13). These plasmids have been transformed into the previous strains in order to measure the fluorescence produced by the plasmids in relation to that of the chromosomal integration.
Since all copies are under the control of the same promoter, fluorescence of the transformed strains is expected to be n-fold (PY79 with plasmid) or (n+1)-fold (control-α with plasmid) that of control-α, where n is the number of copies of the plasmid within the cell. Previous estimations of these copy numbers in stress conditions have been measured by Espinar et al (3), for pDG148 the mean number is approximately 75 in stationary conditions while for pHP13 it is around 6 copies.
In this work, we intend to identify variations in the production of fluorescent protein depending on the stress conditions of the media where they are cultured during induction. These changes in stress are tuned by addition of conditioned media, which possesses less nutrients and more stress peptides.
6
STATE OF THE ART
As we have previously said, plasmids are DNA chains that carry non-essential genes, which may become useful for some situations. During division, the different copies that are present in the cell are distributed between the daughter cells; however, this distribution might not be random, it may depend on the molecular machinery encoded in the plasmid.
Depending on the number of copies that a plasmid presents in bacterial cells, different partition systems can be found. While high-copy plasmids generally rely on the elevated number of copies to avoid their loss (assuming that due to the elevated number of copies, each daughter cell would at least receive one copy), low-copy ones usually code for an active partition mechanism (par +) (4). These par + systems organize the position of the plasmids within the cytoplasm in a way such that at least one of the copies goes to each new cell. There are different methods of control, some of them partition the copies exactly by half and others only take into account that each cell gets at least one copy. The first system is obviously more efficient in reducing loss of plasmids, but the metabolic cost is higher.
For a plasmid-host system to be maintained in a population, the plasmid loss rate and the metabolic burden need to reach equilibrium. Under conditions where having the plasmid is not positively selected, plasmid-free cells would duplicate faster (due to lower metabolic burden) and rapidly outnumber bacteria with the plasmid. Therefore, in conditions where this pressure for selection is applied intermittently (e.g.: when an antibiotic is administered), it is important for the population to avoid the early appearance of plasmid-free cells, in order to ensure survival when the selection stimuli appear. At this point it is where the importance of these partition systems arises.
Another relevant matter is the copy number control within each cell. Plasmids present machinery which allows its replication, independently from that of the chromosome. The main mechanism by which this is accomplished is the principle of inhibitor-dilution. The plasmid itself encodes an inhibitor that represses the initiation of replication; this protein is synthesized at a constant rate and has a short half-life (5). When the number of plasmids within the bacterium increases, the production of inhibitor also increases. This leads to a situation where the frequency of replication per plasmid is decreased. When the number of copies is lower than the mean copy number of the given plasmid, the opposite occurs.
7
In order for a pathogenic bacterial population to survive within a host organism that has been treated with antibiotics, the characteristic of acquiring new genetic material becomes greatly advantageous. As has been previously mentioned, plasmids can be transferred from one cell to another. On top of that, bacteria can also take up DNA from the environment.
A good exemplification of this behaviour is the entry of Bacillus subtilis into the competent state when subjected to nutrient limitation and high cell density (among others). In these conditions, a small fraction of the cells become competent (able to take up DNA), while the majority commit to sporulation, meaning that the cell produces a spore that is resistant to a variety of extreme environmental factors and allows the bacterium to persist until conditions improve.
The competent state is controlled by the activation of comK, which presents two different feedback loops: a positive one based on direct auto-activation and a slower indirect negative one. This circuit structure allows the occurrence of transient and repeated events. While the cell remains in this state, no cell division occurs. This lack of division can lead to a phenotype where the cell appears elongated and has the shape of a filament. When the bacterium exits competence, multiple divisions occur at one and more than two cells with normal length are formed (6).
Although much work has been done regarding the behaviour of competent cells, whether this state affects the plasmid copy number with respect to that of the normal stationary phase is still unclear. It could also be that cells that are not in the competent state modify its number of plasmid copies due to the lack of nutrients and the signals released in the medium. Moreover, stress could change the expression dynamics from plasmids, leading to increased or decreased protein concentration that does not correlate with the number of copies of that plasmid.
8
METHODOLOGY
In this section, the methods and protocols employed in the creation of the different strains, the preparation of the experiments and the analysis of the data will be detailed. Additional information regarding culture media, strain list, etc. can be found in the
Annexes section of this project.
Sequencing & in silico cloning design
In order to decide which one is the optimal site of the vector to insert the desired construct, a detailed map of the plasmid was needed. The sequence of pHP13 (with an insert that had to be removed) was kindly proportioned by Prof. Gurol Süel from University of California San Diego (who also provided us with the plasmid itself).
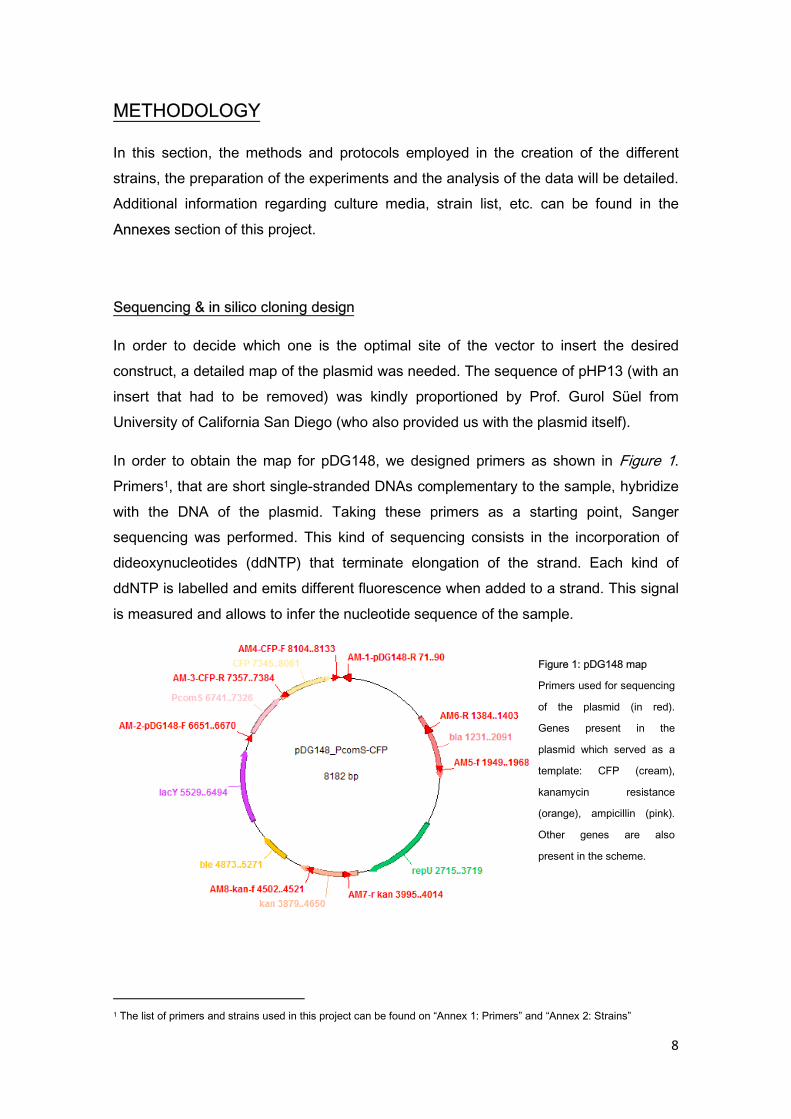
In order to obtain the map for pDG148, we designed primers as shown in Figure 1. Primers1, that are short single-stranded DNAs complementary to the sample, hybridize with the DNA of the plasmid. Taking these primers as a starting point, Sanger sequencing was performed. This kind of sequencing consists in the incorporation of dideoxynucleotides (ddNTP) that terminate elongation of the strand. Each kind of ddNTP is labelled and emits different fluorescence when added to a strand. This signal is measured and allows to infer the nucleotide sequence of the sample.
1 The list of primers and strains used in this project can be found on “Annex 1: Primers” and “Annex 2: Strains”
Figure 1: pDG148 map
Primers used for sequencing
of the plasmid (in red).
Genes present in the
plasmid which served as a
template: CFP (cream),
kanamycin resistance
(orange), ampicillin (pink).
Other genes are also
present in the scheme.

9
The sequence of the insert contained YFP under the control of a promoter induced by IPTG and the spectinomycin resistance gene (to allow selection of the colonies that have correctly acquired the plasmid).
In the case of pDG148, insert and vector were cut with the same restriction enzymes and assembled. In the case of pHP13, assembly was performed through complementary regions. We designed additional primers to allow sequencing of the resulting colonies, in order to confirm the correct assembly of the construct and that there were no mutations that could affect the behaviour of the construct (see Figure 2).
Plasmid extraction
In order to acquire the desired strains, the first thing that was needed was the vector where the insert had to be cloned. Both plasmids, pDG148 and pHP13, were obtained from Bacillus subtilis strains used in Espinar et al (3).
For the high copy number plasmid, we extracted the sample from a 10mL LB over-night culture with the corresponding antibiotic. On the other hand, for the low copy number one, two cultures were needed, since the quantity of plasmid present in each cell is smaller. Extraction was performed using a commercial kit.
We centrifuged the tubes to eliminate the liquid and resuspended the cells in 400μL of the corresponding buffer. Afterwards, alkaline lysis was carried out: a buffer that contains NaOH separates the plasmid and genomic DNA into single strands. The
Figure 2: In silico design of pDG148::Phyp-YFP (left) and pHP13::Phyp-YFP (right)
Primers used for cloning and sequenciation of the resulting plasmid (in red). Features of the insert that has been
introduced: Phyperspank promoter (pink), YFP (green), spectinomycin resistance and lacI (blue).

10
timing of this step is very important, because exceeding 5 minutes of exposition may lead the plasmid to be irreversibly denatured.
It has to be taken into account that Bacillus is a gram positive bacterium, which means that it has a thick peptidoglycan layer that makes disruption of the cell wall more difficult. Therefore, before adding the lysis buffer, chicken lysozyme had to be introduced. This enzyme from the innate immune system prevents bacterial infection by damaging the cell’s wall.
After lysis, another buffer with potassium acetate was added to renature the plasmid (join the two strands). This renaturation process doesn’t occur with the genomic DNA due to its big size, which is crucial to guarantee that the sample will contain only plasmid DNA.
We centrifuged the sample to let cell walls precipitate. Meanwhile, a column which possesses a silica membrane that binds the DNA under certain conditions was prepared. The liquid (without the turbulence) was charged into the column and centrifuged. A wash buffer was then added to remove impurities from the membrane.
Finally, we added between 30 and 50μL of type I water (highly purified) to the column, that was mounted into a clean eppendorf tube. After incubating for 1 minute at 60⁰C and 3 minutes at room temperature, the column was centrifuged one last time. We measured DNA concentration of the extracted plasmid and stored the sample at -20⁰C.
PCR amplification
Polymerase chain reaction (PCR) is a technique employed to amplify a DNA sequence. Two primers which are complementary to the 3’ ends of each strand of the target DNA are required. Repeated cycles of heating and cooling are used to melt the double-stranded sample DNA and amplify it.
The high temperature causes the double-strand to separate and by lowering the temperature both strands become templates for replication. The primers bind to the target and DNA polymerase extends them to form a new double-strand. Each new fragment becomes a target starting a chain reaction which leads to exponential amplification of the sample2.
2 Conditions used to amplify target DNA fragments can be found in “Annex 3: Experimental conditions”
11
In the case of pDG148, we amplified the sequences for insert and vector adding a restriction site at each end of the double-strands. The primers for the insert were designed incorporating the sequences for AvrII at 5’ end and SpeI at 3’ end. The vector’s primers amplified the plasmid without the original insert and added the sequences for SpeI at 5’ end and AvrII at 3’ end. It is crucial that the restriction sites are places at opposite ends in the vector and the insert, in order to allow posterior ligation of the fragments.
In the case of pHP13, we amplified the sequence of the insert using primers with a region which was complementary to that of the vector. These regions allowed the ligation of the fragments using Gibson assembly.
Gel electrophoresis
In order to ensure that we did not have any DNA fragments which were not our target sequence, we needed to perform a gel electrophoresis. This method allows the separation of the DNA strands present in the tube depending on their size.
An electric field is applied to move the DNA, which is negatively charged, through the agarose gel. The pores of the gel facilitate the movement of short DNA strands, while larger molecules move at a slower pace. To measure the length of the resulting bands, a size marker (also known as “ladder”) is run through the gel at the same time as the sample. It presents different bands with known size that allow to infer the length of the DNA strands in our tube.
To visualize the DNA sample, ethidium bromide is added during the preparation of the gel. This substance intercalates through the DNA and fluoresces when exposed to ultraviolet light. This property of intercalation makes it mutagenic (it can produce mutations in our genome); therefore, it must be employed with utmost care.
Increasing the agarose concentration of the gel allows to correctly separate shorter strands, while decreasing it is useful when our samples have thousands of base pairs. In this project, we used a concentration of 1% of agarose, which allows separation of fragments from a few hundred to 10 kylobases.
12
Band extraction and purification
Once the outcome of the gel was visualized and the band which corresponds to the size of our DNA target was located, we cut it using a scalpel and weighted it. To extract the DNA from the gel slice, a commercial kit was used.
Firstly, the gel slice was incubated at 60⁰C with a buffer that allowed its dissolution. We added isopropanol to the sample to improve binding to the membrane of the column, which is similar to that used in plasmid extraction. The column was charged with the liquid and then centrifuged.
After applying the washing buffer, the column was incubated at room temperature for approximately 5 minutes, to remove the remaining salts that could affect the following steps of cloning. We centrifuged the column again and mounted it on a clean eppendorf tube. 30μL of type I water were added and the tube was incubated for 1 minute at 60⁰C and 3 minutes at room temperature.
Lastly, the tube was centrifuged again and the DNA concentration of the sample was measured. We stored the sample at -20⁰C.
Cloning strategies
Traditional cloning
Cloning of the high copy number plasmid (pDG148) was performed using the traditional method. Vector and insert were cut using the pertinent restriction enzymes (AvrII and SpeI), the vector was dephosphorylated and afterwards ligation was carried out.
The selected enzymes work better with the addition of Buffer 4 (5 ul/tube). We incubated the tubes for approximately 3 hours at 37⁰C and purified the sample using a PCR Purification kit.
In order to prevent recircularization of the vector which we wanted to ligate to the insert, its dephosphorylation was needed. An alkaline phosphatase was added to a tube with the linearized plasmid. This protein catalyzes the removal of the phosphate placed at 5’ end of the DNA strand, leading to a reduction of the self-ligation rate of the sample.
13
This process was performed using Antarctic Phosphatase and its reaction buffer. The sample was incubated during 15 minutes at 37⁰C and, immediately after, it was heat inactivated by increasing the temperature to 65⁰C for 5 minutes.
Self-ligated plasmids possess the antibiotic resistance which will be used to select the colonies that have undergone successful cloning. Therefore, this step reduces the background found in our cloning, by reducing the number of undesired colonies that will grow in our plate.
Ligation was been carried out using a commercial kit. We added 50 ng of the vector and a quantity of vector described in Eq. 1 into a tube and adjusted the volume to 10 μL with type I water. Afterwards, 10 μL of buffer and 1 μL of T4 DNA ligase were also added.
Equation 1: �� ������ = 50�� ∗ �� � ������ ∗ 3�� � �������
The mix was briefly centrifuged and incubated during 7 minutes at room temperature. Then it had to be tapped on ice for immediate transformation or stored at -20⁰C.
Gibson assembly
We performed cloning of the low copy number plasmid (pHP13) using this method. It was developed by D. Gibson and colleagues on 2009 (7) to assemble linear DNA fragments in a single tube. This process converts different linear fragments that present overlapping sequences into a double-stranded DNA molecule.
Gibson assembly has clear advantages with respect to traditional cloning. Firstly, the fragments do not have to be cut with the same restriction enzyme, so no specific restriction sites are needed and no scar appears between the joined strands. Secondly, fewer steps are needed and the reaction takes place in a single tube, which reduces lose of sample due to pipetting. Lastly, more than two DNA fragments can be combined at the same time.
Prior to gel electrophoresis, we incubated the samples obtained from PCR are for 1 hour at 37⁰C with DpnI (and its buffer). This enzyme cuts the DNA at the methylated GA^TC sites. Since methylation occurs within a cell and not as a result of PCR amplification, it permits us to get rid of the plasmid which we used as a template and, therefore, eliminates false positive colonies.
14
As has been previously explained in the “Sequencing & in silico cloning design” section, the primers used to amplify the insert presented a sequence which was complementary to that of the ends of the amplified vector. 50 ng of the vector and a quantity of the insert calculated using the formula detailed in Eq.1, were adjusted at a volume of 10 μL with type I water and added to the tube with the Master Mix (a premixed, ready-to-use solution). Another tube where the insert was not added was used as a negative control.
The Master Mix used for Gibson cloning consists of three different enzymes which are placed within the same buffer. An exonuclease creates 3’ overhangs by cutting nucleotides from 5’ end of the other strand. This process allows hybridization with the complementary sequence of vector/insert. A DNA polymerase adds nucleotides to fill the gaps in the annealed fragments and a DNA ligase joins them through covalent bonding.
The tubes were incubated during 1 hour at 50⁰C to allow the reactions to take place. To increase the efficiency of cell transformation, the obtained solutions had to be filtered. We placed each of them on top of a desalting paper that floated on a plate filled with type I water. After approximately 30 minutes, the solutions could be carefully pipetted into a tube and stored at -20⁰C.
Transformation
In order to perform the experiments, the plasmid that was cloned had to be introduced into the desired Bacillus subtilis strain. However, we checked the sequence of the plasmid to ensure that the whole procedure has been successful. To facilitate plasmid extraction, an E. coli strain that presented no recombinases was first transformed.
Recombinases permit excision, insertion, inversion and translocation of short target site sequences that are specific to each enzyme. Since the sequence of the plasmid had to remain intact through the whole experiment, introducing the plasmid into one of these strains and then sequencing was the best way to proceed. Afterwards, the plasmids used to transform B. subtilis were chosen from one of the E. coli colonies that presented no mutations.
Escherichia coli

15
Transformation was carried out into chemically competent Top10 cells. As has been noted above, this strain does not present the gene for recombinase. These cells had already been made competent using calcium chloride, which debilitated the cell’s wall and, therefore, transformation could be performed without further preparations. It is important to note that these cells were in a very delicate state and can be damaged by sudden temperature changes or by mechanic forces (such as pipetting).
Vials containing the competent cells had been stored at -80⁰C and needed to be thawed on ice in order to start transformation. Two vials were needed for each transformation: one for the actual transformation and another that served as a negative control and pre. After approximately 15 minutes, we inserted 3μL of the ligation product into one of the tubes and 3μL of the ligation negative control into the other. The vials were mixed gently by tapping with a finger and incubated on ice for 30 minutes.
To allow the DNA uptake, a “heat shock” was needed. The cells were incubated for exactly 30 seconds at 42⁰C, which provoked formation of pores that served as entrance for the plasmids. As temperature was returned to normal by putting the vials back on ice, these pores closed.
We added 250μL of pre-warmed SOC3 medium, a very rich medium that has been seen to increase efficacy of transformation, to the tubes. This step had to be done in sterile conditions, since this medium is contaminated easily. The tubes were incubated at 37⁰C during 1 hour with shaking at 225 rpm. Afterwards, 100μL of the solution were plated onto LB agar selective plates. These plates were inverted and placed at 37⁰C.
Incubation time needed for colony growth depended on the antibiotic/bacteriostatic applied. Approximately 16 hours sufficed for ampicillin resistant colonies (pDG148), while more time was needed for chloramphenicol ones (pHP13). We picked the colonies that had grown on the plate and performed a colony PCR (which will be detailed later) to select the ones that had incorporated the desired plasmids. The plasmid was subsequently extracted and sequenced to verify that there were no mutations that would impair its correct functioning.
Bacillus subtilis
LB plates with the strains that had to be transformed were incubated overnight at 37⁰C. We picked some colonies and inoculated them into 5mL of TM (transformation
3 Conditions used to amplify target DNA fragments can be found in “Annex 4: Media composition”

16
medium). The tubes were incubated at 37⁰C until the optical density (OD) reached a value of 0.4-0.8; we needed approximately 4 hours to reach this concentration.
Then, 1mL of the culture was inoculated with 2μg of the plasmid that had been extracted from E. coli Top10. This tube was incubated at 37⁰C for 40 minutes. Another tube where the plasmid had not been added was also incubated and was used as a negative control. We added 1mL of 2xYT medium to the cultures and incubated the tubes for 45 additional minutes.
Finally, the cultures were pipetted into 2mL eppendorf tubes and centrifuged to remove excess medium. We plated approximately 100μL of culture onto LB agar selective plates.
Colony PCR
The colonies that had grown on the plates were examined to see whether they really contained the desired construct or were just false positives. In order to do that, colony PCR was employed. The mechanism is the same of amplification PCR.
We picked the colonies and placed them into different 0.2mL PCR tubes with approximately 12μL of type I water. 5μL were placed into another tube with the polymerase, the buffer and the other compounds that are necessary for the process. The remaining liquid had to be placed into the incubator, to keep the colonies alive to grow a culture and store it at -80⁰C.
After performing the PCR, the samples were charged into an agarose gel and 2 or 3 positive colonies were grown with LB and selective antibiotics to store them.
Figure 3: Agarose gel of a colony PCR of PY79
cells transformed with pHP13::Phyp-YPF
The gel shows the bands amplified by colony PCR
and primers AM20 and AM21 of 14 different
samples. Only three of them present the band of
approximately 3500bp that shows that the plasmid
with the insert has been correctly taken up.
4000bp 3500bp

17
Time-lapse fluorescence microscopy
In this procedure, a sequence of images is taken at regular time intervals with a microscope that monitors fluorescence. These images can be viewed at greater speed to mimic a video of the whole growth process.
The sample is illuminated with excitation light and this energy is absorbed by the fluorophores, which emit light after being excited by a specific wavelength of light. Depending on the fluorescent protein employed, such as YFP (yellow fluorescent protein) or CFP (cyan fluorescent protein), different wavelengths are used.
In order to perform this experiment, the cells need to be placed below agarose pads made with a minimal medium (Resuspension medium, RM) that reduces growth speed and puts cells under nutritional stress. These pads need to have a certain concentration of IPTG to induce the expression of the promoter Phyp and produce YFP.
Sample preparation
Cells were grown over-night in LB with the selective antibiotic. We diluted the culture ten-fold and incubated it for approximately 3 hours at 30⁰C until the OD reached 1.8. 1mL of the culture was centrifuged 1 minute at 4000 rpm, the supernatant was discarded and the cells were resuspended with 1mL of RM.
The tube was centrifuged again to remove residual LB medium, which presents auto-fluorescence and would affect the measures from the microscope. The supernatant was discarded and the cells were resuspended into 0,5mL of RM. The tube was incubated for 1.5 hours at 37⁰C with a concentration of IPTG of 250μM.
Meanwhile, we prepared the pads where the cells will be placed. 1.8g of agarose (special for movies) were dissolved into 10mL of RM. When the temperature diminished, the adequate concentration of IPTG was added. It is important to wait enough time, because IPTG is heat-labile, but waiting for too long would cause the agar to solidify.
We prepared a support and covered it with Parafilm to avoid contamination. Approximately 5mL of the mix were carefully pippeted onto a slide cover. Another slide cover was placed on top of the first one and the support was placed in the incubator, to accelerate drying. Then, the upper slide cover was removed and the gel was cut into small pads where the samples will be placed.

18
The culture was diluted 40-fold and 2.25μL were placed on top of each pad. One of the pads was reserved for fluorescent beads, which would be used to calibrate the exposure time and obtain reproducible results. Afterwards, the pads were left in the incubator for 15 minutes and in the desiccator 15 minutes more in order to dry the droplet.
Finally, the pads were placed face down on a glass bottom dish that was placed on the microscope’s support. The experiment was performed with samples from wild-type B. Subtilis (PY79), the strain with the chromosomal integration of Phyp-YFP (control α) and the two strains transformed with the high copy number plasmid (PY79 pDG149 and control α pDG149).
Phase and fluorescence images have been taken every 10 minutes for 16 hours. The temperature of the sample was 37±0.4⁰C.
Data analysis
We analyzed the series of images obtained by this procedure using “Schnitzcells” (8), a Matlab based software that permits segmentation of images, tracking of cell lineages and fluorescence quantification.
Flow cytometry
Flow cytometry is a technology that measures multiple physical characteristics of single cells, such as particle size, granularity and relative fluorescence intensity.
A fluidics system transports the cells (and other particles in the medium) into a laser beam. The light from the laser passes through a focusing lens and goes into the flow chamber, where the cells circulate. Behind it, there is a blocker bar and a device that detect light scatter, which is produced by the particles present in the fluid.
Different mirrors are used to select the wavelength that will be used. This system works in the same way of that of the fluorescence microscope and allows to measure fluorochrome’s concentration. To differentiate fluorescence emitted by YFP (the goal of the experiment) from auto-fluorescence, the signal from the correspondent channel is
Figure 4: Microscopy phase image
Microscopy image from control α
cells grown on an agarose pad for
150 minutes.

19
plotted against that of a closer channel (it is important that the light is emitted by the same laser). Signals that aren’t higher in the desired channel with respect to the control don’t represent YFP activity (9).
To select the data that is relevant for the project, successive gating of the data has to be performed (see Figure 5). Firstly, only the particles that have a determinate size and granularity need to be analyzed (thus particles from the medium and spores are omitted). Secondly, only the particles that emit a higher signal in the selected channel versus a close wavelength channel are actually measures of YFP production.
Sample preparation
Overnight LB cultures of the desired strains with selective antibiotics were diluted to an OD of 0.1 and grown for approximately 2 hours at 30⁰C. Conditioned medium was prepared by filtering an 18-hour LB culture of wild-type B. subtilis (OD≈5). Part from the medium’s nutrients had been consumed and stress peptides had been released by the bacteria.
Afterwards, we diluted 0.1mL of the culture into different combinations of LB and conditioned medium with 250 μM concentration of IPTG (inductor) to test fluorescent
Figure 5: Gating of flow cytometry data for control α pDG148::Phyp-YFP
On the left, the granularity of the particles (SSC-H) is plotted against their size (FSC-H). The particles within region
R1 are considered to be cells and are selected.
On the right, fluorescence in the desired channel (FL1-H) is plotted against that of a close channel (FL2-H). Only the
particles that are above the bisecting line show actual YFP activity and are selected as part of region R2.
Green dots correspond to the particles that were analyzed during acquisition, while black dots were visualized
during the set up and their data was not stored

20
protein expression under nutritional stress. The first tube contained only LB, the second contained 50% LB and 50% conditioned medium and the third one, 10% LB and 90% conditioned medium. It is important to note that no antibiotic was placed into the cultures, to avoid stress not due to the media.
After 2 hours of incubation at 30⁰C, the samples could be examined using flow cytometry. The experiment was performed in two different ways. On the one hand, we measured fluorescence directly from LB medium, using a wild-type strain (PY79) as a control to eliminate the signal that was due to auto-fluorescence of the medium.
On the other hand, the same measurements were performed after washing the medium and replacing it by RM (the medium used in time-lapse fluorescence microscopy). Washing was carried out by centrifuging the cells at 4000rpm for a minute, discarding supernatant and resuspending the pellet into 1mL of RM. The procedure was repeated one more time to ensure that no LB remains.
Data analysis
We visualized flow cytometry and extracted it using FlowPy, a Python software tool. Further analysis of the extracted data was performed using Matlab 2014a.

21
RESULTS
Due to problems encountered during transformation of pHP13::Phyp-YFP into B. subtilis, microscopy and flow cytometry experiments could only be performed with the high copy number plasmid, pDG148::Phyp-YFP.
Time-lapse Fluorescence Microscopy
Quantification of the mean cell fluorescence present at the images allowed us to study the evolution of pDG148 (high-copy plasmid) protein expression with time. At first, the cells were under very stressful conditions, because they were moved from liquid to solid medium. After some time, the cells became accustomed to it and there were still enough nutrients to support them. Finally, cell proliferation led to a decrease of the nutrients that resulted in increased stress, which led some cells to sporulate (see Figure 6).
t = 0h t = 2.5h t = 5h
t = 7.5h t = 10h t = 12.5h
Figure 6: Time evolution of PY79 with pDG148::Phyp-YFP
Frames showing time evolution of this strain through the microscopy experiment. In the last
image some black dots can be seen, which corresponds to the spores produced due to the
stress conditions.

22
Fluorescence imaging shows that cells with the plasmid present an initial increase in YFP production. Afterwards, the levels of YFP decrease. Unfortunately, due to loss of focus of the microscope, the dynamics of fluorescence after more than 400 minutes of recording cannot be analyzed. Contrasting with this change in expression in the strain with the plasmid, the strain which only presents chromosomal integration shows a stable fluorescence expression through the whole experiment (see Figure 7).
In order to see the relative fluorescence of the strain with the plasmid in comparison to that of the control, we plotted the fluorescence ratio of PY79 pDG148::Phyp-YFP versus the chromosomal integration (see Figure 8). At the peak of fluorescence which occurs during the first 2 hours, the fluorescence of our strain reaches 13-fold the expression of the control. Afterwards, its expression stabilizes to between 5 and 6 times that of the control.
Figure 7: Mean cell fluorescence for control α
(chromosomal integration) and PY79
pDG148::Phyp-YFP
This figure shows the mean fluorescence of
all cells in the sample. Control α shows a
constant fluorescence value, while the strain
with the plasmid shows an initial increase of
this value that later decreases.
Figure 8: Ratio of mean cell fluorescence of
PY79 pDG148::Phyp-YFP versus control α
Initially, the ratio increases to reach a value of
12-13. After approximately 120 minutes, the
ratio starts decreasing until reaching a value
of 5-6.

23
Plotting the fluorescence in single cells with respect to the mean expression of all control α cells (which present lesser variation between individuals), shows that the initial fluorescence peak present at 100-200 minutes is not present in all cells, but only in one of them (see Figure 9). Therefore, we can assume that this is an artefact caused by the small number of cells sampled and that YFP expression remains more or less regular during the first hours of recording. Discarding the previously mentioned cell, these bacteria present fluorescence levels that are between 3- and 14-fold that of the control with an integrated gene copy. Even though there is high variability, different populations cannot be observed according to their YFP expression.
Flow cytometry
Flow cytometry allowed us to study the level of fluorescence of a large number of cells under different stress conditions. The results show that increased stress leads to a small increment in the expression of YFP that can be seen in the strain with chromosomal integration (control α), as well as on the ones with the high copy number plasmid pDG148 (see Figure 10). This tendency being independent from particles in the medium has been checked by using a wild-type B. subtilis (PY79) as a negative control, which indeed does not present fluorescence in any conditions. Control α cells, which only present a chromosomal copy of the YFP gene, present fluorescence values that follow a normal distribution, with a slight increment in the mean value for the case of higher conditioned medium concentration.
Figure 9: Ratio of PY79 pDG148::Phyp-
YFP at a single cell level vs control α
The cell causing the increase in the
average expression of the population
can be seen in red. The rest of the
cells have YFP levels around 3- and
14-fold those of the chromosamal
integration control.
24
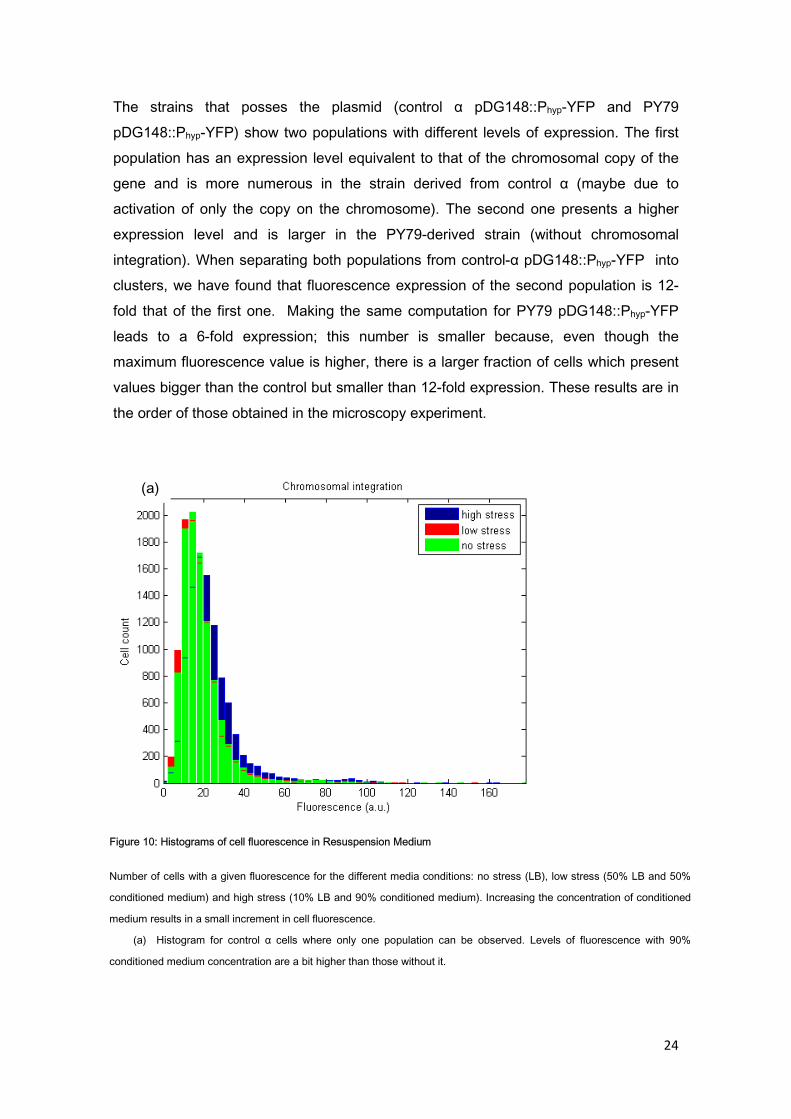
The strains that posses the plasmid (control α pDG148::Phyp-YFP and PY79 pDG148::Phyp-YFP) show two populations with different levels of expression. The first population has an expression level equivalent to that of the chromosomal copy of the gene and is more numerous in the strain derived from control α (maybe due to activation of only the copy on the chromosome). The second one presents a higher expression level and is larger in the PY79-derived strain (without chromosomal integration). When separating both populations from control-α pDG148::Phyp-YFP into clusters, we have found that fluorescence expression of the second population is 12-fold that of the first one. Making the same computation for PY79 pDG148::Phyp-YFP leads to a 6-fold expression; this number is smaller because, even though the maximum fluorescence value is higher, there is a larger fraction of cells which present values bigger than the control but smaller than 12-fold expression. These results are in the order of those obtained in the microscopy experiment.
(a)
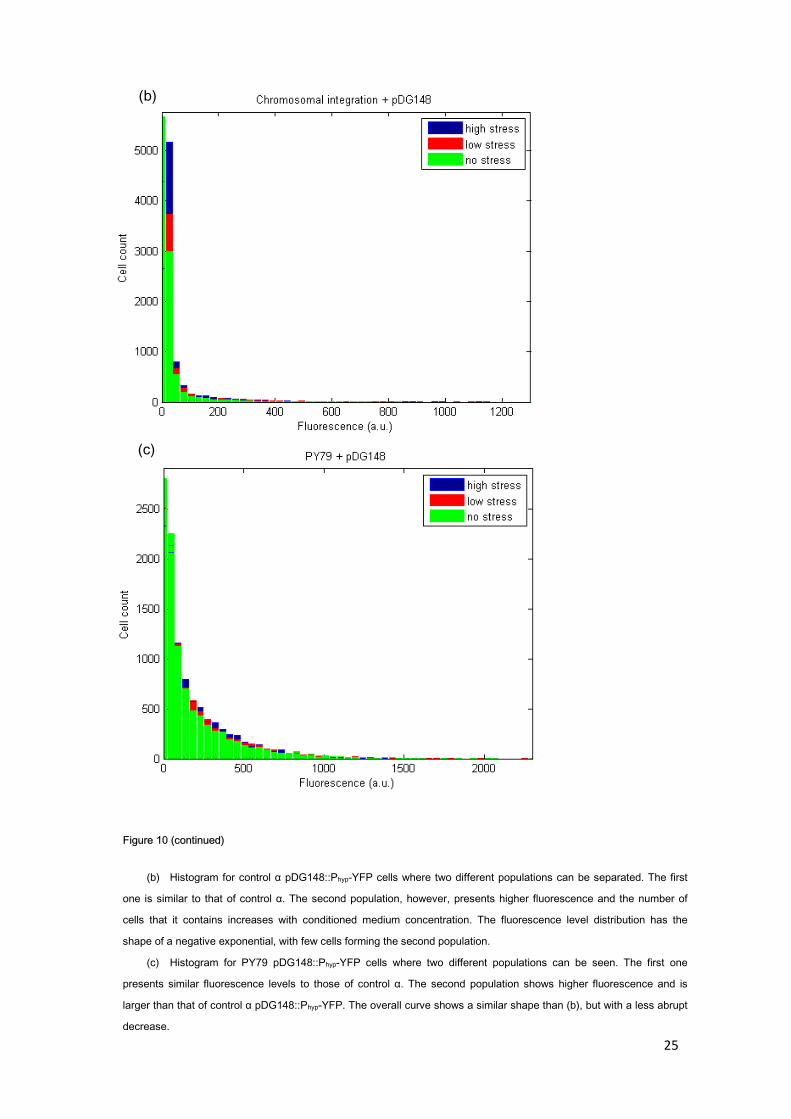
Figure 10: Histograms of cell fluorescence in Resuspension Medium
Number of cells with a given fluorescence for the different media conditions: no stress (LB), low stress (50% LB and 50%
conditioned medium) and high stress (10% LB and 90% conditioned medium). Increasing the concentration of conditioned
medium results in a small increment in cell fluorescence.
(a) Histogram for control α cells where only one population can be observed. Levels of fluorescence with 90%
conditioned medium concentration are a bit higher than those without it.
25
Figure 10 (continued)
(b) Histogram for control α pDG148::Phyp-YFP cells where two different populations can be separated. The first
one is similar to that of control α. The second population, however, presents higher fluorescence and the number of
cells that it contains increases with conditioned medium concentration. The fluorescence level distribution has the
shape of a negative exponential, with few cells forming the second population.
(c) Histogram for PY79 pDG148::Phyp-YFP cells where two different populations can be seen. The first one
presents similar fluorescence levels to those of control α. The second population shows higher fluorescence and is
larger than that of control α pDG148::Phyp-YFP. The overall curve shows a similar shape than (b), but with a less abrupt
decrease.
(c)
(b)

In order to discern whether these differences in expression originated from cells that stopped dividing and formed filaments (as happens in the competent state), thus accumulating a large amount YFP, we have plotted the relation between size and fluorescence for each cell (see variability, most of it is still present after normalizing the fluorescence levels and the two populations remain intact.
All of these results concur in the experiments performeone carried out in RM. The only difference between both media is a basal autofluorescence level that is also present in the wildeasily removed from the data
4 Additional figures of flow cytometry results can be found on the secti
Figure 11: Cell fluorescence (FL1-H) vs cell size (FSC
(a) Control α strain: There is a clear correlation between size and fluorescence of the cells. (correlation = 0.8334)
(b) PY79 pDG148::Phyp-YFP strain: There are two populations, the least fluorescent one is equivalent to that of
control α cells. The other has a broader distribution of fluorescence values. Both of them present some correlation
between size and fluorescence. (correlation=0.520
(a)
In order to discern whether these differences in expression originated from cells that stopped dividing and formed filaments (as happens in the competent state), thus accumulating a large amount YFP, we have plotted the relation between size and
ce for each cell (see Figure 11). Even though size accounts for a part of the variability, most of it is still present after normalizing the fluorescence levels and the two populations remain intact.4
All of these results concur in the experiments performed with LB medium and in the one carried out in RM. The only difference between both media is a basal autofluorescence level that is also present in the wild-type control and can therefore be easily removed from the data
Additional figures of flow cytometry results can be found on the section “Annex 5: Supplementary figures”.
H) vs cell size (FSC-H)
strain: There is a clear correlation between size and fluorescence of the cells. (correlation = 0.8334)
YFP strain: There are two populations, the least fluorescent one is equivalent to that of
cells. The other has a broader distribution of fluorescence values. Both of them present some correlation
between size and fluorescence. (correlation=0.5204)
(b)
26
In order to discern whether these differences in expression originated from cells that stopped dividing and formed filaments (as happens in the competent state), thus accumulating a large amount YFP, we have plotted the relation between size and
). Even though size accounts for a part of the variability, most of it is still present after normalizing the fluorescence levels and the
d with LB medium and in the one carried out in RM. The only difference between both media is a basal auto-
type control and can therefore be
on “Annex 5: Supplementary figures”.
strain: There is a clear correlation between size and fluorescence of the cells. (correlation = 0.8334)
YFP strain: There are two populations, the least fluorescent one is equivalent to that of
cells. The other has a broader distribution of fluorescence values. Both of them present some correlation

27
DISCUSSION & CONCLUSIONS
Results from flow cytometry show clearly that an increase in stress conditions due to less nutrients and increased concentration of stress peptides leads to an increment in the fluorescence levels of the cells. This increment is not only seen in the strains which possess the high copy number plasmid (pDG148::Phyp-YFP), but also on the one that only presents a chromosomal copy of the construct (control α).
The strains with the plasmid present two different levels of YFP that allow to distinguish two different populations. The first one presents fluorescence values that are equivalent to those of control α. It is interesting to note that in the strain derived from control α this population is bigger than in the one derived from a wild-type B. subtilis (PY79). This could be due to activation of only the chromosomal copy of the gene. Nonetheless, it is still unexpected that the number of cells with high YFP expression is bigger in PY79 pDG148::Phyp-YFP, when theoretically it presents one gene copy less than control α pDG148::Phyp-YFP.
The results obtained from time-lapse fluorescence microscopy do not show clear differences on expression due to increased stress conditions. Even though exists high variability across cells, they cannot be separated into different populations according to their YFP expression. Being able to analyze the final stage of the experiment, when the lack of nutrients and stress leads some cells to sporulate, would have allowed us to see how fluorescence evolves as nutrients become sparse. In any case, these results are not significant and repetition of the experiment would be necessary in order to ascertain whether this occurrence is consistent or it was just an isolated case.
In contrast with data from Espinar et al. (3), the ratio of fluorescence between our strains and the control with only a chromosomal integration is much lower. Through time-lapse fluorescence microscopy experiments, they determined that the number of copies of pDG148 present in the cells was around 75. On the other hand, our results show a maximum copy number of 14 (after 1-2 hours of recording), if we discard data from the abnormally behaving cell. Flow cytometry leads to similar results, but, due to the elevated quantity of cells analyzed, it can be seen that there is high variability in YFP expression.
This difference between our results and those from (3) could possibly be due to the behavior of the promoter. While we used Phyperspank (Phyp), a strong inducible promoter under the control of IPTG (10), they used PComS, which is involved in the complex

28
system of competence regulation and promotes a lower expression than Phyp (6) (11). This high level of transcription may lead to a situation where some molecule acts as a limiting factor for expression. We tested the concentration of IPTG by increasing its concentration up to 1mM, but the level of YFP expression obtained in flow cytometry experiments remained the same as for 250μM5; therefore, the concentration of inductor is not the factor which limits YFP production. Higher expression under stress could also mean that there is a higher concentration of the mentioned factor under these conditions, which does not happen for IPTG.
Finally, we would like to point out that from these measurements, it can’t be assured whether variations on expression levels are a consequence of changes in plasmid copy number or in the expression of these plasmids’ proteins. Given the fact that the fluorescence level also increases in the control with only a chromosomal copy (this does not happen in the microscopy results, but, as we said before, these results are not significant), intuition would suggest that copy number is not responsible for these difference; however, further experiments need to be performed in order to give a clear answer.
5 Additional figures of flow cytometry results can be found on the section “Annex 5: Supplementary figures”.
29
REFERENCES
1. Baron S (editor). Medical Microbiology. 4th edition. Galveston : University of Texas Medical
Branch at Galveston, 1996.
2. Plasmid encoded antibiotic resistance: acquisition and transfer of antibiotic resistance genes
in bacteria. M, Bennett P. 2008, Br J Pharmacol, p. 153(Suppl 1): S347–S357.
3. Circuit-level input integration in bacteria gene regulation. Lorena Espinar, Marta Dies, Tolga
Çagatay, Gürol M. Süel, and Jordi Garcia-Ojalvo. 2013, Proc Natl Acad Sci U S A, pp.
110(17):7091-6.
4. Partition of unit-copy miniplasmids to daughter cells. II. The partition region of miniplasmid
P1 encodes an essential protein and a centromere-like site at which it acts. Austin S, Abeles A.
1983, J Mol Biol, pp. 169(2):373-87.
5. Noise in a minimal regulatory network: plasmid copy number control. M., Paulsson J. and
Ehrenberg. 2001, Quarterly Reviews of Biophysics, pp. 34, 1 pp. 1–59.
6. An excitable gene regulatory circuit induces transient cellular differentiation. Süel GM,
Garcia-Ojalvo J, Liberman LM, Elowitz MB. 2006, Nature, pp. 440(7083):545-50.
7. Enzymatic assembly of DNA molecules up to several hundred kilobases. D G Gibson, L Young,
R Chuang, J C Venter, C A Hutchison III & H O Smith. 2009, Nature Methods, p. 6, 343 - 345.
8. Measuring single-cell gene expression dynamics in bacteria using fluorescence time-lapse
microscopy. Young, J. W. , Locke, J.C.W., Altinok, A., Rosenfeld, N., Bacarian, T., Swain, P.S.,
Mjolsness, E., Alon, U., Elowitz, M.B. 2012, Nature Protocols, p. 7, 80–88.
9. Ormerod, M G. Flow Cytometry. A Practical Approach. Oxford : Oxford University Press,
2000.
10. Use of the Escherichia coli lac repressor and operator to control gene expression in Bacillus
subtilis. J, Yansura D G & Henner D. 1984, Proc Natl Acad Sci U S A. , p. 81(2): 439–443.
11. Tunability and Noise Dependence in Differentiation Dynamics. Süel G M, R P, Dworkin J,
Garcia-Ojalvo J, Elowitz M B. 2007, Science, p. 315 (5819): 1716-1719.

30
ANNEXES
Annex 1: Primers
Name Sequence Purpose
AM1-pDG148-R CATCCGCTTACAGACAAGCT Sequence insert PcomK-CFP
AM2-pDG148-F GTCAAGACCTCACTAGGCAC Sequence insert PcomS-CFP
AM3-pDG148-CFP-R TTGGGACAACTCCAGTGAAAAGTTCTTC Sequence pDG148::PcomS-
CFP
AM4-pDG148-CFP-F AAGATGGAGTAGAAGATCAGGTATGAGGAG
Sequence pDG148::PcomS-
CFP
AM5-pDG148-AMP-F TCCAGTTCGATGTAACCCAC Sequence pDG148::PcomS-
CFP
AM6-pDG148-AMP-R CTGATAAATCTGGAGCCGGT Sequence pDG148::PcomS-
CFP
AM7-pDG148-KAN-R GACGACCAAGAGAGCCATAA Sequence pDG148::PcomS-
CFP
AM8-pDG148-KAN-F ATGACCATCTGTGCCAGTTC Sequence pDG148::PcomS-
CFP
AM9-F CAT(CCTAGG)CTGAACGAGAAGCTATCACC Cloning pDG148::Phyp-YFP
AM10-R CAT(ACTAGT)GGACACATGGAAACACACA Cloning pDG148::Phyp-YFP
AM11-F CAT(ACTAGT)AAACCTCTGACACATGCAG Cloning pDG148::Phyp-YFP
AM12-R CAT(CCTAGG)GCTCTCGTGCTCGTTTAA Cloning pDG148::Phyp-YFP
AM13-R GTACAATCTGCTCTGATGCC Sequence pDG148::Phyp-YFP
AM14-F AAATACTACCTGTCCCTTGC Sequence pDG148::Phyp-YFP
AM15-F AGTACAGTCGGCATTATCTC Cloning pHP13::Phyp-YFP
AM16-R TGCCTAATGAGTGAGCTAAC Cloning pHP13::Phyp-YFP
AM17-F GTTAGCTCACTCATTAGGCACTGAACGAGAA
GCTATCACC
Cloning pHP13::Phyp-YFP
AM18-R GAGATAATGCCGACTGTACTGGACACATGGA
AACACACA
Cloning pHP13::Phyp-YFP
AM19-F CCTTTGAGTGAGCTGATACC Sequence pHP13::Phyp-YFP
AM20-R CTACCCATTATTACAGCAGG Sequence pHP13::Phyp-YFP
AM21-F AATGGTTCAGATACGACGAC Sequence pHP13::Phyp-YFP

31
Annex 2: Strains
Strain Chromosomal
integration
Plasmid Source
Top 10 (none) (none)
Top 10 + pHP13 (none) pHP13::Phyp-YFP this project
Top 10 + pDG148 (none) pDG148::Phyp-YFP this project
PY79 (none) (none)
Control-alpha AmyE::Phyp-YFP (none) Ref. 11
PY79 + pDG148 (none) pDG148::Phyp-YFP this project
Control-alpha + pDG148 AmyE::Phyp-YFP pDG148::Phyp-YFP this project
Control-betaS-6xS AmyE::Phyp-YFP pDG148::PcomS-CFP Ref. 3
Control-betaS-75xS AmyE::Phyp-YFP pHP13::PcomS-CFP Ref. 3
Annex 3: Experimental conditions
Amplification PCR
Reagents:
5xPhusion HF buffer 10 μL
dNTPs (10uM) 1 μL
forward primer (10uM) 2.5 μL
reverse primer (10uM) 2.5 μL
Phusion polymerase 0.5 μL
DNA sample X μL
H2O type I until 50 μL
Conditions:
(*) Steps 2 to 4 are repeated 30 times (30 cycles).
Step Temperature Time
1) Initialization 98⁰C 30 seconds
2) Denaturalization * 98⁰C 10 seconds
3) Annealing * Depends on primer melting temperature
30 seconds
4) Elongation * 72⁰C 30 sec/kb sample DNA
5) Final elongation 72⁰C 9 minutes
6) Final hold 4⁰C -

32
Colony PCR
Reagents:
Thermo Pol buffer 5 μL
dNTPs (10uM) 0.5 μL
forward primer (10uM) 1 μL
reverse primer (10uM) 1 μL
Taq polymerase 0.25 μL
DNA sample 5 μL
H2O type I until 25 μL
Conditions:
(*) Steps 2 to 4 are repeated 30 times (30 cycles).
Annex 4: Media composition
Resuspension Medium (RM)
Solution A (500mL):
FeCl3·6H2O (Sigma-Aldrich 23,648-9) 0.49 g
MgCl2·6H2O (Sigma-Aldrich M2670) 4.15 g
MnCl2·6H2O (Sigma-Aldrich 221279) 5.895 g
Solution B (500mL):
NH4Cl (Sigma-Aldrich A9434) 26.75 g
Na2SO4 (Sigma-Aldrich 204447) 5.3 g
Step Temperature Time
1) Initialization 94⁰C 5 minutes
2) Denaturalization * 94⁰C 30 seconds
3) Annealing * Depends on primer melting temperature
30 seconds
4) Elongation * 72⁰C 1 min/kb sample DNA
5) Final elongation 72⁰C 5 minutes
6) Final hold 4⁰C -

33
KH2PO4 (Merck 1.04873.1000) 3.4 g
NH2NO3 (Sigma-Aldrich 9642) 4.85 g
pH adjusted to 7 with NaOH
A and B solutions need to be filtered in order to guarantee sterility.
A+B solution = 1 mL A + 10 mL B
Adjust with water type III until 1L and store at 4⁰C.
RM (100mL):
A+B 90 mL
10% L-Glutamate (Sigma-Aldrich G5889) 2 mL
0.1M CaCl2 (vwr 22313.294) 1 mL
1M MgSO4 (Sigma-Aldrich M2643) 4 mL
H2O type III 3 mL
RM has to be fresh and cannot be stored.
Transformation Medium (TM)
TM (250mL):
K2HPO4.3H2O (Sigma-Aldrich P5504) 4.77 g
KH2PO4 (Sigma-Aldrich P3786) 1.5 g
Trisodic citrate (Sigma-Aldrich S4641) 0.25 g
MgSO4.7H2O (Sigma M2773) 0.005 g
Na2SO4 (Aldrich 204447) 0.5 g
100mM FeCl3 (Aldrich 451649) 125 μL
100mM MnSO4 (Sigma M8179) 5 μL
Glucose (Sigma G7528) 1 g
Glutamate (Sigma G5889) 0.5 g
adjust volume to 250 mL with H2O type III
Filter-sterilize and store at 4⁰C.
2xYT Medium
2xYT (1L):
Tryptone (FlukaT7293) 16 g
Yeast extract (Sigma Y1625) 10 g
NaCl (Sigma S5886) 5 g
adjust volume to 1L with H2O type III
34
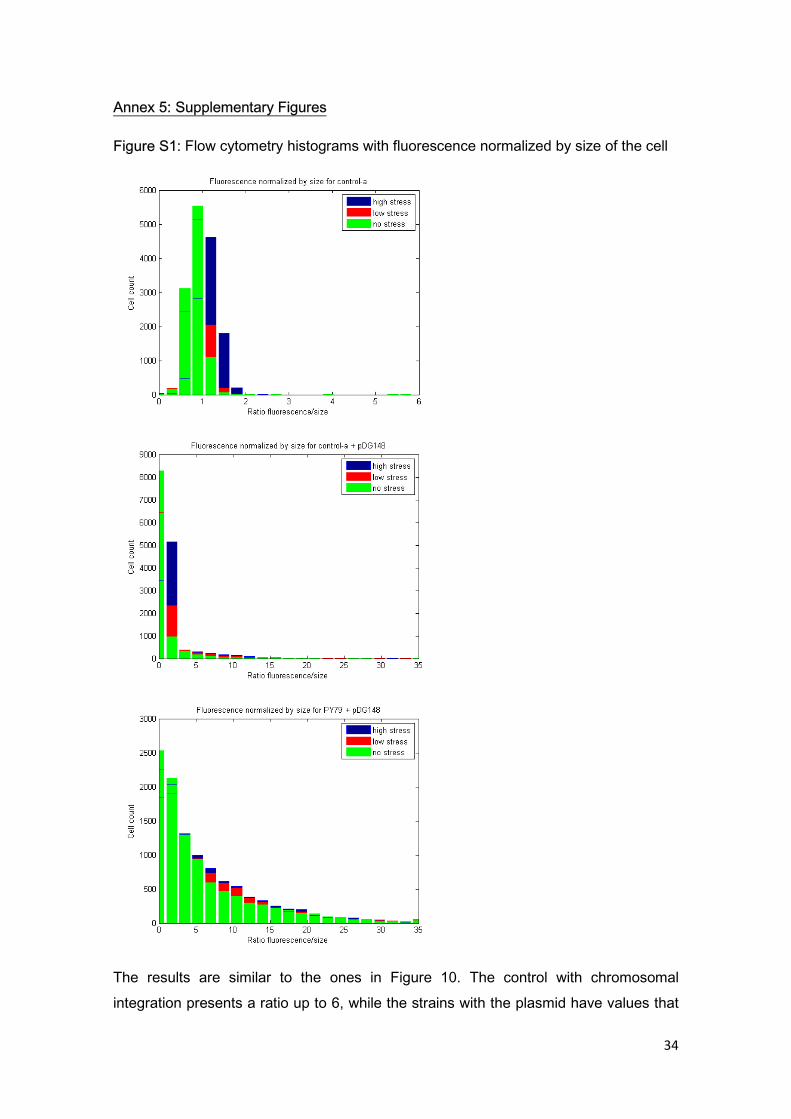
Annex 5: Supplementary Figures
Figure S1: Flow cytometry histograms with fluorescence normalized by size of the cell
The results are similar to the ones in Figure 10. The control with chromosomal integration presents a ratio up to 6, while the strains with the plasmid have values that

35
reach 35. We can consider cells with fluorescence/size ratio under 6 as a first population, while those with a higher coefficient can be seen as a second population that cannot be achieved with only a chromosomal integration.
Figure S2: Flow cytometry histograms showing fluorescence levels of control α + pDG149::Phyp-YFP under IPTG concentrations of 250uM (upper) and 1mM (lower) in LB culture (no stress)
Histograms for both IPTG concentrations present the same fluorescence distributions. Fluorescence values are a bit higher than in the measurements performed using RM, but medium fluorescence could be extracted by comparing the results with those of the wild-type control.


