Platform downstream processes in the age of continuous chromatography: A case study
Mark Brower
BioProcess Technology & Expression Bioprocess Development
Kenilworth, NJ
Integrated Continuous Biomanufacturing Castelldefels, Spain 20-24 October 2013
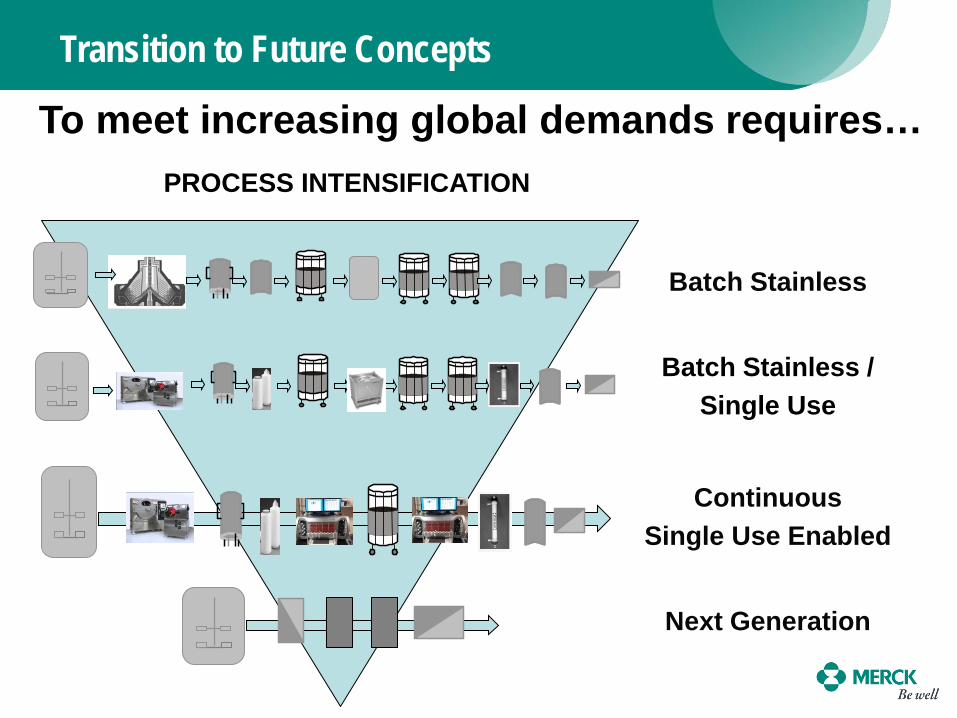
Batch Stainless / Single Use
Batch Stainless
Continuous Single Use Enabled
PROCESS INTENSIFICATION
Next Generation
Transition to Future Concepts
To meet increasing global demands requires…
6H
18H
24H
30H
36H
42H
48H
54H
60H
12H
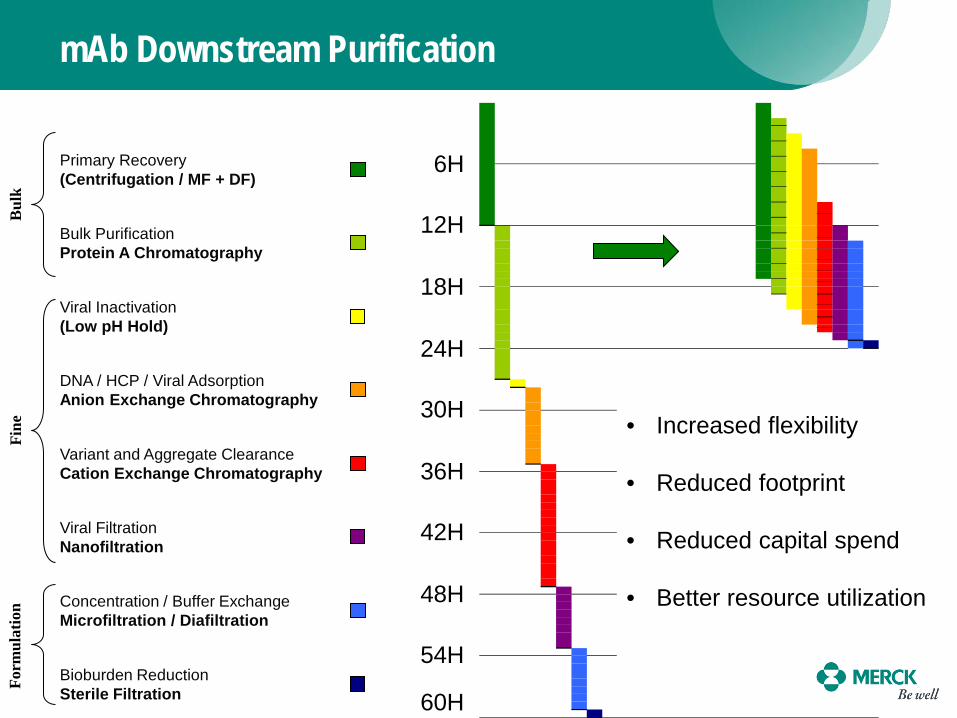
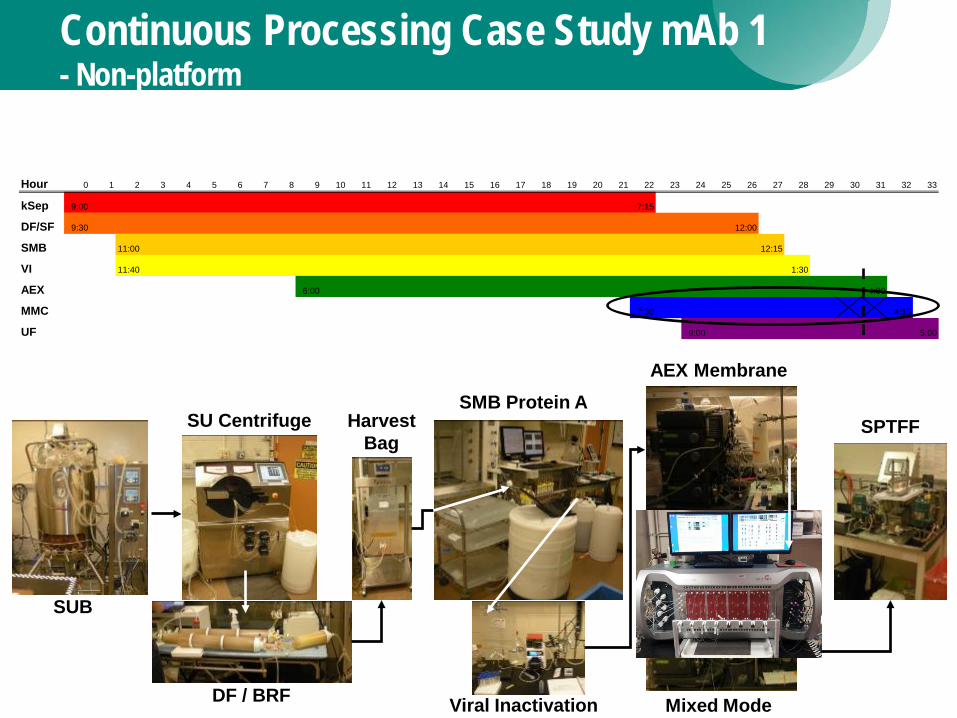
Primary Recovery (Centrifugation / MF + DF)
Bulk Purification Protein A Chromatography
Viral Inactivation (Low pH Hold)
DNA / HCP / Viral Adsorption Anion Exchange Chromatography
Variant and Aggregate Clearance Cation Exchange Chromatography
Viral Filtration Nanofiltration
Concentration / Buffer Exchange Microfiltration / Diafiltration
Bioburden Reduction Sterile Filtration
mAb Downstream Purification B
ulk
Form
ulat
ion
Fine
• Increased flexibility
• Reduced footprint
• Reduced capital spend
• Better resource utilization
Continuous Processing Vision - 2,000L SUB*
Overall DSP Time Cycle is Dictated by the Longest Step Other Steps are Lengthened to Compensate
S U B*
Depth /BRF
Filtration
Surge Bag
BioSMB Protein A
Single-Use Centrifugation
Surge Bag
p p
BRF p p
BRF p p
Viral Filtration
Surge Bag
Surge Bag
Formulation: BRF/DiaF
Continuous UF Anion
Exchange Membrane
p
p
Polishing Step
Continuous Viral Inactivation
A E X M
BRF
Surge Bag
*Single-Use Bioreactor
Hour 0 1 2 3 4 5 6 7 8 9 10 11 12 13 14 15 16 17 18 19 20 21 22 23 24 25 26 27 28 29 30 31 32 33
kSep 9:00 7:15
DF/SF 9:30 12:00
SMB 11:00 12:15
VI 11:40 1:30
AEX 6:00 4:00
MMC 7:30 4:15
UF 9:00 5:00
SUB
Harvest Bag
DF / BRF
SU Centrifuge SMB Protein A
Viral Inactivation
AEX Membrane
Mixed Mode
SPTFF
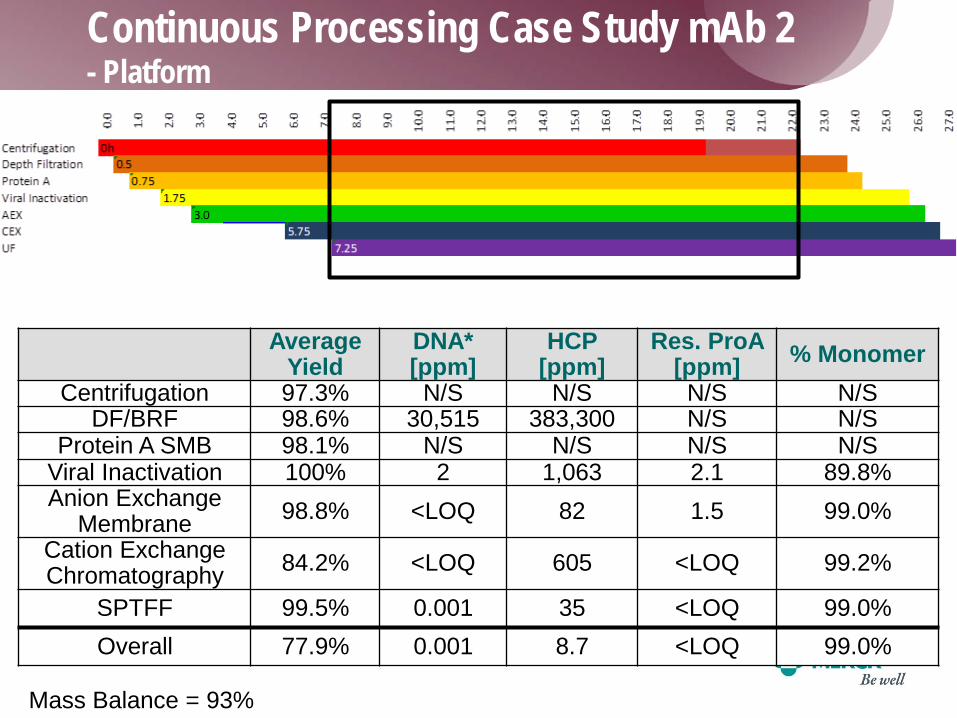
Continuous Processing Case Study mAb 1 - Non-platform
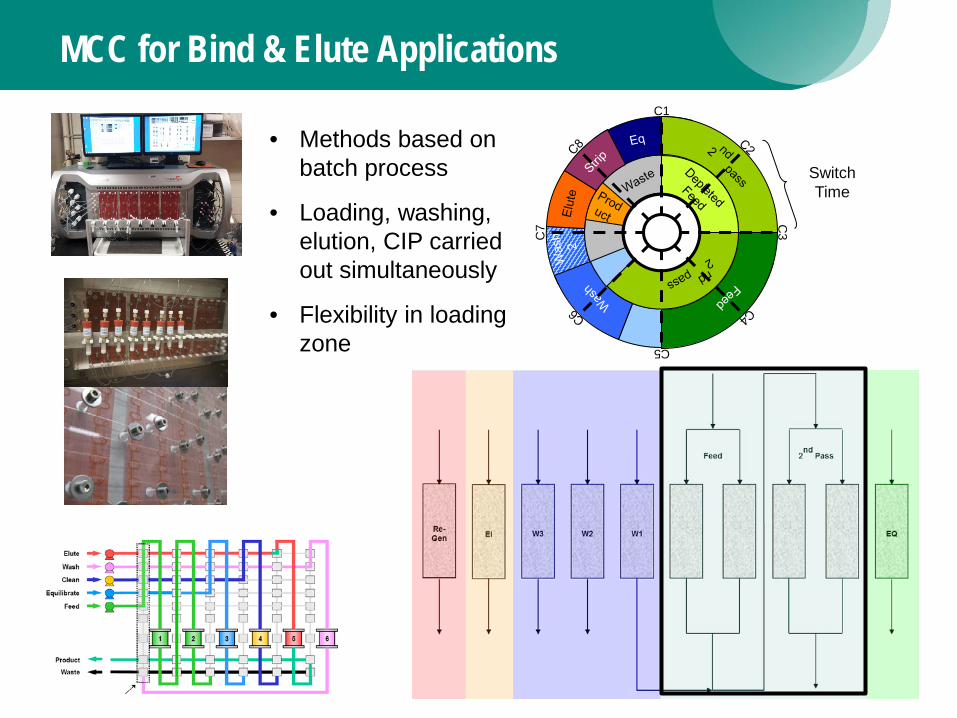
MCC for Bind & Elute Applications C1
C5
C3 C
7
Switch Time
• Methods based on batch process
• Loading, washing, elution, CIP carried out simultaneously
• Flexibility in loading zone
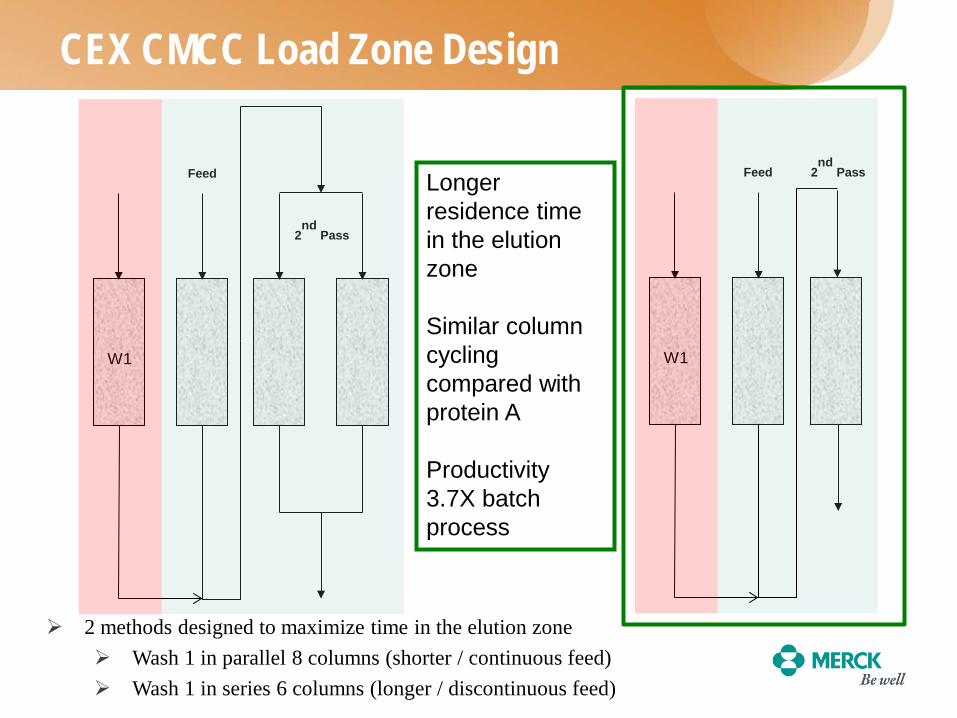
CEX CMCC Load Zone Design
2 methods designed to maximize time in the elution zone Wash 1 in parallel 8 columns (shorter / continuous feed) Wash 1 in series 6 columns (longer / discontinuous feed)
W1
Feed
2nd
Pass
W1
Feed 2nd
Pass Longer residence time in the elution zone Similar column cycling compared with protein A Productivity 3.7X batch process
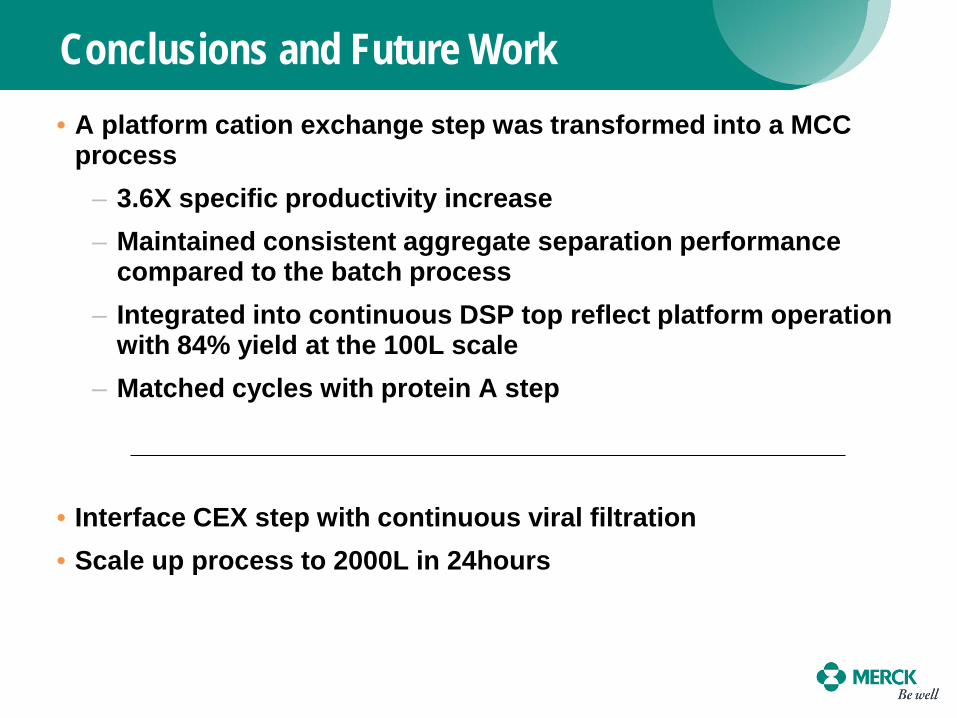
SMB Transformation of Platform CEX Step
• 1.2cm x 3cm pre-packed columns • Poros HS Adsorbent • qbatch=50mg/mL • Feed = 11-13g/L • 2 different load zone configurations • Good agreement between experimental and
theoretical capture efficiency • CMCC loading was 60-73mg/mL at high yield
>95%
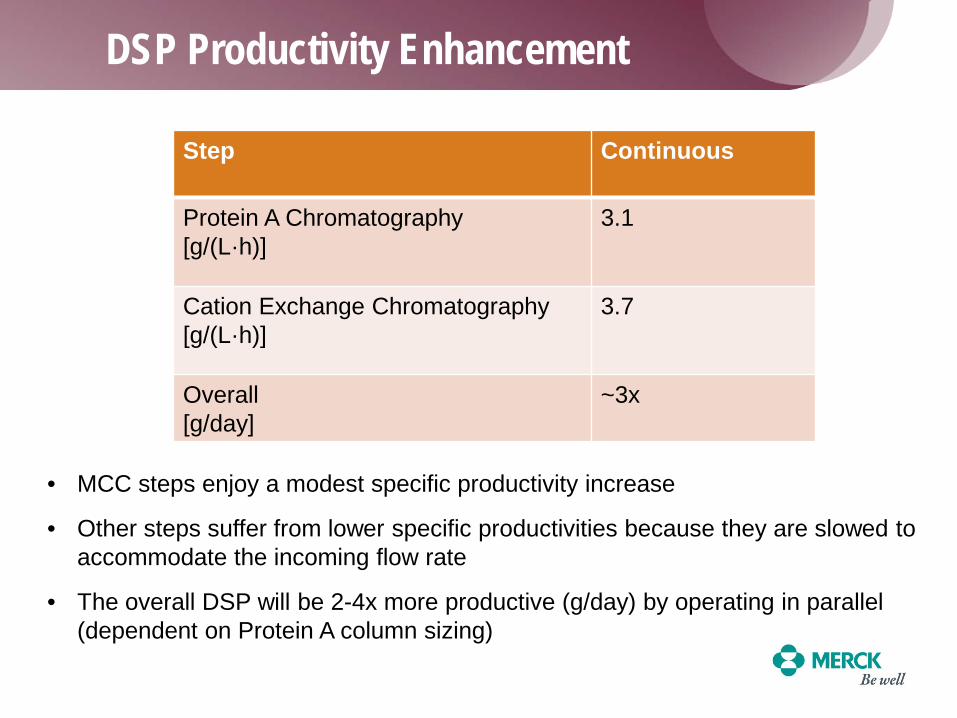
3.7 x Specific Productivity
⋅⋅−
−⋅
⋅=
SSSS1-1NTU-exp11111-1NTU-exp-1CE
Design Equations*
*Miyauchi and Vermeulen (1963)
++== ∑
1
21
WfeedfeedoL
i
ioL QQ
VNQ
VNakQ
VNakNTU0cQ
qQSfeed
BedBed
⋅⋅
=
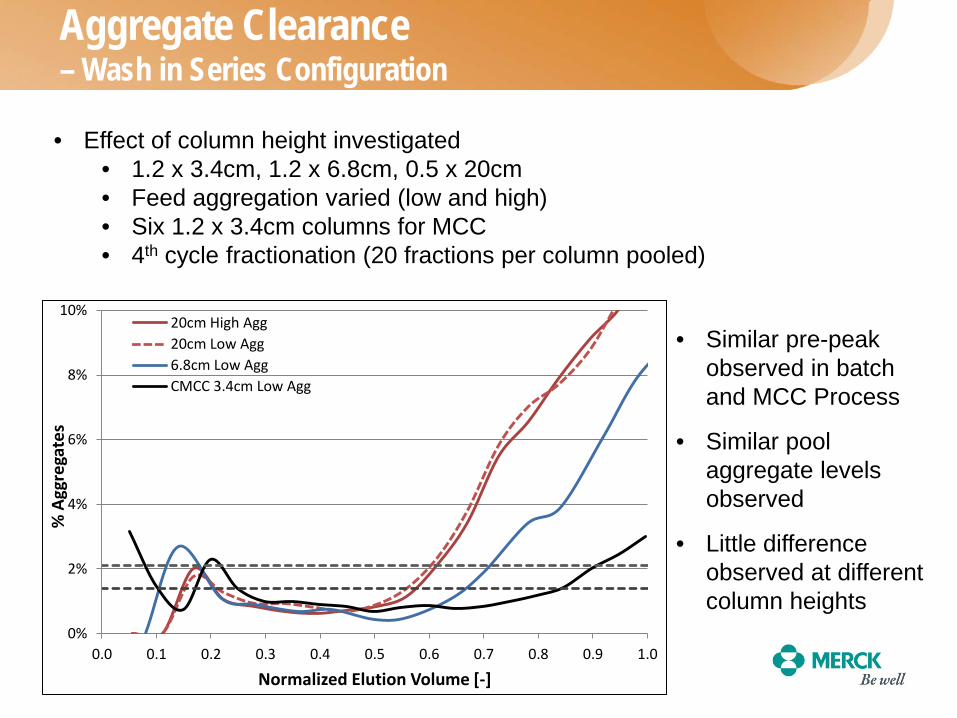
Aggregate Clearance – Wash in Series Configuration
• Effect of column height investigated • 1.2 x 3.4cm, 1.2 x 6.8cm, 0.5 x 20cm • Feed aggregation varied (low and high) • Six 1.2 x 3.4cm columns for MCC • 4th cycle fractionation (20 fractions per column pooled)
• Similar pre-peak observed in batch and MCC Process
• Similar pool aggregate levels observed
• Little difference observed at different column heights
0%
2%
4%
6%
8%
10%
0.0 0.1 0.2 0.3 0.4 0.5 0.6 0.7 0.8 0.9 1.0
% A
ggre
gate
s
Normalized Elution Volume [-]
20cm High Agg20cm Low Agg6.8cm Low AggCMCC 3.4cm Low Agg
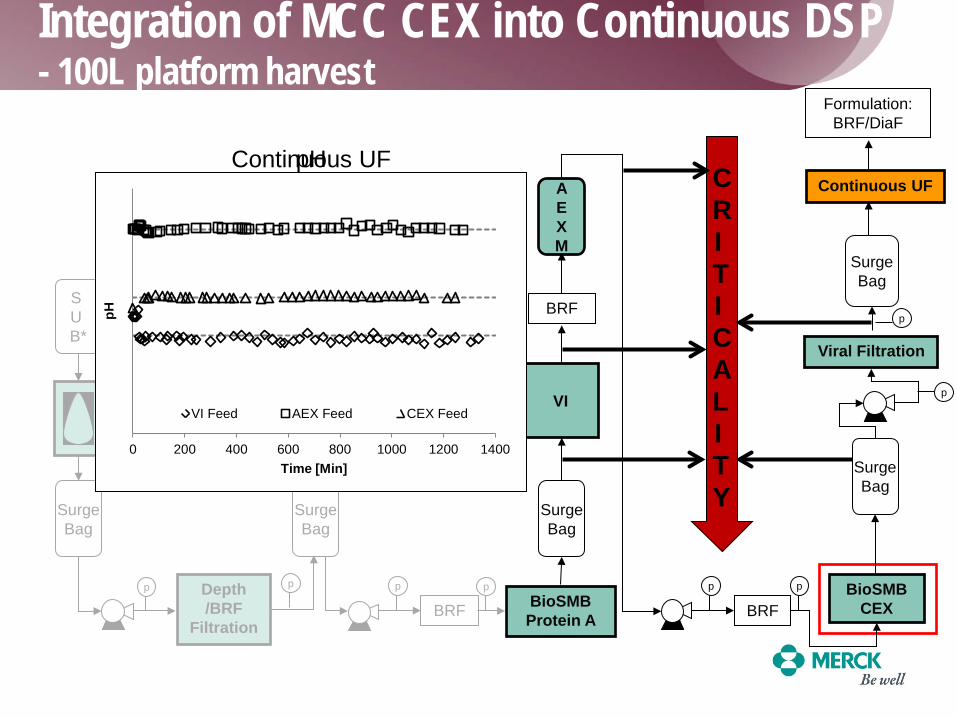
Integration of MCC CEX into Continuous DSP - 100L platform harvest
VI
BioSMB Protein A BRF
p p
Viral Filtration
Surge Bag
Surge Bag
Formulation: BRF/DiaF
Continuous UF
p
p
BioSMB CEX
A E X M
BRF
Surge Bag
S U B*
Depth /BRF
Filtration
Surge Bag
Surge Bag
p p
BRF p p
CRITICALITY
Continuous UF
-100%
-80%
-60%
-40%
-20%
0%
20%
40%
60%
80%
100%
0 20 40 60 80 100 120 140
Con
cent
ratio
n Fa
ctor
[-]
Membrane Loading [L/m2]
0 200 400 600 800 1000 1200 1400
pH
Time [Min]
VI Feed AEX Feed CEX Feed
pH
0
0.1
0.2
0.3
0.4
0.5
Abso
rban
ce [m
AU]
0
0.25
0.5
0.75
1
1.25
1.5
0 10
0.25
0.5
0.75
1
1.25
1.5
0 1 2 3 4 5 6
Abso
rban
ce [m
AU]
STDEV(%) Between Columns =1.01%
Continuous CEX Performance
• 16 Overlaid CEX Elution Profiles • AEXM Effluent Feed
Column
Average Yield
DNA* [ppm]
HCP [ppm]
Res. ProA [ppm] % Monomer
Centrifugation 97.3% N/S N/S N/S N/S DF/BRF 98.6% 30,515 383,300 N/S N/S
Protein A SMB 98.1% N/S N/S N/S N/S Viral Inactivation 100% 2 1,063 2.1 89.8% Anion Exchange
Membrane 98.8% <LOQ 82 1.5 99.0% Cation Exchange Chromatography 84.2% <LOQ 605 <LOQ 99.2%
SPTFF 99.5% 0.001 35 <LOQ 99.0% Overall 77.9% 0.001 8.7 <LOQ 99.0%
Continuous Processing Case Study mAb 2 - Platform
Mass Balance = 93%
DSP Productivity Enhancement
Step Continuous
Protein A Chromatography [g/(L·h)]
3.1
Cation Exchange Chromatography [g/(L·h)]
3.7
Overall [g/day]
~3x
• MCC steps enjoy a modest specific productivity increase
• Other steps suffer from lower specific productivities because they are slowed to accommodate the incoming flow rate
• The overall DSP will be 2-4x more productive (g/day) by operating in parallel (dependent on Protein A column sizing)
Conclusions and Future Work • A platform cation exchange step was transformed into a MCC
process – 3.6X specific productivity increase – Maintained consistent aggregate separation performance
compared to the batch process – Integrated into continuous DSP top reflect platform operation
with 84% yield at the 100L scale – Matched cycles with protein A step
• Interface CEX step with continuous viral filtration • Scale up process to 2000L in 24hours
Acknowledgements
• BTE – Ying Hou – David Pollard
• Analytical Support – Joe Fantuzzo – John Troisi – Jun Heo
• Fermentation Support – Patty Rose – Chris Kistler – Rachel Bareither
• Protein Purification Process Development – Nihal Tugcu – Thomas Linden
– Marc Bisschops – Steve Allen