Technical Report 1104 Platoon Readiness as a Function of Leadership, Platoon, and Company Cultures Bernard M. Bass and Bruce J. Avolio Binghamton University August 2000 United States Army Research Institute for the Behavioral and Social Sciences Approved for public release; distribution is unlimited. 20000921 007
Transcript
Technical Report 1104
Platoon Readiness as a Function of Leadership,Platoon, and Company Cultures
Bernard M. Bass and Bruce J. AvolioBinghamton University
August 2000
United States Army Research Institutefor the Behavioral and Social Sciences
Approved for public release; distribution is unlimited.
20000921 007
U.S. Army Research Institutefor the Behavioral and Social Sciences
A Directorate of the U.S. Total Army Personnel Command
EDGAR M. JOHNSONDirector
Research accomplished under contractfor the Department of the Army
Binghamton University
NOTICES
DISTRIEBUTION: Primary distribution of this Technical Report has been made by ARI.Please address correspondence concerning distribution of reports to: U.S. ArmyResearch Institute for the Behavioral and Social Sciences, Attn: TAPC-ARI-PO, 5001Eisenhower Ave., Alexandria, VA 22333-5600.
FINAL DISPOSITION: This Technical Report may be destroyed when it is no longerneeded. Please do not return it to the U.S. Army Research Institute for the Behavioraland Social Sciences.
NOTE: The findings in this Technical Report are not to be construed as an officialDepartment of the Army position, unless so designated by other authorized documents.
REPORT DOCUMENTATION PAGE
1. REPORT DATE (dd-mm-yy) 2. REPORT TYPE 3. DATES COVERED (from... to)
August 2000 Final 8/1/96-3/30/00
4. TITLE AND SUBTITLE 5a. CONTRACT OR GRANT NUMBER
Platoon Readiness as a Function of Leadership, Platoon, and DASWO1-96-K0008
Company Cultures 5b. PROGRAM ELEMENT NUMBER61102A
6. AUTHOR(S) 5c. PROJECT NUMBER
Bass, B. M. & Avolio, B. J. (Binghamton University) B74f
5d. TASK NUMBER
19025e. WORK UNIT NUMBER
Cll7. PERFORMING ORGANIZATION NAME(S) AND ADDRESS(ES) 8. PERFORMING ORGANIZATION REPORT NUMBER
Binghamton UniversityP.O. Box 6015Binghamton, NY 13902-6015
9. SPONSORING/MONITORING AGENCY NAME(S) AND ADDRESS(ES) 10. MONITOR ACRONYMU.S. Army Research Institute for the Behavioral and Social Sciences ARI
12. DISTRIBUTION/AVAILABILITY STATEMENTApproved for Public Release; Distribution Unlimited.
13. SUPPLEMENTARY NOTES
The task was performed under ERO Broad Agency Announcement of September 1992 regarding research in the behavioral sciences.
The contracting officer's representative was Michael Drillings.
14. ABSTRACT (Maximum 200 words):The ultimate criterion of Army light infantry unit readiness is its performance in combat. A second criterion is the unit's readiness in
peacekeeping missions. A close representation of requirements for peacekeeping is reflected in the unit's effectiveness in home station. Amodified military version of the Multifactor Leadership Questionnaire (MILQ) was used to profile the individual leadership style of platoonleaders (PLs) and platoon sergeants (PSGs). The Team Multifactor Leadership Questionnaire (TMLQ) was used to describe the platoon andcompany culture. Results for the MLQ were in line with expectations derived from Bass and Avolio's full range model of leadership. Ifleaders, particularly PLs, were transformational according to their superiors, peers, and subordinates, their platoons were seen by raters inhome station as more effective both in home station and in simulated combat arenas. The most accurate predictions were made by thecompany cadres; the least accurate were made by the platoon members. Overall, the level of transformational leadership exhibited byplatoon leaders in garrison predicted performance at the Joint Readiness Training Center (JRTC). Similarly the platoon sergeant'stransformational leadership also predicted performance at JRTC.
15. SUBJECT TERMS
Leadership; MLQ; TMLQ; Company culture; Training and development.
i iii i F A N i...19. LIMITATION OF 20. NUMBER 21. RESPONSIBLE PERSON
ABSTRACT OF PAGES (Name and Telephone Number)16. REPORT 17. ABSTRACT 18. THIS PAGE Michael DrillingsUnclassified Unclassified Unclassified Unlimited 122 DSN 767-8641
i
Technical Report 1104
Platoon Readiness as a Function of Leadership,Platoon, and Company Cultures
Bernard M. Bass and Bruce J. Avollo- Binghamton University
Research and Advanced Concept Off iceMichael Drillings, Chief
U.S. Army Research Institute for the Behavioral and Social Sciences5001 Eisenhower Avenue, Alexandria, Virginia 22333-5600
August 2000
Army Project Number Personnel Performance201 611021374F and Training
Approved for public release; distribution unlimited.
iii
FOREWORD
Leadership for Change is a basic research program of the Research and AdvancedConcepts Office (RACO) of the United States Army Research Institute for the Behavioral andSocial Sciences (ARI). ARI is a directorate of the Total Army Personnel Command and theArmy's principal agency for soldier-oriented research and development in personnel andtraining. ARI's mission is to maximize Army effectiveness through research and development inthe acquisition, training, development, utilization, and retention of Army personnel.
* ARI has initiated a programn to study military leadership, understand its effects on unitperformance, and determine how it might be enhanced. One major area of interest in ARI'sleadership program is the effect of transformational leadership on unit performance. The goal ofLeadership for Change is to determine whether and how well platoon leadership in home stationand in simulated combat can predict platoon readiness. This research has been designed to testthe theory of transformational leadership by determining whether platoon leaders and platoonsergeants who were more inspirational, intellectually stimulating, and individually considerateled platoons that were more effective at both home station and in mission accomplishment in thenear-combat conditions of the Joint Readiness Training Center (JRTC).
This research has produced a series of findings that support that transformationalleadership is a key element leading to more effective unit performance. However, we do notknow to what extent we can train to produce higher levels of transformational leadership. Thishas triggered a new program to better understand the answer to this question.
EDGAR M. JOHNSONDirector
ACKNOWLEDGMENTS
The authors would like to thank the following people for their support of this project.Without their assistance this project would never have achieved its objectives. General WaltUlmer (ret), Col. Michael Shaler (ret), Col. Mac Snodgrass (ret), Dr. Yair Berson, Dr. DongJung, Dr. Robb Most, Wendy Kramer, Ben Laurenzi, Sally Bowers, Juliette Monet, andSusanna Kwan. We also wish to express our appreciation to Maj. James Reeves and Lt. Col.Lee Washington for help in collecting the data for this project. We thank Dr. Ed Johnson ofthe Army Research Institute and Dr. Mike Drillings, who provided both advice and support forthis project.
Finally, we want to especially thank the U.S. Army and the commanders who gave usaccess to Ft. Campbell, Ft. Drum, Ft. Bragg, Ft. Benning, as well as all of the platoon leaders,sergeants, NCOs, and soldiers who gave us the kind of quality data that helped make thisproject a success.
vi
EXECUTIVE SUMMARY
Requirement:
The platoon is the most significant unit for both the individual soldier and the Army forenhancing the effectiveness of operations. The core leadership rests with the platoon sergeantand the platoon leader (usually a commissioned second lieutenant). Squads and squad leadersplay secondary leadership roles, usually for shorter periods of time, since turnover is higher insquads and squad leaders than in platoon sergeants and platoon leaders.
The hypotheses being tested in this research are that platoon effectiveness in home stationand mission performance at JRTC correlates positively with platoon leader transformational andcontingent reward leadership, less so with active and passive managing-by-exception, andnegatively with laissez-faire leadership. Home station effectiveness, itself, is expected to predictJRTC performance. Platoon and company climate at home station should also contribute tosubjective effectiveness and observed platoon readiness.
Procedure:
Over the course of this 3-year investigation this research worked on developingleadership survey instruments that could be reliably used in military contexts to predictindividual and unit performance. This involved working with military consultants to reviseexisting leadership survey measures. These steps were taken at the outset of the project to assurethe leadership survey measures would be both reliable and valid. In this final report, the resultsare presented for the surveys taken with a total of 90 platoons, and for predicting theperformance of 72 platoons that went to JRTC. The JRTC criterion data and correlations withtheir predictors are thus based on 72 platoons. However, correlations among the home stationdata are based on 90 platoons.
Approximately one to two months prior to each platoon attending JRTC, 3600evaluations of the platoon commander and sergeant were collected in garrison using the Multi-factor Leadership Questionnaire (MLQ). Evaluations of the platoon's collective leadershipprofile and culture were also gathered in garrison from different rater sources in the platoon toreduce the effects of common source bias. Platoon commanders were rated by the CO, XO, CO-sergeant, sergeant, peers from two other platoons in their company and subordinates within theplatoon, including squad leaders, fire team leaders, and squad members. Sergeants were rated bythe CO, XO, CO-sergeant, peers from two other platoons in their company and subordinatesincluding squad leaders, fire team leaders, and squad members. Ratings of collective leadershipand culture were based on the same dimensions/constructs contained in the MLQ, escalated to agroup and company level of analysis. For example, measures were taken of the platoon'scollective transformational leadership using the Team Multi-factor Leadership Questionnaire(TMLQ), as well as whether the platoon had a transformational culture using the OrganizationalDescription Questionnaire (ODQ).
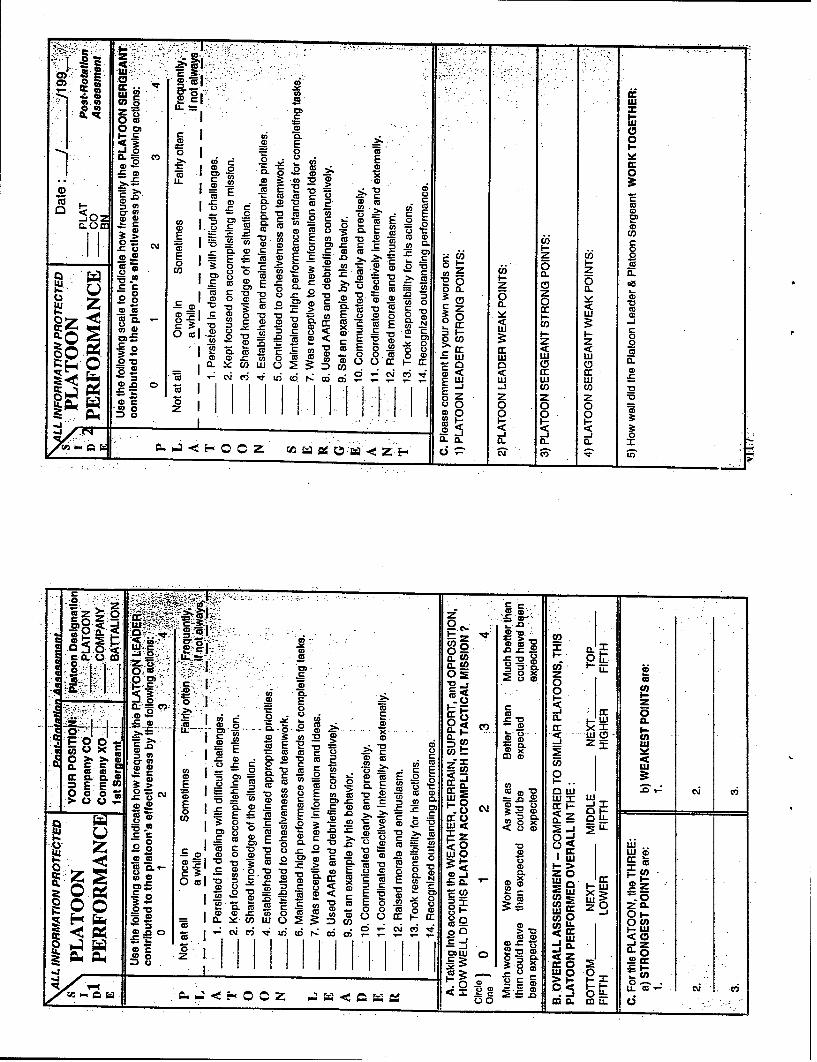
Performance in JRTC was evaluated by observer-controllers (OC's), who accompaniedthe platoons carrying out their assignments over a two-week period. A survey measure was
Vii
developed to assess the platoon leader's (PL) performance, platoon sergeant's performance(PSG), their ability to work together in the field and the platoon's overall performance. A
*consulting team, who had extensive experience in the military, working in conjunction with thetwo P1's, developed the criterion evaluation measure. OC rater input was also solicited in thedevelopment of the criterion measure. The criterion data collected at JRTC assessed theplatoon's readiness and consistency of the platoon commanders' and sergeants' leadership withArmy policy governing combat leaders. Ratings by the OC evaluators were collected at threepoints during JRTC, following the completion of each of three phases.
Utilization of Findings:
The results of this research indicate that transformational leaders are generally moreeffective in home station and in JRTC combat readiness missions. The best predictors ofperformance in near combat conditions came from other sources of ratings, not from self-ratingsof leadership.
The findings of this research support the utility of transformational and transactionalleadership theory for predicting the readiness of units in military settings. Results indicated thatselecting and developing leaders who are more proactive and transformational should result inboth more effective platoons in garrison and in extreme conditions, such as at JRTC. Althoughmany leadership training programs concentrate on the positive styles of leadership, the results ofthis research point to the importance of examining and eliminating passive avoidant styles aswell. Results indicate that leaders who were more passive and/or avoidant in home station, ledplatoons that performed worse at JRTC. Moreover, the qualitative observations collected fromthe 0/Cs at JRTC confirm that leaders who were either passive or simply focused on correctingproblems as they arose, lead lower performing platoons at JRTC.
Transformational leadership (TL) may become an even more powerful model for leadertraining and development at higher levels in the organization where elements of self-motivationand coordination are typically more critical to organizational effectiveness. Additional researchis needed, however, in determining whether transformational behaviors can be learned byleaders. ARI is continuing fuirther study and experimentation in this area.
Viii
TABLE OF CONTENTS
INTRODUCTION 1
RESEARCH PLANPurpose 16Hypotheses 17Method and Design of the Study 17Summary of Research Activities 18
METHODSSample 19'MLQ and TMLQ Data Collection 22Field Performance Data Collection Process by 0/Cs 23Qualitative Data Collection Overview 24
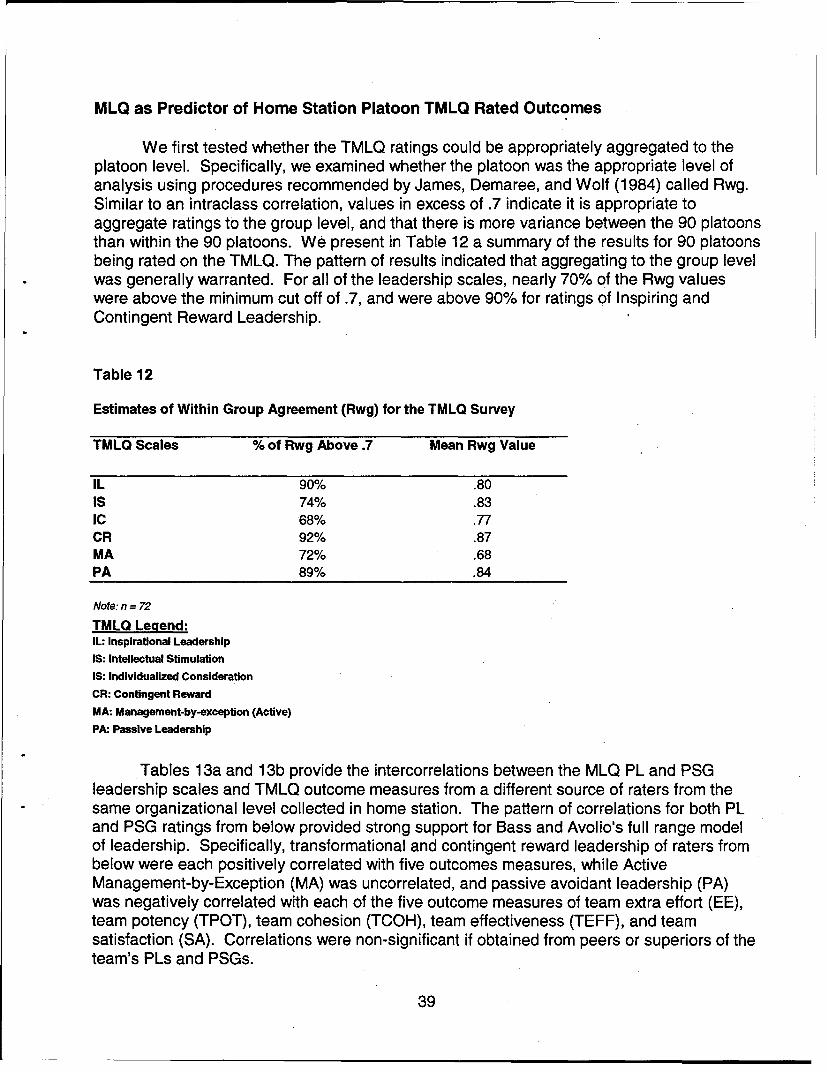
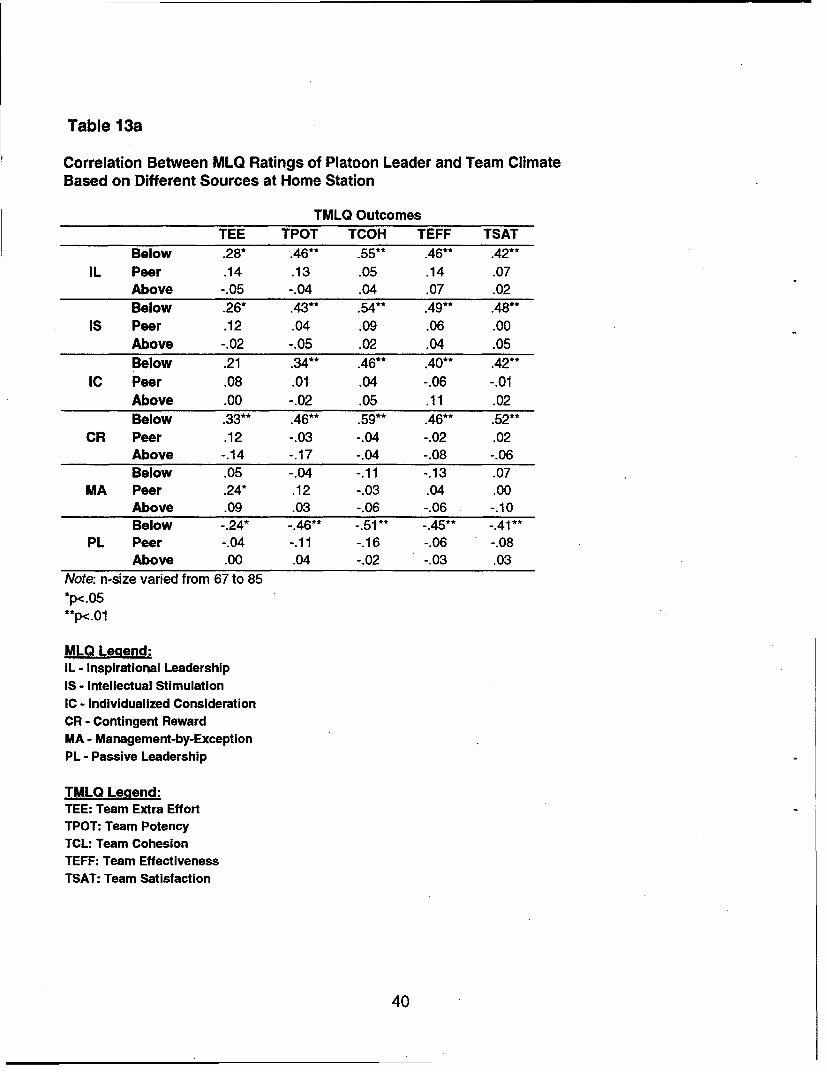
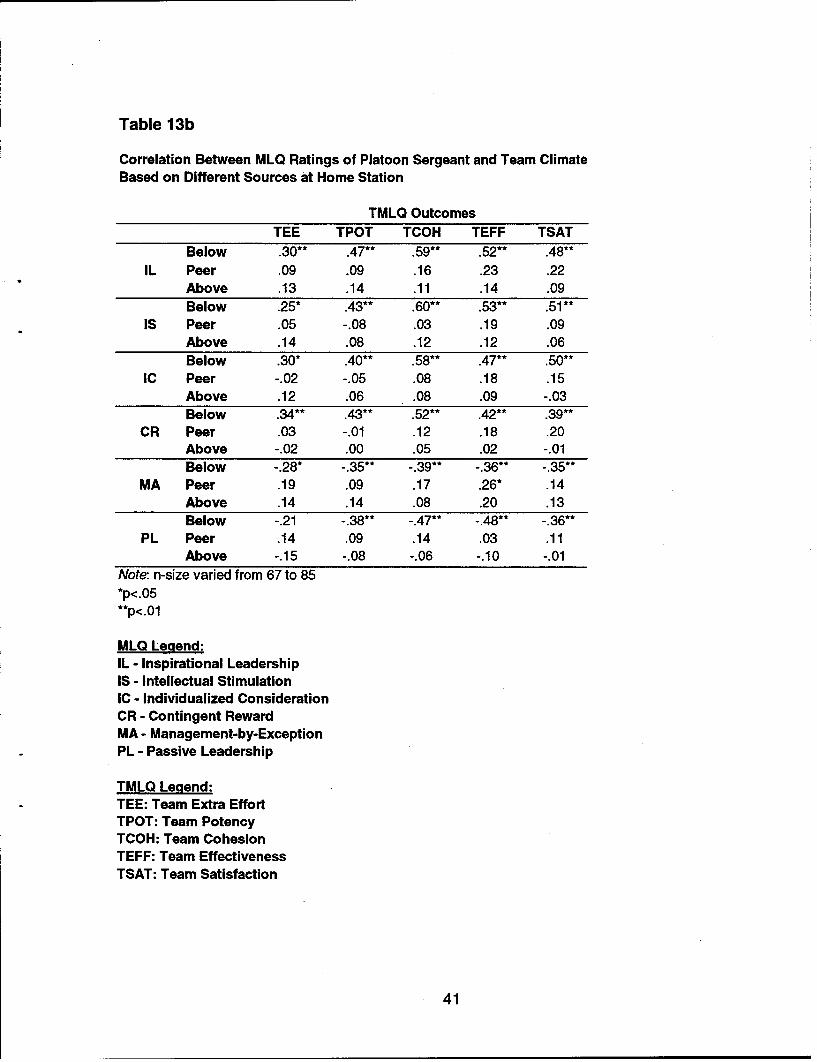
RESULTSQuantitative Analyses 28Factor Structure of the MLQ and TMLQ 28MLQ, TMLQ and 0/C Ratings' Descriptive Statistics 29MLQ as Predictor of Home Station Platoon TMLQ Rated Outcomes 39Effects of Tenure 49Trends in JRTC Performance 53Multiple Regressions 56Company Culture 57Unit Leadership Strength as a Predictor of JRTC Performance 59Exploratory Analyses 60
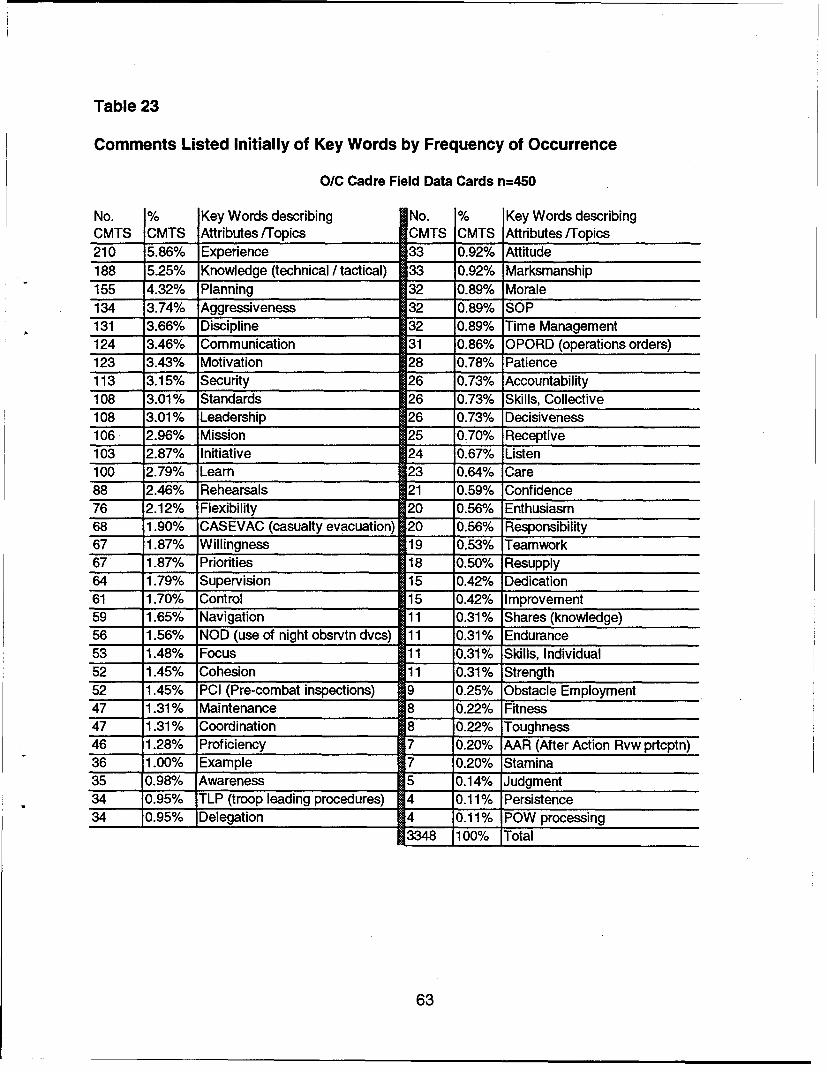
TEXT ANALYSIS OF 0/C AND CADRE COMMENTS ONPLATOON LEADER, PLATOON SERGEANT, ANDPLATOON PERFORMANCE
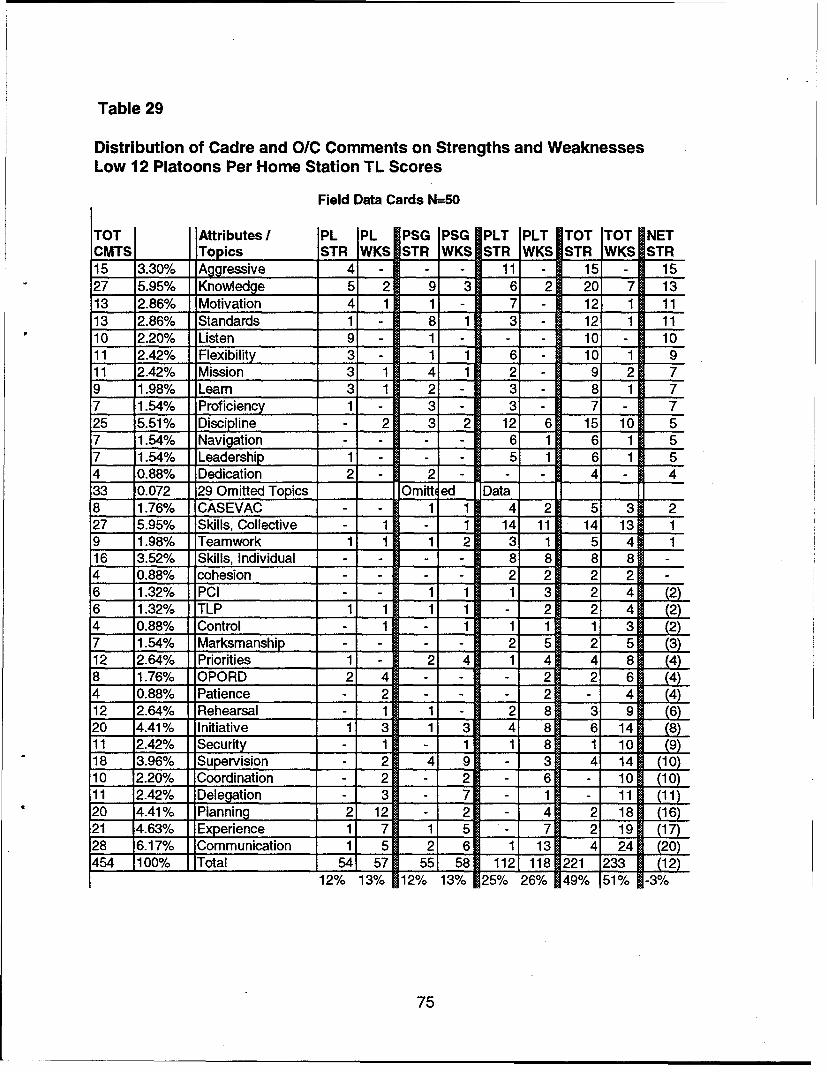
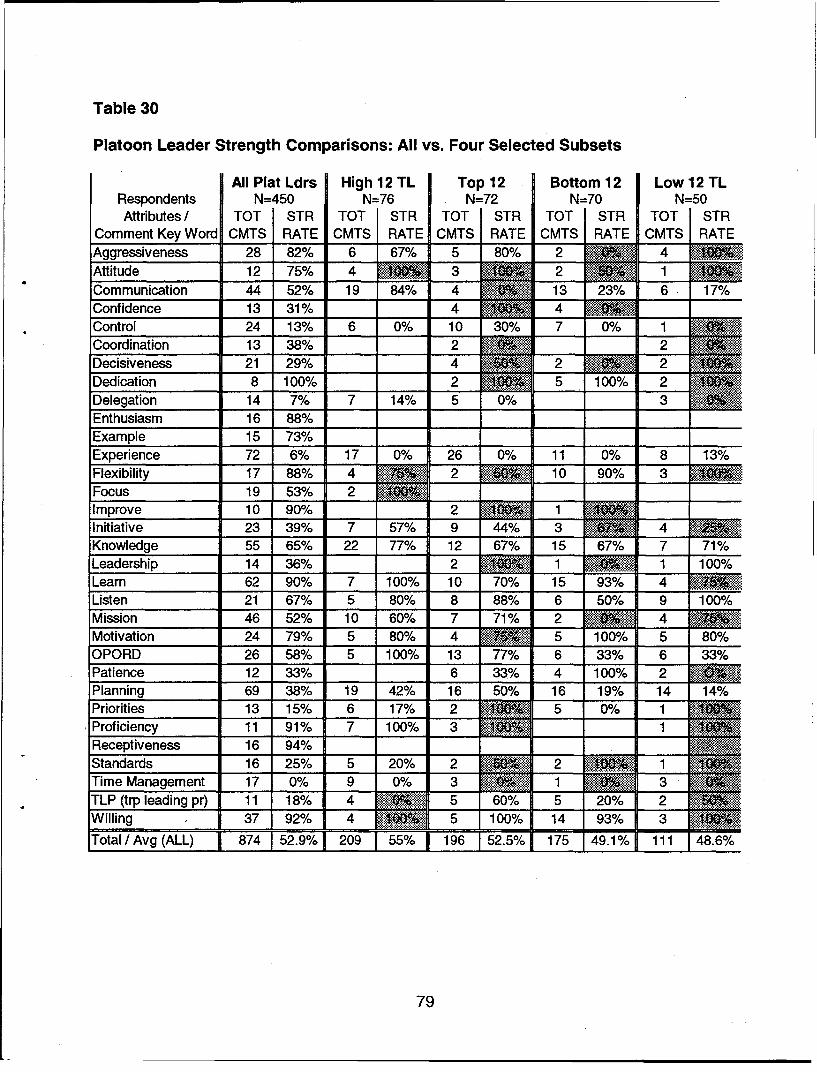
Frequency and Significance 61Attributing Comments as Strengths or Weaknesses by Subject 62Questions for Analysis 66Strengths and Weaknesses in Top vs. Bottom 12 Performing
Platoons 68Qualitative Interpretation of Top and Bottom Differences 720/C and Cadre Comments According to the Platoon's TMLQ
In Home Station Transformational Leadership 72Strengths and Weaknesses in High vs. 12 Low TL Platoons
In Transformational Leadership 73Comparisons Between Data Sets 78Findings for Platoon Leader Comparisons 80Summary of Qualitative Comment Analysis Findings 81Implications for Training 82Implications for Leadership Training and Development 83
ix
Communication 83Tactical Training Implications 84Qualitative Model Improvements 84Summary of Qualitative Findings 85CONCLUSIONSLimitations 86
REFERENCES 87
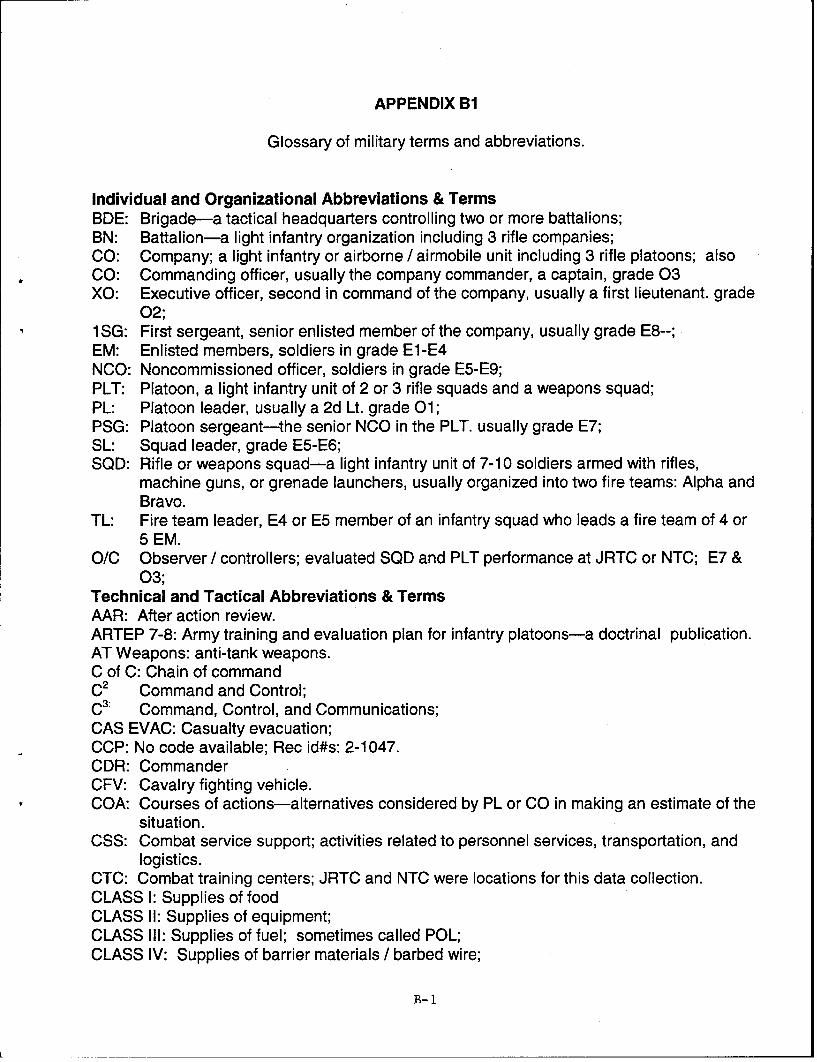
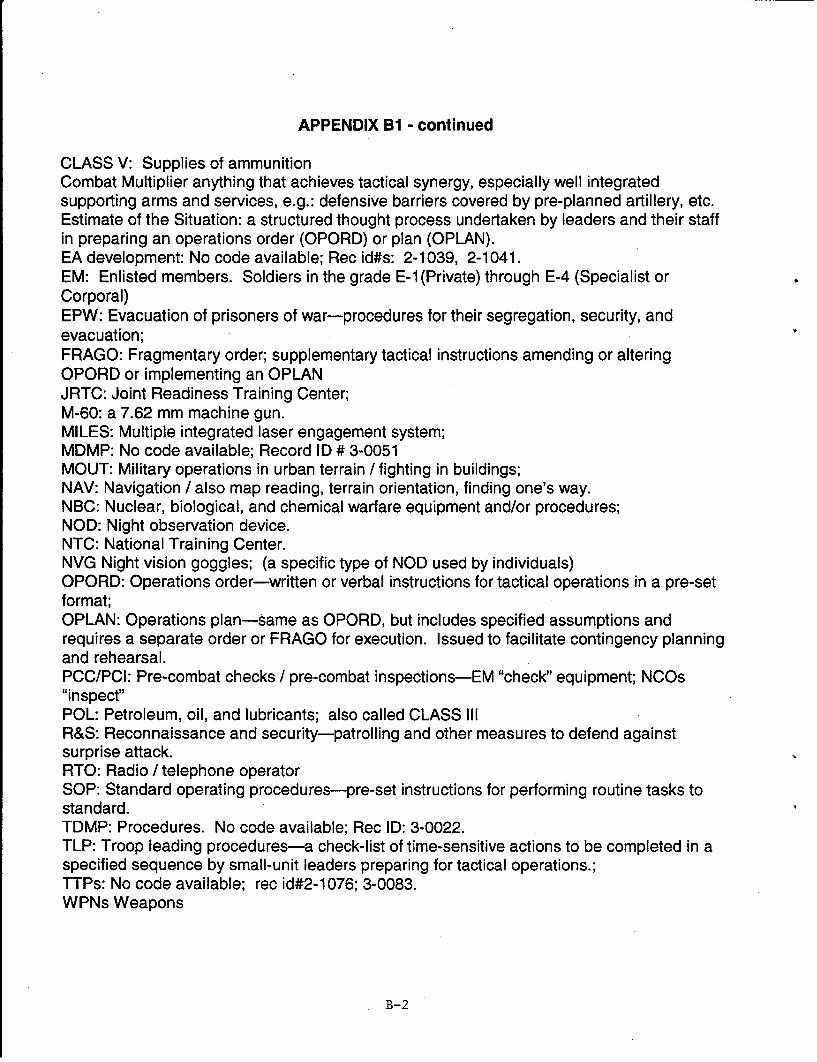
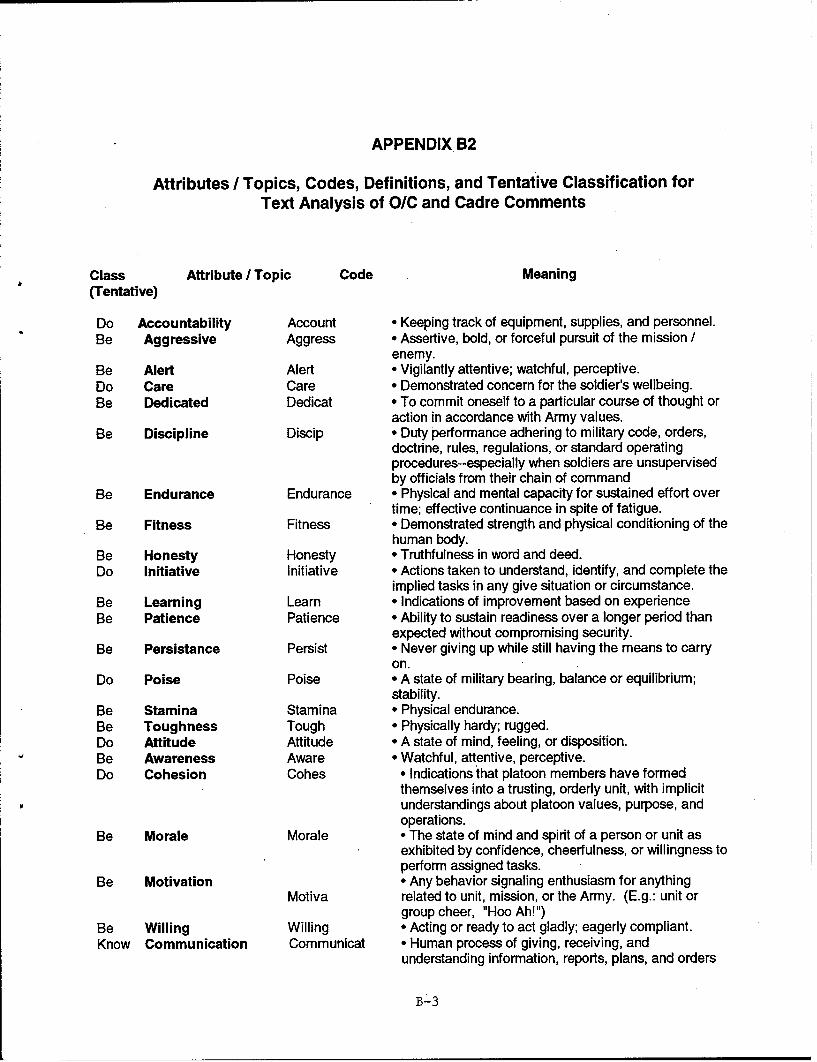
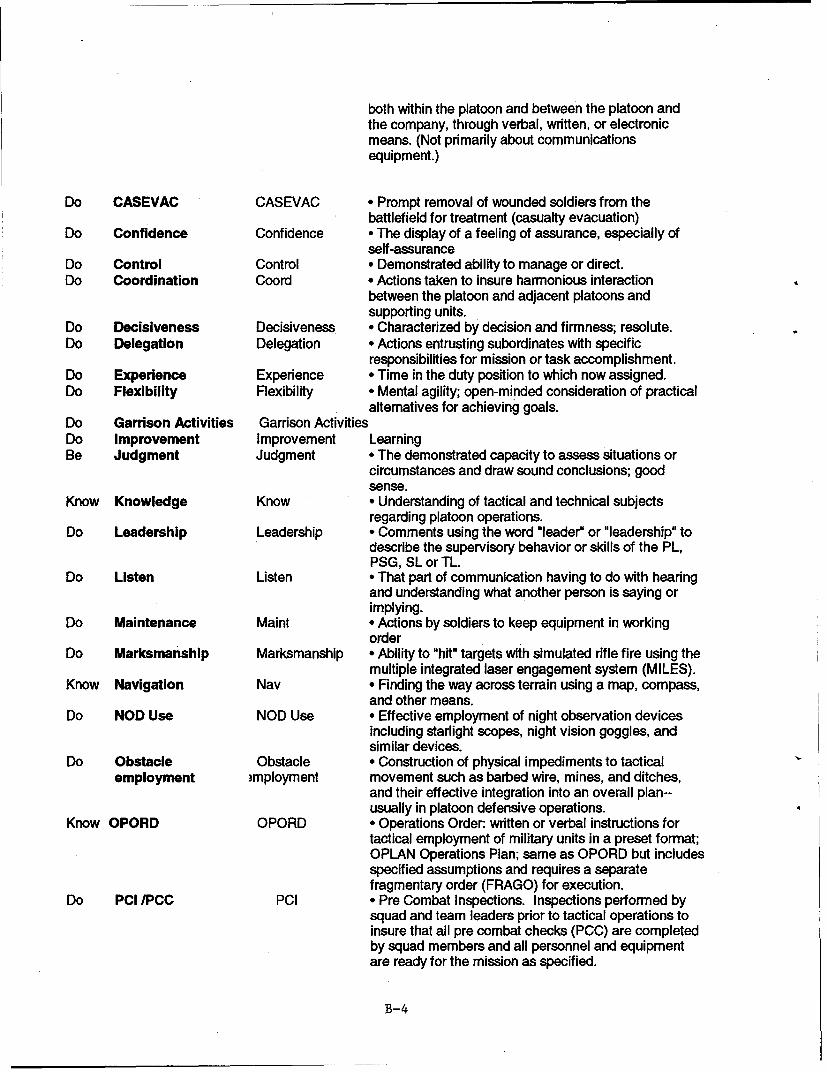
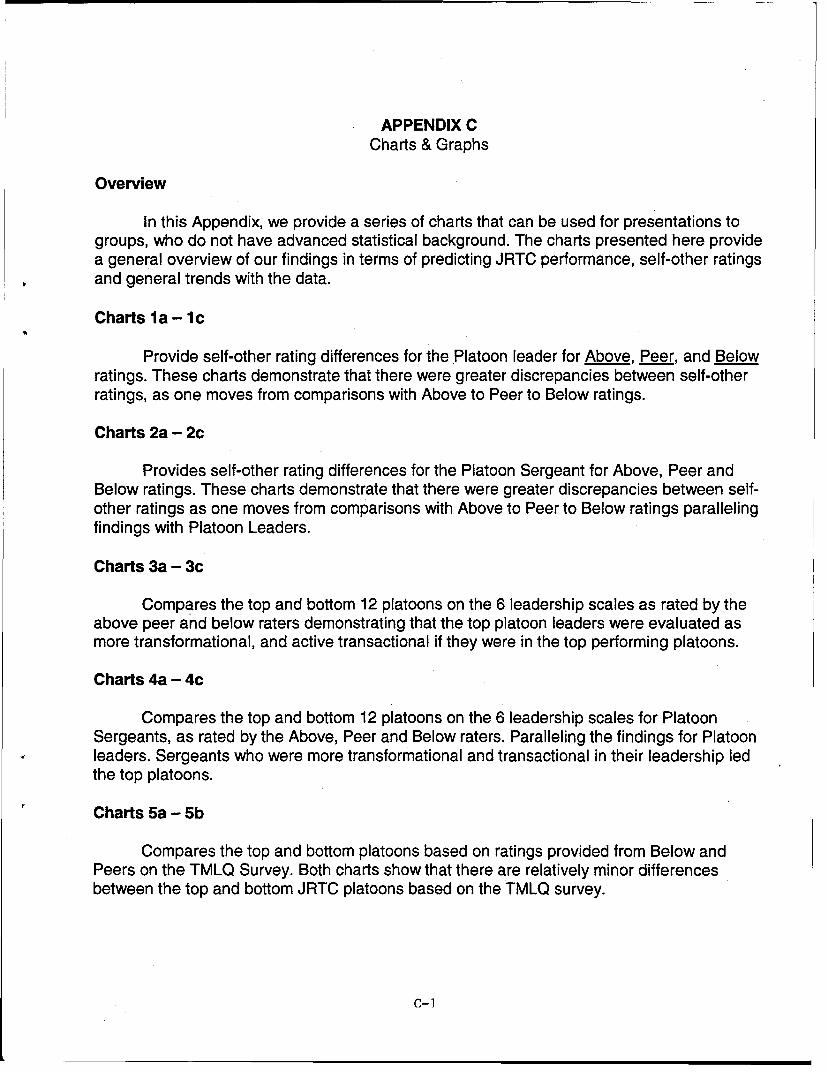
APPEN DICESAppendix A - Survey Measures and JRTC Scorecard A-iAppendix Bi1 - Glossary of Military Terms and Abbreviations B-iAppendix k2 - Coding and Classification Sheet for Key Words B-3Appendix C - Charts and Graphs C-i
x
INTRODUCTION
Objectives
The purpose of the contracted project was to determine whether and how well platoonleadership in home station and in simulated combat could predict platoon readiness.Findings would test the theory of transformational leadership by showing that platoon leadersand platoon sergeants who were more inspirational, intellectually stimulating, and individuallyconsiderate, led platoons that were more effective and satisfying in home station andsubsequently higher in mission accomplishment, in the near-combat conditions of the JointReadiness Training Center (JRTC).
More specifically, this research project set out to examine the relative contributions toplatoon home station and combat readiness; (1) the transformational/transactional leadershipbehavior of the platoon leaders (PLs and PSGs) as seen in multiple-source appraisals bysuperiors, peers, platoon members, and selves; (2) the differenttransformational/transactional leadership styles and (3) the transformational/transactionalteam leadership of the platoon and company culture. The results were expected to haveimplications for policy, recruitment, leadership training, selection, and classification.
Such research and its potential applications are needed for at present because,
"there are no highly visible, heavily resourced efforts to define,inculcate, and monitor the creation and sustainment oforganizational climates that challenge, inspire and motivate allranks... the Army's interest in the values of duty, loyalty, selflessservice, honor, courage, respect and integrity represent the coreof a noble tradition. Announcing them is necessary but insufficienthowever, for shaping leaders behavior and for demonstrating whatthe Army considers 'best practices' in this respect" (Ulmer, 1998,p. 11).
Changing Requirements
In the Post-Cold War environment, adaptability to change in the many situations theU.S. may be called into action is key to the effectiveness of the required leadership and unitperformance. Obvious changes that are required of the U.S. military result from changes inthe international scene, changes in technology and changes in U.S. society. "Forcereductions and recent high usage of marginally guided military organizations, have enacted atoll on morale and readiness that may have long term cultural impact" (CSIS, 2000).
For the Army, the time increasingly is reduced for force build-up and entry into action.Readiness to fight two regional wars or several "little" wars simultaneously must be presentin less time than was available for the Gulf War, Bosnia and Kosovo. Units must be ready toproject U.S. power on any continent in the shortest possible time.
1
The Army's leadership has to be ready to deal with several security threatssimultaneously (Avant, 1994). At the time of this writing, Iraq, Yugoslavia, and North Korearemain threatening violent confrontations. The Bos 'nian Muslims, Serbs and Croats, and theAlbanians of Kosovo require extensive investment in peacekeeping as did Panama, Haiti,Somalia. Peace treaties between Israel and Egypt in the Sinai and most probably betweenIsrael and Syria on the Golan will further stretch the requirements. The importance ofattention by the military leadership to "the hearts and minds" of the local civilian populationsis seen as a crucial requirement for success (Avant, 1994).
The exclusive use of air power in Yugoslavia lacked deterrence until the threat ofusing ready ground forces was made apparent. Such ground forces need to be highly flexiblein their capabilities for war-fighting, peace-making and peace-keeping. These forces must beable to incorporate new technologies such as digitization as they become available and to beengaged in continuous learning and improvement throughout the unit.
The new Army units also reflect the multicultural society that the U.S. has become asminority membership continues to increase (Moskos & Burk, 1994). Leadership must weldtogether soldiers of mixed race, ethnic background, and sex into effective collaborative units.These units must in turn, be able to handle the high levels of stress associated with conflictand the difficulties of addressing an indigenous population that may or may not be supportiveof U.S. intervention. At the same time, the military must also have the leadership and supportof the American public, which has been consistent in its willingness to support the use offorce for humanitarian ends and/or to counterbalance aggressive behavior. For instance, in a1993 Times Mirror General Survey of the U.S. population, 91% of those questioned agreedthat the United States should take a leadership role in world affairs. The characteristics andchallenges of situations in which the U.S. has and may become involved, requires that wedevelop and maintain a highly equipped military force with the appropriate leadership.
For the Army of volunteers, increasingly based on education and intelligence, Armyservice is either a career or a prelude to a career in civilian life. While honor, duty andcountry can still provide a sense of purpose, the moral relativism and the substitution in oursociety of anti-heroes and celebrities for heroes, requires new forms of leadership. Suchleadership can generate commitment, loyalty and involvement based on the alignment of themember's interests and those of the units at various levels to which the enlisted personneland officers belong. Leadership at all levels can align the interests of the Army, its units, andits members to the Army's core values and its ultimate objectives.
The Army can no longer afford the perception that it is so bureaucratic that "Catch 22"is the rule rather than the exception and that snafus are the norm. Rather than the revealedwisdom that, "There's the Army way and there's the right way", the Army way has to becomeand be seen as the right way, exhibiting the highest degrees of authentic leadership.
In the past decade, new problems have emerged that have added implications for theleadership required of U.S. forces. China has emerged as a global, military, and economicpower along with a weakened and less stable Russia. The nature of conflicts the U.S. hasand expects it might become engaged change over time. The booming U.S. economy has
2
made recruiting and retaining personnel difficult. The professional army shares missions withthe reserves. The perceived threats are often subnational and non-military ranging fromterrorist threats organized in Afghanistan, to the flow of drugs from Colombia.
Effective leadership is instrumental in the readiness for war-fighting, peacemaking,and peacekeeping in order to raise morale, and to create the combination of legitimacy,commitment and moral violence in the service of social goals (Gal, 1990). Today, and intothe foreseeable future, American soldiers will need to be prepared to go in harm's way whenmost of the nation is at peace going about its regular business.
The Concern for Improving Leadership
General R. R. Fogelman (1993) declared that the difference between a good unit anda bad unit is leadership. J.H. Dalton, Secretary of the Navy, added that trust in its leadershipis central to military readiness:
"The question of military character and ethics is not an abstract topic for discussion. Itis a readiness issue. It is a readiness issue because without ethical leadership in our ArmedForces, there can be no trust by subordinates in the orders of their superiors. There can benone of the special spirit or bonding that we consider essential to the teamwork required forcombat. And there would be little confidence by the American people in the rightness of ouractions. Without trust and confidence, there cannot be an effective military for America."(Dalton, 1994, p. 296)
Self-interest must be transcended by the military. As S.L.A. Marshall noted:"The sole difference distinguishing the professional soldier from the civilian is that theprofessional soldier places the line of duty above the line of self interest." (Dalton, 1994, p.297)
Based on the climate survey of 9000 military service personnel and 90 focus groups ,William J. Taylor, Senior Vice-President, Center for Strategic & International Studies,concluded that "Among problems inside the service are significant differences in the qualityof local leadership" (Taylor, 1999). According to Lieutenant General Howard D. Graves(1994), "We continue to face a woeful shortage of good leadership in our country today. Theencouraging trend is that there is a rising concern about that shortage (p.3)." Most relevant tothe focus of our three-year project, he went on to say, "we are beginning to recognize thatleaders may be good or bad, and that the command climate set by the leadership of anorganization has a major effect on the eff iciency and interaction of its members, and thus onthe effectiveness of the organization. We are also learning that frequently the differencebetween good and bad leaders is more a question of character than technical proficiency(p.3)."
A New Paradigm of Leadership
Paralleling the post-Vietnam and post-cold War changes in military leadershiprequirements has been the introduction of a new paradigm of leadership -
3
transformational/transactional leadership. Beginning with the seminal book by Burns (1978),attention was centered on issues raised by Fogelman, Dalton, Marshall and Graves, of trust,confidence, transcending self-interest, and character. By 1985, a set of measures andmodels became available for empirical research, assessment and training (Bass, 1985).These measures were extensively refined and validated in the following years. (Avolio, Bass& Dong, 1999; Avolio & Bass, 1993)
While the U.S. Army may have been practicing some of the components oftransformational leadership since George Washington assumed command in 1775, theconception, measurements, and available modeling have not been exploited by the Army forbasic research which, could further applications in training, development and selection (Bass,1998). The earliest demonstrations of the validity of U.S. Army colonels' ratings in combatand combat-service units of their superiors' transformational/transactional leadership as itrelated to their effectiveness was completed by 1982 (reported in Bass, 1985). A sufficientnumber of empirical research studies were completed between 1982 and 1992 to provide ameta-analysis comparing military and civilian findings (Gaspar, 1992). The empiricalresearch both inside and outside the US Army, Navy, Air Force and Marine Corps havesupported the greater effectiveness of transformational leadership in contrast to transactionalleadership, in generating subordinate extra effort, commitment, satisfaction and contributionto military readiness. Replications supporting these findings also have been carried out withU.S., German and Canadian officers in NATO (Boyd, 1988) and in the Israeli Defense Forces(Zakay, 1995). Recently, Dvir (1998) demonstrated that transformational leadership could bedeveloped in Israeli platoon officers, and have significant positive impact on unit readinesssix months following the close of a 3-day training program. Yet, a full understanding of whatwas actually involved in improving unit effort and performance remains unclear. Often theavailable studies have not utilized the survey instruments designed to measuretransactional/transformational leadership, and in no instance has prior research examinedthe associated unit and organizational levels. Numerous studies repeatedly test the samefew hypotheses and often have failed to tie these hypotheses to a multi-level framework andtheory of organizational leadership.
In today's Army, as is true of all other organizations, inspiring leadership is needed,along with the type of character to determine the difference between right and wrong, whilehaving the courage to choose the right alternative. We also need leaders at all levels in theArmy, who can exemplify the highest levels of ethical and moral conduct, who are able togain the confidence of followers to make the ultimate sacrifice, who have the analytical abilityto overcome problems that were unanticipated and who focus throughout their careers ontheir own leadership development and the development of others. Such leaders wereoriginally described by Burns (1978) as being transforming.
The Transformational/Transactional Model of Leadership
Burns (1978) introduced a new model of leadership. Leadership wa's conceived to betransactional and transformational. Empirical evidence accumulated that transformationalleadership can move followers to exceed expected levels of motivation and performance,(Avolio, 1999; Bass, 1998; Bass & Avolio, 1993a; Onnen, 1987; Seltzer, Numeof & Bass,
4
1989). It has been seen extensively as a particularly significant source of effective leadershipin Army, Navy, Marine Corps and Air Force settings (e.g. Bass, 1998; Boyd, 1989; Curphy,1992; Longshore, 1988; O'Keefe, 1989; Salter, 1990; and Yammarino & Bass, 1990). Thisfact was implicitly recognized by many in the military long before the m odel was codified. Forexample, the Air Force included some of Burns' original writings in the Air Force Academycurriculum shortly after his 1978 book appeared in print.
Overall, the codification of a new range of leadership styles has permitted somesystematic exploration of transformational leadership and the effects of its application tospecific conditions. It has led to a whole new focus in leadership evaluation and training bothat the individual and team level (Avolio & Bass, 1991, 1994; Avolio, Waldman, & Einstein,1988; Bass, Waldman, Avolio, & Bebb, 1987; Kotter & Heskett, 1992; Onnen, 1987). And, ithas also resulted in new ways of identifying more successful and effective junior Naval officerleaders (Yammarino & Bass, 1990; Yammarino, Bass & Spangler, 1993). Finally, this newmodel and its components have been extended to examining the characteristics thatdifferentiate successful from unsuccessful groups and organizational cultures (Bass, 1990;Bass & Avolio, 1993b).
Social scientists, historians and military analysts long recognized leadership that wentbeyond contingent reinforcement (Levinson, 1980). Weber's (1924/1 947) seminal work oncharisma as the alternative to bureaucratic management epitomized such study. However,most psychologists, economists and military managers concentrated on testing and applyingcontingent reinforcement as the fundamental basis of effective leadership. For them,leadership was transactional. Followers agreed with, accepted or complied with the leader inexchange for praise, rewards, and resources or the avoidance of disciplinary action. Rewardwas contingent on the follower's carrying out roles and assignments as directed orcon sens ual.
Leadership must also deal with the individual follower's sense of self-worth, with thegroup's sense of collective efficacy, and the meaningfulness in what is to be done, in order toengage the motivation of followers to willingly provide total commitment and involvement inthe task at hand. Transformational leadership secures higher levels of commitment andinvolvement, by building personal identification among followers with the goals of the leaderand organization. The process of gaining this identification is critical to success in militaryunits. And that among other things is what transformational leadership adds to thetransactional exchanges of contingent reward for compliance, or the exchange of correction,negative feedback, reproof, or disciplinary action for failure to meet role requirements (Avolio,1999; Bass, 1998).
Transformational leaders motivate others to do more than they originally intended andmore than they thought possible. They set more challenging expectations, raise levels of selfand collective efficacy, and typically achieve significantly higher performance.
Transformational leadership does not substitute for transactional leadership. Itaugments the effects of transactional leadership in both civilian and military organizations asshown in two meta analyses of prior empirical literature that used the Multif actor Leadership
The components of transformational and transactional leadership and their meaninghave been identified in a variety of ways: factor analyses, observations, interviews, anddescriptions of the ideal leader that people carry around in their heads.
Transformational leaders do more with colleagues and followers than set up simpleexchanges, contracts, or agreements. They behave in ways to achieve superior results byemploying one or more of the components of transformational leadership. Factor studies fromBass (1985), Howell and Howell (1993), Bycio, Hackett, and Allen (1995), Jung, Bass, andAvolio (1995), and most recently by Avolio, Bass, and Jung (1999) have identified thecomponents of transformational leadership. Leadership is idealized or charismatic such thatfollowers seek to identify with their leaders and emulate them in terms of their values andbeliefs. The leader inspires the follower with challenge and persuasion, providing a broadermeaning and understanding, as well as enhancing the followers, the individual and collectiveefficacy. The leader is intellectually stimulating, expanding the followers creative use of theircognitive and analytical abilities. Finally, the leader is individually considerate, treating eachof the followers as an individual, and providing the follower with support, mentoring, andcoaching to enhance the developmental potential of the followers. Each of thesecomponents has been reliably measured with the MLQ (Bass & Avolio, 1990). Thesecomponents were the bases for the measurements of the MLQ, suitably modified wherenecessary, for the current military context.
Descriptions of the components are presented below.
Idealized Influence (or Charismatic Leadership) (11). Transformational leadersbecome role- models for their followers. The leaders are admired, respected, and trusted.Followers identify with the leaders and want to emulate them. In order to earn this credit theleader considers the needs of others over his or her own personal needs. The leader sharesrisks with followers and is consistent, rather then arbitrary. He or she can be counted on todo the right thing, demonstrating high standards of ethical and moral conduct. He or sheavoids using power for personal gain, but will use it when needed.
The most recently developed MLQ, Form 45, also calculates an attributed idealizedinfluence (IIA) scale as opposed to idealized influence or charismatic behaviors observed inthe leader (111B). Superiors, peers, subordinates, and self can complete comparable forms for36012 assessment of the leader.
Inspirational Motivation (IM). Transformational leaders behave in ways that motivateand inspire those around them by providing meaning and challenge to their followers' work,resulting in individual and team spirit being aroused, and enthusiasm and optimism beingdisplayed. The leader gets followers involved in envisioning attractive future states, whichthey can ultimately envision themselves, as they develop their full potential. The leader
6
creates clearly communicated expectations that followers strive to meet and alsodemonstrates commitment to goals and the shared vision.
Intellectual Stimulation (IS). Transformational leaders stimulate their followers' effortto be innovative and creative by questioning assumptions, ref raining problems, andapproaching old situations in new ways. There is no ridicule or public criticism of individualmembers' mistakes. New ideas and creative problem solutions are solicited from followers,who are included in the process of addressing problems and finding solutions. Followers areintellectually challenged to try new approaches and their ideas are not criticized becausethey differ from the leaders' ideas. Differences are encouraged to maximize the best solutionto problems.
Individualized Consideration (IC). Transformational leaders pay attention to eachindividual's needs for achievement and growth by acting as coach or mentor. Followers andcolleagues are developed to successively higher levels of potential. New learningopportunities are created along with a supportive climate. Individual differences in terms ofneeds and desires are recognized. The leader's behavior demonstrates acceptance ofindividual differences (e.g., some followers receive more encouragement, some moreautonomy, still others firmer standards, and still others more task structure). A two-wayexchange in communication is encouraged. Interactions with followers are personalized (e.g.,the leader remembers previous conversations, is aware of individual concerns, and sees theindividual as a whole person rather than as just an employee). The individually considerateleaders listen effectively. The leaders delegate tasks as a means of developing followers.Delegated tasks are monitored to see if followers need additional direction or support and toassess progress; ideally, followers do not feel they are being checked on. Such leaderscontinually develop followers and themselves to increasingly higher levels of potential.
Components of Transactional Leadership
Transactional leadership occurs when the leader rewards or disciplines a followerdepending on the adequacy of a follower's performance. Transactional leadership dependson contingent reinforcement, either positive contingent reward (CR) or the more negativeactive or passive forms of management- by-excepti on (MBE-A or MBE-P). Other possibilitiessuch as noncontingent rewards and punishments have been measured and found valid anduseful in a four-year longitudinal study of cadets at Virginia Military Academy by Atwater,Lau, Bass et. al., (1994).
Contingent Reward (CR). This constructive transaction has been found to bereasonably effective, although not as much as any of the transformational components inmotivating others to achieve higher levels of development and performance. With thismethod, the leader assigns or gets consensual agreement on what needs to be done andpromises rewards or actually rewards others in exchange for satisfactorily carrying out theassignment.
Management by Exception. Although this corrective transaction tends to be moreineffective than CR, it may be required in certain situations. This corrective transaction has
7
two main components representing active (MBE-A) or passive (MBE-P) styles of leadership.In MBE-A, the leader arranges to actively monitor deviances from standards, mistakes, anderrors in followers' assignments and to take corrective action as necessary. MBE-P implieswaiting passively for deviances, mistakes, and errors to occur and then taking correctiveaction. Management by exception is active if the leader monitors follower performance forfailure to meet standards and takes corrective or disciplinary action when failure is observed.Management is passive if corrective or disciplinary action only occurs when unsoughtproblems arise. Most recently it has been found to combine with laissez faire leadership intoa single passive leadership factor.
Laissez Faire (LF). This style is the avoidance or absence of leadership and is, bydefinition, most inactive, as well as most ineffective and dissatisfying according to almost allresearch on the style. As opposed to transactional leadership, laissez-faire represents anontransaction. Passive management by exception is less effective than active. Leasteffective is the laissez faire style in which the leader avoids the role of leading altogether(Avolio & Bass, 1991; Bass, 1998; Bass & Avolio, 1994; Podsakoff & Schriesheim, 1985).
Validation of the Leadership Measurement Model
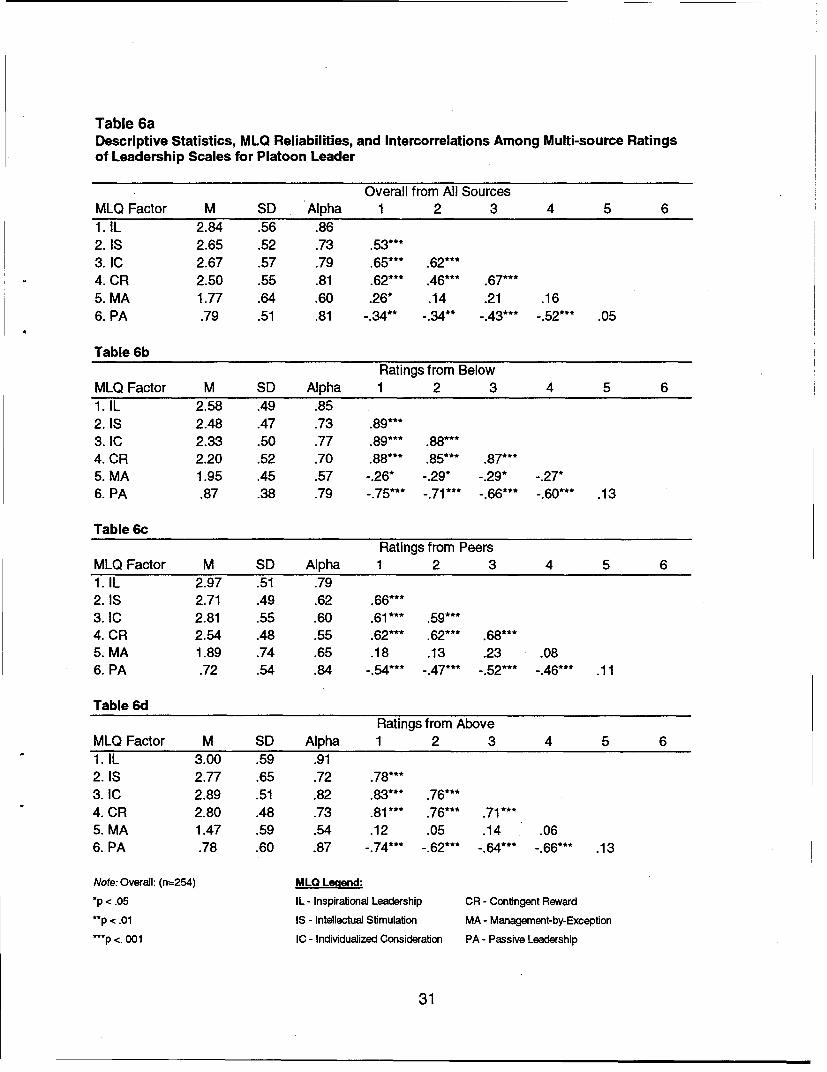
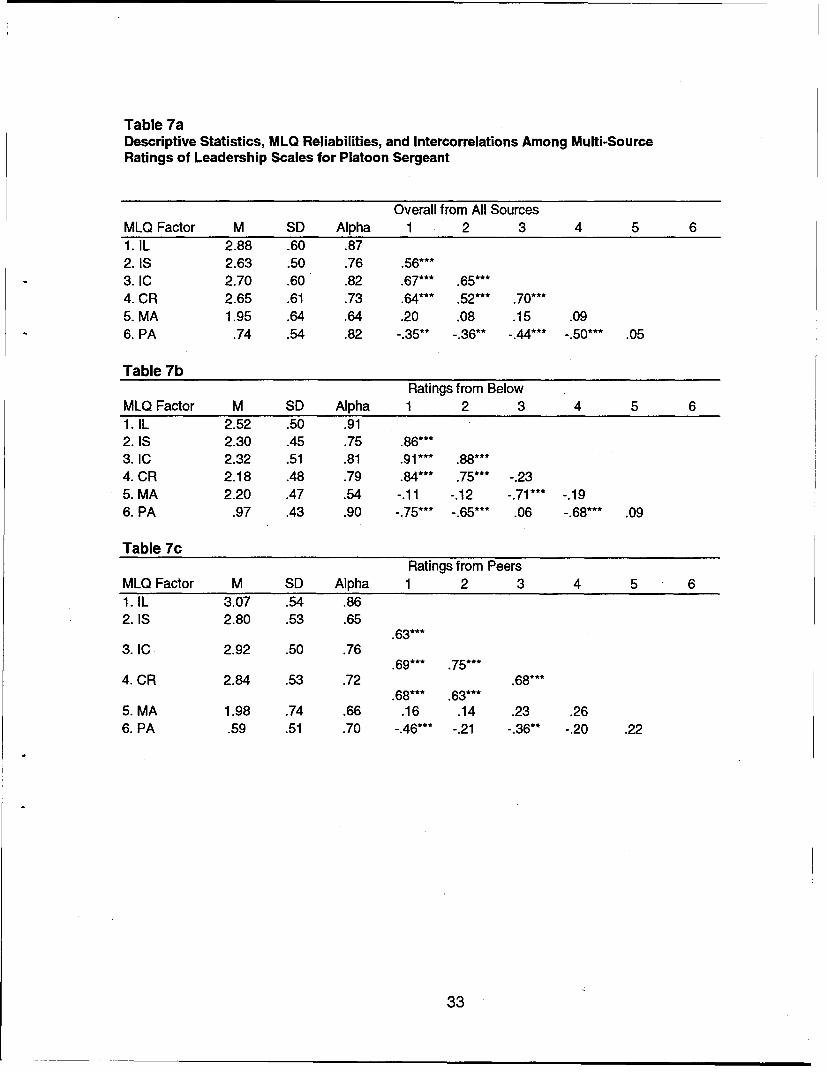
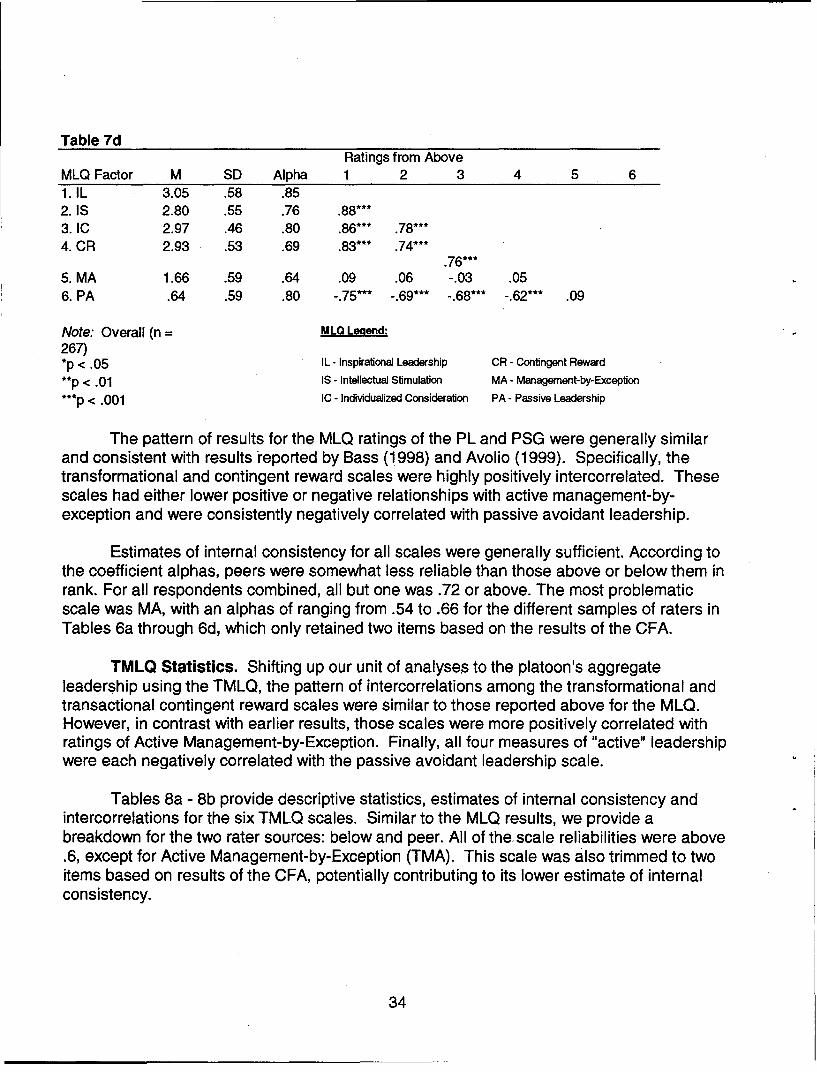
Burn's concept of the transforming leader was used to elicit accounts of leaders who fitthe description. These were converted to 141 behavioral statements. Eleven judges agreedon 73 as transformational or transactional. Principal component factor analyses werecompleted of the frequency which 196 US Army colonels said each of the items describedone of their immediate superiors. Numerous subsequent factor analyses and more recentLISREL and Partial Least Squares analyses, supported a three-factor solution that emerged(Bass, 1985; Howell & Avolio, 1993; Avolio, et al., 1999).
Three factors were obtained whose items beforehand had been judged-transformational: charismatic/inspirational, intellectually stimulating, and individuallyconsiderate. Since the dynamics and literature on charisma and inspiration were quitedifferent, we opted to maintain them as separate components early on in the present study.Salient in charisma is the identification of the follower with the charismatic and the desire toemulate him or her. Salient to inspiration is the providing of meaning and challenge to thefollower. Leaders who do a lot of one are also likely to do a lot of the other, but thedynamics, content, focus, antecedents and consequences may be different. Avolio, et al.(1999) recently confirmed the construct validity of an inspirational factor containing both thecomponents of idealized influence and inspirational motivation leadership. Bass (1985) hadfound both components highly intercorrelated.
In the earliest factor studies of the MLQ (Bass, 1985), the transactional items formedfactors of contingent reward, management by exception and laissez-faire leadership.Additional analyses supported splitting contingent reward into promises, rewards,management-by-exception, and laissez-faire leadership (Yammarino & Bass, 1990).Subsequent analyses also supported splitting management-by-exception into active andpassive components (Hater & Bass, 1988). Most recently a factor of empowerment has beenfound separable from the laissez-faire leadership factor (Bass, 1998).
8
In the most definitive MLQ study containing 14 samples, threetransactional/nontransactional factors emerged: contingent reward, active management-by-exception, and passive avoidant leadership (PA). Passive Avoident leadership combinedpassive MBE with laissez-faire (LF) leadership. Furthermore, there was an overlappingsecond order factor containing individualized consideration (IC) and contingent reward (CR)of the non-material aspects of reward such as praise.
In addition to survey studies of the MLQ, qualitative analyses of diaries and interviewshave also been conducted.
Diaries
In another ARI-supported investigation, Virginia Military Academy cadets reported inunstructured logs or diaries the leadership behavior they observed during a given set ofdays. These logs could be reliably scored in terms of all of the transformational andtransactional leadership components noted earlier. The log data have been linked toindependently obtained MLQ survey results for the components oftransformational/transactional leadership (Atwater, Avolio & Bass, 1992; Atwater, Lau, et al.,1994). Also, the transformational leadership behaviors collected via these diaries werepositively linked to higher peer rankings of the more effective cadet leaders at VMI.
Interviews
Interviews with executives about the leadership they had seen produced numerousother behavioral examples of transformational leadership that matched the MLQ components(Yokochi, 1989). Charismatic leadership was attributed to the interviewees' bosses forsetting an example, showing determination, exhibiting extraordinary talents, taking risks,creating in subordinates a sense of empowerment, showing dedication to "the cause,"creating a sense of a joint mission, dealing with crises using radical solutions, andengendering faith in the subordinates for the leadership. Inspirational leadership includedproviding meaning and challenge, painting an optimistic future, molding expectations bycreating self-fulfilling prophesies, and thinking ahead. Intellectual stimulation was judgedpresent when superiors questioned assumptions, encouraged subordinates to employintuition, entertained ideas that may have seemed silly at first, created imaginative visions,and asked subordinates to rework the same problems they thought they had solved before,but not completely. Individualized consideration was apparent to interviewees when theirbosses answered them with minimum delay, showed they were concerned for theirsubordinates well-being, assigned tasks based on subordinate needs and abilities,encouraged two-way exchanges of ideas, were available when needed, encouraged selfdevelopment, practiced walk-around management, and effectively mentored, counseled andcoached.
When peers of VMI military cadet leaders were asked what characterized theimportant traits of a good leader, they tended to describe traits of charismatic, inspirational,intellectual stimulation, and individualized consideration such as: self-confidence,
9
persuasiveness, concern for the well-being of others, the ability to articulate one's ideas andthoughts, providing role models to be emulated by others, holding high expectations foroneself and others, keeping others well informed, maintaining high motivation in oneself(Atwater, Lau, et al., 1994).
The 'Full Range Leadership" development program (Avolio & Bass, 1991) begins withparticipants describing their implicit theories of leadership as evidenced by an ideal leadereach has known. For well over 2000 trainees, from diverse backgrounds, the characteristicsof their "ideal leader" have consistently included the components of transformational andcontingent reward leadership described above. Moreover, the list of attributes is mainlyoriented towards most or all of the components of transformational leadership.
Correlations with Independent Criteria of Effectiveness
In previous military research, transformational leadership as measured bysubordinates' ratings correlated more highly than did transactional leadership with variouscriteria of leader effectiveness. When subordinates provide the criteria of effectiveness andsatisfaction, ordinarily the correlations with the components of transformational leadershipare highly positive. Nonetheless, lower but still moderately positive findings have beenobtained when the criteria of effectiveness were obtained independently of the subordinates.
In the military environment, transformational mean scores as gauged by subordinateswere higher among Marine Corps commanders of more effective helicopter squadrons(Salter, 1990), as well as among junior Naval officers in the surface fleet, who were moreoften recommended by superiors for early promotion and given better-fitness reports(Yammarino & Bass, 1990). The charisma scores of 20 Israeli battalion commanders alonepredicted 74 percent of the variance in their subordinates' satisfaction with their leadership.The lieutenant colonels commanded infantry and armor units. Additionally, the commanders'.individualized consideration accounted for 45 percent of their subordinates' extra effort andthe commanders' intellectual stimulation accounted for 8 percent of the variance insubordinates' extra effort (Zakay, 1995).
Gaspar (1992) completed a meta-analysis of 20 military and civilian studies. For themilitary studies, the mean charisma-i nspi ration, intellectual stimulation, and individualizedconsideration correlated .53, .46 and .57 respectively with objective organizational criteria ofperformance. The corresponding average correlations with transactional contingent rewardand active and passive managing-by-exception were .46, .26, and .32. The one military-civilian difference occurred for man ag ing-by-exception, which was negative for civilians.
Further Assumptions and Propositions
Further specific theoretical and hypothesized propositions have been tested withaffirmative results. Bass (1985) proposed an augmentation relationship betweentransformational and transactional leadership, i.e., transformational leadership augmentstransactional leadership in predicting effects on follower satisfaction and performance.Waldman, Bass, and Yammarino (1990) found the augmentation effect among various
10
samples of industrial managers and military officers as did Seltzer & Bass (1989) for 300part-time MBA students, each describing their superiors at their full-time work settings. Foranother sample of 130 MBAs, who each asked three of their followers to complete MLQsabout them, the augmentation effect held up when one follower's leadership ratings and asecond follower's outcomes were correlated. The same augmentation effect occurred wheninitiation and consideration, as measured by the Leader Behavior Description Questionnaire(LBDQ), was substituted as the measure of transactional leadership. (Seizer & Bass, 1990)Finally, Howell and Higgins (1988) reported that champions of innovation for research anddevelopment teams were also described as more transformational.
Collectively, these results demonstrate a fundamental point emphasized in the Bass(1985) theory of leadership: Transactional leadership, particularly contingent reward,provides a basis for effective leadership, but a greater amount of effort, effectiveness, andsatisfaction is possible from transactional leadership if augmented by transformationalleadership. Finally, and as reported earlier by Howell & Avolio (1993), transformationalleadership also augments transactional in predicting subordinates' levels of innovation, risk-taking, and creativity.
Directive or Participative. Transformational leadership can be directive orparticipative, as well as democratic or authoritarian. Charismatic leaders may directdependent followers out of crises with appropriate solutions to their problems. Theintellectually stimulating leader may challenge his/her followers to consider ideas andprinciples they felt were beyond their conceptual capacity. The individually considerateleader may override the demands for equality and may treat his/her followers differentlyaccording to their different needs. Nonetheless, transformational leaders may also beparticipative. They may share the building of visions of a democratic and collectiveenterprise. They may encourage follower participation to make decisions to change. Theymay foster mutual consideration among followers. Similarly, transactional leadership may beeither directive or participative.
Pseudo-transformational Leadership. Critics may find exploitiveness and abuses ofpower in the transformational leader. But such leadership is pseudo-transformational (Bass& Steidlmeier, 1999). Idealized influence (11) or charismatic leadership may be socialized orpersonalized (Howell & House, 1992). Socialized means that the leadership serves
* collective interests and develops and empowers others for the good of the group.
Personalized charismatic leadership, based on personal influence and authoritarianbehavior, is self-aggrandizing, serves self-interests of the leader and is exploitative of others(McClelland, 1975). Personalized leaders rely heavily on manipulation, threat andpunishment, and show disregard for the rights and feelings of others. They are impulsivelyaggressive, narcissistic, and impetuous. They are at lower levels of moral development andperspective-taking (Howell & House, 1992) and fail to inhibit unnecessary use of power.
Pseudo-transformational leaders are self-oriented, self-aggrandizing, exploitative,narcissistic, power-oriented, and openly talk about distorted utilitarian and warped moral
11
principles. The pseudo-transformational leader caters in the long run only to his or her ownself interests.
Burns (1978) believed that to be transforming, a leader had to be morally uplifting.Truly transformational leaders transcend their own self-interest for one of two reasons:utilitarian or moral principles. If utilitarian, their objective is to benefit the organization,society, the group, and/or to meet the challenges of the mission. If a matter of moralprinciple, the objective is to do the right thing, to do what fits principles of morality,responsibility, sense of discipline, and/or respect for authority, rules and traditions of asociety, and for "duty, honor and country." Both reasons apply equally well to the espousedcharacteristics of leadership being sought by the U.S. Army.
It is clear that the moral character and ethics of leadership in our Armed forces isfundamentally important to readiness. And that where there is no trust in the orders of theirsuperiors, or by the indigenous population whose support is needed to win regional conflicts,the possibility of success is diminished (Dalton, 1994). Moreover, the trust that results in aspirit or bonding essential for teamwork in combat is much more likely to result fromtransformational leadership displayed by officers and among unit members.
Extension of the Transformational Leadership Model to Groups
The original proposed research called for assessments of squad mores, platoonclimate, and company culture, for their effects on platoon leadership. At the first meetingwith consultants, it was decided that turnover of squad members and squad leaders were toohigh to provide reliable results and that main focus should be on platoons and company asthe prime sources of infantry effectiveness.
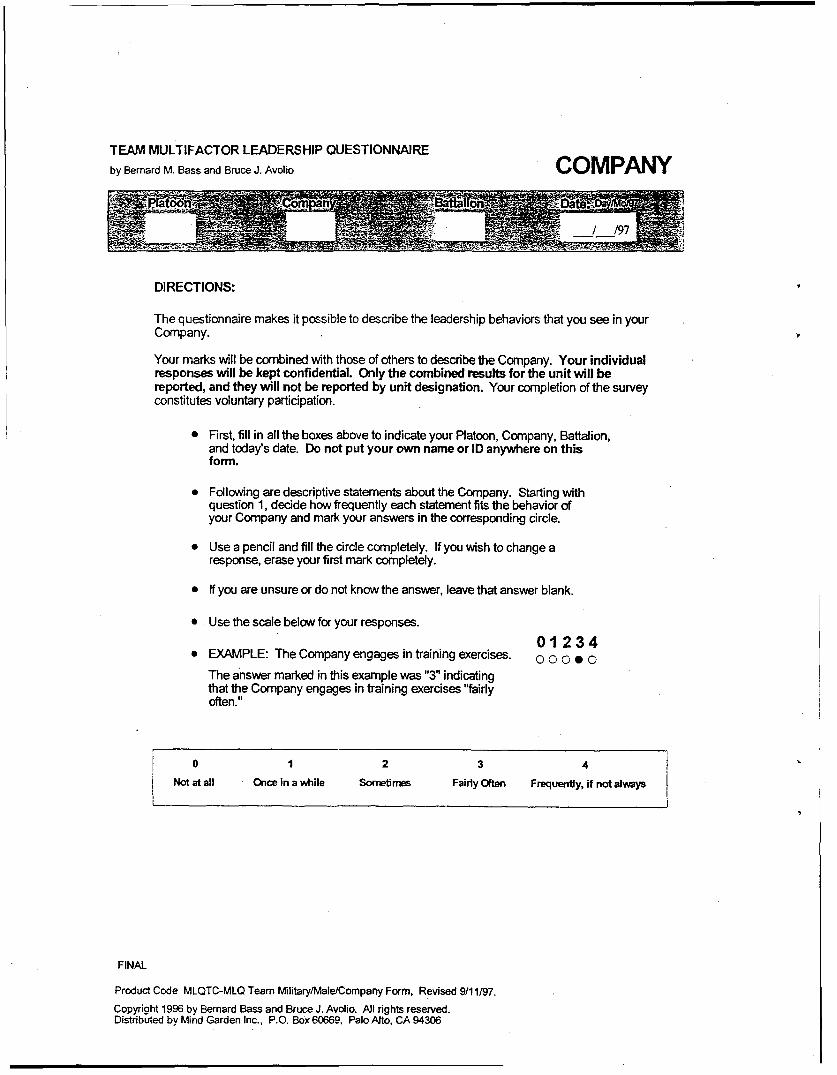
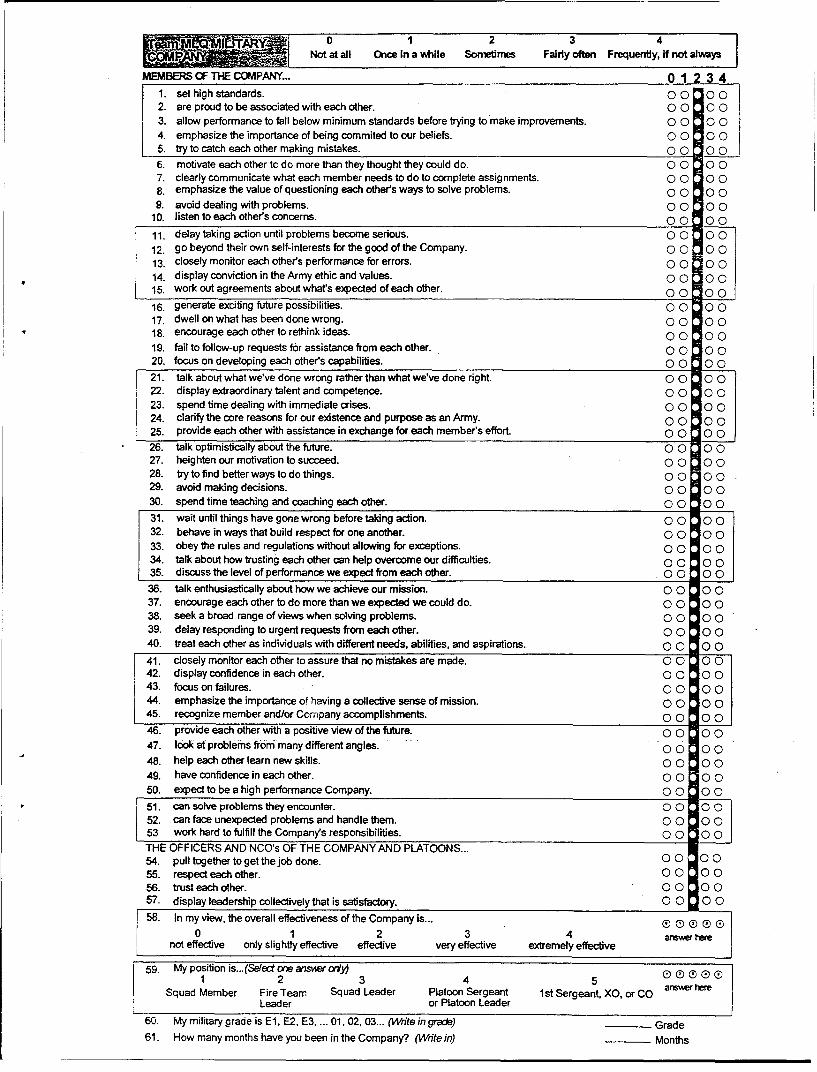
The transformational/transactional model embedded in the Team MultifactorLeadership Questionnaire (TMLQ) could be used by their members to describe the attitudesand behavior of their groups, as groups, such as platoons and companies. Insights couldalso be obtained of their leadership climate and leadership culture. The same concepts-would be measured at three different levels: individual, platoon, and company.
Burns (1996) expanded his original thinking on individual transformational leadershipto include a focus on "collective leadership". Burns (1996) wrote in an unpublished paperentitled "Empowerment for Change," that there were "the existence of webs of potentialcollective leadership" (p.1). Substituting the term 'initiators' for 'leadership' due to the fact thatleadership is typically assigned to an individual, Burns went on to suggest, "the initiator maycontinue as a single dominating 'leader' a Ia Castro, but more typically he or she will mergewith others on a series of participant interactions that will constitute collective leadership ...Isee crucial leadership acts in the collective process. (pp 2-3)."
In his extension of transformational leadership theory to teams, Bass (1998, p. 157)notes that, "transformational leadership could be shared among the team members". Hesuggests that in such teams, substitutes for leadership may evolve that help support theteam's higher levels of achievement. For example, Bass (1998, p. 157) states, " We might
12
see a small military team whose esprit had been built by a previous history of success,gallantry, and mutual support of members for each other. Its formally appointed officer mightfind the membership on the team provided sufficient member self-esteem without any efforton the part of the officer... Ilnstead of motivation being supplied by identification of memberswith the team... Ilnspiration would come from sharing of mutually articulatedgoals... .Empowered, self-managed work teams ideally epitomize substitution for much of whatwas done before by the formal hierarchical leader."
"Structured Groups" vs "Highly Developed" Teams. To be successful, team* members must understand each other better and must be willing to address problems by
entertaining different perspectives. Trust and commitment become essential to unit success,particularly in combat, which requires a special spirit and bond among members to be willingto make self-sacrifices for the benefit of the unit and its mission. Each of these qualities isincorporated in what has already been discussed as transformational leadership. However,now the unit of analysis is perceptions of the platoon or company and these behaviors orstyles can be measured by the Team Multifactor Leadership Questionnaire. (TMLQ)
Group performance is below expectations when individuals are working in anunstructured group particularly where an integrated effort is required, at expectations wherethe individuals in structured groups have well-defined roles and expectations, and beyondexpectations where individuals are members of highly developed, high performance teams.
Unstructured and semi-structured groups. These groups typically exhibit laissez-faire and passive man agement-by-exception. Members do not set clear agendas and areconfused about priorities and responsibilities. Early on in its development, the unstructuredgroup's priorities and expectations remain diffuse, potentially resulting in conflict amongindividual members of the group. This may parallel the common stage of group performanceknown as "storming". We believe that storming is not necessarily a natural stage of groupdevelopment, and it may be avoided with adequate transactional team leadership. It is theproductive conflict of ideas and perspectives that result in profound knowledge anddevelopment, as opposed to the lower-level conflict associated with poorly defined roles andexpectations. Transformational leadership among team members appears to produce suchproductive conflict, while at the same time building cohesion, commitment and loyalty to theteam's mission. In semi-structured groups, members react to problems rather than anticipatethem and hesitate to take initiatives. The boundaries for participation are too ill-defined to beeffective.
Structured Groups. The members of structured groups have a clearer sense of whatis expected from each other. Guidelines to be followed are in place and reinforced byfeedback, rewards, and discipline. Structured groups, as groups, actively manage-by-exception. Members closely monitor each other for deviations from expectations to assuretasks have been satisfactorily completed. They enforce rules and procedures to guidemembers' participation in the group. In structured groups, members focus on their roles andon accomplishing the group's goals and objectives. Agendas are clear and explicit. Tasksand responsibilities are assigned, constructive feedback and recognition are provided tomove the group towards its goals.
13
Structure is required by highly developed teams concerning the expectations teammembers have of each other. Structuring at the level of groups, parallels transactionalleadership at the individual level. The structure determines what is and is not appropriatebehavior, contributions expected from each group member, how the group will evaluate itsperformance, how the group rewards and disciplines its members, and how decisions will bemade and communicated. The structure is the external framework that forms the basis forgroup interactions (Avolio, 1999).
Highly Developed Teams. Distinguishing between a structured group and a highlydeveloped team involves a transition in perspective. Members shift from adhering toexternalized criteria and standards for behavior to their internalized standards based onbeliefs, values and commitment to shared ideals. Differences in perspective in the structuredgroup give way in highly performing teams to shared perspectives. This shared perspectiveenhances the vital force of the team to take on the most formidable challenge, and to reachinside oneself to achieve the uncommon goals.
In highly developed teams, the members contribute their best efforts because of theirresolve, because their identity is linked to the teams shared vision, because they take pridein being associated with the team, and because they are willing to provide extraordinaryeffort to achieve the team's mission. The member of the structured group asks "what's in itfor me" and what am "In supposed to do. The member of the highly developed team asks"nwhat's in it for my team" and where do "we"~ need to go to accomplish our mission. Membersof highly developed teams are willing to sacrifice their own gain to achieve the team'scommon purposes. High levels of commitment, cohesion, interdependence, andresponsiveness to change characterize such teams (Avolio, Jung, Murry, &Sivasubramaniam, 1996; Guzzo, Yost, Campbell, & Shea, 1993). Specifically, Avolio, Jung,et al., showed that the transformational leadership of team members was highly predictive oflevels of cohesion, collective efficacy, group effectiveness and satisfaction over periods of 3-4 months.
Highly developed and performing teams, as teams, manifest the components oftransformational leadership behavior. Highly developed teams and its members exhibitbehaviors that are individually considerate, intellectually stimulating, and inspiring to otherson the team. Shared ideals, trust, commitment and cohesion are high and so too is thewillingness to sacrifice for other team members, representing the charismatic qualitiesdescribed above, but now at the team level. Members trust they are each working toward acollective purpose and team ideal. The focus is on working together to maximize theperformance of the group and its rewards, as opposed to the unstructured and semi-structured groups, which too often exhibit a "war of the parts" against the whole.
The highly performing teams are optimistic, aroused, and enthusiastic. They areconfident they have the talent and the experience to meet and exceed their most challenginggoals as demonstrated in their higher estimates of collective efficacy and team potency(Avolio, Jung, et. al., 1996). There is a strong sense of synergy and collective efficacy thattogether the members can accomplish the highest levels of performance. There is a
14
perceived unity, pride and commitment to the teams shared mission and vision. There isbelief in the dependability and integrity of the team members as a whole. Members helpalign their individual interests with the general missions and visions of the team. Within theteams, members serve as role models for each other's development and performance.
As team members develop beyond structured groups and internalize shared purposes,commitment and cohesion, the teams increase their achievement of team goals and establishthe basis for achieving higher levels of performance than would be expected from a simplesummation of individual efforts (Campion, Medsker & Higgs, 1993).
In many ways, the members of the platoon, as a group, can substitute for directintervention of the PL or PSG. In this regard, one can examine the diffusion of leadership to amore macro-level of analysis (Avolio & Bass, 1995). For example, in a platoon wherecontinuous improvement is highly valued and reinforced, one would expect to observemembers who are more developmental ly-oriented, individually considerate, and rewarded bythe organization for being so.
As we moved from the individual member to the level of analysis to the platoon level,and then to the company level, we have created a broader framework for examiningleadership. Starting with the platoon or company we can examine how certain style behaviorsare more or less relevant, from senior to junior levels. We can also examine how relationsbetween the PL and the PSG affect platoon effectiveness, and satisfaction.
Leadership "of" versus "by" the Team
Most prior research focusing on leadership in teams has assessed the leadership of asingle individual leading a team (Cohen, Chang, & Ledford, 1997; llgen, Major, Hollenbeck &Sego, 1993). While several authors have introduced the concept of "collective" ordistributed" leadership within teams (Katzenbach, 1997; Kozlowski, et al., 1996; Manz &Sims, 1993), there has been no attempt to examine leadership as a group-level construct.Thus, there are no methods to measure the leadership exhibited by the team as a collectivewhole. Dunphy and Bryant (1996) reviewed the literature on teams and concluded that futureresearch must include leadership by the team, as well as of the team, when modeling teameffectiveness. Similarly, Ilgen et al., (1993) recommended, "as we consider work teams andresearch on them in the 1990s, we cannot overlook the role of leaders and leadership (p.248)."
One purpose here was to examine a new measure of team leadership, the TMLQ,which can be used to evaluate the transactional and transformational leadership exhibited bya team. We first provide our justification for measuring these constructs associated with"team leadership".
Team leadership is defined here as representing the collective influence of membersin a team on each other. Teams create a particular identity and mental model that guides thebehavior of individual members based on shared expectations and beliefs (Martin, 1993), orwhat Neck and Manz (1994) referred to as "group self leadership". As the team itself
15
becomes a more central entity for its members, the mental model in each member's head ofwhat the collective accepts, supports, criticizes and so forth will influence the individual andcollective actions of team members. For example, the very act of being a part of thecollective might inspire and stimulate individual members to reach performance levelsbeyond expectations in very much the same way as an individual leader influences his or herfollowers to perform when they are inspired (Bass, 1985). This may explain why Bowers andSeashore (1966) found that peer leadership had a higher positive correlation with unitperformance than the leadership exercised by an individual manager.
We define team leadership in terms of how members of the group evaluate theinfluence of the group, as opposed to one individual within or external to the group. Thetheoretical meaning and operational definition of team leadership integrates the perspectivetaken by the team member in assessing leadership, as well as the level at which thephenomenon of leadership is examined, which we define here as the group. Our strategy formeasuring team leadership is consistent with recommendations by Tesluck, Zaccaro, Marks,and Mathieu (11997), who suggested that group level phenomena can be assessed by havingeach individual rate the group (also see Campion, Papper, & Medsker, 1996; Chan, 1998;Hyatt & Ruddy, 1997 for a discussion on methods to evaluate team constructs).
RESEARCH PLAN
Purpose
The infantry platoon, as a platoon, is the most significant unit for both the individualsoldier and the Army for enhancing the effectiveness of operations. The core leadership restswith the non-coin platoon sergeant and the platoon leader, usually a commissioned secondlieutenant. Squads and squad leaders play secondary leadership roles usually for shorterperiods of time, since turnover is higher in squads and squad leaders than in platoons andplatoon leaders. The purpose of this investigation was to show that platoon readiness andeffectiveness is a complex function of its platoon leadership,. its platoon and companyclimate, and the culture of leadership of all its members.
The plan assumed that each company and platoon within it initially containedsoldiers with the same distribution of skills, competencies, training and experience. That is,we assumed there were no selection biases that would skew the results.
A major aim of the investigation was to examine whether the joint-readiness of theplatoons in terms of the leadership and platoon effectiveness, according to observer-controllers when the platoon's brigade is engaged in joint-readiness exercises, could bepredicted from prior transformational and transactional leadership ratings in home station ofthe PL and PSG and of the platoon as a whole. Also, prior to JRTC, in home station,assessments of the platoon and company satisfaction and extra effort were obtained alongwith measures of extra effort, cohesiveness, and collective efficacy. The less complex lightinfantry were studied, rather than more complex heavy infantry. Within each company, onlythe 3 rifle platoons of each company were engaged in the data collection and analysis. The
16
heavy weapons platoon was excluded. Data were gathered at Ft. Benning, Ft. Bragg, Ft.
Campbell, Ft. Drum and Ft. Polk (the JRTC site).
Hypotheses
It was hypothesized that the transformational/transactional leadership components ofthe platoon leader and platoon sergeant would predict independently-gathered judgments ofreadiness in the light infantry platoons. Consistent with Boyd (1988) and Gasper (1992), andthe other completed meta-analyses, an overall hypothesis was that platoon effectiveness inhome station and mission performance at JRTC would correlate positively with platoon leadertransformational and contingent reward leadership, less so with active and passivemanaging-by-exception and negatively with laissez-faire leadership. Home stationeffectiveness, itself, would be expected to predict JRTC performance. (See Siebold, 1992,1994). Platoon and company climate at home station would similarly contribute to subjectiveeffectiveness and observed platoon readiness.
Method and Design of the Study
The method and design built on prior work on home station determinants of squad andplatoon performance (Tremble & Alderks, 1991), and its extension to further predicting theperformance of platoons at a U.S. Army Joint Readiness Training Center (Siebold & Lindsay,1991; Siebold & Kelly, 1988). Similar to Siebold and Lindsay, we examined the extent towhich the aggregated individual, leadership, and group data collected in of platoons couldaccount for the performance of the platoons and its leadership in achieving higherperformance evaluations from observers/controllers (O/Cs) judging platoon missionperformance in joint-readiness exercises. Siebold and Lindsay established for 22 platoonsthat individual squad member motivational satisfaction, pride in the platoon, and cohesionamong the platoon and squad leaders measured shortly before JRTC ranged from .53 to .65in correlation with subsequent joint-readiness of platoon mission performance. Given thesefindings, we hypothesized that platoon and mission performance would be higher, the higherthe transformational leadership of the platoon leaders and platoon sergeants.
Subjective predictors of readiness and effectiveness of the platoon and its leaderswould come from the TMLQ suitably modified for Army considerations.
All of the survey scale items to be used in the current study were first examined andsuitably modified in discussion with our consultants, Lt. General (Ret.) Walter Ulmer, ColonelWilder M. Snodgrass and Colonel (Ret.) Michael Shaler. Lt. Col. Washington and GeneralUlmer each checked at Ft. Benning and Ft. Bragg with focus groups of infantry soldiers forunderstanding. In all, only two items required changes. Next, a first study of 18 platoons wascompleted for preliminary analyses and possible revisions to the data collection. These 18platoons were assessed at home station and again immediately following JRTC. Thesecollections of data were followed by a study of 72 additional platoons excluding the post-JRTC MLQ reassessment since the first 18 platoons were sufficient to provide rate- reratereliabilities and the effects of JRTC on MLQ ratings. Debriefing sessions led by one of the
17
principal investigators and one of the consultants were held for senior officers, cadres, PLs
and PSGs following the completion of JRTC and return to home site.
Summary of Research Activities
Over the course of this 3-year investigation we have worked on developing leadershipsurvey instruments that could be reliably used in military contexts to predict individual andunit performance. As noted earlier, part of our work involved working with military consultantsto revise existing leadership survey measures for this military project. These steps weretaken at the outset of the project to assure the leadership survey measures would be bothreliable and valid. In our second interim report completed in 1998, evidence was provided todemonstrate the reliability and validity of our measures with a sample of 54 platoons. In thisfinal report, we include the results for the surveys used here with a total of 90 platoons, andfor predicting the performance of 72 platoons that went to JRTC. The JRTC criterion data andcorrelations with their predictors are thus based on 72 platoons. However, correlationsamong the home station data are based on 90 platoons.
The First Interim Report described results for the first 18 platoons. The Second InterimReport described results for 72 platoons studied, of which 54 went to JRTC. We brieflysummarize here the methodology that was used to collect data, the total response rates forall measures, the final psychometric results on measures and our findings regarding theprediction of platoon performance at JRTC. A more detailed description of our methodsappears in the Second Interim Report.
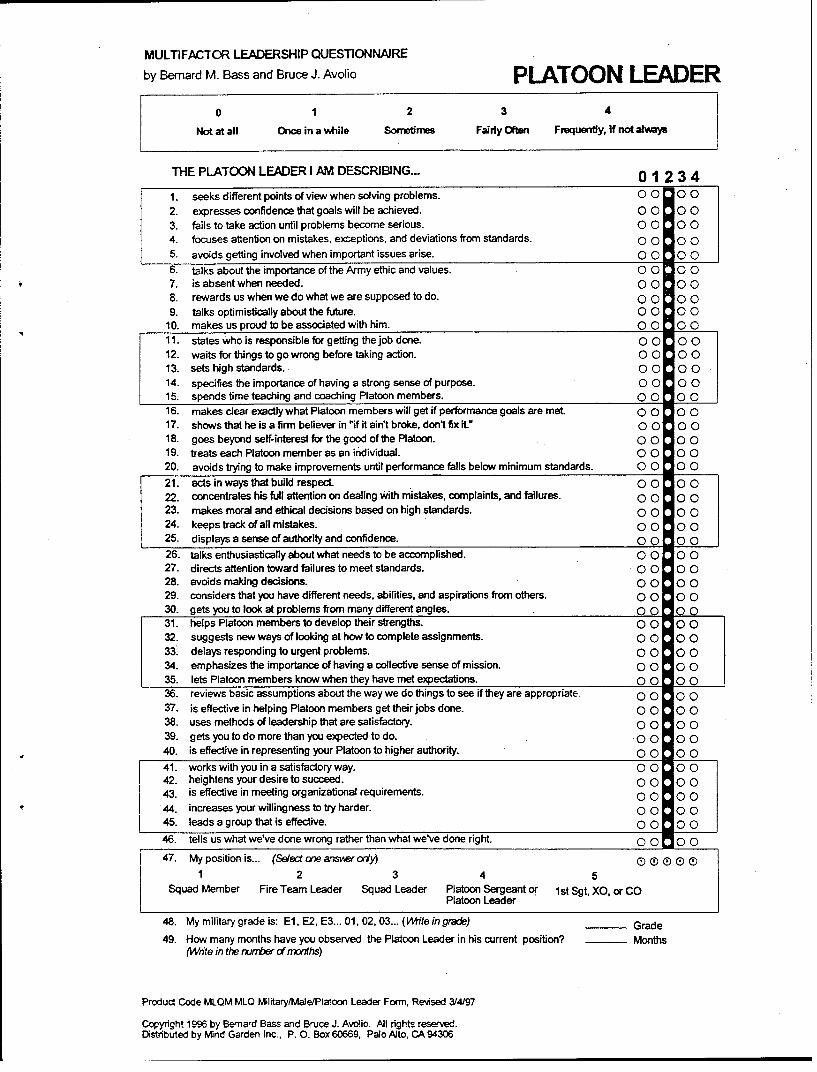
Assessments in home station were obtained approximately one month prior toplatoons attending JRTC/NTC, using a 360 degree MLQ, which were completed by COs,XOs and FSGs, by other PLs and PSGs, and by platoon EMs. In addition to individual MLQratings of the PLs and PSGs by all of the above raters, we also collected ratings focusing onthe collective leadership behavior of the platoons and company in home station. Theseratings were gathered from the same sources described above using the Team MultifactorLeadership Questionnaire (TMLQ).
During the third year, we had the opportunity to complete all of the data collection inhome station and at JRTC. The survey data collected on leadership and our criterionmeasures collected from the Observer/Controllers (O/C) raters at JRTC and NationalTraining Center (NTC) were all entered into data files and verified. Qualitative coding of O/Crater comments on the technical proficiency of the platoon and its behavioral leadership wasalso coded and entered into data files. More detailed descriptions of the qualitative analysisappear in the Methods and Results sections of this final report.
18
METHODS
Sample
We have divided our presentation concerning the procedures used to collectleadership ratings and performance data collection at JRTC. We begin with a discussion ofthe procedures for home station data collection of the MLQ and TMLQ.
Table 1 provides an overall breakdown of raters and units completing the varioussurvey measures. Most of the members of 90 rifle platoons, 90 Platoon Sergeants, 90Platoon Leaders and their 30 company cadres (COs, XOs, FSGs), provided the data for theanalyses linking leadership and performance at JRTC. Table 2 contains the overallrespondent participation rates in the research project. It can be seen in Table 2, ratesranged from 100 percent for COs and FSGs to 86% for platoon members. Most of the non-participating soldiers were on special assignments or on leave.
Participants were surveyed in companies by specially prepared questionnaires. Afterexplaining the purposes of the study and its anonymity and confidentiality, all participantswere given the option of sitting quietly and not participating. Only 10 availed themselves ofthis opportunity.
Table 1
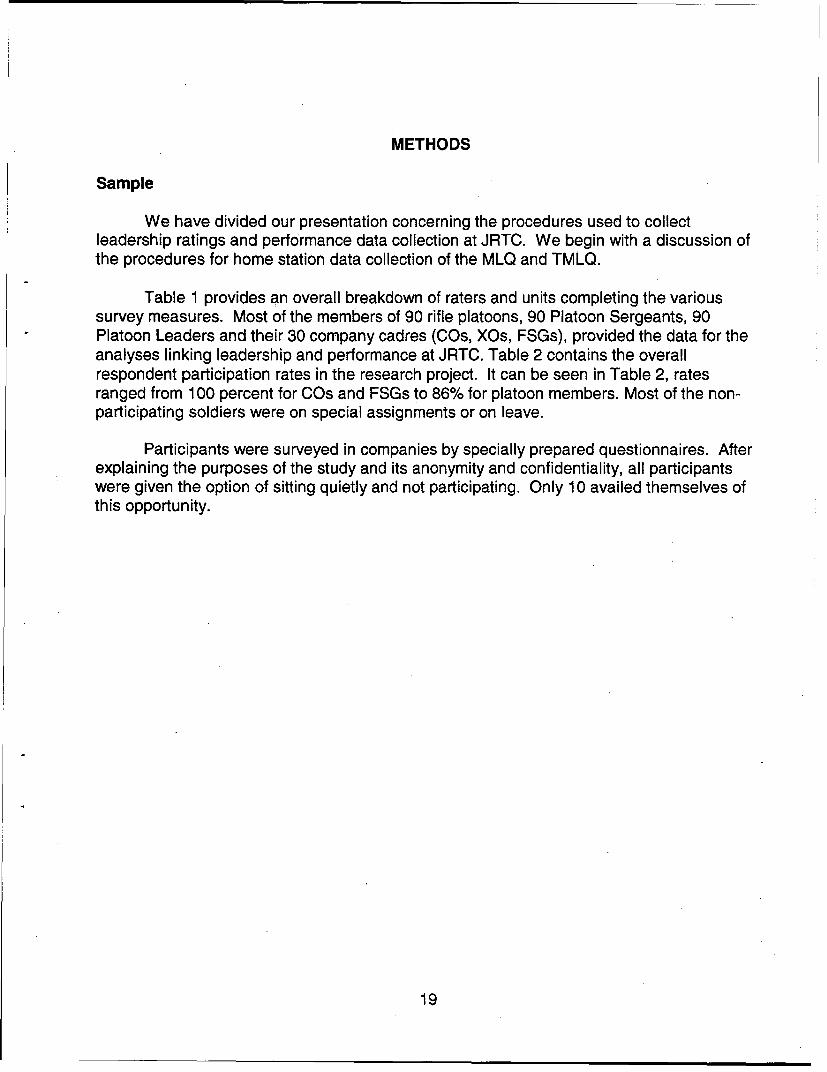
Instruments and Raters
Multifactor Leadership Questionnaire (MLQ)
90 Platoon Leaders90 Platoon Sergeants
Team Multifactor Leadership Questionnaire (TMLQ)
90* Platoons30* Companies
MLQ Raters:
MLQ MLQ MLQ/TMLQ MLQAbove Peer Below Self
CO PL Squad Leaders SelfXO PSG Fire Team Leaders1SG Squad Members __
Number of Observer/Controllers' (O/C's) rating cards reported: 339
*Those numbers were applicable to all the data collected at home station. However, only 72
PLs, 72 PSGs, 72 Platoons and 24 companies were rotated to JRTC which was theappropriated center for light infantry near-combat experience. One brigade was rated to theNational Training Center, Ft. Irwin, which primarily provides near-combat experience forarmor and mechanized forces. Light infantry troops are unlikely to receive much training inthe missions provided by NTC.
20
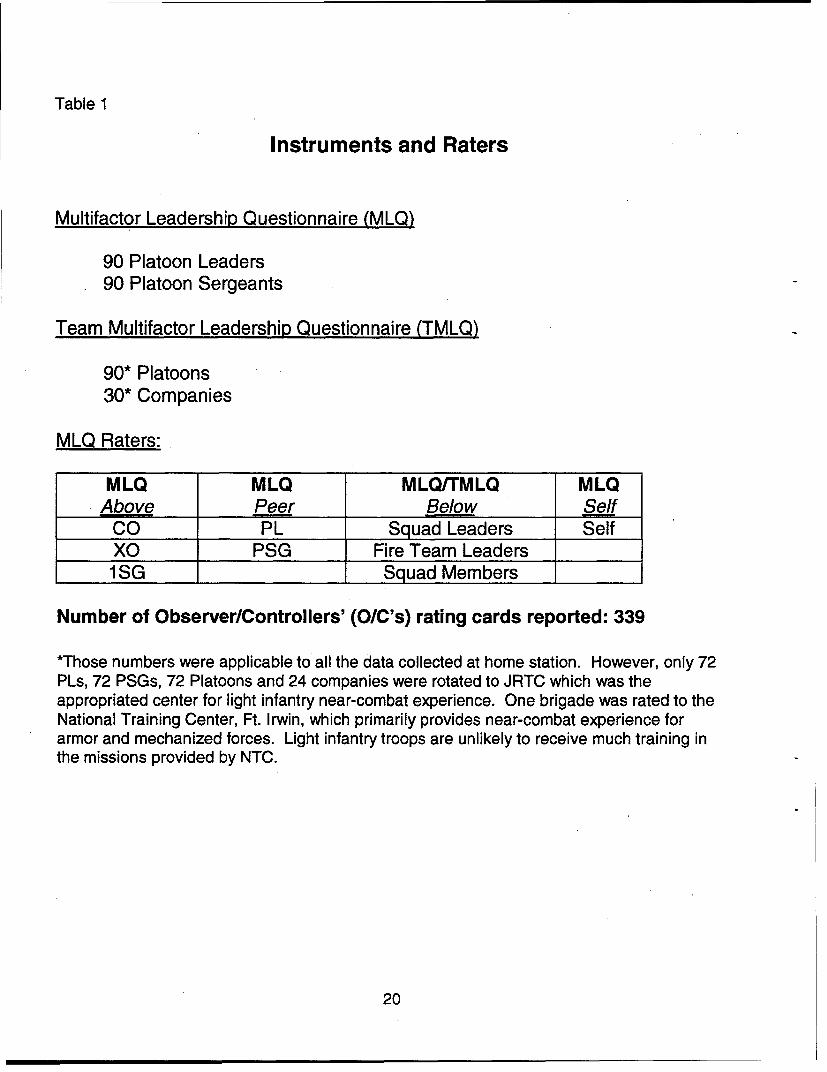
Table 2
Number of Ratings Obtained in Platoon Leader Study
Total number of questionnaires completed by using the military version of the MultifactorLeadership Questionnaire (MLQ):
Using the military version of the Team Multifactor Leadership Questionnaires (TMLQ)
Company 391 18 per companyPlatoon 1221 18 per platoon
Using the Observer/Controller Ratings
JRTC Phase 1 90JRTC Phase 2 125JRTC Phase 3 124
Total 339
Averaqe Response Rates by Class
CO/XO/1 st SGT (Above) 100%Platoon Leader (Peers) 96%Platoon Sgt. (Peers) 94%Platoon Members (Below) 86%
21
MLQ and TMLQ Data Collection
One of the fundamental assumptions for this project was that leadership measured atmultiple levels would provide a more complete evaluation of a platoon's overall leadershippotential and performance in near battle conditions simulated at JRTC. The multiple levelsincluded surveys of the PL's leadership, the PSG's leadership, the collective leadership of allmembers of the platoon, and the leadership characterizing the company culture. Surveymeasures that assess each of these levels and tap into what Bass and Avolio (1994), asdiscussed above, have referred to as the Full Range Leadership Model, already existed butwere modified for the current military setting. Modifications to the survey measures generallyincluded minor rewording of items by the consultant team of content experts, to "fit" within theArmy context. Most items remained unchanged in the survey measures. (See Appendix A forcopies of the surveys).
Also, 107 COs, XOs, and FSGs cadre MLQ reratings were collected at the end of theJRTC missions to establish rate-rerate reliabilities. For the analyses in this report, the CO,XO and FSG, or Company Cadre, were labeled as "Above" the PL and PSG, the PLs andPSGs were labeled "Peers" of the PLs and PSGs and all other EMs were labeled as "Below"the PL and PSG. Table 2 contains the numbers and types of instruments that were collectedat home station.
Control of Same Source Variance and Order Effects. As previously noted, the MLQand TMLQ data were gathered about the PLs and PSGs from all personnel of each of 90platoons, the company leaders (CO), executive officers (XOs) and first sergeants (FSGs) ofthe 30 companies from all brigades. In order to control for order effects, half of therespondents below the PL and PSG received two questionnaires in a folder and weredirected to complete them as presented. Since there were 30 companies of 90 platoons, toeven the numbers of completed surveys, the folders contained three times as many PlatoonTMLQs as Company TMLQs. These surveys were placed in alternating order in the folderswith either PL-MLQ or with PSG-MLQ. These two samples were further subdivided so thatthe folder presented the TMLQ first and the MLQ second or vice versa.
The CO, XO, and FSG were each asked to complete MLQs on all 3 PLs and 3 PSGsof the 3 rifle platoons in their company, again presented in folders to them in alternatingorders. The PLs and PSGs completed self-MLQs and an MLQ on each of their peers in theother two platoons of their company.
Table 2 shows the collection and return rates by company and platoon. We were ableto achieve very high return rates, even though some participants had conflicting assignmentsat the time of data collection, or were on vacation or sick call.
Since each EM platoon member below the PL and PSG completed an MLQ on one orthe other, as well as a TMLQ on either the platoon or the total company, it became possibleto correlate MLQ and TMLQ responses minimizing same source effects or bias. The numberof respondents here for platoon and company was equalized. Anonymity was promised to all
22
respondents and maintained. There was no individual feedback of results provided to the PLor PSG themselves or to their superiors, peers or subordinates.
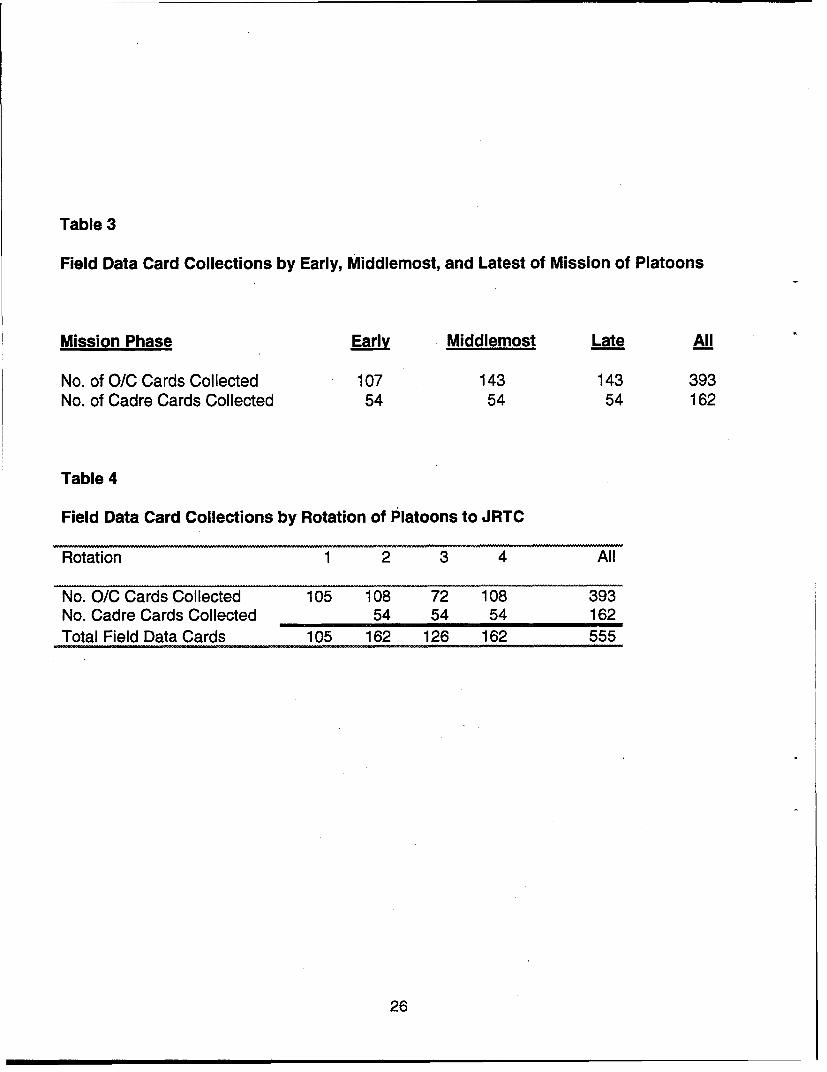
Field Performance Data Collection Process by Observer-Controllers (O/Cs)
Approximately one month after the MLQ/TMLQ had been collected in home station,four of the brigades engaged in tactical mission exercises at the JRTC in Ft. Polk, LA, while afifth brigade participated in exercises at the National Training Center (NTC) at Ft. Irwin, CA.For the five data sets of 18 platoons each, ratings were obtained from two experiencedobserver/controllers (O/Cs) at the respective training centers. COL(R) Shaler at a specialmeeting oriented the 36 O/Cs several days prior to their moving into the field with theirplatoons. At the end of each of three phases, after the first mission, after the middlemostmission and after the last mission, the O/Cs completed the attached performance rating form(see Appendix A).
The O/C ratings, which measured the individual and collective performance of theleaders and platoon participating in 11 simulated combat missions at JRTC, were createdspecifically for this project. Ratings of 20 behavioral items, then refined to 14 items werebased on Army leadership doctrine (FM 22-100). They were developed to assess the PL'sand PSG's individual leadership effectiveness (PLE and PSGE) in meeting the doctrinalstandards. Additionally, two overall scales assessed the platoon's performance of its missiongiven the conditions it faced (A) and relative to other platoon's performance at JRTC (B).Answers were solicited to open-ended questions about the platoon's strong and weak pointsand PL/PSG relationships. The score card used by observer controllers after the first,middlemost and last mission of a platoon at JRTC is shown in Appendix A.
Qualitative analyses were completed of the comments written down by O/C raters onthe JRTC scorecards. The comments included the relationship of the PL and PSG,.behavioral incidents describing the leaders' behavior with followers, and the appropriate useof Army procedures, equipment and technology by the observed platoon. In most cases, twoobserver-controllers accompanied the platoons on their missions. The numbers and types ofO/C ratings are shown in Table 3.
The JRTC results were to serve as the criterion of platoon effectiveness in near-combat conditions, as well as criteria for PL and PSG effectiveness as leaders (PLE andPSGE). Based on analysis of the first set of data (obtained at Fort Campbell), we modifiedthe structure of the O/C rating card to include more qualitative open-ended questions, andeliminated several items that measured PL and PSG leadership performance. There was alsoone less item included that assessed platoon performance. This list of items was trimmedbecause the 20 original PLE items were highly intercorrelated as were the 20 PSGE items.The number of questions assessing overall platoon effectiveness was also reduced from 3 to2 for the same reason. The O/C Platoon Performance forms used in the 2nd, 3rd, 4th and 5thsets for 72 platoons, included two ratings about the platoon's observed effectiveness. Thoseratings were as follows:
23
A = Tactical Mission Accomplishment (considering weather, terrain, support, andopposition.)
B = Overall Performance as compared to other platoons.Every quantitative response was based on five anchors and was scored 0 = lowestanchor; 1 = low anchor; 2 = middle anchor; 3 high anchor; and 4 = highest anchor.
There remained after the trimming of 6 items, 14 items that assessed the behavior ofthe PL and PSG. The items measured each leader's consistency with Army doctrinalprescriptions for effective platoon leadership in combat as judged by our military consultants.
The qualitative questions included sections about the platoon, the PL, the PSG, andthe PL-PSG relationship. For platoon effectiveness, raters were asked to identify theplatoon's 3 strongest and 3 weakest points. Similarly, raters were asked to comment on thePL and PSG strong and weak points, and how well they worked together during the two-weekperiod.
Two 0/Cs were assigned to accompany each of the platoons into the field, and toserve as raters for the 18 platoons going through JRTC. Evaluations of each platoon werecollected from both raters at the end of the first, middlemost and last mission. Generally,these missions included defense, movement to contact, and attack. A total of 489 ratingswere obtained from the 0/Cs. For the first 18 platoons, 107 cadre ratings were obtained.Cadre ratings were used as a confirmatory check of the same field data cards against the0/C ratings.
As described in the First Interim Report, for the first set of 18 platoons, companycadres (CO, XO, FSG) also completed the MLQs of PLs and PSGs a second time at the endof the JRTC rotation. MLQ ratings of the PL and PSG were completed before and afterrotation to assess the rate-rerate reliability of MLQ scores and the agreement of home stationand JRTC results.
0/Cs also provided the platoons with an after-action review at the end of each phase.A debriefing of general results was also provided at home station for selected PL's, PSGs,company cadres and senior officers.
Qualitative Data Collection Overview
The Field Data Cards used to collect objective data on leader and unit performancewere also used to record narrative comments. (See sample Field Data Cards in Appendix A)The card was modified after the first JRTC rotation to include questions on the weaknessesas well as the strengths of the platoon leader, platoon sergeant, and the platoon overall; also,starting with the second rotation, cadre as well as 0/C respondents were included in thesurvey.
24
In Part C of the final version of the Field Data Card, a total of seven fill-in-the-blankitems were provided for respondents to write free-response narrative comments. The firsttwo items asked respondents to describe the three strongest points and the three weakestpoints of the platoon. The next two items asked for comments on the platoon leaders (PL)strong points and weak points. The next two items ask for comments on the platoon sergeant(PSG) strong points, and weak points. The final item asked how well the platoon leader (PL)and the platoon sergeant (PSG) worked together.
Multiple Respondents. Field Data Cards on most platoons were completed by fiverespondents: two observer controllers (O/C) and three cadre members. All respondentsaccompanied each platoon throughout the 14 day JRTC field training exercise. The O/Cswere experienced tactical observers in the grade of Captain (0-3) and Sergeant First Class(E-7) or Master Sergeant (E-8). O/Cs were selected by the Joint Readiness Training Centerfor O/C duties based on their background and ability; all had received training in their dutiesand were instructed on how to complete the Field Data Cards. The O/Cs were observingthese particular platoons for the first time, but all had performed O/C duties in the past. Theirprior experience was recorded on the field data cards and experience ranged from 3 to 30prior rotations. The average number of prior platoon rotations in the experience of theseobserver/controllers was calculated to be 11.94 prior rotations. O/Cs were with the platoonsday and night, and were in a position to observe the behaviors of the PL, PSG, squadleaders, fire team leaders, and enlisted members on a continuous basis for all four JRTCrotations.
Starting with the second JRTC rotation, Field Data Cards were also completed bythree cadre members: the company commander (CO), company executive officer (XO), andcompany first sergeant (FSG). These cadre were also in the field in close proximity to theplatoons--although not always in sight of each platoon-- throughout the exercise; they werealways in radio contact, and usually met the PL and /or the PSG face to face at least once aday. The cadre respondents had the advantage of prior knowledge of the platoon personnel.Cadre provide the observer perspective of a higher Headquarters, responsible for thecommand, control, and continuous supervision of platoon performance throughout theexercise.
Multiple Observations. Starting with the second rotation, a total of nine field datacards were normally collected on each platoon. The two O/Cs with each platoon usuallycompleted three field data cards. The three-company cadre--the company CO, XO and FSGeach submitted one card per platoon. The O/C cards were prepared individually at the end of* each of the three phases during the 14-day JRTC field exercise. The three cadre cards werecompleted independently at the end of the 14-day field exercise. In the third rotation,however, the tactical situation was such there were only two phases and therefore only fourO/C field data cards were collected altogether from the 2 0/Cs.
A total of 555 field data cards were received and considered in our analysescollectively, they cover four JRTC brigade rotations and contain more than 4000 commentson 72 infantry rifle platoons. The breakdowns of field data cards collected, per typerespondent, per JRTC rotation are presented in Tables 3 and 4.
25
Table 3
Field Data Card Collections by Early, Middlemost, and Latest of Mission of Platoons
Mission Phase Early Middlemost Late All
No. of O/C Cards Collected 107 143 143 393No. of Cadre Cards Collected 54 54 54 162
Table 4
Field Data Card Collections by Rotation of Platoons to JRTC
Data Verification and Processing. 0/C and Cadre field data cards were collectedand audited in the field for legibility, completeness, respondent identification, and subjectidentification. Missing or incomplete data were requested / corrected on the spot. Theresponse rate on 0/C and Cadre field data cards was greater than 99%.
Graduate students at the Center transcribed comments for Leadership Studies.Handwriting on the field data cards was generally legible. A separate record was created foreach field data card received; thus the final database contained 555 records. For example,each record, comments were recorded in separate fields as appropriate, so that commentson PL strengths could later be distinguished from comments on PL weaknesses, for example.The same procedures were followed for PSG Strengths, PSG Weaknesses, PlatoonStrengths, Platoon Weaknesses, and PLIPSG cooperation. The resulting database ofcomments was reviewed and edited by researchers familiar with military terminology. Alayout for rendering a printout of comments on each item by platoon was designed.
Methodology Overview. The focus of the analysis was to sort through 555 field datacards containing about 4000 free-response comments and draw appropriate inferences. Thequestions for initial analysis were:
* What were the greatest strengths of the platoon leader, platoon sergeant, andplatoon?"* What were the greatest weaknesses?"* How well did the platoon leader and platoon sergeant work together?
The first step in the analysis process was to organize the responses by platoon and tomanually read through the records. The idea was to search for recurrent key words thatexpressed leadership actions and attributes. A Glossary of the military terms andabbreviations encountered was prepared. (See Appendix B.)
Key Words. Key words were selected by reading through all comments on strengthsand weaknesses, taking notes on the subject of each comment, and looking for recurrenttopics. Most key words to emerge from this process were attributes that soldier/leadersshould be or have such as "discipline," "enthusiasm," "stamina," "persistence. . . ." Other keywords focused on military skills that soldier leaders should know such as "navigation," "troopleading procedures (TLP)," "use of night observation devices (NOD),...." Still others were
- ~process oriented--items a soldier! leader should do or practice such as: "communication,"~"delegation," "coordination," '.supervision. .. ." As key words were selected, a glossary wasprepared defining each term within the military context in which it appeared. Finally, analphabetical index of all words appearing in the comment database was produced andscreened to insure that important key words or concepts were not being overlooked.
Coding. Each key word was reduced to a key word stem, which was tested using asoftware application to count the frequency of occurrence of all forms of the word throughoutthe comment database. The occurrences were verified and spot-checked in the comment
27
database. Spell check routines were used to insure consistent wording and completesearches. "Search and replace" routines were used normalize key word usage in thecomment database. More than a hundred key word stems were explored. Many provedinsignificant or duplicative. Ultimately, 64 key word stems were used for the initial analysisand about half were retained for the final analysis. Comments that had analyticalsignificance but did not contain a key word were coded with the appropriate key word inbrackets: [key word]. Not all comments were coded. Comments without analyticalsignificance were not tabulated; thus, comments such as "None" or "No weaknesses wereobserved" were not counted. Likewise, the comment "platoon leader," platoon sergeant," or"Sergeant X" when listed alone as a strength or weakness was not counted. Individualsmentioned by name were deleted. A Glossary defining all key words based on the militarycontext in which they were used is provided in Appendix B. Finally, the software applicationwas used to search a given data set and to count occurrences of the 64 selected key wordstems; there were 3348 "hits" or occurrences in the comment database as shown in Table 23of the qualitative results section.
The methodology for processing quantitative information from 555 respondentsdescribing performance in 72 infantry platoons is summarized below.
RESULTS
Quantitative Analyses
We began our quantitative analyses for the 90 platoons by trimming data to eliminaterespondents whose ratings reflected a pattern with little or no variance at all in theirresponses to the surveys. Less than 1 % of the respondents were so eliminated from the finaldata set. We then conducted a more in-depth evaluation of both our survey and criterionmeasures. First, we tested the factor structure of the MLQ and TMLQ, and found support fora six- factor model for both the MLQ and the TMLQ, as described below.
Factor Structure of the MVLQ and TMVLQ
Our first step was to confirm the factor structure on the first set of data collected from18 platoons at Fort Campbell. A six-factor model was used as the target model based onresults reported by Avolio, Bass & Jung (1999). We employed confirmatory factor analysis(CFA) using LISREL VIII. CFA is a widely used technique for testing the psychometricproperties of established measurement instruments, in that it tests a pre-specified factorstructure and the goodness of fit of the resulting solution. LISREL compares an impliedcovariance matrix with the observed matrix and estimates parameters based on the fitbetween these matrices. The fit is represented in indices such as the Goodness of Fit IndexGFI, NF12, NCNF, and AGFI. For these indices, values above .9 are indicative of anadequate fit. We also included the Root Mean Squared Residual (RMSR), for whichacceptable fit should be less than .05, the change in Chi-square value associated with testingeach of several comparison models and several other fit indices that take into account, thenumber of degrees of freedom.
28
Results of the CFA for the remaining set of 72 platoons produced consistent supportfor a six-factor model of individual and team leadership. The six factor model for the MLQproduced a GFI=.93, AGFI=.91, RMSR=.004, NFI2=.94 and NCNFI=.94. (A more detailedpresentation of these findings are presented in the Second Interim Report).
The same six factor model was replicated for the TMLQ and produced a GFI=.96,AGFI=.95, RMSR=.004, NFI2=.97, and NCNFI=.97. The two respective six factor modelsgenerated a more parsimonious fit as compared to the alternative models tested and wereused as the framework for subsequent analyses. The six-factor model is as follows: Inspiring,Intellectually Stimulating, Individually Considerate, Contingent Reward, Active Management-by-Exception and Passive-Avoidant Leadership.
MLQ, TMLQ, and OIC Ratings' Descriptive Statistics
After confirming the factor structure for the MLQ and TMLQ surveys, we thenexamined the means, reliabilities, and intercorrelations of the MLQ scales, as well as themeans, reliabilities, and intercorrelations for the JRTC performance data according to pairs ofO/Cs.
Tables 5a and 5b provide descriptive statistics, estimates of internal consistency andintercorrelations among the six MLQ scales for PL and PSG self ratings of leadership. Thecoefficient alpha values were all above .6 for self-ratings of leadership generated by the twofocal leaders. Transformational scales were more highly intercorrelated than theircorrelations with the remaining scales, and were as expected, negatively correlated withpassive avoidant leadership (PA).
Table 5a
MLQ Means, Standard Deviations, Alpha Reliabilities, and Intercorrelations Among SelfRatings of Platoon Leaders
MLQ Factor M SD Alpha 1 2 3 4 5 61. IL 3.19 .54 .852. IS 3.08 .52 .65 .38*3. IC 3.14 .55 .62 .47***
.51 ***4. CR 2.96 .59 .67 .30* .56
.50***5. MA 1.75 .98 .61 .23 .16 .16 .136. PA .58 .48 .68 -.23 -.32* -.32* -.35* .07Note: n 86*p <05**p < .01***p < .001
29
Table 5b
MLQ Means, Standard Deviations, Alpha Reliabilities, and Intercorrelations Among SelfRatings of Platoon Sergeants
MLQ Factor M SD Alpha 1 2 3 4 5 61. IL 3.34 .47 .832. IS 3.04 .54 .60
.51*3. IC 3.25 .54 .65 .51
.60"***4. CR 3.17 .53 .66 .32* .24
.42"***5. MA 1.96 .53 .77 .02 .00 -.03 .076. PA .47 .56 .67 -.26* -.14 -.21 .05 .11Note: n = 85*p <.05
.*p <.01***p <.001
MLO Legend:
IL - Inspirational Leadership CR - Contingent Reward
IS - Intellectual Stimulation MA - Management-by-Exception
IC - Individualized Consideration PA - Passive Leadership
Tables 6a - 6d provide descriptive statistics, estimates of internal consistency andintercorrelations for the six MLQ scales for the combined rater sample. They then aresubdivided by rater source for the PL. Tables 7a - 7d provide a parallel set of results for thePSG for the six MLQ scales for the overall sample, and then subdivided by rater source. Itcan be seen that peers and cadres gave higher MLQ ratings for the transformational scalesand contingent reward and lower ratings for management-by-exception and passiveleadership than did those below the PL and PSG in rank.
30
Table 6aDescriptive Statistics, MLQ Reliabilities, and Intercorrelations Among Multi-source Ratingsof Leadership Scales for Platoon Leader
Overall from All SourcesMLQ Factor M SD Alpha 1 2 3 4 5 61. IL 2.84 .56 .862. IS 2.65 .52 .73 M***
**p < .01 IS - Intellectual Stimulation MA - Management-by-Exception
***p < .001 IC - Individualized Consideration PA - Passive Leadership
The pattern of results for the MLQ ratings of the PL and PSG were generally similarand consistent with results reported by Bass (1998) and Avolio (1999). Specifically, thetransformational and contingent reward scales were highly positively intercorrelated. Thesescales had either lower positive or negative relationships with active management-by-exception and were consistently negatively correlated with passive avoidant leadership.
Estimates of internal consistency for all scales were generally sufficient. According tothe coefficient alphas, peers were somewhat less reliable than those above or below them inrank. For all respondents combined, all but one was .72 or above. The most problematicscale was MA, with an alphas of ranging from .54 to .66 for the different samples of raters inTables 6a through 6d, which only retained two items based on the results of the CFA.
TMLQ Statistics. Shifting up our unit of analyses to the platoon's aggregateleadership using the TMLQ, the pattern of intercorrelations among the transformational andtransactional contingent reward scales were similar to those reported above for the MLQ.However, in contrast with earlier results, those scales were more positively correlated withratings of Active Management-by-Exception. Finally, all four measures of "active" leadershipwere each negatively correlated with the passive avoidant leadership scale.
Tables 8a - 8b provide descriptive statistics, estimates of internal consistency andintercorrelations for the six TMLQ scales. Similar to the MLQ results, we provide abreakdown for the two rater sources: below and peer. All of the scale reliabilities were above.6, except for Active Management-by-Exception (TMA). This scale was also trimmed to twoitems based on results of the CFA, potentially contributing to its lower estimate of internalconsistency.
34
Table 8aDescriptive Statistics, TMLQ Reliabilities, and Intercorrelations Among Leadership Scales
Self versus Others' Ratings. Table 9 provides the correlations between ratings ofself vs. others' subdivided by rater source for PLs and PSGs. A review of Table 9 indicatesthat self and others' ratings for the PLs and PSGs were generally uncorrelated except for thePlatoon Leader's Idealized Influence (Below, .25; Peers, .23; and Above, .30). A general lackof correlation with the self-other source ratings may be due to each source either perceivingdifferent patterns of leadership behavior, the sources being exposed to different stylesand/or, simply due to the fact that raters do not agree on the frequency that leadershipbehaviors were displayed by their PLs and PSGs. These results are consistent with mostother research about self versus others' ratings (Yammarino & Bass, 1990). In general, self-ratings are higher than those from others and don't provide a valid predictor except whenused for their discrepancies from other's ratings. Nonetheless, platoon leaders had asomewhat accurate sense of how their influence was seen by others.
35
Table 9
MLQ Self versus Other Correlations by Rater Source
Note M• The maximum numbers for the different source correlations are as follows:Self & Leader Below N=71; Self & Sergeant Below N=72; Self & Leader Peers N--68;
In Table 1Oa through 1Oc we provide the mean comparison tests for self versus otherratings. The general pattern that emerged was that both platoon leader and sergeantevaluated themselves higher on the transformational and contingent reward scales, while thereverse pattern was observed for ratings of passive-avoidant leadership.
36
Table 10aMLQ Self-Other (Above) Rating Differences For Platoon Leader (PL) and Sergeant(PSG)
Platoon Leader (PL) Platoon Sergeant (PSG)Self Other T-value Self Other T-value
Interrater Agreement and Intercorrelations for JRTC Performance. Results inTable 1 la provide the different agreement rates for the two O/C raters aggregated across the11 missions. As can be observed in Table 1 la, agreement rates for each of the four criterionmeasures were all adequate ranging .73 for B to .92 for PLE.
Table 11aLevel of Interrater Agreement for OC Ratings Across All Missions for JRTC Performance
Level of AgreementPLE .92PSGE .88A .78B .73
Note: N=72 platoons
JRTC Legend:
A: Taking into account the weather, terrain, support & opposition, how well did this platoon accomplish its tactical mission
B: Overall assessment - compared to similar platoons, this platoon performed overall in the bottom 1/5,
next lower, middle 1/5, next higher or top 1/5.
Perf.LD14: How frequently the Platoon Leader contributed to the platoon's effectiveness according to 14 criteria.
Perf.SG14: How frequently the Platoon Sergeant contributed to the platoon's effectiveness according to 14 criteria.
Results in Table 11 b provide the intercorrelations among the four criterion measuresfor O/C ratings. As expected, all of the performance measures were moderately andpositively intercorrelated. The values in parenthesis are the internal consistency value foreach performance rating scale. Both multi-item scales had relatively high values of internalconsistency for PL and PSG ratings. Results presented in Table 11 b indicated that each ofthe four dimensions were measuring different aspects of performance at JRTC.
Table 11 bIntercorrelations between O/C Performance Indices
1 2 3 4 5AB .70PLE .55 .67 (.94)PSGE .44 .51 .51 (.95)Note: N=72 platoons; All correlations were significant at p <.001.Values in parentheses are coefficient alphas for each scale.
JRTC Le-gend:A: Taking into account the weather, terrain, support & opposition, how well did this platoon accomplish its tactical mission
B: Overall assessment -compared to similar platoons, this platoon performed overall in the bottom 1/5, next lower, middle1/5, next higher or top 1/5.Perf.LD14: How frequently the Platoon Leader contributed to the platoon's effectiveness according to 14 criteria
Perf.SG14: How frequently the Platoon Sergeant contributed to the platoon's effectiveness according to 14 criteria.
38
MLQ as Predictor of Home Station Platoon TMLQ Rated Outcomes
We first tested whether the TMLQ ratings could be appropriately aggregated to theplatoon level. Specifically, we examined whether the platoon was the appropriate level ofanalysis using procedures recommended by James, Demaree, and Wolf (1984) called Rwg.Similar to an intraclass correlation, values in excess of .7 indicate it is appropriate toaggregate ratings to the group level, and that there is more variance between the 90 platoonsthan within the 90 platoons. We present in Table 12 a summary of the results for 90 platoonsbeing rated on the TMLQ. The pattern of results indicated that aggregating to the group levelwas generally warranted. For all of the leadership scales, nearly 70% of the Rwg valueswere above the minimum cut off of .7, and were above 90% for ratings of Inspiring andContingent Reward Leadership.
Table 12
Estimates of Within Group Agreement (Rwg) for the TMLQ Survey
Tables 13a and 13b provide the intercorrelations between the MLQ PL and PSGleadership scales and TMLQ outcome measures from a different source of raters from thesame organizational level collected in home station. The pattern of correlations for both PLand PSG ratings from below provided strong support for Bass and Avolio's full range modelof leadership. Specifically, transformational and contingent reward leadership of raters frombelow were each positively correlated with five outcomes measures, while ActiveManagement-by-Exception (MA) was uncorrelated, and passive avoidant leadership (PA)was negatively correlated with each of the five outcome measures of team extra effort (EE),team potency (TPOT), team cohesion (TCOH), team effectiveness (TEFF), and teamsatisfaction (SA). Correlations were non-significant if obtained from peers or superiors of theteam's PLs and PSGs.
39
Table 13a
Correlation Between MLQ Ratings of Platoon Leader and Team ClimateBased on Different Sources at Home Station
TMLQ Legend:TEE: Team Extra EffortTPOT: Team PotencyTCOH: Team CohesionTEFF: Team EffectivenessTSAT: Team Satisfaction
41
In sum, for both platoon leaders and sergeants the ratings from below provided strongsupport for Bass and Avolio's Full Range model of leadership. Specifically, thetransformational and contingent reward leadership scales were all positively correlated withthe five outcome scales, while passive avoidant leadership was negatively correlated.Management by exception was either not correlated with the outcome ratings or negativelycorrelated, as observed with the below ratings of sergeants.
Table 14a summarizes results linking Platoon Leader MLQ ratings collected in homestation with JRTC performance.
An inspection of the correlations in Table 14a, provided support for the main premiseof the current study. Although the magnitude of relationships varied by source,transformational and contingent reward leadership was each positively correlated with JRTCunit and individual-level leadership performance. Active Management-by-Exception wasgenerally uncorrelated with JRTC performance, while Passive Avoidant Leadership wasnegatively correlated with each of the four JRTC performance measures.
The correlations presented in Table 14a were subdivided by source of MLQ such aspeers. We explored different "below" ratings and uncovered some variations in the observedrelationships. For example, in Table 14a, we provide in parentheses, ratings from fire teamleaders with the four JRTC measures derived from the O/C's appraisals. In many instances,the validity coefficients for ratings generated by fire team leaders were higher than theaggregate pool of ratings from "below" for transformational and contingent reward leadership.
In Table 14b, we provide the correlational results partitioning the ratings category intothree sources: CO, XO, and FSG. The correlation coefficients presented in Table 14b for theplatoon leader were generally higher if the source of ratings were the XO and FSG. Thispattern was particularly evident for the correlations between IS, IC, and the JRTC overall.measures of performance (A and B outcomes).
42
Table 14a
Correlations by Source between Platoon Leader MLQ Ratings Platoon Performance and EffectiveLeadership in JRTC
JRTC Criterion MeasuresMLQ Factor Source A B PLE PSGE
JRTC LegendA: Taking into account the weather, terrain, support & opposition, how well did this platoon accomplishits tactical mission?B: Overall assessment - compared to similar platoons, this platoon performed overallin the bottom 1/5, next lower, middle 1/5, next higher or top 1/5.PLE: How frequently the Platoon Leader contributed to the platoon's effectiveness according to 14 criteria.PSGE: How frequently the Platoon Sergeant contributed to the platoon's effectiveness according to 14 criteria.
43
Table 14b
Correlations by Source between Platoon Leader MLQ Ratings, PlatoonPerformance and Effective Leadership in JRTC
JRTC Criterion MeasuresMLQ Factor Source A B PLE PSGE
JRTC LegendA: Taking into account the weather, terrain, support & opposition, how well did this
platoon accomplish its tactical mission?B: Overall assessment - compared to similar platoons, this platoon performed overallin the bottom 1/5, next lower, middle 1/5, next higher or top 1/5.PLE: How frequently the Platoon Leader contributed to the platoon's effectiveness
according to 14 criteria.PSGE: How frequently the Platoon Sergeant contributed to the platoon's effectiveness
according to 14 criteria.
44
Table 15a provides results for (PSG) MLQ ratings by source correlated with the fourJRTC measures. Again, there was evidence provided to support the predictions of the fullrange leadership model of leadership. Correlations with the O/C raters' evaluation of platoonsergeant performance in JRTC provided the strongest evidence in support of the model.
In Table 15b we provide the correlational results for the PSG from MLQ ratings fromthe CO, XO and FSG, three above sources, paralleling the results presented for predictingPSGE from the platoon leader. In general, the validity coefficients for IL, IS, IC and CR werehigher when broken out by the different sources and particularly from the two positions, COand XO.
45
Table 15a
Correlation between Ratings by Source of Platoon Sergeant MLQ Ratings, andPlatoon Performance and Effective Leadership at JRTC
JRTC Criterion MeasuresMLQ Factor Source A B PLE PSGE
JRTC Legend:A: Taking into account the weather, terrain, support & opposition, how well did this platoonaccomplish its tactical mission?B: Overall assessment - compared to similar platoons, this platoon performed overall
in the bottom 1/5, next lower, middle 1/5, next higher or top 1/5.PLE: How frequently the Platoon Leader contributed to the platoon's effectiveness according to 14
criteria.PSGE: How frequently the Platoon Sergeant contributed to the platoon's effectiveness according
to 14 criteria.
46
Table 15b
Correlations by Source between Platoon Sergeant MLQ Ratings, PlatoonPerformance and Effective Leadership at JRTC
JRTC Criterion MeasuresMLO Factor Source A B PLE PSGE
CO -.02 .10 .03 .34*IL XO .09 .22 .02 .42**
FSG -.02 .07 -.01 .29*CO .07 .17 .05 .31*
IS XO .11 .20 -.05 .39**FSG .01 .07 -.09 .30*CO .09 .16 .03 .32*
IC XO .10 .29* .06 .39**FSG -.08 -.00 -.11 .21CO .07 .20 .04 .31*
JRTC Legend:A: Taking into account the weather, terrain, support & opposition, how well did this platoonaccomplish its tactical mission?B: Overall assessment - compared to similar platoons, this platoon performed overallin the bottom 1/5, next lower, middle 1/5, next higher or top 1/5.PLE: How frequently the Platoon Leader contributed to the platoon's effectiveness according to
14 criteria.PSGE: How frequently the Platoon Sergeant contributed to the platoon's effectiveness
according to 14 criteria.
47
We examined the relationships between the TMLQ ratings provided by two sources(below and peer) in Tables 16a and 16b, for both the leadership and outcome scales. Therewere no significant relationships obtained with the four JRTC performance measures. Thecorrelations with the TMLQ outcome scales produced several significant relationshipsbetween ratings of platoon cohesion and satisfaction by peers with the B outcome andratings of platoon leader effectiveness (PLE). The best predictors of JRTC performancewere peer ratings of platoon cohesiveness and satisfaction, which generated positivecorrelations in the range of r=.15 to .45. However, the overall pattern of results did notsupport the full range model of leadership.
Table 16aCorrelation Between TMLQ Ratings at Home Station, and Platoon Performanceand Effective Leadership at JRTC
JRTC Criterion MeasuresTMLQ Factor Source A B PLE PSG
JRTC Legend:A: Taking into account the weather, terrain, support & opposition, how well did this platoon accomplish
its tactical mission?B: Overall assessment - compared to similar platoons, this platoon performed overall
in the bottom 1/5, next lower, middle 1/5, next higher or top 1/5.PLE: How frequently the Platoon Leader contributed to the platoon's effectiveness according to 14 criteria.PSGE: How frequently the Platoon Sergeant contributed to the platoon's effectiveness according to 14 criteria.
48
Table 16b
Correlation between TMLQ Outcome Ratings from "Below" and "Peer" at HomeStation, and Platoon Performance and Effective Leadership at JRTC
JRTC Criterion MeasuresTMLQ Factor Source A B PLE PSGE
A: Taking into account the weather, terrain, support & opposition, how well did this platoon accomplish
its tactical mission?
B: Overall assessment - compared to similar platoons, this platoon performed overall
in the bottom 1/5, next lower, middle 1/5, next higher or top 1/5.
PLE: How frequently the Platoon Leader contributed to the platoon's effectiveness according to 14 criteria
PSGE: How frequently the Platoon Sergeant contributed to the platoon's effectiveness according to 14 criteria-
Effects of Tenure
To explore these findings further, we examined whether the results would differ forsquad leaders in the platoon who were in the top and bottom half in terms of tenure in theirplatoon using a median split on tenure. Squad leaders are pivotal leaders in the platoon andmay have a unique view of the platoon's collective leadership as they are in a lower rankedleadership position. The squad leaders were sorted into high and low tenure in service by amedian split.
49
Results presented in Table 17 indicated there were generally higher positivecorrelations between the TMLQ leadership ratings for the platoons and JRTC performancewhere more tenured squad leaders were higher in tenure in the platoon. Specifically, for theB criterion measure and PSG leadership effectiveness ratings of performance at JRTC, thetransformational and contingent reward TMLQ scales were each more positively correlatedwith JRTC performance, for platoons with higher tenured squad leaders. Whereas, therewere generally no differences in results for squad members ratings of their platoons on theTMLQ and their relationships to JRTC performance for higher versus lowertenuredmembers.
Moving to Table 18, there was some additional evidence provided that higher tenuredsquad leader ratings on several outcome measures were more positively correlated with theB criterion measure and PSG leadership. Indeed for potency, the relationship with PSGeffectiveness went from a -.31 to a positive .30 for low.to high tenured squad leaders.However, for the most part, the results concerning the TMLQ did not provide consistentevidence linking platoon-level leadership to JRTC performance.
50
Table 17Correlation between TMLQ Ratings by Tenure, Rank and JRTC Platoon Performanceand Leadership Effectiveness at JRTC
JRTC Criterion MeasuresTMLQ Factor Source A B PLE PSG
IL High Tenure Squad Member -.04 -.10 -.15 -.14Low Tenure Squad Member .11 .14 .05 .21High Tenure Squad Leader .14 .34* .11 .30*Low Tenure Squad Leader -.25 -.19 -.12 .13
IS High Tenure Squad Member .03 -.07 -.04 -.02Low Tenure Squad Member .10 .20 .02 .25*High Tenure Squad Leader .04 .34* .11 .40*Low Tenure Squad Leader -.16 -.12 -.17 .20
IC High Tenure Squad Member -.10 -.21 -.13 -.04Low Tenure Squad Member .11 .14 .03 .13High Tenure Squad Leader .05 .18 -.03 .29Low Tenure Squad Leader -.12 -.10 -.11 .10
CR High Tenure Squad Member -.05 -.13 -.14 -.08Low Tenure Squad Member .05 .08 .05 .19High Tenure Squad Leader .10 .27 .00 .41Low Tenure Squad Leader -.04 -.11 -.14 .20
MA High Tenure Squad Member .11 .00 .02 .12Low Tenure Squad Member -.15 -.21 -.15 -.05High Tenure Squad Leader -.04 .02 .02 .15Low Tenure Squad Leader -.18 .03 -.06 .16
PL High Tenure Squad Member -.02 .08 .12 .01Low Tenure Squad Member -.04 -.13 -.07 -.14High Tenure Squad Leader .12 -.11 .13 -.04
,Low Tenure Squad Leader .09 -.03 .18 -.12Note: High and Low tenured squad leaders/members were based on a median split on tenurein the platoon*p < .05**p <.01
JRTC Legend:A: Taking into account the weather, terrain, support & opposition, how well did this platoon
accomplish its tactical mission?B: Overall assessment - compared to similar platoons, this platoon performed
overall in the bottom 1/5, next lower, middle 1/5, next higher or top 1/5.PLE: How frequently the Platoon Leader contributed to the platoon's effectiveness according
to 14 criteria.PSGE: How frequently the Platoon Sergeant contributed to the platoon's effectiveness
according to 14 criteria.
51
Table 18
Correlation between TMLQ Outcome Ratings at Home Station and JRTCPlatoon Performance and Leadership Effectiveness
JRTC Criterion MeasuresTMLQ Factor Source A B PLE PSGE
TEE High Tenure Squad Member -.18 -.25* -.15 -.01Low Tenure Squad Member .01 .10 -.06 .21High Tenure Squad Leader -.09 .16 -.02 .27Low Tenure Squad Leader -.17 -.09 -.20 .13
TPOT High Tenure Squad Member -.10 -.12 -.14 -.05Low Tenure Squad Member .14 .19 .07 .23High Tenure Squad Leader .07 .15 -.02 .30*Low Tenure Squad Leader -.05 -.03 -.12 -.31"
TCOH High Tenure Squad Member .05 -.01 .02 .07Low Tenure Squad Member .05 .10 .06 .13High Tenure Squad Leader .23 .28 .14 .23Low Tenure Squad Leader -.02 .02 -.10 .22
TEFF High Tenure Squad Member -.84 -.08 -.05 -.09Low Tenure Squad Member .10 .14 .08 .03High Tenure Squad Leader .13 .20 .12 .28Low Tenure Squad Leader -.09 .01 -.08 .11
TSA High Tenure Squad Member .12 .00 -.06 -.11Low Tenure Squad Member .15 .16 .06 .10High Tenure Squad Leader .09 .24 .07 .09
,Low Tenure Squad Leader .05 .10 -.02 -.01Note: (n = 68 for Squad Member High; n = 71 for Squad Member Low; n = 43 Squad LeaderHigh; n = 45 for Squad Leader Low) High and Low tenured squad leaders'members werebased on a median split on tenure in the platoon*p < .05**p <. 0 1
TMLQ Legend:TEE: Team Extra EffortTPOT: Team PotencyTCOH: Team CohesionTEFF: Team EffectivenessTSAT: Team Satisfaction
JRTC Criterion LegendA: Taking into account the weather, terrain, support & opposition, how well did this platoon
accomplish its tactical mission?B: Overall assessment - compared to similar platoons, this platoon performed overall
in the bottom 1/5, next lower, middle 1/5, next higher or top 1/5.PLE: How frequently the Platoon Leader contributed to the platoon's effectiveness
according to 14 criteria.PSGE: How frequently the Platoon Sergeant contributed to the platoon's effectiveness
according to 14 criteria.
52
Trends in JRTC Performance
JRTC performance was based on evaluations of three sets of missions. To determinewhether there were any significant changes in aggregate performance, we ran separate oneway ANOVAs for each of the four performance measures. Graphical results of the means foreach performance indice across the three sets of missions are presented in Figures la, lband ic.
The only significant difference in mean ratings of performance, which trended upwardfor the three sets of missions, was with the A performance index (F (2,372) = 4.74, P < .01).Based on post hoc Scheffe tests, the difference appeared to be due to an increase inperformance from the second and third sets of missions. The upward trends suggest thatAARs by O/Cs at the end of a mission may have resulted in either improved performance ormore lenient judgements/ratings.
Figure 1 a - Trends in JRTC Platoon Performance and Leaders'Effectiveness Over 3 Mission Phases
Note:A 1.83 1.97 2.16* Mission Set 2 vs. 3 (significant at p<.05)B 2.81 3.01 3.07PLE 2.72 2.73 2.8
Legend for JRTC Questions:
Q1 - Persisted in dealing with difficult challengesQ2 - Kept focused on accomplishing the missionQ3 - Shared knowledge of the situationQ4 - Established and maintained appropriate priorities.Q5 - Contributed to cohesiveness and teamworkQ6 - Maintained high performance standards for completing tasks07 - Was receptive to new information and ideas
54
Figure Ic - Trends in JRTC Performance Over 3 Mission Phases
Note:A 1.83 1.97 2.16* Mission Set 2 vs. 3 (significant at p<.05)B 2.81 3.01 3.07PLE 2.72 2.73 2.8
Legend for JRTC Questions
Q8 - Used AARs and debrief ings consturctivelyQ9 - Set an example by his behaviorQ10 - Communicated clearly and preciselyQ11 - Coordinated effectively internally and externallyQ12 - Raised morale and enthusiasmQ13 - Took responsibility for his actionsQ14 - Recognized outstanding performance
55
Multiple Regressions
Table 19 provides a summary of the significant regression results, for each ratersource, predicting the four JRTC outcome measures. Due to the relatively small sample sizefor platoons (n = 72), we collapsed the three transformational scales into one scale tomaximize our degrees of freedom in these analyses. Also, we have reported in earlierresearch, which tested the factor structure of the MLQ, that each of the transformationalscales loaded on a higher order latent construct of transformational leadership see (Avolio etal., 1999). Thus to reduce problems with multi-collinearity, the three transformational scaleswere aggregated for these regression analyses.
Table 19
Summary of Regression Results for PL and PSG Transformational Ratings PredictingJRTC Performance with MLQ Leadership Ratings Collected at Home Station
LeaendTL: MLQ Transformational LeadershipA: Taking into account the weather, terrain, support & opposition, how well did this platoon accomplish
its tactical mission?B: Overall assessment - compared to similar platoons, this platoon performed overall
in the bottom 1/5, next lower, middle 1/5, next higher or top 1/5.PLE: How frequently the Platoon Leader contributed to the platoon's effectiveness according to 14 criteria.PSGE: How frequently the Platoon Sergeant contributed to the platoon's effectiveness according to 14
criteria.
The regression results paralleled the correlational results presented earlier. Indeed,the 4 main predictors of JRTC performance were the transformational leadership ratings ofthe PSG and PL, as well as the passive avoidant scale for each of these respective leadersin the platoon. It is interesting to note that the passive avoidant leadership style of the
56
platoon leader and sergeant had as great a negative relationship in predicting performanceat JRTC, as the transformational leadership scale had in terms of a positive relationship withperformance. In terms of the two overall measures of platoon performance, both peer andabove ratings were the strongest predictors with the respective JRTC outcome measures.
Regression analyses were then run using self and other transformational ratings (bysource) to predict the four JRTC outcome measures. A summary of the significant results ispresented in Table 20. Overall, self-ratings only marginally predicted JRTC performance ascompared to below, peer and above ratings on the MLQ for PLs and PSGs. Moreover, inseveral instances, the beta values were opposite to those generated with 'other' ratings,indicating that higher self-ratings by the platoon leaders correlated with lower JRTCperformance.
Table 20
Summary of Regression Results for Self/Other PL and PSG Transformational Ratings PredictingJRTC Performance and Leadership Effectiveness
Below Peer Above
Self Other Self Other Self Otherr2 Beta r2 Beta r2 Beta
(.13)b (-.14) (.34**)Note: n=72a: p <.08, * p< .05, ** p< .01b: Values in parentheses are for PSG ratings
JRTC LegendA: Taking into account the weather, terrain, support & opposition, how well did this platoon accomplish
its tactical mission?B: Overall assessment - compared to similar platoons, this platoon performed overall
in the bottom 1/5, next lower, middle 1/5, next higher or top 1/5.PLE: How frequently the Platoon Leader contributed to the platoon's effectiveness according to 14 criteria.PSGE: How frequently the Platoon Sergeant contributed to the platoon's effectiveness according to 14
criteria.
Company Culture
For every three soldiers in each company, the TMLQ survey rated was based on theirrespective platoon. A fourth soldier used the TMLQ to rate his company's leadership culture.The company's home station team leadership and home station outcome assessments of theTMLQ were seen to be proxy measures of the company's culture and climate. Analyseswere run examining the relationship between company culture and JRTC performance.Summaries of these analyses appear in Table 22. Generally, all of the leadership culture
57
scales had sufficient levels of reliability except MA. Problems with the MA scale have beenconsistent across all three levels of measurement.
The company culture results showed there was some positive relationships betweentransformational, contingent reward and an active management by exception culture in homestation with the (A) overall measure of JRTC performance. Similar to earlier findings, apassive-avoidant culture in home station negatively predicted overall platoon performance. Aparallel, but somewhat weaker pattern emerged for the (B) measure of overall platoonperformance.
In sum, the company leadership culture survey showed some promise for predictingplatoon outcomes in JRTC. Further exploration and refinements to the survey are needed.
Table 21Correlation between Company TMLQ and JRTC Platoon Performance
JRTC Legend:A: Taking into account the weather, terrain, support & opposition, how well did this platoon
accomplish its tactical mission?B: Overall assessment - compared to similar platoons, this platoon performed overall in
the bottom 1/5, next lower, middle 1/5, next higher or top 1/5.PLE: How frequently the Platoon Leader contributed to the platoon's effectiveness
according to 14 criteria.PSGE: How frequently the Platoon Sergeant contributed to the platoon's effectiveness
according to 14 criteria.
58
Unit Leadership Strength as a Predictor of JRTC Performance
Chan (1998) recently suggested that estimates of within group agreement onmeasures of climate could be interpreted as assessing 'climate strength' in a unit. Chanargued that the mean and the variance could both be used on measures such as climate topredict performance. In the current context, we examined the Rwg values on the TMLQ, as ameasure of unit leadership strength. For each platoon, we calculated an Rwg value for thesix respective TMLQ scales. We then regressed each of the 4 JRTC measures on the sixRwg scores for each of the 72 platoons.
Examining the overall sample, we found the regression analysis containing all sixscales was marginally significant in predicting the B criterion measure from JRTC (R2 = 16, p.< .07). The two TMLQ scales significantly contributed to the prediction of performance were:IS Rwg B = .32 (p = .05) and MA Rwg B = .25 (p = .05). These preliminary results indicatedthat the variance in platoon member perceptions of their own collective leadership helpedpredict one overall measure of JRTC performance.
We next ran separate regressions entering on the first step of each regressionanalysis the aggregate mean measure of transformational leadership followed by itsaggregate Rwg value for each platoon. The dependent variable for each regression analysiswas one of the four JRTC performance measures. Similar to the correlational resultspresented for the TMLQ earlier, the above transformational mean scores did not predictJRTC performance entered on the first step in the regression analysis. However the Rwgvalue for transformational leadership entered on the second step, predicted the followingthree measures: For (A) TF Rwg R2 = .14, p < .01, B = .40, p <.01; for (B) TF Rwg R2 = .07, p<.08, B = .28, p < .03; and for (PSGE) TF Rwg R2 = .09, p < .05, B = .30, p < .05.
In sum, the level of agreement in the platoon member's perception of its collectiveleadership style was a unique predictor of JRTC performance. Indeed, when we created atotal TMLQ leadership scale Rwg, using each scale score as an item, we found an r = .25, p< .05, for the overall measure of agreement with the A measure of overall platoonperformance.
59
Table 22Summary of Regression Results for TMLQ Rwg Values Predicting JRTC Performance
Independent Overall Squad Member Squad LeaderR;! Rz Rz
A .14* .09 .03B .11+ .06 .07PL Leadership Effectiveness .06 .04 .06PSG Leadership Effectiveness .11+ .05 .06Note: n = 72
p < .05p< .10
JRTC Legend:
A: Taldng into account the weather, terrain, support & opposition, how well did this platoon accomplish
its tactical mission?
B: Overall assessment - compared to similar platoons, this platoon performed overall
in the bottom 1/5, next lower, middle 1/5, next higher or top 1/5.
PLE: How frequently the Platoon Leader contributed to the platoon's effectiveness according to 14 criteria.
PSGE: How frequently the Platoon Sergeant contributed to the platoon's effectiveness according to 14 criteria
Exploratory Analyses
Next, we examined how the overall transformational ratings for platoon leader,sergeant and team transformational ratings blocked together, predicted each of the fourJRTC performance outcomes. Results in indicated that the combined ratings accounted for11% of the variance in JRTC overall performance (A) and on up to 24% with respect to theplatoon leader's performance at JRTC. Generally, the effects were largely attributable to theplatoon leader's transformational leadership.
TEXT ANALYSIS OF OBSERVERICONTROLLER (O/C) AND CADRE COMMENTS ONPLATOON LEADER, PLATOON SERGEANT, AND PLATOON PERFORMANCE AT NTC
In addition to testing the quantitative performance data, we also examined qualitativeresults, using trained research assistants to code data concerning the quality of the PL-PSGrelationship. Specifically, each rater went through training on the transformational leadershipcomponents, and then was asked to independently evaluate the comments from the O/Craters regarding the question that refers to the quality of the relationship and observedinteractions between the PL and PSG. The qualitative codings were repeated for each of theJRTC data sets. The interrater reliabilities were all above .88.
Dr. Avolio, Dr. Berson and COL (R) Snodgrass went through all of the qualitative datafrom the O/C raters to identify and evaluate the strong and weak points for the platoons, PL,
60
and PSG. Col. Snodgrass also developed a comprehensive list of categories representingboth interpersonal aspects of performance (e.g., teamwork) and technical military expertise(e.g., navigation) that could impact on platoon performance. Each platoon was scored onthese respective categories. Additional categories were also created to examine thetechnical proficiency of these platoons, and were used to code additional comments made bythe 0/C raters during JRTC. All of these categories are described in detail below.
This section presents findings and conclusions from 0/C and cadre comments.Comments focused on strengths and weaknesses of the platoon leader, platoon sergeant,and the platoon as revealed during the 14 day field training exercise at the JRTC.
Frequency and Significance
Narrative comments cannot be readily "averaged." Each narrative comment of anylength is unique and potentially of significance to interpreting platoon performance. Yet,many comments are common and their meanings are the same, and generalizations are bothpossible and appropriate. In such cases, the more frequently a key word appears in thecomment database, the more relevance it may have to how the raters judged performance atJRTC.
In Table 23, it can be seen that "experience" was the most frequently occurring keyword in the comment database. The high occurrence bears further consideration, later inthis section, in terms of differentiating level of experience within a platoon and general overallmilitary experience.
It should be noted that the software used to tabulate key words, by design, would notcount repeated occurrences of the same key word within the same comment. In any givencomment, only the first occurrence of each key word was tabulated. Where there were two ormore key words in a single comment, the software used will pick up all such uniqueoccurrences. (The average rate of occurrence is 1.31 key words per comment in an uncodeddata set, and 1.73 key words per comment for coded data sets.) The software screening asingle comment such as, "The leadership was poor because the leadership lackedexperience" would return two findings: one for the key word "leadership" (even though"leadership" appeared twice) and one for the key word "experience."
At the opposite end of the spectrum shown in Table 23, the least frequently occurringtopic is "POW processing", which occurs in less than 0.12% of all key word hits. Its place atthe very end of this list is largely a function of the cut-off point for list preparation.'
Even small numbers can be of potential significance. "Honesty'for example, which is not even listed in Table 23, is mentioned only twice in thedatabase. "Integrity," "truthfulness," and "candor" are each mentioned only once. It may be reassuring to note that these four occurrences allappear as strengths, but one might ask: Why so few "hits" on such key concepts? It is probably because core values for the Army such as"integrity' and "candor,' etc. are taken for granted as being present, and in any case are so sensitive in the negative that most observers arereluctant to identify those subjects. There was one comment in which a PSG was called "disloyal" because he did not make appropriatesuggestions to his platoon leader --a seemingly exaggerated indictment-- and one poignant comment on integrity: "he chose the easier wrong overthe more difficult right."
61
Regarding frequency and significance, the question is where should the line be drawnto establish a threshold for analytical purposes and to draw conclusions? In this case, wedecided to focus on individual key word findings, which numbered at least one percent of allkey word findings. Those attributes occurring less frequently (about 25% of the initialfindings) are not considered significant for the analytical purposes of this report, though allthe findings have face validity and their relative infrequency may be of future interest tocertain military audiences, including the Joint Readiness Training Center.
Attributing comments as Strengths or Weaknesses by Subject
In every case, the respondent's original comments were categorized by subjects or thetarget of evaluation (PL, PSG, or platoon overall) and were further categorized as either astrength or a weakness. The software tabulates across all six categories: PL strengths, PLweaknesses, PSG strengths, PSG weaknesses, platoon strengths, and platoon weakness.
Table 23 shows a complete distribution of findings for all key word occurrences greaterthan one percent of total occurrences. The distribution shows the count of each occurrenceas either a strength, or a weakness relative to each attribute or topic.
62
Table 23
Comments Listed Initially of Key Words by Frequency of Occurrence
Strength Bias. Respondents were asked to identify strengths and weaknesses inequal proportion. An inspection of Table 23, however, reveals that overall, respondentsoffered a total of 3348 comments; 1784 (53%) were registered as strengths and 1584 (47%)were registered as weaknesses. Thus we can conclude that respondents comments overallreflect a slight (3%) orientation toward commenting on strengths.
Total Net Strength. Attributes are rank ordered by Total Net Strength (TNS). TNS isthe sum of the strengths minus the sum of the weaknesses for any given attribute. Wherethe number of weaknesses outweigh the number of strengths, the number showing thedifference appears in parentheses indicating a "negative" strength (a weakness) of thatmagnitude. TNS serves as a convenient way of rank-ordering all attributes. Those attributesat the top of the list represent soldier/leader functions where performances' were identified asstrongest. Toward the bottom of the list, one encounters the attributes where performancewas increasingly wo 'rse and, presumably, where more training or other corrective action mightbe recommended. Total net strength are relative values that have significance only in thecontext of the specific data set in which they occur for the purpose of rank-ordering therelative strengths and weaknesses of all reported attributes, in this case, for the overall dataset (N=450 respondents).
For example, in Table 24 it is apparent that motivation was identified as the mostcommon strength and (lack of) experience is the greatest weakness based on 450 observersof infantry rifles platoons at JRTC between 1997 and 1999. From these findings, one caninfer, based on the definition of experience (as used by respondents and defined in AppendixA), that longer tenure for rifle platoon officers, junior NOOs / enlisted soldiers, and platoonsergeants, in that order, should be considered for achieving improved platoon performance.Of course, what is learned during their tenure is an area that requires further inquiry, assimply accumulating more overall time may not have the intended positive impact on platoonperformance.
64
Table 24
Distribution of Cadre and O/C Comments on All PL, PSG, and Platoon Strengthsand Weaknesses at J RTC n Rank Order by Total Net Strength
•Field Data Cards N=450
AtaAculAttributes PL/L P S S S PTPTIPT TTIO TOTNet Nt NetNET
*When listed as a weakness, each comment indicating a lack of what the comment is about.Motivation is a strength; lack of motivation is a weakness.
65
Net Strength by Subject. By rank ordering by PL Net strength, we can also offer alist of potential training achievements and training priorities for the platoon leaders. At thetop of the list would be the attributes representing the greatest current strength: learning witha net strength of 50. Continuing down form the top: Willingness 18, Knowledge 17,Motivation 14, Flexibility 13, and Proficiency 9. The greatest weakness for platoon leaderswas experience with a net strength of (64) at the bottom. Working up from the bottom, areasfor PL improvement would be: tactical control (18), planning (17), delegation (12), settingpriorities (9), standards (8), and troop leading procedures (7). The same could be done forPSG and for the junior NCO and EM in the platoon overall. No two lists would be quite thesame, as can be seen in Table 24 where we present a breakdown based on these targetgroups.
For example, in total net strength, motivation is most frequently occurring strength, asis evident in Table 3, but considering subjects individually, motivation ranks 4th in frequencywith the PL, and second with the PSG and the platoon overall. Experience is most noticeableweakness in PLs and the platoons. Platoon sergeants are somewhat less likely to beinexperienced,~ communications is their weakest attribute. Table 24 compares the relativefrequency of different findings for the three subjects.
Questions for Analysis
The "distribution analysis" is a simple accounting process that addresses the followingquestions:
"* How many times was a given attribute--" Enthusiasm" for exam pl e--mentioned?"* Which attributes were the most frequently occurring?"* How often did a given attribute occur as a percentage of all attributed occurrences?-, To which subject --the platoon leader, platoon sergeant, or the platoon--did eachoccurrence apply?"* Was the occurrence listed as a strength, or a weakness?"* What is the net effect of all reported strengths and weaknesses for each attribute?
These tabulations, in turn, allows us to address the following questions:
"* What were the greatest strengths of platoon leaders and platoon sergeants?"* What were their greatest weaknesses?"* To what extent were the leaders strengths and weaknesses reflected in theplatoons?
By running the tabulation application across different sub-sets of platoons, other issues canalso be addressed:
66
* How did the rank ordering of the leadership attributes of top performing platoonsdiffer from the ordering of attributes revealed in bottom ranked platoons?* How did the observed attributes in platoons that scored highest in transformational*leadership behaviors vary from the observed attributes of platoons which scoredlowest in transformational leadership behaviors?* What is the relationship between PL/PSG cooperation and platoon performance?* What are the implications of these findings for leader training and unit readiness?
Table 25Differential Analysis Comparing P1, PSG, and Platoon Findings for Top and Bottom 14 Attributes inDescending Order by Net Strengths
Respondents N=450 field data cards
Platoon Leader Platoon Sergeant Platoon NCOs and EMAWlbuteaI P1- Pt. Pt. Attrlbute� / PSG P6� PSG Aiffibutos! Pt.T P1-? Pt.?
Transcripts of Narrative Comments. All narrative comments on the top and bottom12 platoons based on JRTC evaluations can be obtained from the authors of this report.
Top and Bottom 12 of 72 Platoons. The top and bottom 12 platoons were selectedbased on ratings for 72 platoons provided by O/C in Parts A and B of the field data cards. Asimple sum of ratings for A and B was used to identify the top 12 and bottom 12 platoons.
Platoons were also categorized based on falling into the top 12 and bottom 12 onTMLQ transformational leadership. All of the narrative comments rendered on the high andlow 12 platoons in transformational leadership (TL) scores can be obtained from the authorsof this report. The high and low TL scores are based on the mean subordinate TL ratings forall 72 platoons completing the TMLQ. The survey was conducted at home station by eachplatoon a month prior to JRTC deployment. Earlier quantitative results showed that the TMLQdid not appear to differentiate more or less effective platoon performance at JRTC, wedecided to explore the aggregate measures of transformational leadership further withadditional qualitative analyses.
Strengths and Weaknesses in Top vs. Bottom 12 Performing Platoons
Frequency of comments on strengths and weaknesses overall and by subject werepresented in Table 24 and 25.
O/Cs rated the performance of each platoon in parts A and B of the field data cards.An overall rank ordering of all 72 platoons was produced based on these performancescores. The narrative comments on the Top 12 and the Bottom 12 platoons are comparedand contrasted in this section. First, narrative findings for the top 12 platoons will bequantified by topic. As before, attributes mentioned most often as strengths will appear at thetop of the list.
The strength bias is actually slightly less than for all platoons: 52% of all commentswere on strengths in Top performing platoons versus 53% for all platoons.
Findings for Bottom 12 Platoons in JRTC Performance. The results for the Bottom12 of 72 platoons are presented in Table 26. Topics are listed in descending order by TotalNet Strength.
68
Table 26
Bottom 12 of 72 Platoons at JRTC Distribution of Cadre and O/C C.omments onStrengths and Weaknesses
100% Percentages of total 13% 13% 10% 12% 25% 18% 48% 52% (4%)comments
Findings for Top 12 Platoons in JRTC Performance. The strength bias is actuallyslightly less than for all platoons: 52% of all comments were on strengths in Top performingplatoons vs. 53% for all platoons. These findings are presented in Table 27.
69
Table 27
Findings for Top 12 Platoons Distribution of Cadre and O/C Comments onStrengths and Weaknesses in Top 12 Platoons at JRTC
Respondents N=72 field data cards
1.769T % Attributes / PL P1 PSG PSG PIT PIT TOT TOT NET
Findings in Top 12 Platoons VS. Bottom 12 Platoons in JRTC Performance. Totalcomments on top platoons registered 52% strengths and 48% weaknesses; in Bottomplatoons the figures were reversed: 48% of all comments were strengths vs. 52%weaknesses. What may be of importance are the different qualities mentioned by 0/Cs ofthe strengths in the top versus bottom groups. As will be seen, the greatest absolutedifferences are in the leadership of these platoons.
Frequently Attributed Strengths. Both groups were described as "motivated" and"learning". However, the bottom platoons were clearly described as being at an earlier stageof development. They are "willing", while the top performing platoons are more noticeably"proficient" "aggressive", and "enforcing standards" under strong "leadership" notably fromthe junior NOOs within the platoons. A comparison of the most frequently noted weaknesses
* is also revealing. Both groups have frequently observed weaknesses in experience,interpersonal communication, and maintaining tactical control. However, in the Bottomperforming group, few collective skills and the lack of control are frequently combined withlack of discipline.
Frequently Reported Strengths
Bottom 12 Platoons Top 12 PlatoonsMotivation KnowledgeWillingness AggressivenessLearning MotivationCasualty Evacuation Enforcing StandardsUse of night observation Learningdevices ProficiencyPersistence LeadershipInitiative
Platoon Leaders versus Platoon Sergeants. In the bottom performing platoons,there were a total of 323 comments on the performance of the platoon leaders and sergeants.
71
154 comments were registered as strengths and 169 as weaknesses: 52% were commentson weaknesses and 48% were comments on strengths.
In the top performing platoons, there were a total of 368 comments on the performanceof the platoon leaders and the platoon sergeants. 201 comments were registered asstrengths and 167 as weaknesses. 55% were comments on strengths, while 45% onweaknesses.
Qualitative Interpretation of Top and Bottom Differences
Most differences between top and bottom performing platoons in this analysis areprobably not attributable to differences in resources such as training time, home stationlocation, or personnel strength --although all such factors are clearly important to overallperformance. All platoons, including those scoring among the both the top and bottom 12,were lacking in the experience.
Top and bottom performing platoons in this study were frequently to be found in thesame brigades, battalions, and even within the same companies. Although seven of the 12top performing platoons emerge from one brigade rotation, there were platoons from all fourbrigades that scored in the top and bottom 12. Five of the eight battalions participating in thestudy, had platoons that were ranked in both the top as well as the bottom 12 of 72 platoons.Three of the 24 companies had platoons ranked in both the top and bottom 12 of 72platoons. Only one platoon out of 72 came to the JRTC under strength to the point that both0/C respondents mentioned it as a significant factor in their performance.
The difference in the platoon's performance does not seem to be based on the qualityof the enlisted soldiers. In the current analysis of cadre and 0/C comments, the quality of theperformance of enlisted soldiers and junior NOOs (platoon findings) varied between platoonsto a far lesser extent than the quality of attributes of the platoon leader. While military skills,technical and tactical knowledge, and high levels of competence are clearly importantelements for success in top performing platoons, these attributes were also present only toslightly varying degrees, in all 72 platoons (see platoon tabulations in Tables 24 and 25).
Leadership appears to make a difference between top and bottom performing platoonsbased on both qualitative and quantitative analyses. The relative importance of platoonleadership is a finding that will be further supported in a comparative analysis of all fivesubsets of platoon leaders following the next section of this report.
0/C and Cadre Comments According to the Platoon's TMLQ in Home StationTransformational Leadership
Methodology. As noted earlier in our Methods section, platoon members completedthe Team Multi-factor Leadership Questionnaires at home station. The TMLQ was designedto measure six leadership factors across a spectrum of transactional and transformationalbehaviors. Those items on the survey that loaded on indicators of transformational leadershipwere scored and a transformational leadership (TL) rating was determined for each platoon
72
on a scale of zero to four. A score of zero indicated no transformational behaviors wereobserved in the platoon; a score of "4" indicated that transformational behaviors occurred"frequently if not always." The average "TL" mean score for all 72 JRTC platoons was 2.30.The lowest mean platoon score was 1.66. The highest was 2.92.
In this analysis, narrative findings will compared for the 12 High TL versus the 12 LowTL platoons. Tabular data will be presented for both groups as before. Comparisons similarto those made in the analysis of Top vs. Bottom performing platoons will be made. Finally,an overall comparison of the relative strength of platoon leaders in all five groups ispresented.
Strengths and Weaknesses in High vs. 12 Low TL Platoons in TransformationalLeadership (TL)
Table 28 presents findings for the 12 high TL platoons. Comments are independentobservations by 0/C and cadre during tactical training at JRTC. The layout is the same as inearlier comparisons, with all attributes! topics rank ordered by net strength. Again, the mostfrequently occurring strengths are listed at the top progressing downward to the mostfrequently occurring weakness at the bottom.
A count of total comments in the high TL data set indicated nearly a 50-50% split onfindings of strengths and weaknesses (i.e., 400 strengths vs. 393 weaknesses). The attributecount of comments for platoon leaders favored strengths., The PSG and PL attribute countfavored weakness. The most distinctive finding in this set of qualitative data was the veryhigh occurrence of positive comments on cohesion.
Frequency of comments for the 12 lowest platoons in transformational leadership wererank ordered by net strength and are presented in Table 29. The strength bias reportedearlier for the total data on all platoons was not evident among the comments on low TLplatoons. In fact, total weaknesses exceeded total strengths by about 4%--ranking withBottom 12 in overall performance. There were 247 comments on strengths and 263comments on weaknesses. Among platoon leaders, the split was nearly equal with 61comments on strengths versus 62 comments on weaknesses: There was a greaterpercentage of comments on weakness (8%) in the PSG comments: 57 comments onStrengths versus 67 on weaknesses. Comments on platoon (EM and junior NOOs) alsofocused more on weaknesses (2%). Comments on cohesion were hard to locate in thisgroup--barely 6 comments of which were on weaknesses.
73
Table 28
High 12 Platoons Per Home Station TL Scores: Distribution of Cadre and O/CComments on Strengths and Weaknesses
Respondents N=77 Field Data Cards
TOT % Attributes PTL PL PSG JPSG PLT JPLT TOT TOTINETCMTS; CMTS Topics S R WK STR JWKS STR JWKS STIR WK ISTR
Among the 12 low ranking platoons in TMLQ transformational leadership, observercomments indicated the Junior NCOs and EM lack initiative. Orders concerning operationswere weak and poorly understood at the lowest levels. Lack of communication was the mostfrequently occurring comment among observers of these platoons. Of the 33 commentsregistered, all but eight were focused on weaknesses. One observer noted, "Mavericks",where another oberserver noted "platoon focus only-- no communication or coordination withadjacent unit or up the chain." As with other platoons, the platoon leaders and sergeantslacked experience. In this group, one of the consistent comments concerned the junior NOOsnot keeping their soldiers informed or in check. Supervision was also commented on asbeing a weakness in this group.
The top ranking for cohesion in the High TL group is most noteworthy. In no otherdata set does cohesion rank as the top attribute when sorting by net strength; the highlypositive finding is unanimous among 0/C and cadre respondents. The platoon leadersreceived 23 comments on their technical and tactical knowledge. 77% of those commentswere favorable. Teamwork, Proficiency, Morale, and Discipine all ranked high in this groupboth for leaders and followers.
Both the high and low TL groups were commented on as being "flexible" and"knowledgeable" in both technical and tactical subjects. Low TL platoons were seen as moreoften enforcing military standards--something of a weakness in high TL platoons.
The greatest qualitative strength associated with the high TL platoons was theircohesiveness, unmatched in other subsets. Also important were their high ratings ondiscipline. Of the 32 comments by observers of this attribute, nearly half focused on juniorNCOs and EM, and the majority of these were also favorable.
The greatest qualitative strength for low TL platoons was their aggressiveness. Theyalso received high marks in motivation, standards, and mission focus. There were 35comments on knowledge, most of which pertained to technical understanding. Of thesecomments, 66% were positive.
Both the top and bottom TL groups lacked experience and did poorly in planning.Beyond the attributes listed, there were 28 comments on discipline in the low TL platoons:57% were positive. However, the platoon leaders and sergeants in the low TL platoons,apparently did not set the example in terms of being effective planners.
Comparison of Strengths Among all Platoon Leaders. The final objective of thisqualitative analysis was to take a closer look at the overall quality of leadership for the 72platoon leaders. To undertake this analysis, only narrative data on platoon leaders wasconsidered. The intent here was to compare the consolidated findings on the 72 platoonleaders with findings for each of the four included subsets:
Only comments on the strengths and weaknesses of the platoon leaders wereconsidered. The basis for rank ordering the five groups is the percentage of total commentsattributed as strengths; this "strength rating" is calculated by dividing the total comments onstrengths by total comments on strengths plus total comments on weaknesses. All commentson the platoon leaders, both strengths and weaknesses, are thereby considered for purposesof comparisons by attribute and for rank ordering of overall results. Only the most frequentlyoccurring attributes! topics were selected for use in the body of Table 30.
Topics receiving at least one percent of all PL comments are presented in the tabulardata; this is the same frequency cut-off point used earlier. There were comments on everyattribute in the baseline data set, which included all 72 platoon leaders. In those cases whereonly a few comments were received, the tabular percentage for each attribute becomes lessmeaningful. Where the number of comments per attribute is less than 5, the correspondingpercentage is shaded in Table 30, as a reminder of the low frequency rate reported for thatattribute.
In Table 29, a list of the 32 attributes constituting at least one percent of all PLcomments are listed in the left-most column. At the very top of the chart are the total numbersof respondent field data cards that were received for the platoon leaders in each subset. Inthe first group of comparative data, the number of comments and their strength rates areshown for all 72 platoon leaders. This was used as baseline for comparing platoon leaders.
The findings for the four comparison groups of platoon leaders are shown insubsequent sets of columns: "Top 12" platoon leaders in the first set of data; "High 12 TL"
77
platoon leaders in the second set; "Bottom 12" in the third set, and "Low 12 TL" platoonleaders in the fourth set. Attributes listed on the left were encountered in at least one percentof all PL comments in the baseline group of 72 platoon leaders. In the body of the chart, foreach attribute, the total number of received comments (strengths and weaknesses) is listed,followed by the strength rate for that attribute. The strength rate was the percentage of thosecomments recorded by respondents as strengths. Thus, both strengths and weaknesses arereflected in the strength rates per attribute. The strength rate per attribute is determined bydividing the total strengths by total strengths plus total weaknesses for each attribute.
Near the bottom of Table 29 are the total numbers of comments and total strengthrates recorded for all comments attributed to the platoon leaders in each data set. Again, thetotal weaknesses are accounted for in the overall strength rate. Thus a strength rate of 50%would indicate half the comments were attributed as strengths and half were attributed asweaknesses. A strength rate of zero indicates all comments were recorded as weaknesses.These totals at the bottom of Table 29 included omitted attributes. Since only the mostfrequently mentioned attributes are included in the body of the table, the totals at the bottomare greater than the sums for attributes in the body of the table. Total percentages arecalculated by dividing total strengths by the sum of total strengths plus total weaknesses.
Comparisons between data sets
In the aggregate, the total numbers of comments in each subset, though lower for the"uLow TL" and "Bottom 12" groups, still netted more than a 100 comments on strengths andweaknesses and are considered adequate for purposes of determining overall strengthcomparisons.
The overall strength rates for the four sub-sets selected for comparison in Table 30vary from a high of 55% for the High TL group to a low of 48.6% for the Low TL Group. ThePL groups are arranged in Table 30 in descending order by overall strength rates from 55%for the High TL group to 48.6% for the low TL group.
The reader should keep in mind, that the total net strength is an appropriate measurefor comparing the frequency of attributes within a given subset. However, it is less useful forcomparisons between data sets since there were variations in the numbers of respondentfield data cards received for the four sub sets. Comparisons across groups should be donewith some degree of caution. Note that there was complete source independence of theTMLQ differentiation and the 0/C comments while the JRTC differentiation was biased bysame source variance as both identification of top and bottom 12 JRTC: groups andcomments came from the 0/Cs.
78
Table 30
Platoon Leader Strength Comparisons: All vs. Four Selected Subsets
All Plat Ldrs High12 TL Topl12 Bottoml12 Low 12TLRespondents N=450 N=76 N=72 N=70 N=50Attributes / TOT STR TOT STR TOT STR TOT ISTR TOT STR
The "High 12 TL" group. This group of officers received a total of 209 comments ofwhich 115 comments described strengths and 94 comments described weaknesses. TheHigh TL group achieved an overall strength rating of 55%, which was higher than any othergroup of leaders in this study.
The platoon leaders in the High TL group achieved above average strengthpercentages in 15 of the 22 (68%) attributes in which they were scored. Qualitatively, theareas of above average performance included: mission, focus, attitude, learning, listening,motivation, communications, knowledge, proficiency, the issuing of operations orders,planning, proficiency, delegation, and willingness. The group scored at the average for allplatoon leaders in one area: that area was time management --an attribute in which no grouphad any observed strengths. The group scored below average for all platoon leaders in 6 of22 scored areas (27%): Aggressiveness, Control, Experience, TLP (Troop LeadingProcedures), Flexibility, and Standards.
The "Top 12" JRTC Group achieved a strength rating of only 52.5%, which was nearlyidentical to the percentage achieved by all 72 platoon leaders (52.9%).
The lieutenants in Top 12 group achieved above average strength percentages in 18of 28 rated areas (64%): attitude, confidence, control, decisiveness, improvement, initiative,knowledge, leadership, listen, mission, motivation, OPORD preparation, willingness, troopleading procedures, planning, priorities, proficiency, and standards enforcement.
This group scored at the average in three attributes: dedication, patience, and timemanagement.
The group scored below the average for all platoon leaders in seven of 28 areas(25%): aggressiveness, learning, communications, coordination, delegation, experience, andflexibility.
"Bottom 12" JRTC Group. There were 175 total comments received on the "Bottom12" group; 89 were recorded as strengths. The Bottom 12 platoons achieved a strength ratingof 49.1 % from the observer group of 0/C and cadre--a rating nearly 4% below the baselineaverage for all lieutenants.
Platoon leaders in the "Bottom 12" group achieved above average strengthpercentages in nine of 25 rated attributes (36%): flexibility, improvement, initiative,knowledge, learning, patience, standards, willingness, and troop leading procedures (TLP).The group achieved an average score in one attribute: dedication. The "average" score was100%, a finding that is not particularly surprising as will be discussed in our conclusionsregarding the qualitative data analysis. Platoon leaders in this "Bottom 12" group scoredbelow average in 15 of 25 attributes (60%): aggressiveness, attitude, communications,confidence, control, decisiveness, experience, leadership, listening, mission, motivation,OPORD preparation, planning, priorities, and time management.
80
"Low 12 TL" Group. The low transformational leadership group received a total of111 comments from 0/C and Cadre observers: 54 comments identified strengths; 57identified weaknesses. This group had a total strength report of 48.6%--a score that was4.3% lower than the baseline average of 52.9% achieved by all 72 platoon leaders. Therelatively lower numbers of total comments on the strengths and weaknesses of this group isdue in part, to the larger number of platoons in this group that participated in the first rotation,before field data cards were modified to provide information equally on strengths andweaknesses. This, in turn, has resulted in lower numbers of comments per attribute, whichhas reduced the precision of the percentages by which individual attributes are measured.The total number of comments is adequate for measuring a total strength percentage for thisgroup overall, but comparative measurements by attribute is often not possible, due to thefewer numbers of qualified field data cards.
In only seven of 25 attributes are there sufficient numbers to yield comparisons withthe baseline group. Above average findings by attribute were found in experience, listening,motivation, and knowledge. Below average strength percentages were found incommunication, OPORD preparation, and patience.
Summary of Qualitative Comment Analysis Findings
The strongest group of leaders was from platoons rated highest in transformationalleadership by platoon members at home station. Platoons rated by members as beinghighest in transformational leadership, accrued the highest strength rating in narrativecomments by 0/C and Cadre observers a month later in the field at JRTC. The strength rateachieved by the High TL group was 55%, which was higher than the strength rating achievedby any other group of leaders. This top rating was determined by a comparative analysis of0/C and cadre comments on four subsets of leaders.
The weakest group of platoon leaders was from platoons that were rated lowest intransformational leadership by platoon members at home station. Their strength rate at JRTCwas 48.2%, which was the lowest of the five groups. The low strength rating was based oncomments by 0/C and Cadre at JRTC comparing descriptions of strengths and weaknesseson the final version of the Field Data Card--the same methodology used to determinestrengths ratings for all platoons. The Low TL group of platoons was selected based on theirhaving achieved the lowest mean transformational leadership scores as determined byPlatoon TMLQ instruments completed by platoon members at home station a month prior toJRTC.
Regarding comparisons between the High and Low TL group, the raters whocompleted the comment cards were totally different from the raters who completed the homestation survey. While the company cadre who completed some of the field data cardsdescribing platoon behaviors at JRTC, also completed MLQ questionnaires on the PL andPSG at home station, however these cadre- the company commander, company X0 andCompany First Sergeant- did not participate in the TMLQ survey used to determine platoontransformational leadership scores. The mean platoon transformational leadership scores
81
were derived from Platoon TMLQ data collected from platoon members only, and nocompany cadre were involved in these evaluations.
Comparisons between "Top and Bottom 12" JRTC Platoons involved some raters fromthe same source: the Observer /Controllers. The Top and Bottom 12 platoons weredetermined based directly on 0/C answers to questions in parts "A" and "B" of the field datacards and also on 0/C ratings on 14 points of PL and PSG performance. The strength ratingswere determined indirectly from 0/C and cadre narrative comments on strengths andweaknesses in part "C" of the field data cards. Six of the nine field data cards per platoonwere completed by the 0/C.
Methodologies and data used to select the top and bottom 12 platoons were distinctlydifferent from the methods used in this text analysis. However, the 0/Cs provided all of thedata for platoon selection to high and low groups, and two thirds of the comments used todetermine their strengths rates in the narrative analysis.
Inconsistencies between O/C Ratings and 0/C Narratives. The £top 12" group,based on 0/C performance ratings, also included four platoons, which platoon members hadrated as being among the 12 lowest in transformational leadership. Further investigationreveals that two of the "Top 12" platoons were also described by the 0/Cs in their narrativecomments as having weaknesses which would have ranked them among the lowest 12 TLplatoons.
This inconsistency helps to explain why the final strength rate among the "Top 12"JRTC platoons were slightly below the average for all 72 platoons. (All four Low TL platoonsmight have been so rated, but narratives on strengths and weaknesses on two platoons werecollected before the Field Data Cards had been modified to include these items.)
Consistency of findings. An average score of 100% on the attribute dedicationappears overstated, yet such high marks on dedication are generally consistent with findingsfrom a recent survey of 11,680 respondents in a US military climate and culture survey. Theoverall strongest levels of agreement found anywhere in that study were in response to thestatement, "I am proud to serve in America's armed forces." The strongest levels ofagreement in general were with the clusters of questions focusing on pride, duty, andcommitment. (American Military Culture in the twenty-first Century, A Report of the Center forStrategic and International Studies, Washington DC. February 2000)
Implications for training
Earlier in the qualitative analysis, the relationship between "motivation" and"1experience" was touched upon. In Table 24 it was revealed that motivation was the greateststrength and experience was the greatest weakness based on more than 3000 commentsfrom 450 observers of infantry rifle platoons at JRTC. From these findings one can infer,based on the common definition of experience, that longer tenure for rifle platoon officers,junior NCOs / enlisted soldiers, and platoon sergeants, in that order, could likely result inimproved platoon performance at JRTC. In context, experience was usually taken to mean
82
the length of time an incumbent leader had served in his current position (See key worddefinitions in Appendix B).
A key question for the Army is whether the "experience" gap, is a product ofassignment tenure or of not learning from past experience--or a combination? If it isassignment only, then we are bringing into the equation something over which theparticipants had no control. Experience does not fit in the improvement model except to saythat most folks need time to learn. Should the duration of assignments at the platoon level bereconsidered? Should the MAR process and other tools for enhancing the lessons ofexperience be reviewed? These questions are raised by the current findings, but cannot beanswered on the basis of the data collected for this study.
Implications for Leadership Training and Development
The implications of these findings are particularly significant for Army leadershiptraining and development. Differences in platoon performance at JRTC appear to beattributable to differences in the frequency of transformational leadership behaviors seen byplatoon members at home station.
Transformational leadership (TL) may become an even more powerful model forleader training and development at higher levels in the organization where elements of self-motivation and coordination are typically more critical to organizational effectiveness. What isnot at all clear, however, is whether transformational behaviors can be learned by all leaders,or even identified by them, without specific coaching. This must continue to be a critical areafor further study and experimentation.
Looking back to the inconsistencies in 0/C responses on the field data cards, perhaps0/Cs, being untrained in the identification and importance of TL, might be more inclined tomisinterpret or overlook instances of low TL behavior at the platoon level and below.Perhaps, in rifle squads and fire-teams, high or low levels of transformational leadership gounnoticed, not because they are undetectable by an 0/C, but because they are not seen asthe critical issue to comment on given limited space and time. Interviews with 0/C on thistopic might be fruitful in answering this question. Perhaps those four "Low TL" platoons thatwere evaluated by 0/Cs that ended up in the "Top 12" group, were somehow able to drawupon other attributes and thus perform exceptionally well at JRTC in spite of their low TLscores. Alternatively, JRTC is viewed by many 0/Cs as a development lab where leadersand followers can make mistakes. Consequently, the 0/Cs may have judged those platoonsmore on progress then on levels of absolute performance. The type of developmentalmessage they intended to convey to the platoon leaders may have affected the ratingsfeedback that was given by the 0/Cs.
Communication
Another obvious follow-on topic concerns the weaknesses noted in communicationskills. This attribute is frequently lacking between PL and PSG in low performing units; butcommunications is also a very frequently observed weakness among junior NCOs and EMs in
83
rifle squads and fire teams. There needs to be additional attention placed on improvingcommunication processes in platoons.
The comments were almost always with reference to interpersonal communications.The comments referred to "cross-talk" which, taken in context, always seemed to be apositive attribute. We know survey respondents were not talking about shortcomings in radiotelephone procedures. "Cross-talk" implied recurrent dialogue between and among membersand across organizational boundaries focusing specifically on interpersonal communication.
The seemingly broad preference for increasing levels of communication and quantityrequires further investigation. Such research might begin with a series of follow-up interviewswith 0/Cs. Surely, better units do not simply talk more. 'Or do they? Where are the boundarylines where healthy "cross-talk" becomes dysfunctional "back-talk'? And, in very highperforming units, where are the boundaries between explicit telling and implicit knowing? Towhat extent is "cross-talk" a substitute for the lack of excellence and practice in fieldoperating SOPs? Again, interviews with 0/C would probably help clarify this issue ofcommunication weaknesses.
Tactical training implications
These data are a rich area for distilling training implications. One example will beoffered based on four closely related training problems evident in these findings. We haveobserved weaknesses in planning, setting priorities, time management and troop leadingprocedures (TLP). All four are closely related areas of frequently observed weaknesses ininfantry platoons operations. The Troop Leading Procedures are a proven checklist of about14 time sensitive actions, in priority order, that small unit leaders oftentimes should takewhen preparing for combat operations. When the TLP checklist is most needed, the smallunit leaders have the least time to look for it. This simple "time management" tool is probablyover due for renewed command emphasis. Small unit leaders could memorize the list inabout 50 minutes. It would probably pay big dividends if this checklist could be recalled frommemory while small unit leaders, under the stress of combat, are trying to decide what to donext.
Qualitative Model Improvements
In terms of the validity of the model used in these analyses, the use of net strength (orweakness) as calculated, is considered to be an adequate approach for rank orderingleadership attributes within a given data set. In Table 29, the methodology is modified toembrace the notion of strength rates to allow comparisons of strengths and weakness acrossdata sets of differing sizes.
Future qualitative analyses will need to take into consideration the relative importanceor seriousness of the individual dimensions, beyond simply examining the frequency of theiroccurrence? For example, should three comments on "motivation" count more than onemajor comment on demotivational behavior? Maybe.
84
Finally, to extend our analyses the observed attributes could potentially be classifiedinto larger groupings-such as the Be, Know, Do, attributes discussed in FM 22-100. Usingthis approach might help focus future Army leadership assessment and training on areas ofmore direct relevance to platoon performance?
Summary of Qualitative Findings
There were several interesting patterns that emerged from the qualitative dataanalysis. First, the more effective platoons at JRTC had PLs and PSGs that were rated by0/Cs as having significantly better relationships with each other, which could be described astransformational. These relationships were typically described as being more open,supportive, challenging of each others' assumptions, willingness to listen to each other,inspiring each other, etc. We also found that there was a positive correlation between thetype of relationship that the PSG and PL had in home station, as seen by members of theplatoon, and the relationship observed/described by the 0/C raters at JRTC. Finally, theworst performing platoons had PLs and PSGs that did not listen to each other, openlydisregarded each other's opinion, intervened with each other only when things went wrongand were not helpful to each other's development.
CONCLUSIONS
Our results suggest that PL and PSG transformational leaders were generally moreeffective in home station and again in JRTC combat readiness missions. Results varied bysource of ratings as well as in terms of the level of agreement across rater groups. Thepattern of results observed with respect to rater source indicated that simply combiningdifferent source ratings into an overall average would mask some of the leadershipdifferences observed in home station and/or at JRTC. Also, from a developmentalperspective, relying only upon self-ratings of leadership is simply inadequate to predictperformance. The best predictors of performance in near combat conditions came from othersources of ratings, not from self-ratings of leadership.
Although many leadership training programs tend to concentrate on the positive stylesof leadership, our results point to the importance of examining and eliminating passiveavoidant styles as well. Results presented here clearly indicated that leaders, who weremore passive and/or avoidant in home station, also led platoons that performed worse atJRTC. Moreover, the qualitative observations collected from the 0/Cs at JRTC alsoconfirmed that leaders who were either passive or simply focused on correcting problems asthey arose, lead to lower performing platoons at JRTC.
We also reported that the level of agreement concerning the collective leadership ofthe platoon can potentially serve as a proxy for cohesion, and can serve as an importantindicator of the platoon's overall effectiveness. Further analysis of different member levels inthe platoon are currently being explored to determine whether alternative sources of ratingshave more or less shared variance and its implications for predicting platoon performance.
85
Company culture was also shown to be a potential predictor of platoon performance.Examining how company culture over time effects the pattern of individual and teamleadership seems worth pursuing in future research.
Limitations
In any complex project, there are always a number of potential limitations to beconsidered when interpreting the results. This current study is no exception. First, although.the survey scales were well-established, modifications were made to scales for use in themilitary context. Ironically, the largest number of changes was made to the MA scale, whichconsistently generated the lowest estimates of internal consistency.
Second, survey ratings only capture a limited set of behaviors. In the current setting,the relationship between the PL and the PSG appeared to be quite relevant to the platoon'sperformance in JRTC. Collecting field observations of their interactions in home stationwould likely have helped augment predictions of performance. Third, results presented herewere based on an examination of a light infantry platoon's performance as seen by anobserver, who was charged with the goal of developing platoons. Hence, we need to restrictour conclusions to this sample and now recommend these leadership measures be used topredict platoon performance with other forces across different evaluation contexts.
Overall, the current study provided ample justification for linking individualtransformational and contingent reward leadership to platoon performance. The next obviousstep is to see how such leadership can be developed to augment unit performance.
86
REFERENCES
Atwater, L., Avolio, B.J., & Bass, B.M. (1991). A retrospective/prospective view of leadershipdevelopment, emergence, and performance. U.S. Army Research Institute for theBehavioral and Social Sciences. Alexandria, VA.
Atwater, L., Lau, A., Bass, B., Avolio, B., Camobreco, J., & Whitmore, N. (1994). Thecontent, construct and criterion-related validity of leader behavior measures. (ARIResearch Note 95-01). Alexandria, VA: U.S. Army Research Institute for theBehavioral and Social Sciences.
Avant, D.D. (1994). Political institutions and military change: Lessons from peripheral wars.Ithaca: Cornell University Press.
Avolio, B.J. (1999). Full leadership development: Building the vital forces in organizations.Thousand Oaks, CA: Sage.
Avolio, B.J., & Bass, B.M. (1991). The full range of leadership development: Basic andadvanced manuals. Center for Leadership Studies, Binghamton, NY.
Avolio, B.J., & Bass, B.M. (1993). Cross generations: A full range leadership developmentprogram. Center for Leadership Studies, Binghamton University, NY.
Avolio, B.J., & Bass, B.M. (1994). Evaluating the impact of transformational leadershiptraining at individual, .roups, organizational and community levels. Final report to theW.K. Kellogg Foundation. Center for Leadership Studies, Binghamton University,Binghamton: New York.
Avolio, B.J., & Bass, B.M. (1995). Individual consideration viewed at multiple levels ofanalysis. A multilevel framework for examining the diffusion of transformationalleadership. Leadership Quarterly, 6, 199-218.
Avolio, B.J., Bass, B.M., & Jung, D.(1999) Reexamining the components of transformationaland transactional leadership using the Multifactor Leadership Questionnaire, Journalof Occupational and Organizational Psychology, 72, 441-462
Avolio, B.J., Jung, D.I., Murry, W.D., & Sivasubramaniam, N. (1996). Building highlydeveloped teams: Focusing on shared leadership processes, efficacy, trust, andperformance. In M.M. Beyerlein, D.A. Johnson, S.T. Beyerlein (Eds.), Advances inInterdisciplinary Studies of Work Teams: 173-209. Greenwich, CT: JAI Press.
Avolio, B.J., Waldman, D.A., & Einstein, W.O. (1988). Transformational leadership in amanagement simulation: Impacting the bottomline. Group and Organization Studies,13, 59-80.
87
Bass, B.M. (1985). Leadership and performance beyond expectations. New York: FreePress.
Bass, B.M. (1990). Bass & Stoqdill's handbook of leadership: Theory, research, andapplications. (3rd ed.). New York: Free Press.
Bass, B.M. (1998) Transformational leadership: Individual, military and educational impact.Mahwah, N.J.,: Lawerence Erlbaum Associates.
Bass, B.M., & Avolio, B.J. (1990). Manual for the Multifactor Leadership Questionnaire. PaloAlto, CA: Consulting Psychologists Press
Bass, B.M., & Avolio, B.J. (1993A). Transformational leadership: A response to critiques. InM.M. Chemers & Ayman, R. (Eds.). Leadership theory and research: Perspectives anddirections. (pp. 49-80). New York: Academic Press.Bass.
Boyd, J.T., Jr., (1988). Leadership extraordinary: A cross national military perspective ontransactional versus transformational leadership. Doctoral Dissertation, NovaUniversity, Fort Lauderdale, FL
Bowers, D.G, & Seashore, S.E. (1966). Predicting organizational effectiveness with a four-factor theory of leadership. Administrative Science Quarterly, 11: 238-263.
Burns, J.M. (1978). Leadership. New York, NY: Harper & Row.
Burns, J.M. (1996). Empowerment for change. Unpublished manuscript, Kellogg LeadershipStudies Project, University of Maryland.
Bycio, P., Hackett, R-D., & Allen, J.S. (1995). Further assessments of Bass's (1985)conceptualization of transactional and transformational leadership. Journal of AppliedPsychology, 80, 468-478.
88
Campion, M.A., Medsker, G.J., & Higgs, C.A. (1993). Relations between workgroupcharacteristics and effectiveness: Implications for designing effective work groups.Personnel Psychology, 46, 823-850
Campion, M.A, Papper, E.M., & Medsker, G.J. (1996). Relations between work teamcharacteristics and effectiveness: A replication and extension. Personnel Psychology,49: 429-452.
Chan, D. (1998) Functional relations among constructs in the same content domain atdifferent levels of analysis. A typology of composition models. Journal of AppliedPsychology, 83, 234-246.
Cohen, S.G., Chang, L. & Ledford, G.E. (1997). A hierarchical construct of self managementleadership and its relationship to quality of work life and perceived groupeffectiveness. Personnel Psychologiy, 50:275-308.
CSIS (2000). American Military Culture in the twenty-first Century. A Report of the Center forStrategic and International Studies, Washington DC.
Dalton, J.H. (1994, Jan. 27). The character of readiness: The ethics of moral behavior. VitalSpeeches of the Day. LX 10, 296-298.
Dunphy, D., & Bryant, B. (1996). Teams: Panaceas or prescriptions for improvedperformance? Human Relations, 49: 677-699.
Dvir, T. (1998). The impact of transformational leadership training on follower developmentand performance: A field experiment. Doctoral Dissertation, Tel Aviv University,Israel.
Gal, R. (1990). Limits of military legitimacy to military commitment. In Wyatt, T.C., & Gal, R.(Eds.), Legitimacy and commitment in the military. New York: Greenwood.
Gasper, S. (1992). Transformational leadership: An integrative review of the literature.Doctoral dissertation, Western Michigan University, Kalamazoo, MI.
Guzzo, R-A., Yost, P.R., Campbell, R-J., & Shea, G.P. (1993). Potency in groups:Articulating a concept. British Journal of Social Psychology, 322, 87-106.
Hater, J.J., & Bass, B.M. (1988). Superiors valuations and subordinates perceptions oftransformational and transactional leadership. Journal of Applied Psychology, 73,695-702.
89
Howell J.M., & Avolio, B.J. (1993). Transformational leadership, transactional leadership,locus of control, and support for innovation: Key predictors of consolidated businessunit performance. Journal of Applied Psycholoqy, 7, 891-902.
Howell, J.M., & Higgins, C.A. (1990). Champions of technological innovations.Administrative Science Quarterly, 35, 317-341.
Howell, J.M., & House, R.J. (1992). Socialized and personalized charisma: An essay on thebright and dark side of charisma. Unpublished Manuscript, Western Business School,The University of Western Ontario, Canada.
Hyatt, D.E., & Ruddy, T.M. (1997). An examination of the relationship between work groupcharacteristics and performance: Once more into the breech. Personnel Psychology,50: 553-585.
Ilgen, D., Major, D., Hollenbeck, J., & Sego, D. (1993). Team research in the 1990s. In M.Chemers, & R. Ayman (Eds.), Leadership theory and research: Perspectives anddirections (pp. 245-270). New York, NY: Academic Press.
James, L.B., Demaree, R.G., & Wolf, G. (1984). Estimating within-group interrater reliabilitywith and without response bias. Journal of Applied Psychology, 9, 85-98.
Jung, D., Bass, B.M., & Avolio, B.J. (1995). Convergent and divergent validity of MLQ Form5X. Technical Report 95- 1. Center for Leadership Studies, Binghamton, University,Binghamton, NY.
Katzenbach, J.R. (1997). Teams at the too: Unleashing the potential of both teams andindividual leaders. Boston, MA: Harvard Business School Press.
Kotter, J.P., & Heskett, J.L. (1992). Corporate culture and performance. New York: FreePress.
Kozlowski, S.W.J., Gully, S.M., Salas, E., & Cannon-Bowers, J.A. (1996a). Team leadershipand development: Theories, principles, and guidelines for training leaders and teams.In M.M. Beyerlein, D.A. Johnson & S.T. Beyerlein (Eds.), Advances in interdisciolinarystudies of work teams, 253-291. Greenwich, CT: JAI Press.
Levinson, H. (1980). Power, leadership, and the management of stress. ProfessionalPsychology, 11, 497-508.
Longshore, J.U. (1988). The associative relationship between transformational andtransactional leadership styles and qroup oroductivity. Doctoral dissertation, NovaUniversity, Boca Raton, FL.
90
Lowe, K.B., Kroeck, K.G., & Sivasubramaniam, N. (1996). Effectiveness correlates oftransformational and transactional leadership: A meta-analytic review. LeadershipQuarterly. 7, 385-425.
Manz, C.C., & Sims, H.P. Jr. (1993). Business without bosses: How self-managing teams arebuildincq high performance companies. New York: Wiley.
Martin, D. (1993). Teamthink: Using the sport connection to develop, motivate, and manage awinning business team. New York, NY: Penguin.
McClelland, D.C. (1975). Power: The inner experience. New York, Irvington.
Neck, C.P., & Manz, C.C. (1994). From groupthink to teamthink: Toward the creation ofconstructive thought patterns in self-managing work teams. Human Relations, 47: 929-952.
O'Keeffe, M.J. (1989). The effects of leadership style on the perceived effectiveness andsatisfaction of selected Army officers. Doctoral dissertation, Temple University.
Onnen, M.K. (1987). The relationship of clergy and leadership characteristics to growing ordeclininq churches. Doctoral dissertation, University of Louisville, KY.
Patterson, C.E.P., Fuller, J.B., Hester, K., & Stringer, D.Y. (1995). A meta-analyticexamination of leadership style and selected follower compliance outcomes;Symposium paper. Academy of Management, Vancouver, B.C.
Podsakoff, P.M., & Schriesheim, C.A. (1985). Leader reward and punishment behavior: Amethodological and substantive review. In Staw, B., & Cummings, L.L. (Eds.)Research in Organizational Behavior. San Francisco: Jossey-Bass.
Salter, D.J. (1990). Leadership styles in United States Marine Corps transport helicoptersguadrons. Masters thesis, Naval Postgraduate School, Monterey, CA
Seltzer, J., Numerof, R.E., & Bass, B.M. (1989), Transformational. leadership: Is it a sourceof more or less burnout or stress? Journal of Health and Human ResourcesAdministration, 12, 174-185.
Siebold, G. L. (1992). Research confirms importance of the "human element" for unitpreparedness. ARI Newsletter, 20l), 3-4.
Siebold, G.L. (1994). The relation between soldier motivation, leadership, and small unitperformance. In H.F. O'Neil, Jr. & M. Drillings, (Eds.). Motivation: theoryand research. (pp. 171-190). Hillsdale, NJ. Lawrence Erlbaum,
91
Siebold, G.L., & Kelly, D.R. (1988). The imoact of cohesion on platoon performance at theJoint Readiness Training Center. Technical Report 812. Alexandria, VA: U.S. ArmyResearch Institute for the Behavioral and Social Sciences.
Siebold, G.L., & Lindsay, T.I. (1991). Correlations among ratings of platoon performance.Proceedings of the 33rd Annual Conference of the Military Testing Association, U.S.Air Force Armstrong Research Laboratory, San Antonio, TX, 67-72.
Taylor, W. (1999, June 7). Private correspondence.
Tesluck, P.E., Zaccaro, S.J., Marks, M., & Mathieu, J. (1997). Task and aggregation issuesin the analysis and assessment of team performance. In M. Brannick & E. Salas(eds.), Assessment and measurement of team performance: Theory research andapplications. (pp. 197-224). Greenwich, CT: JAI Press.
Tremble,T.R.,& Alderks,C.E. (1991). Measures for research on small unit Preparedness forcombat effectiveness (Research Note). Alexandria VA: U.S. Army Research Institutefor the Behavioral and Social Sciences.
Ulmer, W.F. (1998). A bridge too far. Parameter
Waldman, D.A., Bass, B.M., & Yammarino, F.J. (1990). Adding to contingent-rewardbehavior: The augmenting effect of charismatic leadership. Group & OrganizationalStudies, 15, 381-394.
Weber, M. (1947). The theory of social organizations. (T. Parsons, Trans). NY: The FreePress.
Yammarino, F.J., & Bass, B.M. (1990). Long-term forecasting of transformational leadershipand its effects among Naval officers: Some preliminary findings. In Clark, K.E. & Clark,M.R. (Eds.), Measures of leadership, (pp. 151-169). Greensboro, NC: Center forCreative Leadership. West Orange, NY: Leadership Library of America.
Yokochi, N. (1989). Leadership styles of Japanese business executives and managers:Transformational and transactional. Doctoral Dissertation, United States InternationalUniversity, CA.
Zakay, E. (1995, May). The school for leadership development. Introductory Notes. IsraeliDefence Forces.
92
APPENDIX A
Survey Measures and JRTC Scorecard
A-1
TEAM MULTIFACTOR LEADERSHIP QUESTIONNAIREby Bernard M. Bass and Bruce J. Avolio P ATOON
DIRECTIONS:
The questionnaire makes it possible to describe the leadership behaviors that you see inyour Platoon.
Your marks will be combined with those of others to describe the Platoon. Your individualresponses will be kept confidential. Only the combined results for the unit will bereported, and they will not be reported by unit designation. Your completion of thesurvey constitutes voluntary participation.
0 First, fill in all the boxes above to indicate your Platoon, Company,Battalion, and today's date. Do not put your own name or ID anywhereon this form.
* Following are descriptive statements about the Platoon. Starting withquestion 1, decide how frequently each statement fits the behavior of thePlatoon you are describing and mark your answers in the correspondingcircle.
* Use a pencil and fill the circle completely. If you wish to change aresponse, erase your first mark completely.
0 If you are unsure or do not know the answer, leave that answer blank.
0 Use the scale below for your responses.01234
* EXAMPLE: The Platoon engages in training exercises. O000
The answer marked in this example was "3" indicatingthat the Platoon engages in training exercises 'fairlyoften."
0 12 3 4
Not at all Onice in a wh~ile Sometimes Faiuly Often Frequently, if niot always
Copyright 1996 by Bernard Bass and Bruce J. Avolio. All rights reserved.Distributed by Mind Garden Inc., P. 0. Box 60669, Palo Alto, CA 94306
0 1 2 3 4Not at all Once in a while Somefirnes Fairly often Frequently, if not awy
MEMBERS OF THE PLATOON... 01 23417 set high standards. 00 0 02. are proud to be associated with each other. 00 003 allow performance to fall below minimum standards before trying to make improvements. 0 0 004. emphasize the importance of being commited to our beliefs. 00 005. focus attention on mistakes, exceptions, and deviations from standards. 0 0 0 06. avoid getting into arguments. 00 007 clearly communicate what each member needs to do to complete assignments. 0 0 0 08. emphasize the value of questioning each other's ways to solve problems. 0 0 0 09. *avoid dealing with problems. 00 00
10. listen to each other's cocrs 00C 0011- delay tking action until problems become serious. 00 00
112. go beyond their own interests for the good of the platoon. 00 .0013. closely monitor each other's performance for errors. 00 00
I14 display conviction in the Army ethic and values. 00 0015. work out agreements about what's expected of each other. 00 0016. generate exciting future possibilities. 00 0017. motivate each other to do more than they thought they culd do. 00 0018. encourage each other to rethink ideas. 00 0019, fail to follow-up requests for assistance from each other. 00 0020. foc-us on developing each other's capabilities. 00 00
121. talk about what we've done wrong but not what we've done right 00 00 122. display extraordinary talent and competence. 00 0023. spend timedealing with immediate rse. 0,0 0024. clarify the core reasons for our existence and purpose as an Airny. 0 0 0 025. provide each other with assistance in exchange for each member's effort. 0 0 0 026. talk optimistically about the future. 00 0027. heighten our motivation to succeed. 00 0028. try fo find better ways to dothings. 0 0 0029. avoid making decisions. 00 0030. spend time teaching and coaching each other. 00 0031. wait until things have gonewrong before taking action. 00 00
1 32. behave in ways that build respectfor one another. 0o0 0 0133. track each other's mistakes. 00 00134. talk about how trusting each other can help overcome our difficulties. 00 0035. discuss the level of performance we expect from each other. 0 0 0036. talk enthusiastically about how we achieve our mission.,. 00 0037. encourage each other to do more than we expected we Could do. 00 0038. seek a broad range of views when solving problems. 00 0039. delay responding to urgent requests from each other. 00 0040. treat each other as individuals with different needs, abilities, and aspirations. 0 0 0 0
141. show we are firm believers in "if it ain't broke, don't fix it."00 0I42. display confidence in each other. 00 00143 direct attention toward failure to meet standards. 00 0044. emphasize the importance of having a collective sense of mission.00 0045. recognize member and/or Platoon accomplishments. 00 0046. provide each other with a positive view of the future. 00 0047. look at problems fom many different angles. 00 0048. help each other learn new skills. 00 0049. have confidence in each other. 00 00So. expectto bea high performance Platoon. 00 0051. can solve problems we encounter. 00 00152. canface unexpected problems and handle them. 0o 00
153. work hard to fulfill the Platoon's responsibilities. 00 00THE PLATOON LEADER, PLATOON SERGEANT, AND SQUAD LEADERS...54. pull together to get the job done. 00 0055 respect each other. 00 0056. trust each other. 00 0 057. display leadership collectively that is satisfactory. 00 00
58. In my view, the overall effectiveness of the platoon is... -D( 10G0 1 2 3 4
not effective only slightly effective effective very effective extremely effective ansm~r hwer
1 2 3 45ansver hereSq~uad Member Fire Team Leader Souad Leader Platoon Sergeant 1 st Se. geant. XO. or COor Platoon Leader
6C0. My military grade is El. E2, EU.... 01, 02. 03... (Wile in grao~k) ____ Grade61. How many months have you been in the Platoon? (Wfite in) ______Months
MULTIFACTOR LEADERSHIP QUESTIONNAIREby Bernard M. Bass and Bruce J. Avolio PLATOON SERGEANT
DIRECTIONS:
The questionnaire makes it possible for you to describe the leadership behavior of thePlatoon Sergeant you are describing.
Your marks will be combined with those of several others to describe the Platoon Sergeant'sbehavior. Your individual responses will be kept confidential. Only the combinedresults for the unit will be reported, and they will not be reported by unit designation.Your completion of the survey constitutes voluntary consent to participate.
"* First, fill in all the boxes above to indicate the Platoon, Company, andBattalion of the Platoon Sergeant you are describing, and today's date.Do not put your own name or ID anywhere on this form.
"* Following are statements which you will use to describe the PlatoonSergeant's behavior. Starting with question 1, decide how frequentlyeach statement fits the behavior of the Platoon Sergeant you aredescribing and mark your answers in the corresponding circle.
"* Use a pencil and fill the circle completely. If you wish to change aresponse, erase your first mark completely.
"* If you are unsure or do not know the answer, leave that answer blank.
"* Use the scale below for your responses.01234
"* EXAMPLE: The Platoon Sergeant engages in athletics. 0 0 000
The answer marked in this example was "3" indicating thatthe Platoon Sergeant engages in athletics "fairly often."
0 12 3 4
Nat at all Once in a while Somnetimies Fairly Often Frequently, if not always
Copyright 1996 by Bernard Bass and Bruce J. Avolio. All rights reserved.Distributed by Mind Garden Inc., P. 0. Box 60669, Palo Alto, CA 94306
MULTIFACTOR LEADERSHIP QUESTIONNAIRE
by Bernard M. Bass and Bruce J. Avolio PLATOON SERGEANT0 1 2 3 4
Not at all Once in a while Sometimes Fairly often Frequently, if not always
THE PLATOON SERGEANT I AM DESCRIBING... 0 1 2341. seeks different points of view when solving problems. 00 002. expresses confidence that goals will be achieved.. 00 003. fails to take action until problems become serious. 0 0 004. tries to catch you making mistakes. 0 0 005. avoids getting involved when important issues arise. 00 006. talks about the importance of Army ethic and values. 0 0 007. is absent when needed. 00 008. rewards us when we do what we are supposed to do. 00 009. talks optimistically about the future. 0 0 00
10. makes us proud to be associated with him. 00 00F 11. states who is responsible for getting the job done. 0 0 0012. waits for things to go wrong before taking action. 00 0013. sets high standards. 0 0014. specifies the importance of having a strong sense of purpose. 0 0 0015. spends time teaching and coaching Platoon members. 00 0016. makes clear exactly what Platoon members will get if performance goals are met. 00 0017. dwells on what I have done wrong. 0 0018. goes beyond self-interest for the good of the Platoon. 0 0 0019. treats each Platoon member as an individual. 0 0020. avoids trying to make improvements until performance falls below minimum standards. 0 0 0021. acts in ways that build respect. 0 0 0O22. looks for reasons to make on-the-spot inspections. 0 0 0023 makes moral and ethical decisions based on high standards. 0 0 0 024 keeps track of all mistakes. 00 0O25. displays a sense of authority and confidence. 0 0 0026. talks enthusiastically about what needs to be accomplished. 0 0 0 027 directs attention toward failures to meet standards. 00 0028. avoids making decisions. 00 0029. considers that you have different needs, abilities, and aspirations from others. 0 0 0 030. gets you to look at problems from many different angles. 0 0 0031. helps Platoon members to develop their strengths. 0 0 0032. suggests new ways of looking at how to complete assignments. 00 0033. delays responding to urgent problems. 0 0 0034. emphasizes the importance of having a collective sense of mission. 00 0035. lets Platoon members know when they have met expectations. .0 0 0036. reviews basic assumptions about the way we do things to see if they are appropriate. 0 0 0 037. is effective in helping Platoon members get their jobs done. 0 0 0038. uses methods of leadership that are satisfactory. 00 0039. gets youtodo more than you expectedtodo. - 00 0040. is effective in representing your Platoon to higher authority. 0 0 041. works with you in a satisfactory way. 0000142. heightens your desire to succeed. 0 0 00
43. is effective in meeting organizational requirements. 00 0044. increases your willingness to try harder. 00 0045. leads a group that is effective. 00 0046. tells us what we've done wrong rather than what we've done right. 00 00
47. My position is... (Select one ansmcr ory) D 0 D 0 01 2 3 4 5 answer here
Squad Member Fire Team Leader Squad Leader Platoon Sergeant or 1st Sgt, XO, or COPlatoon Leader
48. My military grade is: El, E2, E3... 01, 02, 03... (Write in grade) Grade
49. How many months have you observed the Platoon Sergeant in his current Monthsposition? (Write in the rurbner of onoths)
Copyright 1996 by Bernard Bass and Bruce J. Avolio. Ail rights reserved.Distributed by Mind Garden Inc., P. 0. Box 60669, Palo Alto, CA 94306
MULTiFACTOR LEADERSHIP QUESTIONNAIREby Bernard M. Bass and Bruce J. AvoliPLATOON LEADER
DIRECTIONS:
The questionnaire makes it possible for you to describe the leadership behavior of thePlatoon Leader you are describing.
Your marks will be combined with those of several others to describe the Platoon Leader'sbehavior. Your individual responses will be kept confidential. Only the combinedresults for the unit will be reported, and they will not be reported by unit designation.Your completion of the survey constitutes voluntary participation.
" First, fill in all the boxes above to indicate the Platoon, Company, and Battalionof the Platoon Leader you are describing, and today's date. Do not put yourown name or ID anywhere on this form.
" Following are statements which you will use to describe the Platoon Leader'sbehavior. Starting with question 1, decide how frequently each statement fitsthe behavior of the Platoon Leader you are describing and mark youranswers in the corresponding circle.
" Use a pencil and fill the circle completely. If you wish to change a response,erase your first mark completely.
"* If you are unsure or do not know the answer, leave that answer blank.
"* Use the scale below for your responses.01234
"* EXAMPLE: The Platoon Leader engages in athletics. 0 0 0 0O
The answer marked in this example was "3" indicatingthat the Platoon Leader engages in athletics "fairly often."
0 1 2 3 4
Not at all Once in a while Sometimes Fairly Often Frequently, if not always
Copyright 1996 by Bernard Bass and Bruce J. Avolio. All rights reserved.Distributed by Mnd Garden Inc.. P. 0. Box 60669, Palo Alto, CA 94306
MUL71FACTOR LEADERSHIP QUESTIONNAIRE
by Bernard M. Bass and Bruce J. Avolio PLATOO0N LEADER
0 1 2 3 4
Not at all Once in a M~ile Sometimes Fairly Often Frequently, if not always
THE PLATOON LEADER I AM DESCRIBING... 01 2341 . seeks different points of view when solving problems. 00 002. expresses confidence that goals will be achieved. 00 003. fails to take action until problems become serious. 00 004. focuses attention on mistakes, exceptions, and deviations from standards. 0 0 0 05. avoids getting involved when important issues arise. 0 0 0o6. talks about the importance of the Army ethic and values. 0 0 0 0
47. is absent when needed. 00 008. rewards us when we do what we are supposed to do. 00 009. talks optimistically about the future. 00 00
10. makes us proud to be associated with him.00 0
17. showes thato is aesofirmbeliever gting itanth jbroe done t fix it018. goets beondself-inteo rest bforte goofthein Plactoon.00 0
19. treats tie tecigadoachin Platoon members as anidviul
20. avoids trying to make improvements until performance falls below minimum standards. 0 0 0 021. acts in ways that build respect.0 022. concentrates his full attention on dealing Viith mistakes, complaints, and failures.00 023. makes moral and ethical decisions based on high standards.00 024. keeps track of all mistakes.00 025. displays a sense of authority and confidence.00 026. talks enthusiastically about what needs to be accomplished.00 027. directs attention toward failures to meet standards. 00 028. avoids making decisions.00 029. considers that you have different needs, abilities, and aspirations from others. 030. gets you to look at problems from many different angles.00 031. helps Platoon members to develop their strengths.00 032. suggests new ways of looking at how to complete assignments.00 033. delays responding to urgent problems.00 034. emphasizes the importance of having a collective sense of mission.00 035. lets Platoon members know when they have met expectations.00 036. reviews basic assumptions about the way we do things to see if they are appropriate.00 037. is effective in helping Platoon members get their jobs done.00 038. uses methods of leadership that are satisfactory.00 039. gets you to do more than you expected to do. .0 040. is effective in representing your Platoon to higher authority.00 041. works with you in a satisfactory way.00 042. heightens your desire to succeed.00 043. is effective in meeting organizational requirements.00 044. increases your willingness to try harder.00 045. leads a group that is effective.00 046. tells us what we've done wrong rather than what we've done right. 0OJ
47. My position is... (Sele one ansirmwono D0 (1 2 3 4 5
Squad Member Fire Team Leader Squad Leader Platoon Sergeant or I1st Sgt, XO, or COPlatoon Leader
48. My military grade is: El, E2, E3... 0 1, 02, 03... (Wrte in grad) _ ___Grade
49. How many months have you observed the Platoon Leader in his current position? Months(WMite in the nuntbeirctnrmoths)
Copyright 1996 by Bernard Bass and Bruce J. Avciio. AJI rights reserved.Distributed by Mind Garden Inc., P. 0. Box 60669, Palo ~AJto, CA 94306
TEAM MULTIFACTOR LEADERSHIP QUESTIONNAIREby Bernard M. Bass and Bruce J. Avolio COMPANY
DIRECTIONS:
The questionnaire makes it possible to describe the leadership behaviors that you see in yourCompany.
Your marks will be combined with those of others to describe the Company. Your individualresponses will be kept confidential. Only the combined results for the unit will bereported, and they will not be reported by unit designation. Your completion of the surveyconstitutes voluntary participation.
* First, fill in all the boxes above to indicate your Platoon, Company, Battalion,and today's date. Do not put your own name or ID anywhere on thisform.
9 Following are descriptive statements about the Company. Starting withquestion 1, decide how frequently each statement fits the behavior ofyour Company and mark your answers in the corresponding circle.
* Use a pencil and fill the circle completely. If you wish to change aresponse, erase your first mark completely.
* If you are unsure or do not know the answer, leave that answer blank.
* Use the scale below for your responses.
01234EXAMPLE: The Company engages in training exercises. 0 0 000
The answer marked in this example was "3' indicatingthat the Company engages in training exercises "fairlyoften."
0 1 2 3 4Not at all Once in a while Sornefmes Fairly Often Frequently, if not always
FINAL
Product Code MLOTC-MLO Team Military/Male/Company Form, Revised 9/11197.
Copyright 1996 by Bernard Bass and Bruce J. Avolio. All rights reserved.Distributed by Mind Garden Inc., P.O. Box 60669, Palo Alto, CA 94306
Not at all Once in a while Sometimes Fairly often Frequently, if not always
MEMBERS OF THE COPAY. 0 12 341 . set high standards. 00 002. are proud to be associated with each other. 00 003. allow performance to fall below minimum standards before trying to make improvements. 0 0 0 04. emphasize the importance of being commited to our beliefs. 00 005. try to catch each other making mistakes. 00 006o. motivate each other to do more than they thought they could do. 00 007. clearly communicate what each member needs to do to complete assignments. 0 0 0 08. emphasize the value of questioning each other's ways to solve problems. 0 0 0 09. avoid dealing wvith problems. 00 00
10. listen to each other's concerns. 00 0011. delay taking action until problems become serious. 00 0012. go beyond their own self-interests for the good of the Company. 00 0013. closely monitor each other's performance for errors. 00 0014. display conviction in the Amy ethic and values. 00 0015. work outagreements aboutwhat'sexpeced of each other. 00 0016. generate exciting future possibilities. 00 0017. dwell on what has been done wrong. 00 0018. encourage each other to rethink ideas.00 019. fail to follow-up requests for assistance from each other. 00 0020. focus on developing each other's capabilities. 00 0021. talk about what we've done wrong rather than what we've done right. 0 0 0 022. display extraordinary talent and competence. 00 0023. spend time dealing with immediate crises. 00 0024. clarify the core reasons for our existence and purpose as an Army. 0 0 0 025. provide each other with assistance in exchange for each member's effort. 0 0 0 026. talk optimistically about the future. 00 00~27. heighten our motivation to succe. 00 0028. tryto fnd better ways to dothings. 00 0029. avoid making decisions. 00 0030. spend time teaching and coaching each other.00 0
36. walk entithuiagstial habou howe weoachievoe ourin mission.0 037. bencuage enach otherto doilmorespc thanwe expethed. we colddo33. sbeektaebroads randrgeuof tiews wihen t s lolving p orobems. tos.00 039. delays rheespndn tof uefrgent e r equests c from each other.00 0
40. treat each other as individuals with different needs, abilities, and aspirations. 00 041. ciosely monitor each other to assure that no mistakes are made.00 042. display confidence in each other.0 043. focus on failures.00 044. emphasize the importance of having a collective sense of mission.00 045. recognize member and/or Comnpany accomplishments.00 046, provide each other with a positive view of the future.00 047. look at problem~s fromn many different angles.00 048. help each other learn new skills.00 049. have confidence in each other.00 050. expect to be a high performance Company.00 0
THE OFFICERS AND NCO's OF THE COMPANY AND PLATOONS...54. pull together to get the job done.00 055. respect each other.00 056. trust each other.00 057. display leadership collectively that is satisfactory.00 058. In my view, the overall effectiveness of the Company is...
0 1 2 3 4 answ~er herenot effective only slightly effective effective very effective extremely effective
59. My position is..(ee one ansvwe oily) DD0001 2 3 4 5 nvehmSquad Member Fire Teamn Squad Leader Platoon Sergeant 1 st Sergeant. XO, or CO
Leader or Platoon Leader
60. My military grade is El, E2, E3, ... 01, 02, 03... (Write in grade) Grade61. How many months have you been in the Company? (Write in) Months
0) 0 w
0
0 '0CO 0 0V
2 0 bi 0 o
OIZ 1 0 t mIr I.cc Im 0CD > 0 - .c c , t= 7- E E2 C5~ 0
E 0 CDD ZC CUE W ~ ~ C ~< ' ' I 2 -0oo o~ cc C-
J02 -. 2 2CZ - r
D Z0 "S CL) w-5~ E j, :E 5- E co. Ca* C0CO
(D 4PCE E r= ED E Z 0 ý F
00 > ~ = 0 0 -0 0j Z)- W o~~c 0~ - CC W C O OD CD =r--. 0 .0 N-, 0~ caL EW .J 0 CM 00 - L
ou- -0 ~ c- 'o E >zI;
L 0- Nrr - 0-O CD I**-u. E Oj o0 Ca 2 G
co V _ O LE 8~ 2c a)<< c.0 E: -C cua Z i L0-0 r- ** ) 0 U--
-Cl Cý -, z0< : a
(U r, ~~C6 ~ -E -LLJ w0.0~ 0 -1 (1) CO-mEE => E a
0. E Z. z C C 00 z- _
CO~ 00 -D - -co) 0. 0
~ 0-0
C-3 ~CC Z< :~0 -5 car ~ ~
o ID W -ID.~~~U 000 ~0C _0 C3 oD
Cb a. CD.)
AL. D C < CO)~Q O & cuDC LL C
APPENDIX B1
Glossary of military terms and abbreviations.
Individual and Organizational Abbreviations & TermsBDE: Brigade-a tactical headquarters controlling two or more battalions;BN: Battalion-a light infantry organization including 3 rifle companies;CO: Company; a light infantry or airborne / airmobile unit including 3 rifle platoons; alsoCO: Commanding officer, usually the company commander, a captain, grade 03XO: Executive officer, second in command of the company, usually a first lieutenant, grade
02;1 SG: First sergeant, senior enlisted member of the company, usually grade E8--;EM: Enlisted members, soldiers in grade El-E4NCO: Noncommissioned officer, soldiers in grade E5-E9;PLT: Platoon, a light infantry unit of 2 or 3 rifle squads and a weapons squad;PL: Platoon leader, usually a 2d Lt. grade 01;PSG: Platoon sergeant-the senior NCO in the PLT. usually grade E7;SL: Squad leader, grade E5-E6;SOD: Rifle or weapons squad-a light infantry unit of 7-10 soldiers armed with rifles,
machine guns, or grenade launchers, usually organized into two fire teams: Alpha andBravo.
TL: Fire team leader, E4 or E5 member of an infantry squad who leads a fire team of 4 or5 EM.
O/C Observer / controllers; evaluated SOD and PLT performance at JRTC or NTC; E7 &03;
Technical and Tactical Abbreviations & TermsAAR: After action review.ARTEP 7-8: Army training and evaluation plan for infantry platoons-a doctrinal publication.AT Weapons: anti-tank weapons.C of C: Chain of commandc2 Command and Control;C3 Command, Control, and Communications;CAS EVAC: Casualty evacuation;CCP: No code available; Rec id#s: 2-1047.CDR: CommanderCFV: Cavalry fighting vehicle.COA: Courses of actions-alternatives considered by PL or CO in making an estimate of the
situation.CSS: Combat service support; activities related to personnel services, transportation, and
logistics.CTC: Combat training centers; JRTC and NTC were locations for this data collection.CLASS I: Supplies of foodCLASS Ih: Supplies of equipment;CLASS II: Supplies of fuel; sometimes called POL;CLASS IV: Supplies of barrier materials / barbed wire;
'R- 1
APPENDIX BI - continued
CLASS V: Supplies of ammunitionCombat Multiplier anything that achieves tactical synergy, especially well integratedsupporting arms and services, e.g.: defensive barriers covered by pre-planned artillery, etc.Estimate of the Situation: a structured thought process undertaken by leaders and their staffin preparing an operations order (OPORD) or plan (OPLAN).EA development: No code available; Rec id#s: 2-1039, 2-1041.EM: Enlisted members. Soldiers in the grade E-1 (Private) through E-4 (Specialist orCorporal)EPW: Evacuation of prisoners of war-procedures for their segregation, security, andevacuation;FRAGO: Fragmentary order; supplementary tactical instructions amending or alteringOPORD or implementing an OPLANJRTC: Joint Readiness Training Center;M-60: a 7.62 mm machine gun.MILES: Multiple integrated laser engagement system;MDMP: No code available; Record ID # 3-0051MOUT: Military operations in urban terrain / fighting in buildings;NAV: Navigation / also map reading, terrain orientation, finding one's way.NBC: Nuclear, biological, and chemical warfare equipment and/or procedures;NOD: Night observation device.NTC: National Training Center.NVG Night vision goggles; (a specific type of NOD used by individuals)OPORD: Operations order-written or verbal instructions for tactical operations in a pre-setformat;OPLAN: Operations plan-same as OPORD, but includes specified assumptions andrequires a separate order or FRAGO for execution. Issued to facilitate contingency planningand rehearsal.PCC/PCI: Pre-combat checks / pre-combat inspections-EM "check" equipment; NCOs"inspect"POL: Petroleum, oil, and lubricants; also called CLASS IIIR&S: Reconnaissance and security-patrolling and other measures to defend againstsurprise attack.RTO: Radio / telephone operatorSOP: Standard operating procedures-pre-set instructions for performing routine tasks tostandard.TDMP: Procedures. No code available; Rec ID: 3-0022.TLP: Troop leading procedures-a check-list of time-sensitive actions to be completed in aspecified sequence by small-unit leaders preparing for tactical operations.;TTPs: No code available; rec id#2-1076; 3-0083.WPNs Weapons
B-2
APPENDIX B32
Attributes / Topics, Codes, Definitions, and Tentat ive Classification for
Text Analysis of O/C and Cadre Comments
Class Attribute ITopic Code Meaning(Tentative)
Do Accountability Account - Keeping track of equipment, supplies, and personnel.Be Aggressive Aggress * Assertive, bold, or forceful pursuit of the missionI
enemy.Be Alert Alert * Vigilantly attentive; watchful, perceptive.Do Care Care * Demonstrated concern for the soldier's wellbeing.Be Dedicated Dedicat * To commit oneself to a particular course of thought or
action in accordance with Army values.Be Discipline Discip - Duty performance adhering to military code, orders,
doctrine, rules, regulations, or standard operatingprocedures--especially when soldiers are unsupervisedby off icials from their chain of command
Be Endurance Endurance - Physical and mental capacity for sustained effort overtime; effective continuance in spite of fatigue.
Be Fitness Fitness * Demonstrated strength and physical conditioning of thehuman body.
Be Honesty Honesty - Truthfulness in word and deed.Do Initiative Initiative - Actions taken to understand, identify, and complete the
implied tasks in any give situation or circumstance.Be Learning Learn * Indications of improvement based on experienceBe Patience Patience * Ability to sustain readiness over a longer period than
expected without compromising security.Be Persistance Persist - Never giving up while still having the means to carry
on.Do Poise Poise - A state of military bearing, balance or equilibrium;
stability.Be Stamina Stamina * Physical endurance.Be Toughness Tough * Physically hardy; rugged.Do Attitude Attitude * A state of mind, feeling, or disposition.Be Awareness Aware * Watchful, attentive, perceptive.Do Cohesion Cohes * Indications that platoon members have formed
themselves into a trusting, orderly unit, with implicitunderstandings about platoon values, purpose, andoperations.
Be Morale Morale *The state of mind and spirit of a person or unit asexhibited by confidence, cheerfulness, or willingness toperform assigned tasks.
Be Motivation - Any behavior signaling enthusiasm for anythingMotiva related to unit, mission, or the Army. (E.g.: unit or
group cheer, "Hoo Ah! ")Be Willing Willing * Acting or ready to act gladly; eagerly compliant.Know Communication Communicat * Human process of giving, receiving, and
understanding information, reports, plans, and orders
B-3
both within the platoon and betwee n the platoon andthe company, through verbal, written, or electronicmeans. (Not primarily about communicationsequipment.)
Do CASEVAC CASEVAC *Prompt removal of wounded soldiers from thebattlefield for treatment (casualty evacuation)
Do Confidence Confidence - The display of a feeling of assurance, especially ofself-assurance
Do Control Control 9 Demonstrated ability to manage or direct.Do Coordination Coord * Actions taken to insure harmonious interaction
between the platoon and adjacent platoons andsupporting units.
Do Decisiveness Decisiveness * Characterized by decision and firmness; resolute.Do Delegation Delegation 9 Actions entrusting subordinates with specific
responsibilities for mission or task accomplishment.Do Experience Experience * Time in the duty position to which now assigned.Do Flexibility Flexibility * Mental agility; open-minded consideration of practical
alternatives for achieving goals.Do Garrison Activities Garrison ActivitiesDo Improvement Improvement LearningBe Judgment Judgment * The demonstrated capacity to assess situations or
circumstances and draw sound conclusions; goodsense.
Know Knowledge Know * Understanding of tactical and technical subjectsregarding platoon operations.
Do Leadership Leadership - Comments using the word "leader" or "leadership" todescribe the supervisory behavior or skills of the PL,PSG, SL or TL.
Do Listen Listen * That part of communication having to do with hearingand understanding what another person is saying orimplying.
Do Maintenance Maint * Actions by soldiers to keep equipment in workingorder
Do Marksmanship Marksmanship * Ability to "hit"s targets with simulated rifle fire using themultiple integrated laser engagement system (MILES).
Know Navigation Nay Finding the way across terrain using a map, compass,and other means.
Do NOD Use NOD Use - Effective employment of night observation devicesincluding starlight scopes, night vision goggles, andsimilar devices.
Do Obstacle Obstacle *Construction of physical impediments to tacticalemployment ,mployment movement such as barbed wire, mines, and ditches,
and their effective integration into an overall plan--usually in platoon defensive operations.
Know OPORD OPORD * Operations Order: written or verbal instructions fortactical employment of military units in a preset format;OPLAN Operations Plan; same as OPORD but includesspecified assumptions and requires a separatefragmentary order (FRAGO) for execution.
Do PCI /PCC PCI * Pre Combat Inspections. Inspections performed bysquad and team leaders prior to tactical operations toinsure that all pre combat checks (PCC) are completedby squad members and all personnel and equipmentare ready for the mission as specified.
B-4
Do POW POW *Prisoner of War processing. Handling enemy soldierswhom have surrendered or been captured in combat.
Know Priorities Priorities * Demonstrated sense of the relative importance andtimeliness of the various tasks to be performed.
Know Proficiency Proficiency - Competence.Do Reconnaissance Recon 9 An inspection or exploration of an area to gather
military information.
Do Resupply Resupply *Providing replenishment of food, fuel, ammunition,clothing and other equipment to the platoon.
Do Security Security * Saf ety or protection f rom discovery or surprise by theenemy.
Do Skills, Collective Skills, *Military tasks to be performed to a specified standardCollective by a soldier as part of a crew, team, squad or platoon.
Know Skills, Individual Skills, 9 Military tasks to be performed to a specified standardIndividual by a soldier alone.
Know Standards Standard * Performance of tasks to an established minimumexpectation.
Do Supervision Supervise o The act of overseeing activities duringimplementation.
Know Terrain, Use of Terrain, Use * Positioning of soldiers and weapons on the ground soOf as to achieve a tactical advantage.
Do Time management Time a Effective implementation of troop leading proceduresmanagement to fit the time available.
Know TLP TLP * Troop Leading Procedures--a check-list of time-sensitive actions to be accomplished in a specifiedsequence by small unit leaders preparing for tacticaloperations.
Know Planning Plan * Working out a scheme, program, or methodbeforehand to accomplishment an objective; themental process of preparing or implementing thedetails in an OPORD or OPLAN.
Do Mission Mission * Achieving a tactical end state specified by higherAccomplishment authority by a military unit at a given place and time.
Do Rehearsal Rehearsal - Practicing all or part of an operations plan or orderahead of the time specified for actual implementation.
Do Teamwork Teamwork - Cooperative effort by members of the unit to achievea common goal.
Know SOP SOP * Standard Operating Procedures. Standinginstructions for the conduct of certain routine activitiesto specified unit standards.
Uncla Strength: Strength: * Numbers of assigned personnel relative to the total;sif ied numbers authorizes by Army organizational documents.
B-5
APPENDIX C
Charts & Graphs
Overview
In this Appendix, we provide a series of charts that can be used for pres entations togroups, who do not have advanced statistical background. The charts presented here providea general overview of our findings in terms of predicting JRTC performance, self-other ratingsand general trends with the data.
Charts la-i1c
Provide self-other rating differences for the Platoon leader for Above, Peer, and Belowratings. These charts demonstrate that there were greater discrepancies between self-otherratings, as one moves from comparisons with Above to Peer to Below ratings.
Charts 2a - 2c
Provides self-other rating differences for the Platoon Sergeant for Above, Peer andBelow ratings. These charts demonstrate that there were greater discrepancies between self-other ratings as one moves from comparisons with Above to Peer to Below ratings parallelingfindings with Platoon Leaders.
Charts 3a - 3c
Compares the top and bottom 12 platoons on the 6 leadership scales as rated by theabove peer and below raters demonstrating that the top platoon leaders were evaluated asmore transformational, and active transactional if they were in the top performing platoons.
Charts 4a - 4c
Compares the top and bottom 12 platoons on the 6 leadership scales for PlatoonSergeants, as rated by the Above, Peer and Below raters. Paralleling the findings for Platoonleaders. Sergeants who were more transformational and transactional in their leadership ledthe top platoons.
r Charts 5a - 5b
Compares the top and bottom platoons based on ratings provided from Below andPeers on the TMLQ Survey. Both charts show that there are relatively minor differencesbetween the top and bottom JRTC platoons based on the TMLQ survey.
C-I
Chart 6
Presents self-other MLQ (combined rater groups) for the Platoon Leader andSergeant. The values in this chart represent the differences score for self-other ratings.Overall, the leaders in the top platoons tended to have lower differences in terms of their ownperceptions of leadership compared to the aggregated group of their raters.
Chart 7
Provides comparisons between Below and Peer evaluations of the Platoon's collectiveleadership and its Company culture. For the TMVLQ, Peers on average evaluated theirplatoons as more transformational, transactional and less avoidant than did those below.Results for company culture were more mixed. In comparison to those below, peers rated thecompany culture as more intellectually stimulating, more transactional and less avoidant.
c-2
Platoon LeaderMLO Self Ratings vs.Ratings From Above
0.00-
2.4.00
01350-
0000
~IL IS IC CR MA Pt.
Full Range of Leadershp Platoon Leader ito Self Ratings vs.Peerm Ratings
IL00 IS C CeMAPt
1.0
1.0
0.C-3
Platoon Sgt. Sel va Above
41OD
?-so- Self
1.00- kChaft 2a -2cIL IS IC CR MA PL
_______ ______Platoon Sgt.w mdv Pew
4.00-
1350
IL IS IC CR MA PL 4O - Pl t o Sg .S elf vs 9a Blo
3.00o250
iL iS ICCR MA Pt
CPOO
Chart 3a
Platoon Leader MLQ Ratings from Belowfor Top/Bottom Platoon JRTC