26
PLATTS 3 RD ANNUAL NGL CONFERENCE AND PETROCHEMICAL SEMINAR SEPTEMBER 2013
PLATTS 3RD ANNUAL NGL CONFERENCE AND PETROCHEMICAL SEMINAR SEPTEMBER 2013
Forward-Looking Statements
This presentation contains forward-looking statements and information. These forward-looking statements, which in many instances can be identified by words like “could,” “may,” “will,” “should,” “expects,” “plans,” “project,” “anticipates,” “believes,” “planned,” “proposed,” “potential,” and other comparable words, regarding future or contemplated results, performance, transactions, or events, are based on MarkWest Energy Partners, L.P. (“MarkWest” and the “Partnership”) current information, expectations and beliefs, concerning future developments and their potential effects on MarkWest. Although MarkWest believes that the expectations reflected in the forward-looking statements are reasonable, it can give no assurance that such expectations will prove to be correct, and actual results, performance, distributions, events or transactions could vary significantly from those expressed or implied in such statements and are subject to a number of uncertainties and risks.
Among the factors that could cause results to differ materially are those risks discussed in the periodic reports filed with the SEC, including MarkWest’s Annual Report on Form 10-K for the year ended December 31, 2012 and its Quarterly Report on Form 10-Q for the quarter ended June 30, 2013. You are urged to carefully review and consider the cautionary statements and other disclosures, including those under the heading “Risk Factors,” made in those documents. If any of the uncertainties or risks develop into actual events or occurrences, or if underlying assumptions prove incorrect, it could cause actual results to vary significantly from those expressed in the presentation, and MarkWest’s business, financial condition, or results of operations could be materially adversely affected. Key uncertainties and risks that may directly affect MarkWest’s performance, future growth, results of operations, and financial condition, include, but are not limited to:
— Fluctuations and volatility of natural gas, NGL products, and oil prices; — A reduction in natural gas or refinery off-gas production which MarkWest gathers, transports, processes, and/or fractionates; — A reduction in the demand for the products MarkWest produces and sells; — Financial credit risks / failure of customers to satisfy payment or other obligations under MarkWest’s contracts; — Effects of MarkWest’s debt and other financial obligations, access to capital, or its future financial or operational flexibility or liquidity; — Construction, procurement, and regulatory risks in our development projects; — Hurricanes, fires, and other natural and accidental events impacting MarkWest’s operations, and adequate insurance coverage; — Terrorist attacks directed at MarkWest facilities or related facilities; — Changes in and impacts of laws and regulations affecting MarkWest operations and risk management strategy; and — Failure to integrate recent or future acquisitions.
2
Non-GAAP Measures
Distributable Cash Flow, Adjusted EBITDA, and Net Operating Margin are not measures of performance calculated in accordance with GAAP, and should not be considered separately from or as a substitute for net income, income from operations, or cash flow as reflected in our financial statements. The GAAP measure most directly comparable to Distributable Cash Flow and Adjusted EBITDA is net income (loss). The GAAP measure most directly comparable to Net Operating Margin is income (loss) from operations. In general, we define DCF as net income (loss) adjusted for (i) depreciation, amortization, impairment, and other non-cash expense; (ii) amortization of deferred financing costs and discount; (iii) loss on redemption of debt net of current tax benefit; (iv) non-cash (earnings) loss from unconsolidated affiliates; (v) distributions from (contributions to) unconsolidated affiliates (net of affiliate growth capital expenditures); (vi) non-cash compensation expense; (vii) non-cash derivative activity; (viii) losses (gains) on the disposal of property, plant, and equipment (PP&E) and unconsolidated affiliates; (ix) provision for deferred income taxes; (x) cash adjustments for non-controlling interest in consolidated subsidiaries; (xi) revenue deferral adjustment; (xii) losses (gains) relating to other miscellaneous non-cash amounts affecting net income for the period; and (xiii) maintenance capital expenditures, net of joint venture partner contributions. We define Adjusted EBITDA as net income (loss) adjusted for (i) depreciation, amortization, impairment, and other non-cash expense; (ii) interest expense; (iii) amortization of deferred financing costs; (iv) loss on redemption of debt; (v) losses (gains) on the disposal of PP&E and unconsolidated affiliates; (vi) non-cash derivative activity; (vii) non-cash compensation expense; (viii) provision for income taxes; (ix) adjustments for cash flow from unconsolidated affiliates; (x) adjustment related to non-guarantor, consolidated subsidiaries; and (xi) losses (gains) relating to other miscellaneous non-cash amounts affecting net income for the period. We generally define Operating Income before Items Not Allocated to Segments as (i) revenue, excluding derivative gains and losses and adjusted for certain revenue deferral adjustments less; (ii) purchased product costs, excluding derivative gains and losses less; (iii) facility expenses, adjusted for certain non-cash items not allocated to segments and certain interest payments allocable to the segments less; ( iv) the portion allocable to non-controlling interests. Distributable Cash Flow is a financial performance measure used by management as a key component in the determination of cash distributions paid to unitholders. We believe distributable cash flow is an important financial measure for unitholders as an indicator of cash return on investment and to evaluate whether the Partnership is generating sufficient cash flow to support quarterly distributions. In addition, distributable cash flow is commonly used by the investment community because the market value of publicly traded partnerships is based, in part, on distributable cash flow and cash distributions paid to unitholders. Adjusted EBITDA is a financial performance measure used by management, industry analysts, investors, lenders, and rating agencies to assess the financial performance and operating results of the Partnership’s ongoing business operations. Additionally, we believe Adjusted EBITDA provides useful information to investors for trending, analyzing, and benchmarking our operating results from period to period as compared to other companies that may have different financing and capital structures. Net Operating Margin is a financial performance measure used by management and investors to evaluate the underlying baseline operating performance of our contractual arrangements. Management also uses Net Operating Margin to evaluate the Partnership’s financial performance for purposes of planning and forecasting. Please see the Appendix for reconciliations of Distributable Cash Flow, Adjusted EBITDA, and Net Operating Margin to the most directly comparable GAAP measure.
3
MarkWest: Focused on Growth
4
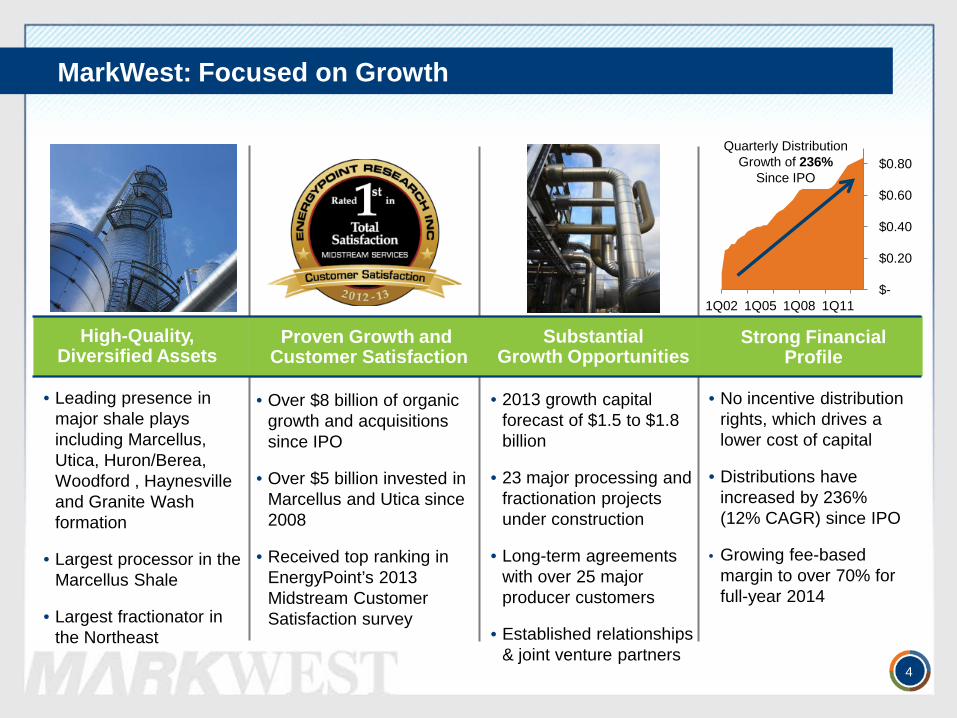
High-Quality, Diversified Assets
Proven Growth and Customer Satisfaction
Substantial Growth Opportunities
Strong Financial Profile
• Leading presence in major shale plays including Marcellus, Utica, Huron/Berea, Woodford , Haynesville and Granite Wash formation
• Largest processor in the Marcellus Shale
• Largest fractionator in the Northeast
• Over $8 billion of organic growth and acquisitions since IPO
• Over $5 billion invested in Marcellus and Utica since 2008
• Received top ranking in EnergyPoint’s 2013 Midstream Customer Satisfaction survey
• 2013 growth capital forecast of $1.5 to $1.8 billion
• 23 major processing and fractionation projects under construction
• Long-term agreements with over 25 major producer customers
• Established relationships & joint venture partners
• No incentive distribution rights, which drives a lower cost of capital
• Distributions have increased by 236% (12% CAGR) since IPO
• Growing fee-based margin to over 70% for full-year 2014
Quarterly Distribution Growth of 236%
Since IPO
$-
$0.20
$0.40
$0.60
$0.80
1Q02 1Q05 1Q08 1Q11
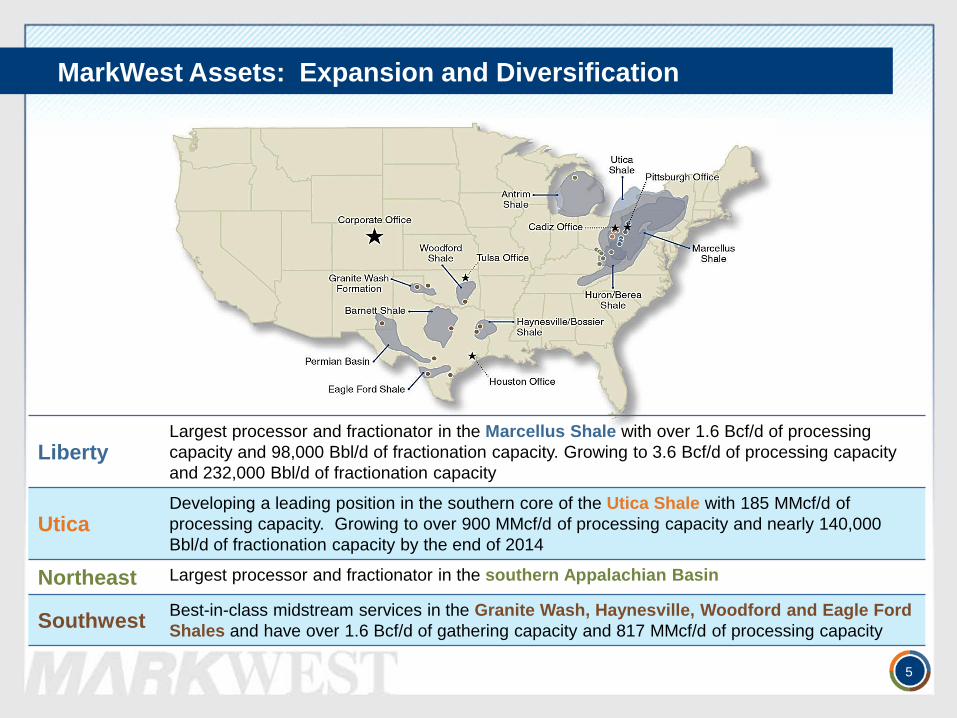
MarkWest Assets: Expansion and Diversification
5
Liberty Largest processor and fractionator in the Marcellus Shale with over 1.6 Bcf/d of processing capacity and 98,000 Bbl/d of fractionation capacity. Growing to 3.6 Bcf/d of processing capacity and 232,000 Bbl/d of fractionation capacity
Utica Developing a leading position in the southern core of the Utica Shale with 185 MMcf/d of processing capacity. Growing to over 900 MMcf/d of processing capacity and nearly 140,000 Bbl/d of fractionation capacity by the end of 2014
Northeast Largest processor and fractionator in the southern Appalachian Basin
Southwest Best-in-class midstream services in the Granite Wash, Haynesville, Woodford and Eagle Ford Shales and have over 1.6 Bcf/d of gathering capacity and 817 MMcf/d of processing capacity
Base Production (Conventional / Tight Sand)
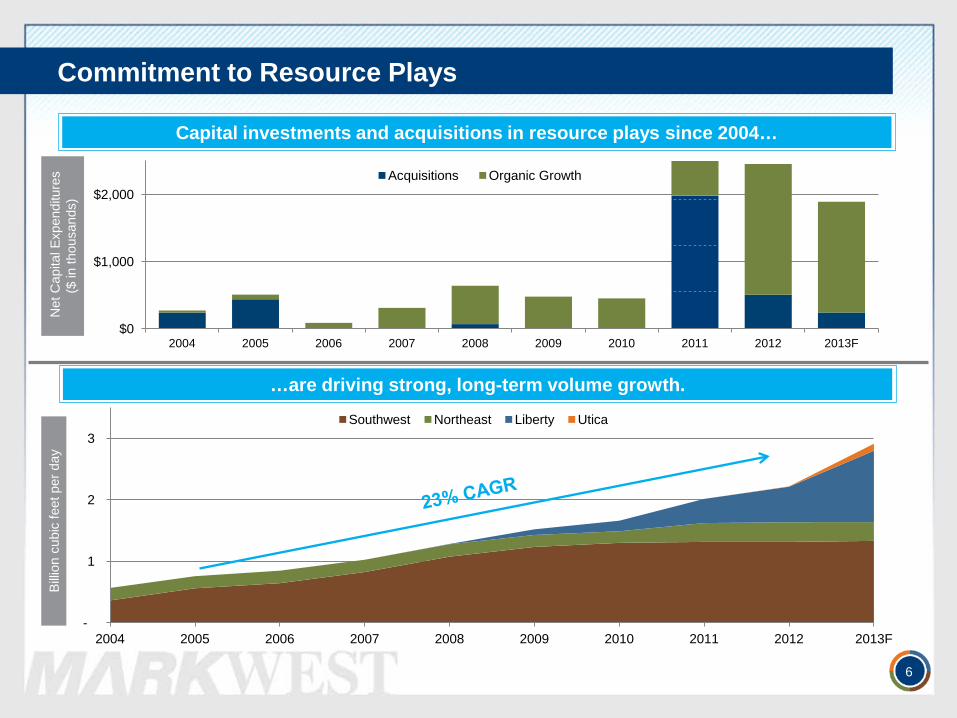
Commitment to Resource Plays
6
Net
Cap
ital E
xpen
ditu
res
($
in th
ousa
nds)
Bi
llion
cubi
c fe
et p
er d
ay
$0
$1,000
$2,000
2004 2005 2006 2007 2008 2009 2010 2011 2012 2013F
Acquisitions Organic Growth
Capital investments and acquisitions in resource plays since 2004…
…are driving strong, long-term volume growth.
-
1
2
3
2004 2005 2006 2007 2008 2009 2010 2011 2012 2013F
Southwest Northeast Liberty Utica
$0
$100
$200
$300
$400
$500
$600
2004 2005 2006 2007 2008 2009 2010 2011 2012
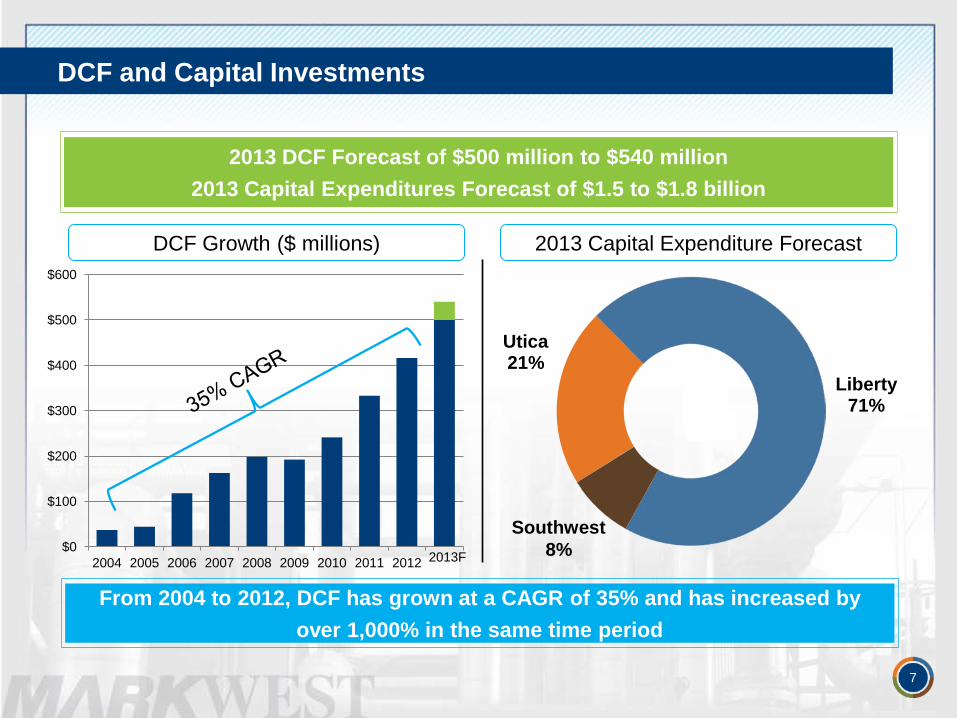
DCF and Capital Investments
7
Utica 21%
Liberty 71%
Southwest 8%
2013 Capital Expenditure Forecast DCF Growth ($ millions)
7
2013 DCF Forecast of $500 million to $540 million 2013 Capital Expenditures Forecast of $1.5 to $1.8 billion
From 2004 to 2012, DCF has grown at a CAGR of 35% and has increased by over 1,000% in the same time period
2013F
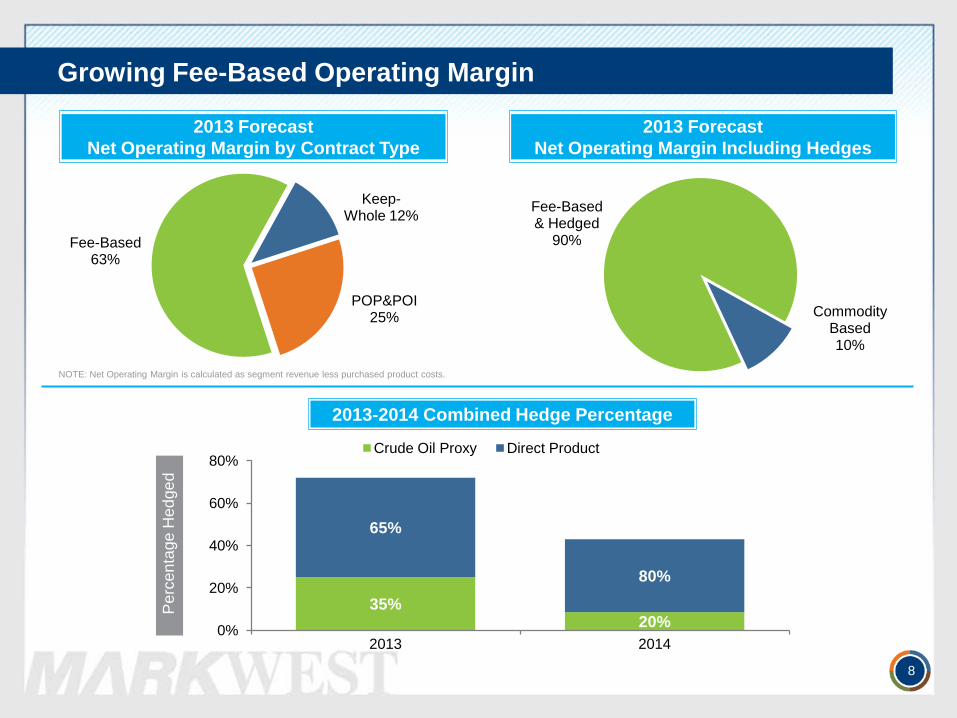
Growing Fee-Based Operating Margin
8
35% 20%
65%
80%
0%
20%
40%
60%
80%
2013 2014
Crude Oil Proxy Direct Product
Fee-Based 63%
Keep-Whole 12%
POP&POI 25%
NOTE: Net Operating Margin is calculated as segment revenue less purchased product costs.
Per
cent
age
Hed
ged
Fee-Based & Hedged
90%
Commodity Based 10%
2013-2014 Combined Hedge Percentage
2013 Forecast Net Operating Margin by Contract Type
2013 Forecast Net Operating Margin Including Hedges

Total Return Since 2009
9 Source: Bloomberg as of 8/30/13 (Cumulative Total Return, Net Dividends)
Tot
al R
etur
n (%
)
MarkWest Provides Superior Total Return
237%
100%
1,124%
0.0
2.0
4.0
6.0
8.0
Jan-07 Jan-08 Jan-09 Jan-10 Jan-11 Jan-12 Jan-13
Fayetteville
Is the Utica the Next Marcellus?
10
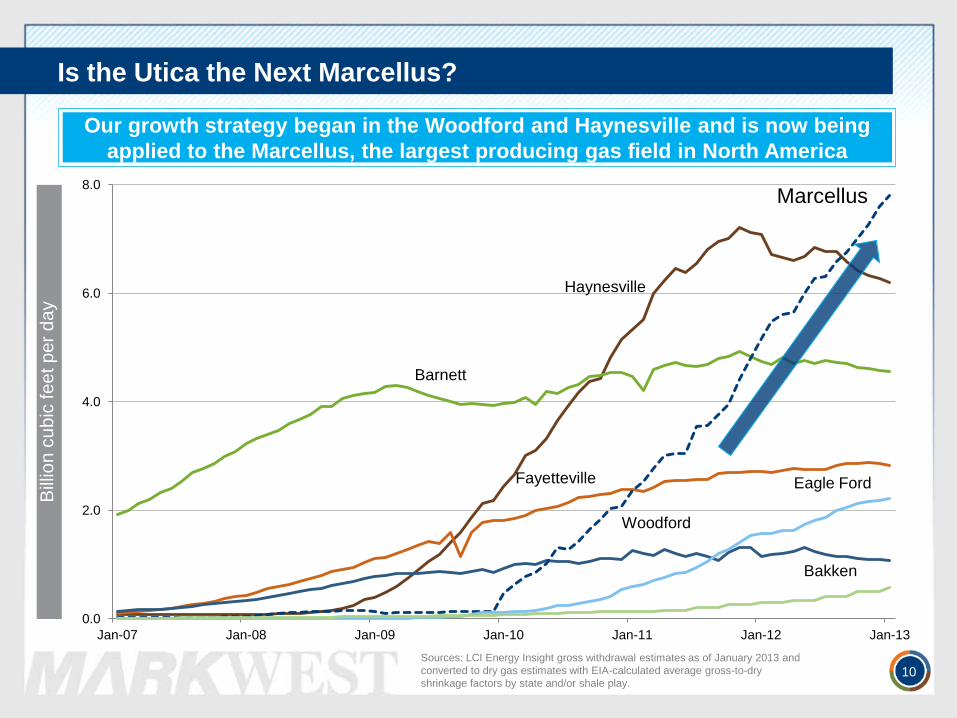
Our growth strategy began in the Woodford and Haynesville and is now being applied to the Marcellus, the largest producing gas field in North America
Barnett
Haynesville
Marcellus
Sources: LCI Energy Insight gross withdrawal estimates as of January 2013 and converted to dry gas estimates with EIA-calculated average gross-to-dry shrinkage factors by state and/or shale play.
Woodford
Eagle Ford
Bakken
Bill
ion
cubi
c fe
et p
er d
ay
11
0
500
1,000
1,500
2,000
2,500
3,000
3,500
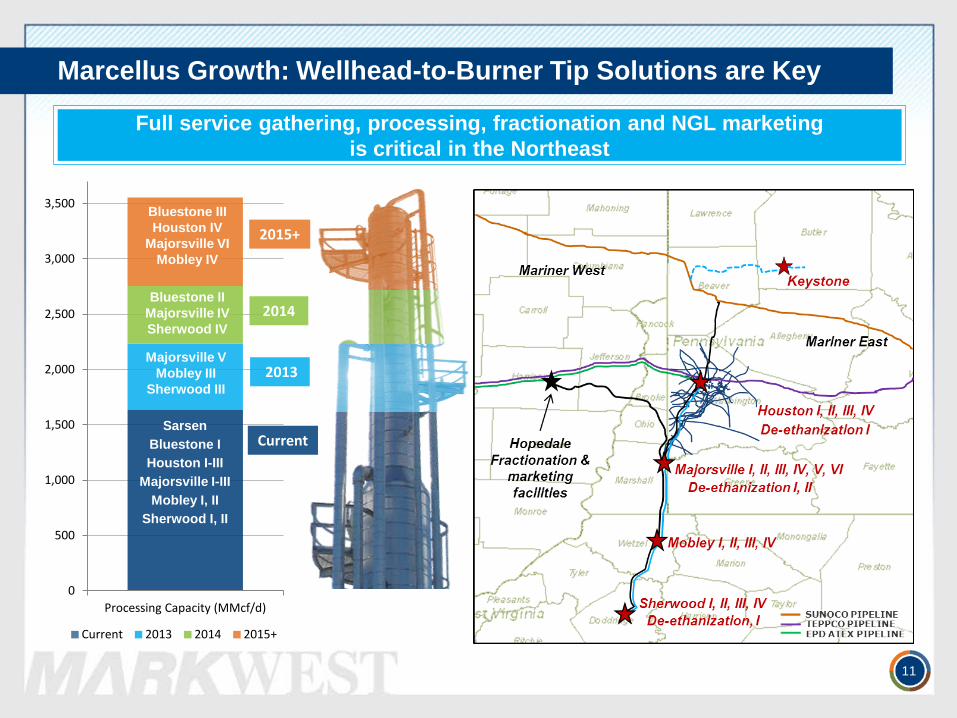
Processing Capacity (MMcf/d)
Current 2013 2014 2015+
Sarsen Bluestone I Houston I-III
Majorsville I-III Mobley I, II
Sherwood I, II
Majorsville V Mobley III
Sherwood III
Bluestone II Majorsville IV Sherwood IV
2014
2013
Current
Full service gathering, processing, fractionation and NGL marketing is critical in the Northeast
Bluestone III Houston IV
Majorsville VI Mobley IV
2015+
Marcellus Growth: Wellhead-to-Burner Tip Solutions are Key
Utica: The Shale Next Door
• We utilized the Marcellus infrastructure to create full-service, wellhead-to-burner tip solutions in Ohio
• We utilized the Marcellus to create scope and scale in the Utica and install world scale solutions
• We gained a first mover advantage in the southern core area in spite of the existing infrastructure
• Like the Marcellus, timing in the Utica is critical to meet the needs of our producer customers
• Our Marcellus position and our partnership with EMG allowed us to change the risk profile and create a competitive advantage
• We created strong new relationships and built on our existing deep relationships with producer customers
12
Since early 2012 we have translated our success from the Marcellus to the Utica with focused execution and strong partnerships
Utica Build-Out: Applying Our Vision from the Marcellus
13
0
100
200
300
400
500
600
700
800
900
1,000
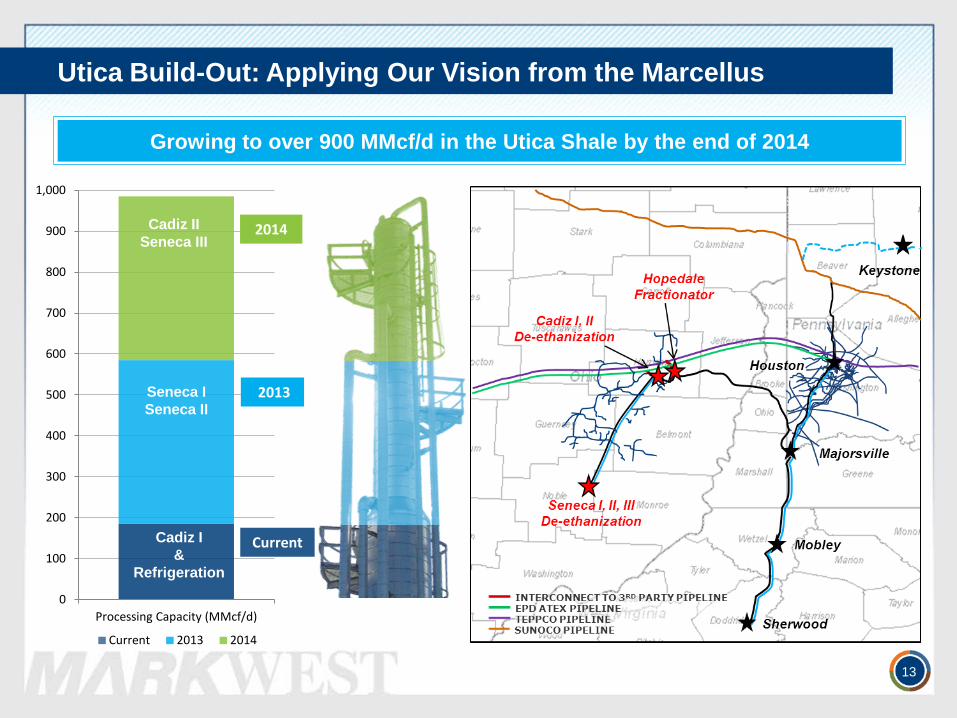
Processing Capacity (MMcf/d)
Current 2013 2014
Cadiz I &
Refrigeration
Seneca I Seneca II
Cadiz II Seneca III
2014
2013
Current
Growing to over 900 MMcf/d in the Utica Shale by the end of 2014
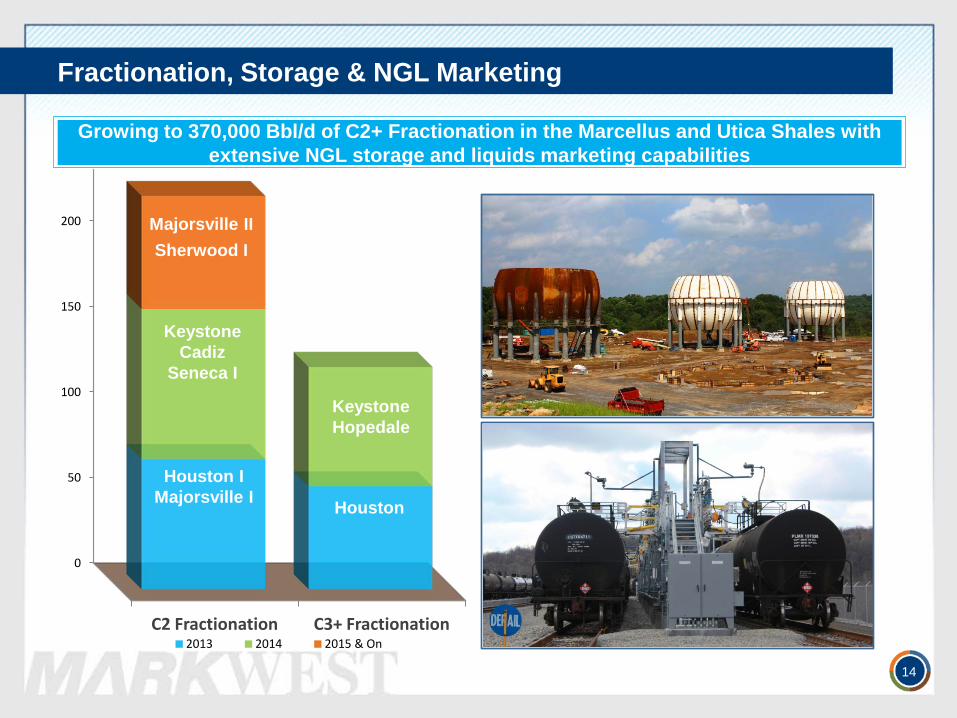
Fractionation, Storage & NGL Marketing
0
50
100
150
200
C2 Fractionation C3+ Fractionation 2013 2014 2015 & On
Houston I Majorsville I
Keystone Cadiz
Seneca I
Majorsville II Sherwood I
Keystone Hopedale
Growing to 370,000 Bbl/d of C2+ Fractionation in the Marcellus and Utica Shales with extensive NGL storage and liquids marketing capabilities
Houston
14
Baaaaaa
Baaaaa
Daaaaaaaa
Haaaaaa
Haaaaaaa
Maaaaa
Maaaaaaa
Maaaaaaaaa
Oaaa
Paaaaaaaa
Paaaaaa
Raaaaaa
Taaaaa
Taaaa
Waaaaa
Waaa
Baaaaaa
Caaaaaa
Caaaaaaaaa
Caaaaaaaa
Gaaaaaaa
Haaaaaaa
Haaaaa
Maaaaaaa
Maaaaa
Maaaaa
Maaaaa
Maaaaaaaa
Naaaa
Paaaaaa
Saaaa
Saaaaa
Taaaaaaa
Taaaaaaaaa
Waaaaaaaaa
Waaaa
Aaaaaaaaa
Aaaaaaaaa
Baaaaa
Baaaaa
Caaaaaa
Caaaaaaa
Faaaaaa
Gaaaaa
Laaaaaaa
Maaaaa
Vaaaaaa
Waaaaaaaaa
Waaaaaaaaaaa
Waaa Vaaaaaaa
Oaaa
MWE Uaaaa Caaaaaaa
MWE Maaaaaaaa Caaaaaaa
MWE Paaaaa
ATEX Eaaaaaa Paaaaaaa
TEPPCO Paaaaaa Paaaaaaa
Jaaaaaaaa
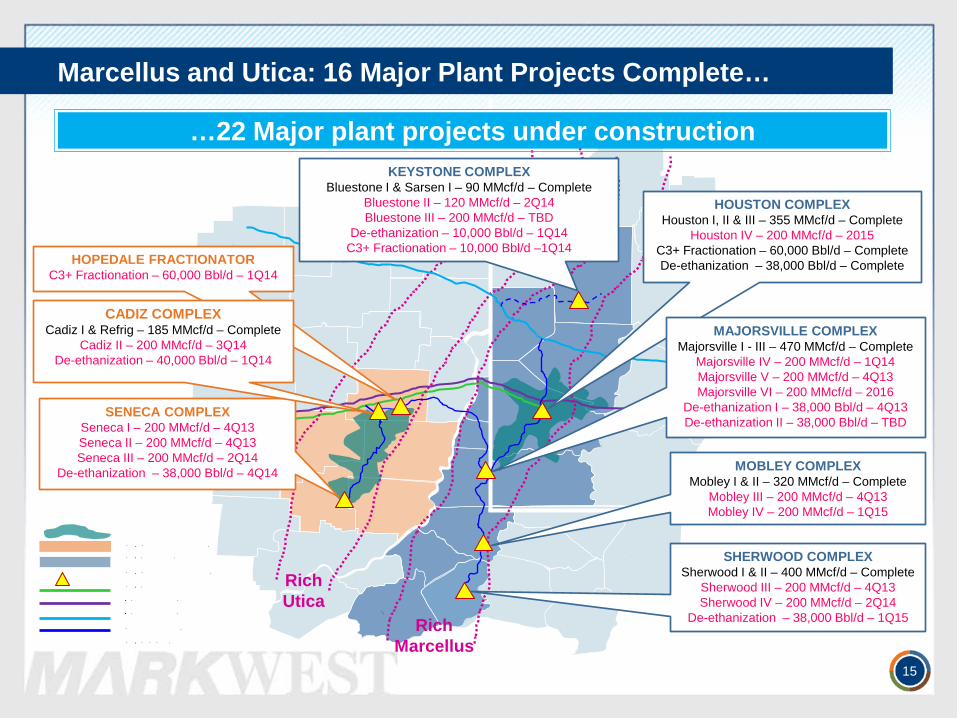
Marcellus and Utica: 16 Major Plant Projects Complete…
Maaaaaa Paaaaaaa
Rich Utica
Rich Marcellus
MWE Gaaaaaaaa Aaaa
15
MWE NGL Paaaaaaaa
…22 Major plant projects under construction
MOBLEY COMPLEX Mobley I & II – 320 MMcf/d – Complete
Mobley III – 200 MMcf/d – 4Q13 Mobley IV – 200 MMcf/d – 1Q15
HOUSTON COMPLEX Houston I, II & III – 355 MMcf/d – Complete
Houston IV – 200 MMcf/d – 2015 C3+ Fractionation – 60,000 Bbl/d – Complete De-ethanization – 38,000 Bbl/d – Complete
SHERWOOD COMPLEX Sherwood I & II – 400 MMcf/d – Complete
Sherwood III – 200 MMcf/d – 4Q13 Sherwood IV – 200 MMcf/d – 2Q14
De-ethanization – 38,000 Bbl/d – 1Q15
HOPEDALE FRACTIONATOR C3+ Fractionation – 60,000 Bbl/d – 1Q14
KEYSTONE COMPLEX Bluestone I & Sarsen I – 90 MMcf/d – Complete
Bluestone II – 120 MMcf/d – 2Q14 Bluestone III – 200 MMcf/d – TBD
De-ethanization – 10,000 Bbl/d – 1Q14 C3+ Fractionation – 10,000 Bbl/d –1Q14
SENECA COMPLEX Seneca I – 200 MMcf/d – 4Q13 Seneca II – 200 MMcf/d – 4Q13 Seneca III – 200 MMcf/d – 2Q14
De-ethanization – 38,000 Bbl/d – 4Q14
MAJORSVILLE COMPLEX Majorsville I - III – 470 MMcf/d – Complete
Majorsville IV – 200 MMcf/d – 1Q14 Majorsville V – 200 MMcf/d – 4Q13 Majorsville VI – 200 MMcf/d – 2016
De-ethanization I – 38,000 Bbl/d – 4Q13 De-ethanization II – 38,000 Bbl/d – TBD
CADIZ COMPLEX Cadiz I & Refrig – 185 MMcf/d – Complete
Cadiz II – 200 MMcf/d – 3Q14 De-ethanization – 40,000 Bbl/d – 1Q14
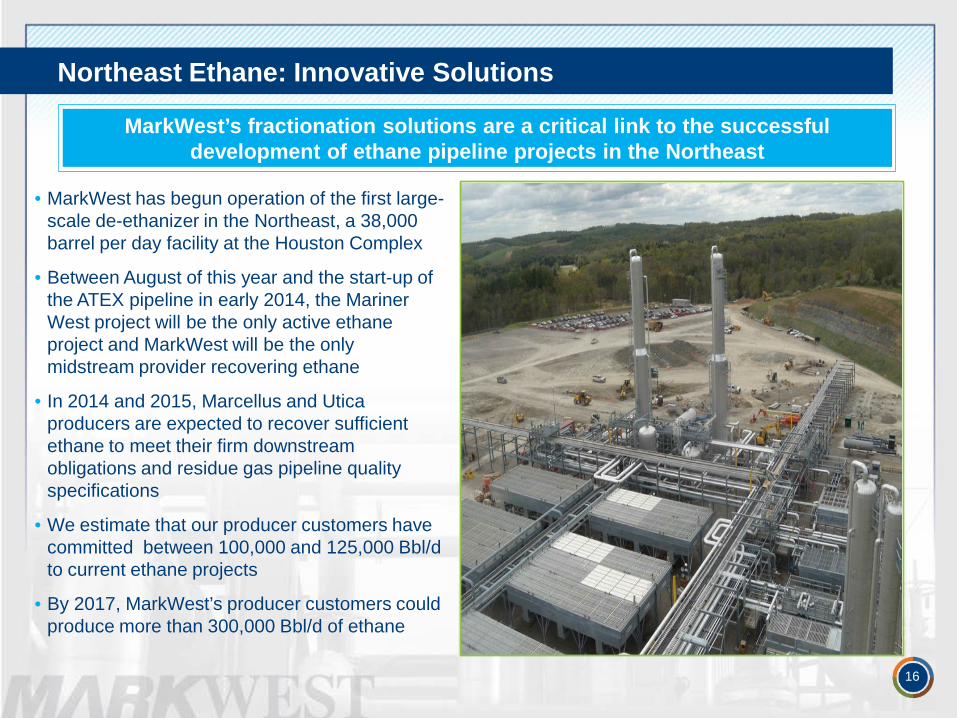
Northeast Ethane: Innovative Solutions
• MarkWest has begun operation of the first large-scale de-ethanizer in the Northeast, a 38,000 barrel per day facility at the Houston Complex
• Between August of this year and the start-up of the ATEX pipeline in early 2014, the Mariner West project will be the only active ethane project and MarkWest will be the only midstream provider recovering ethane
• In 2014 and 2015, Marcellus and Utica producers are expected to recover sufficient ethane to meet their firm downstream obligations and residue gas pipeline quality specifications
• We estimate that our producer customers have committed between 100,000 and 125,000 Bbl/d to current ethane projects
• By 2017, MarkWest’s producer customers could produce more than 300,000 Bbl/d of ethane
Image Source: BENTEK and MarkWest
16
MarkWest’s fractionation solutions are a critical link to the successful development of ethane pipeline projects in the Northeast
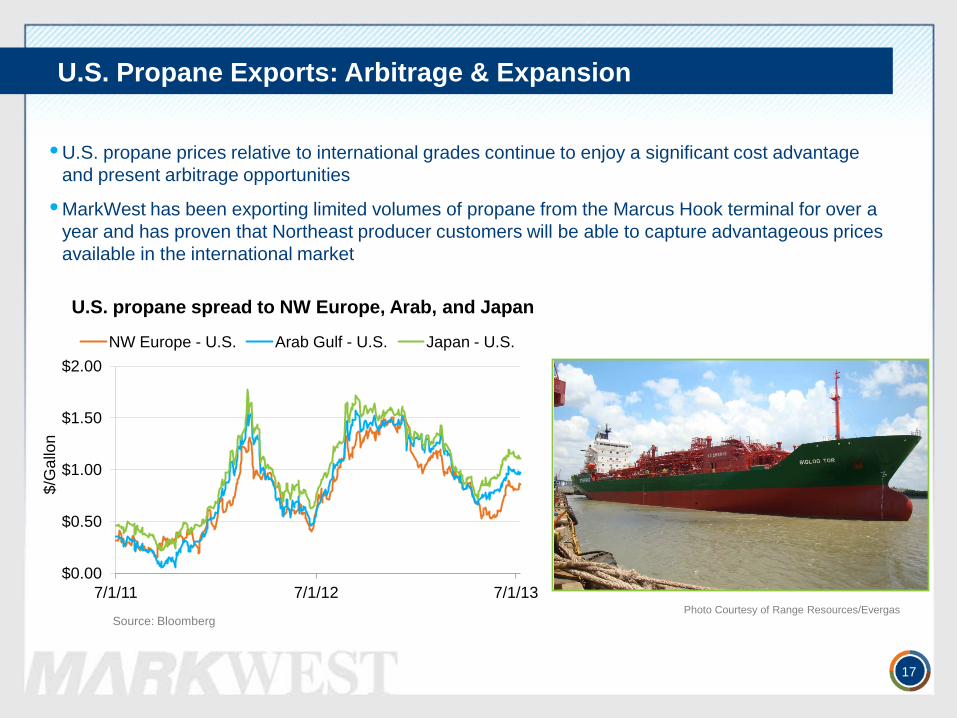
U.S. Propane Exports: Arbitrage & Expansion
• U.S. propane prices relative to international grades continue to enjoy a significant cost advantage and present arbitrage opportunities
• MarkWest has been exporting limited volumes of propane from the Marcus Hook terminal for over a year and has proven that Northeast producer customers will be able to capture advantageous prices available in the international market
17
$0.00
$0.50
$1.00
$1.50
$2.00
7/1/11 7/1/12 7/1/13
$/G
allo
n
NW Europe - U.S. Arab Gulf - U.S. Japan - U.S.
U.S. propane spread to NW Europe, Arab, and Japan
Source: Bloomberg Photo Courtesy of Range Resources/Evergas
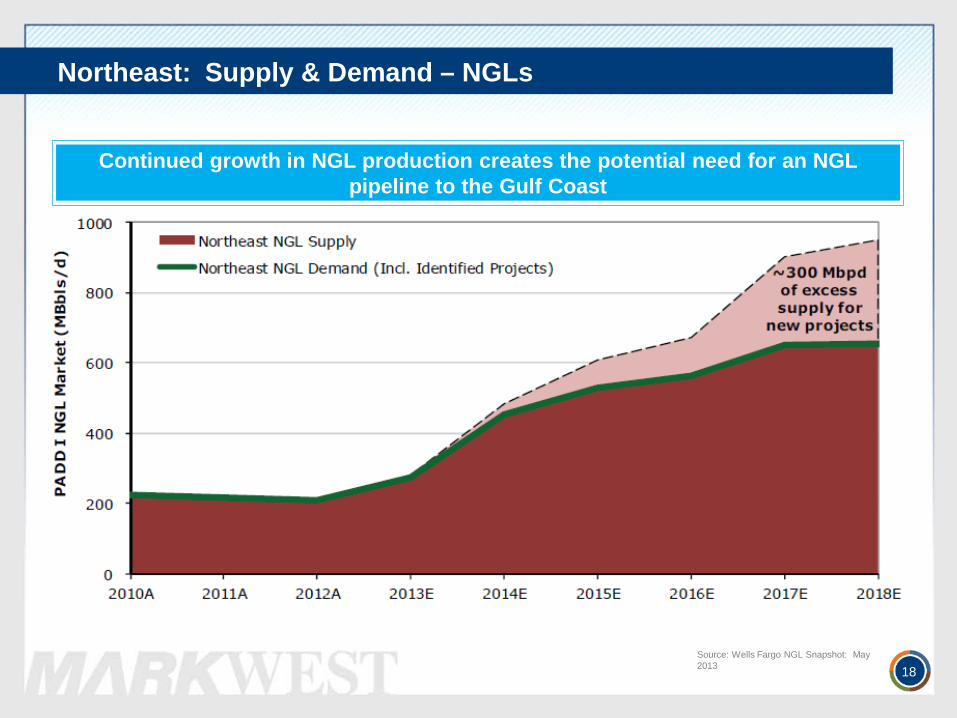
Northeast: Supply & Demand – NGLs
18
Continued growth in NGL production creates the potential need for an NGL pipeline to the Gulf Coast
Source: Wells Fargo NGL Snapshot: May 2013
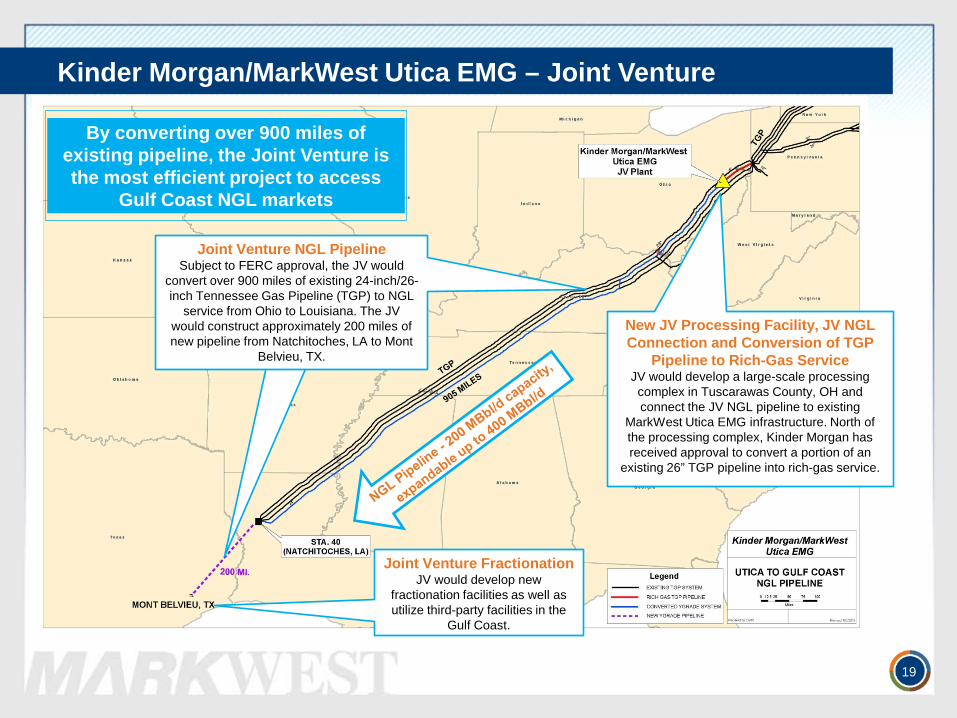
Kinder Morgan/MarkWest Utica EMG – Joint Venture
Joint Venture Fractionation JV would develop new
fractionation facilities as well as utilize third-party facilities in the
Gulf Coast.
New JV Processing Facility, JV NGL Connection and Conversion of TGP
Pipeline to Rich-Gas Service JV would develop a large-scale processing complex in Tuscarawas County, OH and connect the JV NGL pipeline to existing
MarkWest Utica EMG infrastructure. North of the processing complex, Kinder Morgan has received approval to convert a portion of an
existing 26” TGP pipeline into rich-gas service.
Joint Venture NGL Pipeline Subject to FERC approval, the JV would
convert over 900 miles of existing 24-inch/26-inch Tennessee Gas Pipeline (TGP) to NGL
service from Ohio to Louisiana. The JV would construct approximately 200 miles of new pipeline from Natchitoches, LA to Mont
Belvieu, TX.
By converting over 900 miles of existing pipeline, the Joint Venture is the most efficient project to access
Gulf Coast NGL markets
19
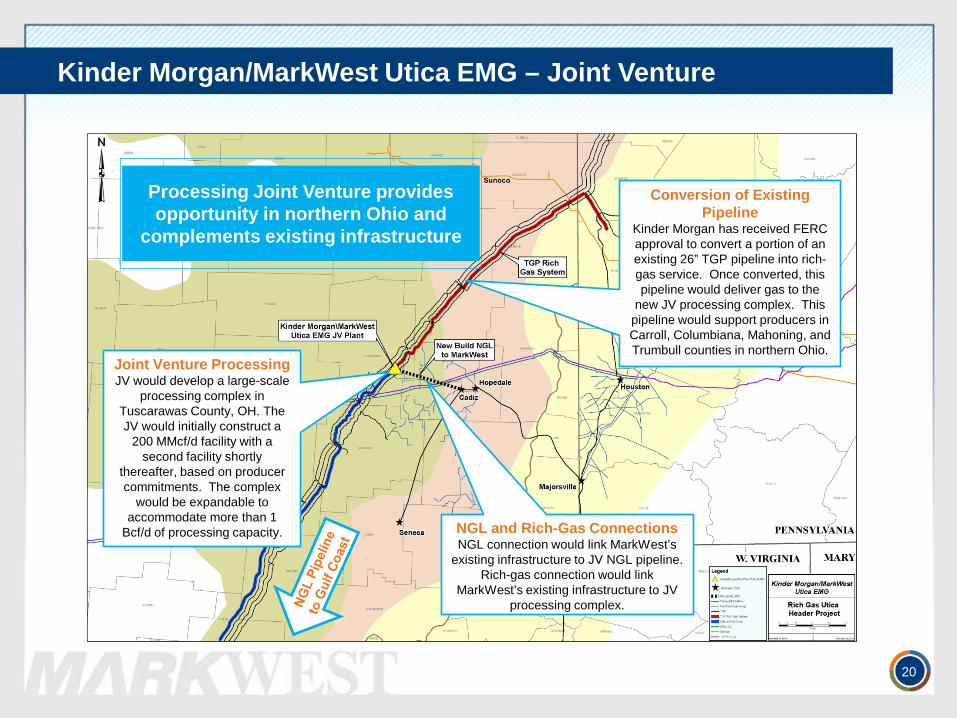
Kinder Morgan/MarkWest Utica EMG – Joint Venture
20
Conversion of Existing Pipeline
Kinder Morgan has received FERC approval to convert a portion of an existing 26” TGP pipeline into rich-gas service. Once converted, this pipeline would deliver gas to the
new JV processing complex. This pipeline would support producers in Carroll, Columbiana, Mahoning, and Trumbull counties in northern Ohio.
NGL and Rich-Gas Connections NGL connection would link MarkWest’s
existing infrastructure to JV NGL pipeline. Rich-gas connection would link
MarkWest’s existing infrastructure to JV processing complex.
Joint Venture Processing JV would develop a large-scale
processing complex in Tuscarawas County, OH. The JV would initially construct a
200 MMcf/d facility with a second facility shortly
thereafter, based on producer commitments. The complex
would be expandable to accommodate more than 1
Bcf/d of processing capacity.
Processing Joint Venture provides opportunity in northern Ohio and
complements existing infrastructure
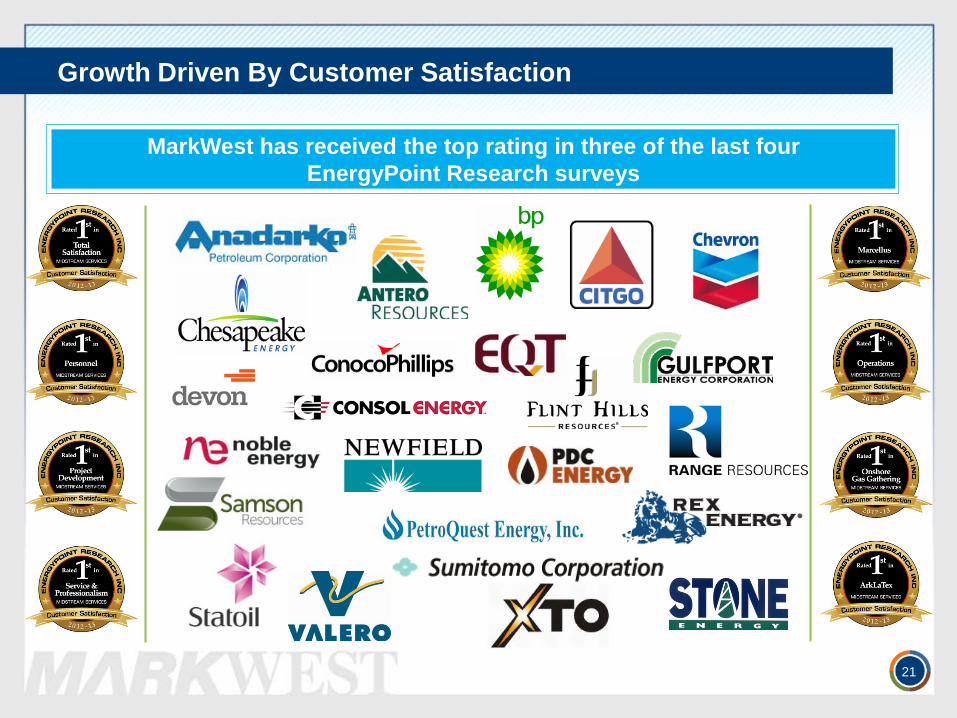
Growth Driven By Customer Satisfaction
21
MarkWest has received the top rating in three of the last four EnergyPoint Research surveys
APPENDIX
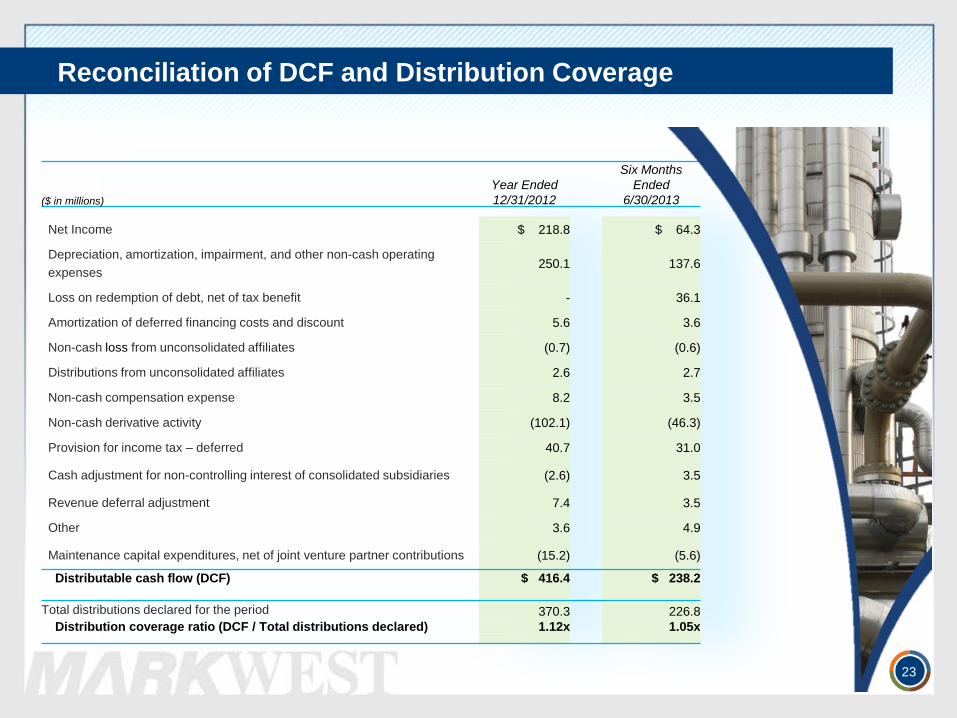
Reconciliation of DCF and Distribution Coverage
23
Year Ended Six Months
Ended ($ in millions) 12/31/2012 6/30/2013
Net Income $ 218.8 $ 64.3
Depreciation, amortization, impairment, and other non-cash operating expenses
250.1 137.6
Loss on redemption of debt, net of tax benefit - 36.1
Amortization of deferred financing costs and discount 5.6 3.6
Non-cash loss from unconsolidated affiliates (0.7) (0.6)
Distributions from unconsolidated affiliates 2.6 2.7
Non-cash compensation expense 8.2 3.5
Non-cash derivative activity (102.1) (46.3)
Provision for income tax – deferred 40.7 31.0
Cash adjustment for non-controlling interest of consolidated subsidiaries (2.6) 3.5
Revenue deferral adjustment 7.4 3.5
Other 3.6 4.9
Maintenance capital expenditures, net of joint venture partner contributions (15.2) (5.6)
Distributable cash flow (DCF) $ 416.4 $ 238.2
Total distributions declared for the period 370.3 226.8 Distribution coverage ratio (DCF / Total distributions declared) 1.12x 1.05x
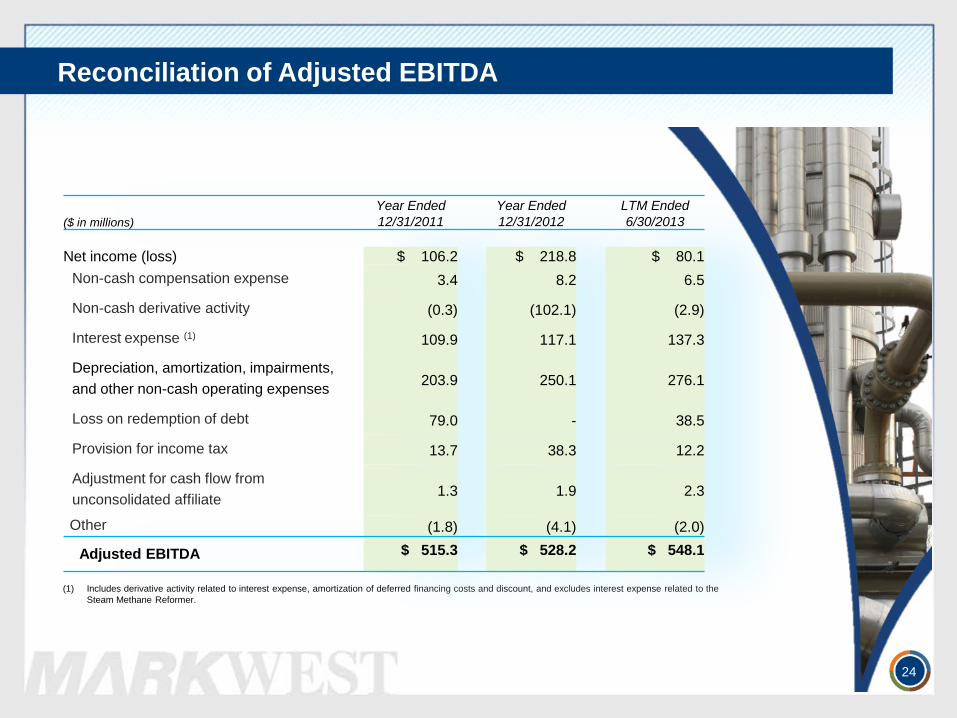
Reconciliation of Adjusted EBITDA
24
(1) Includes derivative activity related to interest expense, amortization of deferred financing costs and discount, and excludes interest expense related to the Steam Methane Reformer.
Year Ended Year Ended LTM Ended ($ in millions) 12/31/2011 12/31/2012 6/30/2013
Net income (loss) $ 106.2 $ 218.8 $ 80.1 Non-cash compensation expense 3.4 8.2 6.5
Non-cash derivative activity (0.3) (102.1) (2.9)
Interest expense (1) 109.9 117.1 137.3
Depreciation, amortization, impairments, and other non-cash operating expenses 203.9 250.1 276.1
Loss on redemption of debt 79.0 - 38.5
Provision for income tax 13.7 38.3 12.2
Adjustment for cash flow from unconsolidated affiliate 1.3 1.9 2.3
Other (1.8) (4.1) (2.0)
Adjusted EBITDA $ 515.3 $ 528.2 $ 548.1
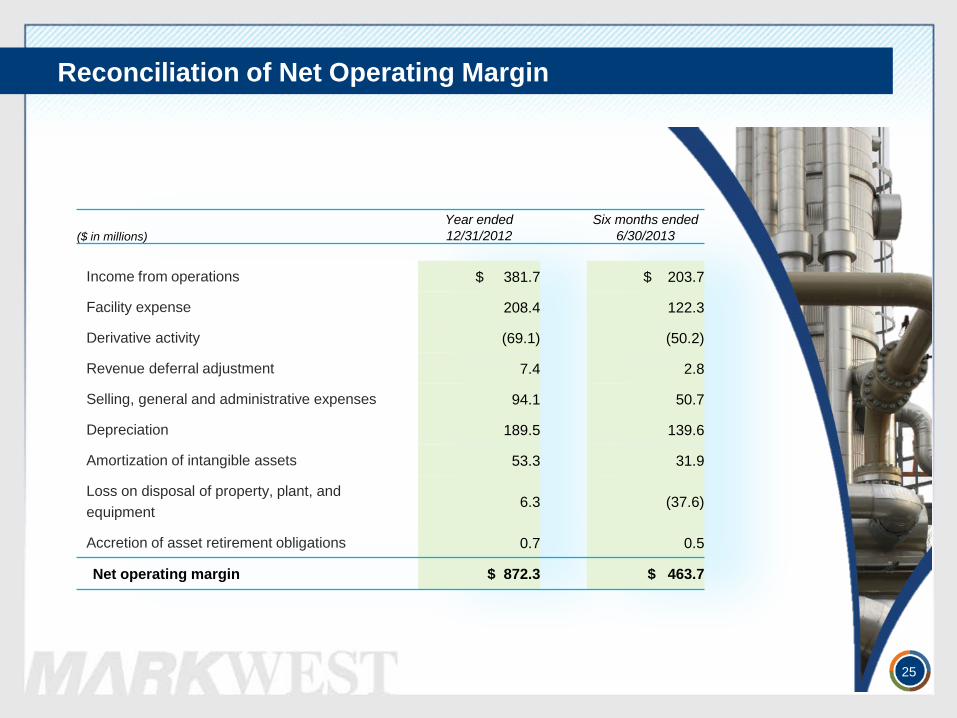
Reconciliation of Net Operating Margin
25
Year ended Six months ended ($ in millions) 12/31/2012 6/30/2013
Income from operations $ 381.7 $ 203.7
Facility expense 208.4 122.3
Derivative activity (69.1) (50.2)
Revenue deferral adjustment 7.4 2.8
Selling, general and administrative expenses 94.1 50.7
Depreciation 189.5 139.6
Amortization of intangible assets 53.3 31.9
Loss on disposal of property, plant, and equipment
6.3 (37.6)
Accretion of asset retirement obligations 0.7 0.5
Net operating margin $ 872.3 $ 463.7
1515 Arapahoe Street Tower 1, Suite 1600
Denver, Colorado 80202 Phone: 303-925-9200
Investor Relations: 866-858-0482 Email: [email protected]
Website: www.markwest.com


