Strategic Management JournalStrat. Mgmt. J. (2016)
Published online EarlyView in Wiley Online Library (wileyonlinelibrary.com) DOI: 10.1002/smj.2447Received 1 March 2013; Final revision received 14 July 2015
PLAYING DIRTY OR BUILDING CAPABILITY?CORRUPTION AND HR TRAINING AS COMPETITIVEACTIONS TO THREATS FROM INFORMAL ANDFOREIGN FIRM RIVALS
AKIE IRIYAMA,1,* RAJIV KISHORE,2 and DEBABRATA TALUKDAR2
1 Graduate School of Business and Finance (Waseda Business School), WasedaUniversity, Tokyo, Japan2 School of Management, State University of New York at Buffalo, Buffalo, New York,U.S.A.
Nearly 50 percent of the respondents in a sur-vey conducted in India by Ernst & Young andFICCI said “their companies have lost busi-ness to their competitors due to the latter’s
Keywords: competitive rivalry; competitive actions; strate-gic groups; corruption; human resource training; informalsector; foreign firms; emerging markets*Correspondence to: Akie Iriyama, 1-6-1 Nishiwaseda, Shinjuku-ku Tokyo 169-8050, Japan. E-mail: [email protected]
unethical conduct” such as engagement incorruption. (Singh and Singh, 2013: 19)Indian IT firms invest a substantial percentageof their revenue on human resource (HR)training, an investment that has been growingat double digit rates in percentage terms.However, there is also a wide variation amongIT firms in the training they provide to theiremployees. (Bapna et al., 2013)
Competitive rivalry/dynamics research hasfocused predominantly on competitive actions in
A. Iriyama, R. Kishore, and D. Talukdar
the product market space, such as product/serviceintroductions, price cuts, and promotion activities(Chen and MacMillan, 1992). Recently, strat-egy scholars have started advancing theoreticalunderstanding about firms’ nonmarket competi-tive actions in the political/governmental spaces(e.g., engaging in corruption, lobbying, pursuinglawsuits) and resource-market competitive actions(e.g., HR training, poaching employees fromrivals) that they take to improve their competitiveposition against rivals (Capron and Chatain, 2008;Markman, Gianiodis, and Buchholtz, 2009). Yet,the field is still nascent and our knowledge on whyand when these actions are taken is fairly limited.
Specifically, one of the questions in this researchstream has to do with why competitive rivalrypushes some firms to engage in nonmarket actions,such as corruption, while it pushes other firmsto engage in resource-market actions, such asHR training. While both corruption and HRtraining—competitive actions of interest in thisstudy in the nonmarket and resource-market arenas,respectively—may be used to gain advantage overcompetitors, they are inherently different and evencontradictory to each other. Corruption is generallyillegal in many countries, and managers mustconsider the possibility of reputation damage andeven imprisonment when they engage in corruptionto gain competitive benefits by influencing gov-ernment officials’ decisions in their favor (Mishinaet al., 2010). In contrast, while HR training is legal,it often takes time to develop human resourcesand associated technological capabilities to gaincompetitive advantage over rivals (Dierickx andCool, 1989). Further, both actions need investmentof finite financial resources. Given this tension, it isimportant to ask: Under what conditions do firmschoose nonmarket and/or resource-market actionsto gain advantage over their rivals?
The present study addresses this question byfocusing on corruption and HR training in theemerging economy context. These two actions arequite prevalent in emerging markets, but firms usethem selectively, and not all firms engage in them asis evident from the vignettes above. We propose thatfirms tailor their nonmarket and resource-marketactions in responding to competitive threats fromdifferent strategic groups. In emerging markets,firms typically face competitive threats from twounique and salient strategic groups in addition todomestic, formal sector rivals. First, they face com-petition from informal sector firms, that is, firms
that are not formally registered with the state.They also typically compete with foreign multi-national companies, that is, foreign firms. Thesetwo strategic groups constitute a significant portionof emerging economies (Schneider, 2002). Further,and interestingly, the two groups are also inherentlydifferent from each other. Informal firms eitheremploy illegal means in their business and/or sellillegal products/services to their customers. Fur-ther, they are typically small entities with fewerresources and capabilities. On the other hand, for-eign firms are not only legal entities, they typicallyenjoy deeper resources and capabilities as comparedto local competitors in emerging economies (Dun-ning, 1980).
Based on the synthesized logics in the compet-itive rivalry and strategic groups literatures, wepropose that firms in emerging markets engagein the nonmarket action of corruption to competeagainst informal firms, while they engage in theresource-market action of investing in HR train-ing to compete against foreign firms. We arguethat a focal firm identifies its rival firm group(s)based on market commonality and resource simi-larity between itself and the informal and foreignfirms groups. Following the emulation logic in thestrategic groups theory, the focal firm then engagesin corruption or HR training based on whetherthe identified rivals are in the informal or foreignfirms groups, respectively. However, as the litera-ture on competitive rivalry suggests (Chen, 1996), afirm’s responses to similar competitor group threatsmay also be heterogeneous, contingent on its mar-ket commonality and resource similarity with itsrival groups. We thus further propose moderatingeffects arising from firm diversification and techno-logical capability on the relationships suggested byour main hypotheses. Less diversified firms have agreater degree of market commonality with infor-mal firms, and are thus more likely to engage incorruption when perceiving threats from informalsector rivals. Firms with higher technological capa-bility have a greater degree of resource similaritywith foreign firms, and are thus more likely to investin HR training when competing with foreign rivals.We test our hypotheses using data from a WorldBank survey of Indian IT industry.
This study makes four contributions. First, weexplicitly connect specific competitor threats andspecific actions in nonmarket and resource-marketarenas, and show that firms take different com-petitive actions in systematic ways depending on
varying levels of perceived threats from multiplecompetitor groups simultaneously. Second, we alsoshow that actions in response to threats from differ-ent competitor groups differ, contingent on firms’resource and market profiles. Third, we extend thenonmarket strategy literature by examining illegalnonmarket actions of firms (i.e., corruption), andby studying the actions of domestic firms fromdeveloping countries against foreign competitors.Finally, we extend our understanding of strategicgroups and competitive rivalry in the context ofemerging markets.
BACKGROUND
Competitive rivalry and strategic group theory
Competitive rivalry centers on firms’ strategic ortactical actions against competitor threats (e.g.,Chen, 1996; Chen and Miller, 1994). Prior researchin this stream found that competitive actionsenhance firm performance (Ferrier, 2001; Ferrier,Smith, and Grimm, 1999), although they maytrigger rivals’ retaliatory actions (Derfus et al.,2008). Antecedents of competitive actions includea number of organizational attributes (Ferrier,2001), of which inter-firm market commonalityand resource similarity are perhaps the more estab-lished antecedents. Chen’s (1996) seminal studyintegrates the literatures on competitor analysis andinter-firm rivalry (Chen, Smith, and Grimm, 1992;Ferrier, 2001), and synthesizes the market-focusedperspective (Gimeno and Woo, 1996; Porter, 1980)with the resource-based view (Barney, 1991;Conner, 1991) to develop two constructs—marketcommonality and resource similarity—as keypredictors of competitive action. Later studiessuggest that these constructs influence a firm’sawareness, motivation, capability, and competitivebehavior with respect to a rival, which, in turn,influence the likelihood of competitive attacks andresponses between the firm and its rival (Chen, Su,and Tsai, 2007; Yu and Cannella, 2007).
Since Chen (1996), scholars have furthered com-petitive rivalry literature in several aspects, twoof which are important for the present study.First, while research in this area has predominantlyfocused on observable factors, such as market over-lap and size asymmetry between firms, to capturecompetitive threats (e.g., Chen, 1996; Chen et al.,2007), recent studies have begun to use perceptual
constructs such as competitive tension and compet-itive acumen to capture the perceptions of focal firmmanagers about their primary competitor (Chenet al., 2007; Tsai, Su, and Chen, 2011). Second,although the integrative competitive rivalry frame-work was originally developed to analyze the rivalrybetween two individual firms, it can be extendedto the group level. Market commonality refers tothe extent of market overlap among competitors,and resource similarity refers to the extent to whichcompetitors possess comparable types and levelsof strategic resources. These constructs are broadenough to examine rivalry at the group level. Build-ing on this insight, Chang and Xu (2008) exam-ine competitive rivalry among multiple groups offirms in China, including local firms group, HMT(Hong Kong, Macao, Taiwan) foreign firms group,and non-HMT foreign firms group. They suggestthat examining competitive rivalry at the group levelmay actually increase the predictive ability of themodel.
Another important research stream for thisstudy—the strategic groups literature—posits thatmanagers categorize competitors into groups that,in turn, shape managerial decision-making and firmactions. Whereas early studies focused on firms’observable attributes (e.g., product lines) to deter-mine strategic groups (Cool and Schendel, 1987;Porter, 1980), later scholars propose that managershave cognitive limitations and they simplify theircompetitive environments by partitioning com-petitors into groups (e.g., Clark and Montgomery,1999; Ferrier, 2001; Hodgkinson and Johnson,1994; Jayachandran, Gimeno, and Varadarajan,1999; Porac and Thomas, 1990; Porac, Thomas,and Baden-Fuller, 1989, 2011; Reger and Huff,1993). Peteraf and Shanley (1997), for instance,argue that managers structure a group of competi-tors into categories that provide information aboutstrategic emulation. The recent conceptual study byAnand, Joshi, and O’Leary-Kelly (2013) furthersthese ideas and develops the notion of strategicgroup configuration, arguing that firm managersidentify with a particular strategic group whentheir beliefs about the firm’s central, enduring,and distinctive characteristics overlap with theidentity of that strategic group. Specifically, thenotion of strategic group configuration advancesthe literature in multiple ways, including that: (1) afirm doesn’t necessarily belong to a strategic group,although it can simply identify with it; (2) a firmcan have multiple identities and that its different
identities may overlap with different competitorgroups; and (3) a firm can also disidentify orambivalently identify with multiple competitorgroups.
Building on Anand et al.’s (2013) insights aswell as overarching arguments in the strategicgroups literature, we premise that a focal firm’s per-ceived threat from a competitor group is developedthrough its strategic group identification process.For instance, Porac and Thomas (1994) found thatrivalry among firms within a category of firms isgreater than rivalry among firms across differentcategories, implying that the degree of rivalry, orcompetitive threat a focal firm perceives, is asso-ciated with the extent to which the firm identi-fies itself with a particularly category of firms, thatis, a competitor group. Porac et al. (1989) alsofind that Scottish knitwear firms do not recognizeJapanese or Italian knitwear firms as competitorsdespite the obvious substitutability of the products,writing that: “The major competitive threats areviewed as coming from within the Scottish firms”(p. 409). This implies that a perception of compet-itive threats emanates from a firm’s identificationprocess, that is, a firm identifying itself with Scot-tish versus a Japanese or an Italian firm. Accord-ingly, we premise that a firm perceives varyinglevels of threats from multiple competitor groupsthrough its group identification mechanism.
Competitive actions in nonmarketand resource-market space
Despite the predominant focus in previous researchon firm competitive actions in product markets(e.g., Armstrong and Collopy, 1996; Chen, 1996;Derfus et al., 2008; Ferrier, 2001; Ferrier et al.,1999; Gimeno and Woo, 1996; Karnani and Wern-erfelt, 1985; Porter, 1980), firms actually engage inactions in other spaces, including nonmarket andresource-market spaces, to improve or defend theircompetitive positions against their rivals (Capronand Chatain, 2008; Markman et al., 2009). Recentstudies have started considering competitive actionsin the nonmarket and resource-market arenas, suchas employee poaching (Gardner, 2005; Rao andDrazin, 2002), enforcement of intellectual propertyrights (Ziedonis, 2004), lawsuits against competi-tors (Markman et al., 2009), and political lobbying(Capron and Chatain, 2008). Specifically, we inves-tigate two competitive actions in nonmarket andresource-market space that are of particular salience
in emerging market contexts: (1) engagement in cor-ruption activities, and (2) investment in HR training.These two actions are an important part of the reper-toire of firm actions (Capron and Chatain, 2008;Markman et al., 2009), but our understanding ofcompetitive conditions under which firms undertakethese actions is limited. As we discuss below, theseactions represent important competitive responsesin emerging markets.
Corruption as a nonmarket competitive action
Nonmarket strategy has become an establishedresearch area, and recent reviews summarize its the-oretical underpinnings in institutional theory, indus-trial organization economics, and agency theory(Doh et al., 2003; Henisz and Zelner, 2012; Hill-man, Keim, and Schuler, 2004). Scholars have accu-mulated theoretical and empirical insights in thisdomain considering various nonmarket activities,such as corporate political activity, public adminis-tration, and environmental obligations. In the cor-porate political activity arena, specifically, firmsinteract with politicians and government regulatorsand inspectors with the goal of shaping laws, poli-cies, and regulations that are beneficial to the firms.Firms also make strategic decisions based on non-market factors. For example, banks in India seemto prefer locations where they can benefit frompolitical pluralism and avoid locations with polit-ical hegemony as hegemony can result in loweredmanagerial discretion and lesser resource trans-fers (Kozhikode and Li, 2012). Further, these non-market actions of firms may also take an illegalform, including corruption (Dutta, Kar, and Roy,2011). Recent evidence shows, for example, thathigh status banks in India engage in the nonmarketaction of illegal loan recovery to improve their assetquality both vis-à-vis their past asset quality andvis-à-vis that of their high status peers (Krishnanand Kozhikode, 2015). Overall, research has shownthat firms engage in nonmarket actions, includingillegal actions to compete effectively in the market-place.
Strategy scholars have examined corruption frommultiple angles. First, some scholars examined firmbehaviors in corrupt environments that may predis-pose firms to obtain certifications to signal theirdistinct capabilities (Montiel, Husted, and Christ-mann, 2012), discourage multinational corpora-tions’ (MNCs’) foreign direct investment (Bardhan,1997; Habib and Leon, 2002), and influence their
entry strategy (Rodriguez, Uhlenbruck, and Eden,2005; Uhlenbruck et al., 2006). Second, researchersalso sought to understand why some firms engage incorruption in a certain institutional context (Jeongand Weiner, 2012; Martin et al., 2007; Spencerand Gomez, 2011). Third, scholars investigated theimpact of a firm’s corruption activities on its perfor-mance (Galang, 2012, for a review). Finally, theyalso examined the normalization of corruption, orcollective corruption, whereby corruption becomesan integral part of organizational life and is perpet-uated by organizational members in a routine andnormal manner (Ashforth and Anand, 2003).
While a large body of literature has developedin the area of corruption, hardly any study recog-nizes corruption as a nonmarket competitive action.We posit that corruption is a nonmarket competi-tive action when conceptualized in terms of giv-ing bribes to government officials to further one’sown interests as it is essentially a financial incen-tive given to government officials to influencepolicy-making and policy-implementing in a waythat favors the demander’s interests (Capron andChatain, 2008). For instance, bribes by a firm togovernment officials have the potential to confera strategic or tactical advantage to the firm overits rivals by helping it obtain licenses in a speedymanner or having its violations of some regulationsoverlooked by government officials. Engaging incorruption is a distinct action in nonmarket strate-gies as it is usually illegal (Webb et al., 2009), andtherefore, risky. Firms engaging in corruption runthe risk of arrest of their executives and employ-ees as well as reputation damage. Indeed, researchon firms’ illegal actions has built on the generalpremise that firms engage in corporate illegalityonly when the upside benefits of doing so are per-ceived as outweighing the downside risks (Mishinaet al., 2010). As a result, all firms do not engagein corruption, even in emerging markets where cor-ruption may be otherwise rampant. Accordingly, weposit that firms engage in corruption as a competi-tive action to gain some advantage over their rivals.
HR training as a resource-market competitiveaction
We posit that HR training is a competitive actionin a firm’s resource market. Literature has recog-nized the importance of HR development (Becker,1964; Bruton, Dess, and Janney, 2007; Martin et al.,2007) as human resources are often valuable, rare,
and inimitable resources, and a source of firms’competitive advantage (Barney, 1991). In emergingmarkets, HR training serves as a resource-marketaction in two ways. First, it serves the more tra-ditional role of internal resource building (Capronand Chatain, 2008). While firms obtain humanresources with required qualifications by screeningincoming employees, they also improve the qual-ity of their current employees by providing training(Delaney and Huselid, 1996). Considerable evi-dence suggests that investments in employee train-ing produce beneficial organizational outcomes andhelp firms improve their competitive positions overrivals (Bartel, 1994; Knoke and Kalleberg, 1994;Russell, Terborg, and Powers, 1985).
Second, HR training also serves as Capron andChatain’s (2008) “resource preemption strategy”that is used to retain human resources within thefirm who might otherwise run out to or be poachedby competitors. This role of HR training is par-ticularly apt in fast-growing sectors of emergingeconomies. In Indian IT industry, for instance, HRattrition rate was between 55 and 60 percent in thefirst six months of 2011 (PTI, 2012), and managersthere recognize HR training as one of the strategictools for preventing talented employees from beingpoached by rival firms. A recent survey finds HRtraining as one of the top five strategies for Indiancompanies to mitigate employee turnover (Yiu andSaner, 2011). Therefore, HR training can be con-sidered a resource preemption strategy as well as aresource building strategy. HR training also entailsrisk, however. Developing human resources takesa long time, requires nontrivial financial resources,and the outcomes are uncertain in the short run(Dierickx and Cool, 1989; Foote and Folta, 2002).Moreover, due to their increased value, trainedhuman resources may leave the firm, thereby dimin-ishing the return on training investments to theinvesting firm. Accordingly, managers must care-fully weigh the risks and benefits of this competitiveaction.
Threats from competitor groups in emergingmarkets
While firms may compete head-to-head at afirm-dyad level, literature also suggests that firmactions are often influenced by competitor groups(e.g., Chang and Xu, 2008). In an emergingeconomy, firms typically face threats from threedifferent competitor groups: foreign competitors,
informal sector competitors, and domestic competi-tors in the formal sector. Further, firms in the twoformer groups are generally prevalent in emergingmarkets.
Informal sector competitor group
Following current literature, we consider the infor-mal sector of an emerging country as consistingof firms that are not formally registered with thestate, and therefore, do not pay taxes and otherlevies to the state (Marcelli, Pastor, and Joassart,1999; Portes, 1994; Webb et al., 2009). Such firmseither use illegal “means,” for example, employundocumented workers or child labor (Raijman,2001), and/or pursue illegal “ends,” for example,sell illegal products such as pirated software (Givon,Mahajan, and Muller, 1995). However, some socialgroups and stakeholders view both the means andthe ends to be legitimate because of which suchfirms exist and even thrive in their respectiveentrepreneurial domains (Webb et al., 2009).
The presence of informal economy in emerg-ing economies is pervasive. Schneider (2002) esti-mated that informal economy activities account forapproximately 40 percent of GDP in developingcountries. The National Sample Survey Organiza-tion (NSSO) estimates that only seven percent ofthe workforce in India in 2004–2005 belonged tothe formal sector (Chidambaram, 2008; Dutta et al.,2011; Ratnam, 2006). In the 2006 World Banksurvey of firms in 14 Latin American countries,38.7 percent of manufacturing firms ranked compe-tition from informal firms as one of their top threeobstacles to doing business. Consequently, infor-mal sector firms, as a distinct and salient competitorgroup, pose threats to formal sector firms in emerg-ing markets.
Foreign firms competitor group
In emerging markets, the presence of foreign firmsis pervasive. According to UNCTAD, 53 percentof the overall FDI flowed to developing and tran-sition countries in 2010. As a result, local firmsoften compete with foreign firms in emerging mar-kets, and both groups compete head-to-head inmany instances. For example, local Chinese firmssuch as Haier compete with Western rivals such asWhirlpool and Electrolux in the appliances marketin China (Zeng and Williamson, 2003). Chang andXu (2008) indicate that competition between local
firms and foreign firms in the Chinese market isintense when they share similar resources. In sum,firms in emerging markets face significant compet-itive threats from foreign firms.
HYPOTHESES
Given our focus on firms’ nonmarket andresource-market actions, and the two salientcompetitor groups in emerging markets, we nowturn our attention to developing theoretical logicsto connect them. Specifically, we develop syntheticlogics by integrating the strategic groups literaturewith the competitive rivalry literature. We proposethat a focal firm engages in appropriate competitiveactions to act against those strategic groups that itidentifies as its rivals.
First, the competitive rivalry literature posits thatfirms consider resource similarity and market com-monality as key considerations in their competitoranalysis (Chen, 1996) as they compete with theirrivals in both the resource and product market are-nas (Markman et al., 2009). Consequently, a firm islikely to identify a group of firms as its rival withwhom it has a high degree of resource similarity,or market commonality, or both. In other words,resource similarity and/or market commonality playan important role in the firm’s identification process,a key notion in the strategic groups literature.
Second, the strategic groups literature notes that“firms are more likely to imitate the prevalent strate-gies, practices, and norms of the group membersthey identify with” (Anand et al., 2013: 7), and wepropose this emulation mechanism as the key driverfor competitive action. A focal firm’s perceivedthreat from a particular competitor group, devel-oped through its identification process, inherentlyimplies that the focal firm shares some current andpotential stakeholders (e.g., customers, employees,investors) with other firms that also identify withthat group. By buying from, working for, or invest-ing in its competitors, the shared customers, poten-tial employees, and investors signal to the focalfirm some of the outcomes they value that are pro-vided by the competitors in terms of low prices, highproduct quality, and speedy service. As a result,the focal firm may be inclined to emulate the pro-cesses and strategies, including actions in nonmar-ket and resource-market spaces, that are used byits competitors as they are known to produce theoutcomes that the shared stakeholders value and
support. Further, managers of the focal firm holdbeliefs that shared stakeholders view as legitimatethe processes and strategies pursued by the com-petitors, and this may further motivate the focalfirm to emulate the actions in both the nonmarketand resource-market spaces used by its competi-tors (Labianca et al., 2001; Panagiotou, 2007; Poracet al., 1989).
Influence of perceived threats from the informalsector competitors
An informal sector firm is generally recognizedas a “fast and loose” entity that exploits marketopportunities in a fast manner by circumventingthe legal and bureaucratic governmental processesdue to the acceptability of illegal means and endsin the informal institutional arena (Webb et al.,2009). While risky, engaging in corruption can helpfirms save time in obtaining government permitsor licenses in a bureaucratic governmental regime,thereby accelerating their business activities andproduct/service launches. Furthermore, corruptionmay also reduce firms’ administrative and operationcosts by helping them reduce or avoid paymentof large government taxes, tariffs, license fees, orpenalties for violations of government regulations.
Firms in the formal sector may perceive a threatfrom their informal sector competitors when theircustomers also buy products/services from thesecompetitors. In such cases of market commonal-ity, current and potential customers of a formal firmsend it a signal that they value speedy actions andcheaper prices through their willingness to buy fromcompeting informal sector firms. Equally impor-tant, a focal firm perceiving competitive threat frominformal sector firms would tend to view illegalactions as being accepted by its current and poten-tial customers based on the fact they also buy prod-ucts/services from its competitors in the informalsector. Further, paying some informal gifts or pay-ments to government officials may help a focalfirm avoid time delays that would otherwise hamperthe firm’s speedy response against fast-and-looseinformal sector firms. Hence, consistent with stud-ies on illegal actions (Mishina et al., 2010), focalfirm managers perceive the upside benefits of illegalactions as outweighing the downside risks. Conse-quently, when a firm perceives a significant threatfrom rivals in the informal sector, it is likely toemulate the “illegal but fast” actions of its informalsector rivals and itself engage in such activities to
serve the needs and preferences of that particularcustomer base (Anand et al., 2013). Accordingly,the focal firm is likely to engage in corruption toimprove its competitive position vis-à-vis its infor-mal sector rivals, when it perceives threats fromsuch rivals.
Hypothesis 1: The greater the competitive threata focal firm perceives from informal sector firms,the more likely it will engage in corruptionactivities.
Influence of perceived threats from the foreignsector competitors
There is broad consensus in international businessresearch that foreign firms operating in emergingmarkets enjoy some inherent advantages over localfirms that are usually sufficiently large to offsettheir liability of foreignness (Caves, 1971; Dunning,1980). These advantages include superior techni-cal resources, managerial capabilities, well-knownbrand names, and access to international networks.Moreover, such firms generally offer better productswith advanced technology and high-quality servicesthan do their local competitors. By exploiting theirsuperior resources that are generally not availableto local competitors, foreign firms are able to hitthe ground running in emerging markets (Chang andXu, 2008).
Therefore, a focal firm in emerging markets mayidentify foreign firms as a competitor group andmay perceive threats from this group when it facesa situation of resource similarity with this group.In such a situation, the focal firm has to competehard with foreign firms for similar resources withadvanced knowledge, skills, and capabilities as theyare typically scarce in emerging economies. Further,the focal firm realizes that it needs to offer advancedtechnology and high-quality products/services, orproducts/services at competitive prices with accept-able levels of quality to compete with its foreignrivals. If the products/services of this firm cannotreach the levels offered by its foreign competitors,the viability of the firm may become questionableas the customers and other stakeholders may notsupport the focal firm through purchase of its prod-ucts/services and investments in the firm, and soforth.
Therefore, emulating its foreign competitors, thefocal firm is likely to invest in activities that improveits human resource base in order to stay competitive
in the products/services arena. In the face of scarcityof human resources due to resource similarity withforeign firms, training of current employees thenbecomes a reasonable action as advanced techni-cal knowledge and managerial skills are the primaryingredients for innovative products, high-qualityservices, and productivity enhancements. In addi-tion, as discussed above, HR training may alsoenable the focal firm to retain its talented employeesand to prevent them from being poached by its for-eign firm rivals. While HR development takes a longtime and entails a high degree of uncertainty (Footeand Folta, 2002), these risks are offset by the pres-sures from customers and stakeholders who valueforeign competitors’ products and services.
Hypothesis 2: The greater the competitive threata focal firm perceives from foreign firms, themore likely it will invest in HR training.
Thus far, our theoretical arguments havefocused on the influence of strategic group-levelcompetitive threats on a focal firm’s actions.However, competitive rivalry literature also sug-gests firm-level heterogeneity of threat-actionrelationships due to increased rivalry between firmsthat results from their market commonality andresource similarity (Chen, 1996). Accordingly, wedevelop theoretical arguments for two firm-levelcontingencies—diversification and technologicalcapability—on the relationships suggested bythe above main hypotheses. These firm profilesare not only indicators of market commonalityand resource similarity, respectively, but also welldocumented in the literature as sources of firmheterogeneity.
Moderating effect of diversification
Our theoretical logics leading to Hypothesis 1 arebased on the notion of market commonality as thesource of competitive rivalry. We now suggest thata firm’s level of diversification also serves as asource of contingency for the relationship betweenthe firm’s perceived level of competitive threat frominformal sector firms and its likelihood to engagein corruption. One of the key variables pertain-ing to market commonality is the degree of firmdiversification. When a focal firm has multipleproduct/service lines, it means that it has alterna-tive markets to compete in and win even when it
faces a high level of threat in a certain market (Jay-achandran et al., 1999). On the other hand, when afocal firm relies on one product/service line, it isessentially operating in a single market. It may bea question of survival for this firm if this market isthreatened. Therefore, when an undiversified firmperceives competitive threats from informal sectorfirms, it implies that this firm has a high degree ofmarket commonality with informal sector firms interms of a large volume of shared current and poten-tial customers with the informal sector firms (Changand Xu, 2008; Chen, 1996). In addition, a diversi-fied firm may have multiple identities as it competesin multiple markets. Strategic group configurationtheory (Anand et al., 2013) suggests that a firm withmultiple identities is likely to identify with multi-ple strategic groups. Consequently, the diversifiedfirm may not perceive severe pressure from any onestrategic group. In contrast, an undiversified firmhas only a few identities, or even a single identity,and thus, identifies with only a few strategic groups,or even a single group. Therefore, an undiversifiedfirm will perceive a greater level of threat from onestrategic group.
Accordingly, when an undiversified firm facesheightened rivalry stemming from its market com-monality with informal sector firms, it is then morelikely to amplify its emulation of its informal sec-tor rivals. As discussed before, an informal sectorfirm is a fast and loose entity and may even engagein corruption to circumvent the legal governmentalprocesses due to the acceptability of illegal meansin the market (Webb et al., 2009). Thus, to com-pete with its informal sector rivals, the undiversifiedfocal firm would also need to act fast and quickly,even by taking illegal actions, including corruption,as otherwise it may not survive in that market.
Hypothesis 3: Less diversified firms are morelikely than diversified firms to engage in corrup-tion activities when faced with a certain level ofthreat from informal sector firms.
Moderating effect of technological capability
Our theoretical logics leading to Hypothesis 2are based on the notion of resource similarity asthe source of competitive rivalry. We now pro-pose that the relationship suggested by Hypothe-sis 2 between a focal firm’s perceived threat fromforeign firms and its likelihood to invest in HRtraining is contingent on the focal firm’s resource
profile, specifically, its technological capability,which refers to a firm’s ability to employ varioustechnologies (Zhou and Wu, 2010). A large body ofliterature suggests that a firm’s technological capa-bility is a source of unique and innovative prod-uct/service offerings (e.g., Kelm, Narayanan, andPinches, 1995; Kotha, Zheng, and George, 2011;Sears and Hoetker, 2014; Zhou and Wu, 2010). Fur-ther, foreign firms are generally expected to develophigh-end products/services due to their high tech-nological capability (Dunning, 1980). Accordingly,from a resource similarity perspective, a focal firmwith high technological capability will be morelikely to consider foreign firms as key competitorsthan a firm with low technological capability. More-over, such a firm is also more likely to perceivean elevated level of competitive threat from foreigncompetitors (Chang and Xu, 2008; Chen, 1996).
As a result, the focal firm is likely to amplify itsemulation of foreign sector rivals and engage in ahigher level of HR training when it perceives height-ened rivalry with foreign firms stemming from itsresource similarity with them. This response by thefocal firm is a result of its recognition that foreignfirms not only have high levels of current techno-logical capability, but also they possess deep overallknowledge resources that they keep on developingfurther (Kirca et al., 2011). The focal firm thus real-izes that its existing technological capability maynot be enough to compete with foreign sector rivals,and that it will need to invest in HR training toexploit its technological capability to compete withits foreign rivals.
Hypothesis 4: Firms with higher technologicalcapability are more likely than firms with lowertechnological capability to invest in HR trainingwhen faced with a certain level of threat fromforeign firms.
METHODS
Sample and data
The World Bank conducts regular surveys of firmsacross major emerging economies such as Chinaand India. Data from these surveys have also beenused in prior academic research (e.g., Angelini andGenerale, 2008; Cull and Xu, 2005). The main datafor the current study also comes from a surveythat was conducted by the World Bank in India
in 2006 and consists of a sample of 360 firmsin the Indian IT industry. All sampled firms arelegally registered, that is, they are firms in the for-mal sector. The 360 firms in the sample come fromseven states and union territories: Andhra Pradesh,Delhi, Haryana, Karnataka, Maharashtra, TamilNadu, and Uttar Pradesh. These firms belong to thefollowing subindustries of the broader IT industry:telecom services (4%), software (59%), informa-tion technology-enabled services (ITES, 17%), andmedia and entertainment services (20%). Finally,42 percent of the sample firms have nine or feweremployees, 34 percent have between 10 and 24employees, and the rest, 24 percent, have 25 or moreemployees.
The survey was conducted by the World Bankin consultation with the Confederation of IndianIndustries, and the Indian unit of an internationalmarket-research firm implemented the survey. Theimplementation involved personal interviews usinga common survey questionnaire with sampledfirms’ top-level managers. They were told that theinformation obtained from them would be heldin strict confidence. The survey collected data onfirm characteristics such as sales, operational costs,number of employees, access to public infrastruc-ture, access to finance, and so on, as well as data onfirm managers’ perceptions about various aspectsof the business climate, including competitivethreats. We believe that the design of the surveyprovides us with one of the most comprehensivefirm-level data in an emerging country context toinvestigate firms’ nonmarket and resource-marketactions. This dataset also allows us to include alarge set of control variables in empirical analysesas compared to the existing studies in this area.
We inspected the dataset and dropped observa-tions from our sample that had missing data for thestudy variables. Through this process, we obtainedthe final sample consisting of 157 observations forthe corruption models and 269 observations for theHR training models.1 We also collected additional
1 There may be potential nonresponse bias in the corruption mod-els as some interviewees may intentionally decline to answerquestions about corruption. We compared the means of the sub-sample of firms that answered corruption-related questions withthe subsample of firms that declined to answer those questions onkey firm characteristics, including size, age, diversification, tech-nological capability, advertisement intensity, and foreign owner-ship. Results of t-tests showed no significant differences betweenthe two subsamples, indicating that our results from the corruptionmodels do not suffer from any serious nonresponse bias.
state-level GDP per capita data from other sourcesnoted below.
Dependent variables
Firm’s engagement in corruption activities
Quantifying the precise level of a firm’s cor-ruption activities (e.g., number of bribes paid)is intrinsically difficult due to an understandablereluctance on the part of the giver of bribes toshare such information. Therefore, the World Banksurveys—including the one used by us—aim toindirectly identify whether a surveyed firm is likelyto have recently engaged in corruption practicesacross various business contexts (Dabla-Norris,Gradstein, and Inchauste, 2008). The indirect phras-ing of the corruption related questions, along witha “no response” option, was to ensure that respon-dents were not implicating themselves of wrong-doing of a criminal nature, and is consistent withthe approach used in existing studies (e.g., Spencerand Gomez, 2011; Svensson, 2003). We used datafrom three questions on the survey to constructour measures for corruption. First, each respondentfirm was asked whether or not “an informal giftor payment expected or requested” by governmentofficials to obtain approval on applications for busi-ness licenses and/or infrastructure within the lasttwo years. Second, each respondent firm was askedwhether or not “a gift or informal payment everexpected/requested” by government officials fromthe tax, labor, and safety agencies during inspec-tions by and required meetings with them during thelast one year. Third, the survey also measured, usinga five-degree Likert-type scale, a respondent’s per-ception about the extent to which corruption was anobstacle “to the current operations and opportuni-ties for growth of this establishment.”
We created two alternative dichotomous mea-sures for the corruption variable to ensure thatour empirical results for the corruption model arerobust. Our main measure for corruption is a con-servative measure and attempts to precisely capturea firm’s proactive engagement in corruption activi-ties. We first coded 1 for firms that answered “yes”for at least one of the question items that askedfirms about whether or not they were expected orrequested to give gifts or payments, and 0 otherwise.However, this may be a more expansive measure ofcorruption as it also includes those firms that mayfeel forced by government officials to pay informal
benefits to them, rather than proactively makingthose informal payments. Therefore, we used thequestion that measures a respondent perceptionsabout corruption as an obstacle for his/her business.We consider that when firms do not perceive cor-ruption as a serious obstacle to doing business, itimplies that they may not be reluctant to pay bribeswhen asked to pay them.2 Accordingly, if such firmswere “asked or expected to pay bribes,” then wecan surmise that they did so more proactively thanthose who thought corruption was a severe obsta-cle to doing business. Thirteen of the focal firms inour sample fall in the “proactive corruption” group,and we coded 1 for these firms, and 0 otherwise, forour main corruption measure. We also used as analternative measure of corruption the more expan-sive measure of all corruption activities discussedabove that considers only firm responses on ques-tions about whether or not they were expected orrequested to give informal gifts or payments to gov-ernment officials.
Firm’s investment in HR training
We captured firms’ investment in HR training usingtwo questions in the survey. In one question, a firmwas asked whether it ran “formal in-house train-ing programs for its permanent, full-time employ-ees” during the last one year. In another question,the firm was asked whether it sent “its permanent,full-time employees to formal training run by otherorganizations” during the last one year. We againcreated two alternative measures for the HR trainingvariable to ensure that our empirical results for theHR training model are robust. Our main measure forHR training is a conservative measure that attemptsto precisely capture a firm’s investment in HR train-ing. The two types of training—in-house trainingversus that provided by another organization—aretypically different in nature as the former providestrainees with firm-specific knowledge about firm’sproducts, technologies, and processes, while the lat-ter provides trainees with generalized technical orbusiness knowledge. Therefore, our main measureof HR training investment is a categorical orderedthree-degree measure that codes 2 for firms thatinvested in both types of HR training, 1 for firmsthat invested in only one type of HR training, and 0for firms that did not invest in any HR training. For
2 We wish to thank an anonymous reviewer for this suggestion.
our alternative measure of HR training investment,we use a more expansive binary measure that codes1 for firms that invested in any or both types of HRtraining, and 0 otherwise.
Explanatory, moderating, and control variables
For our main explanatory variables, we use ques-tions from the World Bank survey that ask firmsto describe competitive threats from three specifictypes of firms operating in India: (1) foreign firms,(2) domestic firms, and (3) informal sector firms.Specifically, the question asked: “Describe a fewcharacteristics of your industry and the market on ascale from 1 to 5 (where 5 represents a specific typeof firm as being a big threat and 1 represents thattype of firm as being no threat).” This stem ques-tion was followed by three leaf questions that askedhow big a competitive threat were those three typesof firms for the responding firm. For example, withrespect to foreign firms, the leaf question asked:“How big a competitive threat are foreign firmsoperating in India?” Similar questions were askedfor domestic and informal sector firms. We usedresponses for these questions on foreign firms andinformal sector firms as our explanatory variables.We also included the response on domestic firms asa control variable. Note that the time horizon forboth our dependent and explanatory variables arecontemporaneous, referring to the last fiscal yearsrelative to the year in which the survey was con-ducted. For Hypotheses 1 and 2, we expect positivecoefficients for the effects of perceived threats frominformal sector and foreign firm competitors on cor-ruption and HR training, respectively.
For testing the moderating effect of firm diversi-fication suggested by Hypothesis 3, we calculated adiversification index based on the Simpson diversityindex (Abdullah, Ku Ismail, and Nachum, 2015)using data from the survey about firms’ sales ontheir primary product/service (including softwareproducts) as a percentage of their total annual sales.Our diversification index was calculated as (1 – p2)where p is the proportion of a firm’s primary prod-uct/service sales to its total annual sales.3 We multi-plied this index with perceived threat from informal
3 The Simpson index is calculated as(
1 −∑N
i=1 p2i
), where pi is
a firm’s proportion of sales of its ith product/service sales to itstotal sales and N is the total number of products/services soldby the firm. We used only the proportion of a firm’s primaryproduct/service sales to its total sales due to lack of availabilityof data in the survey about all of a firm’s products and services.
competitors to create an interaction term. BecauseHypothesis 3 proposes that less diversified firms aremore likely to engage in corruption activities fora given level of threat from informal sector com-petitors, we expect a negative coefficient for thisinteraction term. For testing the moderating effectof technology capability suggested by Hypothe-sis 4, we used questions on the survey that askedfirms about their patent activity. Prior studies oftenemploy firm’s patent activity as a proxy of its tech-nological capability (Kotha et al., 2011; Sears andHoetker, 2014). We coded 1 for this variable if thefocal firm applied for, or was awarded any patents,in the last three years and 0 otherwise. We thenmultiplied this measure of technological capabilitywith perceived threat from foreign competitors tocreate an interaction term. Because Hypothesis 4proposes that firms with high technological capabil-ity are more likely to make HR training investmentsactivities for a given level of threat from foreign sec-tor competitors, we expect a positive coefficient forthis interaction term.
We included a number of control variablesin our models. Following previous studies, wecontrolled for firm age (log of number of yearsfrom establishment) and firm size (log of num-ber of employees) (Martin et al., 2007; Spencerand Gomez, 2011). We also included a dummyvariable to control for firm’s public status aspublic firms are typically more transparent thanprivate firms and are thus less likely to engage incorruption activities. In addition, we controlled forforeign ownership share in the focal firm. While81 percent of focal firms in our sample are purelydomestic, 19 percent receive some investment fromforeign investors. We also controlled for focalfirms’ advertisement intensity using a dummyvariable. For models of corruption, we also con-trolled for three corruption-related factors. Thefirst variable—corruption as an obstacle—wasmeasured on a five-point Likert-type scale usingthe survey question that asked firms to evaluate theextent to which corruption was an obstacle to thecurrent operations and opportunities for growth ofthe focal firm. The second variable—regulatoryand policy uncertainty—was measured on afive-point Likert-type scale using the surveyquestion that asked firms to evaluate the extent ofregulatory and policy uncertainty that can affectthe current operations and opportunities for growthof the focal firm. The third variable—consistentregulatory interpretation—was measured on a
Diversification Simpson diversity index of firm’s primary product/service share 0.257 0.346Technological capability Binary indicator of patent activities 0.060 0.228Firm level controlsAge Log of number of years a firm has been in operation 11.041 8.904Size Log of number of employees 581.6 5,270.9Foreign ownership share Percentage of foreign ownership 12.697 30.933Advertisement Binary indicator for investment in advertisement 0.483 0.501Public firm Binary indicator for public status 0.127 0.334Other controlsCorruption as an obstacle Five-point Likert-type scale indicator for perception of
corruption as a business obstacle1.513 1.377
Regulatory and policyuncertainty
Five-point Likert-type scale indicator for perception ofregulatory and policy uncertainty as a business obstacle
1.213 1.234
Inconsistent regulatoryinterpretation
Six-point Likert-type scale indicator for perception of thebusiness impact of government officials’ inconsistentinterpretation of law and regulations
3.439 1.617
GDP per capita State level GDP (in US$) divided by population 1,796.8 443.9Northern states Binary indicator (western states as baseline) 0.217 0.413Southern states Binary indicator (western states as baseline) 0.333 0.472Software industry Binary indicator (telecom sector as baseline) 0.573 0.496ITES industry Binary indicator (telecom sector as baseline) 0.169 0.375Media & entertainment
industryBinary indicator (telecom sector as baseline) 0.232 0.423
six-point Likert-type scale that asked firms aboutthe extent to which government officials’ inter-pretations of the laws and regulations affectingthe focal firm are consistent and predictable. Wealso controlled for income level of Indian statesusing GDP per capita, which we obtained fromthe Directorate of Economics & Statistics of therespective State Governments. We also includedregional dummies for northern and southern states,with western states as the baseline. Finally, weincluded dummy variables for three subsectors inthe IT industry—telecom services, software, and
IT enabled services (ITES)—using the telecomservices subsector as the baseline.
RESULTS
Table 1 shows the summary statistics on the vari-ables. About 21 percent of the firms in the sam-ple were engaged in corruption activities, and about50 percent of the firms invested in both internal andexternal HR training, with about 26 percent invest-ing in one of the two trainings. On average, firms
perceived the highest level of competitive threatfrom their domestic rivals, and the lowest level ofthreat from their informal sector rivals. We alsoran t-tests and confirmed that all the three threatvariables significantly differ from 1 (with a valueof 1 signifying “no threat”). This suggests that, onaverage, firms in our sample perceive competitivethreats to some degree from all the three types ofcompetitor groups. Correlations among study vari-ables are provided in Table 2. The VIFs of all studyvariables vary from 1.38 to 2.50, indicating thatmulticollinearity is not a serious concern in ouranalyses.
Since a firm’s engagement in corruption activi-ties was measured as a binary variable, we employthe probit model for evaluating corruption models.Table 3 shows results for firms’ corruption activi-ties. Models 1 and 2 in Table 3 provide results forthe main corruption variable that uses the conserva-tive measure for proactive engagement in corruptionactivities by the focal firm (Model 1 for controlsonly and Model 2 for the full model). Models 3 and4 in Table 3 show results for the alternative corrup-tion variable that uses the expansive measure forany engagement in corruption activities by the focalfirm (Model 3 for controls only and Model 4 forthe full model). In both Models 2 and 4, the coef-ficient for competitive threat from informal sectorfirms is positive and significant (p< 0.001 in Model2, and p< 0.01 in Model 4), providing support forHypothesis 1.
We also obtained a negative coefficient for theinteraction term between competitive threat frominformal sector firms and the focal firm’s diversi-fication index, and it differs from zero (p< 0.001in Model 2, and p< 0.05 in Model 4). This ren-ders support for Hypothesis 3 as results show thata firm with a higher level of diversification is lesslikely to engage in corruption for the same level ofperceived threat from informal sector firms as com-pared to a firm with a lower level of diversification.However, scholars have recently made notes of cau-tion on the interpretation of regression coefficientsfor interaction terms in limited dependent variableregression models, and have proposed additionalanalyses to evaluate the specific range for which theinteraction effects are significant (Hoetker, 2007;Wiersema and Bowen, 2009). Accordingly, follow-ing recent studies (e.g., Fortune and Mitchell, 2012;London et al., 2014), we ran an analysis using thetechnique recommended by Ai and Norton (2003)to determine the significance of the marginal effects
of the interaction term involving competitive threatfrom informal sector firms and diversification index,and we graphed our results. Figure S1(a) illus-trates the interaction effects plot for Model 2 inTable 2, demonstrating negative interaction effectsfor most data points (i.e., the observations are pri-marily below zero). Figure S1(b) is the z-statisticplot with three horizontal lines (lines at z= 1.645,0, and –1.645), and it indicates that the interactioneffects are generally significant for a range between0.1 and 0.8 of the predicted probability of corrup-tion. Overall, results from these additional analysesprovide support for Hypothesis 3.
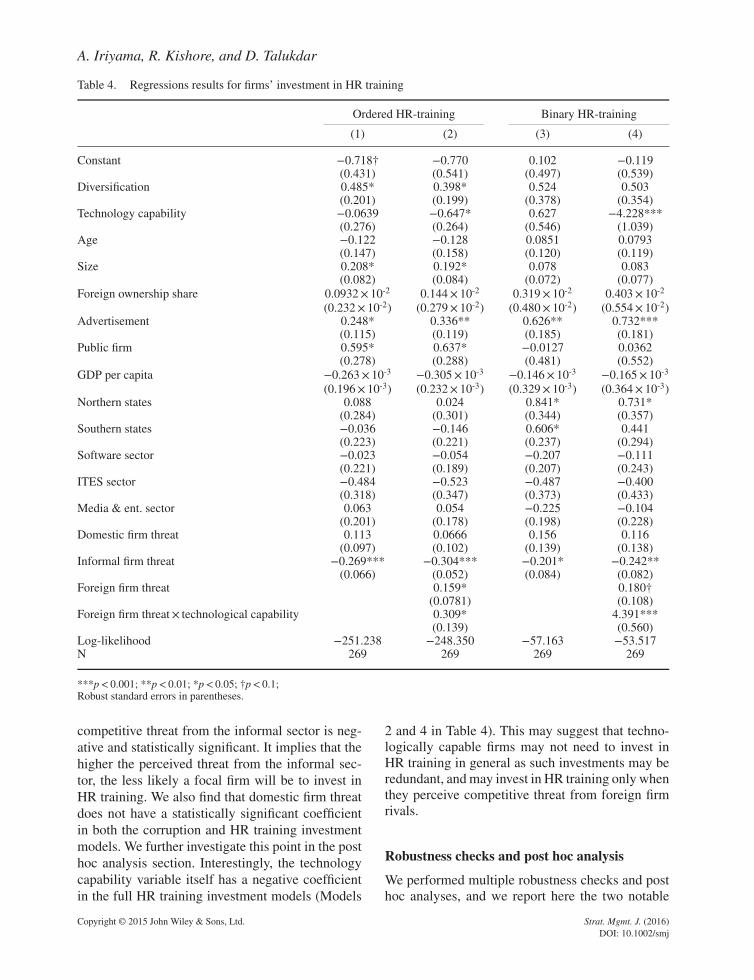
As discussed earlier, a firm’s investment in HRtraining was measured both as an ordered categori-cal variable (0, 1, and 2) as well as a binary vari-able. We employed the ordered probit model andthe binary probit model, respectively, for these twomeasures of the HR training investment variable.Models 1 and 2 in Table 4 show results for theordered categorical variable, and Models 3 and 4in Table 4 show results for the binary variable. Inboth the models, competitive threat from foreignfirms has a significant positive coefficient (p< 0.05in Model 2, and p< 0.10 in Model 4), providing sup-port for Hypothesis 2.
As for Hypothesis 4, the coefficient for theinteraction term between competitive threat fromforeign firms and the focal firm’s technology capa-bility is positive and significant in both Model 2(p< 0.05) and Model 4 (p< 0.001). These resultsare consistent with the prediction in Hypothesis 4as they show that a firm with a higher level oftechnological capability is more likely to invest inHR training for the same level of perceived threatfrom foreign sector firms as compared to a firmwith a lower level of technological capability. How-ever, the results are more nuanced when we ana-lyzed the specific range for which the interactioneffects are significant using the approach by Aiand Norton (2003) as discussed above. The inter-action effects for Model 4 in Table 3 are plotted inFigure S2(a). While this figure shows positive inter-action effect for many observations, it also showsnegative interaction effects for some observations.The z-statistic plot in Figure S2(b) shows that theinteraction effects are generally significant whenthe predicted probability of HR investment is above0.3 and below 0.7. Overall, these additional resultsprovide at least a moderate level of support forHypothesis 4.
***p< 0.001; **p< 0.01; *p< 0.05; †p< 0.1;Robust standard errors in parentheses. Public firm dummy omitted for perfect correlation in Models 1 and 2.
Finally, several results for other variables inboth corruption and HR training investment mod-els are noteworthy. First, in the corruption models(Table 3), the coefficient for perceived competi-tive threat from foreign competitors is negative and
statistically significant, suggesting that the higherthe perceived threat from the foreign firms sec-tor, the less likely a focal firm will be to engagein corruption. Similarly, in the HR training invest-ment models (Table 4), the coefficient for perceived
***p< 0.001; **p< 0.01; *p< 0.05; †p< 0.1;Robust standard errors in parentheses.
competitive threat from the informal sector is neg-ative and statistically significant. It implies that thehigher the perceived threat from the informal sec-tor, the less likely a focal firm will be to invest inHR training. We also find that domestic firm threatdoes not have a statistically significant coefficientin both the corruption and HR training investmentmodels. We further investigate this point in the posthoc analysis section. Interestingly, the technologycapability variable itself has a negative coefficientin the full HR training investment models (Models
2 and 4 in Table 4). This may suggest that techno-logically capable firms may not need to invest inHR training in general as such investments may beredundant, and may invest in HR training only whenthey perceive competitive threat from foreign firmrivals.
Robustness checks and post hoc analysis
We performed multiple robustness checks and posthoc analyses, and we report here the two notable
ones. First, we reexamined our models by using arelative measure of competitive threats. In our mainanalysis, we used raw scores on the competitivethreat questions as measures of the levels of per-ceived competitive threat by a focal firm from threecompetitor groups. We explored whether our resultshold even when we incorporate the threat levelexperienced by a firm from a particular competi-tor group relative to another reference competitorgroup. To examine this, we followed Venkatraman’s(1989) approach and estimated two sets of regres-sion residuals: (1) relative level of threat from infor-mal firms vis-à-vis domestic firms, and (2) relativelevel of threat from foreign firms vis-à-vis domes-tic firms. The results are reported in Table S1. Wefound our main results to hold with this alternativethreat measure.
Second, we explored whether our results of non-significant coefficient for the variable “threat fromdomestic competitors” is generalizable. Our resultsabove for both corruption and HR training mod-els consistently provide nonsignificant coefficientsfor the variable “threat from domestic competitors.”One reason for this could be that domestic firms’sector is a broad and high-level strategic group.The strategic groups literature indicates that man-agers categorize competitors using multiple layersin a taxonomy (Porac and Thomas, 1994). Accord-ingly, a focal firm in our sample may perceive com-petitive threats heterogeneously only at lower lev-els of the “domestic firms” taxonomy (e.g., IT ser-vices, BPO, animation firms), and this may explainwhy threats from domestic competitors at the high-est level of the taxonomy may not impact a focalfirm’s actions. To investigate this point, we con-ducted an analysis using focal firm’s physical capac-ity expansion as another competitive action in theresource-space. Results in Table S2 show a sys-tematic pattern for this firm action: a firm’s capac-ity expansion is influenced by threats from infor-mal and foreign firms, but not by threat fromdomestic firms. Accordingly, we conclude that ourmain results about threat from domestic firms aregeneralizable.
Furthermore, we also checked whether our mainresults vary depending on a focal firm’s foreignownership and its international operation usinginformation from the survey, and we obtainedresults similar to those reported. Moreover, in ourmain regression models, we used GDP per capitato capture heterogeneity among Indian states. Wereplaced this variable with Human Development
Index, which is another appropriate measure tocapture economic levels of states. Data for this vari-able was obtained from Government of India’s 2008National Human Development Report of India. Useof this variable also produced results similar to thosereported.
DISCUSSION AND CONCLUDINGREMARKS
Given increasing competitive pressures throughoutthe world, scholars have begun paying more atten-tion to the mechanisms underlying firm actions inresponse to competitor threats (D’Aveni, Dagnino,and Smith, 2010). Our analysis of the Indian ITindustry reveals that a firm’s engagement in corrup-tion and investment in HR training, as competitiveactions in the nonmarket and resource-marketspaces, are systematically influenced by man-agerial perceptions of threats from informal andforeign sector competitors, respectively. We alsofind that these relationships are contingent ona focal firm’s profile, namely firm diversifica-tion and technological capability. We find ourresults to be robust through multiple robustnesschecks.
Our study makes four important contributions.First, it contributes to the emerging scholarlyliterature on firms’ actions in nonmarket andresource-market spaces. Researchers have recentlybegun developing conceptual models aboutfirms’ competitive actions in nonmarket andresource-market spaces in response to inter-firmrivalry (Capron and Chatain, 2008; Markman et al.,2009). Yet, we know little about why and howcompetitive threats influence a firm to take suchcompetitive actions in practice. Our study fills thisgap by beginning to bridge the competitive rivalryand strategic groups literatures to understandhow managerial perceptions of multiple threatsfrom different competitor groups lead to differentcompetitive actions by firms. While scholars inthe competitive rivalry literature highlight theimportance of managerial perception of threats(e.g., Chen et al., 2007), they typically considerthreats at the firm-dyad level. In contrast, strategicgroup researchers have emphasized that managerialperceptions about competitor groups influencefirm actions. Recent conceptual advances suggestthat a firm identifies with multiple competitorgroups simultaneously (Anand et al., 2013),
implying that firms may take different competitiveactions in systematic ways depending on levelsof perceived threats from different competitorgroups. Our study combines these ideas andprovides empirical evidence that competitivethreats from informal sector firm and foreignfirm groups predispose a focal firm to engage incorruption and invest in HR training in systematicways. Overall, our study extends, and beginsintegrating, the two main streams of competitivestrategy.
Second, and related to the above, we show thatcompetitive actions in response to threats from dif-ferent competitor groups are contingent on firms’resource and market profiles. Competitive rivalryliterature has shown that resource similarity andmarket commonality can lead to increased rivalryamong firms (Chang and Xu, 2008; Chen, 1996).Based on these notions and the emerging mar-kets context, we argued that diversification andtechnological capability moderate the relationshipbetween threat from a particular competitor groupand firm actions of corruption and HR training insystematic ways. Our results provide evidence sup-porting our arguments, thereby further extendingthe literature on strategic groups and competitiverivalry.
Third, our study also extends the nonmarket strat-egy literature in two significant ways. One criticaldistinction of our study from previous studies onnonmarket strategies is that our study examines cor-ruption, which is illegal by its nature, whereas pre-vious studies of nonmarket strategy (e.g., Schuler,1996) have generally examined legal nonmarketactions. The potential risks from engaging in ille-gal activities are much higher than engaging inlegal nonmarket activities (e.g., lobbying). Thus, asMishina et al. (2010) posit, a firm will be carefulwhile engaging in illegal activities. We extend thenonmarket strategy literature by developing theo-retical arguments about the conditions under whicha firm is more likely to engage in illegal activ-ities. Further, prior studies on nonmarket strat-egy have examined nonmarket actions of domesticfirms in developed countries against foreign firmsfrom developing countries (e.g., Schuler, 1996). Weextend this literature by examining resource-marketactions of domestic firms in developing countriesagainst threats posed by foreign firms from devel-oped countries.
Finally, this is one of the first studies to empiri-cally examine competitive rivalry and competitive
actions in emerging markets. This contributionbrings to fore relatively unexplored competitiveactions, particularly corruption, and the role ofrelatively unexplored competitive groups, partic-ularly, the informal sector. Moreover, we extendthe nascent research area of group-level rivalry inemerging markets that has recently focused on firmperformance implication from rivalries betweengroups (e.g., Chang and Xu, 2008) by theorizing alink between threats from rivals in emerging mar-kets and systematic actions by firms in response.
This study is not without limitations, whichalso imply intriguing extensions for future stud-ies. First, strategic group configuration theory, oneof the foundational theoretical perspectives usedfor developing our logics, proposes disidentifica-tion and ambivalent identification of a firm withone or more strategic groups in addition to its iden-tification relationship with those strategic groups(Anand et al., 2013). For simplifying our theoret-ical integration, however, we only considered afirm’s identification relationships as contributing toits perceived competitive threats. Further, data fordisidentification and ambivalent identification rela-tionships were also not available in the World Bankdataset used for this study. We acknowledge thepossibility that the perceived threats would alsodepend on the firm’s disidentification and ambiva-lent identification relationships, and believe that thislimitation provides an interesting future researchopportunity.
Second, previous empirical studies of com-petitive actions often use the count measure ofcompetitive actions. In contrast, the measure ofcompetitive actions in our study is dichotomousdue to the nature of the World Bank data usedin this study. The dichotomous measures aretheoretically appropriate for examining the like-lihood of the two competitive actions consideredin our study. However, we expect future studies toemploy alternative measures for these or similarcompetitive actions. Third, while our assumptionthat most foreign firms in the IT industry in Indiaare from developed countries is fairly reasonable,our dataset does not allow us to break down theirnational origins. Fourth, survey data used in thisstudy is cross-sectional in nature, and may limitour conclusions about causality. However, our the-oretical logic underlying the proposed relationshipsis rooted in the competitive rivalry and strategicgroups theories, which mitigates this concern.Further, our robustness check results are consistent
with our main results, lending further support tothe hypothesized causal relationships. Finally, weacknowledge that the corruption measures usedin the World Bank survey data have sometimesbeen criticized for their reliability (Razafindrakotoand Roubaud, 2010). However, given the inherentdifficulties in collecting information on corruptionactivities, we believe this corruption measure andrelated data are among the most reliable that areavailable.
In conclusion, this study is an important steptoward enhancing our understanding of competi-tive rivalry in emerging markets by examining howfirm actions in both nonmarket and resource-marketspaces result from perceived threats emanating fromdifferent competitor groups. We hope it will stim-ulate further conversations among researchers whoseek to explore the finer nuances of the linkages andmechanisms that connect strategic groups, compet-itive rivalry, and competitive actions in nonmarketand resource-market spaces.
ACKNOWLEDGEMENTS
We gratefully acknowledge the support of WorldBank by providing us the survey dataset used inthis study. We are also grateful to John Prescott forproviding insightful comments on an earlier versionof this article.
REFERENCES
Abdullah SN, Ku Ismail KNI, Nachum L. 2015. Does hav-ing women on boards create value? The impact of soci-etal perceptions and corporate governance in emerg-ing markets. Strategic Management Journal, DOI:10.1002/smj.2352.
Ai C, Norton EC. 2003. Interaction terms in logit and probitmodels. Economics Letters 80(1): 123–129.
Anand V, Joshi M, O’Leary-Kelly AM. 2013. An organi-zational identity qpproach to strategic groups. Organi-zation Science 24(2): 571–590.
Angelini P, Generale A. 2008. On the evolution of firmsize distributions. American Economic Review 98(1):426–438.
Armstrong JS, Collopy F. 1996. Competitor orienta-tion: effects of objectives and information on manage-rial decisions and profitability. Journal of MarketingResearch 33(2): 188–199.
Ashforth BE, Anand V. 2003. The normalization of cor-ruption in organizations. Research in OrganizationalBehavior 25: 1–52.
Bapna R, Langer N, Mehra A, Gopal R, Gupta A. 2013.Human capital investments and employee performance:
an analysis of IT services industry. Management Sci-ence 59(3): 641–658.
Bardhan P. 1997. Corruption and development: a reviewof issues. Journal of Economic Literature 35(3):1320–1346.
Barney J. 1991. Firm resources and sustained competitiveadvantage. Journal of Management 17(1): 99.
Bartsel AP. 1994. Productivity gains from the implementsof employee training programs. Industrial Relations33(4): 411–425.
Becker G. 1964. Human Capital: A Theoretical and Empir-ical Analysis, with Special Reference to Education.National Bureau of Economic Research: New York.
Bruton GD, Dess GG, Janney JJ. 2007. Knowledgemanagement in technology-focused firms in emergingeconomies: caveats on capabilities, networks, and realoptions. Asia Pacific Journal of Management 24(2):115–130.
Capron L, Chatain O. 2008. Competitors’resource-oriented strategies: acting on competi-tors’ resources though interventions in factor marketsand political markets. Academy of Management Review33(1): 97–121.
Caves RE. 1971. International corporations: the industrialeconomics of foreign investment. Economica 38(149):1–27.
Chang SJ, Xu D. 2008. Spillovers and competition amongforeign and local firms in China. Strategic ManagementJournal 29(5): 495–518.
Chen M-J. 1996. Competitor analysis and interfirm rivalry:toward a theoretical integration. Academy of Manage-ment Review 21(1): 100–134.
Chen M-J, MacMillan IC. 1992. Nonresponse and delayedresponse to competitive moves: the roles of competi-tor dependence and action irreversibility. Academy ofManagement Journal 35(3): 539–570.
Chen M-J, Miller D. 1994. Competitive attack, retaliationand performance: an expectancy-valence framework.Strategic Management Journal 15(2): 85–102.
Chen M-J, Smith K, Grimm C. 1992. Action characteristicsas predictors of competitive responses. ManagementScience 38(3): 439–455.
Chen M-J, Su K-H, Tsai W. 2007. Competitive tension: theawareness-motivation-capability perspective. Academyof Management Journal 50(1): 101–118.
Chidambaram P. 2008. Economic Survey 2007–2008,Minister of Finance (ed). Government of India: NewDelhi, India.
Clark BH, Montgomery DB. 1999. Managerial identi-fication of competitors. Journal of Marketing 63(3):67–83.
Conner KR. 1991. A historical comparison ofresource-based theory and five schools of thoughtwithin industrial organization economics: do we have anew theory of the firm? Journal of Management 17(1):121–154.
Cool KO, Schendel D. 1987. Strategic group formationand performance: the case of the U.S. pharmaceuti-cal industry, 1963–1982. Management Science 33(9):1102–1124.
Cull R, Xu LC. 2005. Institutions, ownership, and finance:the determinants of profit reinvestment among Chi-nese firms. Journal of Financial Economics 77(1):117–146.
Dabla-Norris E, Gradstein M, Inchauste G. 2008. Whatcauses firms to hide output? The determinants of infor-mality. Journal of Development Economics 85(1–2):1–27.
D’Aveni RA, Dagnino GB, Smith KG. 2010. The age oftemporary advantage. Strategic Management Journal31(13): 1371–1385.
Delaney JT, Huselid MA. 1996. The impact of humanresource management practices on perceptions of orga-nizational performance. Academy of Management Jour-nal 39(4): 949–969.
Derfus PJ, Maggitti PG, Grimm CM, Smith KG. 2008.The red queen effect: competitive actions and firmperformance. Academy of Management Journal 51(1):61–80.
Dierickx I, Cool K. 1989. Asset stock accumulation andsustainability of competitive advantage. ManagementScience 35(12): 1504–1511.
Doh JP, Rodriguez P, Uhlenbruck K, Collins J, Eden L,Shekshnia S. 2003. Coping with corruption in foreignmarkets [and executive commentary]. Academy of Man-agement Executive (1993–2005) 17(3): 114–129.
Dunning JH. 1980. Toward an eclectic theory of inter-national production: some empirical tests. Journal ofInternational Business Studies 11(1): 9–31.
Dutta N, Kar S, Roy S. 2011. Informal Sector and Cor-ruption: An Empirical Investigation for India, IZA Dis-cussion Paper Series. Institute for the Study of Labor(IZA): Bonn, Germany.
Ferrier WJ. 2001. Navigating the competitive landscape:the drivers and consequences of competitive aggres-siveness. Academy of Management Journal 44(4):858–877.
Ferrier WJ, Smith KG, Grimm CM. 1999. The role ofcompetitive action in market share erosion and indus-try dethronement: a study of industry leaders andchallengers. Academy of Management Journal 42(4):372–388.
Foote DA, Folta TB. 2002. Temporary workers as realoptions. Human Resource Management Review 12(4):579–597.
Fortune A, Mitchell W. 2012. Unpacking firm exit at thefirm and industry levels: the adaptation and selection offirm capabilities. Strategic Management Journal 33(7):794–819.
Galang RMN. 2012. Victim or victimizer: firm responsesto government corruption. Journal of ManagementStudies 49(2): 429–462.
Gardner TM. 2005. Interfirm competition for humanresources: evidence from the software industry.Academy of Management Journal 48(2): 237–256.
Gimeno J, Woo CY. 1996. Hypercompetition in a mul-timarket environment: the role of strategic similarityand multimarket contact in competitive de-escalation.Organization Science 7(3): 322–341.
Givon M, Mahajan V, Muller E. 1995. Software piracy:estimation of lost sales and the impact on softwarediffusion. Journal of Marketing 59(1): 29–37.
Habib M, Leon Z. 2002. Corruption and foreign directinvestment. Journal of International Business Studies33(2): 291–307.
Henisz W, Zelner B. 2012. Strategy and competition in themarket and non-market arena. Academy of ManagementPerspectives (AMP) 26(3): 40–51.
Hillman AJ, Keim GD, Schuler D. 2004. Corporatepolitical activity: a review and research agenda. Journalof Management 30(6): 837–857.
Hodgkinson GP, Johnson G. 1994. Exploring the mentalmodels of competitive strategists: the case for a proces-sual approach. Journal of Management Studies 31(4):525–552.
Hoetker G. 2007. The use of logit and probit models instrategic management research: critical issues. StrategicManagement Journal 28(4): 331–343.
Jayachandran S, Gimeno J, Varadarajan PR. 1999. The the-ory of multimarket competition: a synthesis and impli-cations for marketing strategy. Journal of Marketing63(3): 49–66.
Jeong Y, Weiner RJ. 2012. Who bribes? Evidence fromthe United Nations’ oil-for-food program. StrategicManagement Journal 33(12): 1363–1383.
Karnani A, Wernerfelt B. 1985. Multiple point competi-tion. Strategic Management Journal 6(1): 87–96.
Kelm KM, Narayanan V, Pinches GE. 1995. Shareholdervalue creation during R&D innovation and commercial-ization stages. Academy of Management Journal 38(3):770–786.
Kirca AH, Hult GTM, Roth K, Cavusgil ST, Perryy MZ,Akdeniz MB, Deligonul SZ, Mena JA, Pollitte WA,Hoppner JJ. 2011. Firm-specific assets, multinational-ity, and financial performance: a meta-analytic reviewand theoretical integration. Academy of ManagementJournal 54(1): 47–72.
Knoke D, Kalleberg AL. 1994. Job training in U.S.organizations. American Sociological Review 59(4):537–546.
Kotha R, Zheng Y, George G. 2011. Entry into new niches:the effects of firm age and the expansion of technologi-cal capabilities on innovative output and impact. Strate-gic Management Journal 32(9): 1011–1024.
Kozhikode RK, Li J. 2012. Political pluralism, public poli-cies, and organizational choices: banking branch expan-sion in India, 1948–2003. Academy of ManagementJournal 55(2): 339–359.
Krishnan R, Kozhikode R. 2015. Status and corporateillegality: illegal loan recovery practices of commercialbanks in India. Academy of Management Journal 58(5):1287–1312.
Labianca G, Fairbank JF, Thomas JB, Gioia DA,Umphress EE. 2001. Emulation in academia: balanc-ing structure and identity. Organization Science 12(3):312–330.
London T, Esper H, Grogan-Kaylor A, Kistruck GM. 2014.Connecting poverty to purchase in informal markets.Strategic Entrepreneurship Journal 8(1): 37–55.
Marcelli EA, Pastor M Jr, Joassart PM. 1999. Estimatingthe effects of informal economic activity: evidencefrom Los Angeles county. Journal of Economic Issues33(3): 579–607.
Markman GD, Gianiodis PT, Buchholtz AK. 2009.Factor-market rivalry. Academy of ManagementReview 34(3): 423–441.
Martin KD, Cullen JB, Johnson JL, Parboteeah KP.2007. Deciding to bribe: a cross-level analysisof firm and home country influences on briberyactivity. Academy of Management Journal 50(6):1401–1422.
Mishina Y, Dykes BJ, Block ES, Pollock TG. 2010. Why“good” firms do bad things: the effects of high aspira-tions, high expectations, and prominence on the inci-dence of corporate illegality. Academy of ManagementJournal 53(4): 701–722.
Montiel I, Husted BW, Christmann P. 2012. Using pri-vate management standard certification to reduce infor-mation asymmetries in corrupt environments. StrategicManagement Journal 33(9): 1103–1113.
Peteraf M, Shanley M. 1997. Getting to know you: a theoryof strategic group identity. Strategic Management Jour-nal(Summer Special Issue: Organizational and Com-petitive Interactions) 18: 165–186.
Porac JF, Thomas H. 1990. Taxonomic mental models incompetitor definition. Academy of Management Review15(2): 224–240.
Porac JF, Thomas H. 1994. Cognitive categorization andsubjective rivalry among retailers in a small city. Jour-nal of Applied Psychology 79(1): 54–66.
Porac JF, Thomas H, Baden-Fuller C. 1989. Competitivegroups as cognitive communities: the case of Scottishknitwear manufacturers. Journal of Management Stud-ies 26(4): 397–416.
Porac JF, Thomas H, Baden-Fuller C. 2011. Competitivegroups as cognitive communities: the case of Scottishknitwear manufacturers revisited. Journal of Manage-ment Studies 48(3): 646–664.
Porter M. 1980. Competitive Strategy. Free Press: NewYork.
Portes A (ed). 1994. The Informal Economy and ItsParadoxes. Princeton University Press: Princeton, NJ.
PTI. 2012. IT, ITeS-BPO attrition drops in India:Assocham. Times of India.
Raijman R. 2001. Mexican immigrants and informalself-employment in Chicago. Human Organization60(1): 47–55.
Rao H, Drazin R. 2002. Overcoming resource constraintson product innovation by recruiting talent from rivals: astudy of the mutual fund industry, 1986–94. Academyof Management Journal 45(3): 491–507.
Ratnam CSV. 2006. Industrial Relations. Oxford Univer-sity Press: New Delhi, India.
Razafindrakoto M, Roubaud F. 2010. Are internationaldatabases on corruption reliable? A comparisonof expert opinion surveys and household surveysin sub-Saharan Africa. World Development 38(8):1057–1069.
Rodriguez P, Uhlenbruck K, Eden L. 2005. Govern-ment corruption and the entry strategies of multi-nationals. Academy of Management Review 30(2):383–396.
Russell JS, Terborg JR, Powers ML. 1985. Organizationalperformance and organizational level training and sup-port. Personnel Psychology 38(4): 849–863.
Schneider F. 2002. The size and development of theshadow economies of 22 transition and 21 OECDcountries. Discussion paper, Institute for the Study ofLabor (IZA), Bonn, Germany; 514.
Schuler DA. 1996. Corporate political strategy and foreigncompetition: the case of the steel industry. Academy ofManagement Journal 39(3): 720–737.
Sears J, Hoetker G. 2014. Technological overlap, tech-nological capabilities, and resource recombinationin technological acquisitions. Strategic ManagementJournal 35(1): 48–67.
Singh A, Singh AD. 2013. Bribery and Corruption:Ground Reality in India. EY Fraud Investigation & Dis-pute Services: India.
Spencer J, Gomez C. 2011. MNEs and corruption:the impact of national institutions and subsidiarystrategy. Strategic Management Journal 32(3):280–300.
Svensson J. 2003. Who must pay bribes and how much?Evidence from a cross section of firms. QuarterlyJournal of Economics 118(1): 207–230.
Tsai W, Su K-H, Chen M-J. 2011. Seeing through the eyesof a rival: competitor acumen based on rival-centricperceptions. Academy of Management Journal 54(4):761–778.
Uhlenbruck K, Rodriguez P, Doh J, Eden L. 2006. Theimpact of corruption on entry strategy: evidence fromtelecommunication projects in emerging economies.Organization Science 17(3): 402–414.
Venkatraman N. 1989. The concept of fit in strategyresearch: toward verbal and statistical correspondence.Academy of Management Review 14(3): 423–444.
Webb JW, Tihanyi L, Ireland RD, Sirmon DG. 2009. Yousay illegal, I say legitimate: entrepreneurship in theinformal economy. Academy of Management Review34(3): 492–510.
Wiersema MF, Bowen HP. 2009. The use of limiteddependent variable techniques in strategy research:issues and methods. Strategic Management Journal30(6): 679–692.
Yiu L, Saner R. 2011. Talent Recruitment, Attrition andRetention: Strategic Challenges for Indian Industries inthe Next Decade. Centre for Socio-Eco-Nomic Devel-opment: Geneva, Switzerland.
Yu T, Cannella AA. 2007. Rivalry between multinationalenterprises: an event history approach. Academy ofManagement Journal 50(3): 665–686.
Zeng M, Williamson P. 2003. The hidden dragons. Har-vard Business Review October 2003: 49–57.
Zhou KZ, Wu F. 2010. Technological capability, strategicflexibility, and product innovation. Strategic Manage-ment Journal 31(5): 547–561.
Ziedonis RH. 2004. Don’t fence me in: fragmented marketsfor technology and the patent acquisition strategies offirms. Management Science 50(6): 804–820.