163
| Date post: | 27-Oct-2014 |
| Category: |
Documents |
| Upload: | alyssa-frigillana |
| View: | 88 times |
| Download: | 0 times |


SEC Number PW-55 File Number
________________________________________________
PHILIPPINE LONG DISTANCE TELEPHONE COMPANY
________________________________________________ (Company’s Full Name)
Ramon Cojuangco Building Makati Avenue, Makati City
_________________________________________________ (Company’s Address)
(632) 816-8556 ______________________________________
(Telephone Number)
Not Applicable ______________________________________
(Fiscal Year Ending) (month & day)
SEC Form 17-Q ______________________________________
Form Type
Not Applicable ______________________________________
Amendment Designation (if applicable)
June 30, 2011 ______________________________________
Period Ended Date
Not Applicable __________________________________________________
(Secondary License Type and File Number)

August 2, 2011 Securities and Exchange Commission SEC Building, EDSA Mandaluyong City Attention: Director Justina Callangan Corporation Finance Department Gentlemen: In accordance with Section 17.1(b) of the Securities Regulation Code and SRC Rule 17.1, we submit herewith two (2) copies of SEC Form 17-Q with Management’s Discussion and Analysis and accompanying unaudited consolidated financial statements for the six (6) months ended June 30, 2011.
Very truly yours,
PHILIPPINE LONG DISTANCE TELEPHONE COMPANY
MA. LOURDES C. RAUSA-CHAN Corporate Secretary

COVER SHEET
P W - 5 5 S.E.C. Registration No.
P H I L I P P I N E L O N G D I S T A N C E
T E L E P H O N E C O M P A N Y
(Company’s Full Name)
R A M O N C O J U A N G C O B L D G .
M A K A T I A V E . M A K A T I C I T Y (Business Address: No. Street City/Town/Province)
MS. JUNE CHERYL A. CABAL 816-8534
Contact Person Company Telephone Number 1
2
3
1
SEC FORM 17-Q
0
6
Every 2nd Tuesday
Month Day FORM TYPE Month Day Fiscal Year Annual Meeting
C F D N/A
Dept. Requiring this Doc. Amended Articles Number/Section
Total Amount of Borrowings
2,181,790 As of June 30, 2011
N/A
N/A
Total No. of Stockholders Domestic Foreign ----------------------------------------------------------------------------------------------------------------------------------
To be accomplished by SEC Personnel concerned
______________________________
File Number LCU
______________________________ Document I.D. Cashier
STAMPS
Remarks: Please use black ink for scanning purposes.

SECURITIES AND EXCHANGE COMMISSION
SEC FORM 17-Q
QUARTERLY REPORT PURSUANT TO SECTION 17 OF THE SECURITIES REGULATION CODE (“SRC”) AND
SRC 17 (2) (b) THEREUNDER
1. For the quarterly period ended June 30, 2011 2. SEC Identification Number PW-55 3. BIR Tax Identification No. 000-488-793 4. Philippine Long Distance Telephone Company Exact name of registrant as specified in its charter 5. Republic of the Philippines Province, country or other jurisdiction of incorporation or organization 6. Industry Classification Code: (SEC Use Only) 7. Ramon Cojuangco Building, Makati Avenue, Makati City 0721 Address of registrant’s principal office Postal Code 8. (632) 816-8556 Registrant’s telephone number, including area code 9. Not Applicable Former name, former address, and former fiscal year, if changed since last report
10. Securities registered pursuant to Sections 8 of the SRC Title of Each Class Number of Shares of Common Stock Outstanding Common Capital Stock, Php5 par value 186,756,663 shares as at June 30, 2011
11. Are any or all of these securities listed on the Philippine Stock Exchange? Yes [ X ] No [ ]
12. Check whether the registrant
(a) has filed all reports required to be filed by Section 17 of the SRC during the preceding ten months (or for such shorter period that the registrant was required to file such reports):
Yes [ X ] No [ ] (b) has been subject to such filing requirements for the past 90 days. Yes [ X ] No [ ]
TABLE OF CONTENTS Page PART I − FINANCIAL INFORMATION ............................................................................... 1
Item 1. Consolidated Financial Statements ...................................................................... 1
Item 2. Management’s Discussion and Analysis of Financial Condition and Results of Operations .............................................................. 1 Financial Highlights and Key Performance Indicators ......................................... 2 Overview .............................................................................................................. 3
Performance Indicators ......................................................................................... 3 Management’s Financial Review ......................................................................... 5
Results of Operations ........................................................................................... 6 Wireless ........................................................................................................... 9 Revenues ..................................................................................................... 9 Expenses .................................................................................................... 17 Other Income .............................................................................................. 19
Provision for Income Tax ........................................................................... 19 Net Income ................................................................................................. 19
EBITDA ...................................................................................................... 20 Core Income ............................................................................................... 20
Fixed Line ........................................................................................................ 20 Revenues ..................................................................................................... 20 Expenses .................................................................................................... 24 Other Income .............................................................................................. 26
Provision for Income Tax ........................................................................... 26 Net Income ................................................................................................. 27
EBITDA ...................................................................................................... 27 Core Income ............................................................................................... 27
Information and Communications Technology ............................................... 27 Revenues ..................................................................................................... 27 Expenses .................................................................................................... 29 Other Income .............................................................................................. 31
Provision for (Benefit from) Income Tax ................................................... 31 Net Income ................................................................................................. 31
EBITDA ...................................................................................................... 31 Core Income ............................................................................................... 31
Liquidity and Capital Resources ......................................................................... 32 Operating Activities ........................................................................................ 33 Investing Activities ......................................................................................... 33 Financing Activities ........................................................................................ 33
Off-Statement of Financial Position Arrangements ............................................. 36 Equity Financing ................................................................................................. 36 Contractual Obligations and Commercial Commitments .................................... 36
Quantitative and Qualitative Disclosures about Market Risks ............................ 36 Impact of Inflation and Changing Prices ............................................................. 38 PART II – OTHER INFORMATION ....................................................................................... 38
Related Party Transactions ................................................................................... 40 ANNEX – Aging of Accounts Receivable ................................................................................ A-1 SIGNATURES ......................................................................................................................... S-1

2Q 2011 Fo rm 17 -Q Page 1 o f 40
PART I – FINANCIAL INFORMATION Item 1. Consolidated Financial Statements
Our consolidated financial statements as at June 30, 2011 (unaudited) and December 31, 2010 (audited) and for the six months ended June 30, 2011 and 2010 (unaudited) and related notes (pages F-1 to F-115) are filed as part of this report on Form 17-Q. Item 2. Management’s Discussion and Analysis of Financial Condition and Results of Operations
In the following discussion and analysis of our financial condition and results of operations, unless the context indicates or otherwise requires, references to “we,” “us,” “our” or “PLDT Group” mean the Philippine Long Distance Telephone Company and its consolidated subsidiaries, and references to “PLDT” mean the Philippine Long Distance Telephone Company, not including its consolidated subsidiaries (please see Note 2 – Summary of Significant Accounting Policies to the accompanying unaudited consolidated financial statements for the list of these subsidiaries, including a description of their respective principal business activities and PLDT’s direct and/or indirect equity interest).
The following discussion and analysis of our financial condition and results of operations should be read in conjunction with the accompanying unaudited consolidated financial statements and the related notes. Our unaudited consolidated financial statements, and the financial information discussed below, have been prepared in accordance with Philippine Financial Reporting Standards, or PFRS, which is virtually converged with International Financial Reporting Standards as issued by the International Accounting Standards Board except for some transitional differences. PFRS differs in certain significant respects from generally accepted accounting principles, or GAAP, in the U.S.
The financial information appearing in this report and in the accompanying unaudited consolidated financial statements is stated in Philippine pesos. All references to “Philippine pesos,” “Php” or “pesos” are to the lawful currency of the Philippines; all references to “U.S. dollars,” “US$” or “dollars” are to the lawful currency of the United States; all references to “Japanese yen,” “JP¥” or “yen” are to the lawful currency of Japan and all references to “Euro” or “€” are to the lawful currency of the European Union. Unless otherwise indicated, translations of Philippine peso amounts into U.S. dollars in this report and in the accompanying unaudited consolidated financial statements were made based on the exchange rate of Php43.36 to US$1.00, the volume weighted average exchange rate as at June 30, 2011 quoted through the Philippine Dealing System.
Some information in this report may contain forward-looking statements within the meaning of Section 27A of the U.S. Securities Act of 1933, as amended, and Section 21E of the U.S. Securities Exchange Act of 1934, as amended. We have based these forward-looking statements on our current beliefs, expectations and intentions as to facts, actions and events that will or may occur in the future. Such statements generally are identified by forward-looking words such as “believe,” “plan,” “anticipate,” “continue,” “estimate,” “expect,” “may,” “will” or other similar words.
A forward-looking statement may include a statement of the assumptions or bases underlying the forward-looking statement. We have chosen these assumptions or bases in good faith, and we believe that they are reasonable in all material respects. However, we caution you that forward-looking statements and assumed facts or bases almost always vary from actual results, and the differences between the results implied by the forward-looking statements and assumed facts or bases and actual results can be material, depending on the circumstances. When considering forward-looking statements, you should keep in mind the description of risks and cautionary statements in this report. You should also keep in mind that any forward-looking statement made by us in this report or elsewhere speaks only as at the date on which we made it. New risks and uncertainties come up from time to time, and it is impossible for us to predict these events or how they may affect us. We have no duty to, and do not intend to, update or revise the forward-looking statements in this report after the date hereof. In light of these risks and uncertainties, actual results may differ materially from any forward-looking statement made in this report or elsewhere might not occur.
2Q 2011 Fo rm 17 -Q Page 2 o f 40
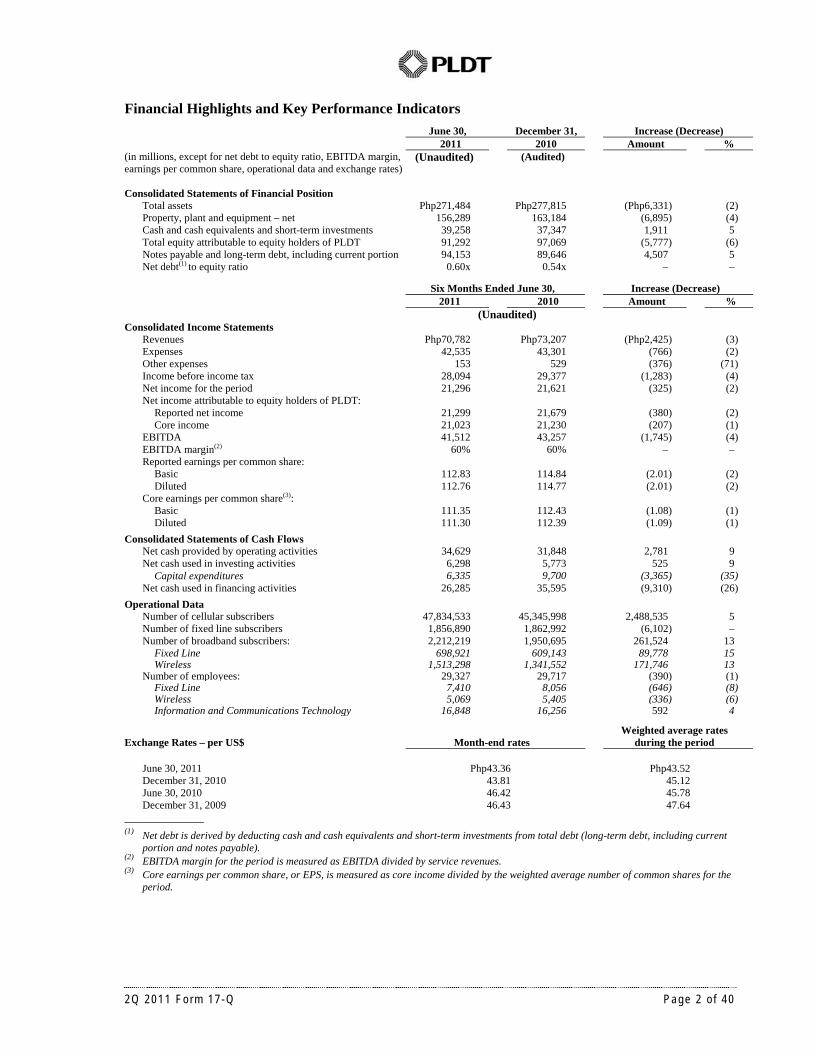
Financial Highlights and Key Performance Indicators
June 30, December 31, Increase (Decrease) 2011 2010 Amount % (in millions, except for net debt to equity ratio, EBITDA margin, earnings per common share, operational data and exchange rates)
(Unaudited) (Audited)
Consolidated Statements of Financial Position
Total assets Php271,484 Php277,815 (Php6,331) (2) Property, plant and equipment – net 156,289 163,184 (6,895) (4) Cash and cash equivalents and short-term investments 39,258 37,347 1,911 5 Total equity attributable to equity holders of PLDT 91,292 97,069 (5,777) (6) Notes payable and long-term debt, including current portion 94,153 89,646 4,507 5 Net debt(1) to equity ratio 0.60x 0.54x – –
Six Months Ended June 30, Increase (Decrease)
2011 2010 Amount % (Unaudited) Consolidated Income Statements
Revenues Php70,782 Php73,207 (Php2,425) (3) Expenses 42,535 43,301 (766) (2) Other expenses 153 529 (376) (71) Income before income tax 28,094 29,377 (1,283) (4) Net income for the period 21,296 21,621 (325) (2) Net income attributable to equity holders of PLDT:
Reported net income 21,299 21,679 (380) (2) Core income 21,023 21,230 (207) (1)
EBITDA 41,512 43,257 (1,745) (4) EBITDA margin(2) 60% 60% – – Reported earnings per common share:
Basic 112.83 114.84 (2.01) (2) Diluted 112.76 114.77 (2.01) (2)
Core earnings per common share(3): Basic 111.35 112.43 (1.08) (1) Diluted 111.30 112.39 (1.09) (1)
Consolidated Statements of Cash Flows Net cash provided by operating activities 34,629 31,848 2,781 9 Net cash used in investing activities 6,298 5,773 525 9
Capital expenditures 6,335 9,700 (3,365) (35) Net cash used in financing activities 26,285 35,595 (9,310) (26)
Operational Data Number of cellular subscribers 47,834,533 45,345,998 2,488,535 5 Number of fixed line subscribers 1,856,890 1,862,992 (6,102) – Number of broadband subscribers: 2,212,219 1,950,695 261,524 13
Fixed Line 698,921 609,143 89,778 15Wireless 1,513,298 1,341,552 171,746 13
Number of employees: 29,327 29,717 (390) (1)Fixed Line 7,410 8,056 (646) (8)Wireless 5,069 5,405 (336) (6)Information and Communications Technology 16,848 16,256 592 4
Exchange Rates – per US$ Month-end rates Weighted average rates
during the period June 30, 2011 Php43.36 Php43.52 December 31, 2010 43.81 45.12 June 30, 2010 46.42 45.78 December 31, 2009 46.43 47.64
______________ (1) Net debt is derived by deducting cash and cash equivalents and short-term investments from total debt (long-term debt, including current
portion and notes payable). (2) EBITDA margin for the period is measured as EBITDA divided by service revenues. (3) Core earnings per common share, or EPS, is measured as core income divided by the weighted average number of common shares for the
period.

2Q 2011 Fo rm 17 -Q Page 3 o f 40
Overview We are the largest and most diversified telecommunications company in the Philippines. We
have organized our business into business units based on our products and services and have three reportable operating segments which serve as the basis for management’s decision to allocate resources and evaluate operating performance:
• Wireless ⎯ wireless telecommunications services provided by Smart Communications,
Inc., or Smart, and Connectivity Unlimited Resource Enterprise, our cellular service providers; Smart Broadband, Inc., or SBI, Airborne Access Corporation, and Primeworld Digital Systems, Inc., or PDSI, our wireless broadband service providers; Wolfpac Mobile, Inc., or Wolfpac, and Chikka Holdings Limited, or Chikka, and Subsidiaries, or Chikka Group, our wireless content operators; and ACeS Philippines Cellular Satellite Corporation, or ACeS Philippines, our satellite operator;
• Fixed Line ⎯ fixed line telecommunications services primarily provided by PLDT. We
also provide fixed line services through PLDT’s subsidiaries, namely, PLDT Clark Telecom, Inc., PLDT Subic Telecom, Inc., PLDT-Philcom, Inc. and Subsidiaries, PLDT-Maratel, Inc., SBI, PDSI, Bonifacio Communications Corporation, and PLDT Global Corporation, or PLDT Global, all of which together account for approximately 4% of our consolidated fixed line subscribers; and
• Information and Communications Technology, or ICT ⎯ information and communications
infrastructure and services for internet applications, internet protocol, or IP-based solutions and multimedia content delivery provided by ePLDT, Inc., or ePLDT, and BayanTrade, Inc.; knowledge processing solutions provided by SPi Technologies, Inc., or SPi, and Subsidiaries, or SPi Group; customer relationship management provided by SPi CRM Inc., or SPi CRM; internet access and online gaming services provided by Infocom Technologies, Inc., Digital Paradise, Inc., or Digital Paradise (on April 1, 2011, ePLDT sold its entire 75% stake in Digital Paradise), netGames, Inc. and Level Up!, Inc., or Level Up! (on July 11, 2011, ePLDT sold its entire 57.51% interest in Level Up!); and e-commerce, and IT-related services provided by other investees of ePLDT, as discussed in Note 10 – Investments in Associates and Joint Ventures to the accompanying unaudited consolidated financial statements.
Performance Indicators
We use a number of non-GAAP performance indicators to monitor financial performance.
These are summarized below and discussed later in this report. EBITDA EBITDA is measured as net income excluding depreciation and amortization, amortization of
intangible assets, asset impairment on noncurrent assets, financing costs, interest income, equity share in net earnings (losses) of associates and joint ventures, foreign exchange gains (losses) – net, gains (losses) on derivative financial instruments – net, provision for (benefit from) income tax and other income. EBITDA is monitored by the management for each business unit separately for purposes of making decisions about resource allocation and performance assessment. EBITDA is presented also a supplemental disclosure because our management believes that it is widely used by investors in their analysis of the performance of PLDT and to assist them in their comparison of PLDT’s performance

2Q 2011 Fo rm 17 -Q Page 4 o f 40
with that of other companies in the technology, media and telecommunications sector. We also present EBITDA because it is used by some investors as a way to measure a company’s ability to incur and service debt, make capital expenditures and meet working capital requirements. Companies in the technology, media and telecommunications sector have historically reported EBITDA as a supplement to financial measures in accordance with PFRS. EBITDA should not be considered as an alternative to net income as an indicator of our performance, as an alternative to cash flows from operating activities as a measure of liquidity, or as an alternative to any other measure determined in accordance with PFRS. Unlike net income, EBITDA does not include depreciation and amortization or financing costs and, therefore, does not reflect current or future capital expenditures or the cost of capital. We compensate for these limitations by using EBITDA as only one of several comparative tools, together with PFRS-based measurements, to assist in the evaluation of operating performance. Such PFRS-based measurements include income before income tax, net income, cash flows from operations and cash flow data. We have significant uses of cash flows, including capital expenditures, interest payments, debt principal repayments, taxes and other non-recurring charges, which are not reflected in EBITDA. Our calculation of EBITDA may be different from the calculation methods used by other companies and, therefore, comparability may be limited.
Core Income Core income is measured as net income attributable to equity holders of PLDT (net income less
net income attributable to non-controlling interests), excluding foreign exchange gains (losses) – net, gains (losses) on derivative financial instruments – net (excluding hedge costs), asset impairment on noncurrent assets, other non-recurring gains (losses), net of tax effect of aforementioned adjustments, as applicable, and similar adjustments to equity share in net earnings (losses) of associates and joint ventures. The core income results are monitored by the management for each business unit separately for purposes of making decisions about resource allocation and performance assessment. Also, core income is used by the management as a basis of determining the level of dividend payouts to shareholders and basis of granting incentives to employees. Core income should not be considered as an alternative to income before income tax or net income determined in accordance with PFRS as an indicator of our performance. Unlike income before income tax, core income does not include foreign exchange gains and losses, gains and losses on derivative financial instruments, asset impairments and other non-recurring gains and losses. We compensate for these limitations by using core income as only one of several comparative tools, together with PFRS-based measurements, to assist in the evaluation of operating performance. Such PFRS-based measurements include income before income tax and net income. Our calculation of core income may be different from the calculation methods used by other companies and, therefore, comparability may be limited.

2Q 2011 Fo rm 17 -Q Page 5 o f 40
Management’s Financial Review
We use EBITDA and core income to assess our operating performance. The reconciliation of our consolidated EBITDA and our consolidated core income to our consolidated net income for the six months ended June 30, 2011 and 2010 are set forth below.
The following table shows the reconciliation of our consolidated EBITDA to our consolidated
net income for the six months ended June 30, 2011 and 2010:
2011 2010 (in millions)
Consolidated EBITDA Php41,512 Php43,257 Amortization of intangible assets (144) (178) Depreciation and amortization (13,118) (13,054) Asset impairment on non-financial assets (3) (119) 28,247 29,906 Equity share in net earnings of associates and joint ventures 839 881 Interest income 645 612 Gains on derivative financial instruments – net 484 934 Foreign exchange gains (losses) – net 426 (59) Financing costs – net (3,178) (3,451) Other income 631 554 Consolidated income before income tax 28,094 29,377 Provision for income tax (6,798) (7,756) Consolidated net income for the period Php21,296 Php21,621
The following table shows the reconciliation of our consolidated core income to our
consolidated net income for the six months ended June 30, 2011 and 2010:
2011 2010 (in millions)
Consolidated core income for the period Php21,023 Php21,230 Gains on derivative financial instruments – net, excluding hedge cost 663 1,189 Foreign exchange gains (losses) – net 423 (59) Core income adjustment on equity share in net earnings of associates and joint ventures (458) (227) Others (74) (115) Net tax effect of aforementioned adjustments (278) (339) Net income attributable to equity holders of PLDT 21,299 21,679 Net loss attributable to non-controlling interests (3) (58) Consolidated net income for the period Php21,296 Php21,621

2Q 2011 Fo rm 17 -Q Page 6 o f 40
Results of Operations The table below shows the contribution by each of our business segments to our consolidated
revenues, expenses, other income, income before income tax, provision for (benefit from) income tax, net income, EBITDA, EBITDA margin and core income for the six months ended June 30, 2011 and 2010. Majority of our revenues are derived from our operations within the Philippines.
Wireless Fixed Line ICT Inter-segment Transactions Consolidated
(in millions)For the six months ended June 30, 2011
Revenues Php46,334 Php23,784 Php5,671 (Php5,007) Php70,782 Expenses 24,107 18,387 5,149 (5,108) 42,535 Other income (expenses) 271 (519) 196 (101) (153)Income before income tax 22,498 4,878 718 – 28,094 Provision for income tax 5,383 1,366 49 – 6,798 Net income for the period/Segment
profit for the period 17,115 3,512 669 – 21,296
EBITDA for the period 29,039 11,393 979 101 41,512 EBITDA margin for the period(1) 63% 49% 18% – 60% Core income for the period 17,428 2,939 656 – 21,023
For the six months ended June 30, 2010
Revenues 48,621 25,417 5,497 (6,328) 73,207 Expenses 25,758 18,723 5,277 (6,457) 43,301 Other income (expenses) (46) (420) 66 (129) (529)Income before income tax 22,817 6,274 286 – 29,377 Provision for (benefit from) income tax 6,051 1,724 (19) – 7,756 Net income for the period/Segment
profit for the period 16,766 4,550 305 – 21,621 EBITDA for the period 29,704 12,668 756 129 43,257 EBITDA margin for the period(1) 62% 50% 14% – 60% Core income for the period 17,133 3,753 344 – 21,230
Increase (Decrease) Amount % Amount % Amount % Amount % Amount %
(in millions) Revenues (Php2,287) (5) (Php1,633) (6) Php174 3 Php1,321 (21) (Php2,425) (3) Expenses (1,651) (6) (336) (2) (128) (2) 1,349 (21) (766) (2)Other income (expenses) 317 689 (99) 24 130 197 28 (22) 376 (71)Income before income tax (319) (1) (1,396) (22) 432 151 – – (1,283) (4)Provision for (benefit from) income tax (668) (11) (358) (21) 68 358 – – (958) (12)Net income for the period/Segment
profit for the period 349 2 (1,038) (23) 364 119 – – (325) (2)EBITDA for the period (665) (2) (1,275) (10) 223 29 (28) (22) (1,745) (4)Core income for the period 295 2 (814) (22) 312 91 – – (207) (1)
___________ (1) EBITDA margin for the period is measured as EBITDA divided by service revenues.

2Q 2011 Fo rm 17 -Q Page 7 o f 40
On a Consolidated Basis
We registered consolidated revenues of Php70,782 million in the first half of 2011, a decrease of Php2,425 million, or 3%, as compared with Php73,207 million in the same period in 2010, primarily due to a decline in our service revenues by Php2,515 million as a result of decreases in cellular and satellite revenues from our wireless business, as well as lower revenues from local exchange, national and international long distance services, partly offset by the increase in data and other network services of our fixed line business.
The following table shows the breakdown of our consolidated revenues for the six months
ended June 30, 2011 and 2010 by business segment:
Change 2011 % 2010 % Amount % (in millions) Wireless Php46,334 65 Php48,621 66 (Php2,287) (5) Fixed line 23,784 34 25,417 35 (1,633) (6) Information and communications technology 5,671 8 5,497 8 174 3 Inter-segment transactions (5,007) (7) (6,328) (9) 1,321 (21) Consolidated Php70,782 100 Php73,207 100 (Php2,425) (3)
Consolidated expenses decreased by Php766 million, or 2%, to Php42,535 million in the first
half of 2011 from Php43,301 million in the same period in 2010, largely as a result of decreases in compensation and employee benefits, asset impairment, rent, taxes and licenses, and amortization of intangible assets, partly offset by higher professional and other contracted services, repairs and maintenance, insurance and security services, and depreciation and amortization.
The following table shows the breakdown of our consolidated expenses for the six months
ended June 30, 2011 and 2010 by business segment:
Change 2011 % 2010 % Amount % (in millions) Wireless Php24,107 57 Php25,758 60 (Php1,651) (6) Fixed line 18,387 43 18,723 43 (336) (2) Information and communications technology 5,149 12 5,277 12 (128) (2) Inter-segment transactions (5,108) (12) (6,457) (15) 1,349 (21) Consolidated Php42,535 100 Php43,301 100 (Php766) (2)
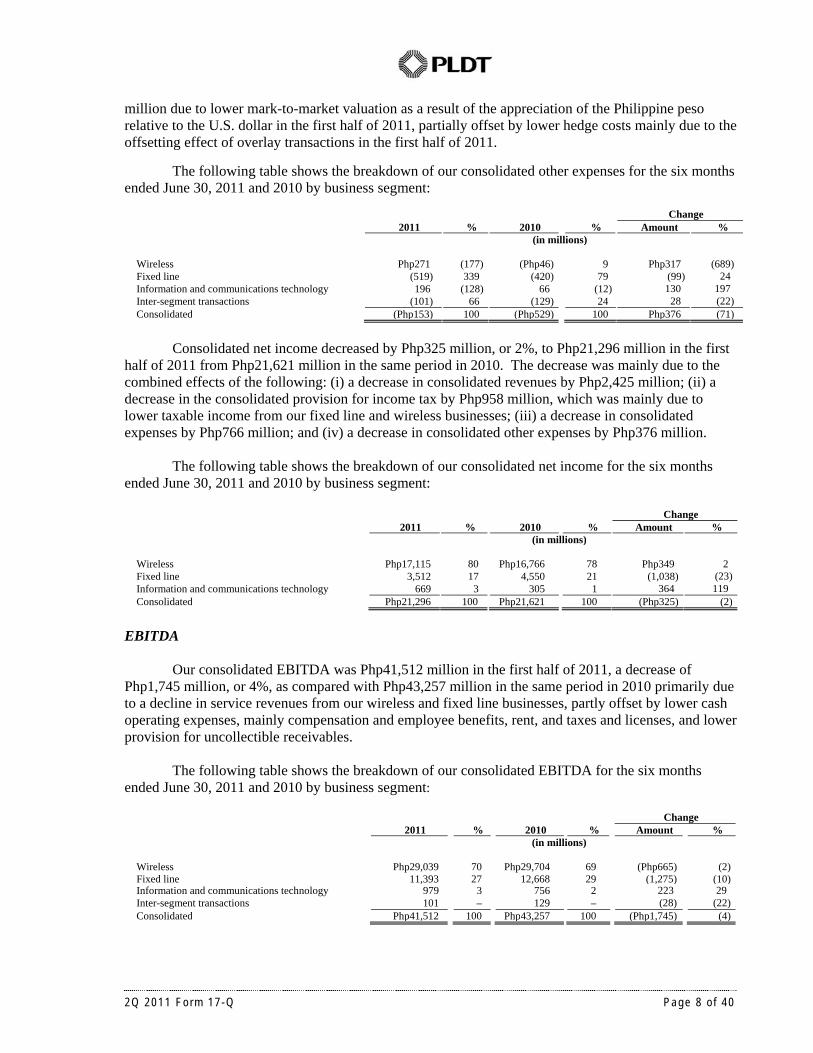
Consolidated other expenses in the first half of 2011 amounted to Php153 million, a decrease of
Php376 million, or 71%, from Php529 million in the same period in 2010 primarily due to the combined effects of the following: (i) net foreign exchange gains of Php426 million in the first half of 2011 as compared to net foreign exchange losses of Php59 million in the same period in 2010 due to the revaluation of foreign-currency denominated assets and liabilities as a result of the effect of the appreciation of the Philippine peso to the U.S. dollar; (ii) a decrease in net financing costs by Php273 million mainly due to lower interest on loans and other related items on account of PLDT’s and Smart’s lower average loan balances, partially offset by higher accretion on amortization of debt issuance costs and debt discount; (iii) an increase in other income by Php77 million mainly due to pension benefit income recognized by PLDT, partially offset by lower gain on disposal of fixed assets; (iv) higher interest income by Php33 million due to a higher average level of peso short-term investments and a higher average interest rate; (v) net decrease in equity share in net earnings of associates and joint ventures of Php42 million; and (vi) lower net gains on derivative financial instruments by Php450
2Q 2011 Fo rm 17 -Q Page 8 o f 40
million due to lower mark-to-market valuation as a result of the appreciation of the Philippine peso relative to the U.S. dollar in the first half of 2011, partially offset by lower hedge costs mainly due to the offsetting effect of overlay transactions in the first half of 2011.
The following table shows the breakdown of our consolidated other expenses for the six months ended June 30, 2011 and 2010 by business segment:
Change 2011 % 2010 % Amount % (in millions) Wireless Php271 (177) (Php46) 9 Php317 (689) Fixed line (519) 339 (420) 79 (99) 24 Information and communications technology 196 (128) 66 (12) 130 197 Inter-segment transactions (101) 66 (129) 24 28 (22) Consolidated (Php153) 100 (Php529) 100 Php376 (71)
Consolidated net income decreased by Php325 million, or 2%, to Php21,296 million in the first
half of 2011 from Php21,621 million in the same period in 2010. The decrease was mainly due to the combined effects of the following: (i) a decrease in consolidated revenues by Php2,425 million; (ii) a decrease in the consolidated provision for income tax by Php958 million, which was mainly due to lower taxable income from our fixed line and wireless businesses; (iii) a decrease in consolidated expenses by Php766 million; and (iv) a decrease in consolidated other expenses by Php376 million.
The following table shows the breakdown of our consolidated net income for the six months
ended June 30, 2011 and 2010 by business segment:
Change 2011 % 2010 % Amount %
(in millions) Wireless Php17,115 80 Php16,766 78 Php349 2 Fixed line 3,512 17 4,550 21 (1,038) (23)Information and communications technology 669 3 305 1 364 119 Consolidated Php21,296 100 Php21,621 100 (Php325) (2)
EBITDA
Our consolidated EBITDA was Php41,512 million in the first half of 2011, a decrease of Php1,745 million, or 4%, as compared with Php43,257 million in the same period in 2010 primarily due to a decline in service revenues from our wireless and fixed line businesses, partly offset by lower cash operating expenses, mainly compensation and employee benefits, rent, and taxes and licenses, and lower provision for uncollectible receivables.
The following table shows the breakdown of our consolidated EBITDA for the six months
ended June 30, 2011 and 2010 by business segment:
Change 2011 % 2010 % Amount %
(in millions) Wireless Php29,039 70 Php29,704 69 (Php665) (2)Fixed line 11,393 27 12,668 29 (1,275) (10)Information and communications technology 979 3 756 2 223 29 Inter-segment transactions 101 – 129 – (28) (22)Consolidated Php41,512 100 Php43,257 100 (Php1,745) (4)

2Q 2011 Fo rm 17 -Q Page 9 o f 40
Core Income
Our consolidated core income was Php21,023 million in the first half of 2011, a decrease of Php207 million, or 1%, as compared with Php21,230 million in the same period in 2010 primarily due to a decrease in consolidated revenues, partially offset by decreases in consolidated expenses and consolidated provision for income tax. Our consolidated basic core EPS also decreased to Php111.35 in the first half of 2011 from Php112.43 in the same period in 2010 and our consolidated diluted core EPS decreased to Php111.30 in the first half of 2011 from Php112.39 in the same period in 2010. Our weighted average number of outstanding common shares was approximately 186.8 million in each of the six months ended June 30, 2011 and 2010.
The following table shows the breakdown of our consolidated core income for the six months
ended June 30, 2011 and 2010 by business segment:
Change 2011 % 2010 % Amount %
(in millions) Wireless Php17,428 83 Php17,133 81 Php295 2 Fixed line 2,939 14 3,753 18 (814) (22) Information and communications technology 656 3 344 1 312 91 Consolidated Php21,023 100 Php21,230 100 (Php207) (1)
On a Business Segment Basis Wireless
Revenues
Revenues generated from our wireless business amounted to Php46,334 million in the first half of 2011, a decrease of Php2,287 million, or 5%, from Php48,621 million in the same period in 2010.
The following table summarizes our total revenues from our wireless business for the six
months ended June 30, 2011 and 2010 by service segment: Decrease 2011 % 2010 % Amount %
(in millions) Service Revenues:
Cellular Php42,192 91 Php44,076 91 (Php1,884) (4) Wireless broadband, satellite and others
Wireless broadband 3,186 7 3,203 6 (17) (1) Satellite and others 360 1 597 1 (237) (40)
45,738 99 47,876 98 (2,138) (4) Non-Service Revenues:
Sale of cellular handsets, cellular subscriber identification module, or SIM,-packs and broadband data modems 596 1 745 2 (149) (20)
Total Wireless Revenues Php46,334 100 Php48,621 100 (Php2,287) (5) Service Revenues
Our wireless service revenues decreased by Php2,138 million, or 4%, to Php45,738 million in the first half of 2011 as compared with Php47,876 million in the same period in 2010, mainly as a result of lower revenues from our cellular, broadband, and satellite and other services. The decrease in our cellular revenues was mainly due to the decline in revenues from domestic and international calls, as well as domestic text messaging services on the back of pervasive multiple SIM card ownership and

2Q 2011 Fo rm 17 -Q Page 10 o f 40
increasing patronage of social networking sites, partially offset by an increase in international short messaging service, or SMS, as well as higher value-added services, or VAS, revenues, mainly from internet-based VAS and Pasa Load. Our dollar-linked revenues were negatively affected by the appreciation of the Philippine peso relative to the U.S. dollar, which decreased to a weighted average exchange rate of Php43.52 for the six months ended June 30, 2011 from Php45.78 for the six months ended June 30, 2010. With subscriber growth being driven more by multiple SIM card ownership, especially in the lower income segment of the Philippine wireless market, monthly cellular average revenue per unit/s, or ARPUs, for the first half of 2011 were lower as compared with the same period in 2010. We expect the decreasing trend in our cellular revenues, particularly our revenues from traditional voice and text messaging services, to continue due to the popularity of unlimited offers, multiple SIM card ownership and the emerging popularity of social media services. As a percentage of our total wireless revenues, service revenues increased to 99% in the first half of 2011 from 98% in the same period in 2010.
Cellular Service
Our cellular service revenues in the first half of 2011 amounted to Php42,192 million, a
decrease of Php1,884 million, or 4%, from Php44,076 million in the same period in 2010. Cellular service revenues accounted for 92% of our wireless service revenues in each of the first half of 2011 and 2010.
The following tables show the breakdown of our cellular service revenues and other key
measures of our cellular business as at and for the six months ended June 30, 2011 and 2010: Decrease
2011 2010 Amount % (in millions)
Cellular service revenues Php42,192 Php44,076 (Php1,884) (4)
By service type 41,007 42,771 (1,764) (4)
Prepaid 37,862 39,371 (1,509) (4) Postpaid 3,145 3,400 (255) (8)
By component 41,007 42,771 (1,764) (4)
Voice 19,916 21,510 (1,594) (7) Data 21,091 21,261 (170) (1)
Others(1) 1,185 1,305 (120) (9)
___________________ (1) Refers to other non-subscriber-related revenues consisting primarily of inbound international roaming fees, share in revenues from
PLDT’s WeRoam and PLDT Landline Plus, or PLP, services, a small number of leased line contracts, and revenues from Chikka, Wolfpac and other Smart subsidiaries.

2Q 2011 Fo rm 17 -Q Page 11 o f 40
Increase (Decrease)
2011 2010 Amount % Cellular subscriber base 47,834,533 45,345,998 2,488,535 5
Prepaid 47,404,197 44,906,154 2,498,043 6 Smart Buddy 26,079,785 25,764,292 315,493 1 Talk ’N Text 19,777,498 18,008,072 1,769,426 10 Red Mobile 1,546,914 1,133,790 413,124 36
Postpaid 430,336 439,844 (9,508) (2) Smart 429,752 439,844 (10,092) (2) Red Mobile(1) 584 – 584 100
Systemwide traffic volumes (in millions) Calls (in minutes) 17,742 12,985 4,757 37
Domestic 16,200 11,449 4,751 41 Inbound 700 736 (36) (5) Outbound 15,500 10,713 4,787 45
International 1,542 1,536 6 – Inbound 1,445 1,430 15 1 Outbound 97 106 (9) (8)
SMS/Data count (in hits) 161,477 179,608 (18,131) (10)
Text messages 160,610 178,861 (18,251) (10) Domestic 160,314 178,613 (18,299) (10)
Inbound 4,316 3,893 423 11 Outbound 155,998 174,720 (18,722) (11)
Bucket-Priced 146,961 165,498 (18,537) (11) Standard 9,037 9,222 (185) (2)
International 296 248 48 19 Inbound 157 91 66 73 Outbound 139 157 (18) (11)
Value-Added Services 851 736 115 16 Financial Services 16 11 5 45
_________ (1) Red Mobile postpaid was launched on March 17, 2011.
Revenues attributable to our prepaid cellular services amounted to Php37,862 million in the first
half of 2011, a decrease of Php1,509 million, or 4%, as compared with Php39,371 million in the same period in 2010. Prepaid cellular service revenues accounted for 92% of cellular voice and data revenues in each of the first half of 2011 and 2010. Revenues attributable to Smart’s postpaid cellular service amounted to Php3,145 million in the first half of 2011, a decrease of Php255 million, or 8%, as compared with Php3,400 million earned in the same period in 2010, and accounted for 8% of cellular voice and data revenues in each of the first half of 2011 and 2010.
Voice Services
Cellular revenues from our voice services, which include all voice traffic and voice VAS, such
as voice mail and outbound international roaming, decreased by Php1,594 million, or 7%, to Php19,916 million in the first half of 2011 from Php21,510 million in the same period in 2010 primarily due to a decrease in international and domestic call revenues. Cellular voice services accounted for 47% and 49% of our cellular service revenues in the first half of 2011 and 2010, respectively.

2Q 2011 Fo rm 17 -Q Page 12 o f 40
The following table shows the breakdown of our cellular voice revenues for the six months ended June 30, 2011 and 2010:
Decrease 2011 2010 Amount % (in millions) Voice services:
Domestic Inbound Php2,575 Php2,632 (Php57) (2) Outbound 9,512 10,327 (815) (8)
12,087 12,959 (872) (7) International
Inbound 7,039 7,626 (587) (8) Outbound 790 925 (135) (15)
7,829 8,551 (722) (8) Total Php19,916 Php21,510 (Php1,594) (7)
Domestic voice service revenues decreased by Php872 million, or 7%, to Php12,087 million in
the first half of 2011 from Php12,959 million in the same period in 2010 primarily due to a decrease in domestic outbound call revenues by Php815 million, or 8%, to Php9,512 million in the first half of 2011 from Php10,327 million in the same period in 2010 mainly due to lower yield and a decrease in traffic volume of standard calls, partly offset by increased revenues from higher traffic volume of bucket calls. In addition, revenues from our domestic inbound voice service decreased by Php57 million, or 2%, to Php2,575 million in the first half of 2011 from Php2,632 million in the same period in 2010 as a result of a decrease in revenues from incoming fixed line calls. Domestic outbound call volumes increased by 4,787 million minutes, or 45%, to 15,500 million minutes in the first half of 2011 from 10,713 million minutes in the same period in 2010, while domestic inbound call volumes decreased by 36 million minutes, or 5%, to 700 million minutes in the first half of 2011 from 736 million minutes in the same period in 2010. The overall increase was mainly due to higher call volumes resulting from unlimited voice offerings.
International voice service revenues decreased by Php722 million, or 8%, to Php7,829 million
in the first half of 2011 from Php8,551 million in the same period in 2010 primarily due to a decline in international inbound voice service revenues by Php587 million, or 8%, to Php7,039 million in the first half of 2011 from Php7,626 million in the same period in 2010, as well as a decline in international outbound voice service revenues by Php135 million, or 15%, to Php790 million in the first half of 2011 from Php925 million in the same period in 2010. The decline in international voice service revenues was due to a reduction in inbound termination rates, as well as the effect on our dollar-linked revenues of the appreciation of the Philippine peso relative to the U.S. dollar to a weighted average exchange rate of Php43.52 for the six months ended June 30, 2011 from Php45.78 for the six months ended June 30, 2010. Conversely, international inbound and outbound calls totaled 1,542 million minutes in the first half of 2011, an increase of 6 million minutes as compared with 1,536 million minutes in the same period in 2010 mainly due to an increase in our cellular subscriber base.
Smartalk, Smart’s unlimited voice offering, is available to Smart Buddy and Smart Gold
subscribers nationwide. The service does not require any change in SIM or cellular phone number and enables Smart Buddy and Smart Gold subscribers to make unlimited calls to any subscriber on the Smart network. Smart subscribers could avail of the service, via registration or via retailer loading, by purchasing loads for unlimited calls which come in two denominations:
• “Smartalk 100” which offers five days of unlimited calls for Php100; and • “Smartalk 500” which offers 30 days of unlimited calls for Php500 to any subscriber on the
Smart network.

2Q 2011 Fo rm 17 -Q Page 13 o f 40
In addition, Smart also offers Smartalk Plus, which includes unlimited calling and on-net
texting during off-peak hours and reduced rates during peak hours. Smartalk Plus’ Php100 load denomination is valid for five days and provides on-net unlimited calls and SMS from 10:00 p.m. to 5:00 p.m., and call and SMS rates of Php2.50 per minute and Php0.20 per SMS, respectively, from 5:01 p.m. to 9:59 p.m.
Through the Talk ‘N Text UnliTalk Plus 100 package, existing Talk ‘N Text subscribers can
avail of unlimited off-peak calls from 10:00 p.m. to 5:00 p.m. and special peak hour rates of Php2.50 per minute from 5:01 p.m. to 9:59 p.m. to any Smart Buddy, Smart Postpaid and Talk ‘N Text subscriber. The package also includes all day unlimited texting to any Smart Buddy, Smart Postpaid and Talk ‘N Text subscriber. Each registration to this promo is valid for five days. Talk ‘N Text also has UnliTalk 100 which offers five days of unlimited calls to Talk ‘N Text and Smart subscribers.
Red Mobile introduced its unlimited voice and SMS offering which utilizes a secondary
network powered by Smart. Red Mobile Unlimited offers unlimited Red-to-Red call and text, and unlimited Red-to-Red text packages, as well as unlimited calling and texting to all Smart subscribers.
Data Services
Cellular revenues from our data services, which include all text messaging-related services, as
well as VAS, decreased by Php170 million, or 1%, to Php21,091 million in the first half of 2011 from Php21,261 million in the same period in 2010. Cellular data services accounted for 50% and 48% of our cellular service revenues in the first half of 2011 and 2010, respectively.
The following table shows the breakdown of our cellular data revenues for the six months ended
June 30, 2011 and 2010:
Increase (Decrease) 2011 2010 Amount % (in millions) Text messaging
Domestic Php18,338 Php19,337 (Php999) (5) Bucket-Priced 11,319 12,146 (827) (7) Standard 7,019 7,191 (172) (2)
International 1,165 676 489 72 19,503 20,013 (510) (3) Value-added services
Internet-based(1) 498 345 153 44 MMS-based(2) 398 345 53 15 SMS-based(3) 318 334 (16) (5) Pasaload(4) 353 206 147 71
1,567 1,230 337 27 Financial services 21 18 3 17 Total Php21,091 Php21,261 (Php170) (1)
__________ (1) Includes revenues from web-based services such as mobile internet browsing, video streaming and Uzzap, net of allocated discounts and
content provider costs. Uzzap is an IP-based messaging service that allows instant messaging, email, SMS, group messages, chatting, etc. (2) Includes revenues from point-to-point multimedia messaging system, or MMS, and content download services, such as ringtone, logo or
music downloads, net of allocated discounts and content-provider costs. (3) Includes revenues from info-on-demand and voice text services, net of allocated discounts and content-provider costs. (4) Includes revenues from Pasaload and Dial*SOS, net of allocated discounts. Pasaload is a service which allows prepaid and postpaid
subscribers to transfer small denominations of air time credits to other prepaid subscribers. Dial*SOS allows Smart prepaid subscribers to borrow Php4 of load (Php3 on-net SMS plus Php1 air time) from Smart which will be deducted upon their next top-up.

2Q 2011 Fo rm 17 -Q Page 14 o f 40
Text messaging-related services contributed revenues of Php19,503 million in the first half of 2011, a decrease of Php510 million, or 3%, as compared with Php20,013 million in the same period in 2010, and accounted for 92% and 94% of our total cellular data revenues in the first half of 2011 and 2010, respectively. The decrease in revenues from text messaging-related services resulted mainly from declining SMS traffic although SMS yields have stabilized. Another factor that contributed to this decline in revenues is the availability of alternative means of communication through social media sites. Text messaging revenues from the various bucket-priced plans totaled Php11,319 million in the first half of 2011, a decrease of Php827 million, or 7%, as compared with Php12,146 million in the same period in 2010. Standard text messaging revenues decreased by Php172 million, or 2%, to Php7,019 million in the first half of 2011 from Php7,191 million in the same period in 2010. On the other hand, the increase in international text messaging revenues was mainly due to the growth in international inbound SMS traffic and a higher average yield per international inbound SMS.
Bucket-priced text messages decreased by 18,537 million, or 11%, to 146,961 million in the
first half of 2011 from 165,498 million in the same period in 2010. Standard text messages also declined by 185 million, or 2%, to 9,037 million in the first half of 2011 from 9,222 million in the same period in 2010. Lower usage of these services was due to the increasing popularity of social networking sites.
VAS contributed revenues of Php1,567 million in the first half of 2011, an increase of Php337
million, or 27%, as compared with Php1,230 million in the same period in 2010, primarily due to an increase in revenues from internet-based VAS, which increased by Php153 million, or 44%, to Php498 million in the first half of 2011 from Php345 million in the same period in 2010, and Pasa Load by Php147 million, or 71%, to Php353 million in the first half of 2011 from Php206 million in the same period in 2010.
Subscriber Base, ARPU and Churn Rates
As at June 30, 2011, Smart, including Talk ‘N Text and Red Mobile subscribers totaled
47,834,533, an increase of 2,488,535, or 5%, over their combined cellular subscriber base of 45,345,998 as at June 30, 2010. Our cellular prepaid subscriber base grew by 2,498,043, or 6%, to 47,404,197 as at June 30, 2011 from 44,906,154 as at June 30, 2010, while our cellular postpaid subscriber base decreased by 9,508, or 2%, to 430,336 as at June 30, 2011 from 439,844 as at June 30, 2010. Prepaid subscribers accounted for 99% each of our total subscriber base as at June 30, 2011 and 2010.
Our net subscriber activations for the six months ended June 30, 2011 and 2010 were as
follows:
Increase (Decrease) 2011 2010 Amount % Prepaid 2,189,764 4,013,056 (1,823,292) (45)
Smart Buddy 786,342 2,001,478 (1,215,136) (61) Talk ’N Text 810,117 957,359 (147,242) (15) Red Mobile 593,305 1,054,219 (460,914) (44)
Postpaid 8,761 4,301 4,460 104
Smart 8,177 4,301 3,876 90 Red Mobile 584 – 584 100
Total 2,198,525 4,017,357 (1,818,832) (45)

2Q 2011 Fo rm 17 -Q Page 15 o f 40
Prepaid and postpaid subscribers reflected net activations of 2,189,764 and 8,761, respectively,
in the first half of 2011 as compared with net activations of 4,013,056 and 4,301, respectively, in the same period in 2010.
For Smart Buddy subscribers, the average monthly churn rate in the first half of 2011 and 2010
were 4.8% and 4.4%, respectively, while the average monthly churn rate for Talk ’N Text subscribers were 5.4% and 5.3% in the first half of 2011 and 2010, respectively. The average monthly churn rate for Red Mobile prepaid subscribers were 11.3% and 2.6% in the first half of 2011 and 2010, respectively.
The average monthly churn rate for Smart’s postpaid subscribers were 2.3% and 1.7% for the
first half of 2011 and 2010, respectively. Smart’s policy is to redirect outgoing calls to an interactive voice response system if the postpaid subscriber's account is either 45 days overdue or if the subscriber has exceeded the prescribed credit limit. If the subscriber does not make a payment within 44 days of redirection, the account is temporarily disconnected. If the account is not settled within 30 days from temporary disconnection, the account is then considered as churned. From the time that temporary disconnection is initiated, a series of collection activities is implemented, involving the sending of a collection letter, call-out reminders and collection messages via text messaging.
The following table summarizes our average monthly cellular ARPUs for the six months ended
June 30, 2011 and 2010:
Gross(1) Increase (Decrease) Net(2) Increase (Decrease) 2011 2010 Amount % 2011 2010 Amount %
Prepaid
Smart Buddy Php204 Php228 (Php24) (11) Php162 Php182 (Php20) (11) Talk ’N Text 127 140 (13) (9) 106 116 (10) (9) Red Mobile 37 8 29 363 32 6 26 433
Prepaid – Blended(3) 168 190 (22) (12) 135 153 (18) (12) Postpaid
Smart 1,624 1,675 (51) (3) 1,205 1,271 (66) (5) Red Mobile 343 – 343 100 343 – 343 100
Postpaid – Blended 1,623 1,675 (52) (3) 1,205 1,271 (66) (5) Prepaid and Postpaid Blended(4) 181 205 (24) (12) 145 164 (19) (12)
____________ (1) Gross monthly ARPU is calculated by dividing gross cellular service revenues for the month, gross of discounts, allocated content-
provider costs and interconnection income but excluding inbound roaming revenues, by the average number of subscribers in the month. (2) Net monthly ARPU is calculated by dividing gross cellular service revenues for the month, including interconnection income net of
interconnection expense, but excluding inbound roaming revenues, net of discounts and content-provider costs, by the average number of subscribers in the month.
(3) The average monthly ARPU of Smart Buddy, Talk ’N Text and Red Mobile. (4) The average monthly ARPU of all prepaid and postpaid cellular subscribers.
Prepaid service revenues consist mainly of charges for the subscribers’ actual usage of their
loads. Prepaid blended gross average monthly ARPU in the first half of 2011 was Php168, a decrease of 12%, as compared with Php190 in the same period in 2010. The decrease was primarily due to a decline in the average domestic outbound call and text messaging revenue per subscriber, as well as a drop in the average international inbound voice revenue per subscriber in the first half of 2011 as compared with the same period in 2010. On a net basis, prepaid blended average monthly ARPU in the first half of 2011 was Php135, a decrease of 12%, as compared with Php153 in the same period in 2010.
Postpaid blended gross and net average monthly ARPU decreased to Php1,623 and Php1,205,
respectively, in the first half of 2011 as compared with Php1,675 and Php1,271, respectively, in the same period in 2010. Prepaid and postpaid gross average monthly blended ARPU was Php181 in the first half of 2011, a decrease of 12%, as compared with Php205 in the same period in 2010. Likewise, the net average monthly prepaid and postpaid blended ARPU decreased by 12% to Php145 in the first

2Q 2011 Fo rm 17 -Q Page 16 o f 40
half of 2011 from Php164 in the same period in 2010. Our average monthly prepaid and postpaid ARPUs per quarter for the first two quarters of 2011
and for each of the four quarters of 2010 were as follows: Prepaid Postpaid Smart Buddy Talk ’N Text Red Mobile Smart Red Mobile Gross(1) Net(2) Gross(1) Net(2) Gross(1) Net(2) Gross(1) Net(2) Gross(1) Net(2)
2011 First Quarter Php205 Php163 Php129 Php106 Php32 Php27 Php1,610 Php1,205 Php133 Php133 Second Quarter 203 162 126 105 43 37 1,638 1,206 413 413 2010 First Quarter 232 184 140 115 11 8 1,686 1,286 – – Second Quarter 224 179 141 116 4 3 1,665 1,257 – – Third Quarter 207 163 135 112 6 5 1,661 1,229 – – Fourth Quarter 215 171 140 116 22 19 1,702 1,256 – – ____________ (1) Gross monthly ARPU is calculated based on the average of the gross monthly ARPUs for the quarter. (2) Net monthly ARPU is calculated based on the average of the net monthly ARPUs for the quarter.
Wireless Broadband, Satellite and Other Services Our revenues from wireless broadband, satellite and other services consist mainly of wireless
broadband service revenues from SBI, charges for ACeS Philippines’ satellite information and messaging services and service revenues generated by the mobile virtual network operations of PLDT Global’s subsidiary.
Wireless Broadband Revenues from our wireless broadband services decreased by Php17 million, or 1%, to
Php3,186 million in the first half of 2011 from Php3,203 million in the same period in 2010, primarily due to a lower postpaid subscriber base.
SBI offers a number of wireless broadband services and had a total of 1,491,700 subscribers as
at June 30, 2011, an increase of 168,336 subscribers, or 13%, as compared with 1,323,364 subscribers as at June 30, 2010. Our postpaid wireless broadband subscriber base decreased by 11,600 subscribers, or 3%, to 444,210 subscribers as at June 30, 2011 from 455,810 subscribers as at June 30, 2010, while our prepaid wireless broadband subscriber base increased by 179,936 subscribers, or 21%, to 1,047,490 subscribers as at June 30, 2011 from 867,554 subscribers as at June 30, 2010.
SmartBro, SBI’s wireless broadband service linked to Smart’s wireless broadband-enabled base
stations, allows subscribers to connect to the internet using an outdoor aerial antenna installed in a subscriber’s home.
SBI offers mobile internet access through SmartBro Plug-It, a wireless modem and SmartBro
Pocket Wifi, a portable wireless router which can be shared by up to five users at a time. Both provide instant connectivity in places where there is Smart network coverage. SmartBro Plug-It and SmartBro Pocket Wifi are available in both postpaid and prepaid variants, with prepaid offering 30-minute internet access for every Php10 worth of load. SBI also offers unlimited internet surfing with Unli Surf200, Unli Surf100 and Unli Surf50 for SmartBro Plug-It and Pocket Wifi Prepaid subscribers with specific internet usage needs. We also have an additional array of load packages that offer per minute-based charging and longer validity periods.

2Q 2011 Fo rm 17 -Q Page 17 o f 40
SmartBro WiMAX service is available in Metro Manila and selected key cities in Visayas and
Mindanao. WiMAX, which stands for Worldwide Interoperability for Microwave Access, is a wide area network technology that allows for a more efficient radio-band usage, an improved interference avoidance and higher data rates over a longer distance. WiMAX unlimited broadband usage is available under Plan 999 with a burst speed of up to 1 Mbps.
Satellite and Other Services Revenues from our satellite and other services decreased by Php237 million, or 40%, to Php360
million in the first half of 2011 from Php597 million in the same period in 2010, primarily due to the sale of Mabuhay Satellite’s transponders on July 1, 2010 and the effect of the appreciation of the Philippine peso relative to the U.S. dollar to a weighted average exchange rate of Php43.52 for the six months ended June 30, 2011 from Php45.78 for the six months ended June 30, 2010 on our U.S. dollar and U.S. dollar-linked satellite and other service revenues.
Non-Service Revenues
Our wireless non-service revenues consist of proceeds from sales of cellular handsets, cellular
SIM-packs and broadband data modems. Our wireless non-service revenues decreased by Php149 million, or 20%, to Php596 million in the first half of 2011 as compared with Php745 million in the same period in 2010 primarily due to the lower quantity of broadband data modems sold.
Expenses
Expenses associated with our wireless business in the first half of 2011 amounted to Php24,107
million, a decrease of Php1,651 million, or 6%, from Php25,758 million in the same period in 2010. A significant portion of this decrease was attributable to lower expenses related to rent, compensation and employee benefits, cost of sales, and taxes and licenses, partially offset by higher expenses related to repairs and maintenance, insurance and security services, and selling and promotions. As a percentage of our total wireless revenues, expenses associated with our wireless business accounted for 52% and 53% in the first half of 2011 and 2010, respectively.
The following table summarizes the breakdown of our total wireless-related expenses for the six
months ended June 30, 2011 and 2010 and the percentage of each expense item to the total:
Increase (Decrease) 2011 % 2010 % Amount %
(in millions)
Depreciation and amortization Php6,758 28 Php6,781 26 (Php23) – Rent 4,070 17 5,439 21 (1,369) (25) Compensation and employee benefits(1) 2,943 12 3,210 12 (267) (8) Repairs and maintenance 2,592 11 2,450 10 142 6 Selling and promotions 1,993 8 1,940 8 53 3 Cost of sales 1,764 7 1,919 7 (155) (8) Professional and other contracted services 1,448 6 1,467 6 (19) (1) Taxes and licenses 797 3 901 4 (104) (12) Communication, training and travel 483 2 462 2 21 5 Insurance and security services 414 2 344 1 70 20Asset impairment 321 2 346 1 (25) (7) Amortization of intangible assets 54 – 47 – 7 15 Other expenses 470 2 452 2 18 4
Total Php24,107 100 Php25,758 100 (Php1,651) (6)
__________ (1) Includes salaries and employee benefits, long-term incentive plan, or LTIP, pension and manpower rightsizing program, or MRP, costs.

2Q 2011 Fo rm 17 -Q Page 18 o f 40
Depreciation and amortization charges decreased by Php23 million to Php6,758 million in the first half of 2011 principally due to lower depreciation charges on broadband network facilities.
Rent expenses decreased by Php1,369 million, or 25%, to Php4,070 million primarily due to
lower domestic fiber optic network, or DFON, charges as a result of lower rental rates and a decrease in domestic leased circuits, partially offset by the increase in cell site rental charges. In the first half of 2011, we had 6,055 cell sites, 10,442 cellular/mobile broadband base stations and 2,684 fixed wireless broadband-enabled base stations, as compared with 5,643 cell sites, 9,727 cellular/mobile broadband base stations and 2,019 fixed wireless broadband-enabled base stations in the same period in 2010.
Compensation and employee benefits expenses decreased by Php267 million, or 8%, to
Php2,943 million primarily due to lower salaries and employee benefits, as a result of lower headcount, and lower MRP costs, partially offset by the higher provision for pension benefits and LTIP. Employee headcount decreased to 5,069 in the first half of 2011 as compared with 5,405 in the same period in 2010.
Repairs and maintenance expenses increased by Php142 million, or 6%, to Php2,592 million
mainly due to higher electricity and fuel costs for power generation and an increase in computer hardware and building maintenance expenses, partly offset by lower maintenance charges for cellular and broadband network facilities, and computer software.
Selling and promotion expenses increased by Php53 million, or 3%, to Php1,993 million
primarily due to higher spending on advertising and promotional campaigns, commissions and public relations expenses.
Cost of sales decreased by Php155 million, or 8%, to Php1,764 million primarily due to lower
quantity and average cost of broadband modems sold, partly offset by higher broadband and cellular retention costs.
Professional and other contracted service fees decreased by Php19 million, or 1%, to Php1,448
million primarily due to lower management fees, legal fees, customer relationship management service fees and technical service fees, partly offset by the increase in consultancy fees, contracted service fees, corporate membership fees and outsourced service fees.
Taxes and licenses decreased by Php104 million, or 12%, to Php797 million primarily due to
lower non-creditable input taxes and business-related taxes and license fees. Communication, training and travel expenses increased by Php21 million, or 5%, to Php483
million primarily due to higher travel expenses, courier charges and fuel consumption for vehicles, partially offset by lower communication, hauling and training expenses.
Insurance and security services increased by Php70 million, or 20%, to Php414 million
primarily due to higher site security expense and insurance premiums. Asset impairment decreased by Php25 million, or 7%, to Php321 million primarily due to lower
provision for uncollectible receivables. Amortization of intangible assets increased by Php7 million, or 15%, to Php54 million primarily
due to the amortization of intangible assets relating to the acquisition of Chikka and PDSI. Other expenses increased by Php18 million, or 4%, to Php470 million primarily due to higher
various business and operational-related expenses.
2Q 2011 Fo rm 17 -Q Page 19 o f 40
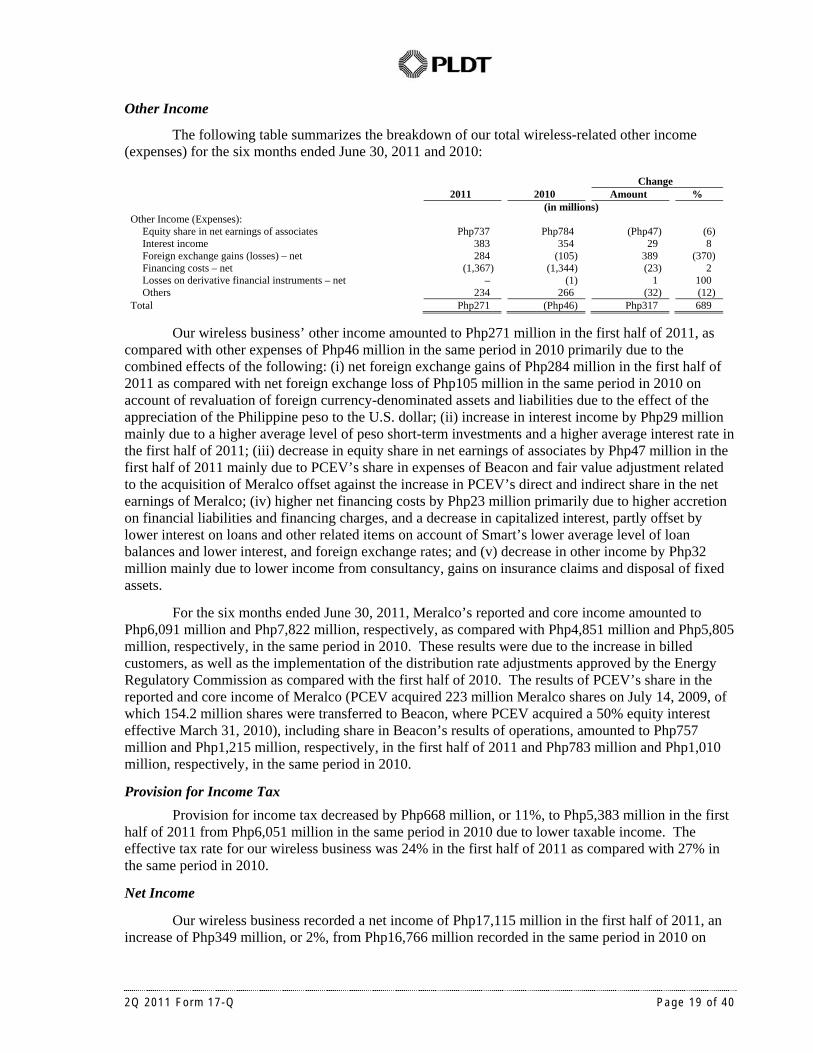
Other Income The following table summarizes the breakdown of our total wireless-related other income
(expenses) for the six months ended June 30, 2011 and 2010:
Change 2011 2010 Amount %
Other Income (Expenses): (in millions)
Equity share in net earnings of associates Php737 Php784 (Php47) (6) Interest income 383 354 29 8 Foreign exchange gains (losses) – net 284 (105) 389 (370) Financing costs – net (1,367) (1,344) (23) 2 Losses on derivative financial instruments – net – (1) 1 100 Others 234 266 (32) (12)
Total Php271 (Php46) Php317 689 Our wireless business’ other income amounted to Php271 million in the first half of 2011, as
compared with other expenses of Php46 million in the same period in 2010 primarily due to the combined effects of the following: (i) net foreign exchange gains of Php284 million in the first half of 2011 as compared with net foreign exchange loss of Php105 million in the same period in 2010 on account of revaluation of foreign currency-denominated assets and liabilities due to the effect of the appreciation of the Philippine peso to the U.S. dollar; (ii) increase in interest income by Php29 million mainly due to a higher average level of peso short-term investments and a higher average interest rate in the first half of 2011; (iii) decrease in equity share in net earnings of associates by Php47 million in the first half of 2011 mainly due to PCEV’s share in expenses of Beacon and fair value adjustment related to the acquisition of Meralco offset against the increase in PCEV’s direct and indirect share in the net earnings of Meralco; (iv) higher net financing costs by Php23 million primarily due to higher accretion on financial liabilities and financing charges, and a decrease in capitalized interest, partly offset by lower interest on loans and other related items on account of Smart’s lower average level of loan balances and lower interest, and foreign exchange rates; and (v) decrease in other income by Php32 million mainly due to lower income from consultancy, gains on insurance claims and disposal of fixed assets.
For the six months ended June 30, 2011, Meralco’s reported and core income amounted to
Php6,091 million and Php7,822 million, respectively, as compared with Php4,851 million and Php5,805 million, respectively, in the same period in 2010. These results were due to the increase in billed customers, as well as the implementation of the distribution rate adjustments approved by the Energy Regulatory Commission as compared with the first half of 2010. The results of PCEV’s share in the reported and core income of Meralco (PCEV acquired 223 million Meralco shares on July 14, 2009, of which 154.2 million shares were transferred to Beacon, where PCEV acquired a 50% equity interest effective March 31, 2010), including share in Beacon’s results of operations, amounted to Php757 million and Php1,215 million, respectively, in the first half of 2011 and Php783 million and Php1,010 million, respectively, in the same period in 2010.
Provision for Income Tax
Provision for income tax decreased by Php668 million, or 11%, to Php5,383 million in the first half of 2011 from Php6,051 million in the same period in 2010 due to lower taxable income. The effective tax rate for our wireless business was 24% in the first half of 2011 as compared with 27% in the same period in 2010.
Net Income
Our wireless business recorded a net income of Php17,115 million in the first half of 2011, an
increase of Php349 million, or 2%, from Php16,766 million recorded in the same period in 2010 on

2Q 2011 Fo rm 17 -Q Page 20 o f 40
account of a decrease in wireless-related expenses by Php1,651 million, lower provision for income tax by Php668 million and an increase in other income by Php317 million, partially offset by a decrease in wireless revenues by Php2,287 million. EBITDA
Our wireless business’ EBITDA decreased by Php665 million, or 2%, to Php29,039 million in
the first half of 2011 from Php29,704 million in the same period in 2010 primarily due to a decline in our wireless revenues, partly offset by lower cash operating expenses particularly rent, compensation and employee benefits, cost of sales, and taxes and licenses.
Core Income
Our wireless business’ core income increased by Php295 million, or 2%, to Php17,428 million
in the first half of 2011 from Php17,133 million in the same period in 2010 on account of a decrease in wireless-related expenses and lower provision for income tax, partially offset by a decrease in wireless revenues and lower other income. Fixed Line
Revenues
Revenues generated from our fixed line business amounted to Php23,784 million in the first half
of 2011, a decrease of Php1,633 million, or 6%, from Php25,417 million in the same period in 2010. The following table summarizes our total revenues from our fixed line business for the six
months ended June 30, 2011 and 2010 by service segment:
Increase (Decrease) 2011 % 2010 % Amount % (in millions)
Service Revenues: Local exchange Php7,445 31 Php7,764 31 (Php319) (4) International long distance 2,396 10 2,690 11 (294) (11) National long distance 2,055 9 2,351 9 (296) (13) Data and other network 10,834 46 11,578 45 (744) (6) Miscellaneous 751 3 854 3 (103) (12)
23,481 99 25,237 99 (1,756) (7) Non-Service Revenues:
Sale of computers, PLDT Landline Plus, or PLP, units and SIM cards 303 1 180 1
123 68
Total Fixed Line Revenues Php23,784 100 Php25,417 100 (Php1,633) (6)
Service Revenues Our fixed line business provides local exchange service, national and international long distance
services, data and other network services, and miscellaneous services. Our fixed line service revenues decreased by Php1,756 million, or 7%, to Php23,481 million in the first half of 2011 from Php25,237 million in the same period in 2010 due to a decrease across our fixed line service revenues.

2Q 2011 Fo rm 17 -Q Page 21 o f 40
Local Exchange Service The following table summarizes the key measures of our local exchange service business as at
and for the six months ended June 30, 2011 and 2010:
Increase (Decrease) 2011 2010 Amount %
Total local exchange service revenues (in millions) Php7,445 Php7,764 (Php319) (4) Number of fixed line subscribers 1,856,890 1,862,992 (6,102) –
Postpaid 1,754,165 1,716,684 37,481 2 Prepaid 102,725 146,308 (43,583) (30)
Number of fixed line employees 7,410 8,056 (646) (8) Number of fixed line subscribers per employee 251 231 20 9
Revenues from our local exchange service decreased by Php319 million, or 4%, to Php7,445
million in the first half of 2011 from Php7,764 million in the same period in 2010 primarily due to a decrease in ARPU on account of lower fixed charges due to the increase in demand for bundled voice and data services and the decrease in installation and service connection charges, as well as a decrease in the average number of postpaid wired lines as a result of higher disconnections, partially offset by the increase in postpaid PLP lines. PLP wireless service allows subscribers to bring the telephone set anywhere within the home zone area and is available on postpaid and prepaid variants. The percentage contribution of local exchange revenues to our total fixed line service revenues accounted for 32% and 31% in the first half of 2011 and 2010, respectively.
International Long Distance Service
The following table shows our international long distance service revenues and call volumes for
the six months ended June 30, 2011 and 2010:
Increase (Decrease) 2011 2010 Amount %
Total international long distance service revenues (in millions) Php2,396 Php2,690 (Php294) (11)
Inbound 2,028 2,239 (211) (9) Outbound 368 451 (83) (18)
International call volumes (in million minutes, except call ratio) 951 921 30 3
Inbound 865 815 50 6 Outbound 86 106 (20) (19) Inbound-outbound call ratio 10.1:1 7.7:1 – –
Our total international long distance service revenues decreased by Php294 million, or 11%, to
Php2,396 million in the first half of 2011 from Php2,690 million in the same period in 2010 primarily due to the decrease in the average settlement rate, the unfavorable effect of the appreciation of the weighted average exchange rate of the Philippine peso to the U.S. dollar to Php43.52 for the six months ended June 30, 2011 from Php45.78 for the six months ended June 30, 2010 and the decrease in outbound call volumes. The percentage contribution of international long distance service revenues to our total fixed line service revenues accounted for 10% and 11% in the first half of 2011 and 2010, respectively.
Our revenues from inbound international long distance service decreased by Php211 million, or
9%, to Php2,028 million in the first half of 2011 from Php2,239 million in the same period in 2010 due to the decrease in the average settlement rate and the effect on our inbound revenues of the appreciation of the weighted average exchange rate of the Philippine peso to the U.S. dollar, partially offset by an increase in inbound call volumes.
Our revenues from outbound international long distance service decreased by Php83 million, or
18%, to Php368 million in the first half of 2011 from Php451 million in the same period in 2010
2Q 2011 Fo rm 17 -Q Page 22 o f 40
primarily due to the decline in outbound call volumes and the effect of the appreciation of the weighted average exchange rate of the Philippine peso to the U.S. dollar to Php43.52 for the six months ended June 30, 2011 from Php45.78 for the six months ended June 30, 2010, resulting in a decrease in the average billing rates to Php43.62 in the first half of 2011 from Php45.79 in the same period in 2010, partially offset by the increase in average collection rate in dollar terms.
National Long Distance Service
The following table shows our national long distance service revenues and call volumes for the
six months ended June 30, 2011 and 2010:
Decrease 2011 2010 Amount %
Total national long distance service revenues (in millions) Php2,055 Php2,351 (Php296) (13) National long distance call volumes (in million minutes) 558 679 (121) (18)
Our national long distance service revenues decreased by Php296 million, or 13%, to Php2,055
million in the first half of 2011 from Php2,351 million in the same period in 2010 primarily due to a decrease in call volumes, partially offset by an increase in the average revenue per minute of our national long distance services due to cessation of certain promotions on our national long distance calling rates. The percentage contribution of national long distance revenues to our fixed line service revenues accounted for 9% in each of the first half of 2011 and 2010.
Data and Other Network Services
The following table shows information of our data and other network service revenues for the
six months ended June 30, 2011 and 2010:
Increase (Decrease) 2011 2010 Amount %
Data and other network service revenues (in millions) Php10,834 Php11,578 (Php744) (6)
Domestic 8,021 8,634 (613) (7) Broadband 4,692 4,150 542 13
DSL 4,553 4,036 517 13 WeRoam 139 114 25 22
Leased Lines and Others 3,329 4,484 (1,155) (26)
International Leased Lines and Others 2,813 2,944 (131) (4)
Subscriber base:
Broadband 720,519 627,331 93,188 15 DSL 698,921 609,143 89,778 15 WeRoam 21,598 18,188 3,410 19
SWUP 18,983 13,893 5,090 37 Our data and other network services posted revenues of Php10,834 million in the first half of
2011, a decrease of Php744 million, or 6%, from Php11,578 million in the same period in 2010 primarily due to a decrease in domestic leased line revenues resulting from the lower revenue contribution of Diginet, our domestic leased private line service, and the decrease in international data revenues resulting from the termination of transponder sub-lease agreement with customers, as well as lower revenues from i-Gate, partially offset by an increase in domestic broadband services, owing to higher revenues from PLDT DSL. The percentage contribution of this service segment to our fixed line service revenues accounted for 46% in each of the first half of 2011 and 2010.

2Q 2011 Fo rm 17 -Q Page 23 o f 40
Domestic
Domestic data services contributed Php8,021 million in the first half of 2011, a decrease of
Php613 million, or 7%, as compared with Php8,634 million in the same period in 2010 mainly due to lower Diginet revenues, partially offset by the continued growth in DSL, Shops.Work Unplugged, or SWUP, and internet protocol-virtual private network, or IP-VPN subscribers as customer locations and bandwidth requirements continued to expand and demand for offshoring and outsourcing services increased. The percentage contribution of domestic data service revenues to total data and other network services decreased to 74% in the first half of 2011 from 75% in the same period in 2010.
Broadband
Broadband data services include PLDT DSL broadband internet service, which is intended for
individual internet users, small and medium enterprises, and large corporations with multiple branches, and PLDT WeRoam, our mobile broadband service, running on the PLDT Group’s nationwide wireless network (using GPRS, EDGE, 3G/HSDPA/HSPA and WiFi technologies). Broadband data revenues amounted to Php4,692 million in the first half of 2011, an increase of Php542 million, or 13%, from Php4,150 million in the same period in 2010 primarily due to the higher revenue contribution of DSL which contributed revenues of Php4,553 million in the first half of 2011 from Php4,036 million in the same period in 2010 as a result of the increase in the number of subscribers, partially offset by the lower ARPU as a result of the launching of lower-priced promotional plans. DSL revenues accounted for 42% and 35% of total data and other network service revenues in the first half of 2011 and 2010, respectively. DSL subscribers increased by 15% to 698,921 subscribers as at June 30, 2011 from 609,143 subscribers in the same period in 2010. WeRoam revenues amounted to Php139 million in the first half of 2011 from Php114 million in the same period in 2010 as subscribers increased by 19% to 21,598 subscribers in first half of 2011 from 18,188 subscribers in the same period in 2010.
Leased Lines and Others
Leased lines and other data services include: (1) Diginet, our domestic private leased line service providing Smart’s fiber optic and leased line data requirements; (2) IP-VPN, a managed corporate IP network that offers a secure means to access corporate network resources; (3) Metro Ethernet, our high-speed wide area networking services that enable mission-critical data transfers; (4) Shops.Work, our connectivity solution for retailers and franchisers that links company branches to their head office; and (5) SWUP, our wireless VPN service that powers mobile point-of-sale terminals and off-site bank ATMs, as well as other retail outlets located in remote areas. As at June 30, 2011, SWUP has a total subscriber base of 18,983 up by 37% from 13,893 subscribers in the same period in 2010. Leased lines and other data revenues amounted to Php3,329 million in the first half of 2011, a decrease of Php1,155 million, or 26%, from Php4,484 million in the same period in 2010 primarily due to a decrease in Diginet revenues, partially offset by the higher revenues from IP-VPN. The percentage contribution of leased lines and other data service revenues to the total data and other network services accounted for 31% and 39% in the first half of 2011 and 2010, respectively.
International
Leased Lines and Others
International leased lines and other data services consist mainly of: (1) i-Gate, our premium
dedicated internet access service that provides high speed, reliable and managed connectivity to the global internet, and is intended for enterprises and VAS providers; (2) Fibernet, which provides cost-effective and reliable bilateral point-to-point private networking connectivity, through the use of our

2Q 2011 Fo rm 17 -Q Page 24 o f 40
extensive international alliances to offshore and outsourcing, banking and finance, and semiconductor industries; (3) sub-lease transponder service; and (4) other international managed data services in partnership with other global service providers, such as AT&T, BT-Infonet, NTT Arcstar, Orange Business, SingTel, Tata, Telstra, Verizon Business, among others, which provide data networking services to multinational companies. International data service revenues decreased by Php131 million, or 4%, to Php2,813 million in the first half of 2011 from Php2,944 million in the same period in 2010 primarily resulting from the termination of transponder sub-lease agreement with customers, a decrease in revenues from i-Gate, Fibernet and various global service providers, and the unfavorable effect of the appreciation of the Philippine peso relative to the U.S. dollar, partially offset by the growth in international managed data services. The percentage contribution of international data service revenues to total data and other network service revenues accounted for 26% and 25% in the first half of 2011 and 2010, respectively.
Miscellaneous Services
Miscellaneous service revenues are derived mostly from directory advertising, facilities
management and rental fees. These service revenues decreased by Php103 million, or 12%, to Php751 million in the first half of 2011 from Php854 million in the same period in 2010 mainly due to a decrease in directory advertising and facilities management fees, partially offset by higher rental income owing to higher co-location charges. The percentage contribution of miscellaneous service revenues to our total fixed line service revenues was 3% in each of the first half of 2011 and 2010.
Non-service Revenues
Non-service revenues increased by Php123 million, or 68%, to Php303 million in the first half
of 2011 from Php180 million in the same period in 2010 primarily due to the sale of several managed PABX and OnCall solution in the first half of 2011 and higher computer-bundled sales.
Expenses
Expenses related to our fixed line business totaled Php18,387 million in the first half of 2011, a
decrease of Php336 million, or 2%, as compared with Php18,723 million in the same period in 2010. The decrease was primarily due to lower expenses related to asset impairment, compensation and employee benefits, repairs and maintenance, rent, and selling and promotions, partly offset by higher expenses related to professional and other contracted services, cost of sales, and depreciation and amortization. As a percentage of our total fixed line revenues, expenses associated with our fixed line business accounted for 77% and 74% in the first half of 2011 and 2010, respectively.

2Q 2011 Fo rm 17 -Q Page 25 o f 40
The following table shows the breakdown of our total fixed line-related expenses for the six
months ended June 30, 2011 and 2010 and the percentage of each expense item to the total:
Increase (Decrease) 2011 % 2010 % Amount % (in millions)
Depreciation and amortization Php5,989 33 Php5,896 31 Php93 2 Compensation and employee benefits(1) 4,710 26 5,020 27 (310) (6) Repairs and maintenance 2,064 11 2,152 12 (88) (4) Professional and other contracted services 1,742 9 1,490 8 252 17 Rent 1,258 7 1,306 7 (48) (4) Selling and promotions 655 3 679 4 (24) (4) Asset impairment 478 3 836 4 (358) (43) Taxes and licenses 341 2 351 2 (10) (3) Cost of sales 337 2 186 1 151 81 Communication, training and travel 275 1 265 1 10 4 Insurance and security services 231 1 219 1 12 5 Amortization of intangible assets 7 – – – 7 100 Other expenses 300 2 323 2 (23) (7)
Total Php18,387 100 Php18,723 100 (Php336) (2)__________ (1) Includes salaries and employee benefits, LTIP, pension and MRP costs.
Depreciation and amortization charges increased by Php93 million, or 2%, to Php5,989 million
due to a higher depreciable asset base in the first half of 2011 as compared with the same period in 2010.
Compensation and employee benefits expenses decreased by Php310 million, or 6%, to
Php4,710 million primarily due to lower salaries and employee benefits as a result of a lower headcount, as well as lower provisions for pension costs, and LTIP costs, partially offset by higher MRP costs. See Note 3 – Management’s Use of Accounting Judgments, Estimates and Assumptions and Note 24 – Employee Benefits to the accompanying unaudited consolidated financial statements for further discussion.
Repairs and maintenance expenses decreased by Php88 million, or 4%, to Php2,064 million
primarily due to decreases in maintenance costs on buildings, cable and wire facilities, and IT software. Professional and other contracted services increased by Php252 million, or 17%, to Php1,742
million primarily due to higher consultancy fees, contracted services and technical service fees for customer relationship management outsourcing project services, partially offset by lower payment facility and collection agency fees.
Rent expenses decreased by Php48 million, or 4%, to Php1,258 million due to a decrease in
satellite link and international leased circuit rental charges, partially offset by an increase in site and domestic leased circuit rental charges.
Selling and promotion expenses decreased by Php24 million, or 4%, to Php655 million
primarily due to lower spending on advertising and promotions, and commission expenses, partially offset by higher public relations expenses.
Asset impairment decreased by Php358 million, or 43%, to Php478 million mainly due to lower
provision for uncollectible receivables.

2Q 2011 Fo rm 17 -Q Page 26 o f 40
Taxes and licenses decreased by Php10 million, or 3%, to Php341 million as a result of lower business-related taxes.
Cost of sales increased by Php151 million, or 81%, to Php337 million primarily due to the sale
of several managed PABX and OnCall solution in the first half of 2011; no similar transaction was recognized in the same period in 2010, as well as higher computer-bundled sales in relation to our DSL promotion.
Communication, training and travel expenses increased by Php10 million, or 4%, to Php275
million mainly due to increases in foreign and local training expenses, communication charges and fuel consumption, partially offset by lower local travel and training expenses.
Insurance and security services increased by Php12 million, or 5%, to Php231 million primarily
due to higher security services, partly offset by lower insurance and bond premiums. Amortization of intangible assets amounted to Php7 million in the first half of 2011 primarily
due to amortization of intangible assets related to the acquisition of customer list from PDSI. Other expenses decreased by Php23 million, or 7%, to Php300 million due to decreases in
various business and fixed line operational-related expenses.
Other Income The following table summarizes the breakdown of our total fixed line-related other expenses for
the six months ended June 30, 2011 and 2010:
Change 2011 2010 Amount %
Other Income (Expenses): (in millions)
Gains on derivative financial instruments – net Php484 Php934 (Php450) (48) Interest income 245 252 (7) (3) Foreign exchange gains – net 145 51 94 184 Financing costs – net (1,786) (2,029) 243 (12) Others 393 372 21 6
Total (Php519) (Php420) (Php99) 24 Our fixed line business’ other expenses amounted to Php519 million in the first half of 2011, an
increase of Php99 million, or 24%, from Php420 million in the same period in 2010. The change was due to the combined effects of the following: (i) lower net gains on derivative financial instruments by Php450 million in the first half of 2011 due to lower mark-to-market valuation as a result of the increase in dollar interest rates, partially offset by lower hedge costs mainly due to the offsetting effect of overlay transactions in the first half of 2011; (ii) a decrease in interest income by Php7 million due to a lower average level of cash balances and the impact of the appreciation of the Philippine peso on dollar placements; (iii) increase in other income by Php21 million mainly due to the pension benefit income recognized by PLDT, partially offset by the loss on disposal of fixed assets; (iv) net increase in foreign exchange gains by Php94 million on account of higher gains on net foreign exchange revaluation of foreign currency-denominated liabilities due to the effect of the appreciation of the Philippine peso to the U.S. dollar; and (v) a decrease in net financing costs by Php243 million due to a decrease in interest expense on loans and related items on account of a lower average level of loan balances of PLDT, higher capitalized interest and lower level of average interest rate.
Provision for Income Tax
Provision for income tax amounted to Php1,366 million in the first half of 2011, a decrease of
Php358 million, or 21%, as compared with Php1,724 million in the same period in 2010 primarily due

2Q 2011 Fo rm 17 -Q Page 27 o f 40
to lower taxable income. The effective tax rate of our fixed line business was 28% in the first half of 2011 from 27% in the same period in 2010.
Net Income
Our fixed line business contributed a net income of Php3,512 million in the first half of 2011, a
decrease of Php1,038 million, or 23%, as compared with Php4,550 million in the same period in 2010 primarily as a result of decreases in fixed line revenues by Php1,633 million and higher other expenses by Php99 million, partially offset by lower provision for income tax by Php358 million and lower fixed line-related expenses by Php336 million.
EBITDA
Our fixed line business’ EBITDA decreased by Php1,275 million, or 10%, to Php11,393 million in the first half of 2011 from Php12,668 million in the same period in 2010 primarily due to a decline in revenues from all our fixed line services, partly offset by lower provision for uncollectible receivables and lower cash operating expenses, mainly compensation and employee benefits, repairs and maintenance, rent, and selling and promotions. Core Income
Our fixed line business’ core income decreased by Php814 million, or 22%, to Php2,939 million in the first half of 2011 from Php3,753 million in the same period in 2010 primarily as a result of the decrease in fixed line revenues, partially offset by decreases in fixed line operating expenses and financing costs.
Information and Communications Technology
Revenues
Our ICT business provides knowledge processing solutions, customer relationship management,
internet and online gaming, and data center and other services. Our ICT business generated revenues of Php5,671 million in the first half of 2011, an increase
of Php174 million, or 3%, as compared with Php5,497 million in the same period in 2010. This increase was primarily due to higher revenue contributions of our knowledge processing solutions, data center and other businesses, and point-product sales, partially offset by a decline in the revenue contribution of our customer relationship management, and internet and online gaming businesses.

2Q 2011 Fo rm 17 -Q Page 28 o f 40
The following table summarizes our total revenues from our ICT business for the six months
ended June 30, 2011 and 2010 by service segment:
Increase (Decrease) 2011 % 2010 % Amount %
(in millions)
Service Revenues: Knowledge processing solutions Php2,744 48 Php2,502 46 Php242 10 Customer relationship management 1,382 24 1,526 28 (144) (9) Internet and online gaming 469 8 520 9 (51) (10) Data center and others 820 15 714 13 106 15
5,415 95 5,262 96 153 3 Non-Service Revenues:
Point-product sales 256 5 235 4 21 9 Total ICT Revenues Php5,671 100 Php5,497 100 Php174 3
Service Revenues
Service revenues generated by our ICT business amounted to Php5,415 million in the first half
of 2011, an increase of Php153 million, or 3%, as compared with Php5,262 million in the same period in 2010 primarily as a result of the continued growth in our knowledge processing solutions, and data center and other businesses, partially offset by a decline in our customer relationship management, and internet and online gaming businesses. As a percentage of our total ICT business revenues, service revenues accounted for 95% and 96% in the first half of 2011 and 2010, respectively.
Knowledge Processing Solutions
We provide our knowledge processing solutions business primarily through the SPi Group. The
knowledge processing solutions business contributed revenues of Php2,744 million in the first half of 2011, an increase of Php242 million, or 10%, from Php2,502 million in the same period in 2010. Dollar revenues increased by 15% offset by the appreciation of the Philippine peso to the U.S. dollar by 5%. Knowledge processing solutions business revenues accounted for 51% and 47% of total service revenues of our ICT business in the first half of 2011 and 2010, respectively.
Customer Relationship Management
We provide our customer relationship management business primarily through SPi CRM.
Revenues relating to our customer relationship management business decreased by Php144 million, or 9%, to Php1,382 million in the first half of 2011 from Php1,526 million in the same period in 2010 primarily due to lower dollar-denominated revenues by 5% and the effect of the appreciation of the Philippine peso to the U.S. dollar, partially offset by higher domestic sales by 12%. In total, we own and operate 5,986 seats with an average of 3,610 customer service representatives, or CSRs, in the first half of 2011, as compared with 7,168 seats with an average of 4,671 CSRs in the same period in 2010. SPi CRM had six and seven customer relationship management sites as at June 30, 2011 and 2010, respectively. Customer relationship management business revenues accounted for 25% and 29% of total service revenues of our ICT business in the first half of 2011 and 2010, respectively.
Internet and Online Gaming
Revenues from our internet and online gaming business decreased by Php51 million, or 10%, to
Php469 million in the first half of 2011 from Php520 million in the same period in 2010. On April 1, 2011, ePLDT sold its entire 75% stake in Digital Paradise which resulted in the cessation of consolidation of Digital Paradise effective April 1, 2011. This was partially offset by the introduction of

2Q 2011 Fo rm 17 -Q Page 29 o f 40
a new game and the strong performance of existing major games, higher sales from retail and desk printing transactions, as well as the addition of new clients. Our internet and online gaming business revenues accounted for 9% and 10% of total service revenues of our ICT business in the first half of 2011 and 2010, respectively.
Data Center and Others
ePLDT operates an internet data center under the brand name Vitro™, which provides
co-location or rental services, server hosting, disaster recovery and business continuity services, intrusion detection, security services, such as firewalls and managed firewalls, and other data services. Our data center contributed revenues of Php820 million in the first half of 2011, an increase of Php106 million, or 15%, from Php714 million in the same period in 2010 primarily due to an increase in co-location or rental and managed service revenues, and regional sales of a branded software. Our data center business revenues accounted for 15% and 14% of total service revenues of our ICT business in the first half of 2011 and 2010, respectively.
Non-Service Revenues
Non-service revenues consist of sales generated from reselling certain software licenses, server
solutions, networking products, storage products and data security products. Non-service revenues generated by our ICT business increased by Php21 million, or 9%, to Php256 million in the first half of 2011 from Php235 million in the same period in 2010 primarily due to the higher revenues from sales of software licenses.
Expenses
Expenses associated with our ICT business totaled Php5,149 million in the first half of 2011, a
decrease of Php128 million, or 2%, as compared with Php5,277 million in the same period in 2010, primarily due to lower expenses related to amortization of intangible assets, asset impairment, compensation and employee benefits, rent, communication, training and travel, repairs and maintenance, and other expenses, partially offset by higher expenses related to professional and other contracted services, and cost of sales. As a percentage of our total ICT revenues, expenses related to our ICT business accounted for 91% and 96% in the first half of 2011 and 2010, respectively.
The following table shows the breakdown of our total ICT-related expenses for the six months
ended June 30, 2011 and 2010 and the percentage of each expense item to the total:
Increase (Decrease) 2011 % 2010 % Amount % (in millions)
Compensation and employee benefits(1) Php3,004 58 Php3,024 57 (Php20) (1) Depreciation and amortization 371 7 377 7 (6) (2) Repairs and maintenance 354 7 366 7 (12) (3) Rent 332 6 349 7 (17) (5) Cost of sales 306 6 284 5 22 8 Professional and other contracted services 282 6 254 5 28 11 Communication, training and travel 207 4 222 4 (15) (7) Amortization of intangible assets 83 2 131 2 (48) (37) Taxes and licenses 42 1 51 1 (9) (18) Selling and promotions 42 1 50 1 (8) (16) Insurance and security services 39 1 37 1 2 5 Asset impairment 13 – 38 1 (25) (66) Other expenses 74 1 94 2 (20) (21)
Total Php5,149 100 Php5,277 100 (Php128) (2)
__________ (1) Includes salaries and employee benefits, LTIP, pension and MRP costs.

2Q 2011 Fo rm 17 -Q Page 30 o f 40
Compensation and employee benefits decreased by Php20 million, or 1%, to Php3,004 million
mainly due to a decline in MRP costs, partially offset by higher salaries and benefits, pension benefits and LTIP. ePLDT and its subsidiaries’ employee headcount increased by 592, or 4%, to 16,848 in the first half of 2011 as compared with 16,256 in the same period in 2010.
Depreciation and amortization decreased by Php6 million, or 2%, to Php371 million primarily
due to a decrease in the depreciable asset base of our knowledge processing solutions and internet and online gaming businesses on account of fully depreciated assets and cessation of consolidation of Digital Paradise, partially offset by higher depreciation in relation to our data center expansion.
Repairs and maintenance expenses decreased by Php12 million, or 3%, to Php354 million
primarily due to decrease in buildings repairs and maintenance costs and site facilities particularly from our customer relationship management business, partially offset by higher IT software repairs and maintenance costs.
Rent expenses decreased by Php17 million, or 5%, to Php332 million primarily due to lower
office building charges. Cost of sales increased by Php22 million, or 8%, to Php306 million primarily due to the higher
volume of sales of software licenses and hardware products. Professional and other contracted services increased by Php28 million, or 11%, to Php282
million primarily due to higher consultancy fees, contracted service fees, legal fees and other professional fees.
Communication, training and travel expenses decreased by Php15 million, or 7%, to Php207
million primarily due to lower local and foreign training and travel expenses, courier charges and fuel consumption, partially offset by higher communication charges incurred by our customer relationship management and knowledge processing solutions businesses. Moreover, our data center business incurred lower trunkline charges in the first half of 2011.
Amortization of intangible assets decreased by Php48 million, or 37%, to Php83 million due to
the full impairment of intangible assets related to CyMed and SPi in December 2010. Taxes and licenses decreased by Php9 million, or 18%, to Php42 million primarily due to lower
business-related taxes. Selling and promotion expenses decreased by Php8 million, or 16%, to Php42 million mainly
due to our gaming business’ lower promotional expenses due to prioritization of spending on profitable games and decrease in commission expense of our knowledge processing solutions business, partially offset by higher advertisements by our customer relationship management business.
Insurance and security services increased by Php2 million, or 5%, to Php39 million primarily
due to higher security services and insurance premiums. Asset impairment decreased by Php25 million, or 66%, to Php13 million primarily due to
customer relationship management’s asset impairment of unutilized business tax benefits. Other expenses decreased by Php20 million, or 21%, to Php74 million mainly due to lower
various business and ICT operational-related costs.

2Q 2011 Fo rm 17 -Q Page 31 o f 40
Other Income The following table summarizes the breakdown of our total ICT-related other income for the six
months ended June 30, 2011 and 2010:
Change 2011 2010 Amount %
Other Income (Expenses): (in millions)
Equity share in net earnings of associates Php102 Php97 Php5 5 Interest income 21 16 5 31 Foreign exchange losses – net (3) (5) 2 (40) Financing costs (29) (88) 59 (67) Gains on derivative financial instruments – net – 1 (1) (100) Others 105 45 60 133
Total Php196 Php66 Php130 197 Our ICT business’ other income amounted to Php196 million in the first half of 2011, an
increase of Php130 million, or 197%, from Php66 million in the same period in 2010 primarily due to the combined effects of the following: (i) an increase in other income by Php60 million mainly due to gain on sale of Digital Paradise and reversal of prior year’s provision by our data center business, partially offset by the lower gain on the disposal of fixed assets in the first half of 2011; (ii) a decrease in financing costs by Php59 million due to lower accretion on contingent liabilities from our knowledge processing solutions business; (iii) an increase in equity share in net earnings of associates by Php5 million; (iv) an increase in interest income of Php5 million due to increase in short-term placements and bank deposits; (v) net decrease in foreign exchange losses by Php2 million due to the revaluation of net foreign currency-denominated assets as a result of the effect of the appreciation of the Philippine peso to the U.S. dollar in the first half of 2011; and (vi) net gain on derivative financial instruments by Php1 million in the first half of 2010.
Provision for (Benefit from) Income Tax
Provision for income tax amounted to Php49 million in the first half of 2011 as against a benefit
from income tax of Php19 million in the same period in 2010 primarily due to higher taxable income.
Net Income Our ICT business registered a net income of Php669 million in the first half of 2011 from
Php305 million in the same period in 2010 mainly as a result of an increase in ICT revenues by Php174 million, an increase in other income by Php130 million and a decrease in ICT-related expenses by Php128 million, partially offset by an increase in provision for income tax by Php68 million. EBITDA
Our ICT business’ EBITDA increased by Php223 million, or 29%, to Php979 million in the first half of 2011 from Php756 million in the same period in 2010 primarily due to higher service revenues, and lower cash operating expenses particularly compensation and employee benefits, rent, communication, training and travel, repairs and maintenance, and other expenses. Core Income
Our ICT business’ core income amounted to Php656 million in the first half of 2011, an increase of Php312 million, or 91%, as compared with Php344 million in the same period in 2010 mainly as a result of increases in ICT revenues and other income, as well as lower ICT-related expenses, partially offset by an increase in provision for income tax.

2Q 2011 Fo rm 17 -Q Page 32 o f 40
Liquidity and Capital Resources The following table shows our consolidated cash flows for the six months ended June 30, 2011
and 2010, as well as our consolidated capitalization and other consolidated selected financial data as at June 30, 2011 and December 31, 2010:
Six Months Ended June 30, 2011 2010
(in millions) (Unaudited) Cash Flows
Net cash provided by operating activities Php34,629 Php31,848 Net cash used in investing activities 6,298 5,773
Capital expenditures 6,335 9,700 Net cash used in financing activities 26,285 35,595 Net increase (decrease) in cash and cash equivalents 1,980 (9,441)
June 30, December 31, 2011 2010
(in millions) (Unaudited) (Audited)Capitalization
Long-term portion of interest-bearing financial liabilities – net of current portion: Long-term debt Php71,710 Php75,879 Obligations under finance lease 7 9
71,717 75,888
Current portion of interest-bearing financial liabilities: Notes payable 651 – Long-term debt maturing within one year 21,792 13,767 Obligations under finance lease maturing within one year 6 34
22,449 13,801 Total interest-bearing financial liabilities 94,166 89,689
Total equity attributable to equity holders of PLDT 91,292 97,069 Php185,458 Php186,758
Other Selected Financial Data
Total assets Php271,484 Php277,815 Property, plant and equipment 156,289 163,184 Cash and cash equivalents 38,658 36,678 Short-term investments 600 669
Our consolidated cash and cash equivalents and short-term investments totaled Php39,258
million as at June 30, 2011. Principal sources of consolidated cash and cash equivalents in the first half of 2011 were cash flows from operating activities amounting to Php34,629 million, proceeds from availment of long-term debt and notes payable of Php11,949 million, interest received of Php653 million and dividends received of Php216 million. These funds were used principally for: (1) dividend payments of Php26,833 million; (2) debt principal and interest payments of Php7,362 million and Php2,552 million, respectively; (3) capital outlays of Php6,335 million; and (4) settlements of derivative financial instruments of Php319 million.
Our consolidated cash and cash equivalents and short-term investments totaled Php29,576
million as at June 30, 2010. Principal sources of consolidated cash and cash equivalents in the first half of 2010 were cash flows from operating activities amounting to Php31,848 million, net proceeds from maturity of short-term investments of Php3,134 million, proceeds from availment of long-term debt of Php2,246 million and interest received of Php665 million. These funds were used principally for: (1) dividend payments of Php26,330 million; (2) capital outlays of Php9,700 million; (3) debt principal and interest payments of Php7,929 million and Php2,929 million, respectively; and (4) settlements of derivative financial instruments of Php458 million.

2Q 2011 Fo rm 17 -Q Page 33 o f 40
Operating Activities Our consolidated net cash flows from operating activities increased by Php2,781 million, or 9%,
to Php34,629 million in the first half of 2011 from Php31,848 million in the same period in 2010 primarily due to LTIP settlement in March 2010 and higher collection of receivables partially offset by higher settlement of various payables.
Cash flows provided by operating activities of our fixed line business increased by Php2,319
million, or 26%, to Php11,177 million in the first half of 2011 from Php8,858 million in the same period in 2010 primarily due to LTIP settlement in March 2010, lower level of settlement of accounts payable and other liabilities, partially offset by higher level of outstanding receivables. Cash flows provided by operating activities of our ICT business also increased by Php658 million, or 117%, to Php1,219 million in the first half of 2011 from Php561 million in the same period in 2010 primarily due to settlement of LTIP in March 2010 and higher collection of receivables, partially offset by the higher level of settlement of accounts payable, and other liabilities in the first half of 2011. On the other hand, cash flows from operating activities of our wireless business decreased by Php202 million, or 1%, to Php22,237 million in the first half of 2011 from Php22,439 million in the same period in 2010 primarily due to a higher level of settlement of accounts payable and other current liabilities, partially offset by higher level of collection of receivables and LTIP settlement in March 2010.
Investing Activities
Consolidated net cash used in investing activities amounted to Php6,298 million in the first half
of 2011, an increase of Php525 million, or 9%, as compared with Php5,773 million in the same period in 2010 primarily due to the combined effects of the following: (1) the decrease in capital expenditures by Php3,365 million; (2) the lower net proceeds from the maturity of short-term investments by Php3,118 million; (3) increase in payment for contingent consideration arising from business acquisitions by Php810 million; and (4) lower interest received by Php12 million.
Our consolidated capital expenditures in the first half of 2011 totaled Php6,335 million, a
decrease of Php3,365 million, or 35%, as compared with Php9,700 million in the same period in 2010 primarily due to the decrease in Smart’s and PLDT’s capital spending. PLDT’s capital spending of Php4,139 million in the first half of 2011 was principally used to finance the expansion and upgrade of its submarine cable facilities, DFON facilities, NGN roll-out, fixed line data and IP-based network services and outside plant rehabilitation. Smart's capital spending of Php1,835 million in the first half of 2011 was used primarily to modernize and expand its 2G, 3G and fixed wireless broadband and mobile broadband networks. ePLDT and its subsidiaries’ capital spending of Php311 million in the first half of 2011 was primarily used to fund the continued expansion of its customer relationship management and knowledge processing solutions facilities. The balance of Php50 million represented other subsidiaries’ capital spending.
As part of our growth strategy, we may from time to time, continue to make acquisitions and
investments in companies or businesses. Dividends received in the first half of 2011 amounted to Php216 million, a decrease of Php5
million, or 2%, as compared with Php221 million in the same period in 2010. The dividends received in the first half of 2011 were from Meralco and Philweb Corporation, while the dividends received in the same period in 2010 were from Meralco and ePDS, Inc.
Financing Activities
On a consolidated basis, net cash used in financing activities amounted to Php26,285 million in
the first half of 2011, a decrease of Php9,310 million, or 26%, as compared with Php35,595 million in the same period in 2010, resulting largely from the combined effects of the following: (1) higher

2Q 2011 Fo rm 17 -Q Page 34 o f 40
proceeds from the issuance of long-term debt and notes payable by Php9,703 million; (2) net decrease in repayments of long-term debt and notes payable by Php567 million; (3) lower interest payments by Php377 million; (4) lower settlements of derivative financial instruments by Php139 million; (5) higher cash dividend payments by Php503 million; and (6) lower availment of capital expenditures under long-term financing by Php1,082 million.
Debt Financing
Proceeds from availment of long-term debt and notes payable for the six months ended June 30,
2011 amounted to Php11,300 million and Php649 million, respectively, mainly from PLDT’s and Smart’s drawings related to the financing of our capital expenditure requirements and maturing loan obligations. Payments of principal and interest on our total debt amounted to Php7,362 million and Php2,552 million, respectively, in the first half of 2011.
Our consolidated long-term debt increased by Php3,856 million, or 4%, to Php93,502 million in
the first half of 2011 from Php89,646 million on December 31, 2010, largely due to drawings from our term loan facilities, partially offset by debt amortizations and prepayments and the appreciation of the Philippine peso relative to the U.S. dollar to Php43.36 as at June 30, 2011 from Php43.81 as at December 31, 2010. The long-term debt levels of PLDT and Smart increased by 7% and 1% to Php52,582 million and Php40,820 million, respectively, as at June 30, 2011 as compared with December 31, 2010.
On March 9, 2011, Smart signed a Notes Facility Agreement with BDO Private Bank, Inc.
amounting to Php2,000 million to finance capital expenditures. Tranche A amounting to Php1,000 million was issued on March 16, 2011. Tranche B amounting to Php1,000 million was issued in multiple drawdowns of Php250 million each, the first of which was on March 24, 2011. On various dates in April 2011, the remaining Php750 million of Tranche B was fully drawn. The aggregate amount of Php2,000 million remained outstanding as at June 30, 2011. The facility is payable in full five years from the respective issue dates.
On March 15, 2011, Smart signed a Philippine Peso term loan facility with Metropolitan Bank
and Trust Company to finance capital expenditures for an amount of Php1,500 million, which was drawn in full on March 22, 2011 and remained outstanding as at June 30, 2011. The facility is a five-year loan, payable in full upon maturity on March 22, 2016.
On March 24, 2011, PLDT issued Php5,000 million fixed rate corporate notes under a Notes
Facility Agreement dated March 22, 2011, comprised of Series A five-year notes amounting to Php3,435 million, Series B seven-year notes amounting to Php700 million and Series C ten-year notes amounting to Php865 million. Proceeds from the facilities were used to finance capital expenditures for network expansion and improvement and/or to refinance existing debt obligations which were also used to finance service improvements and expansion programs. The amount of Php5,000 million remained outstanding as at June 30, 2011.
On March 24, 2011, Smart signed a Philippine Peso term loan facility with Philippine National
Bank to finance capital expenditures for an amount of Php2,000 million, which was drawn in full on March 29, 2011 and remained outstanding as at June 30, 2011. The facility is a five-year loan, payable in full upon maturity on March 29, 2016.
On April 4, 2011, PLDT signed a loan agreement with The Manufacturers Life Insurance Co.
(Phils.), Inc. amounting to Php300 million to finance capital expenditures and/or refinance its existing loan obligations which were utilized for service improvements and expansion programs. The loan is
2Q 2011 Fo rm 17 -Q Page 35 o f 40
payable in full upon maturity on April 29, 2016. The amount of Php300 million was fully drawn on April 28, 2011 and remained outstanding as at June 30, 2011.
On April 4, 2011, PLDT signed a loan agreement with The Manufacturers Life Insurance Co.
(Phils.), Inc. amounting to Php500 million to finance capital expenditures and/or refinance its existing loan obligations which were utilized for service improvements and expansion programs. The loan is payable in full upon maturity on June 17, 2016. The amount of Php500 million was fully drawn on June 16, 2011 and remained outstanding as at June 30, 2011.
On June 6, 2011, Smart signed a US$60 million five-year term loan facility to finance the
equipment and service contracts for the modernization and expansion project with Bank of Tokyo-Mitsubishi UFJ, Ltd. as Lender. The loan is payable over five years in eight equal semi-annual installments with the first installment on the eighteenth month from signing date. No availment has been made on this facility as at June 30, 2011.
On June 10, 2011, Smart signed a US$49 million five-year loan facility to finance the supply
and services contracts for the modernization and expansion project with Nordea Bank AB as Original Lender, Arranger and Facility Agent which will subsequently assign its rights and obligations to the Swedish Export Credit Corporation (AB Svensk Exportkredit) guaranteed by EKN. This facility is payable semi-annually in ten equal installments commencing six months after the applicable mean commissioning date. No availment has been made on this facility as at June 30, 2011.
Approximately Php56,329 million principal amount of our consolidated outstanding long-term
debt as at June 30, 2011 is scheduled to mature over the period from 2011 to 2014. Of this amount, Php33,806 million is attributable to Smart, Php22,424 million to PLDT, and the remainder to ePLDT’s subsidiaries.
For a complete discussion of our long-term debt, see Note 19 – Interest-bearing Financial
Liabilities – Long-term Debt to the accompanying unaudited consolidated financial statements.
Debt Covenants Our consolidated debt instruments contain restrictive covenants, including covenants that
require us to comply with specified financial ratios and other financial tests, calculated in conformity with PFRS, at relevant measurement dates, principally at the end of each quarterly period. We have complied with all of our maintenance financial ratios as required under our loan covenants and other debt instruments. Furthermore, certain of PLDT’s debt instruments contain provisions wherein PLDT may be required to repurchase or prepay certain indebtedness in case of a change in control of PLDT.
Please see Note 19 – Interest-bearing Financial Liabilities – Debt Covenants to the
accompanying unaudited consolidated financial statements for a detailed discussion of our debt covenants.
Financing Requirements
We believe that our available cash, including cash flow from operations, will provide sufficient
liquidity to fund our projected operating, investment, capital expenditures and debt service requirements for the next 12 months.
Consolidated cash dividend payments in the first half of 2011 amounted to Php26,833 million as
compared with Php26,330 million paid to shareholders in the same period in 2010. On August 2, 2011, we declared a regular cash dividend of Php78 per share, 70% payout of our 2011 core EPS. On March 1, 2011, we declared regular and special cash dividends of Php78 per share and Php66 per share,

2Q 2011 Fo rm 17 -Q Page 36 o f 40
respectively, in addition to the Php78 per share regular cash dividend declared last August 3, 2010, altogether representing approximately 100% payout of our 2010 core EPS.
Off-Statement of Financial Position Arrangements
There are no off-statement financial position arrangements that have or are reasonably likely to
have any current or future effect on our financial position, results of operations, cash flows, changes in stockholders’ equity, liquidity, capital expenditures or capital resources that are material to investors.
Equity Financing
Through our subscriber investment plan, which provides postpaid fixed line subscribers the
opportunity to buy shares of our 10% Cumulative Convertible Preferred Stock as part of the upfront payments collected from subscribers, PLDT was able to raise approximately Php1 million each in the first half of 2011 and 2010.
As part of our goal to maximize returns to our shareholders, we obtained Board of Directors’
approval for a share buyback program of up to five million shares of PLDT’s common stock, representing approximately 3% of PLDT’s total outstanding shares of common stock. We had acquired a total of approximately 2.72 million shares of PLDT’s common stock, representing approximately 1% of PLDT’s outstanding shares of common stock, at a weighted average price of Php2,388 per share for a total consideration of Php6,505 million in accordance with the share buyback program as at June 30, 2011 and December 31, 2010. The effect of the acquisition of shares of PLDT’s common stock pursuant to the share buyback program was considered in the computation of our basic and diluted earnings per common share for the six months ended June 30, 2011 and 2010. Please see to Note 8 – Earnings Per Common Share, Note 18 – Equity and Note 26 – Financial Assets and Liabilities to the accompanying unaudited consolidated financial statements for further details. Contractual Obligations and Commercial Commitments
Contractual Obligations
For a discussion of our consolidated contractual undiscounted obligations as at June 30, 2011 and 2010, see Note 26 – Financial Assets and Liabilities to the accompanying unaudited consolidated financial statements.
Commercial Commitments
Our outstanding consolidated commercial commitments, in the form of letters of credit, amounted to Php364 million and Php1,145 million as at June 30, 2011 and December 31, 2010, respectively. These commitments will expire within one year. Quantitative and Qualitative Disclosures about Market Risks
Our operations are exposed to various risks, including liquidity risk, foreign currency exchange risk, interest rate risk, credit risk and capital management risk. The importance of managing these risks has significantly increased in light of considerable change and continuing volatility in both the Philippine and international financial markets. With a view to managing these risks, we have incorporated financial risk management functions in our organization, particularly in our treasury operations, equity issues and sales of certain assets.
For further discussions of these risks, see Note 26 – Financial Assets and Liabilities to the accompanying unaudited consolidated financial statements.

2Q 2011 Fo rm 17 -Q Page 37 o f 40
The following table sets forth the estimated consolidated fair values of our financial assets and liabilities recognized as at June 30, 2011 and March 31, 2011: Fair Values June 30, March 31, 2011 2011 (in millions) (Unaudited) Noncurrent Financial Assets Available-for-sale financial assets
Listed equity securities Php78 Php79 Unlisted equity securities 68 69
Investments in debt securities 509 496 Derivative financial assets – 238 Advances and refundable deposits – net of current portion 924 917
Total noncurrent financial assets 1,579 1,799
Current Financial Assets Cash and cash equivalents 38,658 55,969 Short-term investments 600 644 Trade and other receivables – net 14,922 15,031 Derivative financial assets 267 24 Current portion of advances and refundable deposits 16 14
Total current financial assets 54,463 71,682 Total Financial Assets Php56,042 Php73,481 Noncurrent Financial Liabilities Interest-bearing financial liabilities Php76,759 Php80,820 Derivative financial liabilities 1,980 3,154 Customers’ deposits 1,596 1,599 Deferred credits and other noncurrent liabilities 10,211 9,767
Total noncurrent financial liabilities 90,546 95,340
Current Financial Liabilities Accounts payable 19,697 21,915 Accrued expenses and other current liabilities 28,476 29,579 Interest-bearing financial liabilities 22,449 14,167 Derivative financial liabilities 892 – Dividends payable 2,191 28,958
Total current financial liabilities 73,705 94,619Total Financial Liabilities Php164,251 Php189,959
The following table sets forth the amount of consolidated gains (losses) recognized for the
financial assets and liabilities for the six months ended June 30, 2011 and for the three months ended March 31, 2011: June 30, March 31, 2011 2011 (in millions) (Unaudited) Profit and Loss
Interest income Php645 Php321 Gains on derivative financial instruments – net 484 422 Accretion on financial liabilities – net (555) (291) Interest on loans and other related items (2,866) (1,358)
Other Comprehensive Income Net gains on available-for-sale financial assets – net of tax 1 2
(Php2,291) (Php904)

2Q 2011 Fo rm 17 -Q Page 38 o f 40
Impact of Inflation and Changing Prices
Inflation can be a significant factor in the Philippine economy, and we are continually seeking ways to minimize its impact. The average inflation rate in the Philippines in each of the first half of 2011 and 2010 was 4.3%. Moving forward, we expect inflation to increase, which may have an impact on our operations.
PART II – OTHER INFORMATION
PLDT’s Acquisition of Digital Telecommunications Philippines, Inc., or Digitel
On March 29, 2011, the Board of Directors of PLDT and JG Summit Holdings, Inc., or JGS, approved the acquisition by PLDT of JGS’s and certain other seller-parties’ ownership interest in Digitel comprising of: (i) 3.28 billion common shares in Digitel, representing approximately 51.55% of the issued common stock; (ii) zero-coupon convertible bonds issued by Digitel and its subsidiary to JGS and its subsidiary, which are convertible into approximately 18.6 billion common shares of Digitel assuming a conversion date of June 30, 2011 and an exchange rate of Php43.405 per U.S. dollar; and (iii) intercompany advances made by JGS to Digitel in the total principal amount plus accrued interest of Php34.1 billion as at December 31, 2010 (the “Assets”). Digitel operates a fixed line business in certain parts of the country and is the 100% owner of Digitel Mobile Philippines, Inc., or DMPI, which is engaged in the mobile telecommunications business and owns the brand Sun Cellular.
PLDT agreed to pay JGS and certain other seller-parties Php69.2 billion, which will be settled
by the issuance of one new PLDT common share for every Php2,500 (equivalent to 27.68 million new PLDT common shares) consideration payable for the Assets. In order to aid the board of PLDT in discharging their fiduciary duties, PLDT engaged an independent financial advisor to review the transaction and render a fairness opinion on the transaction and the consideration payable by PLDT. The independent financial advisor has completed its review and concluded that the acquisition of the Assets is fair and reasonable and in the interest of PLDT shareholders as a whole.
PLDT further expects to announce its intention to conduct a tender offer for all the remaining
Digitel shares, approximately 48.45% of the issued common stock of Digitel, held by the other shareholders of Digitel. Under the contemplated tender offer, it is anticipated that PLDT will offer to purchase the remaining Digitel shares at the price of Php1.6033 per Digitel share, which will be paid in the form of either PLDT shares issued at Php2,500 per share or cash, at the option of Digitel shareholders. The contemplated tender offer price will be equivalent to the fully diluted price per share of Digitel, assuming full conversion of the convertible bonds. Should all remaining shareholders of Digitel accept the tender offer by PLDT, PLDT will issue a total of 29.65 million new PLDT common shares for the acquisition of the Assets and for the remaining Digitel shares held by the other shareholders of Digitel. The 29.65 million new PLDT common shares will represent up to approximately 13.7% of the enlarged issued and outstanding common stock of PLDT.
Assuming full acceptance by the minorities of Digitel, the total transaction consideration would
be approximately Php74.1 billion. The completion of the acquisition is subject to the procurement of certain regulatory and other
approvals, including: (i) the approval by the NTC of the sale or transfer of JGS and the other seller-parties’ Digitel shares representing more than 40% of Digitel’s issued and outstanding common stock; (ii) the confirmation by the Philippine SEC of the valuation of the Assets; (iii) the approval by the PSE of the block sale of the Digitel shares; (iv) the confirmation by the Philippine SEC that the issuance of the PLDT common shares to JGS and the other seller-parties is exempt from the registration

2Q 2011 Fo rm 17 -Q Page 39 o f 40
requirement of the SRC; and (v) all other necessary approvals under applicable laws and regulations; and the approval by the common stockholders of PLDT for the issuance of the PLDT common shares as payment for the purchase price of the Assets and the Digitel shares which shall have been tendered pursuant to the tender offer. In addition, the sale of the Digitel shares owned by the seller-parties is subject to the consent of certain creditors of Digitel and DMPI. On June 14, 2011, the stockholders’ approval mentioned above was obtained.
Digitel and DMPI have outstanding long-term debts that are guaranteed by JGS. The loans and
guarantees contain representations and covenants applicable only to JGS including that on the ownership of JGS in Digitel. To date, Digitel and DMPI have provided the necessary notices and obtained the required consents of the lenders and export credit agencies both for the transfer of ownership of Digitel and the replacement of JGS by PLDT as guarantor under these loans. The amendments to the covenants and the PLDT guarantee will take effect upon closing or completion of the acquisition.
On June 30, 2011, the parties agreed to extend the closing date of the transaction from June 30,
2011 to July 30, 2011. On July 30, 2011, the parties agreed to extend anew the closing date of the transaction from July 30, 2011 to August 26, 2011. The parties are still awaiting the approvals of various regulatory bodies.
PLDT’s Creation of Voting Preferred Shares
On July 5, 2011, the Board of Directors of PLDT approved the amendments to the Seventh
Article of PLDT’s Articles of Incorporation consisting of the sub-classification of its authorized Preferred Capital Stock into: 150 million shares of Voting Preferred Stock with a par value of Php1.00 each, and 807.5 million shares of Non-Voting Serial Preferred Stock with a par value of Php10.00 each, and other conforming amendments (the “Amendments”). The shares of Voting Preferred Stock may be issued, owned, or transferred only to or by: (a) a citizen of the Philippines or a domestic partnership or association wholly-owned by citizens of the Philippines; (b) a corporation organized under the laws of the Philippines of which at least 60% of the capital stock entitled to vote is owned and held by citizens of the Philippines and at least 60% of the Board of Directors of such corporation are citizens of the Philippines; and (c) a trustee of funds for pension or other employee retirement or separation benefits, where the trustee qualifies under paragraphs (a) and (b) above and at least 60% of the funds accrue to the benefit of citizens of the Philippines (a Qualified Owner). The holders of Voting Preferred Stock shall have voting rights at any meeting of the stockholders of PLDT for the election of directors and for all other purposes, with one vote in respect of each share of Voting Preferred Stock.
A special meeting of stockholders will be held on September 20, 2011 for purposes of
presenting and obtaining stockholders’ approval of the Amendments.
After the approval of the Amendments by the stockholders and the PSEC, the Board of Directors, pursuant to the authority granted to it in the Seventh Article of PLDT’s Articles of Incorporation, may determine the specific terms, features and limitations of the Voting Preferred Stock and, as it deems necessary to protect the interest of PLDT and its stakeholders, authorize the issuance of shares of Voting Preferred Stock to Qualified Owners. It is contemplated that the shares of Voting Preferred Stock will have the following other features: (a) entitled to dividends at such rate to be determined by the Board of Directors, payable before any dividends are paid to the holders of Common Stock; (b) not convertible to Common Stock or to any shares of stock of PLDT of any class; (c) redeemable at the option of PLDT; (d) holders will have no pre-emptive right to subscribe or purchase any shares of stock of any class, or convertible debt, securities or warrants issued, sold or disposed by PLDT; and (e) in the event of dissolution or liquidation or winding up of PLDT, holders

2Q 2011 Fo rm 17 -Q Page 40 o f 40
will be entitled to be paid in full, or pro-rata insofar as the assets of PLDT will permit, the par value of such shares of Voting Preferred Stock and any accrued or unpaid dividends thereon before any distribution shall be made to holders of shares of Common Stock.
Related Party Transactions
For a detailed discussion of the related party transactions, see Note 23 –Related Party Transactions to the accompanying unaudited consolidated financial statements.

2Q 2011 Fo rm 17 -Q A -1
ANNEX – AGING OF ACCOUNTS RECEIVABLE
The following table shows the aging of our consolidated receivables as at June 30, 2011:
Type of Accounts Receivable Total Current 31−60 Days
61−90 Days
Over 91 Days
(in millions)
Retail subscribers .................................................. Php8,727 Php2,087 Php789 Php219 Php5,632 Corporate subscribers ........................................... 8,663 1,422 1,570 617 5,054
Foreign administrations ....................................... 4,450 1,682 1,196 629 942
Domestic carriers .................................................. 1,562 139 173 201 1,049
Dealers, agents and others ................................... 4,037 3,035 48 451 503
Total Php27,439 Php8,365 Php3,776 Php2,117 Php13,181
Less: Allowance for doubtful accounts .............. 12,517 Total Receivables - net ........................................ Php14,922

2Q 2011 Fo rm 17 -Q S -1
SIGNATURES
Pursuant to the requirements of the Securities Regulation Code, the registrant has duly caused this report for the first half of 2011 to be signed on its behalf by the undersigned thereunto duly authorized.
Date: August 2, 2011

F-1
PHILIPPINE LONG DISTANCE TELEPHONE COMPANY AND SUBSIDIARIES
CONSOLIDATED FINANCIAL STATEMENTS
AS AT JUNE 30, 2011 (UNAUDITED) AND DECEMBER 31, 2010 (AUDITED)
AND FOR THE SIX MONTHS ENDED JUNE 30, 2011 AND 2010 (UNAUDITED)

F-2
PHILIPPINE LONG DISTANCE TELEPHONE COMPANY AND SUBSIDIARIES
CONSOLIDATED STATEMENTS OF FINANCIAL POSITION As at June 30, 2011 and December 31, 2010
(in million pesos, except par value per share amounts and number of shares)
2011 2010 (Unaudited) (Audited)
ASSETS
Noncurrent Assets Property, plant and equipment (Notes 3, 5, 9, 12, 19 and 26) 156,289 163,184 Investments in associates and joint ventures (Notes 3, 4, 5, 10, 23 and 26) 23,815 23,203 Available-for-sale financial assets (Notes 6 and 26) 146 147 Investment in debt securities (Notes 11 and 26) 495 484 Investment properties (Notes 3, 6, 9, 12 and 26) 1,560 1,560 Goodwill and intangible assets (Notes 3, 4, 5, 13, 20 and 26) 11,390 11,485 Deferred income tax assets – net (Notes 3, 4, 7 and 26) 5,481 6,110 Derivative financial assets (Note 26) – 178 Prepayments – net of current portion (Notes 3, 5, 17, 24 and 26) 9,208 8,679 Advances and refundable deposits – net of current portion (Note 26) 1,210 1,187
Total Noncurrent Assets 209,594 216,217
Current Assets Cash and cash equivalents (Notes 14 and 26) 38,658 36,678 Short-term investments (Note 26) 600 669 Trade and other receivables (Notes 3, 5, 15, 17, 23 and 26) 14,922 16,428 Inventories and supplies (Notes 3, 4, 5, 16 and 26) 2,553 2,219 Derivative financial assets (Note 26) 267 5 Current portion of prepayments (Notes 17 and 26) 4,807 5,418 Current portion of advances and refundable deposits (Note 26) 83 181
Total Current Assets 61,890 61,598 TOTAL ASSETS 271,484 277,815
EQUITY AND LIABILITIES
Equity Preferred stock, Php10 par value per share, authorized - 822,500,000 shares;
issued and outstanding - 441,947,675 shares as at June 30, 2011 and 441,887,387 shares as at December 31, 2010 (Notes 8, 18 and 26) 4,420 4,419
Common stock, Php5 par value per share, authorized - 234,000,000 shares; issued - 189,480,774 shares and outstanding - 186,756,663 shares as at June 30, 2011; and issued - 189,480,549 shares and outstanding - 186,756,438 shares as at December 31, 2010 (Notes 8, 18 and 26) 947 947
Treasury stock - 2,724,111 shares as at June 30, 2011 and December 31, 2010 (Notes 8, 18 and 26) (6,505) (6,505)
Capital in excess of par value 62,890 62,890 Retained earnings (Note 18) 30,956 36,594 Other comprehensive income (Note 6) (1,416) (1,276)
Total Equity Attributable to Equity Holders of PLDT 91,292 97,069 Non-controlling interests (Note 6) 437 316 TOTAL EQUITY 91,729 97,385

F-3
PHILIPPINE LONG DISTANCE TELEPHONE COMPANY AND SUBSIDIARIES
CONSOLIDATED STATEMENTS OF FINANCIAL POSITION (continued) As at June 30, 2011 and December 31, 2010
(in million pesos, except par value per share amounts and number of shares)
2011 2010 (Unaudited) (Audited)
Noncurrent Liabilities Interest-bearing financial liabilities – net of current portion (Notes 3, 4, 5, 9, 19, 22 and 26) 71,717 75,888 Deferred income tax liabilities – net (Notes 3, 4, 7 and 26) 1,003 1,099 Derivative financial liabilities (Note 26) 1,980 3,604 Pension and other employee benefits (Notes 3, 5, 22, 24 and 26) 2,554 1,834 Customers’ deposits (Note 26) 2,247 2,223 Deferred credits and other noncurrent liabilities (Notes 3, 5, 9, 13, 20, 22, 26 and 27) 12,473 13,567
Total Noncurrent Liabilities 91,974 98,215 Current Liabilities Accounts payable (Notes 21, 23, 25 and 26) 21,020 25,804 Accrued expenses and other current liabilities (Notes 3, 10, 13, 19, 20, 22, 23, 24, 25 and 26) 37,030 35,959 Derivative financial liabilities (Note 26) 892 – Provision for assessments (Notes 3, 25 and 26) 1,555 1,555 Current portion of interest-bearing financial liabilities (Notes 3, 4, 5, 9, 19, 22 and 26) 22,449 13,801 Dividends payable (Notes 18 and 26) 2,191 2,086 Income tax payable (Notes 7 and 26) 2,644 3,010
Total Current Liabilities 87,781 82,215 TOTAL LIABILITIES 179,755 180,430 TOTAL EQUITY AND LIABILITIES 271,484 277,815
See accompanying Notes to Consolidated Financial Statements.

F-4
PHILIPPINE LONG DISTANCE TELEPHONE COMPANY AND SUBSIDIARIES
CONSOLIDATED INCOME STATEMENTS For the Periods Ended June 30, 2011 and 2010
(in million pesos, except earnings per common share amounts)
Six Months Ended June 30, Three Months Ended June 30, 2011 2010 2011 2010 (Unaudited)
REVENUES Service revenues (Notes 3 and 4) 69,641 72,156 35,070 36,150 Non-service revenues (Notes 3, 4 and 5) 1,141 1,051 568 543 70,782 73,207 35,638 36,693
EXPENSES Depreciation and amortization (Notes 3, 4 and 9) 13,118 13,054 6,515 6,693 Compensation and employee benefits (Notes 3, 5 and 24) 10,649 11,247 5,308 5,706 Repairs and maintenance (Notes 12, 16 and 23) 4,676 4,512 2,369 2,144 Selling and promotions 2,690 2,667 1,535 1,113 Professional and other contracted services (Note 23) 2,510 2,302 1,320 1,127 Cost of sales (Notes 5, 16 and 23) 2,406 2,389 1,177 1,219 Rent (Notes 3 and 26) 2,023 2,173 1,009 1,080 Taxes and licenses (Note 25) 1,180 1,303 551 629 Communication, training and travel 857 847 444 367 Asset impairment (Notes 3, 4, 5, 9, 10, 15, 16 and 26) 812 1,220 631 658 Insurance and security services (Note 23) 636 553 327 283 Amortization of intangible assets (Notes 3, 4 and 13) 144 178 69 87 Other expenses (Note 23) 834 856 412 399 42,535 43,301 21,667 21,505 28,247 29,906 13,971 15,188
OTHER INCOME (EXPENSES) Equity share in net earnings of associates and joint ventures
(Notes 4 and 10) 839 881 647 512 Interest income (Notes 4, 5, 11 and 14) 645 612 324 246 Gains on derivative financial instruments – net (Notes 4 and 26) 484 934 62 422 Foreign exchange gains (losses) – net (Notes 4, 9 and 26) 426 (59) 106 (768)Financing costs – net (Notes 4, 5, 9, 19 and 26) (3,178) (3,451) (1,648) (1,577)Other income (Notes 4 and 17) 631 554 274 313 (153) (529) (235) (852)
INCOME BEFORE INCOME TAX (Note 4) 28,094 29,377 13,736 14,336 PROVISION FOR INCOME TAX (Notes 3, 4 and 7) 6,798 7,756 3,166 4,089 NET INCOME FOR THE PERIOD (Note 4) 21,296 21,621 10,570 10,247
ATTRIBUTABLE TO: Equity holders of PLDT (Notes 4 and 8) 21,299 21,679 10,565 10,258 Non-controlling interests (Note 4) (3) (58) 5 (11) 21,296 21,621 10,570 10,247
Earnings Per Share For The Period Attributable to Common Equity Holders of PLDT (Note 8) Basic 112.83 114.84 55.96 54.31 Diluted 112.76 114.77 55.96 54.26
See accompanying Notes to Consolidated Financial Statements.

F-5
PHILIPPINE LONG DISTANCE TELEPHONE COMPANY AND SUBSIDIARIES
CONSOLIDATED STATEMENTS OF COMPREHENSIVE INCOME For the Periods Ended June 30, 2011 and 2010
(in million pesos)
Six Months Ended June 30, Three Months Ended June 30, 2011 2010 2011 2010 (Unaudited) NET INCOME FOR THE PERIOD (Note 4) 21,296 21,621 10,570 10,247 OTHER COMPREHENSIVE INCOME (LOSS) (Note 6)
Net gains (losses) on available-for-sale financial assets: – 8 (2) 2 Income tax related to fair value adjustments charged directly
to equity 4 – 4 – Gains (losses) from changes in fair value recognized during
the period (4) 6 (6) 2 Losses removed from other comprehensive income taken to
income – 2 – – Foreign currency translation differences of subsidiaries (141) 76 (96) 217 Total Other Comprehensive Income (Loss) (141) 84 (98) 219
TOTAL COMPREHENSIVE INCOME FOR THE PERIOD 21,155 21,705 10,472 10,466 ATTRIBUTABLE TO:
Equity holders of PLDT 21,159 21,765 10,466 10,475 Non-controlling interests (4) (60) 6 (9)
21,155 21,705 10,472 10,466
See accompanying Notes to Consolidated Financial Statements.

F-6
PHILIPPINE LONG DISTANCE TELEPHONE COMPANY AND SUBSIDIARIES
CONSOLIDATED STATEMENTS OF CHANGES IN EQUITY For the Six Months Ended June 30, 2011 and 2010
(in million pesos)
(Unaudited) Preferred
Stock Common
Stock Treasury
Stock
Capital in Excess of Par Value
Retained Earnings
Other Comprehensive
Loss
Total Equity
Attributable to Equity Holders
of PLDT Non-controlling
Interests Total
Equity Balances as at January 1, 2010 4,416 947 (6,405) 62,890 37,744 (1,017) 98,575 550 99,125 Total comprehensive income for the period: – – – – 21,679 86 21,765 (60) 21,705
Net income for the period (Notes 4 and 8) – – – – 21,679 – 21,679 (58) 21,621 Other comprehensive income (Note 6) – – – – – 86 86 (2) 84
Cash dividends (Note 18) – – – – (26,383) – (26,383) (50) (26,433)Issuance of capital stock – net of conversion
(Note 18) 1 – – – – – 1 – 1 Acquisition of treasury stocks
(Notes 2, 8, 18 and 24) – – – – – – – (6) (6)Others – – – – – – – 9 9 Balances as at June 30, 2010 4,417 947 (6,405) 62,890 33,040 (931) 93,958 443 94,401
Balances as at January 1, 2011 4,419 947 (6,505) 62,890 36,594 (1,276) 97,069 316 97,385 Total comprehensive income for the period: – – – – 21,299 (140) 21,159 (4) 21,155
Net income for the period (Notes 4 and 8) – – – – 21,299 – 21,299 (3) 21,296 Other comprehensive loss (Note 6) – – – – – (140) (140) (1) (141)
Cash dividends (Note 18) – – – – (26,937) – (26,937) – (26,937)Issuance of capital stock – net of conversion
(Note 18) 1 – – – – – 1 – 1 Others – – – – – – – 125 125 Balances as at June 30, 2011 4,420 947 (6,505) 62,890 30,956 (1,416) 91,292 437 91,729
See accompanying Notes to Consolidated Financial Statements.

F-7
PHILIPPINE LONG DISTANCE TELEPHONE COMPANY AND SUBSIDIARIES
CONSOLIDATED STATEMENTS OF CASH FLOWS For the Six Months Ended June 30, 2011 and 2010
(in million pesos)
2011 2010 (Unaudited)
CASH FLOWS FROM OPERATING ACTIVITIES Income before income tax (Note 4) 28,094 29,377 Adjustments for:
Depreciation and amortization (Notes 3, 4 and 9) 13,118 13,054 Interest on loans and other related items – net (Notes 4, 5, 9, 19 and 26) 2,552 2,836 Asset impairment (Notes 3, 4, 5, 9, 10, 13, 15, 16 and 26) 812 1,220 Incentive plans (Notes 3, 5 and 24) 702 694 Accretion on financial liabilities – net (Notes 5, 19 and 26) 555 567 Amortization of intangible assets (Notes 3 and 13) 144 178 Losses (gains) on disposal of property, plant and equipment (Note 9) 27 (39)Pension benefit costs (income) (Notes 3, 5 and 24) (30) 130 Foreign exchange losses (gains) – net (Notes 4, 9 and 26) (426) 59 Gains on derivative financial instruments – net (Notes 4 and 26) (484) (934)Interest income (Notes 4, 5 and 14) (645) (612)Equity share in net earnings of associates and joint ventures (Notes 4 and 10) (839) (881)Others (17) (135)
Operating income before changes in assets and liabilities 43,563 45,514 Decrease (increase) in:
Trade and other receivables 661 (1,934)Inventories and supplies (371) (247)Prepayments (39) 85 Advances and refundable deposits 95 (8)
Increase (decrease) in: Accounts payable (4,673) (2,883)Accrued expenses and other current liabilities 1,790 1,856 Pension and other employee benefits (102) (4,534)Customers’ deposits 24 47 Other noncurrent liabilities 31 (7)
Net cash generated from operations 40,979 37,889 Income taxes paid (6,350) (6,041)Net cash provided by operating activities 34,629 31,848 CASH FLOWS FROM INVESTING ACTIVITIES Interest received 653 665 Dividends received 216 221 Proceeds from:
Maturity of short-term investments 187 3,480 Disposal of property, plant and equipment (Note 9) 35 92 Disposal of investment properties (Note 12) – 36 Disposal of available-for-sale financial assets – 9
Payments for: Acquisition of intangibles (Note 13) (9) (11)Purchase of short-term investments (171) (346)Contingent consideration arising from business combinations (Note 22) (817) (7)
Interest paid – capitalized to property, plant and equipment (Notes 4, 5, 9, 19 and 26) (314) (306)Additions to property, plant and equipment (Notes 4 and 9) (6,021) (9,394)Increase in advances and refundable deposits (57) (212)Net cash used in investing activities (6,298) (5,773)
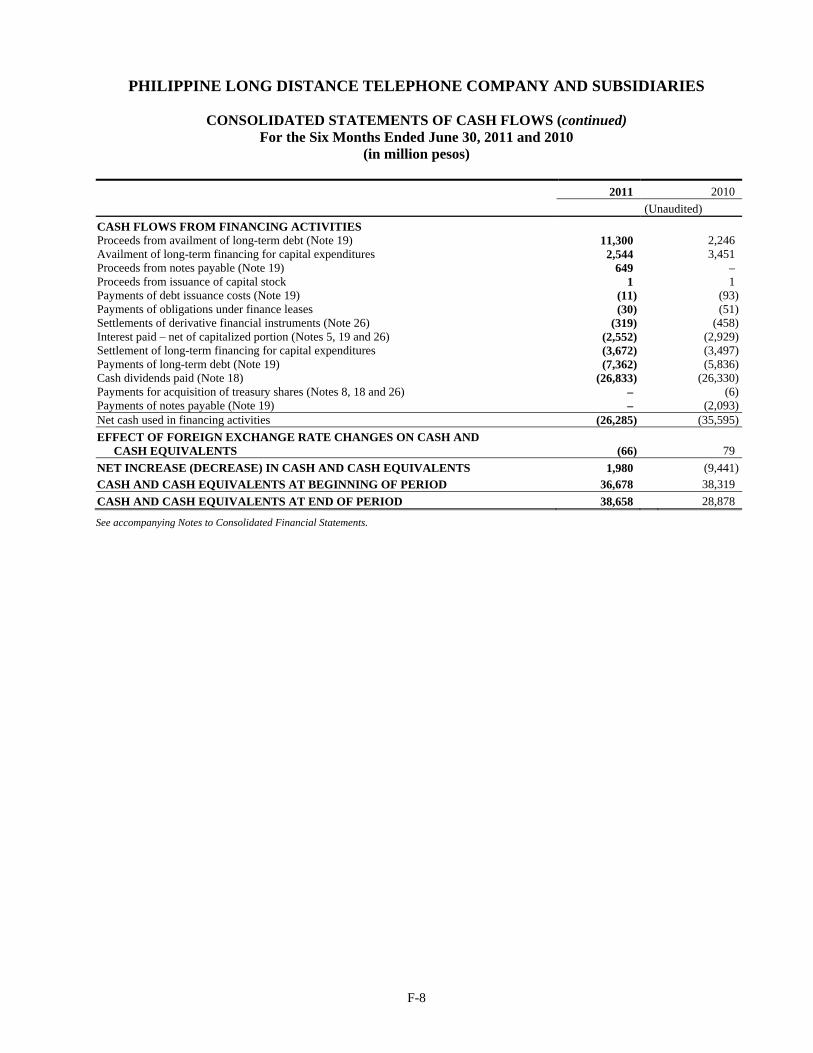
F-8
PHILIPPINE LONG DISTANCE TELEPHONE COMPANY AND SUBSIDIARIES
CONSOLIDATED STATEMENTS OF CASH FLOWS (continued) For the Six Months Ended June 30, 2011 and 2010
(in million pesos)
2011 2010 (Unaudited)
CASH FLOWS FROM FINANCING ACTIVITIES Proceeds from availment of long-term debt (Note 19) 11,300 2,246 Availment of long-term financing for capital expenditures 2,544 3,451 Proceeds from notes payable (Note 19) 649 – Proceeds from issuance of capital stock 1 1 Payments of debt issuance costs (Note 19) (11) (93)Payments of obligations under finance leases (30) (51)Settlements of derivative financial instruments (Note 26) (319) (458)Interest paid – net of capitalized portion (Notes 5, 19 and 26) (2,552) (2,929)Settlement of long-term financing for capital expenditures (3,672) (3,497)Payments of long-term debt (Note 19) (7,362) (5,836)Cash dividends paid (Note 18) (26,833) (26,330)Payments for acquisition of treasury shares (Notes 8, 18 and 26) – (6)Payments of notes payable (Note 19) – (2,093)Net cash used in financing activities (26,285) (35,595)EFFECT OF FOREIGN EXCHANGE RATE CHANGES ON CASH AND
CASH EQUIVALENTS (66) 79 NET INCREASE (DECREASE) IN CASH AND CASH EQUIVALENTS 1,980 (9,441)CASH AND CASH EQUIVALENTS AT BEGINNING OF PERIOD 36,678 38,319 CASH AND CASH EQUIVALENTS AT END OF PERIOD 38,658 28,878
See accompanying Notes to Consolidated Financial Statements.

F-9
PHILIPPINE LONG DISTANCE TELEPHONE COMPANY AND SUBSIDIARIES
NOTES TO CONSOLIDATED FINANCIAL STATEMENTS
1. Corporate Information
The Philippine Long Distance Telephone Company, or PLDT, or Parent Company, was incorporated under the old Corporation Law of the Philippines (Act 1459, as amended) on November 28, 1928, following the merger of four telephone companies under common U.S. ownership. Under its amended Articles of Incorporation, PLDT’s corporate term is currently limited through 2028. In 1967, effective control of PLDT was sold by the General Telephone and Electronics Corporation, then a major shareholder since PLDT’s incorporation, to a group of Filipino businessmen. In 1981, in furtherance of the then existing policy of the Philippine government to integrate the Philippine telecommunications industry, PLDT purchased substantially all of the assets and liabilities of the Republic Telephone Company, which at that time was the second largest telephone company in the Philippines. In 1998, the First Pacific Company Limited, or First Pacific, through its Philippine and other affiliates, collectively the First Pacific Group, acquired a significant interest in PLDT. On March 24, 2000, NTT Communications Corporation, or NTT Communications, through its wholly-owned subsidiary NTT Communications Capital (UK) Ltd., or NTTC-UK, became PLDT’s strategic partner with approximately 15% economic and voting interest in the issued and outstanding common stock of PLDT at that time. Simultaneous with NTT Communications’ investment in PLDT, the latter acquired 100% of Smart Communications, Inc., or Smart. On March 14, 2006, NTT DoCoMo, Inc., or NTT DoCoMo, acquired from NTT Communications approximately 7% of PLDT’s then outstanding common shares held by NTT Communications with NTT Communications retaining ownership of approximately 7% of PLDT’s common shares. Since March 14, 2006, NTT DoCoMo has made additional purchases of shares of PLDT and together with NTT Communications beneficially owned approximately 21% of PLDT’s outstanding common stock as at June 30, 2011. NTT Communications and NTT DoCoMo are subsidiaries of NTT Holding Company. On February 28, 2007, Metro Pacific Asset Holdings, Inc., a Philippine affiliate of First Pacific, completed the acquisition of an approximately 46% interest in Philippine Telecommunications Investment Corporation, or PTIC, a shareholder of PLDT. This investment in PTIC represents an attributable interest of approximately 6% of the then outstanding common shares of PLDT and thereby raised First Pacific Group’s beneficial ownership to approximately 28% of PLDT’s outstanding common stock as at that date. First Pacific Group had beneficial ownership of approximately 26% in PLDT’s outstanding common stock as at June 30, 2011. The common shares of PLDT are listed and traded on the Philippine Stock Exchange, Inc., or PSE. On October 19, 1994, an American Depositary Receipt, or ADR, facility was established, pursuant to which Citibank N.A., as the depositary, issued ADRs evidencing American Depositary Shares, or ADSs, with each ADS representing one PLDT common share with a par value of Php5 per share. Effective February 10, 2003, PLDT appointed JP Morgan Chase Bank as successor depositary for PLDT’s ADR facility. The ADSs are listed on the New York Stock Exchange, or NYSE, in the United States and are traded on the NYSE under the symbol “PHI”. There were approximately 55 million ADSs outstanding as at June 30, 2011. PLDT and our Philippine-based fixed line and wireless subsidiaries operate under the jurisdiction of the Philippine National Telecommunications Commission, or NTC, which jurisdiction extends, among other things, to approving major services offered and certain rates charged to customers. We are the leading telecommunications service provider in the Philippines. Through our three principal business segments, wireless, fixed line and information and communications technology, we offer the largest and most diversified range of telecommunications services across the Philippines’ most extensive fiber optic backbone and wireless, fixed line and satellite networks. Our registered office address is Ramon Cojuangco Building, Makati Avenue, Makati City, Philippines.

F-10
2. Summary of Significant Accounting Policies
Basis of Preparation Our consolidated financial statements have been prepared under the historical cost basis, except for derivative financial instruments, available-for-sale financial assets and investment properties that have been measured at fair value. Our consolidated financial statements include adjustments consisting only of normal recurring adjustments, necessary to present fairly the results of operations for the interim periods. The results of operations for the six months ended June 30, 2011 are not necessarily indicative of the results of operations that may be expected for the full year. Our consolidated financial statements are presented in Philippine peso, PLDT’s functional and presentation currency, and all values are rounded to the nearest million, except when otherwise indicated. Basis of Consolidation Our unaudited consolidated financial statements include the financial statements of PLDT and the following subsidiaries (collectively, the “PLDT Group”) as at June 30, 2011:
Place of Percentage of Ownership
Name of Subsidiary Incorporation Principal Business Activity Direct Indirect Wireless
Smart: Philippines Cellular mobile services 100.0 – Smart Broadband, Inc., or SBI, and Subsidiaries,
or SBI Group Philippines Internet broadband distribution services – 100.0
Primeworld Digital Systems, Inc., or PDSI Philippines Internet broadband distribution services – 100.0 I-Contacts Corporation, or I-Contacts Philippines Call center services – 100.0 Wolfpac Mobile, Inc., or Wolfpac Philippines Mobile applications development and services – 100.0 Wireless Card, Inc., or WCI Philippines Promotion of the sale and/or patronage of debit
and/or charge cards – 100.0
Smarthub, Inc., or SHI Philippines Software development and sale of maintenance and support services
– 100.0
Smart Money Holdings Corporation, or SMHC: Cayman Islands Investment company – 100.0 Smart Money, Inc., or SMI Cayman Islands Mobile commerce solutions marketing – 100.0 Telecoms Solutions, Inc., or TSI Mauritius Mobile commerce platforms – 100.0
Far East Capital Limited, or FECL, and Subsidiary, or FECL Group
Cayman Islands Cost effective offshore financing and risk management activities for Smart
– 100.0
PH Communications Holdings Corporation, or PHC Philippines Investment company – 100.0 Francom Holdings, Inc., or FHI: Philippines Investment company – 100.0
Connectivity Unlimited Resource Enterprise, Inc., or CURE
Philippines Cellular mobile services – 100.0
Chikka Holdings Limited, or Chikka, and Subsidiaries, or Chikka Group
British Virgin Islands Mobile applications development and services; Content provider
– 100.0
PLDT Communications and Energy Ventures, Inc., or PCEV
Philippines Investment company – 99.5
SmartConnect Holdings Pte. Ltd., or SCH: Singapore Investment company – 100.0 SmartConnect Global Pte. Ltd., or SGP Singapore International trade of satellites and Global
System for Mobile Communication, or GSM, enabled global telecommunications
– 100.0
3rd Brand Pte. Ltd., or 3rd Brand Singapore Solutions and systems integration services – 85.0 Telesat, Inc., or Telesat* Philippines Satellite communications services 100.0 – ACeS Philippines Cellular Satellite Corporation,
or ACeS Philippines Philippines Satellite information and messaging services 88.5 11.5
Mabuhay Satellite Corporation, or Mabuhay Satellite* Philippines Satellite communications services 67.0 – Fixed Line
PLDT Clark Telecom, Inc., or ClarkTel Philippines Telecommunications services 100.0 – PLDT Subic Telecom, Inc., or SubicTel Philippines Telecommunications services 100.0 – PLDT Global Corporation, or PLDT Global, and
Subsidiaries, or PLDT Global Group British Virgin Islands Telecommunications services 100.0 –
Smart-NTT Multimedia, Inc., or SNMI* Philippines Data and network services 100.0 – PLDT-Philcom, Inc., or Philcom, and Subsidiaries,
or Philcom Group Philippines Telecommunications services 100.0 –
PLDT-Maratel, Inc., or Maratel Philippines Telecommunications services 97.8 – Bonifacio Communications Corporation, or BCC Philippines Telecommunications, infrastructure and related
value-added services, or VAS 75.0 –

F-11
Place of Percentage of OwnershipName of Subsidiary Incorporation Principal Business Activity Direct Indirect
Information and Communications Technology, or ICT
ePLDT, Inc., or ePLDT: Philippines Information and communications infrastructure for Internet-based services, e-commerce, customer relationship management and information technology, or IT, related services
100.0 –
SPi Technologies, Inc., or SPi, and Subsidiaries, or SPi Group
Philippines Knowledge processing solutions – 100.0
SPi CRM Inc., or SPi CRM Philippines Customer relationship management – 100.0 Infocom Technologies, Inc., or Infocom Philippines Internet services – 99.6 BayanTrade, Inc., or BayanTrade, and Subsidiaries,
or BayanTrade Group Philippines Internet-based purchasing, IT consulting and
professional services – 93.5
Level Up!, Inc., or Level Up! Philippines Publisher of online games – 57.5 netGames, Inc., or netGames Philippines Customer relationship management – 57.5
* Ceased commercial operations Basis of Consolidation Subsidiaries are fully consolidated from the date of acquisition, being the date on which the PLDT Group obtains control, and continue to be consolidated until the date that such control ceases. The financial statements of our subsidiaries are prepared for the same reporting period as PLDT. We prepare our consolidated financial statements using uniform accounting policies for like transactions and other events with similar circumstances. All intra-group balances, income and expenses, unrealized gains and losses and dividends resulting from intra-group transactions are eliminated in full. Non-controlling interest shares in losses even if the losses exceed the non-controlling equity interest in the subsidiary. A change in the ownership interest of a subsidiary, without loss of control, is accounted for as an equity transaction. If the PLDT Group loses control over a subsidiary, it: (a) derecognizes the assets (including goodwill) and liabilities of the subsidiary; (b) derecognizes the carrying amount of any non-controlling interest; (c) derecognizes the cumulative translation differences recorded in equity; (d) recognizes the fair value of the consideration received; (e) recognizes the fair value of any investment retained; (f) recognizes any surplus or deficit in profit or loss; and (g) reclassifies the parent’s share of components previously recognized in other comprehensive income to profit or loss or retained earnings, as appropriate. PCEV’s Share Buyback Program PCEV’s Board of Directors approved three share buyback programs during its meetings on November 3, 2008, March 2, 2009 and August 3, 2009. For all three programs, the buyback was done through the trading facilities of the PSE via open market purchases, block trades or other modes, subject to compliance with applicable laws, rules and regulations. The number of shares approved for repurchase under the buyback programs were 58 million, 25 million and 61.5 million for the programs approved on November 3, 2008, March 2, 2009 and August 3, 2009, respectively. The program approved on November 3, 2008 was completed in January 2009 at a total cost of Php403 million, while the program approved on March 2, 2009 was completed in March 2009 at a total cost of Php188 million. The program approved on August 3, 2009 is still ongoing and will continue until the number of shares earmarked for the program has been fully repurchased or until such time as PCEV’s Board of Directors determines otherwise. The most recent share buyback program was undertaken to accommodate non-controlling shareholders who may not have had the opportunity to participate in the tender offer of Smart due to various constraints. The maximum price under this program is Php8.50 per share. As at June 30, 2011, approximately 3.6 million shares at a cost of Php30 million have been repurchased under the third buyback program. As at June 30, 2011 and December 31, 2010, cumulative shares repurchased under the share buyback programs totaled approximately 86.6 million at an aggregate cost of Php621 million, which reduced the amount of non-controlling interest by the same amount.

F-12
ePLDT’s Sale of Investments in Digital Paradise and Level Up! As part of ePLDT’s business realignment and continuing efforts to dispose its non-core businesses, ePLDT sold its entire 75% interest in Digital Paradise on April 1, 2011, which was followed by the sale of its 57.5% interest in Level Up! on July 11, 2011. Statement of Compliance Our consolidated financial statements have been prepared in conformity with Philippine Financial Reporting Standards, or PFRS. Changes in Accounting Policies and Disclosures Our accounting policies are consistent with those of the previous financial year except for the adoption of the following amendments and improvements to existing PFRSs and new interpretation as at January 1, 2011:
• Revised Philippine Accounting Standard, or PAS, 24, Related Party Disclosures; • Amendment to PAS 32, Financial Instruments: Presentation - Classification of Rights Issues; • Amendment to Philippine Interpretation International Financial Reporting Interpretations Committee, or
IFRIC, 14, Prepayments of a Minimum Funding Requirement; • Philippine Interpretation IFRIC 19, Extinguishing Financial Liabilities with Equity Instrument; and • Improvements to PFRSs (2010).
The changes introduced by such amendments, improvements and new interpretation are as follows: Revised PAS 24, Related Party Disclosures. The standard has been revised to simplify the identification of related party relationship and re-balance the extent of disclosures of transactions between related parties based on the costs to preparers and the benefits to users in having this information available in the consolidated financial statements. Also, the revised standard provides a partial exemption from the disclosure requirements for government-related entities. The adoption of this revised standard did not have any impact on our financial position or performance. Amendment to PAS 32, Financial Instruments: Presentation - Classification of Rights Issues. The definition of a financial liability in the standard has been amended to classify right issues (and certain options or warrants) as equity instruments if: (a) the rights are given pro rata to all of the existing owners of the same class of an entity’s non-derivative equity instruments; and (b) the instruments are used to acquire a fixed number of the entity’s own equity instruments for a fixed amount in any currency. The adoption of this amendment did not have any impact on our financial position or performance. Amendment to Philippine Interpretation IFRIC 14, Prepayments of a Minimum Funding Requirement. The interpretation has been amended to permit an entity to treat the prepayment of a minimum funding requirement as an asset. The amendment should be applied to the beginning of the earliest period presented in the first financial statements in which the entity applied the original interpretation. The adoption of this amendment did not have any impact on our financial position or performance. Philippine Interpretation IFRIC 19, Extinguishing Financial Liabilities with Equity Instruments. The interpretation clarifies that equity instruments issued to a creditor to extinguish a financial liability are consideration paid. As a result, the financial liability is derecognized and the equity instruments issued are treated as consideration paid to extinguish that financial liability. The interpretation states that equity instruments issued in a debt for equity swap should be measured at the fair value of the equity instruments issued, if this can be determined reliably. If the fair value of the equity instruments issued is not reliably determinable, the equity instruments should be measured by reference to the fair value of the financial liability extinguished as of the date of extinguishment. Any difference between the carrying amount of the financial liability that is extinguished and the fair value of the equity instruments issued is recognized immediately in profit or loss. The interpretation did not have any impact on our financial position or performance.

F-13
Improvements to PFRSs The Financial Reporting Standards Council, or FRSC, approved during its meeting in May 2010 the adoption of Improvements to PFRSs, which were issued by the International Accounting Standards Board in May 2010. Improvements to PFRS is an omnibus of amendments to standards that deal primarily with a view to remove inconsistencies and clarify wording. There are separate transitional provisions for each standard which are all effective beginning January 1, 2011. The adoption of the following amendments resulted in changes to our accounting policies but did not have any impact on our financial position or performance.
• PFRS 3, Business Combinations. The improvements include: (a) clarification that the amendments to PFRS 7, Financial Instruments: Disclosures, PAS 32, Financial Instruments: Presentation, and PAS 39, Financial Instruments: Recognition and Measurement, that eliminate the exemption for contingent consideration, do not apply to contingent consideration that arose from business combinations whose acquisition dates precede the application of PFRS 3 (as revised in 2008); (b) guidance that the choice of measuring non-controlling interests at fair value or at the proportionate share of the acquiree’s net assets applies only to instruments that represent present ownership interests and entitle their holders to a proportionate share of the net assets in the event of liquidation. All other components of non-controlling interest are measured at fair value unless another measurement basis is required by PFRS; and (c) clarification that the application guidance in PFRS 3 applies to all share-based payment transactions that are part of a business combination, including un-replaced and voluntarily replaced share-based payment awards.
• PFRS 7, Financial Instruments. The amendment emphasizes the interaction between quantitative and
qualitative disclosures about the nature and extent of risks associated with financial instruments.
• PAS 1, Presentation of Financial Statements. The amendment clarifies that an entity will present an analysis of other comprehensive income for each component of equity, either in the statement of changes in equity or in the notes to the financial statements.
• PAS 27, Consolidated and Separate Financial Statements. The improvement clarifies that the
consequential amendments from PAS 27 made to PAS 21, The Effect of Changes in Foreign Exchange Rates, PAS 28, Investments in Associates, and PAS 31, Interests in Joint Ventures, apply prospectively for annual periods beginning on or after July 1, 2009, or earlier when PAS 27 is applied earlier.
• PAS 34, Interim Financial Reporting. The amendment provides guidance on how to apply disclosure
principles in PAS 34 and add disclosure requirements around: (a) the circumstances likely to affect fair values of financial instruments and their classification; (b) transfers of financial instruments between different levels of the fair value hierarchy; (c) changes in classification of financial assets; and (d) changes in contingent liabilities and assets.
• Philippine Interpretation IFRIC 13, Customer Loyalty Programmes. The amendment clarifies the
meaning of fair value in the context of measuring award credits under customer loyalty programmes. Significant Accounting Policies The following are the significant accounting policies applied by us in preparing our consolidated financial statements: Business Combinations and Goodwill
Business combinations are accounted for using the acquisition method. The cost of an acquisition is measured as the aggregate of the consideration transferred, measured at acquisition date fair value, and the amount of any non-controlling interest in the acquiree. For each business combination, the acquirer has the option to measure the components of the non-controlling interest in the acquiree that are present ownership interest and entitle their holders to a proportionate share of the net assets in the event of liquidation either at fair value or at the proportionate share of the acquiree’s identifiable net assets. All other components of non-controlling interest are measured at acquisition date fair values unless other measurement basis is required. Acquisition-related costs are expensed as incurred.

F-14
When we acquire a business, we assess the financial assets and liabilities assumed for appropriate classification and designation in accordance with the contractual terms, economic circumstances and pertinent conditions as at the acquisition date. This includes the separation of embedded derivatives in host contracts by the acquiree. If the business combination is achieved in stages, the acquirer’s previously held equity interest in the acquiree is remeasured to fair value as at the acquisition date through profit or loss. Any contingent consideration to be transferred by the acquirer will be recognized at fair value at the acquisition date. Subsequent changes to the fair value of the contingent consideration which is deemed to be an asset or liability will be recognized in accordance with PAS 39 either in profit or loss or as a charge to other comprehensive income. If the contingent consideration is classified as equity, it shall not be remeasured. Subsequent settlement is accounted for within equity. In instances where the contingent consideration does not fall within the scope of PAS 39, it is measured in accordance with the appropriate PFRS. Goodwill is initially measured at cost being the excess of the consideration transferred over the fair values of net identifiable assets acquired and liabilities assumed. If this consideration is lower than the fair value of the net assets of the subsidiary acquired, the difference is recognized in profit or loss. After initial recognition, goodwill is measured at cost less any accumulated impairment losses. For the purpose of impairment testing, goodwill acquired in a business combination is, from the acquisition date, allocated to each of our cash-generating units that are expected to benefit from the combination, irrespective of whether other assets or liabilities of the acquiree are assigned to those units. Where goodwill forms part of a cash-generating unit and part of the operation within that unit is disposed of, the goodwill associated with the operation disposed of is included in the carrying amount of the operation when determining the gain or loss on disposal of the operation. Goodwill disposed of in this circumstance is measured based on the relative values of the operation disposed of and the portion of the cash-generating unit retained. Investments in Associates Investments in associates are accounted for using the equity method of accounting and are initially recognized at cost. An associate is an entity in which we have significant influence and which is neither a subsidiary nor a joint venture. Under the equity method, an investment in an associate is carried in our consolidated statement of financial position at cost plus post acquisition changes in our share of net assets of the associate. Goodwill relating to an associate is included in the carrying amount of the investment and is not amortized nor individually tested for impairment. Our consolidated income statement reflects our share in the financial performance of our associates. Where there has been a change recognized directly in the equity of the associate, we recognize our share in such change and disclose this, when applicable, in our consolidated statement of comprehensive income and changes in equity. Unrealized gains and losses resulting from our transactions with and among our associates are eliminated to the extent of our interest in those associates. Our share in the profit or losses of our associates is shown on the face of our consolidated income statement. This is the profit or losses attributable to equity holders of the associate and therefore is profit or losses after tax and net of non-controlling interest in the subsidiaries of the associates. Our reporting dates and that of our associates are identical and our associates’ accounting policies conform to those used by us for like transactions and events in similar circumstances. Where necessary, adjustments are made to bring such accounting policies in line with those of PLDT Group. After application of the equity method, we determine whether it is necessary to recognize an additional impairment loss on our investments in associates. We determine at the end of each reporting period whether there is any objective evidence that our investment in associate is impaired. If this is the case, we calculate the amount of impairment as the difference between the recoverable amount of our investment in the associate and its carrying value and recognize the amount in our consolidated income statement.

F-15
Upon loss of significant influence over the associate, we measure and recognize any retained investment at its fair value. Any difference between the carrying amounts of our investment in the associate upon loss of significant influence, and the fair value of the remaining investment and proceeds from disposal, is recognized in profit or loss. Investments in Joint Ventures Investments in a joint venture that is a jointly controlled entity is accounted for using the equity method of accounting. The financial statements of the joint venture are prepared for the same reporting period as our consolidated financial statements. Where necessary, adjustments are made to bring the accounting policies of the joint venture in line with those of PLDT Group. Adjustments are made in our consolidated financial statements to eliminate our share of unrealized gains and losses on transactions between PLDT and our jointly controlled entity. The joint venture is carried at equity method until the date on which we cease to have joint control over the jointly controlled entity. Upon loss of joint control and provided that the former jointly controlled entity does not become a subsidiary or associate, we measure and recognize our remaining investment at fair value. Any difference between the carrying amount of the former jointly controlled entity upon loss of joint control, and the fair value of the remaining investment and proceeds from disposal, is recognized in profit or loss. When the remaining investment constitutes significant influence, it is accounted for as investment in an associate. Foreign Currency Transactions and Translations Our consolidated financial statements are presented in Philippine peso, which is also the Parent Company’s functional currency. The Philippine peso is the currency of the primary economic environment in which we operate. This is also the currency that mainly influences the revenue from and cost of rendering products and services. Each entity in the PLDT Group determines its own functional currency and items included in the financial statements of each entity are measured using that functional currency. The functional and presentation currency of the entities under PLDT Group (except for SCH, SGP, 3rd Brand, SMHC, SMI, TSI, FECL Group, PLDT Global, SPi and certain of its subsidiaries, and certain subsidiaries of Chikka and BayanTrade) is the Philippine peso. Transactions in foreign currencies are initially recorded in the functional currency rates prevailing at the date of the transaction. Monetary assets and liabilities denominated in foreign currencies are retranslated at the functional currency closing rate of exchange prevailing at the end of the reporting period. All differences are recognized in our consolidated income statement except for foreign exchange differences that qualify as capitalizable borrowing costs for qualifying assets. Non-monetary items that are measured in terms of historical cost in a foreign currency are translated using the exchange rates as at the dates of the initial transactions. Non-monetary items measured at fair value in a foreign currency are translated using the exchange rates at the date when the fair value was determined. Any goodwill arising on the acquisition of a foreign operation and any fair value adjustments to the carrying amounts of assets and liabilities arising on the acquisition are treated as assets and liabilities of the foreign operation and translated at the closing rate. The functional currency of SMHC, SMI, TSI, FECL Group, PLDT Global, SPi and certain of its subsidiaries, and certain subsidiaries of Chikka is the U.S. dollar; and Singapore dollar for SCH, SGP, 3rd Brand and certain subsidiaries of BayanTrade. As at the reporting date, the assets and liabilities of these subsidiaries are translated into Philippine peso at the rate of exchange prevailing at the end of the reporting period, and income and expenses of these subsidiaries are translated monthly using the weighted average exchange rate for the month. The exchange differences arising on translation are recognized as a separate component of other comprehensive income as cumulative translation adjustments. On disposal of these subsidiaries, the amount of deferred cumulative translation adjustments recognized in other comprehensive income relating to subsidiaries are recognized in our consolidated income statement. Foreign exchange gains or losses of PLDT and our Philippine-based subsidiaries are treated as taxable income or deductible expenses in the year such exchange gains or losses are realized.

F-16
Financial Instruments – Initial recognition and subsequent measurement
Financial Assets
Initial recognition Financial assets are classified as financial assets at fair value through profit or loss, or FVPL, loans and receivables, held-to-maturity, or HTM, investments, available-for-sale financial assets, or as derivatives designated as hedging instruments in an effective hedge, as appropriate. We determine the classification of financial assets at initial recognition and, where allowed and appropriate, re-evaluate the designation of such assets at each financial year-end. Financial assets are recognized initially at fair value plus, in the case of financial assets not at FVPL, directly attributable transaction costs. Purchases or sales of financial assets that require delivery of assets within a time frame established by regulation or convention in the market place (regular way purchases or sales) are recognized on the trade date, i.e., the date that we commit to purchase or sell the asset. Our financial assets include cash and cash equivalents, short-term investments, trade and other receivables, quoted and unquoted equity and debt securities, advances and refundable deposits, and derivative financial assets.
Subsequent measurement The subsequent measurement of financial assets depends on the classification as follows:
Financial assets at FVPL Financial assets at FVPL include financial assets held-for-trading and financial assets designated upon initial recognition at FVPL. Financial assets are classified as at FVPL if they are acquired for the purpose of selling in the near term. Derivative assets, including separated embedded derivatives are also classified as at FVPL unless they are designated as effective hedging instruments. Financial assets at FVPL are carried in our consolidated statement of financial position at fair value with gains or losses recognized in our consolidated income statement under “Gains (losses) on derivative financial instruments – net” for derivative instruments and “Other income” for non-derivative financial assets. Interest earned and dividends received from financial assets at FVPL are recognized in our consolidated income statement under “Interest income” and “Other income”, respectively. Financial assets may be designated at initial recognition as at FVPL if any of the following criteria are met: (i) the designation eliminates or significantly reduces the inconsistent treatment that would otherwise arise from measuring the assets or recognizing gains or losses on them on a different bases; (ii) the assets are part of a group of financial assets which are managed and their performance are evaluated on a fair value basis, in accordance with a documented risk management strategy and information about the company is provided internally on that basis to the entity’s key management personnel; or (iii) the financial assets contain one or more embedded derivatives that would need to be separately recorded. Derivatives embedded in host contracts are accounted for as separate derivatives when their risks and characteristics are not closely related to those of the host contracts and the host contracts are not carried at fair value. These embedded derivatives are measured at fair value with gains or losses arising from changes in fair value recognized in our consolidated income statement. Reassessment only occurs if there is a change in the terms of the contract that significantly modifies the cash flows that would otherwise be required.

F-17
Loans and receivables
Loans and receivables are non-derivative financial assets with fixed or determinable payments and are not quoted in an active market after initial measurement. Such financial assets are carried at amortized cost using the effective interest rate, or EIR, method. This method uses an EIR that exactly discounts estimated future cash receipts through the expected life of the financial asset to the net carrying amount of the financial asset. Gains and losses are recognized in our consolidated income statement when the loans and receivables are derecognized or impaired, as well as through the amortization process. Interest earned or incurred is recorded in “Interest income” in our consolidated income statement. Assets in this category are included in the current assets except for those with maturities greater than 12 months after the end of the reporting period, which are classified as noncurrent assets.
HTM investments Non-derivative financial assets with fixed or determinable payments and fixed maturities are classified as HTM when we have the positive intention and ability to hold it to maturity. After initial measurement, HTM investments are measured at amortized cost using the EIR method. Gains or losses are recognized in our consolidated income statement when the investments are derecognized or impaired, as well as through the amortization process. Interest earned or incurred is recorded in “Interest income” in our consolidated income statement. Assets in this category are included in the current assets except for those with maturities greater than 12 months after the end of the reporting period, which are classified as noncurrent assets.
Available-for-sale financial assets Available-for-sale financial assets are non-derivative financial assets that are designated as available-for-sale or are not classified in any of the three preceding categories. They are purchased and held indefinitely and may be sold in response to liquidity requirements or changes in market conditions. After initial measurement, available-for-sale financial assets are measured at fair value with unrealized gains or losses recognized in other comprehensive income account until the investment is derecognized, at which time the cumulative gain or loss recorded in other comprehensive income reserve account is recognized in our consolidated income statement; or determined to be impaired, at which time the cumulative loss recorded in other comprehensive income reserve account is recognized in our consolidated income statement. Interest earned on holding available-for-sale debt securities are included under “Interest income” using the EIR method in our consolidated income statement. Dividends earned on holding available-for-sale equity investments are recognized in our consolidated income statement under “Other income” when the right of the payment has been established. These financial assets are included under noncurrent assets unless we intend to dispose of the investment within 12 months of the end of the reporting period.
Financial Liabilities
Initial recognition Financial liabilities are classified as financial liabilities at FVPL, other financial liabilities, or as derivatives designated as hedging instruments in an effective hedge, as appropriate. We determine the classification of our financial liabilities at initial recognition. Financial liabilities are recognized initially at fair value and, in the case of other financial liabilities, inclusive of directly attributable transaction costs. Our financial liabilities include accounts payable, accrued expenses and other current liabilities, interest-bearing financial liabilities, customers’ deposits, derivative financial liabilities, dividends payable, and accrual for long-term capital expenditures included under “Deferred credits and other noncurrent liabilities” account.

F-18
Subsequent measurement The subsequent measurement of financial liabilities depends on their classification as follows:
Financial liabilities at FVPL Financial liabilities at FVPL include financial liabilities held-for-trading and financial liabilities designated upon initial recognition at FVPL. Financial liabilities are classified as at held-for-trading if they are acquired for the purpose of selling in the near term. Derivative liabilities, including separated embedded derivatives are also classified as at FVPL unless they are designated as effective hedging instruments. Financial liabilities at FVPL are carried in our consolidated statement of financial position at fair value with gains or losses recognized in our consolidated income statement under “Gains (losses) on derivative financial instruments – net” for derivative instruments and “Other income” for non-derivative financial liabilities. Financial liabilities may be designated at initial recognition as FVPL if any of the following criteria are met: (i) the designation eliminates or significantly reduces the inconsistent treatment that would otherwise arise from measuring the liabilities or recognizing gains or losses on them on a different bases; (ii) the liabilities are part of a group of financial liabilities which are managed and their performance are evaluated on a fair value basis, in accordance with a documented risk management strategy and information about the company is provided internally on that basis to the entity’s key management personnel; or (iii) the financial liabilities contain one or more embedded derivatives that would need to be separately recorded.
Other financial liabilities After initial recognition, other financial liabilities are subsequently measured at amortized cost using the EIR method. Gains and losses are recognized in our consolidated income statement when the liabilities are derecognized as well as through the EIR amortization process. Amortized cost is calculated by taking into account any discount or premium on acquisition and fees or costs that are integral part of the EIR. The EIR amortization is included under “Financing costs – net” in our consolidated income statement.
Offsetting of financial instruments Financial assets and financial liabilities are offset and the net amount is reported in our consolidated statement of financial position if, and only if, there is a currently enforceable legal right to offset the recognized amounts and there is an intention to settle on a net basis, or to realize the assets and settle the liabilities simultaneously.
Fair value of financial instruments The fair value of financial instruments that are actively traded in organized financial markets is determined by reference to quoted market prices or dealer price quotations at the close of business at the end of the reporting period. For financial instruments where there is no active market, fair value is determined using appropriate valuation techniques. Such techniques may include using recent arm’s length market transactions; reference to the current fair value of another instrument that is substantially the same; discounted cash flow analysis or other valuation models. An analysis of fair values of financial instruments and further details as to how they are measured are provided in Note 26 – Financial Assets and Liabilities.
Amortized cost of financial instruments Amortized cost is computed using the EIR method less any allowance for impairment and principal repayment or reduction. The calculation takes into account any premium or discount on acquisition and includes transaction costs and fees that are an integral part of EIR.

F-19
“Day 1” difference Where the transaction price in a non-active market is different from the fair value of other observable current market transactions in the same instrument or based on a valuation technique which variables include only data from observable market, we recognize the difference between the transaction price and fair value (a “Day 1” difference) in our consolidated income statement unless it qualifies for recognition as some other type of asset or liability. In cases where data used are not observable, the difference between the transaction price and model value is only recognized in our consolidated income statement when the inputs become observable or when the instrument is derecognized. For each transaction, we determine the appropriate method of recognizing the “Day 1” difference amount. Impairment of Financial Assets We assess at the end of each reporting period whether there is any objective evidence that a financial asset or a group of financial assets is impaired. A financial asset or a group of financial assets is deemed to be impaired if, and only if, there is objective evidence of impairment as a result of one or more events that have occurred after the initial recognition of the asset (an incurred “loss event”) and that loss event has an impact on the estimated future cash flows of the financial asset or the group of financial assets that can be reliably estimated. Evidence of impairment may include indications that the debtor or a group of debtors is experiencing significant financial difficulty, default or delinquency in interest or principal payments, the probability that the debtor will enter bankruptcy or other financial reorganization and where observable data indicate that there is a measurable decrease in the estimated future cash flows, such as changes in arrears or economic conditions that correlate with defaults.
Financial assets carried at amortized cost For financial assets carried at amortized cost, we first assess whether objective evidence of impairment exists individually for financial assets that are individually significant, or collectively for financial assets that are not individually significant. If we determine that no objective evidence of impairment exists for an individually assessed financial asset, whether significant or not, we include the asset in a group of financial assets with similar credit risk characteristics and collectively assess them for impairment. Assets that are individually assessed for impairment and for which an impairment loss is, or continues to be, recognized are not included in a collective assessment of impairment. If there is objective evidence that an impairment loss has been incurred, the amount of the loss is measured as the difference between the asset’s carrying amount and the present value of estimated future cash flows (excluding future expected credit losses that have not yet been incurred). The present value of the estimated future cash flows is discounted at the financial asset’s original EIR. If a financial asset has a variable interest rate, the discount rate for measuring any impairment loss is the current EIR. The carrying amount of the asset is reduced through the use of an allowance account and the amount of the loss is recognized under “Asset impairment” in our consolidated income statement. Interest income continues to be accrued on the reduced carrying amount based on the original EIR of the asset. The financial asset together with the associated allowance are written-off when there is no realistic prospect of future recovery and all collateral has been realized or has been transferred to us. If, in a subsequent year, the amount of the estimated impairment loss increases or decreases because of an event occurring after the impairment was recognized, the previously recognized impairment loss is increased or reduced by adjusting the allowance account. Any subsequent reversal of an impairment loss is recognized in our consolidated income statement, to the extent that the carrying value of the asset does not exceed its original amortized cost at the reversal date. If a future write-off is later recovered, the recovery is recognized in profit or loss.

F-20
Available-for-sale financial assets In the case of equity investments classified as available-for-sale financial assets, objective evidence would include a significant or prolonged decline in the fair value of the investment below its cost. When a decline in the fair value of an available-for-sale financial asset has been recognized in other comprehensive income reserve account and there is objective evidence that the asset is impaired, the cumulative loss that had been recognized in other comprehensive income reserve account is reclassified from other comprehensive income reserve account to profit or loss as a reclassification adjustment even though the financial asset has not been derecognized. The amount of the cumulative loss that is reclassified from other comprehensive income account to profit or loss is the difference between the acquisition cost (net of any principal repayment and amortization) and current fair value, less any impairment loss on that financial asset previously recognized in profit or loss. Impairment losses recognized in profit or loss for an investment in an equity instrument are not reversed in profit or loss. Subsequent increases in the fair value after impairment are recognized directly in other comprehensive income reserve account. In the case of debt instruments classified as available-for-sale financial assets, impairment is assessed based on the same criteria as financial assets carried at amortized cost. Future interest income is based on the reduced carrying amount and is accrued based on the rate of interest used to discount future cash flows for the purpose of measuring impairment loss. Such accrual is recorded as part of “Interest income” in our consolidated income statement. If, in a subsequent year, the fair value of a debt instrument increases and the increase can be objectively related to an event occurring after the impairment loss was recognized in our consolidated income statement, the impairment loss is reversed in profit or loss. Derecognition of Financial Assets and Liabilities
Financial assets A financial asset (or where applicable a part of a financial asset or part of a group of similar financial assets) is derecognized when: (1) the rights to receive cash flows from the asset have expired; or (2) we have transferred its rights to receive cash flows from the asset or have assumed an obligation to pay the received cash flows in full without material delay to a third party under a “pass-through” arrangement; and either: (a) we have transferred substantially all the risks and rewards of the asset; or (b) we have neither transferred nor retained substantially all the risks and rewards of the asset, but have transferred control of the asset. When we have transferred the rights to receive cash flows from an asset or have entered into a “pass-through” arrangement, and have neither transferred nor retained substantially all the risks and rewards of the asset nor transferred control of the asset, a new asset is recognized to the extent of our continuing involvement in the asset. Continuing involvement that takes the form of a guarantee over the transferred asset is measured at the lower of the original carrying amount of the asset and the maximum amount of the consideration that we could be required to repay. When continuing involvement takes the form of a written and/or purchased option (including a cash-settled option or similar provision) on the transferred asset, the extent of our continuing involvement is the amount of the transferred asset that we may repurchase, except that in the case of a written put option (including a cash-settled option or similar provision) on an asset measured at fair value, the extent of our continuing involvement is limited to the lower of the fair value of the transferred asset and the option exercise price.
Financial liabilities A financial liability is derecognized when the obligation under the liability is discharged or cancelled or has expired. When an existing financial liability is replaced by another from the same lender on substantially different terms, or the terms of an existing liability are substantially modified, such an exchange or modification is treated as a derecognition of the original liability and the recognition of a new liability, and the difference in the carrying amount of a financial liability extinguished or transferred to another party and the consideration paid, including any non-cash assets transferred or liabilities assumed, is recognized in profit or loss.

F-21
The financial liability is also derecognized with equity instruments are issued to extinguish all or part of the financial liability. The equity instruments issued are recognized at fair value if it can be reliably measured, otherwise, it is recognized at the fair value of the financial liability extinguished. Any difference between the fair value of the equity instruments issued and the carrying value of the financial liability extinguished is recognized in the profit or loss. Derivative Financial Instruments and Hedge Accounting
Initial recognition and subsequent measurement We use derivative financial instruments, such as long-term currency swaps, foreign currency options, forward currency contracts and interest rate swaps to hedge our risks associated with interest rate and foreign currency fluctuations. Such derivative financial instruments are initially recognized at fair value on the date on which a derivative contract is entered into and are subsequently remeasured at fair value. Derivatives are carried as financial assets when the fair value is positive and as financial liabilities when the fair value is negative. Any gains or losses arising from changes in fair value on derivatives during the period that do not qualify for hedge accounting are taken directly to the “Gains (losses) on derivative financial instruments – net” in our consolidated income statement. The fair value of forward currency contracts is calculated by reference to current forward exchange rates for contracts with similar maturity profiles. The fair value of long-term currency swaps, foreign currency options and interest rate swap contracts is determined using applicable valuation techniques. See Note 26 – Financial Assets and Liabilities. For the purpose of hedge accounting, hedges are classified as: (1) fair value hedges when hedging the exposure to changes in the fair value of a recognized financial asset or liability or an unrecognized firm commitment (except for foreign-currency risk); or (2) cash flow hedges when hedging exposure to variability in cash flows that is neither attributable to a particular risk associated with a recognized financial asset or liability or a highly probable forecast transaction or the foreign-currency risk in an unrecognized firm commitment; or (3) hedges of a net investment in a foreign operation. At the inception of a hedge relationship, we formally designate and document the hedge relationship to which we wish to apply hedge accounting and the risk management objective and strategy for undertaking the hedge. The documentation includes identification of the hedging instrument, the hedged item or transaction, the nature of the risk being hedged and how we will assess the hedging instrument’s effectiveness in offsetting the exposure to changes in the hedged item’s fair value or cash flows attributable to the hedged risk. Such hedges are expected to be highly effective in achieving offsetting changes in fair value or cash flows and are assessed on an on-going basis to determine that they actually have been highly effective throughout the financial reporting periods for which they are designated. In a situation when that hedged item is a forecast transaction, we assess whether the transaction is highly probable and presents an exposure to variations in cash flows that could ultimately affect our consolidated income statement. Hedges which meet the strict criteria for hedge accounting are accounted for as follows:
Fair value hedges The change in the fair value of a hedging derivative is recognized in our consolidated income statement. The change in the fair value of the hedged item attributable to the risk being hedged is recorded as part of the carrying value of the hedged item and is also recognized in our consolidated income statement. The fair value for financial instruments traded in active markets at the end of the reporting period is based on their quoted market price or dealer price quotations (bid price for long positions and ask price for short positions), without any deduction for transaction costs. When current bid and asking prices are not available, the price of the most recent transaction provides evidence of the current fair value as long as there has not been a significant change in economic circumstances since the time of the transaction. For all other financial instruments not listed in an active market, the fair value is determined by using appropriate valuation techniques. Valuation techniques include net present value techniques, comparison to similar instruments for which market observable prices exist, option pricing models, and other relevant valuation models.

F-22
When an unrecognized firm commitment is designated as a hedged item, the subsequent cumulative change in the fair value of the firm commitment attributable to the hedged risk is recognized as financial asset or liability with a corresponding gain or loss recognized in our consolidated income statement. The changes in the fair value of the hedging instrument are also recognized in our consolidated income statement.
Cash flow hedges The effective portion of the gain or loss on the hedging instrument is recognized in our statement of comprehensive income, while any ineffective portion is recognized immediately in our consolidated income statement. Amounts taken to comprehensive income are transferred to our consolidated income statement when the hedged transaction affects our consolidated income statement, such as when the hedged financial income or financial expense is recognized or when a forecast sale occurs. Where the hedged item is the cost of a non-financial asset or non-financial liability, the amounts taken to other comprehensive income are transferred to the initial carrying amount of the non-financial asset or liability. If the forecast transaction or firm commitment is no longer expected to occur, amounts previously recognized in other comprehensive income are transferred to our consolidated income statement. If the hedging instrument expires or is sold, terminated or exercised without replacement or rollover, or if its designation as a hedge is revoked, amounts previously recognized in other comprehensive income remain in other comprehensive income until the forecast transaction or firm commitment occurs.
Hedges of a net investment in a foreign operation Hedges of a net investment in a foreign operation, including a hedge of a monetary item that is accounted for as part of the net investment, are accounted for in a way similar to cash flow hedges. Gains or losses on the hedging instrument relating to the effective portion of the hedge are recognized in other comprehensive income while any gains or losses relating to the ineffective portion are recognized in our consolidated income statement. On disposal of the foreign operation, the cumulative value of any such gains or losses recognized in other comprehensive income is transferred to our consolidated income statement.
Current versus noncurrent classification Derivative instruments that are not designated as effective hedging instruments are classified as current or noncurrent or separated into a current and noncurrent portion based on an assessment of the facts and circumstances (i.e., the underlying contracted cash flows). Where the group will hold a derivative as an economic hedge (and does not apply hedge accounting) for a period beyond 12 months after the reporting date, the derivative is classified as noncurrent (or separated into current and noncurrent portions) consistent with the classification of the underlying item. Embedded derivatives that are not closely related to the host contract are classified consistent with the cash flows of the host contract. Derivative instruments that are designated as effective hedging instruments, are classified consistently with the classification of the underlying hedged item. The derivative instrument is separated into a current portion and a noncurrent portion only if a reliable allocation can be made. Property, Plant and Equipment Property, plant and equipment, except for land, is stated at cost less accumulated depreciation and amortization and any accumulated impairment losses. Cost includes the cost of replacing component parts of the property, plant and equipment when the cost is incurred, if the recognition criteria are met. Likewise, when a major inspection is performed, its cost is recognized in the carrying amount of the property, plant and equipment as a replacement if the recognition criteria are satisfied. All other repair and maintenance costs are recognized in our consolidated income statement as incurred. The present value of the expected cost for the decommissioning of the asset after use is included in the cost of the respective assets if the recognition criteria for a provision are met. Land is stated at cost less any impairment in value.

F-23
An item of property, plant and equipment is derecognized upon disposal or when no future economic benefits are expected from its use or disposal. Any gain or loss arising on derecognition of the asset (calculated as the difference between the net disposal proceeds and the carrying amount of the asset) is included in profit or loss in the year the asset is derecognized. Depreciation and amortization are calculated on a straight-line basis over the estimated useful lives of the assets. The estimated useful lives used in depreciating our property, plant and equipment are disclosed in Note 9 – Property, Plant and Equipment. The asset’s residual value, estimated useful life, and depreciation and amortization method are reviewed at least at each financial year-end to ensure that the period and method of depreciation and amortization are consistent with the expected pattern of economic benefits from items of property, plant and equipment. Property under construction is stated at cost. This includes cost of construction, plant and equipment, capitalizable borrowing costs, and other direct costs. Property under construction is not depreciated until such time that the relevant assets are completed and available for its intended use. Construction-in-progress is transferred to the related property, plant and equipment when the construction or installation and related activities necessary to prepare the property and equipment for their intended use have been completed, and the property and equipment are ready for service. Fully depreciated property, plant and equipment are retained in the accounts until they are no longer in use and no further depreciation are credited or charged to the current operations. Borrowing Costs Borrowing costs are capitalized if they are directly attributable to the acquisition, construction or production of a qualifying asset. Qualifying assets are assets that necessarily takes a substantial period of time to get ready for its intended use or sale. Capitalization of borrowing costs commences when the activities necessary to prepare the asset for intended use are in progress and expenditures and borrowing costs are being incurred. Borrowing costs are capitalized until the asset is available for their intended use. If the resulting carrying amount of the asset exceeds its recoverable amount, an impairment loss is recognized. Borrowing costs include interest charges and other costs incurred in connection with the borrowing of funds, as well as exchange differences arising from foreign currency borrowings used to finance these projects, to the extent that they are regarded as an adjustment to interest costs. All other borrowing costs are expensed as incurred. Asset Retirement Obligations We are legally required under various lease agreements to dismantle the installation in leased sites and restore such sites to their original condition at the end of the lease contract term. We recognize the liability measured at the present value of the estimated costs of these obligations and capitalize such costs as part of the balance of the related item of property, plant and equipment. The amount of asset retirement obligations are accreted and such accretion is recognized as interest expense. Investment Properties Investment properties are initially measured at cost, including transaction costs. Subsequent to initial recognition, investment properties are stated at fair values, which have been determined annually based on the latest appraisal performed by an independent firm of appraisers, an industry specialist in valuing these types of investment properties. Gains or losses arising from changes in the fair values of investment properties are included in our consolidated income statement in the period in which they arise. Where an entity is unable to determine the fair value of an investment property under construction, but expects to be able to determine its fair value on completion, the investment under construction will be measured at cost until such time that fair value can be determined or construction is completed. Investment properties are derecognized when they have been disposed of or when the investment property is permanently withdrawn from use and no future benefit is expected from its disposal.

F-24
Transfers are made to or from investment property only when there is a change in use. For a transfer from investment property to owner occupied property, the deemed cost for subsequent accounting is the fair value at the date of change in use. If an owner occupied property becomes an investment property, we account for such property in accordance with the policy stated under property, plant and equipment up to the date of change in use. The difference between the carrying amount of the occupied property and its fair value at the date of change is accounted for as revaluation increment recognized in other comprehensive income. No assets held under operating lease have been classified as investment properties. Intangible Assets Intangible assets acquired separately are measured at cost on initial recognition. The cost of intangible assets acquired from business combinations is initially recognized at fair value on the date of acquisition. Following initial recognition, intangible assets are carried at cost less any accumulated amortization and any accumulated impairment loss. The useful lives of intangible assets are assessed at the individual asset level as having either a finite or indefinite useful life. Intangible assets with finite lives are amortized over the useful economic life using the straight-line method of accounting and assessed for impairment whenever there is an indication that the intangible assets may be impaired. At a minimum, the amortization period and the amortization method for an intangible asset with a finite useful life are reviewed at least at each financial year-end. Changes in the expected useful life or the expected pattern of consumption of future economic benefits embodied in the asset are accounted for by changing the amortization period or method, as appropriate, and treated as changes in accounting estimates. The amortization expense on intangible assets with finite lives is recognized in our consolidated income statement. Intangible assets with indefinite useful lives are tested for impairment annually either individually or at the cash-generating unit level. Such intangible assets are not amortized. The useful life of an intangible asset with an indefinite life is reviewed annually to determine whether indefinite life assessment continues to be supportable. If not, the change in the useful life assessment from indefinite to finite is made on a prospective basis. Gains or losses arising from derecognition of an intangible asset are measured as the difference between the net disposal proceeds and the carrying amount of the asset, and are recognized in our consolidated income statement when the asset is derecognized. Intangible assets created within the business are not capitalized and expenditures are charged against operations in the year in which the expenditures are incurred. Inventories and Supplies Inventories and supplies, which include cellular phone units, materials, spare parts, terminal units and accessories, are valued at the lower of cost and net realizable value. Cost incurred in bringing each items of inventories and supplies to its present location are accounted using the weighted average method. Net realizable value is determined by either estimating the selling price in the ordinary course of the business, less the estimated cost to sell or determining the prevailing replacement costs. Impairment of Non-Financial Assets
Property, plant and equipment We assess at each reporting period whether there is an indication that an asset may be impaired. If any such indication exists, or when the annual impairment testing for an asset is required, we make an estimate of the asset’s recoverable amount. An asset’s recoverable amount is the higher of an asset’s or cash-generating unit’s fair value less costs to sell or its value in use, and is determined for an individual asset, unless the asset does not generate cash inflows that are largely independent from those of other assets or groups of assets. Where the carrying amount of an asset exceeds its recoverable amount, the asset is considered impaired and is written down to its recoverable amount. In assessing the value in use, the estimated future cash flows are discounted to their present value using a pre-tax discount rate that reflects current market assessments of the time value of money and the risks specific to the asset. In determining the fair value less costs to sell, an appropriate valuation model is used. Impairment losses are recognized in our consolidated income statement.

F-25
For assets, excluding goodwill, an assessment is made at each reporting date as to whether there is any indication that previously recognized impairment losses may no longer exist or may have decreased. If such indication exists, we make an estimate of the recoverable amount. A previously recognized impairment loss is reversed only if there has been a change in the estimates used to determine the asset’s recoverable amount since the last impairment loss was recognized. If this is the case, the carrying amount of the asset is increased to its recoverable amount. The increased amount cannot exceed the carrying amount that would have been determined, net of depreciation and amortization, had no impairment loss been recognized for the asset in prior years. Such reversal is recognized in our consolidated income statement. After such reversal, the depreciation and amortization charges are adjusted in future years to allocate the asset’s revised carrying amount, less any residual value, on a systematic basis over its remaining economic useful life. The following criteria are also applied in assessing impairment of specific assets:
Goodwill Goodwill is reviewed for impairment annually or more frequently if events or changes in circumstances indicate that the carrying value may be impaired. Impairment is determined for goodwill by assessing the recoverable amount of the cash-generating unit, or group of cash-generating units, to which the goodwill relates. Where the recoverable amount of the cash-generating unit, or group of cash-generating units, is less than the carrying amount of the cash-generating unit, or group of cash-generating units, to which goodwill has been allocated, an impairment loss is recognized. Impairment losses relating to goodwill cannot be reversed in future periods. If there is incomplete allocation of goodwill acquired in a business combination to cash-generating units, or group of cash-generating units, an impairment testing of goodwill is only carried out when impairment indicators exist. Where impairment indicators exist, impairment testing of goodwill is performed at a level at which the acquirer can reliably test for impairment.
Intangible assets Intangible assets with indefinite useful lives are tested for impairment annually either individually or at the cash-generating unit level, as appropriate. We calculate the amount of impairment as being the difference between the recoverable amount of the intangible asset and its carrying amount and recognize the amount of impairment in our consolidated income statement. Impairment losses relating to intangible assets can be reversed in future periods.
Investments in associates and joint ventures We determine at the end of each reporting period whether there is any objective evidence that our investments in associates and joint ventures are impaired. If this is the case, the amount of impairment is calculated as the difference between the recoverable amount of the investments in associates and joint ventures, and its carrying amount. The amount of impairment loss is recognized in our consolidated income statement. Investment in Debt Securities Investment in debt securities are government securities which are carried at amortized cost using the EIR method. Interest earned from these securities is recognized as “Interest income” in our consolidated income statement. Cash and Cash Equivalents Cash includes cash on hand and in banks. Cash equivalents are short-term, highly liquid investments that are readily convertible to known amounts of cash with original maturities of three months or less from the date of acquisition, and for which there is an insignificant risk of change in value. Short-term Investments Short-term investments are money market placements, which are highly liquid with maturities of more than three months but less than one year from the date of acquisition.

F-26
Trade and Other Receivables Trade and other receivables, categorized as loans and receivables, are recognized initially at fair value and subsequently measured at amortized cost using the EIR method, less provision for impairment. A provision for impairment of trade and other receivables is established when there is objective evidence that we will not be able to collect all amounts due according to the original terms of the receivables. Significant financial difficulties of the debtor, probability that the debtor will enter bankruptcy or financial reorganization, and default or delinquency in payments are considered indicators that the trade receivable is impaired. The amount of the provision is the difference between the asset’s carrying amount and the present value of estimated future cash flows, discounted at the original EIR. Cash flows relating to short-term receivables are not discounted if the effect of discounting is immaterial. The carrying amount of the asset is reduced through the use of an allowance account and the amount of the loss is recognized in our consolidated income statement. When a trade and other receivable is uncollectible, it is written-off against the allowance account for trade and other receivables. Subsequent recoveries of amounts previously written-off are recognized as income in our consolidated income statement. Revenue Recognition Revenues for services are stated at amounts invoiced to customers, net of value-added tax, or VAT, and overseas communication tax where applicable. We provide wireless communication, fixed line communication, and ICT services to our subscribers and customers. We provide such services to mobile, business, residential and payphone customers. Revenues represent the value of fixed consideration that have been received or are receivable. Revenues are recognized when there is evidence of an arrangement, collectibility is reasonably assured, and the delivery of the product or rendering of service has occurred. In certain circumstances, revenue is split into separately identifiable components based on their relative fair value to reflect the substance of the transactions. Where fair value is not directly observable, the total consideration is allocated using an appropriate allocation method. Under certain arrangements where the above criteria are met, but there is uncertainty regarding the outcome of the transaction for which service was rendered, revenue is recognized only to the extent of expenses incurred for rendering the service, and such amount is determined to be recoverable. We do not provide our customers with the right to a refund. The following specific recognition criteria must also be met before revenue is recognized:
Service Revenues
Subscriptions We provide telephone and data communication services under prepaid and postpaid payment arrangements. Installation and activation related fees and the corresponding costs, not exceeding the activation revenue, are deferred and recognized over the expected average periods of customer relationship for fixed line and cellular services. Postpaid service arrangements include subscription fees, typically fixed monthly fees, which are recognized over the subscription period on a pro-rata basis.
Air time, traffic and VAS Prepaid service revenues collected in advance are deferred and recognized as revenue based on the earlier of actual usage or upon expiration of the usage period. Interconnection revenues for call termination, call transit and network usage are recognized in the year the traffic occurs. Revenues related to local, long distance, network-to-network and international call connection services are recognized when the call is placed or connection is provided, net of amounts payable to other telecommunication carriers for calls terminating in their territories. Revenues related to products and VAS are recognized upon delivery of the product or service, net of content providers share in revenue.

F-27
Knowledge processing solutions and customer relationship management Revenue is recognized when it is probable that the economic benefits associated with the transaction will flow to us and the amount of revenue can be measured reliably. Advance customer receipts that have not been recognized as revenue are recorded as advances from customers and presented as a liability in our consolidated statement of financial position. If the fee is not measurable, revenue is not recognized on those arrangements until the customer payment is received. For arrangements requiring specific customer acceptance, revenue recognition is deferred until the earlier of the end of the deemed acceptance period or until a written notice of acceptance is received from the customer. Revenue on services rendered to customers whose ability to pay is in doubt at the time of performance of services is also not recorded. Rather, revenue is recognized from these customers as payment is received.
Incentives We record insignificant commission expenses based on the number of new subscriber connections initiated by certain dealers. All other cash incentives provided to dealers and customers are recorded as a reduction to revenues. Product-based incentives provided to dealers and customers as part of a transaction are accounted for as multiple element arrangements and recognized when earned. Our wireless segment operates two loyalty points programmes, one for Smart Money cardholders and another for subscribers of Smart Gold, Smart Buddy and SmartBro. The loyalty programme for Smart Money allows cardholders, upon enrollment, to accumulate points when they use their card for purchases, Smart Load payments, and reloads for Smart’s prepaid cards, SmartBro prepaid Airtime and Smart Money Cash Load. The points for the programme can then be redeemed for airtime or load wallet. On the other hand, the loyalty programme for Smart’s cellular and broadband subscribers allows postpaid subscribers to accumulate points for billed transactions and prepaid subscribers for reloads or top-ups and VAS, and international direct dialing usage and tenure in the network for both postpaid and prepaid subscribers. The points for the loyalty programme for the subscribers can then be redeemed, upon registration, for bill rebates, discounts on cellular phonekit purchases, on-network short messaging services or internet surf time. Redemption for both programmes are subject to a minimum number of points being required. Consideration received is allocated between the services sold and the points issued, with the consideration allocated to the points equal to their fair value. Fair value of the points is determined by applying statistical analysis. The fair value of the points issued are deferred and recognized as revenue when the points are redeemed.
Non-service Revenues
Handset and equipment sales Sale of cellular handsets and communication equipment are recognized upon delivery to the customer.
Interest income Interest income is recognized as it accrues on a time proportion basis taking into account the principal amount outstanding and the EIR. Expenses Expenses are recognized as incurred. Provisions We recognize provision when we have present obligation, legal or constructive, as a result of past event, and when it is probable that an outflow of resources embodying economic benefits will be required to settle the obligation and a reliable estimate can be made of the amount of the obligation. Where we expect some or all of a provision to be reimbursed, the reimbursement is recognized as a separate asset but only when the reimbursement is virtually certain. The expense relating to any provision is presented in our consolidated income statement, net of any reimbursements. If the effect of the time value of money is material, provisions are discounted using a current pre-tax rate that reflects, where appropriate, the risks specific to the liability. Where discounting is used, the increase in the provision due to the passage of time is recognized as interest expense.

F-28
Retirement Benefits
Defined benefit pension plans We have separate and distinct retirement plans for PLDT and majority of our Philippine-based operating subsidiaries, administered by the respective Fund’s Trustees, covering permanent employees. Retirement costs are separately determined using the projected unit credit method. This method reflects services rendered by employees to the date of valuation and incorporates assumptions concerning employees’ projected salaries. Retirement costs include current service cost plus amortization of past service cost, experience adjustments, changes in actuarial assumptions and the effect of any curtailments or settlements. Past service cost is recognized as an expense on a straight-line basis over the average period until the benefits become vested. If the benefits vest immediately following the introduction of, or changes to, a pension plan, past service cost is recognized immediately. Actuarial gains and losses are recognized as income or expense when the net cumulative unrecognized actuarial gains and losses for each individual plan at the end of the previous reporting period exceeded 10% of the higher of the defined benefit obligation and the fair value of plan assets at that date. These gains and losses are recognized over the expected average remaining working lives of the employees participating in the plan. The defined benefit asset or liability comprises the present value of the defined benefit obligation (using a discount rate based on government bonds), net of past service cost and actuarial gains and losses not yet recognized, and less the fair value of plan assets out of which the obligations are to be settled directly. Plan assets are assets held by long-term employee benefit fund and are not available to our creditors nor can they be paid directly to us. Fair value is based on market price information and in the case of quoted securities, the published bid price. The value of any defined benefit asset recognized is restricted to the sum of any past service cost and actuarial gains and losses not yet recognized, and the present value of any economic benefits available in the form of refunds from the plan or reductions in the future contributions to the plan.
Defined contribution plans Smart and I-Contacts record expenses for their contribution to the defined contribution plans when the employee renders service to Smart and I-Contacts, respectively, essentially coinciding with their cash contributions to the plans. Other Long-term Employee Benefits Our liability arising from 2010 to 2012 Long-term Incentive Plan, or 2010 to 2012 LTIP, is determined using the projected unit credit method. Employee benefit costs include current service cost, interest cost, actuarial gains and losses and past service costs. Past service costs and actuarial gains and losses are recognized immediately. The long-term employee benefit liability comprises the present value of the defined benefit obligation (using a discount rate based on government bonds) at the end of the reporting period. Leases The determination of whether an arrangement is, or contains, a lease is based on the substance of the arrangement at inception date of whether the fulfillment of the arrangement is dependent on the use of a specific asset or assets or the arrangement conveys a right to use the asset. A reassessment is made after the inception of the lease only if one of the following applies: (a) there is a change in contractual terms, other than a renewal or extension of the agreement; (b) a renewal option is exercised or extension granted, unless the term of the renewal or extension was initially included in the lease term; (c) there is a change in the determination of whether the fulfillment is dependent on a specified asset; or (d) there is a substantial change to the asset. Where a reassessment is made, lease accounting shall commence or cease from the date when the change in circumstances gave rise to the reassessment for scenarios (a), (c) or (d) and the date of renewal or extension period for scenario (b). As a Lessor. Leases where we retain substantially all the risks and benefits of ownership of the asset are classified as operating leases. Any initial direct costs incurred in negotiating an operating lease are added to the carrying amount of the leased asset and recognized over the lease term on the same bases as rental income. Rental income is recognized in our consolidated income statement on a straight-line basis over the lease term.

F-29
All other leases are classified as finance leases. At the inception of the finance lease, the asset subject to lease agreement is derecognized and lease receivable is recognized. Interest income is accrued over the lease term and lease amortization is accounted for as reduction of lease receivable. As a Lessee. Leases where the lessor retains substantially all the risks and benefits of ownership of the assets are classified as operating leases. Operating lease payments are recognized as expense in our consolidated income statement on a straight-line basis over the lease term. All other leases are classified as finance leases. A finance lease gives rise to the recognition of a leased asset and finance lease liability. Capitalized leased assets are depreciated over the shorter of the estimated useful life of the asset or the lease term, if there is no reasonable certainty that we will obtain ownership of the leased asset at the end of the lease term. Interest expense is recognized over the lease term. Income Taxes
Current income tax Current income tax assets and liabilities for the current and prior years are measured at the amount expected to be recovered from or paid to the taxation authorities. The tax rates and tax laws used to compute the amount are those that are enacted or substantively enacted as at the end of the reporting period.
Deferred income tax Deferred income tax is provided using the balance sheet liability method on all temporary differences at the end of the reporting period between the tax bases of assets and liabilities and their carrying amounts for financial reporting purposes. Deferred income tax liabilities are recognized for all taxable temporary differences except: (1) when the deferred income tax liability arises from the initial recognition of goodwill or of an asset or liability in a transaction that is not a business combination and, at the time of the transaction, affects neither the accounting profit nor taxable profit or loss; and (2) with respect to taxable temporary differences associated with investments in subsidiaries, associates and interest in joint ventures, where the timing of the reversal of the temporary differences can be controlled and it is possible that the temporary differences will not reverse in the foreseeable future. Deferred income tax assets are recognized for all deductible temporary differences, carryforward benefits of unused tax credits from excess minimum corporate income tax, or MCIT, over regular corporate income tax, or RCIT, and unused net operating loss carry over, or NOLCO, to the extent that it is probable that taxable profit will be available against which the deductible temporary differences and carryforward benefits of unused tax credits and unused tax losses can be utilized except: (1) when the deferred income tax asset relating to the deductible temporary difference arises from the initial recognition of an asset or liability in a transaction that is not a business combination and, at the time of the transaction, affects neither the accounting profit nor taxable profit or loss; and (2) with respect to deductible temporary differences associated with investments in subsidiaries, associates and interests in joint ventures, deferred income tax assets are recognized only to the extent that it is probable that the temporary differences will reverse in the foreseeable future and taxable profit will be available against which the temporary differences can be utilized. The carrying amount of deferred income tax assets is reviewed at the end of each reporting period and reduced to the extent that it is no longer probable that sufficient taxable profit will be available to allow all or part of the deferred income tax assets to be utilized. Unrecognized deferred income tax assets are reassessed at the end of each reporting period and are recognized to the extent that it has become probable that future taxable profit will allow the deferred income tax assets to be recovered. Deferred income tax assets and liabilities are measured at the tax rates that are expected to apply in the year when the asset is realized or the liability is settled, based on tax rates (and tax laws) that have been enacted or substantively enacted as at the end of the reporting period. Deferred income tax relating to items recognized in other comprehensive income account is included in the statement of comprehensive income and not in our consolidated income statement.

F-30
Deferred income tax assets and liabilities are offset, if a legally enforceable right exists to offset deferred income tax assets against deferred income tax liabilities and the deferred income taxes relate to the same taxable entity and the same taxation authority. Tax benefits acquired as part of a business combination, but not satisfying the criteria for separate recognition at that date, would be recognized subsequently if new information about facts and circumstances changed. The adjustment would either be treated as a reduction to goodwill (as long as it does not exceed goodwill) if it is incurred during the measurement period or in profit or loss. Contingencies Contingent liabilities are not recognized in our consolidated financial statements. They are disclosed in the notes to our consolidated financial statements unless the possibility of an outflow of resources embodying economic benefits is remote. Contingent assets are not recognized in the consolidated financial statements but are disclosed in the notes to the consolidated financial statements when an inflow of economic benefits is probable. Events After the End of the Reporting Period Post quarter-end events that provide additional information about our financial position at the end of the reporting period (adjusting events) are reflected in the unaudited consolidated financial statements. Post quarter-end events that are not adjusting events are disclosed in the notes to the unaudited consolidated financial statements when material. Equity Preferred and common stocks are measured at par value for all shares issued. Incremental costs incurred directly attributable to the issuance of new shares are shown in equity as a deduction from proceeds, net of tax. Proceeds and/or fair value of considerations received in excess of par value are recognized as capital in excess of par value. Treasury stocks are our own equity instruments which are reacquired and recognized at cost and presented as reduction in equity. No gain or loss is recognized in our consolidated income statement on the purchase, sale, reissuance or cancellation of our own equity instruments. Any difference between the carrying amount and the consideration upon reissuance or cancellation of shares is recognized as capital in excess of par value. Change in the ownership interest of a subsidiary, without loss of control, is accounted for as an equity transaction and any impact is presented as part of capital in excess of par value. Retained earnings represent our net accumulated earnings less cumulative dividends declared. Other comprehensive income comprise items of income and expense, including reclassification adjustments, that are not recognized in profit or loss as required or permitted by other PFRSs. Non-controlling interests represent the equity interests in Metro Kidapawan Telephone Corporation, or MKTC, Datelco Global Communications, Inc., or DGCI, PCEV, Level Up!, Mabuhay Satellite, 3rd Brand, Maratel, BCC, Digital Paradise, netGames, Chikka, BayanTrade and Infocom not held directly by PLDT or indirectly through one of our subsidiaries. MKTC and DGCI are subsidiaries of Philcom. New Accounting Standards and Interpretations to Existing Standards Effective Subsequent to June 30, 2011 We will adopt the following revised standards and interpretations enumerated below which are relevant to us when these become effective. Except as otherwise indicated, we do not expect the adoption of these revised standards and amendments to PFRS to have a significant impact on our consolidated financial statements.
F-31
Effective 2012 Amendments to PFRS 7, Disclosures – Transfers of Financial Assets. The amendments will allow users of financial statements to improve their understanding of transfer transactions of financial assets including understanding the possible effects of any risks that may remain with the entity that transferred the assets. The amendments also require additional disclosures if a disproportionate amount of transfer transactions are undertaken around the end of a reporting period. These amendments are applied prospectively and are applicable for annual periods beginning on or after July 1, 2011. Amendment to PAS 12, Income Taxes – Deferred Income Tax: Recovery of Underlying Assets. The amendment provides a practical solution to the problem of assessing whether recovery of an asset will be through use or sale. It introduces a presumption that recovery of the carrying amount of an asset will normally be through sale. This amendment is effective for annual periods beginning on or after January 1, 2012.
Effective 2013 PFRS 9, Financial Instruments: Classification and Measurement. PFRS 9, as issued in 2010, reflects the first phase of the work on the replacement of PAS 39 and applies to classification and measurement of financial assets and financial liabilities as defined in PAS 39. The standard is effective for annual periods beginning on or after January 1, 2013. In subsequent phases, hedge accounting and derecognition will be addressed. The completion of this project is expected in 2011. The Group has not yet decided whether or not to early adopt PFRS 9 for its 2011 financial reporting, and therefore, the interim financial statements do not reflect the impact of the said standard. The adoption of the first phase of PFRS 9 will have an effect on the classification and measurement of our financial assets. We will quantify the effect on our consolidated financial statements in conjunction with the other phases, when issued, to present a comprehensive picture. PFRS 10, Consolidated Financial Statements. PFRS 10 defines the principle of control and introduces a new approach to determining which investees should be consolidated in the consolidated financial statement. It further provides a single model to be applied in the control analysis for all investees and sets out the accounting requirements for the preparation of consolidated financial statements. PFRS 10 and PAS 27 (as amended in 2011) together will supersede PAS 27 (as amended in 2008) and Standards Interpretation Committee, or SIC, 12, Consolidation – Special Purpose Entities. The standard is applied retrospectively for annual periods beginning on or after January 1, 2013, with certain exceptions. Earlier adoption is permitted provided that PFRS 11, Joint Arrangements, and PFRS 12, Disclosure of Interests in Other Entities, are applied simultaneously and with additional disclosure of the fact. PFRS 11, Joint Arrangements. PFRS 11 provides for a more realistic reflection of joint arrangements by focusing on the rights and obligations of the arrangement, rather than its legal form. The standard addresses inconsistencies in the reporting of joint arrangements by requiring a single method to account for interests in jointly controlled entities and elimination of proportionate consolidation method. PFRS 11 will supersede PAS 31, Interests in Joint Ventures, and SIC 13, Jointly Controlled Entities – Non-Monetary Contributions by Ventures. The standard is applied retrospectively for annual periods beginning on or after January 1, 2013. Earlier adoption is permitted provided that PFRS 10 and PFRS 12 are applied simultaneously and with additional disclosure of the fact. PFRS 12, Disclosure of Interests in Other Entities. PFRS 12 is a new and comprehensive standard on disclosure requirements for all forms of interests in other entities, including subsidiaries, joint arrangements, associates and unconsolidated structured entities that enables the users of the financial statements to evaluate: (a) the nature of, and risks associated with, the interests in other entities; and (b) the effects of those interests on the financial position, financial performance and cash flows. The standard also evaluate the: (i) nature and extent of significant restrictions on its ability to access or use assets and settle liabilities of the group; (ii) nature of, and changes in, the risks associated with its interests in consolidated structured entities; (iii) nature and extent of its interests in unconsolidated structured entities, and the nature of, and changes in, the risks associated with those interests; (iv) the nature, extent and financial effects of its interests in joint arrangements and associates, and the nature of the risks associated with those interests; (v) the consequences of changes in a parent’s ownership interest in a subsidiary that do not result in a loss of control; and (vi) the consequences of losing control of a subsidiary during the reporting period.

F-32
PFRS 12 is applied retrospectively for annual periods beginning on or after January 1, 2013. Earlier adoption is permitted provided that PFRS 10 and PFRS 11 are applied simultaneously and with additional disclosure of the fact. PFRS 13, Fair Value Measurement. PFRS 13 sets out the definition of fair value as the price that would be received to sell an asset or paid to transfer a liability in an orderly transaction between market participants at the measurement date with an emphasis that fair value is a market-based measurement, not an entity-specific measurement. PFRS 13 explains that a fair value measurement requires an entity to determine the following: (a) the particular asset or liability being measured; (b) for a non-financial asset, the highest and best use of the asset and whether the asset is used in combination with other assets or on a stand-alone basis; (c) the market in which an orderly transaction would take place for the asset or liability; and (d) the appropriate valuation technique(s) to use when measuring fair value. The valuation technique(s) used should maximize the use of relevant observable inputs and minimize unobservable inputs. Those inputs should be consistent with the inputs that a market participant would use when pricing the asset or liability. PFRS 13 is to be applied for annual periods beginning on or after January 1, 2013. Earlier application is permitted. Revised PAS 27, Separate Financial Statements. The standard has been revised as a result of the issuance of PFRS 10, PFRS 11 and PFRS 12. The revised standard provides the accounting and disclosure requirements for investments in subsidiaries, joint ventures and associates when an entity prepares separate financial statements and requires an entity preparing separate financial statements to account for those investments at cost or in accordance with PFRS 9. The standard is issued concurrently with PFRS 10 and together, the two PFRSs will supersede PAS 27 (as amended in 2008) and SIC 12. Revised PAS 27 is effective for annual periods beginning on or after January 1, 2013. Earlier application is permitted provided that PFRS 10, PRFS 11, PFRS 12 and PAS 28 (as amended in 2011) are applied simultaneously and with additional disclosure of the fact. Revised PAS 28, Investments in Associates and Joint Ventures. The standard has been revised as a result of the issuance of PFRS 10, PFRS 11 and PFRS 12. The revised standard prescribes the accounting for investments in associates and sets out the requirements for the application of the equity method when accounting for investments in associates and joint ventures. Equity method is defined in the revised standard as a method of accounting whereby the investment is initially recognized at cost and adjusted thereafter for the post-acquisition change in the investor’s share of net assets of the investee. The profit or loss of the investor includes its share of the profit or loss of the investee and the other comprehensive income of the investor includes its share of other comprehensive income of the investee. The revised standard is to be applied by all entities that are investors with joint control of, or significant influence over, an investee. This standard supersedes PAS 28 (as revised in 2003). Revised PAS 28 is effective for annual periods beginning on or after January 1, 2013. Earlier adoption is permitted provided that PFRS 10, PFRS 11, PFRS 12 and PAS 27 (as amended in 2011) are applied simultaneously and with additional disclosure of the fact.
3. Management’s Use of Accounting Judgments, Estimates and Assumptions The preparation of our consolidated financial statements in conformity with PFRS requires us to make judgments, estimates and assumptions that affect the reported amounts of our revenues, expenses, assets and liabilities and disclosure of contingent liabilities at the end of each reporting period. The uncertainties inherent in these assumptions and estimates could result in outcomes that could require a material adjustment to the carrying amount of the assets or liabilities affected in the future periods. Judgments In the process of applying the PLDT Group’s accounting policies, management has made the following judgments, apart from those including estimations and assumptions, which have the most significant effect on the amounts recognized in our consolidated financial statements.

F-33
Determination of functional currency
The functional currencies of the entities under the PLDT Group are the currency of the primary economic environment in which each entity operates. It is the currency that mainly influences the revenue from and cost of rendering products and services. The presentation currency of the PLDT Group is the Philippine peso. Based on the economic substance of the underlying circumstances relevant to the PLDT Group, the functional currency of all entities under PLDT Group is the Philippine peso except for SMHC, SMI, FECL Group, PLDT Global, SPi and certain of its subsidiaries, and certain subsidiaries of Chikka, which is the U.S. dollar; and Singapore dollar for SCH, SGP, 3rd Brand, and certain subsidiaries of BayanTrade.
Leases As a lessee, we have various lease agreements in respect of our certain equipment and properties. We evaluate whether significant risks and rewards of ownership of the leased properties are transferred to us (finance lease) or retained by the lessor (operating lease) based on PAS 17, Leases, which requires us to make judgments and estimates of transfer of risk and rewards of ownership of the leased properties. Total lease expense arising from operating leases amounted to Php2,023 million and Php2,173 million for the six months ended June 30, 2011 and 2010, respectively. Total finance lease obligations amounted to Php13 million and Php43 million as at June 30, 2011 and December 31, 2010, respectively. See Note 19 – Interest-bearing Financial Liabilities and Note 26 – Financial Assets and Liabilities.
Significant influence in Manila Electric Company, or Meralco, on which PCEV has less than 20% ownership Under PAS 28, significant influence must be present and currently exercisable over an investee to account for any interest in that investee as investment in an associate and carried at equity method of accounting. If an investor holds, directly or indirectly, less than 20% of the voting power of the investee, it is presumed that the investor does not have significant influence, unless such influence can be clearly demonstrated. On March 30, 2010, following the transfer of PCEV’s Meralco shares to Beacon Electric Asset Holdings, Inc., or Beacon, PCEV’s direct ownership in Meralco was reduced to approximately 6% from approximately 20%. Beacon is a jointly controlled entity of PCEV and Metro Pacific Investments Corporation, or MPIC, for the purpose of consolidating the ownership interest of PCEV and MPIC in Meralco. The decrease in PCEV’s direct ownership in Meralco, however, did not result in a change in PCEV’s representation on the Meralco Board of Directors. Prior to the transfer of approximately 14% interest of PCEV in Meralco to Beacon, PCEV had three out of the 11 Board of Directors seats in Meralco. Based on the Omnibus Agreement, or OA, among PCEV, MPIC and Beacon, both PCEV and MPIC agreed that an equal number of Meralco nominee directors shall be chosen from each list of nominees provided by PCEV and MPIC. If the number of Meralco Nominee Directors for Beacon is an odd number, the remaining one Meralco Nominee Director shall be chosen alternatively first from the list of nominees provided by MPIC and then from the list provided by PCEV. The total Beacon beneficial ownership in Meralco entitles it to nominate three Board of Directors seats, two of whom are the Chairman of the Board and the President of PCEV. For Meralco Board of Directors, committees and officers, these are jointly nominated from a list of nominees mutually agreed to by MPIC and PCEV. The Board of Directors members, committees and Meralco officers, which are the operating decision makers of Meralco, are represented by MPIC and PCEV through nominations. On this basis, PCEV has retained significant influence over Meralco, despite having less than 20% ownership interest, by virtue of PCEV’s 6% direct ownership interest together with its indirect interest of about 19.6% through PCEV’s investment in Beacon as at June 30, 2011. See Note 10 – Investments in Associates and Joint Ventures. PCEV’s effective ownership interest in Meralco is 25.7% as at June 30, 2011.

F-34
Estimates and Assumptions The key estimates and assumptions concerning the future and other key sources of estimation uncertainty at the end of the reporting period that have a significant risk of causing a material adjustment to the carrying amounts of assets and liabilities recognized in the consolidated financial statements within the next financial year are discussed below. We based our estimates and assumptions on parameters available when the consolidated financial statements were prepared. Existing circumstances and assumptions about future developments, however, may change due to market changes or circumstances arising beyond the control of PLDT. Such changes are reflected in the assumptions when they occur.
Asset impairment PFRS requires that an impairment review be performed when certain impairment indicators are present. In the case of goodwill, at a minimum, such asset is subject to an annual impairment test and more frequently whenever there is an indication that such asset may be impaired. This requires an estimation of the value in use of the cash-generating units to which the goodwill is allocated. Estimating the value in use requires us to make an estimate of the expected future cash flows from the cash-generating unit and to choose a suitable discount rate in order to calculate the present value of those cash flows. Determining the recoverable amount of property, plant and equipment, investments in associates and joint ventures, intangible assets and other noncurrent assets, requires us to make estimates and assumptions in the determination of future cash flows expected to be generated from the continued use and ultimate disposition of such assets. Future events could cause us to conclude that property, plant and equipment, investments in associates and joint ventures, intangible assets and other noncurrent assets associated with an acquired business are impaired. Any resulting impairment loss could have a material adverse impact on our financial condition and financial performance. The preparation of estimated future cash flows involves significant estimations and assumptions. While we believe that our assumptions are appropriate and reasonable, significant changes in our assumptions may materially affect our assessment of recoverable values and may lead to future additional impairment charges under PFRS. Total impairment charges (including provision for doubtful account receivables and write-down of inventories and supplies) amounted to Php812 million and Php1,220 million for the six months ended June 30, 2011 and 2010, respectively. See Note 4 – Operating Segment Information, Note 5 – Income and Expenses and Note 9 – Property, Plant and Equipment. The carrying values of our property, plant and equipment, investments in associates and joint ventures, goodwill and intangible assets, trade and other receivables, inventories and supplies and prepayments are separately disclosed in Notes 9, 10, 13, 15, 16 and 17, respectively.
Estimating useful lives of property, plant and equipment We estimate the useful lives of our property, plant and equipment based on the periods over which our assets are expected to be available for use. Our estimate of the useful lives of our property, plant and equipment is based on our collective assessment of industry practice, internal technical evaluation and experience with similar assets. The estimated useful lives of our property, plant and equipment are reviewed at least at each financial year-end and are updated if expectations differ from previous estimates due to physical wear and tear, technical or commercial obsolescence and legal or other limitations on the use of our assets. It is possible, however, that future results of operations could be materially affected by changes in our estimates brought about by changes in the factors mentioned above. The amounts and timing of recorded expenses for any period would be affected by changes in these factors and circumstances. A reduction in the estimated useful lives of our property, plant and equipment would increase our recorded expenses and decrease our noncurrent assets. The total depreciation and amortization of property, plant and equipment amounted to Php13,118 million and Php13,054 million for the six months ended June 30, 2011 and 2010, respectively. Total carrying values of property, plant and equipment, net of accumulated depreciation and amortization, amounted to Php156,289 million and Php163,184 million as at June 30, 2011 and December 31, 2010, respectively. See Note 4 – Operating Segment Information and Note 9 – Property, Plant and Equipment.

F-35
Determining the fair value of investment properties
We have adopted the fair value approach in determining the carrying value of our investment properties. We opted to rely on independent appraisers in determining the fair values of our investment properties, and such fair values were determined based on recent prices of similar properties, with adjustments to reflect any changes in economic conditions since the date of those transactions. The amounts and timing of recorded changes in fair value for any period would differ if we made different judgments and estimates or utilized a different basis for determining fair value. Appraisal of investment properties is annually performed every December 31. There were no gains from fair value adjustments charged to profit or loss for each of the six months ended June 30, 2011 and 2010. Total carrying values of our investment properties amounted to Php1,560 million each as at June 30, 2011 and December 31, 2010. See Note 12 – Investment Properties.
Goodwill and intangible assets Our consolidated financial statements and financial performance reflect acquired businesses after the completion of the respective acquisition. We account for the acquired businesses using the acquisition method, which require extensive use of accounting judgments and estimates to allocate the purchase price to the fair market values of the acquiree’s identifiable assets and liabilities and contingent liabilities, if any, at the acquisition date. Thus, the numerous judgments made in estimating the fair market value to be assigned to the acquiree’s assets and liabilities can materially affect our financial performance. Intangible assets acquired from business combination with finite lives are amortized over the useful economic life using the straight-line method of accounting. At a minimum, the amortization period and the amortization method for an intangible asset with a finite useful life are reviewed at least at each financial year-end. Changes in the expected useful life or the expected pattern of consumption of future economic benefits embodied in the asset are accounted for by changing the amortization period or method, as appropriate, and treated as changes in accounting estimates. The amortization expense on intangible assets with finite lives is recognized in our consolidated income statement. The total amortization of intangible assets amounted to Php144 million and Php178 million for the six months ended June 30, 2011 and 2010, respectively. Total carrying values of goodwill and intangible assets amounted to Php11,390 million and Php11,485 million as at June 30, 2011 and December 31, 2010, respectively. See Note 13 – Goodwill and Intangible Assets.
Recognition of deferred income tax assets and liabilities We review the carrying amounts of deferred income tax assets at the end of each reporting period and reduce these to the extent that these are no longer probable that sufficient taxable income will be available to allow all or part of the deferred income tax assets to be utilized. Our assessment on the recognition of deferred income tax assets on deductible temporary differences is based on the level and timing of forecasted taxable income of the subsequent reporting periods. This forecast is based on our past results and future expectations on revenues and expenses as well as future tax planning strategies. However, there is no assurance that we will generate sufficient taxable income to allow all or part of our deferred income tax assets to be utilized. We also review the level of projected gross margin for the use of Optional Standard Deduction, or OSD, and assess the future tax consequences for the recognition of deferred income tax assets and deferred income tax liabilities. Based on Smart’s and Wolfpac’s projected gross margin, they expect to continue using the OSD method in the foreseeable future.

F-36
Based on the above assessment, our consolidated unrecognized deferred income tax assets amounted to Php1,664 million and Php1,477 million as at June 30, 2011 and December 31, 2010, respectively. In addition, our unrecognized net deferred income tax assets for items which would not result in future tax benefits when using the OSD method amounted to Php2,965 million and Php2,803 million as at June 30, 2011 and December 31, 2010, respectively. Total consolidated provision for deferred income tax amounted to Php109 million and Php1,440 million for the six months ended June 30, 2011 and 2010, respectively. Total consolidated net deferred income tax assets amounted to Php5,481 million and Php6,110 million as at June 30, 2011 and December 31, 2010, respectively, while total consolidated net deferred income tax liabilities amounted to Php1,003 million and Php1,099 million as at June 30, 2011 and December 31, 2010, respectively. See Note 4 – Operating Segment Information and Note 7 – Income Taxes.
Estimating allowance for doubtful accounts If we assessed that there is an objective evidence that an impairment loss has been incurred in our trade and other receivables, we estimate the allowance for doubtful accounts related to our trade and other receivables that are specifically identified as doubtful of collection. The amount of allowance is evaluated by management on the basis of factors that affect the collectibility of the accounts. In these cases, we use judgment based on the best available facts and circumstances, including, but not limited to, the length of our relationship with the customer and the customer’s credit status based on third party credit reports and known market factors, to record specific reserves for customers against amounts due in order to reduce our receivables to amounts that we expect to collect. These specific reserves are re-evaluated and adjusted as additional information received affect the amounts estimated. In addition to specific allowance against individually significant receivables, we also assess a collective impairment allowance against credit exposures of our customer which were grouped based on common credit characteristic, which, although not specifically identified as requiring a specific allowance, have a greater risk of default than when the receivables were originally granted to customers. This collective allowance is based on historical loss experience using various factors, such as historical performance of the customers within the collective group, deterioration in the markets in which the customers operate, and identified structural weaknesses or deterioration in the cash flows of customers. Total asset impairment provision for trade and other receivables recognized in our consolidated income statements amounted to Php774 million and Php1,068 million for the six months ended June 30, 2011 and 2010, respectively. Trade and other receivables, net of asset impairment, amounted to Php14,922 million and Php16,428 million as at June 30, 2011 and December 31, 2010, respectively. See Note 4 – Operating Segment Information, Note 5 – Income and Expenses, Note 15 – Trade and Other Receivables and Note 26 – Financial Assets and Liabilities.
Estimating net realizable value of inventories and supplies We write down the cost of inventories whenever the net realizable value of inventories becomes lower than cost due to damage, physical deterioration, obsolescence, change in price levels or other causes. The lower of cost and net realizable value of inventories is reviewed on a periodic basis. Inventory items identified to be obsolete or unusable are written-off and charged as expense in our consolidated income statement. Total write-down of inventories and supplies amounted to Php35 million and Php33 million for the six months ended June 30, 2011 and 2010, respectively. The carrying values of inventories and supplies amounted to Php2,553 million and Php2,219 million as at June 30, 2011 and December 31, 2010, respectively. See Note 4 – Operating Segment Information, Note 5 – Income and Expenses and Note 16 – Inventories and Supplies.

F-37
Estimation of pension benefit costs and other employee benefits The cost of defined benefit plans and present value of the pension obligation are determined using projected unit credit method. Actuarial valuation includes making various assumptions which consists, among other things, discount rates, expected rates of return on plan assets, rates of compensation increases and mortality rates. See Note 24 – Employee Benefits. Actual results that differ from our assumptions are recognized as income or expense when the net cumulative unrecognized actuarial gains and losses at the end of the previous reporting period exceed 10% of the higher of the present value of the defined benefit obligation and the fair value of plan assets at that date. These excess actuarial gains and losses are recognized over the expected average remaining working lives of the employees participating in the plan. Due to complexity of valuation, the underlying assumptions and its long-term nature, a defined benefit obligation is highly sensitive to changes in assumptions. While we believe that our assumptions are reasonable and appropriate, significant differences in our actual experience or significant changes in our assumptions may materially affect our cost for pension and other retirement obligations. All assumptions are reviewed at year-end. Total consolidated pension benefit costs amounted to income of Php30 million and expense of Php130 million for the six months ended June 30, 2011 and 2010, respectively. Unrecognized net actuarial gains amounted to Php474 million and Php479 million as at June 30, 2011 and December 31, 2010, respectively. The prepaid benefit costs amounted to Php5,493 million and Php5,333 million as at June 30, 2011 and December 31, 2010, respectively. The accrued benefit costs amounted to Php446 million and Php415 million as at June 30, 2011 and December 31, 2010, respectively. See Note 5 – Income and Expenses, Note 17 – Prepayments and Note 24 – Employee Benefits. The new LTIP, or 2010 to 2012 LTIP, has been presented to and approved by the Executive Compensation Committee, or ECC, and the Board of Directors, and is based on profit targets for the covered Performance Cycle. The cost of 2010 to 2012 LTIP is determined using the projected unit credit method based on prevailing discount rates and profit targets. While we believe that our assumptions are reasonable and appropriate, significant differences in our actual experience or significant changes in our assumptions may materially affect our cost for other employee benefits. All assumptions are reviewed on a monthly basis. LTIP cost recognized for the six months ended June 30, 2011 and 2010 amounted to Php702 million and Php694 million, respectively. Total outstanding liability and fair value of 2010 to 2012 LTIP cost amounted to Php2,093 million and Php1,392 million as at June 30, 2011 and December 31, 2010, respectively. See Note 5 – Income and Expenses and Note 24 – Employee Benefits.
Provision for asset retirement obligations Provision for asset retirement obligations are recognized in the period in which they are incurred if a reasonable estimate of fair value can be made. This requires an estimation of the cost to restore/dismantle on a per square meter basis, depending on the location, and is based on the best estimate of the expenditure required to settle the obligation at the future restoration/dismantlement date, discounted using a pre-tax rate that reflects the current market assessment of the time value of money and, where appropriate, the risk specific to the liability. Total provision for asset retirement obligations amounted to Php1,405 million and Php1,344 million as at June 30, 2011 and December 31, 2010, respectively. See Note 20 – Deferred Credits and Other Noncurrent Liabilities.
Provision for legal contingencies and tax assessments We are currently involved in various legal proceedings and tax assessments. Our estimate of the probable costs for the resolution of these claims has been developed in consultation with our counsel handling the defense in these matters and is based upon our analysis of potential results. We currently do not believe these proceedings will have a material adverse effect on our consolidated financial statements. It is possible, however, that future financial performance could be materially affected by changes in our estimates or effectiveness of our strategies relating to these proceedings and assessments. See Note 25 – Provisions and Contingencies.
Revenue recognition Our revenue recognition policies require us to make use of estimates and assumptions that may affect the reported amounts of our revenues and receivables.

F-38
Our agreements with domestic and foreign carriers for inbound and outbound traffic subject to settlements require traffic reconciliations before actual settlement is done, which may not be the actual volume of traffic as measured by us. Initial recognition of revenues is based on our observed traffic adjusted by our normal experience adjustments, which historically are not material to our consolidated financial statements. Differences between the amounts initially recognized and the actual settlements are taken up in the accounts upon reconciliation. However, we cannot assure you that the use of such estimates will not result in material adjustments in future periods. Revenues under a multiple element arrangement specifically applicable to our fixed line and wireless businesses are split into separately identifiable components based on their relative fair value to reflect the substance of the transaction. Where fair value is not directly observable, the total consideration is allocated using an appropriate allocation method. Under certain arrangements with our knowledge processing solutions services, if there is uncertainty regarding the outcome of the transaction for which service was rendered, revenue is recognized only to the extent of expenses incurred for rendering the service and such amount is determined to be recoverable. We recognize our revenues from installation and activation related fees and the corresponding costs over the expected average periods of customer relationship for fixed line and cellular services. We estimate the expected average period of customer relationship based on our most recent churn-rate analysis.
Determination of fair values of financial assets and liabilities Where the fair value of financial assets and financial liabilities recorded in the consolidated statement of financial position cannot be derived from active markets, they are determined using valuation techniques including the discounted cash flows model. The inputs to these models are taken from observable markets where possible, but where this is not feasible, a degree of judgment is required in establishing fair values. The judgments include considerations of inputs such as liquidity risk, credit risk and volatility. Changes in assumptions about these factors could affect the reported fair value of financial instruments. Total fair values of financial assets and liabilities amounted to Php56,042 million and Php164,251 million, respectively, as at June 30, 2011, while the total fair values of financial assets and liabilities amounted to Php55,538 million and Php167,396 million, respectively, as at December 31, 2010. See Note 26 – Financial Assets and Liabilities.
4. Operating Segment Information Operating segments are components of the PLDT Group that engage in business activities from which they may earn revenues and incur expenses (including revenues and expenses relating to transactions with other components of PLDT Group), which operating results are regularly reviewed by the chief operating decision maker to make decisions about how resources are to be allocated to each of the segments and to assess their performances, and for which discrete financial information is available. For management purposes, we are organized into business units based on our products and services and have three reportable operating segments as follows: • Wireless – wireless telecommunications services provided through our cellular service providers namely,
Smart and CURE; SBI, Airborne Access Corporation and PDSI, our wireless broadband service providers; Wolfpac and Chikka Group, our wireless content operators; and ACeS Philippines, our satellite operator;
• Fixed Line – fixed line telecommunications services primarily provided by PLDT. We also provide fixed line
services through PLDT’s subsidiaries ClarkTel, SubicTel, Philcom, Maratel, SBI, PDSI, BCC and PLDT Global, all of which together account for approximately 4% of our consolidated fixed line subscribers; and

F-39
• ICT – information and communications infrastructure and services for internet applications, internet protocol-
based solutions and multimedia content delivery provided by ePLDT and BayanTrade Group; knowledge processing solutions provided by the SPi Group; customer relationship management provided by SPi CRM; internet and online gaming services provided by Infocom, Digital Paradise (on April 1, 2011, ePLDT sold its entire 75% stake in Digital Paradise), netGames and Level Up! (on July 11, 2011, ePLDT sold its 57.5% interest in Level Up!); and e-commerce, and IT-related services provided by other investees of ePLDT, as discussed in Note 10 – Investments in Associates and Joint Ventures.
On July 7, 2010, our Board of Directors approved the reorganization of the ePLDT Group into two business groups: (i) the ICT business group, which provides data center services, internet and online gaming services and business solutions and applications; and (ii) the BPO business group, which covers customer relationship management or call center operations under SPi CRM; and content solutions, medical billing and coding and medical transcription services under SPi. The BPO business group will be eventually transferred to PLDT, subject to the finalization of the terms and conditions thereof and the execution of relevant agreements. Although our Board of Directors already approved the reorganization of ePLDT into two business groups - ICT business group and BPO business group, the actual reorganization has not yet been consummated as at August 2, 2011 and therefore, as at June 30, 2011, the chief operating decision maker continues to view our business activities using the three business units: Wireless, Fixed Line and ICT. The chief operating decision maker and management monitor the operating results of each business unit separately for purposes of making decisions about resource allocation and performance assessment. Segment performance is evaluated based on net income (loss) for the period; earnings before interest, taxes and depreciation and amortization, or EBITDA; EBITDA margin; and core income. Net income (loss) for the period is measured consistent with net income in the consolidated financial statements. EBITDA is measured as net income excluding depreciation and amortization, amortization of intangible assets, asset impairment on noncurrent assets, financing costs, interest income, equity share in net earnings (losses) of associates and joint ventures, foreign exchange gains (losses) – net, gains (losses) on derivative financial instruments – net, provision for (benefit from) income tax and other income (expenses). EBITDA margin is measured as EBITDA divided by service revenues. Core income for the period is measured as net income attributable to equity holders of PLDT (net income less net income attributable to non-controlling interests), excluding foreign exchange gains (losses) – net, gains (losses) on derivative financial instruments – net (excluding hedge costs), asset impairment on noncurrent assets, other nonrecurring gains (losses), net of tax effect of aforementioned adjustments, as applicable, and similar adjustments to equity share in net earnings (losses) of associates and joint ventures. Transfer prices between operating segments are determined on an arm’s length basis similar to transactions with third parties. Segment revenues, segment expenses and segment results include transfers between business segments. These transfers are eliminated upon full consolidation. Core earnings per common share, or EPS, is measured as core income divided by the weighted average number of common shares for the period. See Note 8 – Earnings Per Common Share for the weighted average number of common shares.

F-40
The segment revenues, net income for the period, assets, liabilities, and other segment information of our reportable operating segments for the six months ended June 30, 2011 and 2010 and as at June 30, 2011 and December 31, 2010 are as follows:
Wireless Fixed Line ICT Inter-segment Transactions Consolidated
(in million pesos) June 30, 2011 (Unaudited) Revenues
External customers: 45,881 20,021 4,880 – 70,782 Service revenues (Note 3) 45,285 19,718 4,638 – 69,641 Non-service revenues (Notes 3 and 5) 596 303 242 – 1,141
Inter-segment transactions: 453 3,763 791 (5,007) – Service revenues (Note 3) 453 3,763 777 (4,993) – Non-service revenues (Notes 3 and 5) – – 14 (14) – Total revenues 46,334 23,784 5,671 (5,007) 70,782
Results
Depreciation and amortization (Notes 3 and 9) 6,758 5,989 371 – 13,118 Asset impairment (Notes 3, 5, 9, 10, 13, 15, 16, 17 and 26) 321 478 13 – 812 Equity share in net earnings of associates and joint ventures (Note 10) 737 – 102 – 839 Interest income (Note 5) 383 245 21 (4) 645 Financing costs – net (Notes 5, 9, 19 and 26) 1,367 1,786 29 (4) 3,178 Provision for income tax (Notes 3 and 7) 5,383 1,366 49 – 6,798 Net income for the period / Segment profit for the period 17,115 3,512 669 – 21,296 EBITDA for the period 29,039 11,393 979 101 41,512 EBITDA margin for the period 63% 49% 18% – 60% Core income for the period 17,428 2,939 656 – 21,023
Assets and liabilities Operating assets 105,517 193,619 15,298 (72,246) 242,188 Investments in associates and joint ventures (Notes 3, 5, 10 and 26) 22,819 – 996 – 23,815 Deferred income tax assets – net (Notes 3, 7 and 26) 48 5,161 272 – 5,481
Consolidated total assets 128,384 198,780 16,566 (72,246) 271,484
Operating liabilities 89,808 106,800 4,483 (22,339) 178,752 Deferred income tax liabilities – net (Notes 3, 7 and 26) 553 22 141 287 1,003
Consolidated total liabilities 90,361 106,822 4,624 (22,052) 179,755 Other segment information
Capital expenditures, including capitalized interest (Notes 5, 9, 19 and 20) 1,838 4,186 311 – 6,335
June 30, 2010 (Unaudited) Revenues
External customers: 48,256 20,128 4,823 – 73,207 Service revenues (Note 3) 47,511 19,948 4,697 – 72,156 Non-service revenues (Notes 3 and 5) 745 180 126 – 1,051
Inter-segment transactions: 365 5,289 674 (6,328) – Service revenues (Note 3) 365 5,289 565 (6,219) – Non-service revenues (Notes 3 and 5) – – 109 (109) – Total revenues 48,621 25,417 5,497 (6,328) 73,207
Results
Depreciation and amortization (Notes 3 and 9) 6,781 5,896 377 – 13,054 Asset impairment (Notes 3, 5, 9, 10, 13, 15, 16, 17 and 26) 346 836 38 – 1,220 Equity share in net earnings of associates and joint ventures (Note 10) 784 – 97 – 881 Interest income (Note 5) 354 252 16 (10) 612 Financing costs – net (Notes 5, 9, 19 and 26) 1,344 2,029 88 (10) 3,451 Provision for (benefit from) income tax (Notes 3 and 7) 6,051 1,724 (19) – 7,756 Net income for the period / Segment profit for the period 16,766 4,550 305 – 21,621 EBITDA for the period 29,704 12,668 756 129 43,257 EBITDA margin for the period 62% 50% 14% – 60% Core income for the period 17,133 3,753 344 – 21,230

F-41
Wireless Fixed Line ICT Inter-segment Transactions Consolidated
(in million pesos) December 31, 2010 (Audited) Assets and liabilities
Operating assets 111,852 197,318 15,095 (75,763) 248,502 Investments in associates and joint ventures (Notes 3, 5, 10 and 26) 22,275 – 928 – 23,203 Deferred income tax assets – net (Notes 3, 7 and 26) 41 5,908 161 – 6,110
Consolidated total assets 134,168 203,226 16,184 (75,763) 277,815
Operating liabilities 96,895 104,944 4,435 (26,943) 179,331 Deferred income tax liabilities – net (Notes 3, 7 and 26) 596 22 178 303 1,099
Consolidated total liabilities 97,491 104,966 4,613 (26,640) 180,430 June 30, 2010 (Unaudited) Other segment information
Capital expenditures, including capitalized interest (Notes 5, 9, 19 and 20) 5,000 4,479 221 – 9,700
Our consolidated basic core EPS amounted to Php111.35 and Php112.43 for the six months ended June 30, 2011 and 2010, respectively. Our consolidated diluted core EPS amounted to Php111.30 and Php112.39 for the six months ended June 30, 2011 and 2010, respectively. The following table shows the reconciliation of our consolidated EBITDA to our consolidated net income for the six months ended June 30, 2011 and 2010:
2011 2010 (Unaudited) (in million pesos) Consolidated EBITDA 41,512 43,257 Amortization of intangible assets (Notes 3 and 13) (144) (178)Depreciation and amortization (Notes 3 and 9) (13,118) (13,054)Asset impairment on non-financial assets (Notes 3, 5 and 9) (3) (119) 28,247 29,906 Equity share in net earnings of associates and joint ventures (Note 10) 839 881 Interest income (Note 5) 645 612 Gains on derivative financial instruments – net (Note 26) 484 934 Foreign exchange gains (losses) – net (Notes 9 and 26) 426 (59)Financing costs – net (Notes 5, 9, 19 and 26) (3,178) (3,451)Other income 631 554 Consolidated income before income tax 28,094 29,377 Provision for income tax (Notes 3 and 7) (6,798) (7,756)Consolidated net income for the period 21,296 21,621 The following table shows the reconciliation of our consolidated core income to our consolidated net income for the six months ended June 30, 2011 and 2010:
2011 2010 (Unaudited) (in million pesos)
Consolidated core income for the period 21,023 21,230 Gains on derivative financial instruments – net, excluding hedge cost (Note 26) 663 1,189 Foreign exchange gains (losses) – net (Notes 9 and 26) 423 (59)Core income adjustment on equity share in net earnings of associates and joint ventures (458) (227)Others (74) (115)Net tax effect of aforementioned adjustments (278) (339)Net income for the period attributable to equity holders of PLDT (Notes 6 and 8) 21,299 21,679 Net loss for the period attributable to non-controlling interests (3) (58)Consolidated net income for the period 21,296 21,621
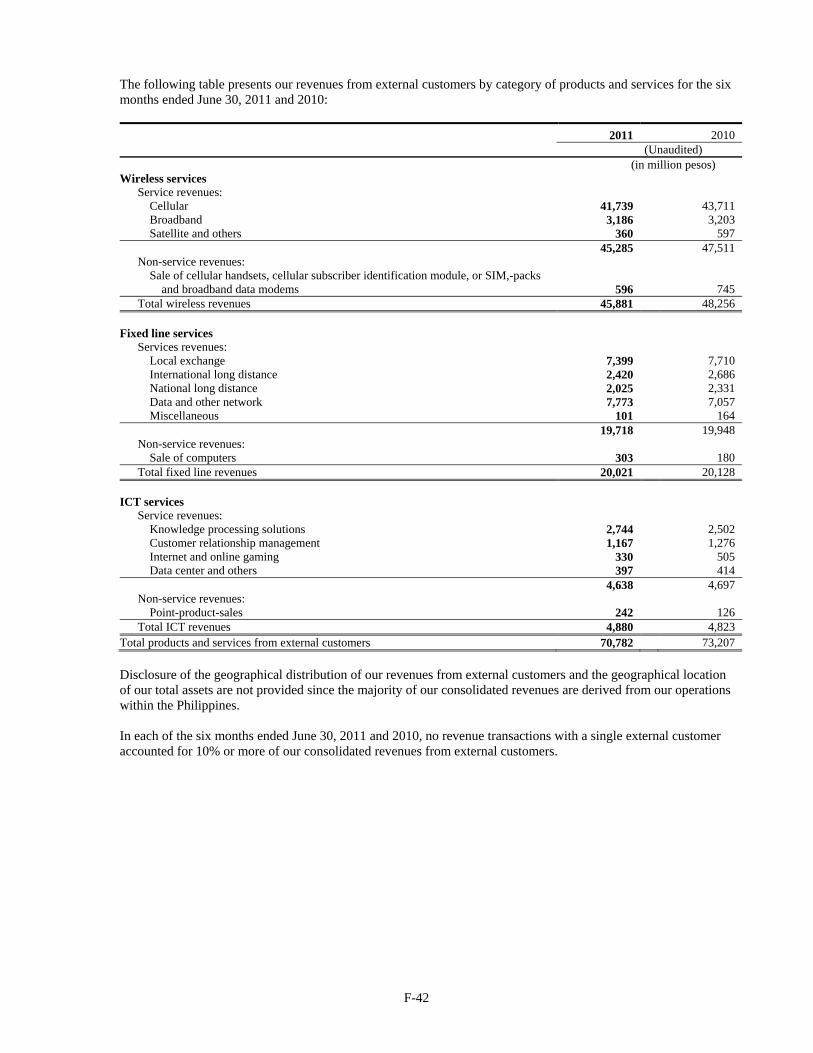
F-42
The following table presents our revenues from external customers by category of products and services for the six months ended June 30, 2011 and 2010: 2011 2010 (Unaudited) (in million pesos) Wireless services
Service revenues: Cellular 41,739 43,711 Broadband 3,186 3,203 Satellite and others 360 597
45,285 47,511 Non-service revenues:
Sale of cellular handsets, cellular subscriber identification module, or SIM,-packs and broadband data modems 596 745
Total wireless revenues 45,881 48,256 Fixed line services
Services revenues: Local exchange 7,399 7,710 International long distance 2,420 2,686 National long distance 2,025 2,331 Data and other network 7,773 7,057 Miscellaneous 101 164
19,718 19,948 Non-service revenues:
Sale of computers 303 180 Total fixed line revenues 20,021 20,128
ICT services
Service revenues: Knowledge processing solutions 2,744 2,502 Customer relationship management 1,167 1,276 Internet and online gaming 330 505 Data center and others 397 414
4,638 4,697 Non-service revenues:
Point-product-sales 242 126 Total ICT revenues 4,880 4,823
Total products and services from external customers 70,782 73,207 Disclosure of the geographical distribution of our revenues from external customers and the geographical location of our total assets are not provided since the majority of our consolidated revenues are derived from our operations within the Philippines. In each of the six months ended June 30, 2011 and 2010, no revenue transactions with a single external customer accounted for 10% or more of our consolidated revenues from external customers.

F-43
5. Income and Expenses Non-service Revenues Non-service revenues for the six months ended June 30, 2011 and 2010 consists of the following:
2011 2010 (Unaudited)
(in million pesos) Sale of computers, cellular handsets, cellular SIM-packs and broadband data modems 899 925 Point-product-sales 242 126 (Note 4) 1,141 1,051 Compensation and Employee Benefits Compensation and employee benefits for the six months ended June 30, 2011 and 2010 consists of the following:
2011 2010 (Unaudited)
(in million pesos) Salaries and other employee benefits 9,716 10,297 Incentive plans (Notes 3 and 24) 702 694 Pension benefit costs (Notes 3 and 24) 130 130 Manpower rightsizing program, or MRP 101 126 10,649 11,247 Over the past years, we have been implementing MRP in line with our continuing effort to reduce the cost base of our businesses. The total MRP cost charged to operations amounted to Php101 million and Php126 million for the six months ended June 30, 2011 and 2010, respectively. The decision to implement the MRP was anchored on the challenges faced by our businesses as significant changes in technology, increasing competition, and shifting market preferences have reshaped the future of our businesses. The MRP is being implemented in compliance with the Labor Code of the Philippines and all other relevant labor laws and regulations in the Philippines. Cost of Sales Cost of sales for the six months ended June 30, 2011 and 2010 consists of the following:
2011 2010 (Unaudited)
(in million pesos) Cost of computers, cellular handsets, cellular SIM-packs sold and broadband data modems 2,121 2,114 Cost of point-product-sales 226 210 Cost of satellite air time and terminal units (Notes 23 and 26) 59 65 2,406 2,389 Asset Impairment Asset impairment for the six months ended June 30, 2011 and 2010 consists of the following:
2011 2010 (Unaudited)
(in million pesos) Trade and other receivables (Notes 3 and 15) 774 1,068 Inventories and supplies (Notes 3 and 16) 35 33 Investments in associates and joint ventures (Notes 3 and 10) – 78 Property, plant and equipment (Notes 3 and 9) – 12 Prepayments and others 3 29 812 1,220

F-44
Interest Income Interest income for the six months ended June 30, 2011 and 2010 consists of the following:
2011 2010 (Unaudited) (in million pesos)
Interest income on other loans and receivables 630 580 Interest income on HTM investments 15 15 Interest income on FVPL – 17 (Note 4) 645 612 Financing Costs – net Financing costs – net for the six months ended June 30, 2011 and 2010 consists of the following:
2011 2010 (Unaudited)
(in million pesos) Interest on loans and other related items (Notes 4, 19 and 26) 2,866 3,142 Accretion on financial liabilities – net (Notes 19, 20 and 26) 555 567 Financing charges 71 48 Capitalized interest (Notes 4 and 9) (314) (306)(Note 4) 3,178 3,451 Interest expense for short-term borrowings amounted to Php4 million and Php8 million for the six months ended June 30, 2011 and 2010, respectively.
6. Components of Other Comprehensive Income
The movements of other comprehensive income under equity of our consolidated statements of financial position for the six months ended June 30, 2011 and 2010 are as follows:
(Unaudited)
Foreign currency translation
differences of subsidiaries
Net gains on available-for-sale financial assets
– net of tax
Revaluation increment on investment properties – net of tax
Total other comprehensive
income attributable to equity holders
of PLDT
Share of non-controlling
interests
Total other
comprehensive loss
– net of tax (in million pesos) Balances as at January 1, 2010 (1,043) 26 – (1,017) 165 (852) Other comprehensive income (loss) for the period 78 8 – 86 (2) 84 Balances as at June 30, 2010 (965) 34 – (931) 163 (768) Balances as at January 1, 2011 (1,639) 49 314 (1,276) (1) (1,277) Other comprehensive income (loss) for the period (140) – – (140) (1) (141) Balances as at June 30, 2011 (1,779) 49 314 (1,416) (2) (1,418)
Revaluation increment on investment properties pertains to the difference between the carrying value and fair value of property, plant and equipment reclassified to investment property at the time of change in classification.

F-45
7. Income Taxes
Corporate Income Tax The components of consolidated net deferred income tax assets (liabilities) recognized in our consolidated statements of financial position as at June 30, 2011 and December 31, 2010 are as follows: 2011 2010 (Unaudited) (Audited) (in million pesos) Net deferred income tax assets (Notes 3 and 4) 5,481 6,110 Net deferred income tax liabilities (Notes 3 and 4) (1,003) (1,099)
The components of our consolidated net deferred income tax assets (liabilities) as at June 30, 2011 and December 31, 2010 are as follows: 2011 2010 (Unaudited) (Audited) (in million pesos) Net deferred income tax assets:
Accumulated provision for doubtful accounts 2,623 2,488 Unearned revenues 2,346 2,586 Unamortized past service pension costs 2,336 2,548 Unrealized foreign exchange losses 857 924 Derivative financial instruments 786 1,028 Provision for impaired assets 386 379 Accumulated write-down of inventories to net realizable values 289 289 NOLCO 227 119 Asset impairment 27 27 MCIT 16 446 Capitalized taxes and duties – net of amortization (155) (186)Capitalized foreign exchange differential – net of depreciation (297) (363)Pension and other employee benefits (1,299) (1,361) Undepreciated capitalized interest charges (2,540) (2,685) Others (121) (129)
5,481 6,110 Net deferred income tax liabilities:
Unearned revenues 655 668 Pension and other employee benefits 56 35 Undepreciated capitalized interest charges (282) (304)Fair value adjustment on fixed assets from business combination (288) (303)Intangible assets and fair value adjustments on assets acquired – net of amortization (378) (423)Unrealized foreign exchange gains (727) (707)Others (39) (65)
(1,003) (1,099)

F-46
Movements of our consolidated net deferred income tax assets (liabilities) as at June 30, 2011 and December 31, 2010 are as follows:
2011 2010 (Unaudited) (Audited) (in million pesos)
Net deferred income tax assets – balance at beginning of period (Notes 3, 4 and 26) 6,110 7,721 Net deferred income tax liabilities – balance at beginning of period (Notes 3, 4 and 26) (1,099) (1,321)
Net balance at beginning of period 5,011 6,400 Provision for deferred income tax (Note 3) (109) (1,198)Excess MCIT deducted against RCIT due (428) – Movement charged directly to equity – (139)Others 4 (52)Net balance at end of period 4,478 5,011
Net deferred income tax assets – balance at end of period (Notes 3, 4 and 26) 5,481 6,110 Net deferred income tax liabilities – balance at end of period (Notes 3, 4 and 26) (1,003) (1,099)
The analysis of our consolidated net deferred income tax assets as at June 30, 2011 and December 31, 2010 are as follows:
2011 2010 (Unaudited) (Audited) (in million pesos) Deferred income tax assets:
Deferred income tax assets to be recovered after 12 months 8,607 8,789 Deferred income tax assets to be recovered within 12 months 1,758 2,222
10,365 11,011 Deferred income tax liabilities:
Deferred income tax liabilities to be settled after 12 months (4,089) (4,240)Deferred income tax liabilities to be settled within 12 months (795) (661)
(4,884) (4,901)Net deferred income tax assets (Notes 3, 4 and 26) 5,481 6,110 The analysis of our consolidated net deferred income tax liabilities as at June 30, 2011 and December 31, 2010 are as follows:
2011 2010 (Unaudited) (Audited) (in million pesos) Deferred income tax assets:
Deferred income tax assets to be recovered after 12 months 553 690 Deferred income tax assets to be recovered within 12 months 196 72
749 762 Deferred income tax liabilities:
Deferred income tax liabilities to be settled after 12 months (1,616) (1,746)Deferred income tax liabilities to be settled within 12 months (136) (115)
(1,752) (1,861)Net deferred income tax liabilities (Notes 3, 4 and 26) (1,003) (1,099) Provision for corporate income tax for the six months ended June 30, 2011 and 2010 consists of:
2011 2010 (Unaudited)
(in million pesos) Current 6,689 6,316 Deferred (Note 3) 109 1,440 6,798 7,756

F-47
The reconciliation between the provision for income tax at the applicable statutory tax rates and the actual provision for corporate income tax for the six months ended June 30, 2011 and 2010 are as follows:
2011 2010 (Unaudited)
(in million pesos) Provision for income tax at the applicable statutory tax rates 8,428 8,813 Tax effects of:
Nondeductible expenses 120 116 Income subject to final tax (199) (224)Income not subject to income tax (200) (230)Equity share in net earnings of associates and joint ventures (252) (264)Losses (income) subject to lower tax rate (315) 24 Difference between OSD and itemized deductions (1,182) (478)Net movement in unrecognized deferred income tax assets and other adjustments 398 (1)
Actual provision for corporate income tax 6,798 7,756 On December 18, 2008, the Bureau of Internal Revenue, or BIR, issued Revenue Regulations No. 16-2008 which implemented the provisions of Republic Act 9504, or R.A. 9504 on OSD. Under the OSD method of computing taxable income, corporations may elect a standard deduction in an amount equivalent to 40% of gross income, as provided by law, in lieu of the itemized allowed deductions. Smart and Wolfpac opted to use and availed of the OSD in computing their taxable income for the six months ended June 30, 2011 and 2010, respectively. Smart and Wolfpac expect to continue to use the OSD method for the foreseeable future. The availment of OSD method affected their recognition of deferred income tax assets and liabilities. Deferred income tax assets and liabilities of Smart and Wolfpac, for which the related income and expense are not considered in determining gross income for income tax purposes, are not recognized as deferred income tax assets and liabilities on the consolidated statements of financial position. This is because the manner by which they will expect to recover or settle the underlying assets and liabilities would not result in any future tax consequence assuming OSD were applied. Deferred income tax assets and liabilities, for which the related income and expense are considered in determining gross income for income tax purposes, are recognized only to the extent of their future tax consequence assuming OSD were applied, which results in such deferred income tax assets and liabilities being reduced by the 40% allowable deduction provided for under the OSD method. Accordingly, the deferred income tax assets and liabilities that were not recognized due to OSD amounted to Php2,965 million and Php2,803 million as at June 30, 2011 and December 31, 2010, respectively. See Note 3 – Management’s Use of Accounting Judgments, Estimates and Assumptions. The breakdown of our consolidated deductible temporary differences, carry forward benefits of unused tax credits from excess of MCIT over RCIT, and NOLCO (excluding those not recognized due to the adoption of OSD) for which no deferred income tax assets were recognized and the equivalent amount of unrecognized deferred income tax assets as at June 30, 2011 and December 31, 2010 are as follows:
2011 2010 (Unaudited) (Audited)
(in million pesos) NOLCO 2,867 2,292 Accumulated provision for doubtful accounts 1,333 1,257 Unearned revenues 704 712 Provisions for other assets 161 170 Accumulated write-down of inventories to net realizable values 160 155 Fixed asset impairment 104 112 Pension and other employee benefits 44 60 MCIT 37 36 Unrealized foreign exchange losses 24 29 Derivative financial instruments 11 11 Operating lease and others 15 6 5,460 4,840 Unrecognized deferred income tax assets (Note 3) 1,664 1,477
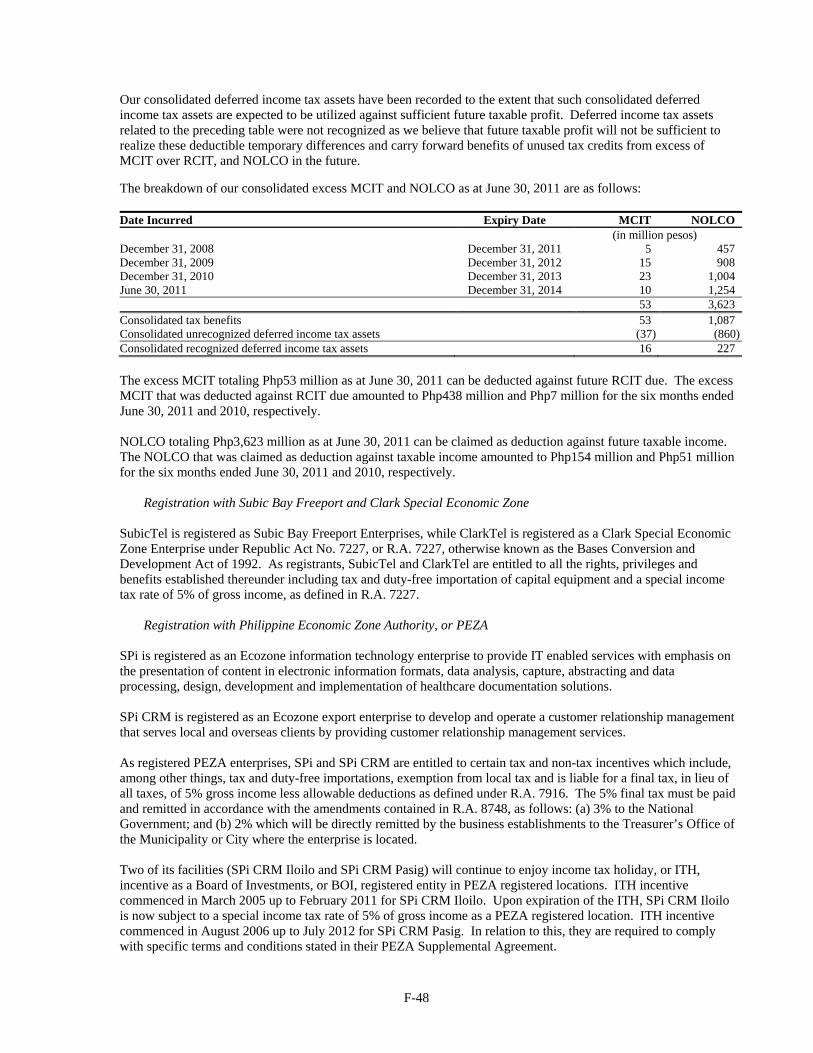
F-48
Our consolidated deferred income tax assets have been recorded to the extent that such consolidated deferred income tax assets are expected to be utilized against sufficient future taxable profit. Deferred income tax assets related to the preceding table were not recognized as we believe that future taxable profit will not be sufficient to realize these deductible temporary differences and carry forward benefits of unused tax credits from excess of MCIT over RCIT, and NOLCO in the future. The breakdown of our consolidated excess MCIT and NOLCO as at June 30, 2011 are as follows: Date Incurred Expiry Date MCIT NOLCO (in million pesos) December 31, 2008 December 31, 2011 5 457 December 31, 2009 December 31, 2012 15 908 December 31, 2010 December 31, 2013 23 1,004 June 30, 2011 December 31, 2014 10 1,254 53 3,623 Consolidated tax benefits 53 1,087 Consolidated unrecognized deferred income tax assets (37) (860)Consolidated recognized deferred income tax assets 16 227 The excess MCIT totaling Php53 million as at June 30, 2011 can be deducted against future RCIT due. The excess MCIT that was deducted against RCIT due amounted to Php438 million and Php7 million for the six months ended June 30, 2011 and 2010, respectively. NOLCO totaling Php3,623 million as at June 30, 2011 can be claimed as deduction against future taxable income. The NOLCO that was claimed as deduction against taxable income amounted to Php154 million and Php51 million for the six months ended June 30, 2011 and 2010, respectively.
Registration with Subic Bay Freeport and Clark Special Economic Zone SubicTel is registered as Subic Bay Freeport Enterprises, while ClarkTel is registered as a Clark Special Economic Zone Enterprise under Republic Act No. 7227, or R.A. 7227, otherwise known as the Bases Conversion and Development Act of 1992. As registrants, SubicTel and ClarkTel are entitled to all the rights, privileges and benefits established thereunder including tax and duty-free importation of capital equipment and a special income tax rate of 5% of gross income, as defined in R.A. 7227.
Registration with Philippine Economic Zone Authority, or PEZA SPi is registered as an Ecozone information technology enterprise to provide IT enabled services with emphasis on the presentation of content in electronic information formats, data analysis, capture, abstracting and data processing, design, development and implementation of healthcare documentation solutions. SPi CRM is registered as an Ecozone export enterprise to develop and operate a customer relationship management that serves local and overseas clients by providing customer relationship management services. As registered PEZA enterprises, SPi and SPi CRM are entitled to certain tax and non-tax incentives which include, among other things, tax and duty-free importations, exemption from local tax and is liable for a final tax, in lieu of all taxes, of 5% gross income less allowable deductions as defined under R.A. 7916. The 5% final tax must be paid and remitted in accordance with the amendments contained in R.A. 8748, as follows: (a) 3% to the National Government; and (b) 2% which will be directly remitted by the business establishments to the Treasurer’s Office of the Municipality or City where the enterprise is located. Two of its facilities (SPi CRM Iloilo and SPi CRM Pasig) will continue to enjoy income tax holiday, or ITH, incentive as a Board of Investments, or BOI, registered entity in PEZA registered locations. ITH incentive commenced in March 2005 up to February 2011 for SPi CRM Iloilo. Upon expiration of the ITH, SPi CRM Iloilo is now subject to a special income tax rate of 5% of gross income as a PEZA registered location. ITH incentive commenced in August 2006 up to July 2012 for SPi CRM Pasig. In relation to this, they are required to comply with specific terms and conditions stated in their PEZA Supplemental Agreement.

F-49
The registration with PEZA for the operations of SPi CRM in Dumaguete is still in progress and therefore it is subject to the regular corporate income tax. However, the Local Investment Board of Dumaguete City had issued a Certificate of Registration and Eligibility which granted SPi CRM the exemption to pay local business taxes and basic real property taxes on improvements for the period from November 2010 to October 2013. SHI was registered with the PEZA as an Ecozone information technology enterprise on a non-pioneer status last July 31, 2009. Under the terms of registration, SHI is entitled to certain tax and non-tax incentives which include, among other things, an ITH for four years starting June 2009. Chikka Philippines, Inc., or CPI, a subsidiary of Chikka, was registered with the PEZA as an Ecozone information technology enterprise on a non-pioneer status last July 28, 2005. Under the terms of registration, CPI was entitled to certain tax and non-tax incentives which include, among other things, an ITH for four years from July 2005 to July 2009. Upon expiration of the ITH, CPI is now subject to 5% special tax on gross revenue, net of certain deductions specifically provided for by the Act, in lieu of all national and local taxes, except real property taxes imposed by the local government. Income derived from non-registered activities is subject to 30% RCIT on taxable income or 2% MCIT on total gross income, whichever is higher.
Registration with BOI On January 3, 2007, the BOI approved ePLDT’s application for pioneer status as a new IT service firm in the field of services related to Internet Data Center for its new data center facility. ePLDT was granted a six-year ITH for its new data center facility from January 2007. SBI is registered with the BOI on a pioneer status, namely as: (i) a new operator of telecommunications systems (inter-exchange carrier for data services); (ii) new information technology service firm in the field of providing internet services; and (iii) a new operator of telecommunications facilities (nationwide broadband wireless access). Under the terms of registration, SBI is entitled to certain tax and non-tax incentives which include, among other things, an ITH for six years. As at June 30, 2011, only the BOI registration for nationwide broadband wireless access continues to enjoy the ITH incentive, which expired in July 2011. Consolidated income derived from non-registered activities with Economic Zone and BOI is subject to the RCIT rate enacted as at the end of the reporting period. Consolidated tax incentives that were availed from registration with Economic Zone and BOI amounted to Php927 million and Php662 million for the six months ended June 30, 2011 and 2010, respectively.
8. Earnings Per Common Share The following table presents information necessary to calculate the EPS for the six months ended June 30, 2011 and 2010:
2011 2010 Basic Diluted Basic Diluted (Unaudited) (in million pesos) Consolidated net income for the period attributable to equity holders of PLDT (Note 4) 21,299 21,299 21,679 21,679 Dividends on preferred shares (Note 18) (228) (24) (228) (25)Consolidated net income for the period attributable to common equity holders of PLDT 21,071 21,275 21,451 21,654 (in thousands, except per share amounts) Outstanding common shares at beginning of period 186,756 186,756 186,797 186,797 Effect of issuance of common shares during the period (Note 19) 1 1 – – Common shares equivalent to convertible preferred shares deemed dilutive:
Preferred Stock Series A to II – 1,914 – 1,870 Weighted average number of common shares for the period 186,757 188,671 186,797 188,667 Earnings per share for the period attributable to common equity holders of PLDT Php112.83 Php112.76 Php114.84 Php114.77

F-50
Basic EPS amounts are calculated by dividing our consolidated net income for the period attributable to common equity holders of PLDT (consolidated net income adjusted for dividends on all series of preferred shares except for dividends on preferred stock subject to mandatory redemption) by the weighted average number of common shares outstanding during the period. Diluted EPS amounts are calculated in the same manner assuming that, at the beginning of the year or at the time of issuance during the period, all outstanding options are exercised and convertible preferred shares are converted to common shares, and appropriate adjustments to consolidated net income are effected for the related income and expenses on preferred shares. Outstanding stock options will have a dilutive effect only when the average market price of the underlying common share during the period exceeds the exercise price of the stock option. Convertible preferred shares are deemed dilutive when required dividends declared on each series of convertible preferred shares divided by the number of equivalent common shares, assuming such convertible preferred shares are converted to common shares, decrease the basic EPS. As such, the diluted EPS is calculated by dividing our consolidated net income attributable to common shareholders (consolidated net income, adding back any dividends and/or other charges recognized for the period related to the dilutive convertible preferred shares classified as liability, less dividends on non-dilutive preferred shares except for dividends on preferred stock subject to mandatory redemption) by the weighted average number of common shares excluding the weighted average number of common shares held as treasury shares, and including the common share equivalent arising from the conversion of the dilutive convertible preferred shares. Series A to II in 2011 and Series A to EE in 2010 were deemed dilutive based on a calculation of the required dividends on these preferred shares divided by the number of equivalent common shares assuming such preferred shares are converted into common shares, including the effect of the treasury shares, and compared against the basic EPS. Where the effect of the assumed conversion of the preferred shares and the exercise of all outstanding options have an anti-dilutive effect, basic and diluted EPS are stated at the same amount. In 2008, the Board of Directors approved a share buyback program of up to five million shares of PLDT’s common stock, representing approximately 3% of PLDT’s total outstanding shares of common stock. We had acquired a total of approximately 2.72 million shares of PLDT’s common stock, representing approximately 1% of PLDT’s outstanding shares of common stock at a weighted average price of Php2,388 per share for a total consideration of Php6,505 million in accordance with the share buyback program as at June 30, 2011 and December 31, 2010. The effect of the acquisition of shares of PLDT’s common stock pursuant to the share buyback program was considered in the computation of our basic and diluted earnings per common share for the six months ended June 30, 2011 and 2010. See Note 18 – Equity and Note 26 – Financial Assets and Liabilities for further discussion.

F-51
9. Property, Plant and Equipment
Movements in property, plant and equipment account for the six months ended June 30, 2011 and for the year ended December 31, 2010 are as follows:
Cable and wire
facilities
Central office
equipment Cellular facilities
Buildings and
improvements
Vehicles, furniture and other network
equipment Communications
satellite
Information origination
and termination equipment
Land and land
improvements
Property under
construction Total (in million pesos) As at December 31, 2009 (Audited) Cost 126,327 87,517 83,451 21,693 35,282 966 8,940 2,458 24,058 390,692 Accumulated depreciation,
impairment and amortization (67,916) (66,505) (48,008) (9,219) (29,061) (966) (7,485) (276) – (229,436) Net book value 58,411 21,012 35,443 12,474 6,221 – 1,455 2,182 24,058 161,256 Year Ended December 31, 2010 (Audited) Net book value at beginning of year 58,411 21,012 35,443 12,474 6,221 – 1,455 2,182 24,058 161,256 Additions 1,494 245 2,336 228 2,045 – 184 – 22,284 28,816 Disposals/Retirements (10) (60) (59) (286) (67) – – – (2) (484) Translation differences charged
directly to cumulative translation adjustments 23 7 – (5) (59) – – – (4) (38)
Acquisition through business combinations – – – – 73 – – – – 73
Impairment losses recognized during the year – (11) – (13) (5) – (91) – – (120)
Reclassifications/Transfers (Note 12) 4,578 2,440 5,653 823 1,740 – 104 (54) (15,326) (42) Depreciation and amortization (7,851) (3,705) (9,418) (2,004) (2,792) – (506) (1) – (26,277) Net book value at end of year (Note 3) 56,645 19,928 33,955 11,217 7,156 – 1,146 2,127 31,010 163,184 As at December 31, 2010 (Audited) Cost 132,356 89,992 90,574 21,873 38,078 966 9,136 2,405 31,010 416,390 Accumulated depreciation,
impairment and amortization (75,711) (70,064) (56,619) (10,656) (30,922) (966) (7,990) (278) – (253,206) Net book value (Note 3) 56,645 19,928 33,955 11,217 7,156 – 1,146 2,127 31,010 163,184 Period Ended June 30, 2011 (Unaudited) Net book value at beginning of period
(Note 3) 56,645 19,928 33,955 11,217 7,156 – 1,146 2,127 31,010 163,184 Additions 936 161 1,103 95 817 – 129 17 3,088 6,346 Disposals/Retirements (3) (4) (20) (13) (76) – – – (2) (118) Translation differences charged
directly to cumulative translation adjustments and other adjustments (1) – – (1) (2) – – – (1) (5)
Reclassifications/Transfers (Note 12) 1,865 1,248 2,135 203 312 – 124 – (5,887) – Depreciation and amortization
(Notes 3 and 4) (4,104) (1,739) (4,702) (688) (1,642) – (243) – – (13,118) Net book value at end of period
(Note 3) 55,338 19,594 32,471 10,813 6,565 – 1,156 2,144 28,208 156,289 As at June 30, 2011 (Unaudited) Cost 134,465 91,238 92,438 22,029 38,590 966 8,818 2,421 28,208 419,173 Accumulated depreciation,
impairment and amortization (79,127) (71,644) (59,967) (11,216) (32,025) (966) (7,662) (277) – (262,884) Net book value (Note 3) 55,338 19,594 32,471 10,813 6,565 – 1,156 2,144 28,208 156,289
Substantially, all our telecommunications equipment are purchased outside the Philippines. Our significant sources of financing for such purchases are foreign loans requiring repayment in currencies other than Philippine pesos, principally in U.S. dollars. See Note 19 – Interest-bearing Financial Liabilities. Interest and net foreign exchange losses capitalized to property, plant and equipment that qualified as borrowing costs for the six months ended June 30, 2011 and 2010 are as follows:
2011 2010 (Unaudited)
(in million pesos) Interest (Note 5) 314 306 Foreign exchange gains – net – 71 The average interest capitalization rates used were approximately 6% in each of the six months ended June 30, 2011 and 2010.

F-52
Our undepreciated capitalized net foreign exchange losses which qualified as borrowing costs amounted to Php1,081 million and Php1,325 million as at June 30, 2011 and December 31, 2010, respectively. The useful lives of our assets are estimated as follows:
Cable and wire facilities 10 – 15 years Central office equipment 10 – 20 years Cellular facilities 3 – 10 years Buildings 25 years Vehicles, furniture and other network equipment 3 – 5 years Information origination and termination equipment 3 – 15 years Land improvements 10 years
Property, plant and equipment includes the net carrying value of capitalized vehicles, furniture and other network equipment under financing leases amounting to Php4 million each as at June 30, 2011 and December 31, 2010. See Note 19 – Interest-bearing Financial Liabilities. Impairment of Smart’s Payphone Business In September 2010, Smart recognized impairment losses on its public telephone equipment in the amount of Php92 million and engaged a third party contractor to operate and maintain its payphone business. Prior to the engagement of the third party, an impairment test was done to assess net cash flows from the business. The result showed that the future net cash flows were not enough to recover the carrying value of the related assets over the useful life of such assets. The recoverable amount was determined based on value in use, calculated using cash flow projections covering a three-year period from 2011 to the end of the assets’ expected useful lives in 2013. The pre-tax discount rate applied to cash flow projections was 7%.
10. Investments in Associates and Joint Ventures
As at June 30, 2011 and December 31, 2010, this account consists of: 2011 2010 (Unaudited) (Audited) (in million pesos) Carrying Value of Investments in Associates:
Meralco 6,953 6,733 Philweb Corporation, or Philweb 947 878 ACeS International Limited, or AIL – –
7,900 7,611 Carrying Value of Investments in Joint Ventures:
Beacon 15,781 15,438 Mobile Payment Solutions Pte. Ltd., or MPS 84 104 ePDS, Inc., or ePDS 50 50 PLDT Italy S.r.l., or PLDT Italy – –
15,915 15,592 Total carrying value of investments in associates and joint ventures (Note 26) 23,815 23,203 Movements in the cost of investments for the six months ended June 30, 2011 and for the year ended December 31, 2010 are as follows: 2011 2010 (Unaudited) (Audited) (in million pesos) Balance at beginning of period 24,636 24,170 Additions during the period (including transfer of interests in Meralco to Beacon) – 15,245 Disposal during the period (including transfer of interests in Meralco to Beacon) – (14,767)Translation and other adjustments (3) (12)Balance at end of period 24,633 24,636

F-53
Movements in the accumulated impairment losses for the six months ended June 30, 2011 and for the year ended December 31, 2010 are as follows:
2011 2010 (Unaudited) (Audited) (in million pesos) Balance at beginning of period 1,974 1,906 Impairment for the period (Notes 3, 4 and 5) – 78 Translation and other adjustments (1) (10)Balance at end of period 1,973 1,974 Movements in the accumulated equity share in net earnings of associates and joint ventures for the six months ended June 30, 2011 and for the year ended December 31, 2010 are as follows:
2011 2010 (Unaudited) (Audited) (in million pesos) Balance at beginning of period 541 (31)Equity share in net earnings (losses) of associates and joint ventures for the period (Note 4): 839 1,408
Beacon 456 354 Meralco 301 874 Philweb 102 161 MPS (20) (7)ePDS – 26
Dividends (216) (530)Translation and other adjustments (9) 10 Disposals – (316)Balance at end of period 1,155 541 Investments in Associates
PCEV’s Acquisition of Shares in Meralco On March 12, 2009, First Philippine Holdings Corporation, or FPHC, First Philippine Utilities Corporation, or FPUC, and Lopez, Inc., (collectively, the Lopez Group) and PLDT entered into an investment and cooperation agreement under which: (a) PLDT acquired, through PCEV as its designated affiliate, 223 million shares in Meralco representing approximately 20% of Meralco’s outstanding shares of common stock, for a cash consideration of Php20,070 million, or Php90 per share; and (b) PLDT and the Lopez Group agreed on certain governance matters, including the right of PLDT or its assignee to nominate certain senior management officers and members of the board of directors and board committees of Meralco. As part of the transaction, PCEV and FPUC also entered into an exchangeable note agreement under which PCEV purchased an exchangeable note dated April 20, 2009, issued by FPUC, with a face value of Php2,000 million, exchangeable into approximately 22.2 million shares of common stock of Meralco, which form part of the 223 million shares or approximately 20% of Meralco’s voting common shares to be acquired by PCEV in the transaction. The exchange option was exercised simultaneously with the acquisition of such shares by PCEV. PCEV recognized a derivative asset of Php563 million on April 20, 2009 for the exchange option feature of the agreement. The residual amount of Php1,437 million was allocated as the value of the host contract of the exchangeable note. The derivative asset was subsequently carried at FVPL while the host contract was carried at amortized cost using effective interest rate. On July 14, 2009, PCEV completed its acquisition of 223 million shares in Meralco for a cash consideration of Php18,070 million for the purchase of approximately 200.8 million shares and the conversion into approximately 22.2 million shares of an exchangeable note issued by FPUC with a market value, including its derivative option, of Php3,286 million. Thus, the investment in 223 million shares in Meralco was recorded at Php21,356 million and a gain of Php1,286 million was recognized on the exchangeable note, representing the mark-to-market gains of Php1,170 million from the derivative option and the amortization of the note’s discount of Php116 million. The acquisition of the shares was implemented through a special block sale/cross sale executed at the PSE.

F-54
PCEV engaged the services of an independent appraiser to determine the fair value of Meralco’s specific identifiable assets and liabilities and allocate the purchase price of PCEV’s investment in Meralco among the identified assets and liabilities based on fair value. Based on the final purchase price allocation, the difference of Php8,377 million between PCEV’s share on the total fair value of Meralco’s specific identifiable assets and liabilities and the total cost of PCEV’s investments was allocated as follows: (a) Php1,517 million for utility, plant and others; (b) Php320 million for investment properties; (c) Php36 million for investments in associates and joint ventures; (d) Php1,286 million for intangible assets particularly for franchise; (e) Php137 million for contingent liability; (f) Php1,295 million for deferred income tax liability; and (g) Php6,650 million for goodwill. On March 30, 2010, PCEV reduced its investment in Meralco by Php15,083 million, the proportionate carrying amount of the 154.2 million Meralco shares sold and transferred to Beacon, see discussion under “Investments in Joint-Ventures – Transfer of PCEV’s Equity Interest in Meralco” section. PCEV will continue to use the equity method to account for its remaining investment in 68.8 million of Meralco’s common shares until the time it will be transferred to Beacon on or before March 31, 2012 per undertaking dated May 9, 2011, where Beacon undertakes to purchase and acquire, and PCEV undertakes to sell and transfer said remaining Meralco shares under terms mutually acceptable to them. See Note 3 – Management’s Use of Accounting Judgments, Estimates and Assumptions. The carrying value of PCEV’s direct investment in Meralco amounted to Php6,953 million with market value of Php18,865 million as at June 30, 2011 based on quoted share price of Php274 per share, while the carrying value of PCEV’s direct investment in Meralco amounted to Php6,733 million with market value of Php15,686 million as at December 31, 2010 based on quoted share price of Php228 per share.
Investment of ePLDT in Philweb In May 2006, ePLDT subscribed to newly issued common shares of Philweb, an internet-based online gaming company, equivalent to 20% of the total outstanding capital stock of Philweb at a price of Php0.020 per share or an aggregate amount of Php503 million. Of the total subscription price, Php428 million was paid by ePLDT on the closing date. A portion of the unpaid subscription price amounting to Php25 million will be paid by ePLDT at the same time as the Philweb majority stockholders pay the remaining unpaid portion of the subscription pursuant to a general call on subscription to be made by Philweb’s Board of Directors. The remaining unpaid balance of Php50 million will be paid upon the lapse of certain post-closing price adjustment periods. In October 2006, ePLDT acquired an additional 8,038 million shares of Philweb at a price of Php0.026 per share or an aggregate amount of Php209 million. This represents an additional 6.2% of the outstanding shares of Philweb, raising ePLDT’s total equity stake to 26.87%. As at June 30, 2011 and December 31, 2010, ePLDT’s equity interest in Philweb is 26.4%. Philweb is primarily engaged in internet-based online gaming, through its appointment as Principal Technology Service Provider under the Marketing Consultancy Agreement for Internet Sports Betting and Internet Casino with the Philippine Amusement and Gaming Corporation, or PAGCOR. Philweb offers Internet Sports Betting in over 180 PAGCOR Internet Sports Betting Stations and over 180 Internet Casino Stations nationwide. The market value of ePLDT’s investment in Philweb, based on quoted share price, amounted to Php5,504 million and Php5,358 million as at June 30, 2011 and December 31, 2010, respectively.
Investment of ACeS Philippines in AIL As at June 30, 2011, ACeS Philippines had a 36.99% investment in AIL, a company incorporated under the laws of Bermuda. AIL owns the Garuda I Satellite and the related system control equipment in Batam, Indonesia. AIL has incurred recurring significant operating losses, negative operating cash flows, and significant levels of debt. The financial condition of AIL was partly due to the National Service Providers’, or NSPs, inability to generate the amount of revenues originally expected as the growth in subscriber numbers has been significantly lower than budgeted. These factors raised substantial doubt about AIL’s ability to continue as a going concern. On this basis, we recognized a full impairment provision of Php1,896 million in respect of our investment in AIL in 2003.

F-55
Unrecognized share in net income of AIL amounted to Php28 million for the six months ended June 30, 2011 while unrecognized share in net losses of AIL amounted to Php18 million for the six months ended June 30, 2010. Share in net cumulative losses amounting to Php2,038 million and Php2,102 million as at June 30, 2011 and December 31, 2010, respectively, were not recognized as we do not have any legal or constructive obligation to pay for such losses and have not made any payments on behalf of AIL. See Note 23 – Related Party Transactions and Note 26 – Financial Assets and Liabilities for further details as to the contractual relationships with respect to AIL. Summarized Financial Information of Associates The following tables present our share in the summarized financial information of our investments in associates in conformity with PFRS for equity investees in which we have significant influence as at June 30, 2011 and December 31, 2010 and for the six months ended June 30, 2011 and 2010: 2011 2010 (Unaudited) (Audited) (in million pesos) Statements of Financial Position: Noncurrent assets 7,866 8,375 Current assets 5,296 3,947 Equity 2,772 2,723 Noncurrent liabilities 6,567 5,503 Current liabilities 3,823 4,096 2011 2010 (Unaudited) (in million pesos) Income Statements: Revenues 7,821 7,938 Expenses 6,818 7,183 Other expenses 292 240 Net income for the period 494 390 The above information includes our share in the financial position and operating results of Meralco based on the following summarized financial information at gross amounts as at June 30, 2011 and December 31, 2010 and for the six months ended June 30, 2011 and 2010 as shown below, which were adjusted to conform with our accounting policy on investment properties: 2011 2010 (Unaudited) (Audited) (in million pesos) Statements of Financial Position: Noncurrent assets 122,037 130,423 Current assets 75,162 54,831 Equity 66,697 68,339 Noncurrent liabilities 83,578 72,552 Current liabilities 46,924 44,363 2011 2010 (Unaudited) (in million pesos) Income Statements: Revenues 124,826 127,463 Expenses 110,309 116,293 Other expenses 4,891 3,985 Net income for the period 6,091 4,851

F-56
Investments in Joint Ventures
Transfer of PCEV’s Equity Interest in Meralco On March 1, 2010, PCEV, MPIC and Beacon, entered into an Omnibus Agreement, or OA. Beacon, formerly known as Rightlight Holdings, Inc., was organized with the sole purpose of holding the respective shareholdings of PCEV and MPIC in Meralco. PCEV and MPIC are Philippine affiliates of First Pacific and both held equity shares in Meralco. Under the OA, PCEV and MPIC have agreed to set out their mutual agreement in respect of, among other matters, the capitalization, organization, conduct of business and the extent of their participation in the management of the affairs of Beacon.
Investment in Beacon
Prior to the transactions contemplated under the OA, MPIC beneficially owned the entire outstanding capital stock of Beacon, consisting of 25,000 common shares of Beacon, with a total par value of Php25,000.
On April 29, 2010, the Philippine SEC approved Beacon’s application to increase its authorized
capital stock to Php5 billion consisting of 3 billion common shares with par value of Php1 per share and 2 billion preferred shares with par value of Php1 per share. The preferred shares of Beacon are non-voting, not convertible to common shares or any shares of any class of Beacon, have no pre-emptive rights to subscribe to any share or convertible debt securities or warrants issued or sold by Beacon. The preference shareholder is entitled to liquidation preference and yearly cumulative dividends at the rate of 7% of the issue value subject to: (a) availability of unrestricted retained earnings; and (b) dividend payment restrictions imposed by Beacon’s bank creditors.
Under the OA, each of PCEV and MPIC agreed to subscribe to 1,156.5 million common shares of
Beacon, for a subscription price of Php20 per share or a total of Php23,130 million. PCEV and MPIC also agreed that their resulting equity after such subscriptions and PCEV’s purchase from MPIC of 12,500 Beacon common shares will be 50% each of the outstanding common shares of Beacon.
MPIC additionally agreed to subscribe to 801 million shares of Beacon’s preferred stock entitled to
liquidation preference and yearly cumulative dividends at the rate of 7% for a subscription price of Php10 per share or a total of Php8,010 million.
The completion of the subscription of MPIC to 1,156.5 million common shares and 801 million
preferred shares of Beacon was subject to the following conditions, all of which have been satisfied: (a) the approval of MPIC’s Board of Directors, which was obtained on March 1, 2010; (b) the approval of the shareholders of First Pacific, which was obtained on March 30, 2010; and (c) the full payment of the subscription price, which was made on March 30, 2010. Consequently, on March 30, 2010, MPIC completed its subscription to 1,156.5 million common shares of Beacon and approximately 801 million preferred shares of Beacon in consideration of: (1) the transfer of 163.6 million Meralco shares at a price of Php150 per share, or Php24,540, million in the aggregate; and (2) Php6,600 million in cash, as further described below in “Transfer of Meralco Shares to Beacon”.
The completion of the subscription of PCEV to 1,156.5 million common shares of Beacon was subject
to the following conditions, all of which have been satisfied: (a) the approval of PCEV’s Board of Directors, which was obtained on March 1, 2010; (b) the approval of the shareholders of First Pacific, which was obtained on March 30, 2010; (c) the approval of the shareholders of PCEV, which was obtained on May 7, 2010; and (d) the full payment of the subscription price, which was made on May 12, 2010.
Although PCEV secured the approval of its shareholders only on May 7, 2010, such approval was
deemed to be a formality as Smart owns 99.5% of PCEV’s capital stock. Consequently, upon receipt of all other required approvals under the OA on March 30, 2010, including that of the shareholders of First Pacific, PCEV recognized as an asset the deposit for future stock subscription of Php23,130 million for its subscription to 1,156.5 million common shares of Beacon. The deposit for future stock subscription was eventually reclassified to investment account when Beacon’s increase in authorized capital stock was approved by the Philippine SEC in April 2010.

F-57
The subscription price of PCEV’s and MPIC’s subscription to Beacon shares was offset in full (in the
case of PCEV) and in part (in the case of MPIC) against the consideration for the transfer of Meralco shares held by PCEV and MPIC as described in “Transfer of Meralco Shares to Beacon” section below. In addition, MPIC settled its remaining balance in cash. On May 12, 2010, PCEV also completed the purchase from MPIC of 12,500 shares or 50% of the 25,000 Beacon common shares originally owned by MPIC. Transfer of Meralco Shares to Beacon
Alongside with the subscription to the Beacon shares described above, Beacon agreed to purchase
154.2 million and 163.6 million Meralco shares, or the Transferred Shares, from PCEV and MPIC, respectively, for a consideration of Php150 per share or a total of Php23,130 million for the PCEV Meralco shares and Php24,540 million for the MPIC Meralco shares.
The completion of the sale of the MPIC Meralco shares to Beacon was subject to the following
conditions, all of which have been satisfied: (a) the approval of MPIC’s Board of Directors, which was obtained on March 1, 2010; (b) the approval of the Board of Directors of First Pacific, which was obtained on March 1, 2010; (c) the approval of the shareholders of First Pacific, which was obtained on March 30, 2010; and (d) the release of the pledge over the MPIC Meralco shares, which was completed on March 30, 2010. Consequently, on March 30, 2010, MPIC transferred 163.6 million Meralco shares to Beacon at a price of Php150 per share for a total consideration of Php24,540 million.
The completion of the sale of the PCEV Meralco shares to Beacon was subject to the following
conditions, all of which have been satisfied: (a) the approval of PCEV’s Board of Directors, which was obtained on March 1, 2010; (b) the approval of the Board of Directors of First Pacific, which was obtained on March 1, 2010; (c) the approval of the shareholders of First Pacific, which was obtained on March 30, 2010; and (d) the approval of the shareholders of PCEV, which was obtained on May 7, 2010. Consequently, on May 12, 2010, PCEV transferred 154.2 million Meralco shares to Beacon at a price of Php150 per share for a total consideration of Php23,130 million.
The transfer of legal title to the Meralco shares was implemented through a special block sale/cross
sale in the PSE.
Although PCEV secured the approval of its shareholders only on May 7, 2010, such approval was deemed to be a formality as Smart owns 99.5% of PCEV’s capital stock. Consequently, upon receipt of all other required approvals under the OA on March 30, 2010, including that of the shareholders of First Pacific, PCEV recognized a Php15,083 million investment (initially recognized as deposit for future stock subscription, see discussion above) in Beacon representing the proportionate carrying cost of the 154.2 million Meralco shares transferred to Beacon under the OA. PCEV recognized a deferred gain of Php8,047 million for the difference between the Php23,130 million transfer price of the Meralco shares to Beacon and the Php15,083 million carrying amount in PCEV’s books of the Meralco shares transferred. The deferred gain, presented as a reduction in PCEV’s investment in Beacon, will only be realized upon the disposal of the investment to a third party.
Subject to rights over certain property dividends that may be declared or distributed in respect of the
approximately 317.8 million Transferred Shares, which will be assigned to FPHC if the Call Option (as discussed below), is exercised, the rights, title and interest transferred to Beacon by MPIC and PCEV in respect of the approximately 317.8 million Transferred Shares includes: (a) all shares issued by Meralco by way of stock dividends on the Transferred Shares from March 1, 2010; (b) all property or cash dividends declared or paid on the Transferred Shares from March 1, 2010; (c) all other rights accruing on the Transferred Shares from March 1, 2010; and (d) the proceeds of all of the foregoing.
PCEV may, at some future time and under such terms and conditions as may be agreed by PCEV,
MPIC and Beacon, transfer to Beacon its remaining 68.8 million Meralco common shares.

F-58
Call Option
Under the OA, MPIC assigned its right to acquire the call option, or the Call Option, over 74.7 million common shares of Meralco held by FPHC, or the Option Shares, to Beacon. As a result of this assignment, Beacon and FPHC executed an Option Agreement dated March 1, 2010 pursuant to which FPHC granted the Call Option over the Option Shares to Beacon.
The Call Option is exercisable at the option of Beacon during the period from March 15, 2010 until
midnight of May 15, 2010. The exercise price for the Option Shares is Php300 per share or an aggregate exercise price of Php22,410 million. Beacon exercised the Call Option on March 30, 2010 and FPHC transferred the 74.7 million shares of Meralco common stock to Beacon in consideration of the payment by Beacon of Php22,410 million in cash on March 30, 2010.
Subject to rights over certain property dividends that may be declared or payable in respect of the
74.7 million shares of Meralco common stock, which are retained by FPHC following the Call Option exercise, the rights, title and interest transferred to Beacon by FPHC in respect of the Option Shares includes: (a) all shares issued by Meralco by way of stock dividends on the Option Shares from March 1, 2010; (b) all property or cash dividends declared or paid on the Transferred Shares from March 1, 2010; (c) all other rights accruing on the Transferred Shares from March 1, 2010; and (d) the proceeds of any sale or disposition of any of the foregoing.
Property Dividends
With respect to the approximately 317.8 million Transferred Shares, the remaining 68.8 million
Meralco common shares held by PCEV and the 74.7 million Option Shares transferred by FPHC to Beacon pursuant to the Call Option, FPHC has the benefit of being assigned, or retaining in the case of the Option Shares, certain property dividends that may be declared on such shares.
Governance Arrangements
Beacon, PCEV and MPIC have also agreed on certain corporate governance matters, including Board
composition, election of officers, shareholders’ action, representation to the Meralco Board, nomination of the Meralco Board Committees, and nomination of Meralco officers. The corporate governance agreements and Beacon equity structure resulted in a jointly controlled entity.
In 2010, Beacon engaged the services of an independent appraiser to provide the fair market values of the operating equity investments, fixed assets and intangible assets of Meralco at the time of Beacon’s acquisition of its Meralco shares and allocate the purchase price of Beacon’s investment in Meralco among the identifiable assets and liabilities based on fair value. Based on the final purchase price allocation, the difference of Php50,595 million between Beacon’s share of the total fair value of Meralco’s specific identifiable assets and liabilities and the total cost of Beacon’s investment was allocated as follows: (a) Php2,521 million for utility, plant and others; (b) Php341 million for investment properties; (c) Php59 million for investment in associates and joint ventures; (d) Php1,814 million for intangible assets particularly for franchise; (e) Php26 million for contingent liability; (f) Php2,018 million for deferred income tax liabilities; and (g) Php47,904 million for goodwill. Beacon also recognized in March 2010, a liability for contingent consideration amounting to Php2,373 million for certain property dividends that may be declared on its Meralco shares pursuant to the Option Agreement between Beacon and FPHC. The liability for contingent consideration was remeasured based on the fair value of said property dividends as at December 31, 2010, and the resulting re-measurement loss of Php331 million was charged to profit or loss for the year ended December 31, 2010. In May and June 2011, Beacon acquired from the market additional 48.2 million Meralco common shares or an equivalent of approximately 4.3% beneficial ownership in Meralco at an aggregate cost of Php14,668 million. Subsequently, in July 2011, Beacon again acquired from the market additional 1.8 million Meralco common shares or an equivalent of approximately 0.2% beneficial ownership in Meralco at an aggregate cost of Php482 million. Beacon will engage the services of an independent appraiser to determine the latest fair market values of the operating equity investments, fixed assets and intangible assets of Meralco to allocate the purchase price of Beacon’s additional investment in Meralco among the identifiable assets and liabilities on the basis of such fair values.

F-59
As at June 30, 2011, Beacon beneficially owned 441 million Meralco common shares representing approximately 39.1 % beneficial ownership in Meralco with a carrying value of Php87,802 million and market value of Php120,834 million based on quoted price of Php274 per share. As at December 31, 2010, Beacon beneficially owned 393 million Meralco common shares representing approximately 34.8% equity interest in Meralco with a carrying value of Php73,322 million and market value of Php89,490 million based on quoted price of Php228 per share. On March 22, 2010, Beacon also entered into an Php18,000 million ten-year corporate notes facility with First Metro Investment Corporation, or FMIC, and PNB Capital and Investment Corporation, or PNB Capital, as joint lead arrangers and various local financial institutions as noteholders. The initial drawdown of Php16,200 million (Php16,031 million, net of debt issuance cost) under this notes facility partially financed the acquisition of Merlaco shares by Beacon pursuant to its exercise of the Call Option in March 2010. In May 2011, the remaining Php1,800 million was drawn to partially finance the acquisition of the additional 48.2 million Meralco common stock from the market. The outstanding balance of the facility amounted to Php17,827 million and Php16,027 million as at June 30, 2011 and December 31, 2010, respectively. In May 2011, Beacon entered into an Php11,000 million ten-year corporate notes facility with FMIC and PNB Capital as joint lead arrangers and various local financial institutions as noteholders. The amount drawn under this facility amounted to Php4,000 million to also partially finance the acquisition of the additional 48.2 million Meralco common stock from the market. The outstanding balance of the facility amounted to Php3,892 million as at June 30, 2011. The undrawn amount of Php7,000 million is earmarked for payment of final tranche of deferred purchases made in May 2011. The above facilities were secured by a pledge over Meralco shares and were not guaranteed by PLDT. Also, the above facilities were not included in our consolidated debt.
Investment of SHI in MPS In June 2010, SHI and MasterCard Asia/Pacific Pte. Ltd., or MasterCard Asia, entered into a joint venture agreement under which the parties agreed to form MPS. The joint venture will develop, provide and market certain mobile payment services among other activities as stipulated in the agreement. MPS was incorporated in Singapore on June 4, 2010 and is 40% and 60% owned by SHI and MasterCard Asia, respectively. On November 9, 2010, SHI contributed US$2.4 million representing 40% ownership in MPS.
Investment of ePLDT in ePDS
ePLDT entered into a joint venture agreement on June 27, 2003 with DataPost Pte. Ltd., or DataPost, a subsidiary of Singapore Post, or Spring, and G3 Worldwide ASPAC pursuant to which the parties formed ePDS, a bills printing company that performs laser printing and enveloping services for statements, bills and invoices, and other VAS for companies in the Philippines. ePLDT has a 50% equity interest in ePDS, while DataPost has a 30% equity interest. Spring, the largest international mail services provider, owns the remaining 20% equity interest. ePDS has an initial paid-up capital of Php11 million.
Investment of PLDT Global in PLDT Italy PLDT Global holds 100% nominal interest in PLDT Italy, a company incorporated under the laws of Italy, which is intended to carry the joint venture business between PLDT Global and Hutchison Global Communications Limited, or HGC, a company based in Hong Kong. On March 12, 2008, PLDT Global and HGC entered into a Co-operation Agreement wherein the parties agreed to launch their first commercial venture in Italy by offering mobile telecommunications services through PLDT Italy. Under the terms of the agreement, PLDT Global and HGC agreed to share equally the profit or loss from the operations of PLDT Italy. As a condition precedent to the effectiveness of the Co-Operation Agreement, PLDT Global pledged 50% of its shareholdings in PLDT Italy to HGC.

F-60
As at June 30, 2011 and December 31, 2010, the aggregate amount of funding contributed by each partner to the joint venture is Euro 3.9 million, or Php235 million, and Euro 3.9 million, or Php238 million, respectively, or a total of Euro 7.8 million, or Php470 million and Euro 7.8 million, or Php476 million, respectively. As at June 30, 2011, PLDT Global has made a full impairment provision on its investment to PLDT Italy. Summarized Financial Information of Joint Ventures The following table presents our share in the summarized financial information of our investments in joint ventures as at June 30, 2011 and December 31, 2010 and for the six months ended June 30, 2011 and 2010: 2011 2010
(Unaudited) (Audited)(in million pesos)
Statements of Financial Position: Noncurrent assets 43,949 36,697 Current assets 943 912 Equity 27,951 27,520 Noncurrent liabilities 14,621 8,018 Current liabilities 2,320 2,071
2011 2010 (Unaudited)
(in million pesos) Income Statements: Revenues 1,076 552 Expenses 66 145 Other expenses 413 200 Net income for the period 597 198 The above information includes our share in the financial position and operating results of Beacon based on the following summarized financial information of Beacon at gross amounts as at June 30, 2011 and December 31, 2010 and for the six months ended June 30, 2011 and 2010 as shown below: 2011 2010
(Unaudited) (Audited)(in million pesos)
Statements of Financial Position: Noncurrent assets 87,802 73,322 Current assets 1,543 1,658 Equity 55,639 54,956 Noncurrent liabilities 29,233 16,027 Current liabilities 4,473 3,997
2011 2010 (Unaudited)
(in million pesos) Income Statements: Equity share in net income of Meralco 2,061 927 Expenses 10 65 Other expenses 827 400 Net income for the period 1,224 462 As at June 30, 2011, we have no outstanding capital commitments with our joint ventures.

F-61
11. Investment in Debt Securities
As at June 30, 2011 and December 31, 2010, this account consists of:
2011 2010 (Unaudited) (Audited)
(in million pesos) National Power Corporation, or NAPOCOR, Zero Coupon Bond 345 334 Rizal Commercial Banking Corporation, or RCBC, Note 150 150 Noncurrent portion of investment in debt securities (Note 26) 495 484
NAPOCOR Zero Coupon Bonds In 2007, Smart purchased, at a discount, a NAPOCOR Zero Coupon Bond, or NAPOCOR Bond, with a face value of Php380 million, maturing on November 29, 2012 at a net yield to maturity of 6.88%. The NAPOCOR Bond, which is classified as a financial asset HTM, is carried at amortized cost using the effective interest rate method. Interest income recognized on the NAPOCOR Bond amounted to Php11 million in each of the six months ended June 30, 2011 and 2010.
RCBC Note In 2008, Smart purchased at par a ten-year RCBC Tier 2 Note, or RCBC Note, with a face value of Php150 million bearing a fixed rate of 7.00% for the first five years and the step-up interest rate from the fifth year up to maturity date. The RCBC Note may be redeemed at the option of the Issuer at par plus accrued and unpaid interest on February 22, 2013. Smart designated the RCBC Note as HTM financial asset. Interest income recognized on the RCBC Note amounted to Php4 million in each of the six months ended June 30, 2011 and 2010.
12. Investment Properties
Movements in investment properties account for the six months ended June 30, 2011 and for the year ended December 31, 2010 are as follows:
2011 2010 (Unaudited) (Audited) (in million pesos) Balance at beginning of period 1,560 1,210 Transfers from property, plant and equipment (Note 9) – 491 Net gains from fair value adjustments charged to profit or loss(1) (Note 3) – 6 Disposals – (147)Balance at end of period (Notes 3 and 26) 1,560 1,560 ___________________ (1) Presented as part of “Other income” in our consolidated income statement. Investment properties, which consist of land and building, are stated at fair values, which have been determined annually based on the year-end appraisal performed by an independent firm of appraisers, an industry specialist in valuing these types of investment properties. The valuation was based on an open market value, supported by a market evidence in which such assets could be exchanged between a knowledgeable and willing buyer and seller in an arm’s length transaction at the date of valuation. None of our investment properties are being leased to third parties that earn rental income. Repairs and maintenance expenses relating to investment properties amounted to Php42 million and Php34 million for the six months ended June 30, 2011 and 2010, respectively.

F-62
13. Goodwill and Intangible Assets
Movements in goodwill and intangible assets for the six months ended June 30, 2011 and for the year ended December 31, 2010 are as follows:
Intangible Assets
Total
Goodwill
Customer
List Spectrum LicensesTechnology Application Trademark
Total Intangible
Assets Goodwill
and Intangible
Assets (in million pesos) June 30, 2011 (Unaudited) Costs:
Balance at beginning of period 1,632 1,205 554 993 159 4,543 14,733 19,276 Additions – – 2 – – 2 – 2 Translation and other adjustments (16) – (235) 78 2 (171) (68) (239)
Balance at end of period 1,616 1,205 321 1,071 161 4,374 14,665 19,039 Accumulated amortization and impairment:
Balance at beginning of period 1,212 509 426 977 41 3,165 4,626 7,791 Amortization during the period (Note 3) 80 40 13 4 7 144 – 144 Translation and other adjustments (21) – (230) 75 1 (175) (111) (286)
Balance at end of period 1,271 549 209 1,056 49 3,134 4,515 7,649 Net balance at end of period (Notes 3 and 26) 345 656 112 15 112 1,240 10,150 11,390 Estimated useful lives (in years) 1 – 8 15 2 – 18 3 – 5 1 – 10 – – – Remaining useful lives (in years) 2 – 6 8 4 months
– 11 1 – 4 9 – – –
December 31, 2010 (Audited) Costs:
Balance at beginning of year 1,655 1,205 613 967 27 4,467 15,201 19,668 Additions 19 – 19 4 1 43 – 43 Translation and other adjustments (42) – (78) 22 131 33 (468) (435)
Balance at end of year 1,632 1,205 554 993 159 4,543 14,733 19,276 Accumulated amortization and impairment:
Balance at beginning of year 995 428 448 964 – 2,835 3,809 6,644 Impairment during the year 56 – 18 – – 74 1,169 1,243 Amortization during the year 219 81 36 11 41 388 – 388 Translation and other adjustments (58) – (76) 2 – (132) (352) (484)
Balance at end of year 1,212 509 426 977 41 3,165 4,626 7,791 Net balance at end of year (Notes 3 and 26) 420 696 128 16 118 1,378 10,107 11,485 Estimated useful lives (in years) 1 – 8 15 2 – 18 3 – 5 1 – 10 – – – Remaining useful lives (in years) 1 – 7 9 1 – 12 2 – 4 9 – – – Intangible Assets
Intangible Assets from Acquisition of SPi, Level Up! and CyMed, Inc., or CyMed In 2010, ePLDT recognized an impairment of its remaining intangible assets from the acquisition of SPi and CyMed amounting to Php19 million and Php38 million, respectively, pertaining to the medical transcription business of SPi, since the carrying amount of the individual assets from SPi and CyMed were deemed unrecoverable. There were no impairment indicators identified as at June 30, 2011. Annual impairment testing will be performed at year-end.

F-63
Intangible Assets from Acquisition of Chikka and PDSI In 2010, Smart recognized intangible assets of Php132 million for technology and tradename and Php23 million for technology and customer base acquired in the purchase of Chikka Group and PDSI, respectively, based on the result of the valuation done by an independent appraiser. There were no impairment indicators identified as at June 30, 2011. Annual impairment testing will be performed at year-end. The consolidated future amortization of intangible assets as at June 30, 2011 is as follows: Year (in million pesos) 2011(1) 133 2012 252 2013 216 2014 126 2015 and onwards 513 Balance at end of period 1,240 ___________________ (1) July 1, 2011 through December 31, 2011. Impairment Testing of Goodwill
Goodwill from Acquisition of SBI, CURE, Airborne Access, PDSI and Chikka The organizational structure of Smart and its subsidiaries is designed to monitor financial operations based on fixed line and wireless segmentation. Management provides guidelines and decisions on resource allocation, such as continuing or disposing of asset and operations by evaluating the performance of each segment through review and analysis of available financial information on the fixed and wireless segments. As at June 30, 2011, Smart’s goodwill comprised of goodwill resulting from Smart’s acquisition of SBI in 2004, CURE in 2008, SBI’s acquisition of a 99.4% equity interest in Airborne Access from ePLDT in 2008 and Smart’s acquisition of PDSI and Chikka in 2009. The test for recoverability of Smart’s goodwill was applied to the wireless asset group, which represents the lowest level for which identifiable cash flows are largely independent of the cash inflows from other groups of assets and liabilities. Although revenue streams may be segregated among Smart, CURE, SBI and PDSI through subscribers availing themselves of their respective cellular (for Smart and CURE) and wireless broadband (for SBI and PDSI) services, the cost items and cash flows are difficult to carve out due largely to the significant portion of shared and common-used network/platform. In the case of CURE, it provides cellular services to its subscribers using Smart’s 2G network. SBI, on the other hand, provides broadband wireless access to its subscribers using Smart’s cellular base stations and fiber optic and IP backbone, as well as the Worldwide Interoperability for Microwave Access technology of PDSI. With the common use of wireless assets of Smart in providing 3G cellular and wireless broadband access, the lowest level of assets of CURE, SBI and PDSI for which cash flows are clearly identifiable from other groups of assets is Smart’s wireless business segment. On the other hand, Chikka’s mobile applications and content are developed mainly for the cellular subscribers of Smart and CURE. The recoverable amount of this segment had been determined using the value in use approach calculated using cash flow projections based on the financial budgets approved by the Board of Directors, covering a five-year period from 2011 to 2015. The pre-tax discount rate applied to cash flow projections is 8.8% and cash flows beyond the five-year period are determined using a 2.5% growth rate that is the same as the long-term average growth rate for the telecommunications industry. There were no impairment indicators identified as at June 30, 2011. Annual impairment testing will be performed at year-end.

F-64
Goodwill from Acquisition of SPi and its Subsidiaries, CyMed, Springfield Service Corporation, or Springfield,
and Laguna Medical Systems, Inc., or Laguna Medical The goodwill acquired through the SPi, CyMed, Springfield and Laguna Medical transactions was allocated for impairment testing to each of the cash-generating units of those businesses, namely medical transcription, litigation, content solutions, medical billing and medical coding, respectively. The recoverable amount of goodwill was determined using the value in use approach. Value in use was based on the cash flow projections of the most recent financial budgets and forecasts approved by the Board of Directors, which management believes are reasonable and are management’s best estimate of the ranges of economic conditions that will exist over the remaining useful life of the asset. The pre-tax discount rate of 15% was applied based on the weighted average cost of capital adjusted for the difference in currency and specific risks associated with the assets or business of such cash-generating units.
Since the carrying amount of the individual assets exceeded the recoverable amount, ePLDT recognized an impairment losses of Php905 million for the year ended December 31, 2010 pertaining to the medical transcription business of SPi and CyMed. There were no impairment indicators identified as at June 30, 2011. Annual impairment testing will be performed at year-end.
Goodwill from Acquisition of Level Up! Goodwill acquired from our acquisition in 2006 of a 60% equity interest in Level Up! was tested for impairment. ePLDT recognized an impairment charge of Php48 million for the year ended December 31, 2010 pertaining to the goodwill from acquisition of Level Up! based on the expected selling price of Level Up!. See Note 2 – Summary of Significant Accounting Policies for the related discussion on the sale of investment in Level Up!.
Goodwill from Acquisition of Digital Paradise Goodwill acquired from the acquisition of Digital Paradise was tested for impairment based on the recoverable amount of the long lived assets where recoverable amount was determined based on the cash flow projections on the most recent financial budgets and forecasts approved by the Board of Directors. The pre-tax discount rate applied was 22% which was based on the weighted average cost of capital. ePLDT recognized full impairment provision of Php85 million as at December 31, 2009. See Note 2 – Summary of Significant Accounting Policies for the related discussion on the sale of investment in Digital Paradise.
Goodwill from Acquisition of BayanTrade Goodwill acquired from the acquisition of BayanTrade was tested for impairment based on the recoverable amount of the long lived assets, determined based on the cash flow projections on the most recent financial budgets and forecasts approved by the Board of Directors. The pre-tax discount rate applied was 22%, which was based on the weighted average cost of capital. ePLDT recognized full impairment provision of Php216 million as at December 31, 2010.
14. Cash and Cash Equivalents
As at June 30, 2011 and December 31, 2010, this account consists of:
2011 2010 (Unaudited) (Audited) (in million pesos) Cash on hand and in banks (Note 26) 2,585 2,906 Temporary cash investments (Note 26) 36,073 33,772 38,658 36,678

F-65
Cash in banks earn interest at prevailing bank deposit rates. Temporary cash investments are made for varying periods of up to three months depending on our immediate cash requirements, and earn interest at the prevailing temporary cash investment rates. Due to the short-term nature of such transactions, the carrying value approximates the fair value of our temporary cash investments. See Note 26 – Financial Assets and Liabilities. Interest income earned from cash in banks and temporary cash investments amounted to Php628 million and Php564 million for the six months ended June 30, 2011 and 2010, respectively.
15. Trade and Other Receivables
As at June 30, 2011 and December 31, 2010, this account consists of receivables from:
2011 2010 (Unaudited) (Audited) (in million pesos) Retail subscribers (Note 26) 8,727 8,917 Corporate subscribers (Notes 23 and 26) 8,663 7,998 Foreign administrations (Note 26) 4,450 4,479 Domestic carriers (Notes 23 and 26) 1,562 1,591 Dealers, agents and others (Notes 17, 23 and 26) 4,037 5,273 27,439 28,258 Less allowance for doubtful accounts (Notes 3, 5 and 26) 12,517 11,830 (Notes 3, 5 and 26) 14,922 16,428 Movements in the allowance for doubtful accounts for the six months ended June 30, 2011 and for the year ended December 31, 2010 are as follows:
Total Retail
Subscribers Corporate
Subscribers Foreign
Administrations Domestic Carriers
Dealers, Agents and
Others (in million pesos) June 30, 2011 (Unaudited) Balance at beginning of period 11,830 5,045 5,956 158 138 533 Provisions for the period (Notes 3, 4 and 5) 774 421 312 5 3 33 Write-offs (62) (27) (27) – – (8)Translation and other adjustments (25) 171 (193) 21 (6) (18)Balance at end of period 12,517 5,610 6,048 184 135 540 Individual impairment 9,541 3,396 5,439 184 135 387 Collective impairment 2,976 2,214 609 – – 153 12,517 5,610 6,048 184 135 540 Gross amount of receivables individually
impaired, before deducting any impairment allowance 9,541 3,396 5,439 184 135 387
December 31, 2010 (Audited) Balance at beginning of year 11,950 4,480 6,677 289 83 421 Provisions for the year 834 493 152 – 64 125 Write-offs (932) (284) (562) (5) – (81)Translation and other adjustments (22) 356 (311) (126) (9) 68 Balance at end of year 11,830 5,045 5,956 158 138 533 Individual impairment 8,861 2,745 5,413 158 138 407Collective impairment 2,969 2,300 543 – – 126 11,830 5,045 5,956 158 138 533 Gross amount of receivables individually
impaired, before deducting any impairment allowance 8,861 2,745 5,413 158 138 407

F-66
Receivables from foreign administrations and domestic carriers represent receivables arising from interconnection agreements with other telecommunications carriers. The aforementioned amounts of receivables are shown net of related payable to the same telecommunications carriers where a legal right of offset exists and settlement is facilitated on a net basis.
16. Inventories and Supplies
As at June 30, 2011 and December 31, 2010, this account consists of:
2011 2010 (Unaudited) (Audited) (in million pesos) Spare parts and supplies:
At net realizable value 1,394 1,152 At cost 2,411 2,163
Terminal and cellular phone units: At net realizable value 715 737 At cost 913 918
Others: At net realizable value 444 330 At cost 447 333
Total inventories and supplies at the lower of cost or net realizable value (Notes 3, 4, 5 and 26) 2,553 2,219 The cost of inventories and supplies recognized as expense for the six months ended June 30, 2011 and 2010 are as follows:
2011 2010 (Unaudited)
(in million pesos) Cost of sales 2,148 1,964 Repairs and maintenance 259 144 Write-down of inventories and supplies (Notes 3, 4 and 5) 35 33 2,442 2,141
17. Prepayments
As at June 30, 2011 and December 31, 2010, this account consists of: 2011 2010 (Unaudited) (Audited) (in million pesos) Prepaid taxes 7,031 7,476 Prepaid benefit costs (Notes 3 and 24) 5,493 5,333 Prepaid selling and promotions 875 1,011 Prepaid fees and licenses 197 40 Prepaid rent – net (Notes 3 and 5) 155 53 Prepaid insurance (Note 23) 116 122 Other prepayments 148 62 14,015 14,097 Less current portion of prepayments (Note 26) 4,807 5,418 Noncurrent portion of prepayments (Note 26) 9,208 8,679 Prepaid taxes include creditable withholding taxes, input VAT and real property taxes. Prepaid benefit costs represent excess of fair value of plan assets over present value of defined benefit obligations less unrecognized net actuarial gains or losses recognized in our consolidated statements of financial position. See Note 24 – Employee Benefits.
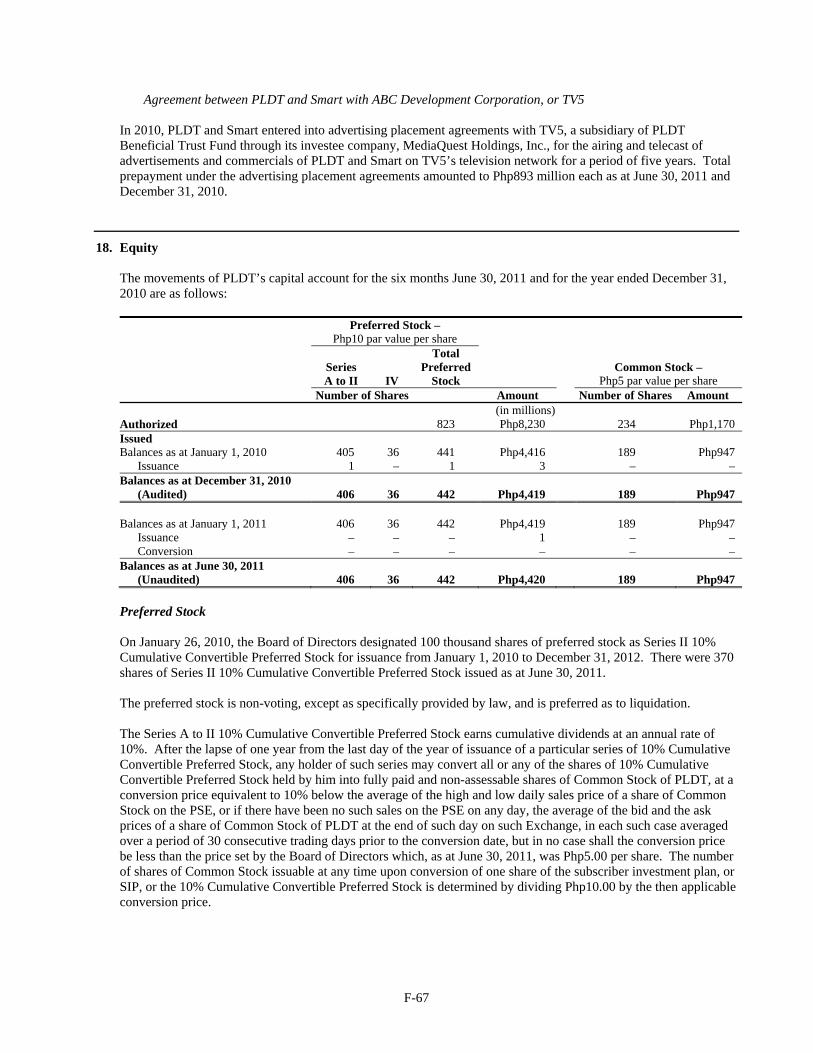
F-67
Agreement between PLDT and Smart with ABC Development Corporation, or TV5
In 2010, PLDT and Smart entered into advertising placement agreements with TV5, a subsidiary of PLDT Beneficial Trust Fund through its investee company, MediaQuest Holdings, Inc., for the airing and telecast of advertisements and commercials of PLDT and Smart on TV5’s television network for a period of five years. Total prepayment under the advertising placement agreements amounted to Php893 million each as at June 30, 2011 and December 31, 2010.
18. Equity
The movements of PLDT’s capital account for the six months June 30, 2011 and for the year ended December 31, 2010 are as follows:
Preferred Stock –
Php10 par value per share
Series A to II IV
Total Preferred
Stock Common Stock –
Php5 par value per share Number of Shares Amount Number of Shares Amount (in millions) Authorized 823 Php8,230 234 Php1,170 Issued Balances as at January 1, 2010 405 36 441 Php4,416 189 Php947
Issuance 1 – 1 3 – – Balances as at December 31, 2010
(Audited) 406 36 442 Php4,419 189 Php947 Balances as at January 1, 2011 406 36 442 Php4,419 189 Php947
Issuance – – – 1 – – Conversion – – – – – –
Balances as at June 30, 2011 (Unaudited) 406 36 442 Php4,420 189 Php947
Preferred Stock On January 26, 2010, the Board of Directors designated 100 thousand shares of preferred stock as Series II 10% Cumulative Convertible Preferred Stock for issuance from January 1, 2010 to December 31, 2012. There were 370 shares of Series II 10% Cumulative Convertible Preferred Stock issued as at June 30, 2011. The preferred stock is non-voting, except as specifically provided by law, and is preferred as to liquidation. The Series A to II 10% Cumulative Convertible Preferred Stock earns cumulative dividends at an annual rate of 10%. After the lapse of one year from the last day of the year of issuance of a particular series of 10% Cumulative Convertible Preferred Stock, any holder of such series may convert all or any of the shares of 10% Cumulative Convertible Preferred Stock held by him into fully paid and non-assessable shares of Common Stock of PLDT, at a conversion price equivalent to 10% below the average of the high and low daily sales price of a share of Common Stock on the PSE, or if there have been no such sales on the PSE on any day, the average of the bid and the ask prices of a share of Common Stock of PLDT at the end of such day on such Exchange, in each such case averaged over a period of 30 consecutive trading days prior to the conversion date, but in no case shall the conversion price be less than the price set by the Board of Directors which, as at June 30, 2011, was Php5.00 per share. The number of shares of Common Stock issuable at any time upon conversion of one share of the subscriber investment plan, or SIP, or the 10% Cumulative Convertible Preferred Stock is determined by dividing Php10.00 by the then applicable conversion price.
F-68
In case the shares of Common Stock outstanding are at anytime subdivided into a greater or consolidated into a lesser number of shares, then the minimum conversion price per share of Common Stock will be proportionately decreased or increased, as the case may be, and in the case of a stock dividend, such price will be proportionately decreased, provided, however, that in every case the minimum conversion price shall not be less than the par value per share of Common Stock. In the event the relevant effective date for any such subdivision or consolidation of shares of stock dividend occurs during the period of 30 trading days preceding the presentation of any shares of 10% Cumulative Convertible Preferred Stock for conversion, a similar adjustment will be made in the sales prices applicable to the trading days prior to such effective date utilized in calculating the conversion price of the shares presented for conversion. In case of any other reclassification or change of outstanding shares of Common Stock, or in case of any consolidation or merger of PLDT with or into another corporation, the Board of Directors shall make such provisions, if any, for adjustment of the minimum conversion price and the sale price utilized in calculating the conversion price as the Board of Directors, in its sole discretion, shall deem appropriate. At PLDT’s option, the Series A to II 10% Cumulative Convertible Preferred Stock are redeemable at par value plus accrued dividends five years after the year of issuance. The Series IV Cumulative Non-convertible Redeemable Preferred Stock earns cumulative dividends at an annual rate of 13.5% based on the paid-up subscription price. It is redeemable at the option of PLDT at any time one year after subscription and at the actual amount paid for such stock, plus accrued dividends. On July 5, 2011, the Board of Directors of PLDT approved the amendments to the Seventh Article of PLDT’s Articles of Incorporation consisting of the sub-classification of its authorized Preferred Capital Stock into: 150 million shares of Voting Preferred Stock with a par value of Php1.00 each, and 807.5 million shares of Non-Voting Serial Preferred Stock with a par value of Php10.00 each, and other conforming amendments (the “Amendments”). The shares of Voting Preferred Stock may be issued, owned, or transferred only to or by: (a) a citizen of the Philippines or a domestic partnership or association wholly-owned by citizens of the Philippines; (b) a corporation organized under the laws of the Philippines of which at least 60% of the capital stock entitled to vote is owned and held by citizens of the Philippines and at least 60% of the Board of Directors of such corporation are citizens of the Philippines; and (c) a trustee of funds for pension or other employee retirement or separation benefits, where the trustee qualifies under paragraphs (a) and (b) above and at least 60% of the funds accrue to the benefit of citizens of the Philippines (a “Qualified Owner”). The holders of Voting Preferred Stock shall have voting rights at any meeting of the stockholders of PLDT for the election of directors and for all other purposes, with one vote in respect of each share of Voting Preferred Stock. A special meeting of stockholders will be held on September 20, 2011 for purposes of presenting and obtaining stockholders’ approval of the Amendments. After the approval of the Amendments by the stockholders and the Philippine Securities and Exchange Commission, the Board of Directors, pursuant to the authority granted to it in the Seventh Article of PLDT’s Articles of Incorporation, may determine the specific terms, features and limitations of the Voting Preferred Stock and, as it deems necessary to protect the interest of PLDT and its stakeholders, authorize the issuance of shares of Voting Preferred Stock to Qualified Owners. It is contemplated that the shares of Voting Preferred Stock will have the following other features: (a) entitled to dividends at such rate to be determined by the Board of Directors, payable before any dividends are paid to the holders of Common Stock; (b) not convertible to Common Stock or to any shares of stock of PLDT of any class; (c) redeemable at the option of PLDT; (d) holders will have no pre-emptive right to subscribe or purchase any shares of stock of any class, or convertible debt, securities or warrants issued, sold or disposed by PLDT; and (e) in the event of dissolution or liquidation or winding up of PLDT, holders will be entitled to be paid in full, or pro-rata insofar as the assets of PLDT will permit, the par value of such shares of Voting Preferred Stock and any accrued or unpaid dividends thereon before any distribution shall be made to holders of shares of Common Stock. All preferred stocks limit the ability of PLDT to pay cash dividends unless all dividends on such preferred stock for all past dividend payment periods have been paid and or declared and set apart and provision has been made for the currently payable dividends.

F-69
Common Stock In 2008, the Board of Directors approved a share buyback program of up to five million shares of PLDT’s common stock, representing approximately 3% of PLDT’s total outstanding shares of common stock. The share buyback program reflects PLDT’s commitment to capital management as an important element in enhancing shareholder value. This also reinforces initiatives that PLDT has already undertaken such as the declaration of special dividends on common stock in addition to the regular dividend payout equivalent to 70% of our core earnings per share, after having determined that PLDT has the capacity to pay additional returns to shareholders. Under the share buyback program, PLDT reacquired shares on an opportunistic basis, directly from the open market through the trading facilities of the PSE and NYSE. We had acquired a total of approximately 2.72 million shares of PLDT’s common stock at a weighted average price of Php2,388 per share for a total consideration of Php6,505 million in accordance with the share buyback program as at June 30, 2011 and December 31, 2010. See Note 8 – Earnings Per Common Share and Note 26 – Financial Assets and Liabilities. Dividends Declared Our dividends declared for the six months ended June 30, 2011 and 2010 are detailed as follows: June 30, 2011 (Unaudited) Date Amount
Class Approved Record Payable Per Share Total (in million pesos)10% Cumulative Convertible Preferred Stock
Series CC January 25, 2011 February 24, 2011 March 31, 2011 Php1.00 17 Series DD January 25, 2011 February 10, 2011 February 28, 2011 1.00 3 Series FF January 25, 2011 February 10, 2011 February 28, 2011 1.00 – Series GG January 25, 2011 February 24, 2011 March 31, 2011 1.00 – Series EE March 29, 2011 April 28, 2011 May 31, 2011 1.00 – Series HH March 29, 2011 April 28, 2011 May 31, 2011 1.00 –
20 Cumulative Non-convertible Redeemable
Preferred Stock Series IV* January 25, 2011 February 18, 2011 March 15, 2011 Php– 12 May 10, 2011 May 27, 2011 June 15, 2011 – 12 24
Common Stock Regular Dividend March 1, 2011 March 16, 2011 April 19, 2011 Php78.00 14,567 Special Dividend March 1, 2011 March 16, 2011 April 19, 2011 66.00 12,326 26,893 26,937
___________________ * Dividends were declared based on total amount paid up.

F-70
June 30, 2010 (Unaudited)
Date Amount Class Approved Record Payable Per Share Total
(in million pesos)10% Cumulative Convertible Preferred Stock
Series CC January 26, 2010 February 25, 2010 March 31, 2010 Php1.00 17 Series DD January 26, 2010 February 11, 2010 February 26, 2010 1.00 2 Series EE March 26, 2010 April 30, 2010 May 31, 2010 1.00 –
19
Cumulative Non-Convertible Redeemable Preferred Stock Series IV* January 26, 2010 February 19, 2010 March 15, 2010 Php– 12 May 13, 2010 May 27, 2010 June 15, 2010 – 13
25 Common Stock
Regular Dividend March 2, 2010 March 17, 2010 April 20, 2010 Php76.00 14,197 Special Dividend March 2, 2010 March 17, 2010 April 20, 2010 65.00 12,142
26,339 Charged to retained earnings 26,383
___________________
* Dividends are declared based on total amount paid up. Our dividends declared after June 30, 2011 are detailed as follows: Date Amount
Class Approved Record Payable Per Share Total (in million pesos)Cumulative Non-convertible Redeemable
Preferred Stock Series IV* August 2, 2011 August 18, 2011 September 15, 2011 Php– 13
10% Cumulative Convertible Preferred Stock Series W July 5, 2011 August 3, 2011 August 31, 2011 Php1.00 49 Series AA July 5, 2011 August 3, 2011 August 31, 2011 1.00 42 Series V August 2, 2011 September 1, 2011 September 30, 2011 1.00 39 Series Z August 2, 2011 September 1, 2011 September 30, 2011 1.00 37 Series BB July 5, 2011 August 3, 2011 August 31, 2011 1.00 21 Series Q August 2, 2011 September 1, 2011 September 30, 2011 1.00 11 Series R July 5, 2011 August 3, 2011 August 31, 2011 1.00 9 Series I July 5, 2011 August 3, 2011 August 31, 2011 1.00 5 Series A July 5, 2011 August 3, 2011 August 31, 2011 1.00 2 Series F August 2, 2011 September 1, 2011 September 30, 2011 1.00 2 Series B August 2, 2011 September 1, 2011 September 30, 2011 1.00 1 218
Common Stock Regular Dividend August 2, 2011 August 31, 2011 September 27, 2011 Php78.00 14,567 14,798
___________________ * Dividends were declared based on total amount paid up.

F-71
19. Interest-bearing Financial Liabilities
As at June 30, 2011 and December 31, 2010, this account consists of the following: 2011 2010 (Unaudited) (Audited) (in million pesos) Long-term portion of interest-bearing financial liabilities:
Long-term debt (Notes 4, 5, 9, 22 and 26) 71,710 75,879 Obligations under finance leases (Notes 3, 4, 5, 22 and 26) 7 9
71,717 75,888 Current portion of interest-bearing financial liabilities:
Long-term debt maturing within one year (Notes 4, 5, 9, 22 and 26) 21,792 13,767 Notes payable (Notes 4, 5, 22 and 26) 651 – Obligations under finance leases maturing within one year (Notes 3, 4, 5, 22 and 26) 6 34
22,449 13,801 Unamortized debt discount, representing debt issuance costs and any difference between the fair value of consideration given or received at initial recognition, included in the financial liabilities as at June 30, 2011 and December 31, 2010 are as follows: 2011 2010 (Unaudited) (Audited) (in million pesos) Long-term debt (Note 26) 2,492 2,944 Obligation under finance lease 1 1 Unamortized debt discount at end of period 2,493 2,945 The following table describes all changes to unamortized debt discount for the six months ended June 30, 2011 and for the year ended December 31, 2010.
2011 2010 (Unaudited) (Audited)
(in million pesos) Unamortized debt discount at beginning of period 2,945 3,861 Revaluations during the period 68 (16)Additions during the period 10 114 Accretion during the period included as part of “Financing costs – net –
Accretion on financial liabilities – net” (Note 5) (530) (1,014)Unamortized debt discount at end of period 2,493 2,945

F-72
Long-term Debt As at June 30, 2011 and December 31, 2010, long-term debt consists of:
2011 2010 Description Interest Rates (Unaudited) (Audited)
(in millions) U.S. Dollar Debts:
Export Credit Agencies-Supported Loans: Finnvera, Plc, or Finnvera 2.99% and US$ LIBOR + 1.35% in 2011
and 2.99% and US$ LIBOR + 0.05% to 1.35% in 2010
US$73 Php3,149 US$82 Php3,590
Exportkreditnamnden, or EKN 3.79% in 2011 and 2010 12 508 14 613 85 3,657 96 4,203
Fixed Rate Notes 8.35% to 11.375% in 2011 and 2010 376 16,319 375 16,450 Term Loans:
Debt Exchange Facility 2.25% in 2011 and 2010 231 10,013 223 9,791 GSM Network Expansion Facilities 4.70% and US$ LIBOR + 0.42% to
1.85% in 2011 and 4.515% to 4.70% and US$ LIBOR + 0.42% to 1.85% in 2010
74 3,188 97 4,230
Others 2.79% + swap rate and US$ LIBOR + 0.42% to 0.50% in 2011 and 2010
66 2,882 85 3,740
US$832 36,059 US$876 38,414 Philippine Peso Debts:
Corporate Notes 5.625% to 9.1038% and PDST-F + 1.25% in 2011 and 2010
35,659 29,677
Term Loans: Unsecured Term Loans
5.8308% to 8.6271% and PDST-F + 0.30% in 2011 and 6.125% to 8.7792% and PDST-F + 0.30% to 1.50% in 2010
21,684 21,439
Secured Term Loans PDST-F + 1.375% and AUB’s prime rate in 2011 and 2010
100 116
57,443 51,232 Total long-term debt 93,502 89,646 Less portion maturing within one year (Note 26) 21,792 13,767 Noncurrent portion of long-term (Note 26) Php71,710 Php75,879 ___________________ Note: Amounts presented are net of unamortized debt discount and debt issuance costs. The scheduled maturities of our consolidated outstanding long-term debt at nominal values as at June 30, 2011 are as follows:
U.S. Dollar Debt Php Debt Total Year In U.S. Dollar In Php In Php In Php (in millions) 2011(1) 51 2,223 4,278 6,501 2012 234 10,124 9,177 19,301 2013 59 2,542 8,578 11,120 2014 305 13,232 6,175 19,407 2015 and onwards 239 10,375 29,290 39,665 888 38,496 57,498 95,994 ___________________ (1) July 1, 2011 through December 31, 2011.
F-73
U.S. Dollar Debts: Export Credit Agencies-Supported Loans In order to acquire imported components for our network infrastructure in connection with our expansion and service improvement programs, we obtained loans extended and/or guaranteed by various export credit agencies.
Finnvera, Plc, or Finnvera On May 14, 2009, Smart signed a US$50 million five-year term facility to finance the Phase 10 (Extension) GSM equipment and services contract with Finnish Export Credit, Plc guaranteed by Finnvera and awarded to Calyon as the Arranger. The facility was drawn on July 15, 2009. The loan is payable over five years in ten equal semi-annual payments. The amounts of US$34 million, or Php1,481 million, and US$39 million, or Php1,703 million, both net of unamortized debt discount, remained outstanding as at June 30, 2011 and December 31, 2010, respectively. On October 9, 2009, Smart signed a US$50 million five-year term loan facility to finance GSM equipment and services contracts with Finnish Export Credit, Plc guaranteed by Finnvera, the Finnish Export Credit Agency, for 100% political and commercial risk cover. The facility was awarded to Citicorp as the Arranger and was drawn on April 7, 2010 and was subsequently transferred to ANZ on January 4, 2011. The loan is payable over five years in ten equal semi-annual payments. The amounts of US$39 million, or Php1,668 million, and US$43 million, or Php1,887 million, both net of unamortized debt discount, remained outstanding as at June 30, 2011 and December 31, 2010, respectively.
Exportkreditnamnden, or EKN On November 25, 2008, Smart signed a US$22 million five-year term loan facility to finance the supply, installation, commissioning and testing of Wireless-Code Division Multiple Access, or W-CDMA/High Speed Packet Access project with Nordea Bank AB as Original Lender, Arranger and Facility Agent and subsequently assigned its rights and obligations to the Swedish Export Credit Corporation (AB Svensk Exportkredit) supported by EKN on December 10, 2008. The amounts of US$8 million, US$13 million and US$1 million were drawn on December 15, 2008, August 5, 2009 and September 1, 2009, respectively. This facility is payable semi-annually in ten equal installments commencing six months from December 10, 2008. The outstanding balance under the facility amounted to US$12 million, or Php508 million, and US$14 million, or Php613 million, both net of unamortized debt discount, as at June 30, 2011 and December 31, 2010, respectively. On June 10, 2011, Smart signed a US$49 million five-year term loan facility to finance the supply and services contracts for the modernization and expansion project with Nordea Bank AB as Original Lender, Arranger and Facility Agent which will subsequently assign its rights and obligations to the Swedish Export Credit Corporation (AB Svensk Exportkredit) guaranteed by EKN. This facility is payable semi-annually in ten equal installments commencing six months after the applicable mean commissioning date. No availment has been made on this facility as at June 30, 2011. Fixed Rate Notes PLDT has the following non-amortizing fixed rate notes outstanding as at June 30, 2011 and December 31, 2010:
2011 2010 Principal Amount Interest Rate Maturity Date (Unaudited) (Audited) (in millions) US$234,259,000 8.350% March 6, 2017 US$232 Php10,052 US$231 Php10,149 US$145,789,000 11.375% May 15, 2012 144 6,267 144 6,301 US$376 Php16,319 US$375 Php16,450
F-74
Term Loans
US$283 Million Term Loan Facility, or Debt Exchange Facility On July 2, 2004, Smart acquired from PCEV’s creditors approximately US$289 million, or 69.4%, the aggregate of PCEV’s outstanding restructured debt at that time, in exchange for Smart debt and a cash payment by Smart. In particular, Smart paid an amount in cash of US$1.5 million, or Php84 million and issued new debt of US$283.2 million, or Php15,854 million, at fair value of Php8,390 million, net of unamortized debt discount amounting to Php7,464 million. The outstanding balance of the Facility amounted to US$231 million, or Php10,013 million, and US$223 million, or Php9,791 million, both net of unamortized debt discount, as at June 30, 2011 and December 31, 2010, respectively. The Facility will be payable in full on June 30, 2014.
GSM Network Expansion Facilities On August 8, 2005, Smart signed a US$30 million commercial facility with Nordic Investment Bank to partly finance the related Phase 8 GSM equipment and services contracts. The facility is a five-year term loan payable semi-annually in ten equal installments with final repayment on July 11, 2011. The facility was drawn on July 11, 2006 for the full amount of US$30 million. The amounts of US$3 million, or Php130 million, and US$6 million, or Php263 million, both net of unamortized debt discount, remained outstanding as at June 30, 2011 and December 31, 2010, respectively. On July 31, 2006, Smart signed a U.S. Dollar term loan facility for US$44.2 million to partly finance the related Phase 9 GSM equipment and services contracts. The Lender is Finnish Export Credit, Plc with ABN AMRO Bank N.V., Standard Chartered Bank, Sumitomo Mitsui Banking Corporation and Mizuho Corporate Bank Ltd. as the Lead Arrangers. The facility is a five-year term loan payable in ten equal semi-annual installments with final repayment on July 15, 2011. The facility was drawn on November 10, 2006 for the full amount of US$44.2 million. The amounts of US$4 million, or Php192 million, and US$9 million, or Php387 million, both net of unamortized debt discount, remained outstanding as at June 30, 2011 and December 31, 2010, respectively. On October 16, 2006, Smart signed a U.S. Dollar term loan facility with Metropolitan Bank and Trust Company to finance the related Phase 9 GSM facility for an amount of US$50 million. The facility is a five-year loan payable in 18 equal quarterly installments commencing on the third quarter from initial drawdown date with final repayment on October 10, 2012. The facility was drawn on October 10, 2007 for the full amount of US$50 million. The amounts of US$17 million, or Php723 million, and US$22 million, or Php973 million, both net of unamortized debt discount, remained outstanding as at June 30, 2011 and December 31, 2010, respectively. On October 10, 2007, Smart signed a US$50 million five-year term loan facility to finance the related Phase 10 GSM equipment and service contracts. The facility was awarded to Norddeutsche Landesbank Girozentrale Singapore Branch as the Original Lender with Standard Chartered Bank (Hong Kong) Ltd. as the Facility Agent. The full amount of the facility was drawn on March 10, 2008. The loan is payable over five years in ten equal semi-annual payments with final repayment on March 11, 2013. The amounts of US$20 million, or Php865 million, and US$25 million, or Php1,091 million, both net of unamortized debt discount, remained outstanding as at June 30, 2011 and December 31, 2010, respectively. On November 27, 2008, Smart signed a US$50 million five-year term loan facility to finance the Phase 10 GSM equipment and service contracts with Finnish Export Credit, Plc. The facility was awarded to ABN AMRO Bank N.V., Australia and New Zealand Banking Group Limited, Standard Chartered Bank, Mizuho Corporate Bank Ltd. as the Lead Arrangers. The loan is payable over five years in ten equal semi-annual installments with final repayment on January 23, 2014. The facility was drawn on January 23, 2009 and May 5, 2009 in the amounts of US$5 million and US$45 million, respectively. The amounts of US$30 million, or Php1,289 million, and US$35 million, or Php1,516 million, both net of unamortized debt discount, remained outstanding as at June 30, 2011 and December 31, 2010, respectively. On June 6, 2011, Smart signed a US$60 million five-year term loan facility to finance the equipment and service contracts for the modernization and expansion project with Bank of Tokyo-Mitsubishi UFJ, Ltd. as Lender. The loan is payable over five years in eight equal semi-annual installments with the first installment on the eighteenth month from signing date. No availment has been made on this facility as at June 30, 2011.
F-75
Other Term Loans
On January 15, 2008, PLDT signed a US$100 million term loan facility agreement with Norddeutsche Landesbank Girozentrale Singapore Branch to be used for the capital expenditure requirements of PLDT. Two separate drawings of US$50 million each was drawn from the facility on March 27, 2008 and April 10, 2008 and is payable over five years in ten equal semi-annual installments with final repayment on March 27, 2013. The amounts of US$40 million, or Php1,734 million, and US$50 million, or Php2,191 million, remained outstanding as at June 30, 2011 and December 31, 2010, respectively. On July 15, 2008, PLDT signed a loan agreement amounting to US$50 million with the Bank of the Philippine Islands to refinance its loan obligations which were utilized for service improvements and expansion programs. The initial drawdown under this loan was made on July 21, 2008 in the amount of US$15 million and the balance of US$35 million was drawn on September 30, 2008. This loan is payable in 17 equal quarterly installments commencing on the fourth quarter from initial drawdown date with final repayment on July 22, 2013. The amounts of US$26 million, or Php1,148 million, and US$32 million, or Php1,417 million, remained outstanding as at June 30, 2011 and December 31, 2010, respectively. On September 24, 2008, BOW signed an Islamic finance facility agreement granted by the Bank of London and the Middle East, or BLME, for a total of US$19 million, which will mature on various dates from June 30, 2013 to September 30, 2014. The amount of US$3 million, or Php132 million, remained outstanding as at December 31, 2010 and was paid in full in June 2011. Philippine Peso Debts: Corporate Notes
Php5,000 Million Fixed Rate Corporate Notes On February 15, 2007, Smart issued Php5,000 million fixed rate corporate notes, comprised of Series A five-year notes amounting to Php3,800 million and Series B ten-year notes amounting to Php1,200 million. Proceeds from the issuance of these notes have been used primarily for Smart’s capital expenditures for network improvement and expansion. The amounts of Php4,960 million and Php4,962 million, both net of unamortized debt discount, remained outstanding as at June 30, 2011 and December 31, 2010, respectively.
Php5,000 Million Fixed Rate Corporate Notes On December 12, 2008, Smart issued a five-year term unsecured fixed rate corporate notes amounting to Php5,000 million. The facility has annual amortizations equivalent to 1% of the principal amount with the balance of 96% payable on December 13, 2013. Funds raised from the issuance of these notes were used primarily to finance Smart’s capital expenditures for network upgrade and expansion. The amounts of Php4,872 million and Php4,867 million, both net of unamortized debt discount, remained outstanding as at June 30, 2011 and December 31, 2010, respectively.
Php5,000 Million Fixed Rate Corporate Notes On February 20, 2009, PLDT issued Php5,000 million fixed rate corporate notes under a Notes Facility Agreement dated February 18, 2009, comprised of Series A five-year notes amounting to Php2,390 million, Series B seven-year notes amounting to Php100 million, and Series C ten-year notes amounting to Php2,510 million. Proceeds from the facility were used to finance capital expenditures of PLDT. The aggregate amounts of Php4,952 million and Php4,976 million remained outstanding as at June 30, 2011 and December 31, 2010, respectively.
F-76
Php3,000 Million Corporate Notes On June 29, 2009, Smart signed a Notes Facility Agreement with BDO Private Bank, Inc. amounting to Php3,000 million to finance capital expenditures. The facility is comprised of Php1,000 million Series A1 note payable in full in 1.5 years and Php1,000 million each for Series B1 and B2 notes payable in full in two years. The aggregate amount of Php2,000 million of Series A1 and B1 notes were drawn on July 8, 2009 while the amount of Php1,000 million of Series B2 notes was drawn on September 1, 2009. The aggregate amounts of Php1,999 million and Php2,997 million, both net of unamortized debt discount, remained outstanding as at June 30, 2011 and December 31, 2010, respectively. The Series A1 amounting to Php1,000 million was repaid on January 10, 2011.
Php7,000 Million Fixed Rate Corporate Notes On December 10, 2009, PLDT issued Php7,000 million fixed rate corporate notes under a Notes Facility Agreement dated December 8, 2009, comprised of Series A 5.25-year notes amounting to Php5,050 million, Series B seven-year notes amounting to Php850 million, and Series C ten-year notes amounting to Php1,100 million. Proceeds from the facility were used to finance capital expenditures and/or to refinance its loan obligations which were also used to finance capital expenditures for network expansion and improvement. The aggregate amount of Php6,891 million each remained outstanding as at June 30, 2011 and December 31, 2010.
Php2,500 Million Fixed Rate Corporate Notes On July 13, 2010, PLDT issued Php2,500 million five-year fixed rate corporate notes under a Notes Facility Agreement dated July 12, 2010. The notes are non-amortizing and will mature on July 13, 2015. Proceeds from the facility were used to finance capital expenditures and/or to refinance PLDT’s loan obligations which were also used to finance capital expenditures for network expansion and improvement. The amount of Php2,500 million each remained outstanding as at June 30, 2011 and December 31, 2010.
Php2,500 Million Fixed Rate Corporate Notes On July 13, 2010, Smart issued Php2,500 million five-year fixed rate corporate notes under a Notes Facility Agreement dated July 12, 2010. The notes are non-amortizing and will mature on July 13, 2015. Proceeds from the facility was used primarily to finance Smart’s capital expenditures for network improvement and expansion. The amounts of Php2,485 million and Php2,484 million, net of unamortized debt discount, remained outstanding as at June 30, 2011 and December 31, 2010, respectively.
Php2,000 Million Fixed Rate Corporate Notes On March 9, 2011, Smart signed a Notes Facility Agreement with BDO Private Bank, Inc. amounting to Php2,000 million to finance capital expenditures. Tranche A amounting to Php1,000 million was issued on March 16, 2011. Tranche B amounting to Php1,000 million was issued in multiple drawdowns of Php250 million each, the first of which was on March 24, 2011. On various dates in April 2011, the remaining Php750 million of Tranche B was fully drawn. The aggregate amount of Php2,000 million remained outstanding as at June 30, 2011. The facility is payable in full five years from the respective issue dates.
Php5,000 Million Fixed Rate Corporate Notes
On March 24, 2011, PLDT issued Php5,000 million fixed rate corporate notes under a Notes Facility Agreement dated March 22, 2011, comprised of Series A 5-year notes amounting to Php3,435 million, Series B 7-year notes amounting to Php700 million and Series C ten-year notes amounting to Php865 million. Proceeds from the facilities were used to finance capital expenditures for network expansion and improvement and/or to refinance existing debt obligations which were also used to finance service improvements and expansion programs. The amount of Php5,000 million remained outstanding as at June 30, 2011.

F-77
Term Loans
Unsecured Term Loans
Php2,500 Million Term Loan Facility On August 14, 2006, Smart signed a Philippine Peso term loan facility with Metropolitan Bank and Trust Company amounting to Php2,500 million to finance the related Phase 9 GSM facility. The facility is payable over five years in 18 equal quarterly installments commencing on the third quarter from initial drawdown date with final repayment on December 9, 2011. The facility was drawn on December 11, 2006. The amounts of Php278 million and Php555 million, both net of unamortized debt discount, remained outstanding as at June 30, 2011 and December 31, 2010, respectively.
Php2,500 Million Term Loan Facility On October 21, 2008, Smart signed a Philippine Peso term loan facility with Metropolitan Bank and Trust Company to finance capital expenditures for an amount of Php2,500 million, which was drawn in full on November 13, 2008. The facility is payable over five years in 16 equal consecutive quarterly installments commencing on the fifth quarter from the date of the first drawdown with final repayment on November 13, 2013. The amounts of Php1,559 million and Php1,870 million, both net of unamortized debt discount, remained outstanding as at June 30, 2011 and December 31, 2010, respectively.
Php2,400 Million Term Loan Facility On November 21, 2008, PLDT signed a loan agreement with Land Bank of the Philippines amounting to Php2,400 million to finance capital expenditures and/or to refinance its loan obligations which were utilized for service improvements and expansion programs. The initial drawdown under this loan was made on December 12, 2008 in the amount of Php500 million and the balance of Php1,900 million was subsequently drawn on May 20, 2009 and July 31, 2009 in two equal Php500 million tranches and on September 15, 2009 in the amount of Php900 million. The loan is payable over five years in ten equal semi-annual installments with final repayment on December 12, 2013. The amounts of Php1,278 million and Php1,533 million remained outstanding as at June 30, 2011 and December 31, 2010, respectively.
Php3,000 Million Term Loan Facility On November 26, 2008, PLDT signed a loan agreement with Union Bank of the Philippines amounting to Php3,000 million to finance capital expenditures and/or to refinance its loan obligations which were utilized for service improvements and expansion programs. The initial drawdown under this loan was made on December 22, 2008 in the amount of Php500 million and the balance of Php2,500 million was subsequently drawn on April 14, 2009. The loan is payable over five years in nine equal semi-annual installments commencing on the second semester from initial drawdown date with final repayment on December 23, 2013. The amounts of Php1,667 million and Php2,000 million remained outstanding as at June 30, 2011 and December 31, 2010, respectively.
Php2,000 Million Term Loan Facility On November 28, 2008, PLDT signed a loan agreement with Philippine National Bank amounting to Php2,000 million to be used for its capital expenditure requirements in connection with PLDT’s service improvement and expansion programs. The initial drawdown under this loan was made on December 19, 2008 in the amount of Php500 million and the balance of Php1,500 million was subsequently drawn on January 30, 2009, February 27, 2009 and March 13, 2009 in three equal Php500 million tranches. The loan is payable over five years in 17 equal quarterly installments commencing on the fourth quarter from initial drawdown date with final repayment on December 19, 2013. The amounts of Php1,176 million and Php1,412 million remained outstanding as at June 30, 2011 and December 31, 2010, respectively.

F-78
Php2,500 Million Term Loan Facility On March 6, 2009, PLDT signed a loan agreement with Banco de Oro Unibank, Inc. amounting to Php2,500 million to finance capital expenditures and/or refinance its loan obligations which were utilized for service improvements and expansion programs. The loan is payable in full upon maturity on April 17, 2014. The amount of Php2,500 million was fully drawn on April 17, 2009 and remained outstanding as at June 30, 2011 and December 31, 2010.
Php1,500 Million Term Loan Facility On May 12, 2009, Smart signed a Philippine Peso term loan facility with Banco de Oro Unibank, Inc. amounting to Php1,500 million to finance capital expenditures which was fully drawn on May 20, 2009. The facility is a three-year loan, payable in full upon maturity on May 20, 2012. The amounts of Php1,496 million and Php1,494 million, both net of unamortized debt discount, remained outstanding as at June 30, 2011 and December 31, 2010, respectively.
Php1,000 Million Term Loan Facility On May 14, 2009, Smart signed a Philippine Peso term loan facility with Asia United Bank amounting to Php1,000 million to finance capital expenditures, which was drawn in full on July 3, 2009. The facility is payable over five years in eight equal semi-annual installments commencing on the eighteenth month from initial drawdown date with final repayment on July 3, 2014. The amount of Php997 million, net of unamortized debt discount, remained outstanding as at December 31, 2010. The debt was paid in full on January 3, 2011.
Php1,000 Million Term Loan Facility On May 15, 2009, Smart signed a Philippine Peso term loan facility with Philippine National Bank amounting to Php1,000 million to finance capital expenditures, which was drawn in full on July 2, 2009. The facility is a seven-year loan, payable in full upon maturity on July 2, 2016. The amount of Php996 million, net of unamortized debt discount, remained outstanding as at December 31, 2010. The debt was paid in full on January 3, 2011.
Php2,500 Million Term Loan Facility On June 8, 2009, PLDT signed a loan agreement with Rizal Commercial Banking Corporation amounting to Php2,500 million to finance capital expenditures and/or refinance its loan obligations which were utilized for service improvements and expansion programs. The facility is payable over seven years with an annual amortization of 1% on the fifth and sixth year from initial drawdown date and the balance payable upon maturity on September 28, 2016. The amount of Php2,500 million was fully drawn on September 28, 2009 and remained outstanding as at June 30, 2011 and December 31, 2010.
Php1,500 Million Term Loan Facility On June 16, 2009, PLDT signed a loan agreement with Allied Banking Corporation amounting to Php1,500 million to finance capital expenditures and/or refinance its loan obligations which were utilized for service improvements and expansion programs. The facility is payable over five years in 17 equal quarterly installments commencing on September 15, 2010 with final repayment on September 15, 2014. The amount of Php1,500 million was fully drawn on September 15, 2009. The amounts of Php1,147 million and Php1,324 million remained outstanding as at June 30, 2011 and December 31, 2010, respectively.
Php500 Million Term Loan Facility On June 29, 2009, PLDT signed a loan agreement with Insular Life Assurance Company, Ltd. amounting to Php500 million to finance capital expenditures and/or refinance its loan obligations which were utilized for service improvements and expansion programs. The loan will mature on July 1, 2016. The amount of Php500 million was fully drawn on July 1, 2009 and remained outstanding as at June 30, 2011 and December 31, 2010.

F-79
Php1,000 Million Term Loan Facility On July 16, 2009, Smart signed a Philippine Peso term loan facility with Metropolitan Bank and Trust Company to finance capital expenditures for an amount of Php1,000 million, which was drawn in full on August 3, 2009. The facility is payable over five years in 16 equal consecutive quarterly installments commencing on the fifth quarter from the date of the first drawdown with final repayment on August 1, 2014. The amounts of Php812 million and Php935 million, both net of unamortized debt discount, remained outstanding as at June 30, 2011 and December 31, 2010, respectively.
Php2,000 Million Term Loan Facility On September 18, 2009, PLDT signed a loan agreement with Bank of the Philippine Islands amounting to Php2,000 million to finance capital expenditures and/or refinance its loan obligations which were utilized for service improvements and expansion programs. The facility is payable over five years in 17 equal quarterly installments with final repayment on October 27, 2014. The initial drawdown under this loan was made on October 26, 2009 in the amount of Php1,000 million and the balance of Php1,000 million was subsequently drawn on December 4, 2009. The amounts of Php1,647 million and Php1,882 million remained outstanding as at June 30, 2011 and December 31, 2010, respectively.
Php1,000 Million Term Loan Facility On November 23, 2009, PLDT signed a loan agreement with Bank of the Philippine Islands amounting to Php1,000 million to finance capital expenditures and/or refinance its obligations which were utilized for service improvements and expansion programs. The facility is payable over five years in 17 equal quarterly installments with final repayment on December 18, 2014. The amount of Php1,000 million was fully drawn on December 18, 2009. The amounts of Php824 million and Php941 million remained outstanding as at June 30, 2011 and December 31, 2010, respectively.
Php1,500 Million Term Loan Facility On March 15, 2011, Smart signed a Philippine Peso term loan facility with Metropolitan Bank and Trust Company to finance capital expenditures for an amount of Php1,500 million, which was drawn in full on March 22, 2011 and remained outstanding as at June 30, 2011. The facility is a five-year loan, payable in full upon maturity on March 22, 2016.
Php2,000 Million Term Loan Facility On March 24, 2011, Smart signed a Philippine Peso term loan facility with Philippine National Bank to finance capital expenditures for an amount of Php2,000 million, which was drawn in full on March 29, 2011 and remained outstanding as at June 30, 2011. The facility is a five-year loan, payable in full upon maturity on March 29, 2016.
Php300 Million Term Loan Facility On April 4, 2011, PLDT signed a loan agreement with the Manufacturers Life Insurance Co. (Phils.), Inc. amounting to Php300 million to finance capital expenditures and/or refinance its existing loan obligations which were utilized for service improvements and expansion programs. The loan is payable in full upon maturity on April 29, 2016. The amount of Php300 million was fully drawn on April 28, 2011 and remained outstanding as at June 30, 2011.
Php500 Million Term Loan Facility
On April 4, 2011, PLDT signed a loan agreement with the Manufacturers Life Insurance Co. (Phils.), Inc. amounting to Php500 million to finance capital expenditures and/or refinance its existing loan obligations which were utilized for service improvements and expansion programs. The loan is payable in full upon maturity on June 17, 2016. The amount of Php500 million was fully drawn on June 16, 2011 and remained outstanding as at June 30, 2011.

F-80
Secured Term Loans
Php150 Million Term Loan Facility On June 7, 2007, BayanTrade obtained a medium term loan facility with Bank of the Philippine Islands amounting to Php150 million, which was fully availed of in December 2007. Each interest period will cover a 90-day period commencing on the initial drawdown date and the interest rate will be determined at the first day of each interest period and payable at the end of the interest period. The loan facility was obtained to facilitate the purchase of a subsidiary and to support its working capital requirements. The aggregate loan amount is due as follows: (a) 20% within the third year from first drawdown date; (b) 20% within the fourth year from first drawdown date; and (c) 60% within the fifth year from first drawdown date. BayanTrade is given a right to repay the principal and the interest accruing thereon on each interest payment date or interest rate setting date without any prepayment penalty. BayanTrade and the bank has agreed to the following terms: (a) pledge of BayanTrade’s shares of stock of the subsidiary purchased at a collateral loan ratio of 2:1; (b) assignment of receivables at a collateral-to-loan of 2:1; and (c) negative pledge on other present and future assets of BayanTrade. The outstanding principal balance of the loan was Php98 million and Php113 million as at June 30, 2011 and December 31, 2010, respectively.
Php8 Million Term Loan Facility On March 31, 2009, Level Up! secured a three-year loan facility with Asia United Bank amounting to Php8 million maturing on March 30, 2012. Principal is payable in twelve equal successive quarterly installments of Php673 thousand starting June 30, 2009 and every quarter thereafter. This loan has a floating interest rate payable every 30 days starting April 30, 2009. The loan is secured by the equipment where the proceeds of the loan were used. The outstanding principal balance of the loan was Php2 million and Php3 million as at June 30, 2011 and December 31, 2010, respectively. Notes Payable On April 1, 2011, SPi availed of short-term loans from Bank of the Philippine Islands and Security Banking Corporation amounting to US$7 million and US$8 million, respectively. Proceeds of the loans were used for working capital requirements. Interest rate on each loan is repriced every month. The aggregate amount of US$15 million, or Php651 million, remained outstanding as at June 30, 2011. Debt Covenants Our debt instruments contain restrictive covenants, including covenants that require us to comply with specified financial ratios and other financial tests, calculated in conformity with PFRS at relevant measurement dates, principally at the end of each quarterly period. We have complied with all of our maintenance financial ratios as required under our loan covenants and other debt instruments. The principal factors that can negatively affect our ability to comply with these financial ratios and other financial tests are depreciation of the Philippine peso relative to the U.S. dollar, poor operating performance of PLDT and its consolidated subsidiaries, impairment or similar charges in respect of investments or other long-lived assets that may be recognized by PLDT and its consolidated subsidiaries, and increases in our interest expense. Interest expense may increase as a result of various factors including issuance of new debt, the refinancing of lower cost indebtedness by higher cost indebtedness, depreciation of the Philippine peso, the lowering of PLDT’s credit ratings or the credit ratings of the Philippines, increase in reference interest rates, and general market conditions. Since approximately 39% of PLDT’s total consolidated debts as at June 30, 2011 were denominated in foreign currencies, principally in U.S. dollars, many of these financial ratios and other tests are negatively affected by any weakening of the Philippine peso. PLDT’s debt instruments contain a number of other negative covenants that, subject to certain exceptions and qualifications, restrict PLDT’s ability to take certain actions without lenders’ approval, including: (a) incurring additional indebtedness; (b) disposing of all or substantially all of its assets or of assets in excess of specified thresholds of its tangible net worth; (c) creating any lien or security interest; (d) permitting set-off against amounts owed to PLDT; (e) merging or consolidating with any other company; (f) entering into transactions with stockholders and affiliates; and (g) entering into sale and leaseback transactions.
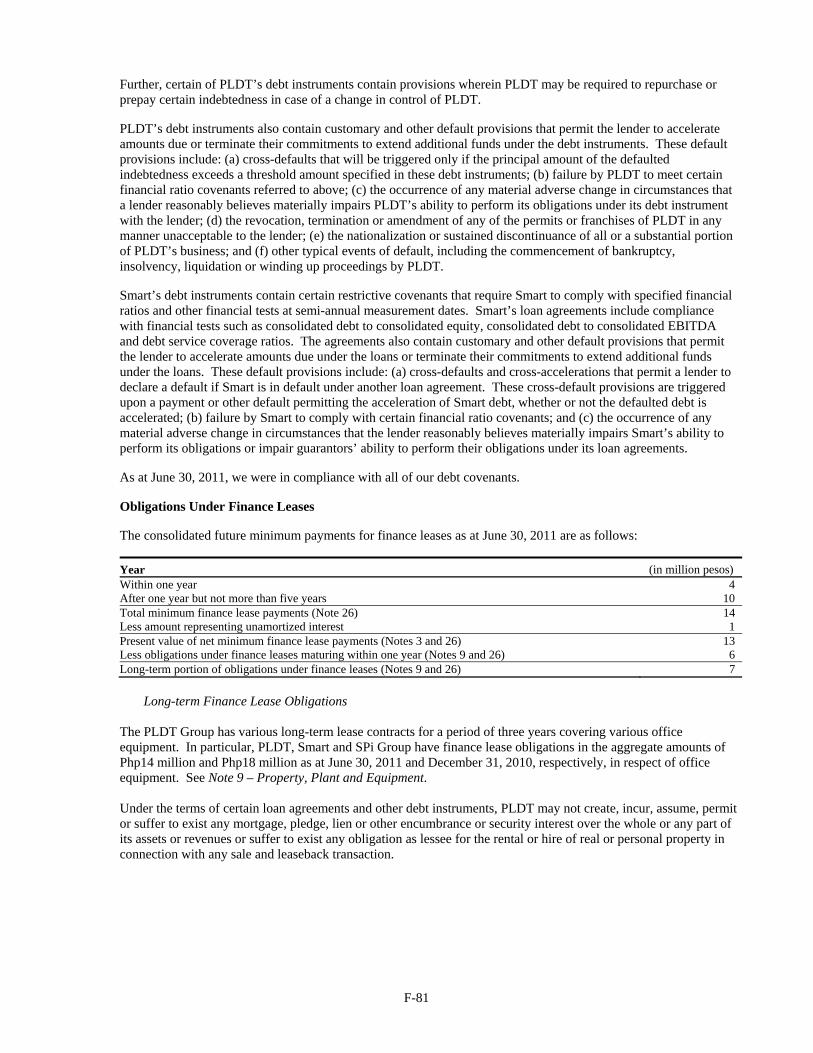
F-81
Further, certain of PLDT’s debt instruments contain provisions wherein PLDT may be required to repurchase or prepay certain indebtedness in case of a change in control of PLDT. PLDT’s debt instruments also contain customary and other default provisions that permit the lender to accelerate amounts due or terminate their commitments to extend additional funds under the debt instruments. These default provisions include: (a) cross-defaults that will be triggered only if the principal amount of the defaulted indebtedness exceeds a threshold amount specified in these debt instruments; (b) failure by PLDT to meet certain financial ratio covenants referred to above; (c) the occurrence of any material adverse change in circumstances that a lender reasonably believes materially impairs PLDT’s ability to perform its obligations under its debt instrument with the lender; (d) the revocation, termination or amendment of any of the permits or franchises of PLDT in any manner unacceptable to the lender; (e) the nationalization or sustained discontinuance of all or a substantial portion of PLDT’s business; and (f) other typical events of default, including the commencement of bankruptcy, insolvency, liquidation or winding up proceedings by PLDT. Smart’s debt instruments contain certain restrictive covenants that require Smart to comply with specified financial ratios and other financial tests at semi-annual measurement dates. Smart’s loan agreements include compliance with financial tests such as consolidated debt to consolidated equity, consolidated debt to consolidated EBITDA and debt service coverage ratios. The agreements also contain customary and other default provisions that permit the lender to accelerate amounts due under the loans or terminate their commitments to extend additional funds under the loans. These default provisions include: (a) cross-defaults and cross-accelerations that permit a lender to declare a default if Smart is in default under another loan agreement. These cross-default provisions are triggered upon a payment or other default permitting the acceleration of Smart debt, whether or not the defaulted debt is accelerated; (b) failure by Smart to comply with certain financial ratio covenants; and (c) the occurrence of any material adverse change in circumstances that the lender reasonably believes materially impairs Smart’s ability to perform its obligations or impair guarantors’ ability to perform their obligations under its loan agreements. As at June 30, 2011, we were in compliance with all of our debt covenants. Obligations Under Finance Leases The consolidated future minimum payments for finance leases as at June 30, 2011 are as follows:
Year (in million pesos) Within one year 4 After one year but not more than five years 10 Total minimum finance lease payments (Note 26) 14 Less amount representing unamortized interest 1 Present value of net minimum finance lease payments (Notes 3 and 26) 13 Less obligations under finance leases maturing within one year (Notes 9 and 26) 6 Long-term portion of obligations under finance leases (Notes 9 and 26) 7
Long-term Finance Lease Obligations
The PLDT Group has various long-term lease contracts for a period of three years covering various office equipment. In particular, PLDT, Smart and SPi Group have finance lease obligations in the aggregate amounts of Php14 million and Php18 million as at June 30, 2011 and December 31, 2010, respectively, in respect of office equipment. See Note 9 – Property, Plant and Equipment. Under the terms of certain loan agreements and other debt instruments, PLDT may not create, incur, assume, permit or suffer to exist any mortgage, pledge, lien or other encumbrance or security interest over the whole or any part of its assets or revenues or suffer to exist any obligation as lessee for the rental or hire of real or personal property in connection with any sale and leaseback transaction.
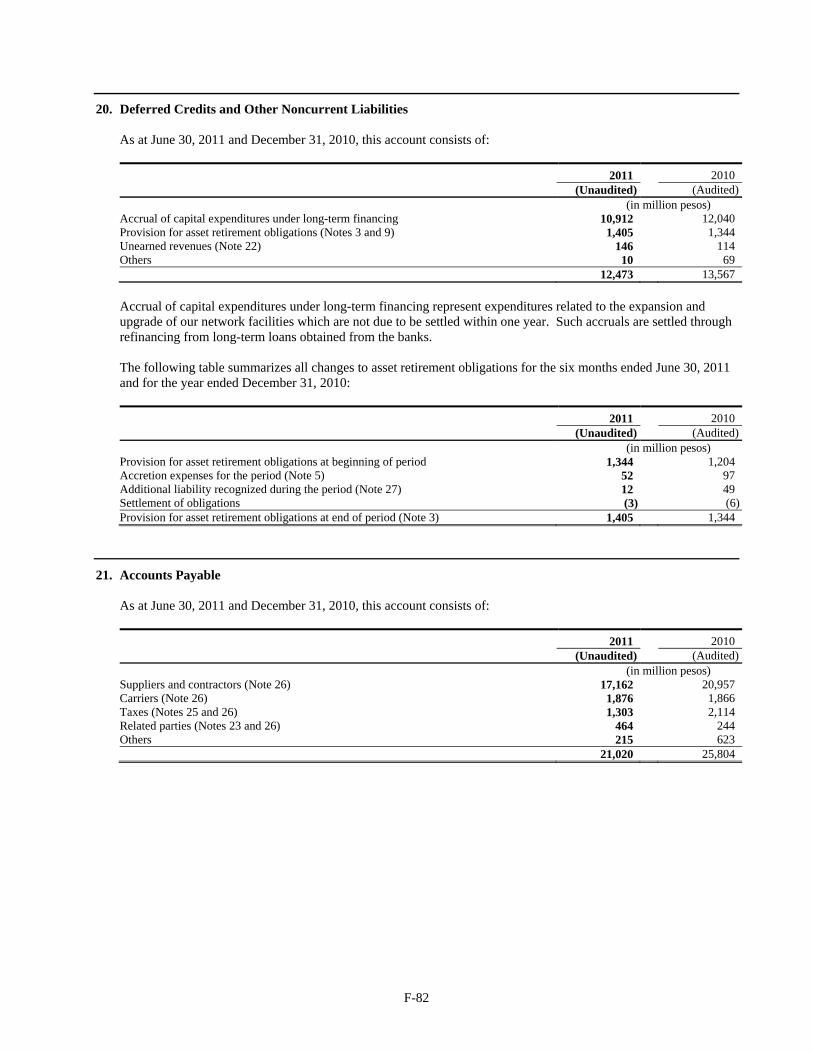
F-82
20. Deferred Credits and Other Noncurrent Liabilities
As at June 30, 2011 and December 31, 2010, this account consists of: 2011 2010 (Unaudited) (Audited) (in million pesos) Accrual of capital expenditures under long-term financing 10,912 12,040 Provision for asset retirement obligations (Notes 3 and 9) 1,405 1,344 Unearned revenues (Note 22) 146 114 Others 10 69 12,473 13,567 Accrual of capital expenditures under long-term financing represent expenditures related to the expansion and upgrade of our network facilities which are not due to be settled within one year. Such accruals are settled through refinancing from long-term loans obtained from the banks. The following table summarizes all changes to asset retirement obligations for the six months ended June 30, 2011 and for the year ended December 31, 2010:
2011 2010 (Unaudited) (Audited)
(in million pesos) Provision for asset retirement obligations at beginning of period 1,344 1,204 Accretion expenses for the period (Note 5) 52 97 Additional liability recognized during the period (Note 27) 12 49 Settlement of obligations (3) (6)Provision for asset retirement obligations at end of period (Note 3) 1,405 1,344
21. Accounts Payable
As at June 30, 2011 and December 31, 2010, this account consists of: 2011 2010 (Unaudited) (Audited) (in million pesos) Suppliers and contractors (Note 26) 17,162 20,957 Carriers (Note 26) 1,876 1,866 Taxes (Notes 25 and 26) 1,303 2,114 Related parties (Notes 23 and 26) 464 244 Others 215 623 21,020 25,804

F-83
22. Accrued Expenses and Other Current Liabilities
As at June 30, 2011 and December 31, 2010, this account consists of: 2011 2010 (Unaudited) (Audited) (in million pesos) Accrued utilities and related expenses (Notes 23 and 26) 21,125 19,941 Unearned revenues (Note 20) 4,702 4,698 Accrued employee benefits (Notes 3, 24 and 26) 4,049 3,853 Accrued taxes and related expenses (Notes 25 and 26) 3,636 2,236 Liability recognized for contingent consideration arising from business acquisitions
(Notes 13 and 20) 1,110 1,632 Accrued interests and other related costs (Notes 19 and 26) 1,027 1,028 Others 1,381 2,571 37,030 35,959 Accrued utilities and related expenses pertain to cost incurred for repairs and maintenance (mostly pertaining to electricity and water consumption), selling and promotions, professional and other contracted services, rent, insurance and security services, and other operational-related expenses pending receipt of billings and statement of accounts from suppliers. Unearned revenues represent advance payments for leased lines, installation fees, monthly service fees and unused and/or unexpired portion of prepaid loads.
Liability Recognized for Contingent Consideration Arising from Business Acquisitions Contingent consideration for business acquisitions was recognized in relation to SPi’s acquisition cost of Springfield and Laguna Medical on April 12, 2007 and August 31, 2009, respectively. See Note 13 – Goodwill and Intangible Assets. SPi acquired 100% of Springfield plus contingent consideration with fair value at acquisition date of US$18 million, or Php894 million. The adjusted fair value of contingent consideration, as revised after effecting adjustments on forecasted earn-out and accretion, amounted to US$24 million, or Php1,024 million, net of advance payment of US$18 million, or Php894 million, and US$35 million, or Php1,547 million, as at June 30, 2011 and December 31, 2010, respectively. SPi acquired 80% of Laguna Medical with a mandatory Put-Call option in respect of the remaining 20% of the outstanding common stock of Laguna Medical. The estimated fair value of the contingent consideration from the mandatory Put-Call option at the acquisition date amounted to US$5.4 million, or Php257 million. The adjusted fair value of contingent consideration after accretion amounted to US$2 million, or Php86 million, and US$2 million, or Php85 million, as at June 30, 2011 and December 31, 2010, respectively. Movements in contingent consideration for business acquisitions for the six months ended June 30, 2011 and for the year ended December 31, 2010 are as follows:
2011 2010 (Unaudited) (Audited) In U.S. Dollar In Php In U.S. Dollar In Php
(in millions) Balance at beginning of period 37 1,632 26 1,207 Business combinations 7 289 8 344 Accretion for the period 1 25 3 163 Payments (19) (817) – (11)Translation and others – (19) – (71)Balance at end of period 26 1,110 37 1,632

F-84
23. Related Party Transactions
a. Air Time Purchase Agreement between PLDT and AIL and Related Agreements
Under the Founder NSP Air Time Purchase Agreement, or ATPA, entered into with AIL in March 1997, which was amended in December 1998 (as amended, the “Original ATPA”), PLDT was granted the exclusive right to sell AIL services, through ACeS Philippines, as national service provider, or NSP, in the Philippines. In exchange, the Original ATPA required PLDT to purchase from AIL a minimum of US$5 million worth of air time (the “Minimum Air Time Purchase Obligation”) annually over ten years commencing on January 1, 2002 (the “Minimum Purchase Period”), the expected date of commercial operations of the Garuda I Satellite. In the event that AIL’s aggregate billed revenue was less than US$45 million in any given year, the Original ATPA also required PLDT to make supplemental air time purchase payments not to exceed US$15 million per year during the Minimum Purchase Period (the “Supplemental Air Time Purchase Obligation”). On February 1, 2007, the parties to the Original ATPA entered into an amendment to the Original ATPA on substantially the terms attached to the term sheet negotiated with the relevant banks (the “Amended ATPA”). Under the Amended ATPA, the Minimum Air Time Purchase Obligation was amended and replaced in its entirety with an obligation of PLDT (the “Amended Minimum Air Time Purchase Obligation”) to purchase from AIL a minimum of US$500 thousand worth of air time annually over a period ending upon the earlier of: (i) the expiration of the Minimum Purchase Period; and (ii) the date on which all indebtedness incurred by AIL to finance the AIL System is repaid. Furthermore, the Amended ATPA unconditionally released PLDT from any obligations arising out of or in connection with the Original ATPA prior to the date of the Amended ATPA, except for obligations to pay for billable units used prior to such date. Total fees under the Amended ATPA amounted to Php59 million and Php65 million for the six months ended June 30, 2011 and 2010, respectively. Under the Amended ATPA, the outstanding obligations of PLDT amounted to Php153 million and Php140 million as at June 30, 2011 and December 31, 2010, respectively. See Note 5 – Income and Expenses.
b. Agreements between PLDT and certain subsidiaries with Meralco In the ordinary course of business, Meralco provides electricity to PLDT and certain subsidiaries’ offices within its franchise area. The rates charged by Meralco are the same as those with unrelated parties. Total electricity costs amounted to Php1,248 million and Php871 million for the six months ended June 30, 2011 and 2010, respectively. Under these agreements, the outstanding utilities payable amounted to Php240 million and Php183 million as at June 30, 2011 and December 31, 2010, respectively. In 2009, PLDT and Smart renewed their respective Pole Attachment Contracts with Meralco, wherein Meralco leases its pole spaces to accommodate PLDT’s and Smart’s cable network facilities. Total fees under these contracts amounted to Php104 million and Php75 million for the six months ended June 30, 2011 and 2010, respectively. Under these agreements, the outstanding obligations amounted to Php6 million and Php111 million as at June 30, 2011 and December 31, 2010, respectively. See also Note 10 – Investments in Associates and Joint Ventures for additional transactions involving Meralco.
c. Transactions with Major Stockholders, Directors and Officers Material transactions to which PLDT or any of its subsidiaries is a party, in which a director, key officer or owner of more than 10% of the outstanding common stock of PLDT, or any member of the immediate family of a director, key officer or owner of more than 10% of the outstanding common stock of PLDT had a direct or indirect material interest, as at June 30, 2011 (unaudited) and December 31, 2010 (audited) and for the six months ended June 30, 2011 and 2010 (unaudited) are as follows:

F-85
1. Cooperation Agreement with First Pacific and certain affiliates, or the FP Parties, NTT Communications
and NTT DoCoMo
In connection with the transfer by NTT Communications of approximately 12.6 million shares of PLDT’s common stock to NTT DoCoMo pursuant to a Stock Sale and Purchase Agreement dated January 31, 2006 between NTT Communications and NTT DoCoMo, the FP Parties, NTT Communications and NTT DoCoMo entered into a Cooperation Agreement, dated January 31, 2006. Under the Cooperation Agreement, the relevant parties extended certain rights of NTT Communications under the Stock Purchase and Strategic Investment Agreement dated September 28, 1999, as amended, and the Shareholders Agreement dated March 24, 2000, to NTT DoCoMo, including:
• certain contractual veto rights over a number of major decisions or transactions; and
• rights relating to the representation on the Board of Directors of PLDT and Smart, respectively, and
any committees thereof.
Moreover, key provisions of the Cooperation Agreement pertain to, among other things:
• Restriction on Ownership of Shares of PLDT by NTT Communications and NTT DoCoMo. Each of NTT Communications and NTT DoCoMo has agreed not to beneficially own, directly or indirectly, in the aggregate with their respective subsidiaries and affiliates, more than 21% of the issued and outstanding shares of PLDT’s common stock. If such event does occur, the FP Parties, as long as they own in the aggregate not less than 21% of the issued and outstanding shares of PLDT’s common stock, have the right to terminate their respective rights and obligations under the Cooperation Agreement, the Shareholders Agreement and the Stock Purchase and Strategic Investment Agreement.
• Limitation on Competition. NTT Communications, NTT DoComo and their respective subsidiaries
are prohibited from investing in excess of certain thresholds in businesses competing with PLDT in respect of customers principally located in the Philippines and from using their assets in the Philippines in such businesses. Moreover, if PLDT, Smart or any of Smart’s subsidiaries intend to enter into any contractual arrangement relating to certain competing businesses, PLDT is required to provide, or to use reasonable efforts to procure that Smart or any of Smart’s subsidiaries provide, NTT Communications and NTT DoCoMo with the same opportunity to enter into such agreement with PLDT or Smart or any of Smart’s subsidiaries, as the case may be.
• Business Cooperation. PLDT and NTT DoCoMo agreed in principle to collaborate with each other
on the business development, roll-out and use of a W-CDMA mobile communication network. In addition, PLDT agreed, to the extent of the power conferred by its direct or indirect shareholding in Smart, to procure that Smart will: (i) become a member of a strategic alliance group for international roaming and corporate sales and services; and (ii) enter into a business relationship concerning preferred roaming and inter-operator tariff discounts with NTT DoCoMo.
• Additional Rights of NTT DoCoMo. Pursuant to amendments effected by the Cooperation Agreement
to the Stock Purchase and Strategic Investment Agreement and the Shareholders Agreement, upon NTT Communications and NTT DoCoMo and their respective subsidiaries owning in the aggregate 20% or more of PLDT’s shares of common stock and for as long as they continue to own in the aggregate at least 17.5% of PLDT’s shares of common stock then outstanding, NTT DoCoMo has additional rights under the Stock Purchase and Strategic Investment Agreement and Shareholders Agreement, including that:
1. NTT DoCoMo is entitled to nominate one additional NTT DoCoMo nominee to the Board of
Directors of each PLDT and Smart;
2. PLDT must consult NTT DoCoMo no later than 30 days prior to the first submission to the board of PLDT or certain of its committees of any proposal of investment in an entity that would primarily engage in a business that would be in direct competition or substantially the same business opportunities, customer base, products or services with business carried on by NTT DoCoMo, or which NTT DoCoMo has announced publicly an intention to carry on;

F-86
3. PLDT must procure that Smart does not cease to carry on its business, dispose of all of its assets, issue common shares, merge or consolidate, or effect winding up or liquidation without PLDT first consulting with NTT DoCoMo no later than 30 days prior to the first submission to the board of PLDT or Smart, or certain of its committees; and
4. PLDT must first consult with NTT DoCoMo no later than 30 days prior to the first
submission to the board of PLDT or certain of its committees for the approval of any transfer by any member of the PLDT Group of Smart common capital stock to any person who is not a member of the PLDT Group.
As at June 30, 2011, NTT Communications and NTT DoCoMo together beneficially owned approximately 21% of PLDT’s outstanding common stock.
• Change in Control. Each of NTT Communications, NTT DoCoMo and the FP Parties agreed that to
the extent permissible under applicable laws and regulations of the Philippines and other jurisdictions, subject to certain conditions, to cast its vote as a shareholder in support of any resolution proposed by the Board of Directors of PLDT for the purpose of safeguarding PLDT from any Hostile Transferee. A “Hostile Transferee” is defined under the Cooperation Agreement to mean any person (other than NTT Communications, NTT DoCoMo, First Pacific or any of their respective affiliates) determined to be so by the PLDT Board of Directors and includes, without limitation, a person who announces an intention to acquire, seeking to acquire or acquires 30% or more of PLDT common shares then issued and outstanding from time to time or having (by itself or together with itself) acquired 30% or more of the PLDT common shares who announces an intention to acquire, seeking to acquire or acquires a further 2% of such PLDT common shares: (a) at a price per share which is less than the fair market value as determined by the Board of Directors of PLDT, as advised by a professional financial advisor; (b) which is subject to conditions which are subjective or which could not be reasonably satisfied; (c) without making an offer for all PLDT common shares not held by it and/or its affiliates and/or persons who, pursuant to an agreement or understanding (whether formal or informal), actively cooperate to obtain or consolidate control over PLDT; (d) whose offer for the PLDT common shares is unlikely to succeed; or (e) whose intention is otherwise not bona fide; provided that, no person will be deemed a Hostile Transferee unless prior to making such determination, the Board of Directors of PLDT has used reasonable efforts to discuss with NTT Communications and NTT DoCoMo in good faith whether such person should be considered a Hostile Transferee.
• Termination. If NTT Communications, NTT DoCoMo or their respective subsidiaries cease to own,
in the aggregate, full legal and beneficial title to at least 10% of the shares of PLDT’s common stock then issued and outstanding, their respective rights and obligations under the Cooperation Agreement and the Shareholders Agreement will terminate and the Strategic Arrangements (as defined in the Stock Purchase and Strategic Investment Agreement) will terminate. If the FP Parties and their respective subsidiaries cease to have, directly or indirectly, effective voting power in respect of shares of PLDT’s common stock representing at least 18.5% of the shares of PLDT’s common stock then issued and outstanding, their respective rights and obligations under the Cooperation Agreement, the Stock Purchase and Strategic Investment Agreement, and the Shareholders Agreement will terminate.
2. Advisory Service Agreement between NTT DoCoMo and PLDT
An Advisory Services Agreement was entered into by NTT DoCoMo and PLDT on June 5, 2006, in accordance with the Cooperation Agreement dated January 31, 2006. Pursuant to the Advisory Services Agreement, NTT DoCoMo will provide the services of certain key personnel in connection with certain aspects of the business of PLDT and Smart. Also, this agreement governs the terms and conditions of the appointments of such key personnel and the corresponding fees related thereto. Total fees under this agreement amounted to Php37 million and Php38 million for the six months ended June 30, 2011 and 2010, respectively. Under this agreement, the outstanding obligations of PLDT amounted to Php13 million each as at June 30, 2011 and December 31, 2010.

F-87
3. Other Agreements with NTT Communications and/or its Affiliates
PLDT is a party to the following agreements with NTT Communications and/or its affiliates:
• Advisory Services Agreement. On March 24, 2000, PLDT entered into an agreement with NTT Communications, as amended on March 31, 2003, March 31, 2005 and June 16, 2006, under which NTT Communications provides PLDT with technical, marketing and other consulting services for various business areas of PLDT starting April 1, 2000;
• Arcstar Licensing Agreement and Arcstar Service Provider Agreement. On March 24, 2000, PLDT
entered into an agreement with NTT Worldwide Telecommunications Corporation under which PLDT markets, and manages data and other services under NTT Communications’ “Arcstar” brand to its corporate customers in the Philippines. PLDT also entered into a Trade Name and Trademark Agreement with NTT Communications under which PLDT has been given the right to use the trade name “Arcstar” and its related trademark, logo and symbols, solely for the purpose of PLDT’s marketing, promotional and sales activities for the Arcstar services within the Philippines;
• Conventional International Telecommunications Services Agreement. On March 24, 2000, PLDT
entered into an agreement with NTT Communications under which PLDT and NTT Communications agreed to cooperative arrangements for conventional international telecommunications services to enhance their respective international businesses; and
• Service Agreement. On February 1, 2008, PLDT entered into an agreement with NTT World
Engineering Marine Corporation wherein the latter provides offshore submarine cable repair and other allied services for the maintenance of PLDT’s domestic fiber optic network submerged plant.
Total fees under these agreements amounted to Php57 million and Php55 million for the six months ended June 30, 2011 and 2010, respectively. Under these agreements, the outstanding obligations of PLDT amounted to Php48 million and Php44 million as at June 30, 2011 and December 31, 2010, respectively.
4. Agreement between Smart and Asia Link B.V., or ALBV
Smart has an existing Technical Assistance Agreement with ALBV, a subsidiary of the First Pacific Group. ALBV provides technical support services and assistance in the operations and maintenance of Smart’s cellular business. The agreement, which upon its expiration on February 23, 2008 was renewed until February 23, 2012 and is subject to further renewal upon mutual agreement of the parties, provides for payment of technical service fees equivalent to 1% of the consolidated net revenues of Smart. Total service fees charged to operations under this agreement amounted to Php297 million and Php313 million for the six months ended June 30, 2011 and 2010, respectively. Under this agreement, the outstanding obligations of Smart amounted to Php244 million and Php90 million as at June 30, 2011 and December 31, 2010, respectively.
5. Agreements Relating to Insurance Companies Gotuaco del Rosario and Associates, or Gotuaco, acts as the broker for certain insurance companies to cover certain insurable properties of the PLDT Group. Insurance premiums are remitted to Gotuaco and the broker’s fees are settled between Gotuaco and the insurance companies. In addition, PLDT has an insurance policy with Malayan Insurance Co., Inc., or Malayan, wherein premiums are directly paid to Malayan. Total insurance expenses under these agreements amounted to Php108 million and Php186 million for the six months ended June 30, 2011 and 2010, respectively. One director of PLDT has direct/indirect interests in or serves as a director/officer of Malayan as at March 31, 2011 and December 31, 2010, while one director of PLDT has direct/indirect interests in or serve as a director/officer of Gotuaco as at December 31, 2010.

F-88
d. Others
See Note 17 – Prepayments for other related party transactions. Compensation of Key Officers of the PLDT Group The compensation of key officers of the PLDT Group by benefit type for the six months ended June 30, 2011 and 2010 are as follows:
2011 2010 (Unaudited)
(in million pesos) Short-term employee benefits 272 279 Share-based payments and other long-term employee benefits (Note 24) 132 134 Post-employment benefits (Note 24) 18 7 Total compensation paid to key officers of the PLDT Group 422 420 Each of the directors, including the members of the advisory board of PLDT, is entitled to a director’s fee in the amount of Php200 thousand for each board meeting attended. Each of the members or advisors of the audit, executive compensation, governance and nomination and technology strategy committees is entitled to a fee in the amount of Php75 thousand for each committee meeting attended. There are no agreements between PLDT Group and any of its key management personnel providing for benefits upon termination of employment, except for such benefits to which they may be entitled under PLDT Group’s retirement and incentive plans. The amounts disclosed in the table are the amounts recognized as an expenses during the reporting period related to key management personnel.
24. Employee Benefits
Pension
Defined Benefit Pension Plans We have defined benefit pension plans, covering substantially all of our permanent and regular employees, excluding those employees of Smart and its subsidiary, I-Contacts, which require contributions to be made to a separate administrative fund. Our actuarial valuation is performed every year-end. Based on the latest actuarial valuation, the actual present value of accrued (prepaid) benefit costs, net periodic benefit costs and average assumptions used in developing the valuation as at June 30, 2011 and December 31, 2010 are as follows: (in million pesos)Present value of defined benefit obligations as at December 31, 2010 (Audited) 14,604 Fair value of plan assets as at December 31, 2010 (Audited) 20,001 Surplus status – net (5,397)Unrecognized net actuarial gains (Note 3) 479 (4,918)Contributions (9) Business combinations (16)Net actuarial pension benefit income during the period (110)Translation adjustments 6 (5,047)Accrued benefit costs as at June 30, 2011 (Unaudited) (Note 3) 446 Prepaid benefit costs as at June 30, 2011 (Unaudited) (Notes 3 and 17) (5,493)
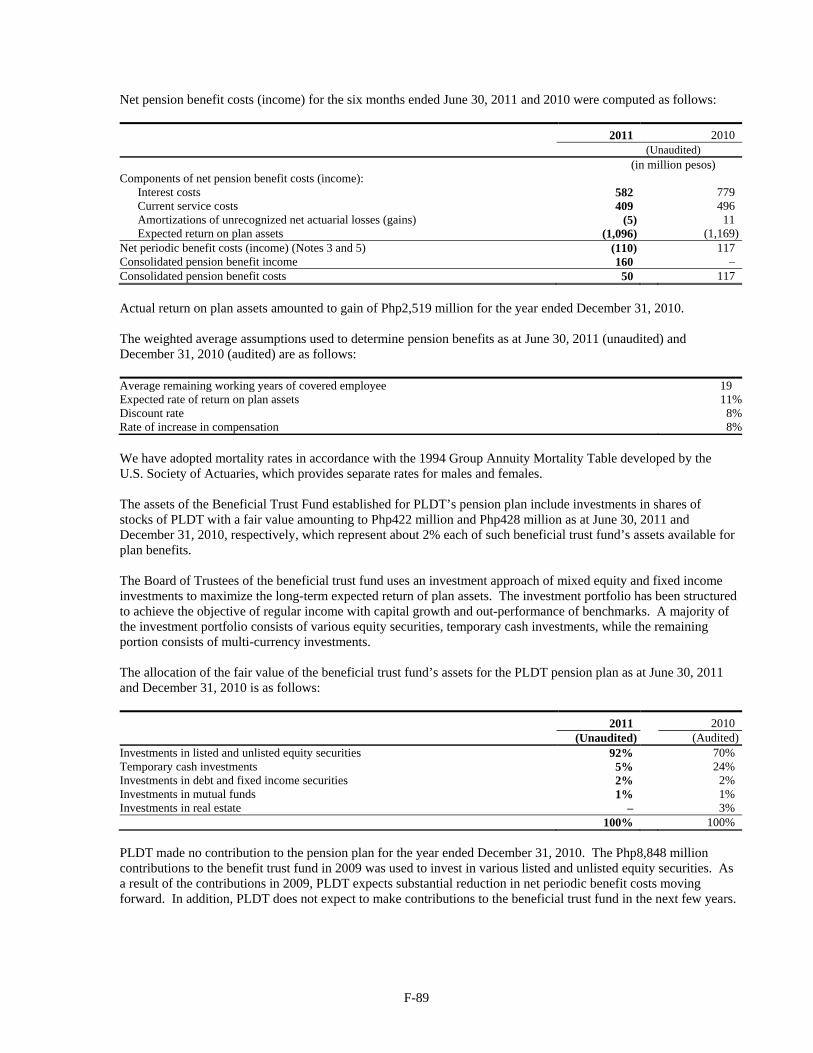
F-89
Net pension benefit costs (income) for the six months ended June 30, 2011 and 2010 were computed as follows: 2011 2010 (Unaudited) (in million pesos) Components of net pension benefit costs (income):
Interest costs 582 779 Current service costs 409 496 Amortizations of unrecognized net actuarial losses (gains) (5) 11 Expected return on plan assets (1,096) (1,169)
Net periodic benefit costs (income) (Notes 3 and 5) (110) 117 Consolidated pension benefit income 160 – Consolidated pension benefit costs 50 117 Actual return on plan assets amounted to gain of Php2,519 million for the year ended December 31, 2010. The weighted average assumptions used to determine pension benefits as at June 30, 2011 (unaudited) and December 31, 2010 (audited) are as follows: Average remaining working years of covered employee 19 Expected rate of return on plan assets 11%Discount rate 8%Rate of increase in compensation 8% We have adopted mortality rates in accordance with the 1994 Group Annuity Mortality Table developed by the U.S. Society of Actuaries, which provides separate rates for males and females. The assets of the Beneficial Trust Fund established for PLDT’s pension plan include investments in shares of stocks of PLDT with a fair value amounting to Php422 million and Php428 million as at June 30, 2011 and December 31, 2010, respectively, which represent about 2% each of such beneficial trust fund’s assets available for plan benefits. The Board of Trustees of the beneficial trust fund uses an investment approach of mixed equity and fixed income investments to maximize the long-term expected return of plan assets. The investment portfolio has been structured to achieve the objective of regular income with capital growth and out-performance of benchmarks. A majority of the investment portfolio consists of various equity securities, temporary cash investments, while the remaining portion consists of multi-currency investments. The allocation of the fair value of the beneficial trust fund’s assets for the PLDT pension plan as at June 30, 2011 and December 31, 2010 is as follows: 2011 2010
(Unaudited) (Audited)Investments in listed and unlisted equity securities 92% 70% Temporary cash investments 5% 24% Investments in debt and fixed income securities 2% 2% Investments in mutual funds 1% 1% Investments in real estate – 3% 100% 100% PLDT made no contribution to the pension plan for the year ended December 31, 2010. The Php8,848 million contributions to the benefit trust fund in 2009 was used to invest in various listed and unlisted equity securities. As a result of the contributions in 2009, PLDT expects substantial reduction in net periodic benefit costs moving forward. In addition, PLDT does not expect to make contributions to the beneficial trust fund in the next few years.

F-90
Defined Contribution Plan Smart and I-Contacts contributions to the plan are made based on the employee’s years of tenure and range from 5% to 10% of the employee’s monthly salary. Additionally, an employee has an option to make a personal contribution to the fund, at an amount not exceeding 10% of his monthly salary. The employer then provides an additional contribution to the fund ranging from 10% to 50% of the employee’s contribution based on the employee’s years of tenure. Although the plan has a defined contribution format, Smart and I-Contacts regularly monitor compliance with R.A. 7641, otherwise known as “The Retirement Pay Law”. As at June 30, 2011 and December 31, 2010, Smart and I-Contacts were in compliance with the requirements of R.A. 7641. The plan’s investment portfolio seeks to achieve regular income and long-term capital growth and consistent performance over its own portfolio benchmark. In order to attain this objective, the trustee’s mandate is to invest in a diversified portfolio of bonds and equities, both domestic and international. The portfolio mix is kept at 60% to 90% for debt and fixed income securities while 10% to 40% is allotted to equity securities. The allocation of the fair value of the beneficial trust fund’s assets for Smart and I-Contacts pension plan as at June 30, 2011 and December 31, 2010 is as follows: 2011 2010
(Unaudited) (Audited)Investments in debt and fixed income securities 64% 58% Investments in listed and unlisted equity securities 34% 37% Others 2% 5% 100% 100% Smart and I-Contacts currently expect to make approximately Php188 million of cash contributions to their pension plans in 2011.
Pension Benefit Costs Net consolidated pension benefit costs (income) for the six months ended June 30, 2011 and 2010 are as follows:
2011 2010 (Unaudited)
(in million pesos) Expense recognized for defined benefit plans 50 117 Expense recognized for defined contribution plans 80 13 Total expense recognized for consolidated pension benefit costs (Notes 3 and 5) 130 130 Consolidated pension benefit income 160 – Net consolidated pension benefit costs (income) (30) 130 Other Long-term Employee Benefits The new LTIP, or 2010 to 2012 LTIP, has been presented to and approved by the ECC and the Board of Directors, and is based on profit targets for the covered Performance Cycle. The cost of 2010 to 2012 LTIP is determined using the projected unit credit method based on assumed discount rates and profit targets. LTIP costs recognized for the six months ended June 30, 2011 and 2010 amounted to Php702 million and Php694 million, respectively. Total outstanding liability and fair value of 2010 to 2012 LTIP cost amounted to Php2,093 million and Php1,392 million as at June 30, 2011 and December 31, 2010, respectively. See Note 3 – Management’s Use of Accounting Judgments, Estimates and Assumptions and Note 5 – Income and Expenses.

F-91
Net periodic benefit costs computed for the six months ended June 30, 2011 and 2010: 2011 2010 (Unaudited) (in million pesos) Components of net periodic benefit costs:
Current service costs 671 680 Interest costs 32 7 Net actuarial loss (gain) (1) 7
Net periodic benefit costs 702 694
25. Provisions and Contingencies
NTC Supervision and Regulation Fees, or SRF
Since 1994, following the rejection of PLDT’s formal protest against the assessments by the NTC of SRF, PLDT and the NTC have been involved in legal proceedings before the Court of Appeals and the Supreme Court. The principal issue in these proceedings was the basis for the computation of the SRF. PLDT’s opinion, which was upheld by the Court of Appeals, but, as set forth below, rejected by the Supreme Court, was that the SRF should be computed based only on the par value of the subscribed or paid up capital of PLDT, excluding stock dividends, premium or capital in excess of par. The Supreme Court, in its decision dated July 28, 1999, ordered the NTC to make a recomputation of the SRF based on PLDT’s capital stock subscribed and paid. Subsequently, in February 2000, the NTC issued an assessment letter for the balance of the SRF, but in calculating said fees, the NTC used as a basis not only capital stock subscribed or paid but also the stock dividends. PLDT questioned the inclusion of the stock dividends in the calculation of the SRF and sought to restrain the NTC from enforcing/implementing its assessment until the resolution of the said issue. Prior to the resolution of the issue mentioned above, PLDT paid the SRF due in 2000 together with the balance due from the recalculation of the SRF and had been paying the SRF due in September of each year thereafter, excluding the portion that was based on stock dividends. The Supreme Court, in a resolution promulgated on December 4, 2007, held that the computation of the SRF should be based on the outstanding capital stock of PLDT, including stock dividends. In a letter to PLDT on February 29, 2008, the NTC assessed PLDT the total amount of Php2,870 million as SRF, which included penalties and interest. On April 3, 2008, PLDT paid NTC the outstanding principal amount relating to SRF on stock dividends in the amount of Php455 million, but did not pay the penalties and interest assessed by the NTC. PLDT, through counsel, believes that it is not liable for penalties and interest, and therefore protested and disputed NTC’s assessments of the same. In letters dated April 14, 2008 and June 18, 2008, the NTC demanded payment of the balance of its assessment. On July 9, 2008, PLDT filed a Petition for Certiorari and Prohibition with the Court of Appeals (the “Petition”) praying that the NTC be restrained from enforcing or implementing its assessment letter of February 29, 2008, and demand letters dated April 14, 2008 and June 18, 2008, all demanding payment of SRF including penalties and interests. The Petition further prayed that after notice and hearing, the NTC be ordered to forever cease and desist from implementing and/or enforcing, and annulling and reversing and setting aside, the said assessment letter and demand letters. The Court of Appeals, in its Decision dated May 25, 2010, granted PLDT’s Petition and set aside/annulled the NTC’s letters-assessments dated February 29, 2008, April 14, 2008 and June 18, 2008. The NTC did not file a Motion for Reconsideration of the decision of the Court of Appeals. Instead, the NTC, through the Solicitor General, filed a petition for review directly with the Supreme Court. PLDT received a copy of the petition on July 29, 2010, and after receiving the order of the Supreme Court to file its comment, filed its Comment on the petition on December 7, 2010. As at August 2, 2011, this case is still pending with the Supreme Court.
PLDT’s Local Business and Franchise Tax Assessments The Local Government Code of 1991, or Republic Act (R.A.) 7160, which took effect on January 1, 1992, extended to local government units, or LGUs, the power to tax businesses within their territorial jurisdiction granted under Batas Pambansa 337, and withdrew tax exemptions previously granted to franchise grantees under Section 12 of R.A. 7082.

F-92
PLDT believes that the Public Telecommunications Policy Act, or R.A. 7925, which took effect on March 16, 1995, and the grant of local franchise and business taxes exemption privileges to other franchise holders subsequent to the effectivity of R.A. 7160, implicitly restored its local franchise and business taxes exemption privilege under Section 12 of R.A. 7082, or the PLDT Franchise pursuant to Section 23 thereof or the equality of treatment clause. To confirm this position, PLDT sought and obtained on June 2, 1998 a ruling from the Bureau of Local Government Finance, or BLGF, of the Philippine Department of Finance, which ruled that PLDT is exempt from the payment of local franchise and business taxes imposable by LGUs under R.A. 7160. However, on March 25, 2003, in a ruling relating to a tax assessment by the City of Davao, the Supreme Court decided that PLDT was not exempt from the local franchise tax. Although PLDT believes that it is not liable to pay local franchise and business taxes, PLDT has entered into compromise settlements with several LGUs, including the City of Makati, in order to maintain and preserve its good standing and relationship with these LGUs. Under these compromise settlements, which have mostly been approved by the relevant courts, PLDT has paid a total amount of Php991 million as at June 30, 2011 for local franchise tax covering prior periods up to June 30, 2011. As at June 30, 2011, PLDT has no contested LGU assessments for franchise taxes based on gross receipts received or collected for services within their respective territorial jurisdiction. However, PLDT contested the imposition of local business taxes in addition to local franchise tax by the City of Tuguegarao in the amount of Php1.9 million for the years 1998 to 2003. The RTC rendered a decision stating that the City of Tuguegarao cannot impose local business tax on PLDT, there being no ordinance enacted for that purpose. The City of Tuguegarao has filed a Motion for Reconsideration which was denied by the court in its Order dated March 2, 2009. The City of Tuguegarao has filed a Notice of Appeal before the Court of Appeals. PLDT filed a motion to dismiss the said appeal on the ground of lack of jurisdiction as the appeal should have been filed before the Court of Tax Appeals, or CTA. The City of Tuguegarao filed its Comment to PLDT’s Motion to Dismiss. PLDT will file its Reply on the said Comment of the City of Tuguegarao. Said motion to dismiss is now submitted for resolution by the honorable court. Moreover, PLDT also contested the imposition of franchise tax by the Province of Cagayan based on gross receipts derived from outside its territorial jurisdiction specifically that of the City of Tuguegarao, in the amount of Php3 million for the years 1999 to 2006. The RTC in its decision dated February 25, 2009, ruled in favor of PLDT, stating that the Province of Cagayan can no longer tax PLDT for transactions taking place in the City of Tuguegarao. The Province of Cagayan filed a Motion for Reconsideration which was denied by the RTC in its Order dated October 7, 2009. The Province of Cagayan filed a Petition for Review before the CTA. After filing its Comment and the submission of the respective memoranda of both parties, PLDT received the Decision of the CTA on September 20, 2010 which affirmed with modifications the Decision of the RTC. Though said Decision affirmed that the Province of Cagayan cannot impose franchise tax on gross receipts realized in the City of Tuguegarao, the CTA ruled that PLDT is subject to surcharge and interest for the years 1999 to 2004 thereby reducing the amount refundable to PLDT from Php2.8 million to Php1 million. Both parties filed a partial motion for reconsideration of the said decision as well as comment on the other party’s motion. In a resolution dated January 27, 2011, the CTA partially granted the motion for reconsideration of PLDT by modifying its decision stating that the Province of Cagayan’s right to assess surcharge and interest for local franchise tax for the period of 1998 has already prescribed thereby increasing the amount refundable to PLDT by Php0.059 million.
Smart’s Local Business and Franchise Tax Assessments In Smart Communications, Inc. vs. City of Makati (Civil Cases No. 02-249 and 02-725, August 3, 2004), the deficiency local franchise tax assessment issued against Smart by the City of Makati covering the years 1995 and 1998 to 2001 had been ordered cancelled by the RTC of City of Makati. This was upheld by the Court of Appeals in its Resolution dated June 9, 2005 (CA G.R. SP No. 88681, June 9, 2005). The Court’s Decision declaring Smart as exempt from paying local franchise tax had become final and executory.

F-93
In a letter dated March 24, 2008, the Miscellaneous, Taxes, Fees and Charges Division of the City of Makati requested payment for alleged deficiency local franchise tax covering the years 1995 and 1997 to 2003. Smart replied and reiterated its exemption from local franchise tax based on its legislative franchise and the Smart vs. City of Makati case, which covered the years 1995 and 1998 to 2001. On March 9, 2009, Smart received another letter from the City of Makati on alleged outstanding franchise tax obligations covering the period from 1995 to 2009. In November 2009, Smart received a Billing Statement from the City of Makati for alleged franchise tax liability covering the period from 1995 and 1997 to 2003. On December 16, 2009 and January 29, 2010, Smart filed its reply letters and refuted the alleged franchise tax liability based on the Smart vs. City of Makati case and its BOI registration dated May 3, 2001. In August 2009, the Business Tax Division of the City of Makati issued a Letter of Authority for the examination of Smart’s local tax liabilities covering the years 2006, 2007 and 2008. The City of Makati issued a Notice of Assessment dated October 23, 2009 against Smart for alleged deficiency local business taxes, fees and charges, including interest and penalties, covering the years 2006 to 2008. Smart protested the assessment on December 16, 2009. On February 8, 2010, Smart received the City of Makati’s Revised Notice of Assessment, which showed deficiency local franchise and business taxes, including interest and penalties, for the years 2006 to 2008. Smart contested the revised deficiency local tax assessment on February 15, 2010. In a letter dated February 19, 2010, the City of Makati demanded the immediate settlement of the alleged tax liability. On March 3, 2010, Smart requested the City of Makati for a reinvestigation and for it to further evaluate its arguments and supporting documents. After which, Smart had several meetings with the officials of the City of Makati to discuss its request for reinvestigation. During that period, the City of Makati officials advised Smart that they still need to study and internally discuss the arguments of Smart. On August 3, 2010, Smart received the City of Makati’s Notice of Distraint and Levy dated July 23, 2010. Smart sent a letter to the City of Makati on August 10, 2010 inquiring on the status of Smart’s request for reinvestigation and requested for a meeting. On August 19, 2010, Smart’s representatives met with the City of Makati officials and they then informed Smart’s representatives that its decision on the matter is final. On September 1, 2010, Smart filed an Appeal with application for the issuance of a Temporary Restraining Order and Writ of Preliminary Injunction before the RTC of the City of Makati (Branch 133) docketed as SCA No. 10-852. On September 6, 2010, the RTC of the City of Makati (Branch 133) promulgated an Order granting the issuance of a temporary restraining order for 20 days directing the City of Makati and the City Treasurer to maintain the status quo until a hearing can be had to determine the propriety of injunctive relief conditioned upon posting a bond by Smart. In an Order dated September 23, 2010, the RTC of the City of Makati (Branch 133) issued a Writ of Preliminary Injunction conditioned upon posting a bond by Smart. Smart submitted the bond with the RTC of the City of Makati (Branch 133) on October 4, 2010. The City of Makati filed a Motion for Reconsideration of the Order dated September 23, 2010, which was denied. Meanwhile, the City of Makati filed a Motion to Dismiss dated September 15, 2010 and a Motion to Inhibit dated September 21, 2010, which were both denied as well as the Motions for Reconsideration from the Orders denying the said motions. Thus, the City of Makati filed with the Court of Appeals a Petition for Certiorari [With Urgent Application for the Issuance of a Temporary Restraining Order and/or Writ of Preliminary Injunction] dated December 16, 2010, seeking to annul the following orders of the RTC of the City of Makati: Order dated September 23, 2010 (granting Smart’s prayer for the issuance of a Writ of Preliminary Injunction); and Order dated October 12, 2010 (denying the City of Makati’s Motion to Dismiss and Motion for Inhibition), as well as the denial of the motions for reconsideration of the Orders dated September 23, 2010 and October 12, 2010. Smart filed its Comment on the Petition on March 16, 2011. No ruling has been issued as regards City of Makati’s application for a temporary restraining order and preliminary injunction. On May 12, 2011, the Court of Appeals issued a resolution stating that the case is now submitted for resolution. In a decision promulgated on July 26, 2011, the Court of Appeals dismissed the Petition of Makati City, et al. for lack of jurisdiction. In the RTC case, Smart has presented two witnesses. The third witness will be presented at the next hearing on August 26, 2011.

F-94
Meanwhile, Smart also received similar local franchise tax assessments issued by the City of Iloilo. The RTC of Iloilo likewise ruled in favor of Smart in its Decision dated January 19, 2005 (Civil Case No. 02-27144) declaring Smart as exempt from payment of local franchise tax. The City of Iloilo appealed the Decision and the Supreme Court, on February 27, 2009, (G.R. No. 167260) ruled that Smart is liable to pay the local franchise tax to the City of Iloilo. On April 2, 2009, Smart filed its Motion for Reconsideration. On July 1, 2009, the Supreme Court’s Special Second Division issued a Resolution denying Smart’s Motion for Reconsideration. In accordance with this Decision, Smart paid the City of Iloilo. In 2002, Smart filed a special civil action for declaratory relief for the ascertainment of its rights and obligations under the Tax Code of the City of Davao. The relevant section of Smart’s franchise provided that the grantee shall pay a franchise tax equivalent to 3% of all gross receipts of the business transacted under the franchise by the grantee and the said percentage shall be in lieu of all taxes on the franchise or earnings thereof. On September 16, 2008, the Supreme Court’s Third Division ruled that Smart is liable for local franchise tax since the phrase “in lieu of all taxes” merely covers national taxes and was rendered inoperative when the VAT law took effect. On October 21, 2008, Smart filed its Motion for Reconsideration. Smart argued that the operative word in the “in lieu of all taxes” clause in Smart’s franchise is the word “all”. The word “all” before “taxes” in the clause “in lieu of all taxes” covers all kinds of taxes, national and local, except only those mentioned in the franchise. Smart also argued that the BIR already clarified in its Revenue Memorandum Circular No. 5-96 dated March 31, 1997 that the VAT merely replaced the franchise tax. On July 21, 2009, the Supreme Court’s Third Division promulgated its Resolution denying Smart’s Motion for Reconsideration and affirming that Smart is liable to pay local franchise tax to the City of Davao. On June 3, 2010, Smart received an initial local franchise tax assessment from the City of Davao covering the years from 1997 to 2010. Smart filed on June 21, 2010 its letter of protest against the local franchise tax assessment citing its local tax exemption by virtue of its BOI registration. On July 6, 2010, Smart received a letter from the City of Davao requesting for the submission of additional documents. Smart submitted several documents on August 3, 2010. In reply to Smart’s protest, the City of Davao answered several issues, made an assessment and demanded for the settlement of the local franchise tax. Smart received the reply on October 26, 2010. On November 11, 2010, Smart protested the assessment. In an unsigned letter received by Smart on December 17, 2010, the City of Davao maintained that Smart is obligated to pay the local franchise tax assessed. In an Indorsement dated February 10, 2011, the City of Davao Legal Office issued an Opinion recognizing that Smart’s Tax exemption, being a BOI registered enterprise, shall commence from the date of registration with the Board (six years for pioneer business enterprise), pursuant to the provisions of Section 133(g) of the Local Government Code in relation to Article 11 of the Omnibus Investment Code of 1987. On March 15, 2011, the City of Davao issued its revised local franchise tax assessment which Smart paid on March 29, 2011. With the finality of the Cities of Iloilo and Davao cases, several cities and provinces have began discussions with Smart on the settlement of alleged local franchise tax within their respective jurisdictions. To limit the years covered by Smart’s tax liability, Smart is invoking the prospective application of the Cities of Iloilo and Davao decisions and the recognition of its local tax exemption by virtue of its BOI registration issued on May 3, 2001.
PCEV’s Local Franchise Tax Assessment In 2004, PCEV secured a favorable decision from a Trial Court involving the local franchise tax in the City of Makati. In the case entitled “Pilipino Telephone Corporation vs. City of Makati and Andrea Pacita S. Guinto” (Piltel vs. City of Makati) (Civil Case No. 01-1760), the RTC of the City of Makati rendered its Decision dated December 10, 2002 declaring PCEV exempt from the payment of local franchise and business taxes. The Trial Court ruled that the legislative franchise of PCEV, R.A. 7293, granting the corporation exemption from local franchise and business taxes took effect after R.A. 7160 which removed all prior tax exemptions granted by law or other special law. The Trial Court’s decision was affirmed by the Court of Appeals in its Decision dated July 12, 2004 and then subsequently, the Supreme Court denied the appeal of the City of Makati in its Entry of Judgment dated October 13, 2004. The Supreme Court ruled that the City of Makati, failed to sufficiently show that the Court of Appeals committed any reversible error in the questioned judgment to warrant the exercise of the Supreme Court’s discretionary appellate jurisdiction.

F-95
On March 9, 2009, PCEV received a letter from the City of Makati on alleged outstanding franchise tax obligations covering the period from 1995 to 2009. In November 2009, PCEV received a Billing Statement from the City of Makati for alleged franchise tax liability covering the period from 1999 to 2003. On December 16, 2009, PCEV filed its reply and refuted the alleged franchise tax liability based on the Piltel vs. City of Makati case.
Real Property Tax Assessment In Smart Communications, Inc. vs. Central Board of Assessment Appeals, or CBAA, Local Board of Assessment Appeals of Surigao City, and City Assessor of Surigao City, Smart filed a Petition for Review with the Court of Appeals assailing the prior decision of the CBAA which declared Smart as being liable to pay real property taxes to the City of Surigao. The Court of Appeals on November 26, 2008 decided that Smart is exempt from the payment of real property taxes for its properties which are actually, directly and exclusively used in the operation of its franchise. On August 16, 2010, the Court of Appeals issued an Entry of Judgment confirming that the November 26, 2008 Resolution had become final and executory on December 22, 2008, and it was recorded in the book of Entries of Judgments.
Arbitration with Eastern Telecommunications Philippines, Inc., or ETPI Since 1990 (up to present), PLDT and ETPI have been engaged in legal proceedings involving a number of issues in connection with their business relationship. While they have entered into Compromise Agreements in the past (one in February 1990, and another one in March 1999), these agreements have not put to rest their issues against each other. Accordingly, to avoid further protracted litigation and improve their business relationship, both PLDT and ETPI have agreed in April 2008 to submit their differences and issues to voluntary arbitration. For this arbitration (after collating various claims of one party against the other) ETPI, on one hand, initially submitted its claims of about Php2.9 billion against PLDT; while PLDT, on the other hand, submitted its claims of about Php2.8 billion against ETPI. Currently, PLDT and ETPI have agreed to suspend the arbitration proceedings between them.
Matters Relating to a Third Party Aggregator In late 2009, PLDT informally received a communication which provided a complaint, or the Draft, setting forth a securities class action lawsuit in the United States District Court for the Southern District of New York against PLDT and certain PLDT officers and indicated that such Draft may be filed against PLDT. The Draft alleges that some PLDT officers and employees caused PLDT’s subsidiary, Smart to enter into contracts with a third-party entity in order to divert long distance telephone traffic and profits to such third-party entity. The Draft further alleges that these officers and employees personally created and controlled the third-party entity and were personally enriched as a result. The Draft alleges that this alleged scheme was accomplished by causing Smart to offer a lower rate for long distance telephone traffic to that third-party entity so that long distance traffic which otherwise would have been handled by PLDT at a higher rate was redirected to equipment owned by the third-party entity. The Draft alleges that PLDT failed to disclose material facts regarding the alleged scheme and that, as a result, PLDT misstated its true financial condition in its annual reports from 2002 through 2008.
In light of the nature of the allegations and out of an abundance of caution, PLDT’s Board of Directors referred the Draft for review by the Audit Committee. The Audit Committee appointed an independent Investigation Committee to oversee an investigation into the allegations contained in the Draft. The Audit Committee retained independent counsel to lead in the investigation. To preserve the confidential nature of the inquiry, the investigation was limited to internal sources at PLDT, including current PLDT and Smart employees, internal records and discrete inquiries and public records searches.

F-96
The independent counsel, under the oversight of the Investigation Committee, has concluded on the basis of the evidence within the control of PLDT or otherwise reasonably available, that: (i) while the investigation cannot definitively exclude the possibility, the investigation has found no evidence to establish that PLDT’s officers and employees were personally involved in the creation of the third-party entity referred to in the Draft and has found no evidence of any improper personal financial benefit or gain by these officers and employees, directly or indirectly from such third party entity; and (ii) while Smart had substantial business relationships with various third-party aggregators of long-distance telephone traffic during the relevant period, including the third-party entity referred to in the Draft (with which Smart ceased doing business in 2008), there is no evidence that the relationship with such third-party entity in fact resulted in a material adverse impact on PLDT’s revenues during the relevant period and may have in fact benefited PLDT overall through an increase in overall call volume. On May 7, 2010, the Audit Committee of PLDT approved the recommendation and conclusion of the independent counsel, as endorsed by the Investigation Committee. Other disclosures required by PAS 37, Provisions, Contingent Liabilities and Contingent Assets, were not provided as it may prejudice our position in on-going claims, litigations and assessments.
26. Financial Assets and Liabilities
We have various financial assets such as trade and non-trade receivables and cash and short-term deposits, which arise directly from our operations. Our principal financial liabilities, other than derivatives, comprise of bank loans and overdrafts, finance leases, trade and non-trade payables. The main purpose of these financial liabilities is to finance our operations. We also enter into derivative transactions, primarily principal only-currency swap agreements, currency options, interest rate swaps and forward foreign exchange contracts to manage the currency and interest rate risks arising from our operations and sources of financing. Our accounting policies in relation to derivatives are set out in Note 2 – Summary of Significant Accounting Policies. The following table sets forth our financial assets and financial liabilities as at June 30, 2011 and December 31, 2010:
Loans and
receivablesHTM
investments
Financial instruments
at FVPL
Derivatives used for hedging
Available-for-sale financial
assets
Financial liabilities carried at
amortized cost
Total financial
assets and liabilities
Non-financial assets and liabilities Total
(in million pesos) Assets as at June 30, 2011 (Unaudited) Noncurrent: Property, plant and equipment – – – – – – – 156,289 156,289Investments in associates and joint ventures – – – – – – – 23,815 23,815Available-for-sale financial assets – – – – 146 – 146 – 146Investment in debt securities – 495 – – – – 495 – 495Investment properties – – – – – – – 1,560 1,560Goodwill and intangible assets – – – – – – – 11,390 11,390Deferred income tax assets – net – – – – – – – 5,481 5,481Prepayments – net of current portion – – – – – – – 9,208 9,208Advances and refundable deposits –
net of current portion 1,008 – – – – – 1,008 202 1,210Current: – Cash and cash equivalents 38,658 – – – – – 38,658 – 38,658Short-term investments 78 – 522 – – – 600 – 600Trade and other receivables 14,922 – – – – – 14,922 – 14,922Inventories and supplies – – – – – – – 2,553 2,553Derivative financial assets – – 256 11 – – 267 – 267Current portion of prepayments – – – – – – – 4,807 4,807Current portion of advances and refundable deposits 16 – – – – – 16 67 83
Total assets 54,682 495 778 11 146 – 56,112 215,372 271,484

F-97
Loans and
receivablesHTM
investments
Financial instruments
at FVPL
Derivatives used for hedging
Available-for-sale financial
assets
Financial liabilities carried at
amortized cost
Total financial
assets and liabilities
Non-financial assets and liabilities Total
(in million pesos) Liabilities as at June 30, 2011 (Unaudited) Noncurrent: Interest-bearing financial liabilities –
net of current portion – – – – – 71,717 71,717 – 71,717Deferred income tax liabilities – net – – – – – – – 1,003 1,003Derivative financial liabilities – – 1,980 – – – 1,980 – 1,980Pension and other employee benefits – – – – – – – 2,554 2,554Customers’ deposits – – – – – 2,247 2,247 – 2,247Deferred credits and other noncurrent liabilities – – – – – 10,913 10,913 1,560 12,473Current: Accounts payable – – – – – 19,697 19,697 1,323 21,020Accrued expenses and other current liabilities – – – – – 28,476 28,476 8,554 37,030Derivative financial liabilities – – 892 – – – 892 – 892Provision for assessments – – – – – – – 1,555 1,555Current portion of interest-bearing financial liabilities – – – – – 22,449 22,449 – 22,449Dividends payable – – – – – 2,191 2,191 – 2,191Income tax payable – – – – – – – 2,644 2,644
Total liabilities – – 2,872 – – 157,690 160,562 19,193 179,755Net assets (liabilities) 54,682 495 (2,094) 11 146 (157,690) (104,450) 196,179 91,729 Assets as at December 31, 2010 (Audited) Noncurrent: Property, plant and equipment – – – – – – – 163,184 163,184Investments in associates and joint ventures – – – – – – – 23,203 23,203Available-for-sale financial assets – – – – 147 – 147 – 147Investment in debt securities – 484 – – – – 484 – 484Investment properties – – – – – – – 1,560 1,560Goodwill and intangible assets – – – – – – – 11,485 11,485Deferred income tax assets – net – – – – – – – 6,110 6,110Derivative financial assets – – 178 – – – 178 – 178Prepayments – net of current portion – – – – – – – 8,679 8,679Advances and refundable deposits –
net of current portion 984 – – – – – 984 203 1,187Current: Cash and cash equivalents 36,678 – – – – – 36,678 – 36,678Short-term investments 152 – 517 – – – 669 – 669Trade and other receivables 16,428 – – – – – 16,428 – 16,428Inventories and supplies – – – – – – – 2,219 2,219Derivative financial assets – – 5 – – – 5 – 5Current portion of prepayments – – – – – – – 5,418 5,418Current portion of advances and refundable deposits 16 – – – – – 16 165 181
Total assets 54,258 484 700 – 147 – 55,589 222,226 277,815 Liabilities as at December 31, 2010 (Audited) Noncurrent: Interest-bearing financial liabilities –
net of current portion – – – – – 75,888 75,888 – 75,888Deferred income tax liabilities – net – – – – – – – 1,099 1,099Derivative financial liabilities – – 3,604 – – – 3,604 – 3,604Pension and other employee benefits – – – – – – – 1,834 1,834Customers’ deposits – – – – – 2,223 2,223 – 2,223Deferred credits and other noncurrent liabilities – – – – – 12,041 12,041 1,526 13,567Current: – Accounts payable – – – – – 23,673 23,673 2,131 25,804Accrued expenses and other current liabilities – – – – – 28,822 28,822 7,137 35,959Provision for assessments – – – – – – – 1,555 1,555Current portion of interest-bearing financial liabilities – – – – – 13,801 13,801 – 13,801Dividends payable – – – – – 2,086 2,086 – 2,086Income tax payable – – – – – – – 3,010 3,010
Total liabilities – – 3,604 – – 158,534 162,138 18,292 180,430Net assets (liabilities) 54,258 484 (2,904) – 147 (158,534) (106,549) 203,934 97,385

F-98
The following table sets forth the consolidated carrying values and estimated fair values of our financial assets and liabilities as at June 30, 2011 and December 31, 2010:
Carrying Value Fair Value 2011 2010 2011 2010 (Unaudited) (Audited) (Unaudited) (Audited) (in million pesos) Noncurrent Financial Assets Available-for-sale financial assets:
Listed equity securities 78 78 78 78 Unlisted equity securities 68 69 68 69
Investment in debt securities 495 484 509 502 Derivative financial assets:
Long-term currency swap – 178 – 178 Advances and refundable deposits – net of current portion 1,008 984 924 915
Total noncurrent financial assets 1,649 1,793 1,579 1,742 Current Financial Assets Cash and cash equivalents:
Cash on hand and in banks 2,585 2,906 2,585 2,906 Temporary cash investments 36,073 33,772 36,073 33,772
Short-term investments 600 669 600 669 Trade and other receivables – net:
Foreign administrations 4,266 4,321 4,266 4,321 Retail subscribers 3,117 3,872 3,117 3,872 Corporate subscribers 2,615 2,042 2,615 2,042 Domestic carriers 1,427 1,453 1,427 1,453 Dealers, agents and others 3,497 4,740 3,497 4,740
Derivative financial assets: Current portion of long-term currency swaps 250 – 250 – Forward foreign exchange contracts 11 – 11 – Bifurcated embedded derivatives 6 5 6 5
Current portion of advances and refundable deposits 16 16 16 16 Total current financial assets 54,463 53,796 54,463 53,796
Total Financial Assets 56,112 55,589 56,042 55,538 Noncurrent Financial Liabilities Interest-bearing financial liabilities:
Long-term debt – net of current portion 71,710 75,879 76,753 82,244 Obligations under finance leases 7 9 6 8
Derivative financial liabilities: Long-term currency swap 1,980 3,604 1,980 3,604
Customers’ deposits 2,247 2,223 1,596 1,701 Deferred credits and other noncurrent liabilities 10,913 12,041 10,211 11,457
Total noncurrent financial liabilities 86,857 93,756 90,546 99,014 Current Financial Liabilities Accounts payable:
Suppliers and contractors 17,162 20,957 17,162 20,957 Carriers 1,876 1,866 1,876 1,866 Related parties 464 244 464 244 Others 195 606 195 606
Accrued expenses and other current liabilities: Utilities and related expenses 20,923 19,739 20,923 19,739 Employee benefits 4,035 3,852 4,035 3,852 Interests and other related costs 1,027 1,028 1,027 1,028 Others 2,491 4,203 2,491 4,203
Derivative financial liabilities: Current portion of long-term currency swap 892 – 892 –
Interest-bearing financial liabilities: Current portion of long-term debt 21,792 13,767 21,792 13,767 Notes payable 651 – 651 – Obligations under finance leases 6 34 6 34
Dividends payable 2,191 2,086 2,191 2,086 Total current financial liabilities 73,705 68,382 73,705 68,382
Total Financial Liabilities 160,562 162,138 164,251 167,396

F-99
Below are the list of financial assets and liabilities carried at fair value that are classified using a fair value hierarchy as at June 30, 2011 and December 31, 2010:
2011 2010 (Unaudited) (Audited)
Level 1(1) Level 2(2) Total Level 1(1) Level 2(2) Total (in million pesos) Noncurrent Financial Assets
Available-for-sale financial assets – Listed equity securities 78 – 78 78 – 78
Derivative financial assets – – – – 178 178 Current Financial Assets
Short-term investments – 522 522 – 517 517 Derivative financial assets – 267 267 – 5 5
Total 78 789 867 78 700 778 Noncurrent Financial Liabilities
Derivative financial liabilities – 1,980 1,980 – 3,604 3,604 Current Financial Liabilities
Derivative financial liabilities – 892 892 – – – Total – 2,872 2,872 – 3,604 3,604
___________________ (1) Fair values determined using observable market inputs that reflect quoted prices in active markets for identical assets or liabilities. (2) Fair values determined using inputs other than quoted prices that are either directly or indirectly observable for the assets or liabilities. As at June 30, 2011 and December 31, 2010, we have no financial instruments whose fair values are determined using inputs that are not based on observable market data (Level 3). As at June 30, 2011 and December 31, 2010, there were no transfers between Level 1 and Level 2 fair value measurements. The following methods and assumptions were used to estimate the fair value of each class of financial instrument for which it is practicable to estimate such value: Long-term financial assets and liabilities: Fair value is based on the following:
Type Fair Value Assumptions
Noncurrent portion of advances and refundable deposits Estimated fair value is based on the discounted values of future cash flows using the applicable zero coupon rates plus credit spread.
Fixed rate loans: U.S. dollar notes Other loans in all other currencies
Quoted market price. Estimated fair value is based on the discounted value of future cash flows using the applicable Commercial Interest Reference Rate and Philippine Dealing System Treasury Fixing rates for similar types of loans.
Variable rate loans The carrying value approximates fair value because of recent and regular repricing based on market conditions.
Customers’ deposits and deferred credits and other noncurrent liabilities Estimated fair value is based on the discounted values of future cash flows using the applicable zero coupon rates plus credit spread.
Derivative Financial Instruments:
Foreign currency options: The fair values were computed using an option pricing model using market volatility rates of the U.S. dollar and Philippine peso exchange rate as at valuation date.
Forward foreign exchange contracts, bifurcated foreign currency forwards and foreign currency swaps: The fair values were computed as the present value of estimated future cash flows using market U.S. dollar and Philippine peso interest rates as at valuation date.

F-100
Available-for-sale financial assets: Fair values of available-for-sale financial assets, which consist of proprietary listed shares, were determined using quoted prices. Investments in unlisted securities are carried at cost less any accumulated impairment losses. Investment in debt securities: Fair values were determined using quoted prices. For non-quoted securities, fair values were determined using discounted cash flow based on market observable rates. Due to the short-term nature of the transactions, the fair value of cash and cash equivalents, short-term investments, current investment in debt securities, trade and other receivables, current portion of advances and refundable deposits, accounts payable, accrued expenses and other current liabilities, current portion of interest-bearing financial liabilities, and dividends payable approximate their carrying values as at the end of the reporting period. Derivative Financial Instruments Our derivative financial instruments are accounted for as either cash flow hedges or transactions not designated as hedges. Cash flow hedges refer to those transactions that hedge our exposure to variability in cash flows attributable to a particular risk associated with a recognized financial asset or liability and exposures arising from forecast transactions. Changes in the fair value of these instruments representing effective hedges are recognized directly in other comprehensive income until the hedged item is recognized in our consolidated income statement. For transactions that are not designated as hedges, any gains or losses arising from the changes in fair value are recognized directly to income for the period. As at June 30, 2011, SPi and SPi CRM designated forward foreign exchange contracts as cash flow hedges. The table below sets out the information about our derivative financial instruments as at June 30, 2011 and December 31, 2010: 2011 2010 (Unaudited) (Audited)
Maturity Notional
Mark-to- market Gains
(Losses) Notional
Mark-to- market Gains
(Losses) (in millions) PLDT
Transactions not designated as hedges: Currency swaps 2017 US$222 (Php1,980) US$222 (Php2,651)
2012 100 (892) 100 (953) 2012 60(1) 250 60(1) 178 (2,622) (3,426) ePLDT
Cash flow hedges: Forward foreign exchange contracts 2012 54 2 – –
2011 32 9 – – Transactions not designated as hedges:
Bifurcated embedded derivatives 2012 1 6 1 5 17 5 Net liabilities (Php2,605) (Php3,421)___________________ (1) Overlay principal only swap agreements to effectively unwind a portion of the outstanding long-term principal only swap agreement
maturing in 2012.

F-101
2011 2010 (Unaudited) (Audited)
(in million pesos) Presented as:
Noncurrent assets – 178 Current assets 267 5 Noncurrent liabilities (1,980) (3,604)Current liabilities (892) – Net liabilities (2,605) (3,421)
Analysis of gains on derivative financial instruments for the six months ended June 30, 2011 and 2010 are as follows:
2011 2010 (Unaudited)
(in million pesos) Net mark-to-market losses at end of period (2,605) (1,356)Net mark-to-market losses at beginning of period (3,421) (2,745)Net change 816 1,389 Net gains on cash flow hedges charged to other comprehensive income (11) – Settlements, accretion and conversion (142) (201)Hedge cost (179) (254)Net gains on derivative financial instruments (Note 4) 484 934 PLDT Due to the amounts of PLDT’s foreign currency hedging requirements and the large interest differential between the Philippine peso and the U.S. dollar, the costs to book long-term hedges can be significant. In order to manage such hedging costs, PLDT utilizes structures that include currency option contracts, and fixed-to-floating coupon-only swaps that may not qualify for hedge accounting.
Currency Swaps PLDT has entered into long-term principal-only currency swap agreements with various foreign counterparties to hedge the currency risk on its fixed rate notes maturing in 2012 and 2017. These long-term currency swaps have an aggregate notional amount of US$322 million with total mark-to-market losses of Php2,872 million and Php3,604 million as at June 30, 2011 and December 31, 2010, respectively. Under the swaps, PLDT effectively exchanges the principal of its U.S. dollar-denominated fixed rate notes into Philippine peso-denominated loan exposures at agreed swap exchange rates. The agreed swap exchange rates are reset to the lowest U.S. dollar/Philippine peso spot exchange rate during the term of the swaps, subject to a minimum exchange rate. The outstanding swap contracts have an agreed average swap exchange rates of Php50.45 as at June 30, 2011 and December 31, 2010. The semi-annual fixed or floating swap cost payments that PLDT is required to make to its counterparties averaged about 2.91% and 2.93% per annum as at June 30, 2011 and December 31, 2010, respectively. On various dates in 2010, the long-term principal only-currency swap agreements maturing in 2012 and 2017 were partially terminated, with a total aggregate settlement amount of Php372 million and Php168 million, respectively. As a result of these unwinding transactions, the outstanding notional amount was reduced to US$100 million and US$222 million for the swaps maturing in 2012 and 2017, respectively, with mark-to-market losses of Php953 million and Php2,651 million, respectively, as at December 31, 2010. On various dates from October to November 2010, PLDT entered into several overlay principal only swap agreements with an aggregate notional amount of US$60 million to effectively unwind a portion of the outstanding long-term principal only swap agreement maturing in 2012. The overlay swaps are offsetting swaps which carry the direct opposite terms and cashflows of our existing swap agreement. As consideration for the overlay swaps, PLDT will pay an average fixed rate of 10.84% on a semi-annual basis over the life of the offsetting swaps. These overlay swap agreements have an aggregate mark-to-market gains of Php250 million and Php178 million as at June 30, 2011 and December 31, 2010, respectively.

F-102
ePLDT In February and March 2011, SPi and SPi CRM entered into several forward foreign exchange contracts with various financial institutions to hedge a portion of monthly dollar denominated revenues and peso denominated expenses maturing March 2011 up to February 2012. The gains and losses on such contracts are expected to be recognized in profit or loss upon occurrence of the monthly dollar revenues and monthly peso expenses hedged. The outstanding forward foreign exchange contracts that were designated as hedges amounted to US$32 million and US$54 million for SPi and SPi CRM, respectively, with aggregate mark-to-market gain of Php11 million as at June 30, 2011. Level Up! embedded derivatives were bifurcated from various license contracts and other service agreements denominated in U.S. dollar. The aggregate notional amount of these bifurcated embedded currency forwards amounted to US$1 million each as at June 30, 2011 and December 31, 2010. The total mark-to-market gains of these bifurcated embedded currency forwards amounted to Php6 million and Php5 million as at June 30, 2011 and December 31, 2010, respectively. Financial Risk Management Objectives and Policies The main risks arising from our financial instruments are liquidity risk, foreign currency exchange risk, interest rate risk and credit risk. The importance of managing those risks has significantly increased in light of the considerable change and volatility in both the Philippine and international financial markets. Our Board of Directors reviews and approves policies for managing each of these risks. Our policies for managing these risks are summarized below. We also monitor the market price risk arising from all financial instruments. Liquidity Risk We manage our liquidity profile to be able to finance our operations and capital expenditures, service our maturing debts and meet our other financial obligations. To cover our financing requirements, we use internally generated funds and proceeds from debt and equity issues and sales of certain assets. As part of our liquidity risk management program, we regularly evaluate our projected and actual cash flows, including our loan maturity profiles, and continuously assess conditions in the financial markets for opportunities to pursue fund-raising initiatives. These activities may include bank loans, export credit agency-guaranteed facilities, debt capital and equity market issues. Any excess funds are primarily invested in short-term and principal-protected bank products that provide flexibility of withdrawing the funds anytime. We also allocate a portion of our cash in longer tenor investments such as fixed income securities issued or guaranteed by the Republic of the Philippines, and Philippine banks and corporates, managed funds and other structured products linked to the Republic of the Philippines. We regularly evaluate available financial products and monitor market conditions for opportunities to enhance yields at acceptable risk levels. Our investments are also subject to certain restrictions contained in our debt covenants. Our funding arrangements are designed to keep an appropriate balance between equity and debt and to provide financing flexibility while enhancing our businesses. We have letters of credit amounting to Php364 million as at June 30, 2011 and certain financial instruments that are allocated to meet our short-term liquidity needs. These financial instruments are cash and cash equivalents, and short-term investments amounting to Php38,658 million and Php600 million, respectively, as at June 30, 2011. See Note 15 – Cash and Cash Equivalents.
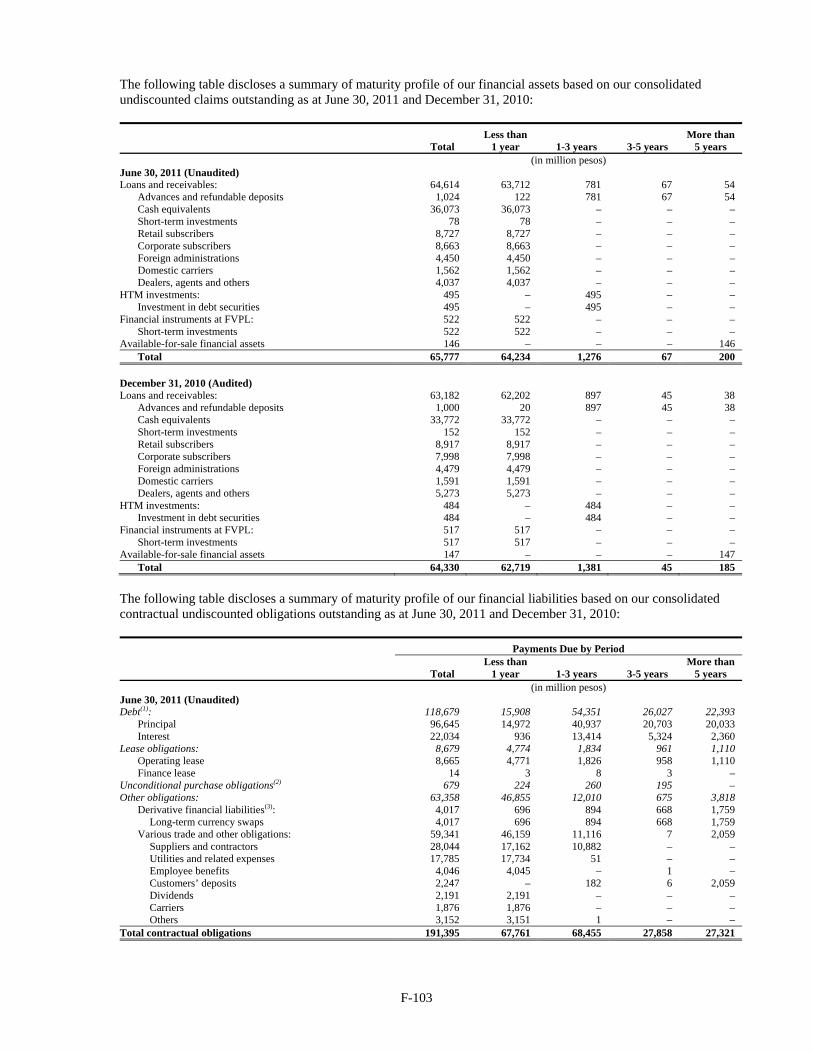
F-103
The following table discloses a summary of maturity profile of our financial assets based on our consolidated undiscounted claims outstanding as at June 30, 2011 and December 31, 2010:
Total Less than
1 year 1-3 years 3-5 years More than
5 years (in million pesos) June 30, 2011 (Unaudited) Loans and receivables: 64,614 63,712 781 67 54
Advances and refundable deposits 1,024 122 781 67 54 Cash equivalents 36,073 36,073 – – – Short-term investments 78 78 – – – Retail subscribers 8,727 8,727 – – – Corporate subscribers 8,663 8,663 – – – Foreign administrations 4,450 4,450 – – – Domestic carriers 1,562 1,562 – – – Dealers, agents and others 4,037 4,037 – – –
HTM investments: 495 – 495 – – Investment in debt securities 495 – 495 – –
Financial instruments at FVPL: 522 522 – – – Short-term investments 522 522 – – –
Available-for-sale financial assets 146 – – – 146 Total 65,777 64,234 1,276 67 200
December 31, 2010 (Audited) Loans and receivables: 63,182 62,202 897 45 38
Advances and refundable deposits 1,000 20 897 45 38 Cash equivalents 33,772 33,772 – – – Short-term investments 152 152 – – – Retail subscribers 8,917 8,917 – – –Corporate subscribers 7,998 7,998 – – –Foreign administrations 4,479 4,479 – – – Domestic carriers 1,591 1,591 – – – Dealers, agents and others 5,273 5,273 – – –
HTM investments: 484 – 484 – – Investment in debt securities 484 – 484 – –
Financial instruments at FVPL: 517 517 – – – Short-term investments 517 517 – – –
Available-for-sale financial assets 147 – – – 147 Total 64,330 62,719 1,381 45 185
The following table discloses a summary of maturity profile of our financial liabilities based on our consolidated contractual undiscounted obligations outstanding as at June 30, 2011 and December 31, 2010: Payments Due by Period
Total Less than
1 year 1-3 years 3-5 years More than
5 years (in million pesos) June 30, 2011 (Unaudited) Debt(1): 118,679 15,908 54,351 26,027 22,393
Principal 96,645 14,972 40,937 20,703 20,033 Interest 22,034 936 13,414 5,324 2,360
Lease obligations: 8,679 4,774 1,834 961 1,110 Operating lease 8,665 4,771 1,826 958 1,110 Finance lease 14 3 8 3 –
Unconditional purchase obligations(2) 679 224 260 195 – Other obligations: 63,358 46,855 12,010 675 3,818
Derivative financial liabilities(3): 4,017 696 894 668 1,759 Long-term currency swaps 4,017 696 894 668 1,759
Various trade and other obligations: 59,341 46,159 11,116 7 2,059 Suppliers and contractors 28,044 17,162 10,882 – – Utilities and related expenses 17,785 17,734 51 – – Employee benefits 4,046 4,045 – 1 – Customers’ deposits 2,247 – 182 6 2,059 Dividends 2,191 2,191 – – – Carriers 1,876 1,876 – – – Others 3,152 3,151 1 – –
Total contractual obligations 191,395 67,761 68,455 27,858 27,321

F-104
Payments Due by Period
Total Less than
1 year 1-3 years 3-5 years More than
5 years (in million pesos) December 31, 2010 (Audited) Debt(1): 113,394 6,569 51,308 33,978 21,539
Principal 92,590 6,206 38,263 29,335 18,786 Interest 20,804 363 13,045 4,643 2,753
Lease obligations: 8,003 4,383 1,710 948 962 Operating lease 7,959 4,353 1,697 947 962Finance lease 44 30 13 1 –
Unconditional purchase obligations(2) 797 271 263 263 – Other obligations: 68,782 50,247 13,963 683 3,889
Derivative financial liabilities(3): 4,241 – 1,735 674 1,832 Long-term currency swaps 4,241 – 1,735 674 1,832
Various trade and other obligations: 64,541 50,247 12,228 9 2,057 Suppliers and contractors 32,997 20,957 12,040 – – Utilities and related expenses 16,477 16,446 10 3 18 Employee benefits 3,853 3,853 – – – Customers’ deposits 2,223 – 178 6 2,039 Dividends 2,086 2,086 – – – Carriers 1,866 1,866 – – – Others 5,039 5,039 – – –
Total contractual obligations 190,976 61,470 67,244 35,872 26,390 ___________________ (1) Consists of long-term debt, including current portion; gross of unamortized debt discount and debt issuance costs. (2) Based on the Amended ATPA with AIL. See Note 23 – Related Party Transactions. (3) Gross liabilities before any offsetting application.
Debt See Note 19 – Interest-bearing Financial Liabilities for a detailed discussion of our debt.
Operating Lease Obligations
The PLDT Group has various lease contracts for periods ranging from one to ten years covering certain offices, warehouses, cell sites telecommunications equipment locations and various office equipment. The consolidated future minimum lease commitments payable with non-cancellable operating leases as at June 30, 2011 and December 31, 2010 are as follows:
2011 2010 (Unaudited) (Audited)
(in million pesos) Within one year 4,834 4,469 After one year but not more than five years 2,721 2,528 More than five years 1,110 962 8,665 7,959
Finance Lease Obligations See Note 19 – Interest-bearing Financial Liabilities for the detailed discussion of our long-term finance lease obligations.
Unconditional Purchase Obligations See Note 23 – Related Party Transactions for a detailed discussion of PLDT’s obligation under the Original and the Amended ATPA. Under the Amended ATPA, PLDT’s aggregate remaining minimum obligation is approximately Php679 million and Php797 million as at June 30, 2011 and December 31, 2010, respectively.

F-105
Other Obligations – Various Trade and Other Obligations
PLDT Group has various obligations to suppliers for the acquisition of phone and network equipment, contractors for services rendered on various projects, foreign administrations and domestic carriers for the access charges, shareholders for unpaid dividends distributions, employees for benefits related obligations, and various business and operational related agreements. Total obligations under these various agreements amounted to approximately Php59,341 million and Php64,541 million as at June 30, 2011 and December 31, 2010, respectively. See Note 21 – Accounts Payable and Note 22 – Accrued Expenses and Other Current Liabilities. Commercial Commitments Our outstanding consolidated commercial commitments, in the form of letters of credit, amounted to Php364 million and Php1,145 million as at June 30, 2011 and December 31, 2010, respectively. These commitments will expire within one year. Foreign Currency Exchange Risk The revaluation of our foreign currency-denominated financial assets and liabilities as a result of the appreciation or depreciation of the Philippine peso is recognized as foreign exchange gains or losses as at the end of the reporting period. The extent of foreign exchange gains or losses is largely dependent on the amount of foreign currency debt. While a certain percentage of our revenues are either linked to or denominated in U.S. dollars, most of our indebtedness and related interest expense, a substantial portion of our capital expenditures and a portion of our operating expenses are denominated in foreign currencies, mostly in U.S. dollars. As such, a strengthening or weakening of the Philippine peso against the U.S. dollar will decrease or increase in Philippine peso terms both the principal amount of our foreign currency-denominated debts and the related interest expense, our foreign currency-denominated capital expenditures and operating expenses as well as our U.S. dollar-linked and U.S. dollar-denominated revenues. In addition, many of our financial ratios and other financial tests are affected by the movements in the Philippine peso to U.S. dollar exchange rate. To manage our foreign exchange risks and to stabilize our cash flows in order to improve investment and cash flow planning, we enter into forward foreign exchange contracts, currency swap contracts, currency option contracts and other hedging products aimed at reducing and/or managing the adverse impact of changes in foreign exchange rates on our operating results and cash flows. We use forward foreign exchange purchase contracts, currency swap contracts and foreign currency option contracts to manage the foreign currency risks associated with our foreign currency-denominated loans. We also enter into forward foreign exchange sale contracts to manage foreign currency risks associated with our U.S. dollar-linked and U.S. dollar-denominated revenues. In order to manage the hedge costs of these contracts, we utilize structures that include credit-linkage with PLDT as the reference entity, a combination of foreign currency option contracts, and fixed to floating coupon only swap contracts. We accounted for these instruments as either cash flow hedges, wherein changes in the fair value are recognized as cumulative translation adjustments in other comprehensive income until the hedged transaction affects our consolidated income statement or when the hedging instrument expires, or transactions not designated as hedges, wherein changes in the fair value are recognized directly as income or expense for the year.

F-106
The following table shows our consolidated foreign currency-denominated monetary financial assets and liabilities and their Philippine peso equivalents as at June 30, 2011 and December 31, 2010: 2011 2010 (Unaudited) (Audited) U.S. Dollar Php(1) U.S. Dollar Php(2) (in millions) Noncurrent Financial Assets
Advances and refundable deposits 3 138 3 122 Derivative financial assets – – 4 178
Total noncurrent financial assets 3 138 7 300 Current Financial Assets
Cash and cash equivalents 173 7,504 138 6,050 Short-term investments 13 583 15 652 Trade and other receivables – net 195 8,459 214 9,361 Derivative financial assets 6 267 – 5
Total current financial assets 387 16,813 367 16,068 Total Financial Assets 390 16,951 374 16,368
Noncurrent Financial Liabilities
Interest-bearing financial liabilities – net of current portion 597 25,906 782 34,244 Derivative financial liabilities 46 1,980 82 3,604
Total noncurrent financial liabilities 643 27,886 864 37,848 Current Financial Liabilities
Accounts payable 110 4,760 169 7,415 Accrued expenses and other current liabilities 121 5,242 143 6,267 Derivative financial liabilities 20 892 – – Current portion of interest-bearing financial liabilities 256 11,098 103 4,537
Total current financial liabilities 507 21,992 415 18,219 Total Financial Liabilities 1,150 49,878 1,279 56,067
___________________ (1) The exchange rate used to translate the U.S. dollar amounts into Philippine peso was Php43.36 to US$1.00, the Philippine peso-U.S. dollar
exchange rate as quoted through the Philippine Dealing System as at June 30, 2011. (2) The exchange rate used to translate the U.S. dollar amounts into Philippine peso was Php43.81 to US$1.00, the Philippine peso-U.S. dollar
exchange rate as quoted through the Philippine Dealing System as at December 31, 2010. As at August 1, 2011, the Philippine peso-U.S. dollar exchange rate was Php41.95 to US$1.00. Using this exchange rate, our consolidated net foreign currency-denominated financial liabilities would have decreased in Philippine peso terms by Php1,072 million as at June 30, 2011. Approximately 39% and 43% of our total consolidated debts (net of consolidated debt discount) were denominated in U.S. dollars as at June 30, 2011 and December 31, 2010, respectively. Consolidated foreign currency-denominated debt decreased to Php36,710 million as at June 30, 2011 from Php38,414 million as at December 31, 2010. See Note 19 – Interest-bearing Financial Liabilities. The aggregate notional amount of PLDT’s outstanding long-term principal only currency swap contracts were US$262 million as at June 30, 2011 and December 31, 2010. Consequently, the unhedged portion of our consolidated debt amounts was approximately 27% (or 18%, net of our consolidated U.S. dollar cash balances) and 30% (or 23%, net of our consolidated U.S. dollar cash balances) as at June 30, 2011 and December 31, 2010, respectively. Approximately 26% of our consolidated service revenues were denominated in U.S. dollars and/or were linked to U.S. dollars in each of the six months ended June 30, 2011 and 2010. In this respect, the appreciation of the weighted average exchange rate of the Philippine peso against the U.S. dollar decreased our revenues, and consequently, our cash flow from operations in Philippine peso terms. The Philippine peso had appreciated by 1.03% against the U.S. dollar to Php43.36 to US$1.00 as at June 30, 2011 from Php43.81 to US$1.00 as at December 31, 2010. As at June 30, 2010, the Philippine peso had appreciated by 0.02% against the U.S. dollar to Php46.42 to US$1.00 from Php46.43 to US$1.00 as at December 31, 2009. As a result of our consolidated foreign exchange movements as well as the amount of our consolidated outstanding net foreign currency financial assets and liabilities, we recognized net consolidated foreign exchange gains of Php426 million for the six months ended June 30, 2011 and net consolidated foreign exchange losses of Php59 million for the six months ended June 30, 2010. See Note 4 – Operating Segment Information.

F-107
Management conducted a survey among our banks to determine the outlook of the Philippine peso-U.S. dollar exchange rate until our next reporting date of September 30, 2011. Our outlook is that the Philippine peso-U.S. dollar exchange rate may weaken/strengthen by 2.45% as compared to the exchange rate of Php43.36 to US$1.00 as at June 30, 2011. If the Philippine peso-U.S. dollar exchange rate had weakened/strengthened by 2.45% as at June 30, 2011, with all other variables held constant, profit after tax for the six months ended June 30, 2011 would have been approximately Php390 million higher/lower and our consolidated stockholders’ equity as at June 30, 2011 would have been approximately Php386 million higher/lower, mainly as a result of consolidated foreign exchange gains and losses on translation of U.S. dollar-denominated net assets/liabilities and mark-to-market valuation of derivative financial instruments. Interest Rate Risk Our exposure to the risk of changes in market interest rates relates primarily to our long-term debt obligations and short-term borrowings with floating interest rates. Our policy is to manage interest cost through a mix of fixed and variable rate debts. We evaluate the fixed to floating ratio of our loans in line with movements of relevant interest rates in the financial markets. Based on our assessment, new financing will be priced either on a fixed or floating rate basis. On a limited basis, we enter into interest rate swap agreements in order to manage our exposure to interest rate fluctuations. We make use of hedging instruments and structures solely for reducing or managing financial risk associated with our liabilities and not for trading purposes. The following tables set out the carrying amounts, by maturity, of our financial instruments that are expected to have exposure on interest rate risk as at June 30, 2011 and December 31, 2010. Financial instruments that are not subject to interest rate risk were not included in the table. As at June 30, 2011 (Unaudited)
In U.S. Dollar
Discount/ Debt
Issuance Cost
In Php
Carrying Value
In Php
Fair Value
Below 1 year 1-2 years 2-3 years 3-5 years Over 5
years Total In Php In U.S.Dollar In Php
(in millions) Assets: Investment in Debt Securities
Philippine Peso – 11 – – – 11 495 – 495 12 509 Interest rate – 6.9200% – – – – – – – – –
Cash in Bank U.S. Dollar 12 – – – – 12 523 – 523 12 523 Interest rate 0.0100% to
0.7902% – – – – – – – – – –
Philippine Peso 25 – – – – 25 1,095 – 1,095 25 1,095 Interest rate 0.1000% to
3.1500% – – – – – – – – – –
Other Currencies 4 – – – – 4 175 – 175 4 175 Interest rate 0.0100% to
2.0000% – – – – – – – – – –
Temporary Cash Investments U.S. Dollar 148 – – – – 148 6,410 – 6,410 148 6,410 Interest rate 0.1000% to
1.8500% – – – – – – – – – –
Philippine Peso 684 – – – – 684 29,663 – 29,663 684 29,663 Interest rate 1.0000% to
4.8750% – – – – – – – – – –
Short-term Investments U.S. Dollar 13 – – – – 13 583 – 583 13 583 Interest rate 1.7000% to
3.2500% – – – – – – – – – –
Philippine Peso 1 – – – – 1 17 – 17 1 17 Interest rate 3.2500% – – – – – – – – – –
887 11 – – – 898 38,961 – 38,961 899 38,975
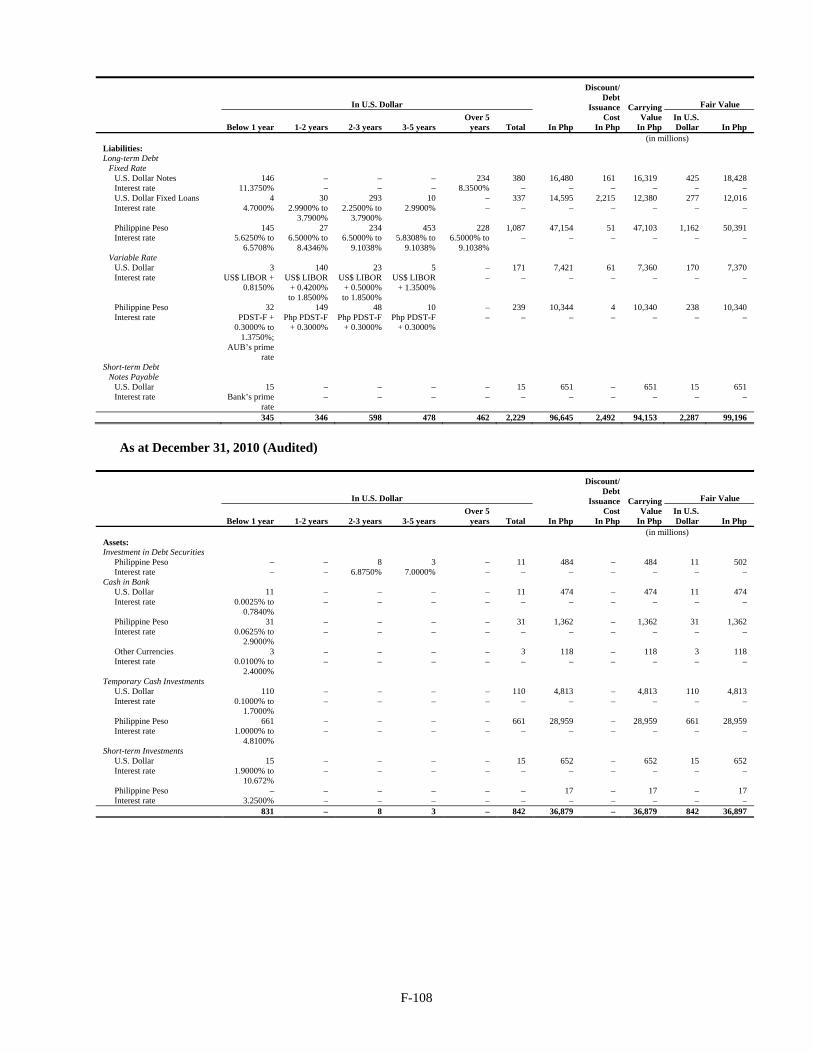
F-108
In U.S. Dollar
Discount/ Debt
Issuance Cost
In Php
Carrying Value
In Php
Fair Value
Below 1 year 1-2 years 2-3 years 3-5 years Over 5
years Total In Php In U.S.Dollar In Php
(in millions) Liabilities: Long-term Debt
Fixed Rate U.S. Dollar Notes 146 – – – 234 380 16,480 161 16,319 425 18,428 Interest rate 11.3750% – – – 8.3500% – – – – – – U.S. Dollar Fixed Loans 4 30 293 10 – 337 14,595 2,215 12,380 277 12,016 Interest rate 4.7000% 2.9900% to
3.7900% 2.2500% to
3.7900% 2.9900% – – – – – – –
Philippine Peso 145 27 234 453 228 1,087 47,154 51 47,103 1,162 50,391Interest rate 5.6250% to
6.5708% 6.5000% to
8.4346% 6.5000% to
9.1038% 5.8308% to
9.1038% 6.5000% to
9.1038% – – – – – –
Variable Rate U.S. Dollar 3 140 23 5 – 171 7,421 61 7,360 170 7,370 Interest rate US$ LIBOR +
0.8150% US$ LIBOR
+ 0.4200% to 1.8500%
US$ LIBOR + 0.5000% to 1.8500%
US$ LIBOR + 1.3500%
– – – – – – –
Philippine Peso 32 149 48 10 – 239 10,344 4 10,340 238 10,340 Interest rate PDST-F +
0.3000% to 1.3750%;
AUB’s prime rate
Php PDST-F + 0.3000%
Php PDST-F + 0.3000%
Php PDST-F + 0.3000%
– – – – – – –
Short-term Debt Notes Payable
U.S. Dollar 15 – – – – 15 651 – 651 15 651 Interest rate Bank’s prime
rate – – – – – – – – – –
345 346 598 478 462 2,229 96,645 2,492 94,153 2,287 99,196
As at December 31, 2010 (Audited)
In U.S. Dollar
Discount/ Debt
Issuance Cost
In Php
Carrying Value
In Php
Fair Value
Below 1 year 1-2 years 2-3 years 3-5 years Over 5
years Total In Php In U.S.Dollar In Php
(in millions) Assets: Investment in Debt Securities
Philippine Peso – – 8 3 – 11 484 – 484 11 502 Interest rate – – 6.8750% 7.0000% – – – – – – –
Cash in Bank U.S. Dollar 11 – – – – 11 474 – 474 11 474 Interest rate 0.0025% to
0.7840% – – – – – – – – – –
Philippine Peso 31 – – – – 31 1,362 – 1,362 31 1,362 Interest rate 0.0625% to
2.9000% – – – – – – – – – –
Other Currencies 3 – – – – 3 118 – 118 3 118 Interest rate 0.0100% to
2.4000% – – – – – – – – – –
Temporary Cash Investments U.S. Dollar 110 – – – – 110 4,813 – 4,813 110 4,813 Interest rate 0.1000% to
1.7000% – – – – – – – – – –
Philippine Peso 661 – – – – 661 28,959 – 28,959 661 28,959 Interest rate 1.0000% to
4.8100% – – – – – – – – – –
Short-term Investments U.S. Dollar 15 – – – – 15 652 – 652 15 652 Interest rate 1.9000% to
10.672% – – – – – – – – – –
Philippine Peso – – – – – – 17 – 17 – 17 Interest rate 3.2500% – – – – – – – – – –
831 – 8 3 – 842 36,879 – 36,879 842 36,897

F-109
In U.S. Dollar
Discount/ Debt
Issuance Cost
In Php
Carrying Value
In Php
Fair Value
Below 1 year 1-2 years 2-3 years 3-5 years Over 5
years Total In Php In U.S.Dollar In Php
(in millions) Liabilities: Long-term Debt
Fixed Rate U.S. Dollar Notes – 146 – – 234 380 16,650 200 16,450 440 19,274 Interest rate – 11.3750% – – 8.3500% – – – – – – U.S. Dollar Fixed Loans 9 29 15 295 – 348 15,264 2,586 12,678 276 12,120 Interest rate 4.7000% 2.9900% to
3.7900% 2.9900% to
3.7900% 2.2500% to
2.9900% – – – – – – –
Philippine Peso 68 146 121 339 195 869 38,066 74 37,992 961 42,091Interest rate 6.0323% to
8.7792% 5.6250% to
8.4346% 6.5000% to
8.4346% 6.5000% to
9.1038% 6.5000% to
9.1038% – – – – – –
Variable Rate
U.S. Dollar 6 148 45 15 – 214 9,357 71 9,286 212 9,286 Interest rate US$ LIBOR +
0.8150% Swap rate +
2.7900%; US$ LIBOR
+ 0.4200% to 1.8500%
Swap rate + 2.7900%;
US$ LIBOR + 0.4200% to 1.8500%
Swap rate + 2.7900%;
US$ LIBOR + 1.3500% to 1.8500%
– – – – – – –
Philippine Peso 58 150 74 20 – 302 13,253 13 13,240 302 13,240 Interest rate PDST-F +
0.3000% to 1.2500%
PDST-F + 0.3000% to
1.3750%; AUB’s
prime rate
PDST-F + 0.3000%
PDST-F + 0.3000%
– – – – – – –
141 619 255 669 429 2,113 92,590 2,944 89,646 2,191 96,011 Fixed rate financial instruments are subject to fair value interest rate risk while floating rate financial instruments are subject to cash flow interest rate risk. Repricing of floating rate financial instruments is mostly done on intervals of three months or six months. Interest on fixed rate financial instruments is fixed until maturity of the particular instrument. Management conducted a survey among our banks to determine the outlook of the U.S. dollar and Philippine peso interest rates until our next reporting date of September 30, 2011. Our outlook is that the U.S. dollar and Philippine peso interest rates may move 10 basis points and 40 basis points higher/lower, respectively, as compared to levels as at June 30, 2011. If U.S. dollar interest rates had been 10 basis points higher/lower as compared to market levels as at June 30, 2011, with all other variables held constant, profit after tax for the six months ended June 30, 2011 and our consolidated stockholders’ equity as at June 30, 2011 would have been approximately Php32 million lower/higher, mainly as a result of higher/lower interest expense on floating rate borrowings and loss/gain on derivative transactions. If Philippine peso interest rates had been 40 basis points higher/lower as compared to market levels as at June 30, 2011, with all other variables held constant, profit after tax for the six months ended June 30, 2011 and our consolidated stockholders’ equity as at June 30, 2011 would have been approximately Php138 million lower/higher, mainly as a result of higher/lower interest expense on floating rate borrowings and loss/gain on derivative transactions. Credit Risk Credit risk is the risk that we will incur a loss arising from our customers, clients or counterparties that fail to discharge their contracted obligations. We manage and control credit risk by setting limits on the amount of risk we are willing to accept for individual counterparties and by monitoring exposures in relation to such limits. We trade only with recognized and creditworthy third parties. It is our policy that all customers who wish to trade on credit terms are subject to credit verification procedures. In addition, receivable balances are monitored on an on-going basis to reduce our exposure to bad debts. We established a credit quality review process to provide regular identification of changes in the creditworthiness of counterparties. Counterparty limits are established and reviewed periodically based on latest available financial data on our counterparties’ credit ratings, capitalization, asset quality and liquidity. Our credit quality review process allows us to assess the potential loss as a result of the risks to which we are exposed and allow us to take corrective actions.

F-110
The table below shows the maximum exposure to credit risk for the components of our consolidated statement of financial position, including derivative financial instruments as at June 30, 2011 and December 31, 2010:
Gross Maximum Exposure(1) Net Maximum Exposure(2)
2011 2010 2011 2010 (Unaudited) (Audited) (Unaudited) (Audited)
(in million pesos) Loans and receivables:
Advances and refundable deposits 1,024 1,000 1,015 999 Cash and cash equivalents 38,658 36,678 38,297 36,458 Short-term investments 78 152 78 152 Foreign administrations 4,266 4,321 4,226 4,277 Retail subscribers 3,117 3,872 3,048 3,799 Corporate subscribers 2,615 2,042 2,466 1,918 Domestic carriers 1,427 1,453 1,424 1,453 Dealers, agents and others 3,497 4,740 3,406 4,740
HTM investments: Investment in debt securities 495 484 495 484
Available-for-sale financial assets 146 147 146 147 Financial instruments at FVPL:
Short-term investments 522 517 522 517 Long-term currency swap 250 178 250 178 Bifurcated embedded derivatives 6 5 6 5
Derivatives used for hedging: Forward foreign exchange contracts 11 – 11 – Total 56,112 55,589 55,390 55,127
___________________ (1) Gross financial assets before taking into account any collateral held or other credit enhancements or offsetting arrangements. (2) Gross financial assets after taking into account any collateral held or other credit enhancements or offsetting arrangements or deposit
insurance. The table below provides information regarding the credit quality by class of our financial assets according to our credit ratings of counterparties as at June 30, 2011 and December 31, 2010:
Neither past due
nor impaired Past due but Total Class A(1) Class B(2) not impaired Impaired (in million pesos) June 30, 2011 (Unaudited) Loans and receivables:
Advances and refundable deposits 1,024 996 28 – – Cash and cash equivalents 38,658 37,537 1,121 – – Short-term investments 78 78 – – – Retail subscribers 8,727 1,127 702 1,288 5,610 Corporate subscribers 8,663 625 298 1,692 6,048 Foreign administrations 4,450 1,874 931 1,461 184 Domestic carriers 1,562 135 19 1,273 135 Dealers, agents and others 4,037 2,109 945 443 540
HTM investments: Investment in debt securities 495 495 – – –
Available-for-sale financial assets 146 108 38 – – Financial instruments at FVPL(3):
Short-term investments 522 522 – – – Long-term currency swap 250 250 – – –Bifurcated embedded derivatives 6 6 – – –
Derivatives used for hedging: Forward foreign exchange contracts 11 11 – – – Total 68,629 45,873 4,082 6,157 12,517

F-111
Neither past due
nor impaired Past due but Total Class A(1) Class B(2) not impaired Impaired (in million pesos) December 31, 2010 (Audited) Loans and receivables:
Advances and refundable deposits 1,000 951 49 – – Cash and cash equivalents 36,678 35,368 1,310 – – Short-term investments 152 152 – – – Retail subscribers 8,917 946 926 2,000 5,045 Corporate subscribers 7,998 393 612 1,037 5,956 Foreign administrations 4,479 1,756 699 1,866 158 Domestic carriers 1,591 191 23 1,239 138 Dealers, agents and others 5,273 2,599 2,013 128 533
HTM investments: Investment in debt securities 484 484 – – –
Available-for-sale financial assets 147 108 39 – – Financial instruments at FVPL(3):
Short-term investments 517 517 – – – Long-term currency swap 178 178 – – – Bifurcated embedded derivatives 5 5 – – – Total 67,419 43,648 5,671 6,270 11,830
___________________ (1) This includes low risk and good paying customer accounts with no history of account treatment for a defined period and no overdue accounts
as at report date; and deposits or placements to counterparties with good credit rating or bank standing financial review. (2) This includes medium risk and average paying customer accounts with no overdue accounts as at report date, and new customer accounts for
which sufficient credit history has not been established; and deposits or placements to counterparties not classified as Class A. (3) Gross receivables from counterparties, before any offsetting arrangements. The aging analysis of past due but not impaired class of financial assets as at June 30, 2011 and December 31, 2010 are as follows: Past due but not impaired
Total Neither past due
nor impaired 1-60 days 61-90 days Over 91 days Impaired (in million pesos) June 30, 2011 (Unaudited) Loans and receivables:
Advances and refundable deposits 1,024 1,024 – – – – Cash and cash equivalents 38,658 38,658 – – – – Short-term investments 78 78 – – – – Retail subscribers 8,727 1,829 1,073 132 83 5,610 Corporate subscribers 8,663 923 878 230 584 6,048 Foreign administrations 4,450 2,805 585 223 653 184 Domestic carriers 1,562 154 175 199 899 135 Dealers, agents and others 4,037 3,054 46 321 76 540
HTM investments: Investment in debt securities 495 495 – – – –
Available-for-sale financial assets 146 146 – – – – Financial instruments at FVPL:
Short-term investments 522 522 – – – – Long-term currency swap 250 250 – – – –Bifurcated embedded derivatives 6 6 – – – –
Derivatives used for hedging: Forward foreign exchange contracts 11 11 – – – – Total 68,629 49,955 2,757 1,105 2,295 12,517

F-112
Past due but not impaired
Total Neither past due
nor impaired 1-60 days 61-90 days Over 91 days Impaired (in million pesos) December 31, 2010 (Audited) Loans and receivables:
Advances and refundable deposits 1,000 1,000 – – – –Cash and cash equivalents 36,678 36,678 – – – – Short-term investments 152 152 – – – – Retail subscribers 8,917 1,872 1,387 150 463 5,045Corporate subscribers 7,998 1,005 642 159 236 5,956Foreign administrations 4,479 2,455 616 393 857 158 Domestic carriers 1,591 214 165 182 892 138 Dealers, agents and others 5,273 4,612 21 20 87 533
HTM investments: Investment in debt securities 484 484 – – – –
Available-for-sale financial assets 147 147 – – – – Financial instruments at FVPL:
Short-term investments 517 517 – – – – Long-term currency swap 178 178 – – – – Bifurcated embedded derivatives 5 5 – – – – Total 67,419 49,319 2,831 904 2,535 11,830
Impairment Assessments The main consideration for the impairment assessment include whether any payments of principal or interest are overdue by more than 90 days or whether there are any known difficulties in the cash flows of counterparties, credit rating downgrades, or infringement of the original terms of the contract. Our impairment assessments are classified into two areas: individually assessed allowance and collectively assessed allowances.
Individually assessed allowance We determine the allowance appropriate for each individually significant loan or advance on an individual basis. Items considered when determining allowance amounts include the sustainability of the counterparty’s business plan, its ability to improve performance once a financial difficulty has arisen, projected receipts and the expected dividend payout should bankruptcy ensue, the availability of other financial support, the realizable value of collateral, if any, and the timing of the expected cash flows. The impairment losses are evaluated at each reporting date, unless unforeseen circumstances require more careful attention.
Collectively assessed allowances Allowances are assessed collectively for losses on loans and advances that are not individually significant and for individually significant loans and advances where there is no objective evidence of individual impairment. Allowances are evaluated on each reporting date with each portfolio receiving a separate review. The collective assessment takes account of impairment that is likely to be present in the portfolio even though there is no objective evidence of the impairment in an individual assessment. Impairment losses are estimated by taking into consideration the following information: historical losses on the portfolio, current economic conditions, the approximate delay between the time a loss is likely to have been incurred and the time it is identified as requiring an individually assessed impairment allowance, and expected receipts and recoveries once impaired. The impairment allowance is then reviewed by credit management to ensure alignment with our policy. Capital Management Risk We aim to achieve an optimal capital structure in pursuit of our business objectives which include maintaining healthy capital ratios and strong credit ratings, and maximizing shareholder value. In recent years, our cash flow from operations has allowed us to substantially reduce debts and, in 2005, resume payment of dividends on common shares. Since 2005, our strong cash flow has enabled us to make investments in new areas and pay higher dividends.

F-113
Our approach to capital management focuses on balancing the allocation of cash and the incurrence of debt as we seek new investment opportunities for new businesses and growth areas. Our current dividend policy is to pay out 70% of our core earnings per share. Further, in the event no investment opportunities arise, we may consider the option of returning additional cash to our shareholders in the form of special dividends or share buybacks. Philippine corporate regulations prescribe, however, that we can only pay out dividends or make capital distribution up to the amount of our unrestricted retained earnings. As part of our goal to maximize returns to our shareholders, we obtained in 2008 an approval from the Board of Directors to conduct a share buyback program for up to five million PLDT common shares. We had acquired at total of approximately 2.72 million shares of PLDT’s common stock at a weighted average price of Php2,388 per share for a total consideration of Php6,505 million as at June 30, 2011 and December 31, 2010. See Note 8 – Earnings Per Common Share and Note 18 – Equity. Some of our debt instruments contain covenants that impose maximum leverage ratios. In addition, our credit ratings from the international credit ratings agencies are based on our ability to remain within certain leverage ratios. We monitor capital using several financial leverage measurements calculated in conformity with PFRS, such as net consolidated debt to equity ratio. Net consolidated debt is derived by deducting cash and cash equivalents and short-term investments from total debt (long-term debt, including current portion and notes payable). Our objective is to maintain our net consolidated debt to equity ratio below 100%. The table below provides information regarding our consolidated debt to equity ratio as at June 30, 2011 and December 31, 2010: 2011 2010 (Unaudited) (Audited) (in million pesos) Long-term debt, including current portion (Note 19) 93,502 89,646 Notes payable (Note 20) 651 – Total consolidated debt 94,153 89,646 Cash and cash equivalents (Note 14) (38,658) (36,678)Short-term investments (600) (669)Net consolidated debt 54,895 52,299 Equity attributable to equity holders of PLDT 91,292 97,069 Net consolidated debt to equity ratio 60% 54%
27. Cash Flow Information
The table below shows non-cash investing activities for the six months ended June 30, 2011 and 2010: 2011 2010 (Unaudited) (in million pesos) Recognition of asset retirement obligations (Note 20) 12 30 Transfer of Meralco shares to Beacon (Note 10) – 15,098

F-114
28. Other Matter
PLDT’s Acquisition of Digital Telecommunications Philippines, Inc., or Digitel
On March 29, 2011, the Board Directors of PLDT and JG Summit Holdings, Inc., or JGS, approved the acquisition by PLDT of JGS’s and certain other seller-parties’ ownership interest in Digitel, comprising of: (i) 3.28 billion common shares in Digitel, representing approximately 51.55% of the issued common stock; (ii) zero-coupon convertible bonds issued by Digitel and its subsidiary to JGS and its subsidiary, which are convertible into approximately 18.6 billion common shares of Digitel assuming a conversion date of June 30, 2011 and an exchange rate of Php43.405 per U.S. dollar; and (iii) intercompany advances made by JGS to Digitel in the total principal amount plus accrued interest of Php34.1 billion as at December 30, 2010 (the “Assets”). Digitel operates a fixed line business in certain parts of the country and is the 100% owner of Digitel Mobile Philippines, Inc., or DMPI, which is engaged in the mobile telecommunications business and owns the brand Sun Cellular.
PLDT agreed to pay JGS and certain other seller-parties Php69.2 billion, which will be settled by the issuance of one new PLDT common share for every Php2,500 (equivalent to 27.68 million new PLDT common shares) consideration payable for the Assets. In order to aid the board of PLDT in discharging their fiduciary duties, PLDT engaged an independent financial advisor to review the transaction and render a fairness opinion on the transaction and the consideration payable by PLDT. The independent financial advisor has completed its review and concluded that the acquisition of the Assets is fair and reasonable and in the interest of PLDT shareholders as a whole.
PLDT further expects to announce its intention to conduct a tender offer for all the remaining Digitel shares, approximately 48.45% of the issued common stock of Digitel, held by the other shareholders of Digitel. Under the contemplated tender offer, it is anticipated that PLDT will offer to purchase the remaining Digitel shares at the price of Php1.6033 per Digitel share, which will be paid in the form of either PLDT shares issued at Php2,500 per share or cash, at the option of Digitel shareholders. The contemplated tender offer price will be equivalent to the fully diluted price per share of Digitel, assuming full conversion of the convertible bonds. Should all remaining shareholders of Digitel accept the tender offer by PLDT, PLDT will issue a total of 29.65 million new PLDT common shares for the acquisition of the Assets and for the remaining Digitel shares held by the other shareholders of Digitel. The 29.65 million new PLDT common shares will represent up to approximately 13.7% of the enlarged issued and outstanding common stock of PLDT. Assuming full acceptance by the minorities of Digitel, the total transaction consideration would be approximately Php74.1 billion. The completion of the acquisition is subject to the procurement of certain regulatory and other approvals, including: (i) the approval by the NTC of the sale or transfer of JGS and the other seller-parties’ Digitel shares representing more than 40% of Digitel’s issued and outstanding common stock; (ii) the confirmation by the Philippine SEC of the valuation of the Assets; (iii) the approval by the PSE of the block sale of the Digitel shares; (iv) the confirmation by the Philippine SEC that the issuance of the PLDT common shares to JGS and the other seller-parties is exempt from the registration requirement of the Securities Regulation Code; and (v) all other necessary approvals under applicable laws and regulations; and the approval by the common stockholders of PLDT for the issuance of the PLDT common shares as payment for the purchase price of the Assets and the Digitel shares which shall have been tendered pursuant to the tender offer. In addition, the sale of the Digitel shares owned by the seller-parties is subject to the consent of certain creditors of Digitel and DMPI. On June 14, 2011, the stockholders’ approval mentioned above was obtained.

F-115
Digitel and DMPI have outstanding long-term debts that are guaranteed by JGS. The loans and guarantees contain representations and covenants applicable only to JGS including that on the ownership of JGS in Digitel. To date, Digitel and DMPI have provided the necessary notices and obtained the required consents of the lenders and export credit agencies both for the transfer of ownership of Digitel and the replacement of JGS by PLDT as guarantor under these loans. The amendments to the covenants and the PLDT guarantee will take effect upon closing or completion of the acquisition. On June 30, 2011, the parties agreed to extend the closing date of the transaction from June 30, 2011 to July 30, 2011. On July 30, 2011, the parties agreed to extend anew the closing date of the transaction from July 30, 2011 to August 26, 2011. The parties are still awaiting the approvals of various regulatory bodies.


