35
AWWA Webinar: Investigating ATP Analysis for Infrastructure Release for Service 11/4/2020 Please consider the environment before printing. 1 2 1 2
AWWA Webinar: Investigating ATP Analysis for Infrastructure Release for Service11/4/2020
Please consider the environment before printing. 1
2
1
2

AWWA Webinar: Investigating ATP Analysis for Infrastructure Release for Service11/4/2020
Please consider the environment before printing. 2
WEBINAR MODERATOR
Nathan Edman
Standards Methods Manager
American Water Works Association
Nathan oversees and manages the content production of Standard Methods for the Examination of Water and Wastewater compendium and is in charge of a majority of the AWWA chemical standards committees.
Nathan received his Bachelor of Science Degree in Chemistry from the University of Arizona.
3
ENHANCE YOUR WEBINAR EXPERIENCE
• Close✓Email Programs
✓ Instant messengers
✓Other programs not in use
• GoToWebinar Support
https://support.logmeininc.com/gotowebinar?labelid=4a17cd95
4
3
4

AWWA Webinar: Investigating ATP Analysis for Infrastructure Release for Service11/4/2020
Please consider the environment before printing. 3
WEBINAR SURVEY
• Immediately upon closing the webinar
➢Survey window opens
➢Thank you!
5
PRODUCTS OR SERVICES DISCLAIMER
The mention of specific products or services in this webinar does not represent AWWA endorsement, nor do the opinions expressed in it
necessarily reflect the views of AWWA
AWWA does not endorse or approve products or services
6
5
6

AWWA Webinar: Investigating ATP Analysis for Infrastructure Release for Service11/4/2020
Please consider the environment before printing. 4
PANEL OF EXPERTS
7
Amina Stoddart, PhD, PE
Assistant Professor
Dalhousie Univeristy
Brad MacIlwain, PE, MASc
Application Engineer
LuminUltra Technologies
AGENDA
I. Microbial Monitoring in Drinking Water Distribution Systems Using ATP
II. ATP Dynamics in Drinking Water Distribution Systems
Brad MacIlwain, PE, MASc
Amina Stoddart, PhD, PE
8
7
8
AWWA Webinar: Investigating ATP Analysis for Infrastructure Release for Service11/4/2020
Please consider the environment before printing. 5
ASK THE EXPERTS
Enter your question into the question pane on the right-hand side of the screen.
Please specify to whom you are addressing the question.9
Amina Stoddart, PhD, PE
Dalhousie Univeristy
Brad MacIlwain, PE, MASc
LuminUltra Technologies
MICROBIAL MONITORING IN DRINKING WATER DISTRIBUTION
SYSTEMS USING ATP
Brad McIlwain, P.Eng., MASc.
Application Engineer
LuminUltra
10
9
10

AWWA Webinar: Investigating ATP Analysis for Infrastructure Release for Service11/4/2020
Please consider the environment before printing. 6
11
• In drinking water, we often focus on specific microorganisms or groups of microorganisms
- E. coli + total coliforms
- Giardia
- Crypto
• Often limited to regulated parameters
• Many operational issues caused by other microorganisms
MICROBES IN WATER DISTRIBUTION SYSTEMS
12
Non-pathogenic microbes can cause several issues within a system:
• Consume disinfectant residual
• Promote biofilm formation
• Promote corrosion
• Contribute to taste and odour issues
• Cause nitrification
MICROBES IN WATER DISTRIBUTION SYSTEMS
11
12

AWWA Webinar: Investigating ATP Analysis for Infrastructure Release for Service11/4/2020
Please consider the environment before printing. 7
13
Microorganisms cause costly problems. Time and resources can be saved by preventing or responding more quickly to microbiological growth.
MICROBES IN WATER DISTRIBUTION SYSTEMS
Complaints
Health Risks
Waste
Labour demands
14
• Treatment and Disinfection- Reduce nutrients
- Remove, inactivate, or kill microorganisms
• Distribution- Maintain disinfectant residual
- Maintain pH
- Manage water age
- Biofilm removal
MECHANISMS FOR CONTROLLING GROWTH
13
14

AWWA Webinar: Investigating ATP Analysis for Infrastructure Release for Service11/4/2020
Please consider the environment before printing. 8
15
• When testing is needed- Routine testing – identify need for actions
- Troubleshooting – identify problem
- Follow-up – Verify corrective actions
• Common parameters- Temperature & pH
- Turbidity
- Disinfectant residual
What about biological content?
MONITORING DISTRIBUTION SYSTEM MICROBIOLOGICAL GROWTH
16
• Examples include E. coli and total coliform testing
• Indicates a system breach
• Important for monitoring integrity and sanitary quality
• Impractical for operational monitoring
BACTERIAL INDICATOR TESTING
Delayed resultsRepresent a portion of population
Typically no detections
15
16

AWWA Webinar: Investigating ATP Analysis for Infrastructure Release for Service11/4/2020
Please consider the environment before printing. 9
17
Heterotrophic Plate Count (HPC)
• HPC is an attempt at a total microbial count (CFU/mL)
• Drawbacks for field-use:
- Only captures small proportion of community (0.1-1%)
- Requires at least 48 hours for results.
• Many utilities choose not to do many HPCs since they do not isolate pathogens.
GENERAL MICROBIOLOGICAL MONITORING IN DRINKING WATER
18
• ATP testing provides a rapid, non-specific measure of total microbial content.
• Advantages:
- Real-time feedback (< 5 minutes)
- Complete results (all cells contain ATP)
- Field-ready
• Decisions can be made on-the-spot enabling same-shift troubleshooting
• Compliant with ASTM D4012.
ATP TESTING
17
18

AWWA Webinar: Investigating ATP Analysis for Infrastructure Release for Service11/4/2020
Please consider the environment before printing. 10
WHAT IS ATP?
19
• ATP = Adenosine Triphosphate
• Molecule associated with cellular energy in all living cells
• Contained in all living cells, so quantifying it allows you to quantify the size of the total population
• Measured via firefly luciferase reaction
- ATP + luciferase = light = microbes
• Measurement takes only minutes.
• ATP testing has been used in food & medical hygiene for decades.
20
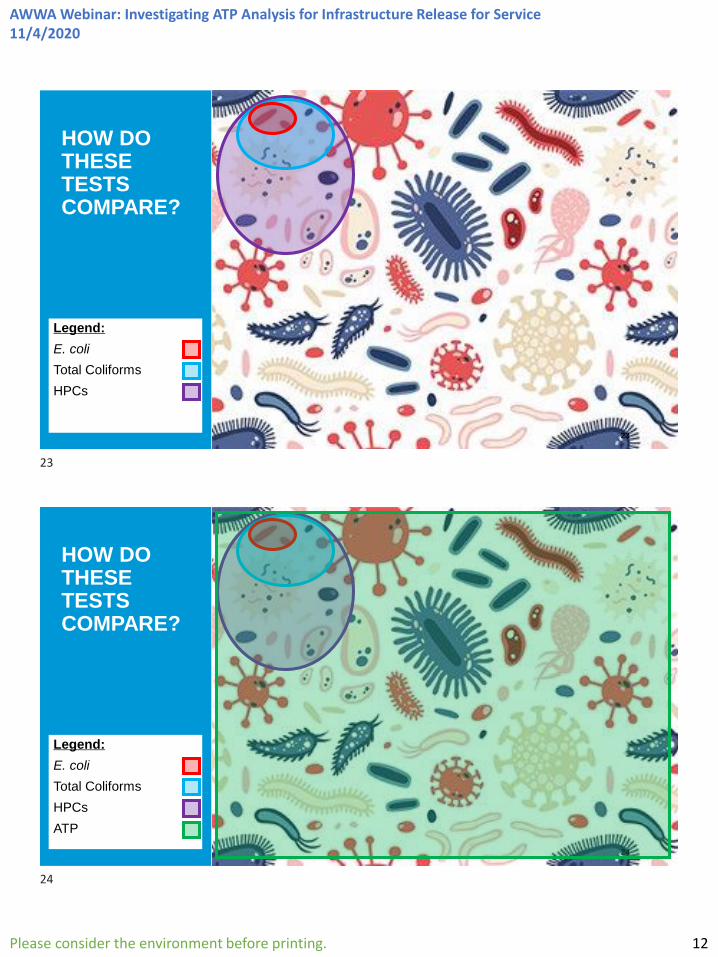
HOW DO THESE TESTS COMPARE?
19
20

AWWA Webinar: Investigating ATP Analysis for Infrastructure Release for Service11/4/2020
Please consider the environment before printing. 11
21
HOW DO THESE TESTS COMPARE?
Legend:
E. coli
22
HOW DO THESE TESTS COMPARE?
Legend:
E. coli
Total Coliforms
21
22
AWWA Webinar: Investigating ATP Analysis for Infrastructure Release for Service11/4/2020
Please consider the environment before printing. 12
23
HOW DO THESE TESTS COMPARE?
Legend:
E. coli
Total Coliforms
HPCs
24
HOW DO THESE TESTS COMPARE?
Legend:
E. coli
Total Coliforms
HPCs
ATP
23
24

AWWA Webinar: Investigating ATP Analysis for Infrastructure Release for Service11/4/2020
Please consider the environment before printing. 13
25
RUNNING ATP TESTS
1. Filter Sample
2. Extract ATP
3. Measure ATP
26
Measurements are obtained in relative light units (RLU) and converted to concentration of ATP (pg/mL) using a standard calibration.
RUNNING ATP TESTS
Action Level
Good Control < 1 pg/mL
Preventive Action 1 – 10 pg/mL
Corrective Action > 10 pg/mL
Typical Interpretation Guidelines
25
26
AWWA Webinar: Investigating ATP Analysis for Infrastructure Release for Service11/4/2020
Please consider the environment before printing. 14
27
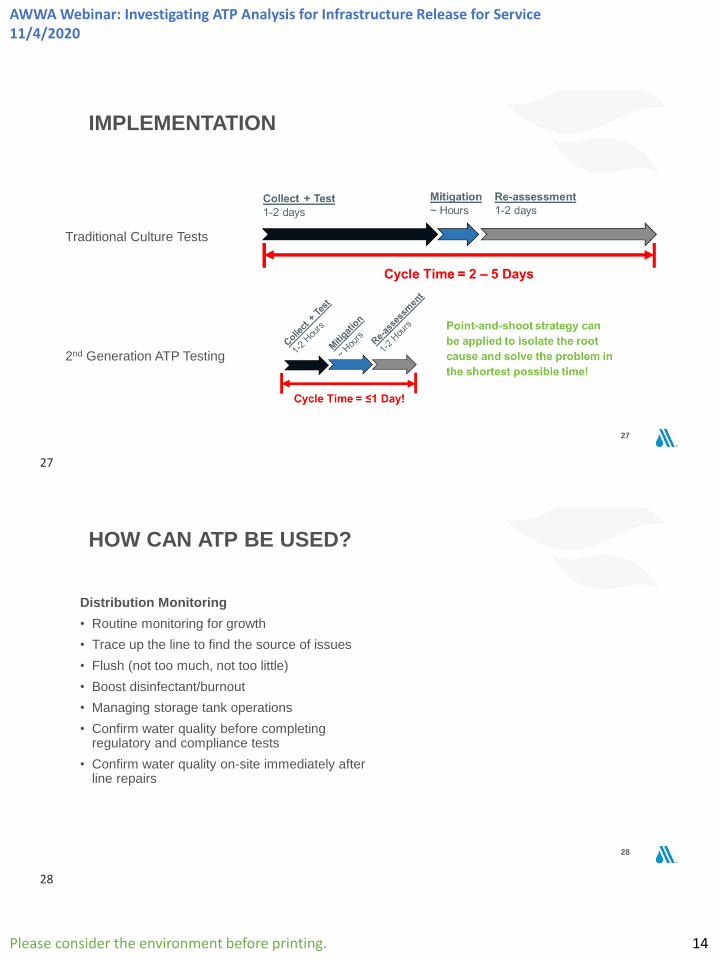
Traditional Culture Tests
IMPLEMENTATION
2nd Generation ATP Testing
28
HOW CAN ATP BE USED?
Distribution Monitoring
• Routine monitoring for growth
• Trace up the line to find the source of issues
• Flush (not too much, not too little)
• Boost disinfectant/burnout
• Managing storage tank operations
• Confirm water quality before completing regulatory and compliance tests
• Confirm water quality on-site immediately after line repairs
27
28

AWWA Webinar: Investigating ATP Analysis for Infrastructure Release for Service11/4/2020
Please consider the environment before printing. 15
29
HOW CAN ATP BE USED?
Other Applications
• Source water monitoring (algae, cyanobacteria)
• Biofiltration
• Membrane filtration pre-treatment
• Monitor growth as part of water management program for building water systems
CASE STUDY
30
29
30

AWWA Webinar: Investigating ATP Analysis for Infrastructure Release for Service11/4/2020
Please consider the environment before printing. 16
31
CASE STUDY – CROSS CONNECTIONS
• Naegleria fowleri amoeba found in a Louisiana drinking water distribution system
• Action taken to raise total chlorine residual to emergency rule level
• Samples collected and analyzed for total chlorine and ATP to establish a baseline
32
CASE STUDY – CROSS CONNECTIONS
0.0
0.5
1.0
1.5
2.0
2.5
3.0
0.01
0.1
1
10
100
1000
10000
Tota
l C
hlo
rine (
mg
/L)
log
10 c
AT
P (
pg
/mL)
cATP (pg/mL) Total Chlorine (mg/L)
• High ATP and low chlorine at ends of system
• ATP spike and chlorine drop between West 4 and West 5
31
32
AWWA Webinar: Investigating ATP Analysis for Infrastructure Release for Service11/4/2020
Please consider the environment before printing. 17
33
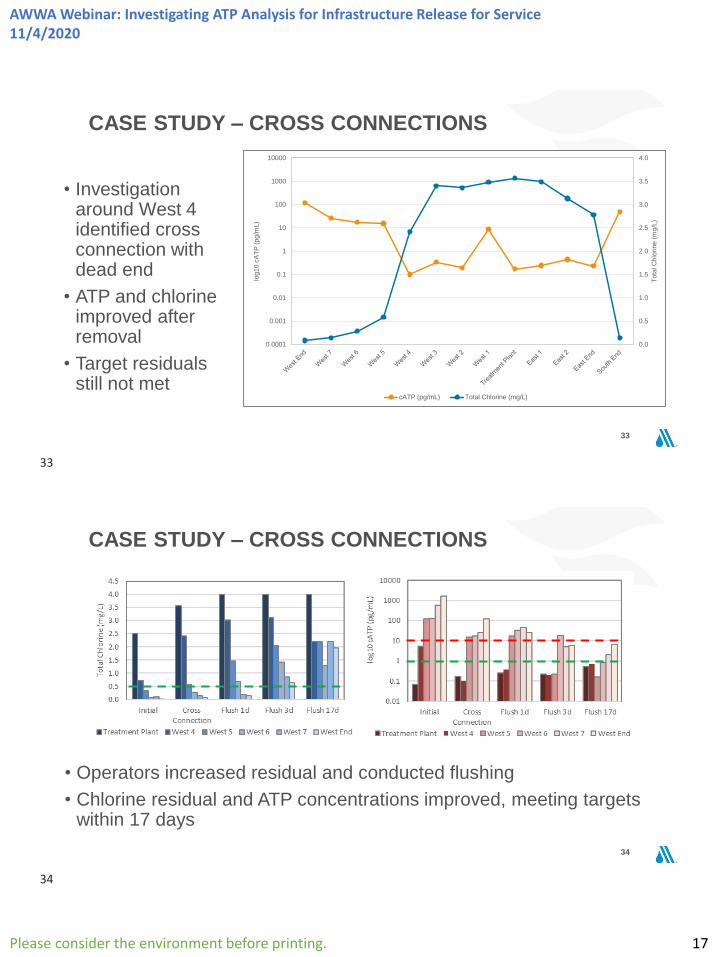
CASE STUDY – CROSS CONNECTIONS
0.0
0.5
1.0
1.5
2.0
2.5
3.0
3.5
4.0
0.0001
0.001
0.01
0.1
1
10
100
1000
10000
Tota
l C
hlo
rine (
mg/L
)
log10 c
AT
P (
pg/m
L)
cATP (pg/mL) Total Chlorine (mg/L)
• Investigation around West 4 identified cross connection with dead end
• ATP and chlorine improved after removal
• Target residuals still not met
34
CASE STUDY – CROSS CONNECTIONS
• Operators increased residual and conducted flushing
• Chlorine residual and ATP concentrations improved, meeting targets within 17 days
33
34
AWWA Webinar: Investigating ATP Analysis for Infrastructure Release for Service11/4/2020
Please consider the environment before printing. 18
SUMMARY
• ATP provides a rapid method for measuring total bioburden in water samples at any stage of the water supply process –supply, treatment, and distribution
• Tests are designed specifically for field-use, providing results on the spot
• Not dependent on incubation – test is rapid and measures all active cells, not just those capable of growing on media
• Can be used for routine monitoring, troubleshooting, and assessing corrective actions
35
ASK THE EXPERTS
Enter your question into the question pane on the right-hand side of the screen.
Please specify to whom you are addressing the question.36
Amina Stoddart, PhD, PE
Dalhousie Univeristy
Brad MacIlwain, PE, MASc
LuminUltra Technologies
35
36
AWWA Webinar: Investigating ATP Analysis for Infrastructure Release for Service11/4/2020
Please consider the environment before printing. 19
ATP DYNAMICS IN DRINKING WATER DISTRIBUTION SYSTEMS
37
Amina Stoddart
Assistant Professor
Dalhousie University
AWWA TEC PROJECT
ATP & Coliform Analysis Comparison For Infrastructure Release For Service
38
Acknowledgements
• Amina Stoddart, PhD
• Graham Gagnon, PhD
• Dallys Serracin
• Fatou Secka
• Toni Mullin
• Ashley Evans, PE
• Rebecca Slabaugh, PE
• Brent Alspach, PE
• Technical Educational Council
• Distribution System Committee
Project Advisory Committee
• Richard Giani
• Corinne Bertoia
• Laura Meteer
• Theodore Nicholas
• Randy Easley
• Dave Tracey
Participating Utilities• Halifax Water
• Greater Cincinnati Water Works
• Ann Arbor
• Newmarket
• City of Bethlehem
• Valley Water
• York
37
38

AWWA Webinar: Investigating ATP Analysis for Infrastructure Release for Service11/4/2020
Please consider the environment before printing. 20
PROJECT MOTIVATION
39
Water main break (HalifaxToday, 2020)
• Total coliform testing is routinely used as a key determinant of when distribution system infrastructure can be released for service following:
- Installation of a new main
- Repair of a main break
- Cleaning, disinfection, and/or maintenance of a treated water storage reservoir
• Total coliform testing can take 20-30 h from time of collection to result
• Use of an alternative indicator to coliform testing could have economic, conservation, customer, environmental and community benefits
40
Investigate the use of adenosine triphosphate (ATP) as a risk assessment indicator for
operational guidance that may be used as an alternate method to total coliform testing for
distribution system events
PROJECT OBJECTIVE
39
40

AWWA Webinar: Investigating ATP Analysis for Infrastructure Release for Service11/4/2020
Please consider the environment before printing. 21
41
1000
10000
100000
1000000
1-Apr-12 18-Oct-12 6-May-13 22-Nov-1310-Jun-1427-Dec-14
Bio
ma
ss
–p
g A
TP
/g
Sustained Biomass (Start of Filter Run)• ATP is an energy carrying
molecule found in all living cells
• ATP concentration can provide an indication of biomass quantity in a laboratory or field setting within minutes
• Measurement of ATP content in microorganisms has found use in the water industry for:
- Microbial monitoring in distribution systems
- Biofilters
Stoddart, A.K., Schmidt, J.J. & Gagnon, G.A. 2016. Biomass
evolution in full-scale anthracite-sand drinking water filters
following conversion to biofiltration. J Am Water Works, 108(12),
615-623.
ADENOSINE TRIPHOSPHATE (ATP)
42
1. Calibration 2. Measure Sample Volume
3. Sample Filtration 4. Extraction
5. Assay
ADENOSINE TRIPHOSPHATE (ATP)
41
42

AWWA Webinar: Investigating ATP Analysis for Infrastructure Release for Service11/4/2020
Please consider the environment before printing. 22
43
Sample turnaround time of minutes (~15 mins) as compared to hours (20-30 h) for total coliform testing
Suitable for in-field testing
Non-specific
GENERAL ATP ADVANTAGES
44
Distribution System
Targeted Event Type
Disadvantages of Coliform
Analysis due to 20-30 Hour
Analysis Turn-Around-
Time
cATP Analysis
Considerations
Releasing newly
installed water mains
for service
• Increased construction
time and costs and lost
production
• Excess water released
during flushing
• Sample
turnaround time of
approximately 15
minutes
• True total non-
specific biomass
measurement
rather than a
specific biological
assay
• On-site testing as
opposed to
laboratory testing,
allowing for rapid
decisions
Releasing mains for
service after breaks
• Customer/community
impacts due to Boil Water
Advisory/Boil Orders or
suspended service
Releasing treated water
storage reservoirs for
service after cleaning,
disinfection, and/or
maintenance
• Negative distribution
system water quality
impacts
• Temporary loss of storage
and/or reduced pressure
in the distribution system
POTENTIAL ATP ADVANTAGES FOR DISTRIBUTION SYSTEM INFRASTRUCTURE
43
44

AWWA Webinar: Investigating ATP Analysis for Infrastructure Release for Service11/4/2020
Please consider the environment before printing. 23
45
• A routine distribution system sample came back positive for total coliforms, along with multiple resamples
• Extensive water quality monitoring in combination with total coliform sampling was conducted
• ATP was added to monitoring list (with chlorine and temperature)- TC sampling could have led to a resampling loop
- HPC found to be too time consuming
• For this event, ATP in conjunction with other parameters, provided extra confidence
Gupta, K. (2014) Evaluation of the ATP Test for Nitrification Monitoring at the Portland Water
Bureau. Pacific Northwest Section Conference.
EARLY ATP STUDY IN LITERATURE:
PORTLAND WATER BUREAU
46
Utility Disinfectant Type Size
A Chloramines >100,000 Customers
B Free Chlorine >1 million Customers
D Free Chlorine >300,000 Customers
E Chloramines <100,000 Customers
F Chloramines >1 million Customers
I Free Chlorine <50,000 Customers
• Partnered with utilities across North America to collect historical and new ATP and total coliform distribution system data
• Selected utilities with with different disinfectant type and service size
APPROACH
45
46

AWWA Webinar: Investigating ATP Analysis for Infrastructure Release for Service11/4/2020
Please consider the environment before printing. 24
47
• Where available, utilities provided historical ATP and coliform distribution system water quality data
- Data reflected normal operation and provided a baseline for each distribution system
• Also requested temperature, pH, turbidity, dissolved oxygen, total organic carbon, and heterotrophic plate counts where available
APPROACH:
HISTORICAL DATA
48
• Utilities followed standard sampling protocols when releasing water mains and/or water storage reservoirs for service
• Specific Events:
- releasing newly installed water mains for service
- releasing mains for service after breaks
- releasing treated water storage reservoirs for service after cleaning, disinfection, and/or maintenance
APPROACH:
EVENT SAMPLING
47
48

AWWA Webinar: Investigating ATP Analysis for Infrastructure Release for Service11/4/2020
Please consider the environment before printing. 25
49
• Provided utilities with detailed sampling plans for each event type in addition to AWWA/ANSI resources
APPROACH:
EVENT SAMPLING
50
Required Water Quality
ParametersOptional Parameter
• cATP
• Total Coliform
(quantitative)
• Disinfectant Residual
• Temperature
• Turbidity
• HPC
• pH
• Dissolved Oxygen
• Alkalinity
• Specific Conductance
• Odor
• Enterococci
• Additional sampling requested:
- Pre-event, Event, Post-event
• Additional parameters requested:
- Microbiological; General water quality
APPROACH:
EVENT SAMPLING
49
50

AWWA Webinar: Investigating ATP Analysis for Infrastructure Release for Service11/4/2020
Please consider the environment before printing. 26
51
UtilityHistorical
Data Provided
Events (N=#)
New Main Main Break Reservoir
A ✓ 7 - -
B ✓ 7 3 -
D ✓ 3 7 1
E ✓ 1 - -
F ✓ - - -
Note: Not all participating utilities had historical data or were able to collect data for the study at
time of presentation
SUMMARY OF DATA COLLECTED TO DATE
52
PRELIMINARY FINDINGS:
HISTORICAL DATA
51
52

AWWA Webinar: Investigating ATP Analysis for Infrastructure Release for Service11/4/2020
Please consider the environment before printing. 27
53
Sample Location nAverage
(pg/mL)Range (pg/mL) Source
Reservoirs and network
pipes7 1.8 ± 1.0 -
Lautenschlager et
al., 2010
Water treatment plant
effluent & distribution
plumbing
243 2.5 1 – 8 Van der Kooij, 2003
Watermain pipes - 2.7 - Lui et al., 2014
Premise plumbing 20011.7 (±
8.62)1 2.54 – 47.71 Siebel et al., 2008
Water mains &
storage reservoirs- - <1 – >1000 Current Study
• Observed a larger range in ATP values than has been
reported in literature
• Under normal operating conditions, ATP concentrations
in the participating distribution systems ranged from
<1 pg/mL to >1000 pg/mL
PRELIMINARY FINDINGS:
HISTORICAL DATA
54
• In general, lower disinfectant residual concentrations appeared to correspond to higher ATP concentrations
• Disinfectant residual appeared to have the greatest effect as compared to other water quality factors investigated (temperature, pH, etc.)
PRELIMINARY FINDINGS:
HISTORICAL DATA
53
54
AWWA Webinar: Investigating ATP Analysis for Infrastructure Release for Service11/4/2020
Please consider the environment before printing. 28
55
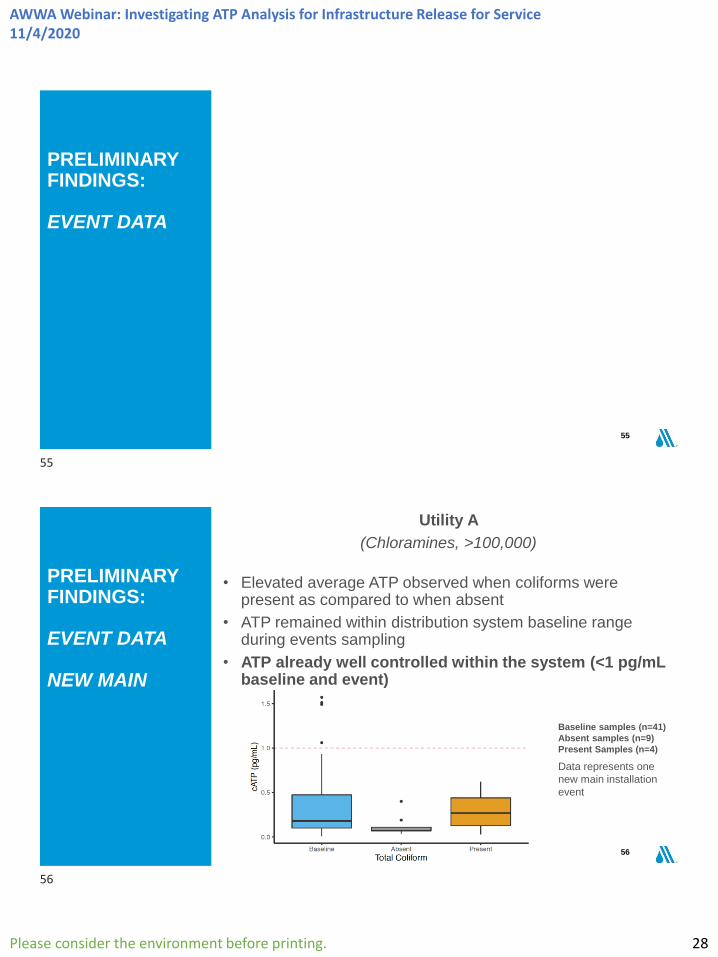
PRELIMINARY FINDINGS:
EVENT DATA
56
Data represents one
new main installation
event
Baseline samples (n=41)
Absent samples (n=9)
Present Samples (n=4)
Utility A
(Chloramines, >100,000)
• Elevated average ATP observed when coliforms were present as compared to when absent
• ATP remained within distribution system baseline range during events sampling
• ATP already well controlled within the system (<1 pg/mL baseline and event)
PRELIMINARY FINDINGS:
EVENT DATA
NEW MAIN
55
56

AWWA Webinar: Investigating ATP Analysis for Infrastructure Release for Service11/4/2020
Please consider the environment before printing. 29
57
Range Cellular ATP Values (pg/mL)
BaselineTotal Coliform
Absent
Total Coliform
Positive
<1 – 7387(n=1380)
<1 – 296(n=10)
159(n=1)
Utility E
(Chloramines, <100,000)
• ATP was typically low (<10 pg/mL, often <1 pg/mL) during event sampling despite higher baseline ATP values
• In some cases, coliforms were identified in event samples when when ATP was low
PRELIMINARY FINDINGS:
EVENT DATA
NEW MAIN
58
AT
P C
on
ce
ntr
ati
on
à
Heterotrophic
Plate Count
Temperature Chlorine
Residual
Utility D
(Chlorine, >300,000)
• No positive coliform results across several (7) main break events
• Well controlled system
- All event ATP results <10 pg/mL
• Higher event ATP appeared to correspond with higher HPC, higher temperature and lower chlorine residual
PRELIMINARY FINDINGS:
EVENT DATA
MAIN BREAK
57
58

AWWA Webinar: Investigating ATP Analysis for Infrastructure Release for Service11/4/2020
Please consider the environment before printing. 30
59
• Difficulty in coordinating sampling for main breaks given the unplanned nature of these events
• Difficulty in coordinating sampling when asking external contractors to add a new sample to their standard sample collection routine
• Challenges with measuring parameters in the field as field staff may not be equipped with necessary equipment and reagents
• Some utilities unable to revise standard procedures to allow for quantitative total coliform analysis
- Comparing quantitative ATP to P/A coliform data a challenge
CHALLENGES & LIMITATIONS
60
• Baseline ATP concentration range is unique to each distribution system
- When data was aggregated, higher baseline ATP was driven by lower chlorine residual more so than other water quality parameters
• ATP was typically well controlled (i.e., <10 pg/mL, often <1 pg/mL) during events across all utilities
- Very few positive total coliform samples were observed during event sampling (all utilities following ANSI/AWWA Standards)
• Some preliminary evidence that higher ATP concentrations during event sampling may signal greater chance of a positive coliform result in certain distribution systems
- Warrants further investigation
PRELIMINARY TAKEAWAYS
59
60

AWWA Webinar: Investigating ATP Analysis for Infrastructure Release for Service11/4/2020
Please consider the environment before printing. 31
61
Amina Stoddart, PhD, P.EngAssistant ProfessorDalhousie University
THANK YOU!
ASK THE EXPERTS
Enter your question into the question pane on the right-hand side of the screen.
Please specify to whom you are addressing the question.62
Amina Stoddart, PhD, PE
Dalhousie Univeristy
Brad MacIlwain, PE, MASc
LuminUltra Technologies
61
62
AWWA Webinar: Investigating ATP Analysis for Infrastructure Release for Service11/4/2020
Please consider the environment before printing. 32
ADDITIONAL RESOURCES
• AWWA Water Quality Resource Community
• M68 Water Quality in Distribution Systems
- AWWA catalog no: 30068
• M7 Problem Organisms in Water: Identification and Treatment
- AWWA catalog no: 30007
63
An Interactive, Online Event for Solving Your Water Quality and Infrastructure Challenges.
63
64

AWWA Webinar: Investigating ATP Analysis for Infrastructure Release for Service11/4/2020
Please consider the environment before printing. 33
UPCOMING WEBINARS
Nov 5 - FREE Webinar from SL Environmental Law Group: PFAS: Learn How to Navigate the Evolving Regulatory and Legal Landscape
Nov 12 - FREE Webinar from Hydromax USA: Pipeline Condition Assessment Technology - Innovative Solutions and Recent Field Applications
Nov 17 - FREE Webinar from Enchanted Rock: Industry Roundtable – Resilient Facility Design for the Water Utility Industry
Register for a 2020 Webinar Bundle
View the full 2020 schedule at awwa.org/webinars
65
THANK YOU FOR JOINING TODAY’S WEBINAR
• As part of your registration, you are entitled to an additional 30-day archive access of today’s program.
• Until next time, keep the water safe and secure.
66
65
66

AWWA Webinar: Investigating ATP Analysis for Infrastructure Release for Service11/4/2020
Please consider the environment before printing. 34
PRESENTER BIOGRAPHY INFORMATION
Brad McIlwain is an application engineer with LuminUltra, where he provides subject matter expertise in the development and implementation of LuminUltra’s microbial monitoring technologies. Prior to joining LuminUltra, he worked as a consultant in the municipal water and wastewater industry. He holds a BASc and MASc in civil engineering.
Amina Stoddart is an Assistant Professor with the Centre for Water Resources Studies at Dalhousie Univeristy. Her group’s research focuses on the development and application of tools to understand and optimize biological water treatment.
67
CE CREDITS (CEUS) AND PROFESSIONAL DEVELOPMENT HOURS (PDHS)
AWWA awards webinar attendees CEUs.
If you viewed this webinar live, you will receive a certificate through the AWWA account associated with the email address you used to register.
If you viewed this webinar through a group registration, contact your proctor to log your participation.
If you viewed this as an archive webinar, follow the directions included in your archive webinar email to log your participation.
Certificates will be available on your AWWA account within 30 days of the webinar
68
67
68

AWWA Webinar: Investigating ATP Analysis for Infrastructure Release for Service11/4/2020
Please consider the environment before printing. 35
HOW TO PRINT YOUR CERTIFICATE OF COMPLETION
Within 30 days of the webinar, login to www.awwa.org or register on the website. If you are having problems, please email [email protected]
Once logged in, go to:
• My Account (click on your name in the top right corner)
• My Transcripts
- To print your official transcript, click Print list
- To print individual certificates, click Download Certificate
69
70
69
70


![tis.nhai.gov.intis.nhai.gov.in/Admin/PGFiles/16all.pdfpdnhai@gmail . com website . nhai . ora P Please consider the environment before printing this. emal From: suresh yadav [mailto:sureshyadav79@yahoo.co.in]](https://static.documents.pub/doc/80x56/5ae67ad87f8b9ae1578db792/tisnhaigovintisnhaigovinadminpgfiles16allpdfpdnhaigmail-com-website.jpg)

![RICHARDS. Clare · Inspiring minds. Creating opportunities. Shaping Queensland1 s future. Please consider the environment before printing this email. From: Leanne Beikoff [mailto:Leanne.BEIKOFF@csyw.qld.gov.au]](https://static.documents.pub/doc/80x56/604ce8914b12d3724d37757c/richards-clare-inspiring-minds-creating-opportunities-shaping-queensland1-s-future.jpg)


