107
Please locate your worksream banner and sit in the corresponding area of the room

Please locate your worksream banner and sit
in the corresponding area of the room

NACAP Regional QI WorkshopsLiverpool – 30 May 2019

Welcome, context, plan for the dayProfessor Mike Roberts

Speakers, facilitators, NACAP teamMike Roberts James Calvert
Dennis Wat
Sally SinghBinita Kane
Ian Sinha
John Hurst

Becky Dubben
Agnese Lazzari
Gabriella Massa
Neena Garnavos
Liam Shanahan
Viki McMillan
Eloya Imoedemhe
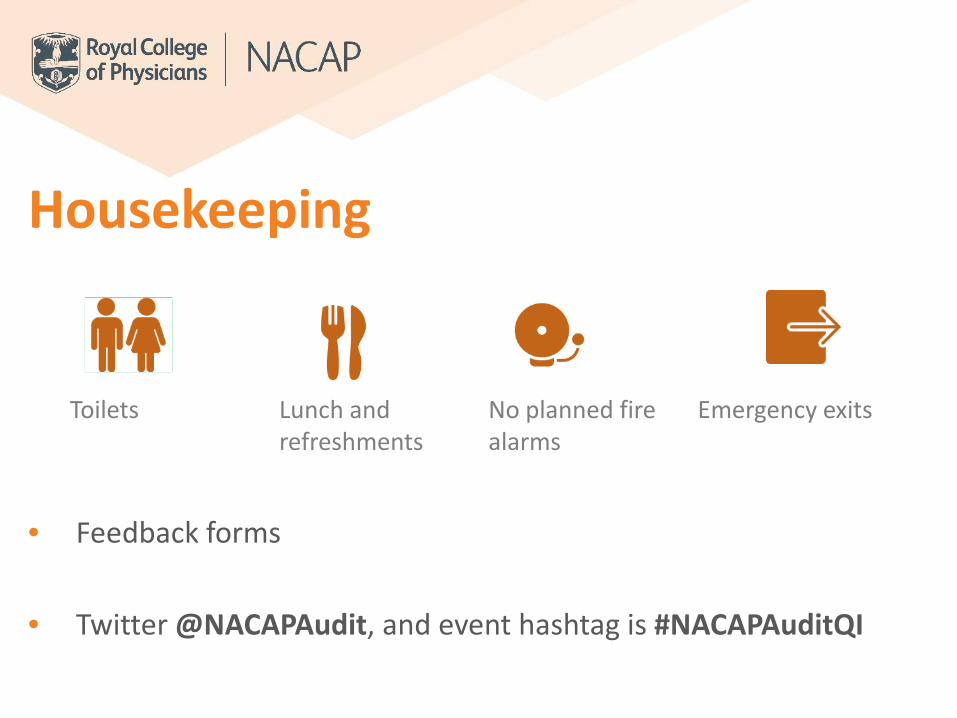
Housekeeping
• Feedback forms
• Twitter @NACAPAudit, and event hashtag is #NACAPAuditQI
Toilets Lunch and refreshments
No planned fire alarms
Emergency exits
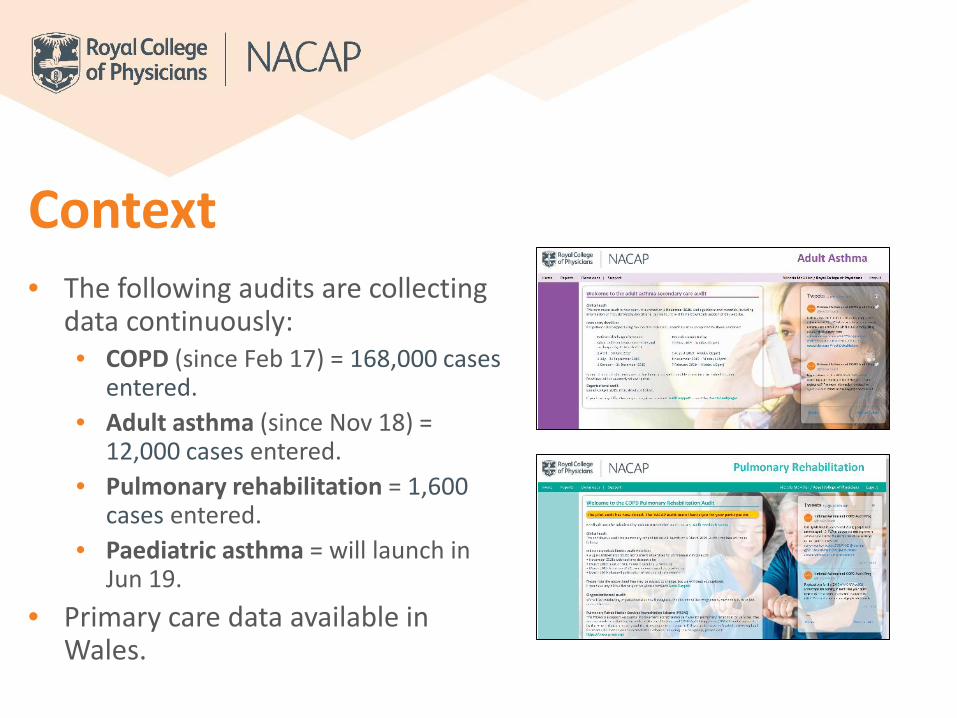
Context• The following audits are collecting
data continuously: • COPD (since Feb 17) = 168,000 cases
entered.• Adult asthma (since Nov 18) =
12,000 cases entered.• Pulmonary rehabilitation = 1,600
cases entered.• Paediatric asthma = will launch in
Jun 19.• Primary care data available in
Wales.

Reporting• National and regional reports
annually/six-monthly (as appropriate).__________________________________
• Will have 6-8 run-charts for all audits. • Adult asthma: First chart launched in May 19
• PR: First chart launching in Summer 19
• CYP asthma: First chart launching in Sept 19
• COPD: 6 charts available

Moving to real-time dataHospital/service level data benchmarked against the national average
Only viewable by registered web tool users
Updated every 15 minutes from data entered into the audit

Improvements in real-timeKey audit indicators Feb
2017April2019
% change
Patients receiving NIV within 2 hours of arrival 19.2% 24.8% 5.6%
Patients receiving respiratory review by a member of the respiratory team within 24 hours of admission 49.0% 72.6% 23.6%
Current smokers prescribed smoking cessation pharmacotherapy 24.0% 54.5% 30.5%
Patients prescribed oxygen to target saturation 95.9% 97% 1.1%
Patients with a spirometry result available 37.0% 49.8% 12.8%
Patients receiving a discharge bundle 48.6% 87.6% 39%

Aims for today• Understanding your data and
service – reflecting on your own service and data to identify areas for change.
• Familiarisation with selected QI methodologies in context –developing an aim and using the model for improvement.

Aims for today – part 2• To network with colleagues
to share expertise and examples of best practice.
• To leave the workshop with an action plan to implement and evaluate improvement in your service.

Ice-breaker

Ice breaker• The previous workshop highlighted five common
barriers to setting up a QI project:
• Time• Money• Staff & resources• Resistance to change• Lack of QI knowledge

• Use your phone to go to pollev.com/nacap
• Rank the barriers from easiest to hardest to change (easiest at the top)
Ice breaker
• What could you do locally to overcome the barrier ranked easiest to change?
Type your answer into the box in the online poll. Enter as many solutions as you like (one at a time).
• What could you do locally to overcome the barrier ranked hardest to change?
Ice breaker

Using NACAP data to understand your serviceProf Mike Roberts

Data collection
• QI is almost impossible without (good) data
• We know that collecting data is time-consuming and challenging. Successful data collection models include:• Data collection rotas• Dedicated staff member for entering data• Working with coding departments to get notes rapidly• Completing audit questions during the patient’s admission

How to access your data1) Go to nacap.org.uk2) select your audit and
log-in3) Click on the ‘reports’
tab 4) You can also ‘export’
all your patient level data if you want to have a closer look
Run charts – a poll • Use your phone to go to pollev.com/nacap
• What is a run-chart?
Run charts – overview • A run chart is a line graph of data for a particular
variable (e.g. sales of books about QI) plotted over time.
• Allows us to:– identify trends or patterns e.g. sales of books about QI are
increasing or decreasing– compare a performance measure before and after
implementation of a change to measure its impact– compare local performance to a bigger group e.g. sales in
one shop compared to a regional or national average

Run charts – interpretation • Axes:
– Y-axis = indicator to be measured
– X-axis = time

Run charts – interpretation • General things to look for:
1) Trends: are consecutive points going up or down?
2) Cycles: is there a pattern? 3) Erratic chart: are the data all over
the place? Is this about performance or about data entry?
4) Aberrations: is there a month where performance is great or terrible? What does this mean?
• What external factors may influence what the run chart is showing?
• Use your phone to go to pollev.com/nacap Getting worse?
Getting better?

Using run-charts to identify a change priority Performance is declining (trend)

Using run-charts to identify a change priority Performance is erratic

Using run-charts to identify a change priority Performance is consistently below average
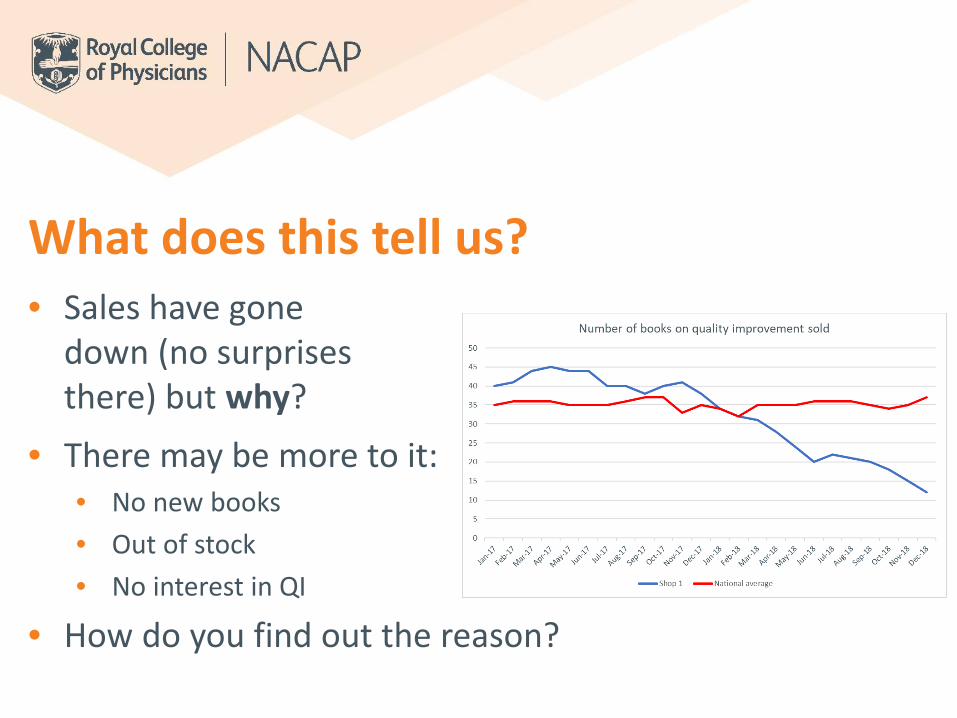
What does this tell us?• Sales have gone
down (no surprises there) but why?
• There may be more to it:• No new books• Out of stock• No interest in QI
• How do you find out the reason?

Let’s look at a respiratory example
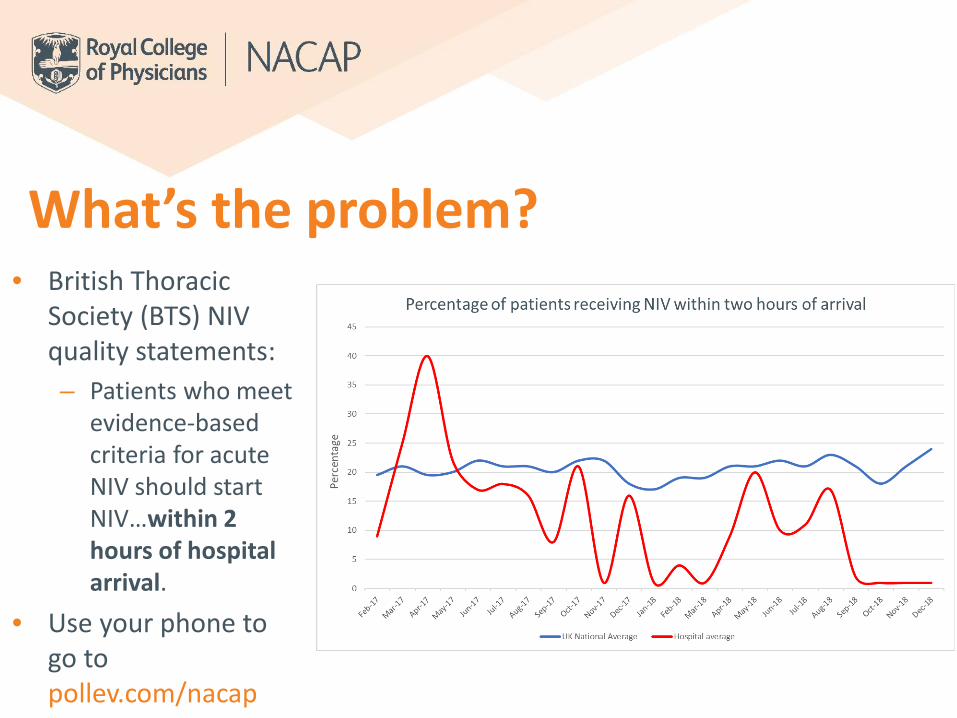
What’s the problem? • British Thoracic
Society (BTS) NIV quality statements: – Patients who meet
evidence-based criteria for acute NIV should start NIV…within 2 hours of hospital arrival.
• Use your phone to go to pollev.com/nacap

Identifying the right thing• If you aren’t sure whether
change is needed, take a ‘deep dive’ into your patient level export
• Look at the metric at hand:– Is data missing?– Are there errors?– Is all as it appears?

Process mapping• Once you’ve identified a problem (before you
think about what to change), it can be useful to learn more about your service
• Tool = process mapping• Allows you to understand
the entirety of a process • Identify areas for
improvement
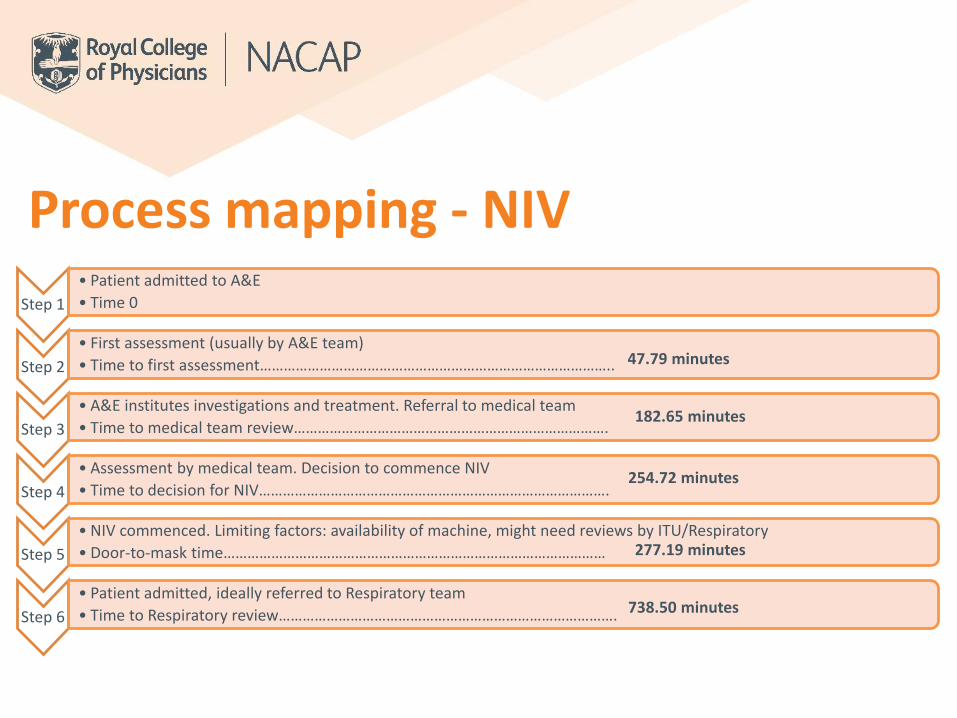
Process mapping - NIVStep 1
• Patient admitted to A&E• Time 0
Step 2• First assessment (usually by A&E team)• Time to first assessment……………………………………………………………………………..
Step 3• A&E institutes investigations and treatment. Referral to medical team • Time to medical team review…………………………………………………………………….
Step 4• Assessment by medical team. Decision to commence NIV• Time to decision for NIV…………………………………………………………………………….
Step 5• NIV commenced. Limiting factors: availability of machine, might need reviews by ITU/Respiratory• Door-to-mask time……………………………………………………………………………………
Step 6• Patient admitted, ideally referred to Respiratory team• Time to Respiratory review………………………………………………………………………….
47.79 minutes
182.65 minutes
254.72 minutes
277.19 minutes
738.50 minutes

Process mapping – in real life

Analysing the process map Are we doing the right thing? (is it
clinically effective) Are we doing them in the right order? Is the right person doing it? How co-ordinated is the patient’s
journey? What information do we give to
patients at what stage? Is the information useful?
Baseline measurement: how often / how many / how much?
Variability in processes should only be driven by the needs of
the patient and not the preferences of the practitioners

Look for areas for improvement Is the process
standardised? Are steps repeated or out
of sequence? Are there steps that do
not add value? Are there steps where
errors occur frequently?
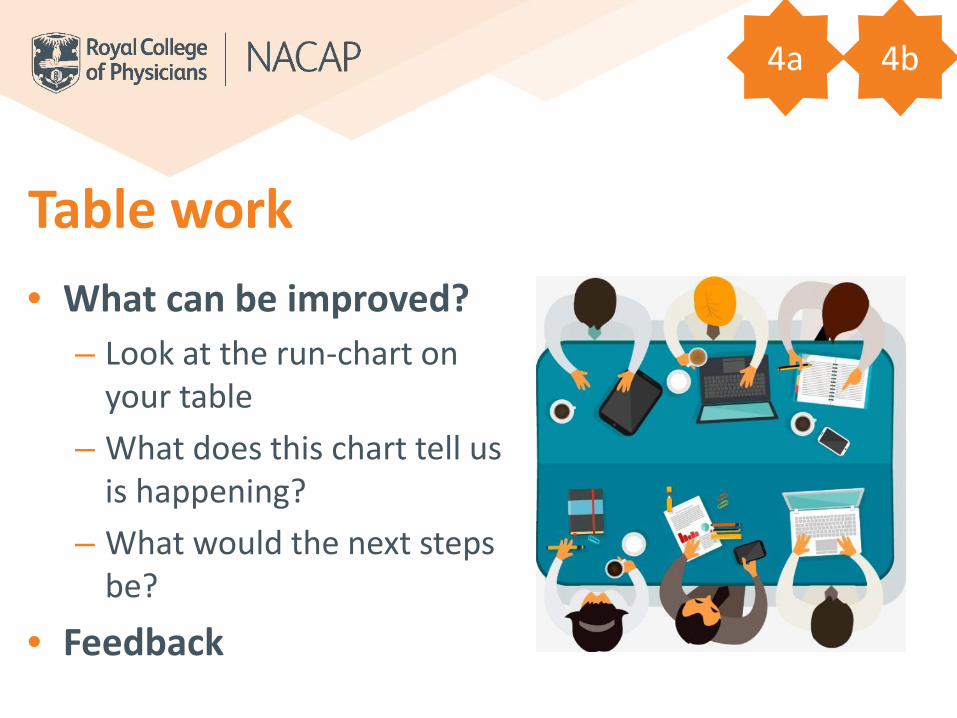
Table work• What can be improved?
– Look at the run-chart on your table
– What does this chart tell us is happening?
– What would the next steps be?
• Feedback
4a 4b

• Randomised Coffee Trial
– What has brought you here today?
– What improvement would you like to make in your hospital/service?
– Share some learning about undertaking an improvement project!
Coffee break

Developing a QI aimDr James Calvert

Developing an aim
• Agree your aim – make it SMART
• Use your data to generate it
• Make it patient-centred
S • Specific
M • Measurable
A • Achievable
R • Realistic
T • Time bound

What is a good aim statement?1) Brief - A few sentences which
explain everything needed. Normally this is honed over time
2) No technical talk – No three letter acronyms, or overly technical language
3) Data – Show the size of the problem or its impact
4) Data – Show the cost of the problem, what can be saved etc.
5) Explain what can be done – This is not ‘the answer’ but is about the scope of the project and timescale
• Not ‘we aim to improve our specialist review time’, but:
• ‘We aim to improve the number of patients receiving a discharge bundle from 60% to 70% within 3 months’

Moving from your data to your aim
• Use your run charts
• Use your exports
• What can you do?
• Where do you want to be?

Using driver diagrams• A driver diagram is a visual of
what ‘drives’ the achievement of an improvement goal/aim.
• Has three or more levels, including: – a goal or aim– the high-level factors that you need to
influence in order to achieve this goal (‘primary drivers’)
– specific projects and activities that would act upon these factors

Developing a driver diagram• Primary drivers:
– These are the big topics or areas that you will need to work on to achieve your aim
– Should include all key areas of the system that you will need to influence
• Secondary drivers:– Each Primary Driver could have
Secondary Drivers. These are what would need to be in place to positively influence the Primary Driver
– The difference between primary and secondary drivers is one of importance.

Driver diagram - example
To increase the number of patients receiving a respiratory
review within 24
hours from 50% to 60% by the end of the next
quarter
Rapid and appropriate diagnostic testing in
A&E
Improve systems for referral across teams (including treatment
induced referral)
Up-skill all members of respiratory team to
provide review
Increase frequency of respiratory rounds
Design concise guideline on appropriate tests
Make sure ED and AAU team have bleep numbers of on call respiratory specialist team member
Training session on discharge bundle and best practice
Ensure there is an early morning referral round 6 days a week
Aims Secondary driversPrimary drivers

Three types of measures
Outcome Measures• Voice of the service user• Other measures of how
the system is performing
Process Measures• Voice of the workings of
the system• Are the parts/steps
performing as planned?• Have you considered
exclusions and exceptions?
Balancing Measures• Looking at a system from
different directions/dimensions
• What happens to the system as we improved outcomes/process measures (unanticipated factors/other factors)?

Table work• Develop an aim for your
service based on your audit data
• Use the driver diagram template to identify drivers for your improvement aim
6b 6c6a5

Small tests of changeDr James Calvert

Why test changes?• To increase the belief that the
change will result in improvements • To learn how to adapt the change to
conditions in your setting• To evaluate the costs and ‘side-
effects’ of changes• To minimize resistance when
spreading the change throughout the organisation

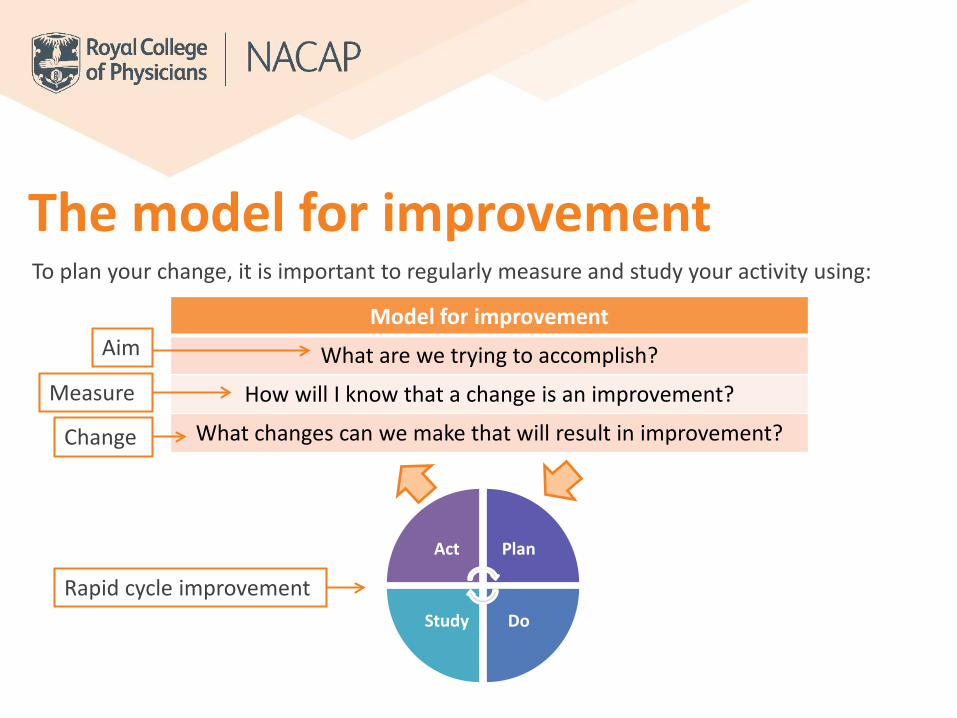
To plan your change, it is important to regularly measure and study your activity using:
Model for improvement
What are we trying to accomplish?
How will I know that a change is an improvement?
What changes can we make that will result in improvement?
Act Plan
DoStudy
Aim
Measure
Change
Rapid cycle improvement
The model for improvement
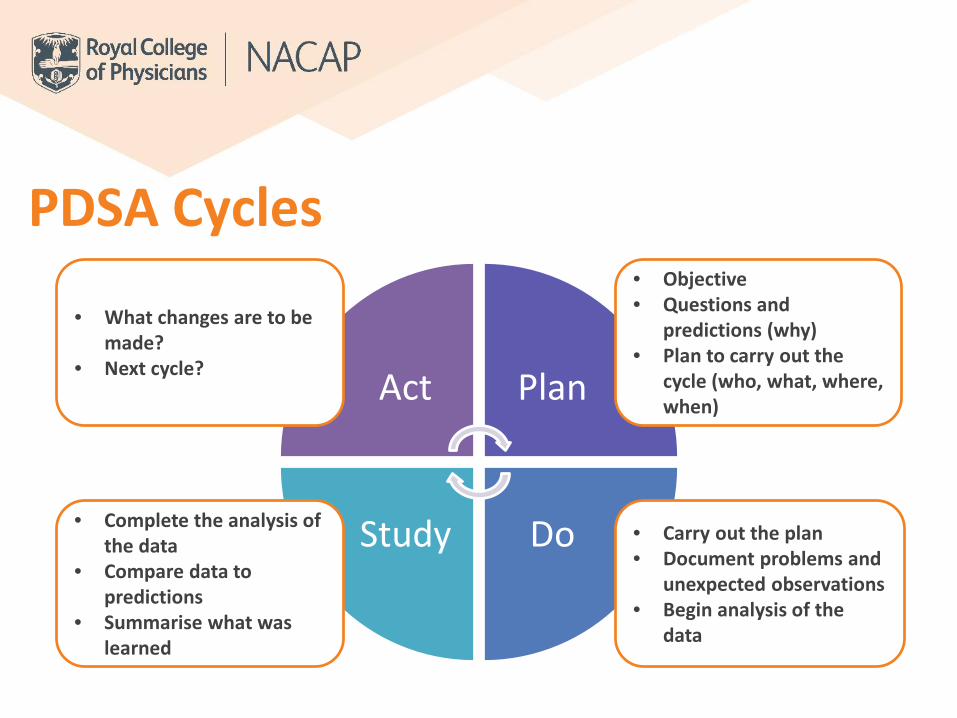
PDSA Cycles
Act Plan
DoStudy
• Objective• Questions and
predictions (why)• Plan to carry out the
cycle (who, what, where, when)
• Carry out the plan• Document problems and
unexpected observations• Begin analysis of the
data
• Complete the analysis of the data
• Compare data to predictions
• Summarise what was learned
• What changes are to be made?
• Next cycle?

Examples from experience

Repeated Use of the Cycle
Hunches Theories
Ideas
Changes that result in
improvement
A PS D
A PS D

Examples of PDSA Cycles
Not enough patients being seen by a member of the respiratory team in 24 hours
A PS D
A PS D
Cycle 1: laminated poster with respiratory contact details placed in ED and admission ward
Cycle 2: Instigate 2 x respiratory rounds of A&E per day
Cycle 3: Education event provided to ED and admission staff
Cycle 4: Instant alert for known COPDpatients to respiratory team on arrival
Increased number of patients reviewed within 24 hours

Move quickly to testing changes• Year• Quarter• Month• Week• Day• Hour
‘What tests can we complete by next Tuesday?’

Measuring change
Cycle 1
Cycle 4
Cycle 3
Cycle 2

Lunch

Local case study: Improvements in a community pulmonary rehabilitation serviceDr Dennis WatConsultant Chest PhysicianLiverpool Heart and Chest Hospital

Topics to cover
Knowsley Community Respiratory Service (KCRS)
Quality improvement in Pulmonary Rehabilitation (PR)
Access to PR
Quality of PR
Outcomes of PR

• 2nd most deprived local authority in England
• Reported prevalence of COPD in Knowsleyo 5,100 patients 2 x that of national averageo COPD prevalence is the 2nd highest rate in the North
West and the 4th highest rate nationally
• 8 % of all deaths in Knowsley are due to COPD (110/year)o 2.5 x that of national average
• Smoking prevalence in Knowsley-27% (highest in the North West)
• 2nd highest smoking attributable mortality rate in the North West
Knowsley COPD problem

Components of community
respiratory service
Diagnostic service
Consultant-led MDT clinic
Oxygen Service
Counselling
Early supported discharge
Rapid response service
Pulmonary rehabilitation & Chest physiotherapy
Admin Hub
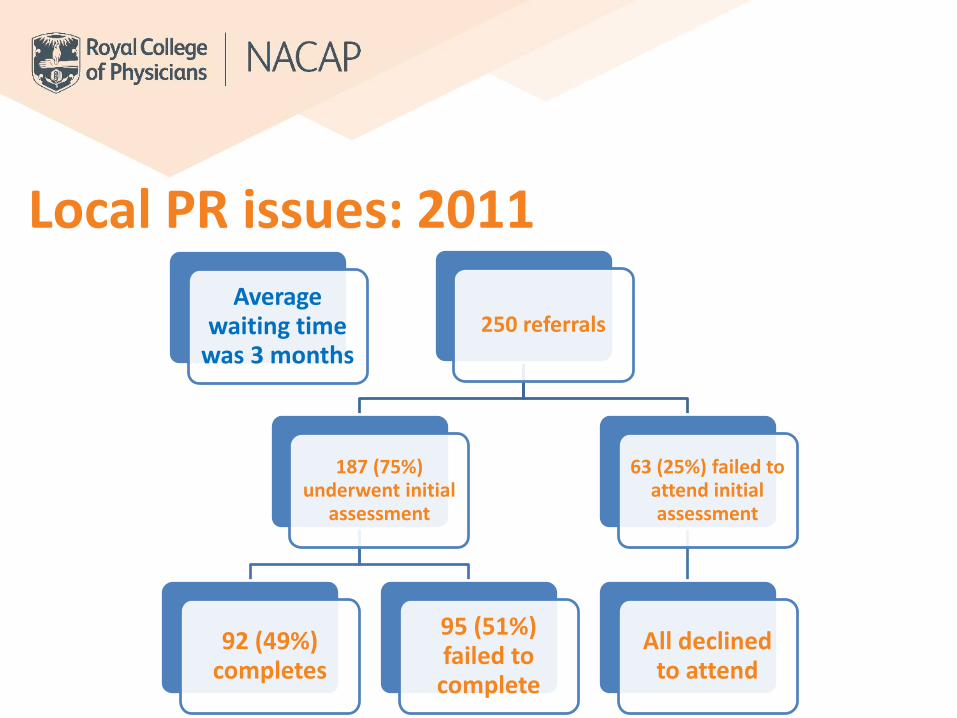
Average waiting time
was 3 months250 referrals
187 (75%) underwent initial
assessment
92 (49%) completes
95 (51%) failed to
complete
63 (25%) failed to attend initial assessment
All declined to attend
Local PR issues: 2011
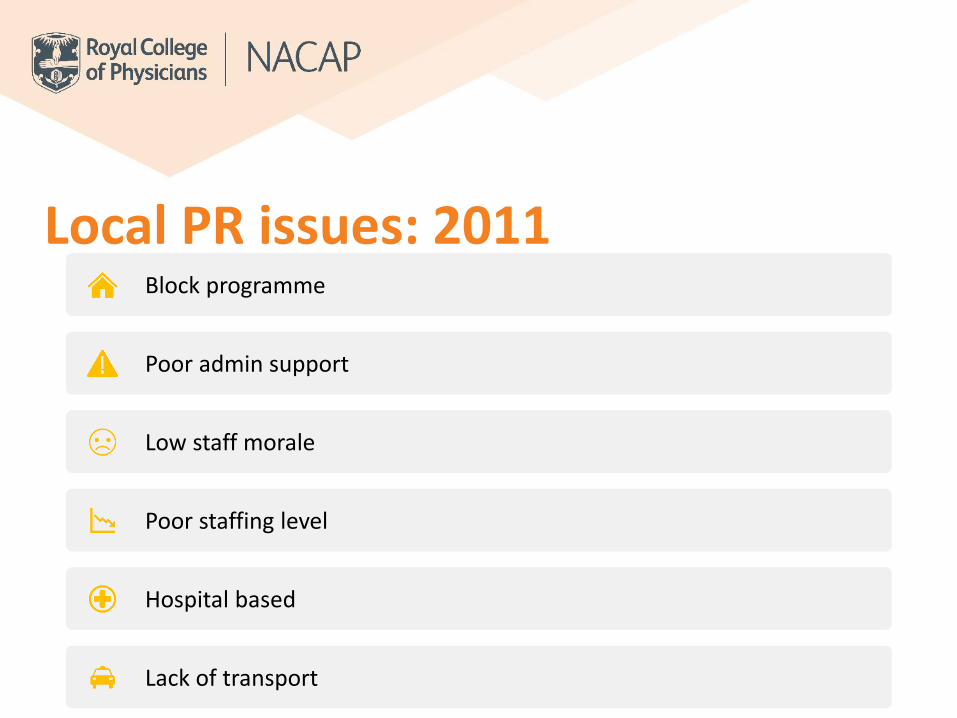
Block programme
Poor admin support
Low staff morale
Poor staffing level
Hospital based
Lack of transport
Local PR issues: 2011

PAYMENT BY RESULT
KPI HIGH ADMISSION RATE

What did we do?

Act Plan
DoStudy
• Objective• Questions and
predictions (why)• Plan to carry out the
cycle (who, what, where, when)
• Carry out the plan• Document problems and
unexpected observations• Begin analysis of the
data
• Complete the analysis of the data
• Compare data to predictions
• Summarise what was learned
• What changes are to be made?
• Next cycle?
PDSA Cycles

Step 1
Change to a rolling design
Annual plan to monitor service performance
Increase staffing level
Full education pack
Life-style choices
Merge cardiac and pulmonary rehab
Home PR programme

PR open to all patients with chronic respiratory conditions
User friendly self-referral forms
Consistent communication Patients define their own goals
MRC 1 and 2 accepted for the education component or a short course for exercise advice
PR is offered at every patient contact

Knowsley Respiratory ServicePulmonary Rehabilitation Service

Knowsley PR programme
Hospital for oxygen patients
Huyton Leisure Centre
Stockbridge Leisure Centre
Whiston Town Hall
Halewood Leisure Centre
Kirkby Leisure Centre
Home based PR
5 days per week, rolling programme
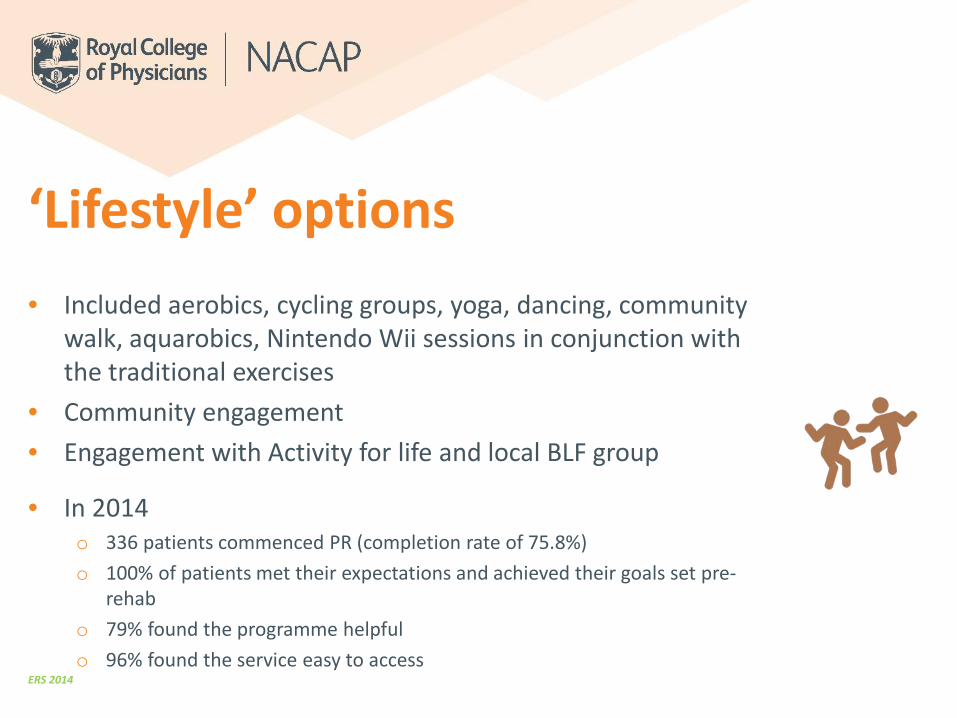
• Included aerobics, cycling groups, yoga, dancing, community walk, aquarobics, Nintendo Wii sessions in conjunction with the traditional exercises
• Community engagement• Engagement with Activity for life and local BLF group
• In 2014o 336 patients commenced PR (completion rate of 75.8%)o 100% of patients met their expectations and achieved their goals set pre-
rehabo 79% found the programme helpfulo 96% found the service easy to access
ERS 2014
‘Lifestyle’ options

Santa Walk
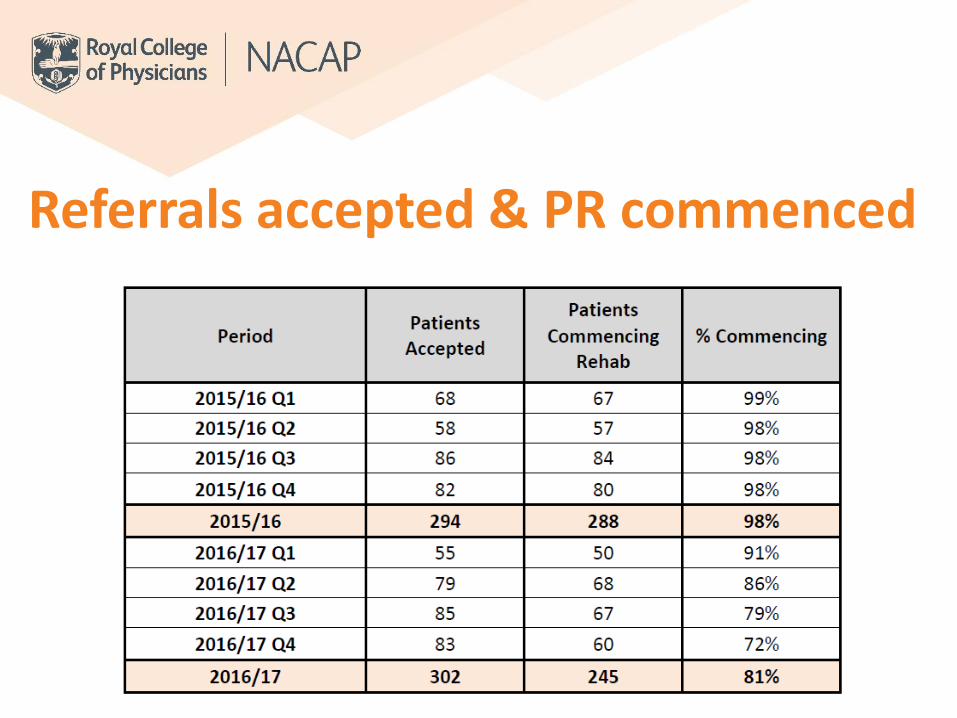
Referrals accepted & PR commenced

Referrals accepted & PR commenced

Completion rates

Completion rates

Health Outcomes

• 88.58% of eligible patients were offered PR
• Increased the number of patients enrolling onto PR year on year
• 98.8% of patients completed PR
98.59% 93.22% 96.23% 88.46%
Knowsley PR KPI 2017/18

Referrals received

Average wait 25 days
84% of patients enrolled within 90 days
85% PR assessments being held in leisure centers
‘Holding list’ for patients awaiting further investigations, procedures, holidays
Optimisation of drug treatment, management of co-morbidities, and the promotion of smoking cessation and winter vaccination
2017/18

Patient feedback

Further improvementsSocial identity
Written, individualised exercise plan at discharge
PGD medications
Merge cardiac and
pulmonary rehab
Inhouse smoking cessation
service
PAM MyCOPD app

You: What do you do when you have to walk through a storm?
Alexa: When you walk through a storm, hold your head up high!
Creating your action planDr James Calvert

To plan your change, it is important to regularly measure and study your activity using:
Model for improvement
What are we trying to accomplish?
How will I know that a change is an improvement?
What changes can we make that will result in improvement?
Act Plan
DoStudy
Aim
Measure
Change
Rapid cycle improvement
The model for improvement

Table work • Use the drivers from your
driver diagram to identify ideas for change
• Develop an action plan to take back to your service
• Provide feedback
7b7a

Coffee Break

Effective stakeholder engagement in QI
Prof John Hurst

Aim of session • Understand theory of stakeholder engagement
• Review some useful tools to facilitate engagement
• Look at patient priorities in your clinical area
• Generate plan to engage patients better in QI

Why engage others in QI?

• Log into the online poll and tell us who is important to engage with in for your QI project to be successful
• pollev.com/nacap
Who do we want to engage with?

How to engage others in QI?Approaches Explanation
Stakeholder Mapping Identifies who stakeholders are - who has influence on or interest in your project.
Stakeholder Analysis Identifies the needs and concerns of these different stakeholders and groups.
Stakeholder Engagement
Helps you plan how stakeholders can be part of the project team.
This engagement can be guided by 4PI National Involvement Standards - Principles, Purpose, Presence, Process and Impact.
Stakeholder Communication Enables you to share updates and listen to comments, in dialogue with different groups.
Stakeholder Management Helps you take proactive steps to change the opinions, attitudes and actions of stakeholders.

Patient and public involvement
Who?
Patients
Potential patients
Carers
Health/ social care
service users
Voluntary sector
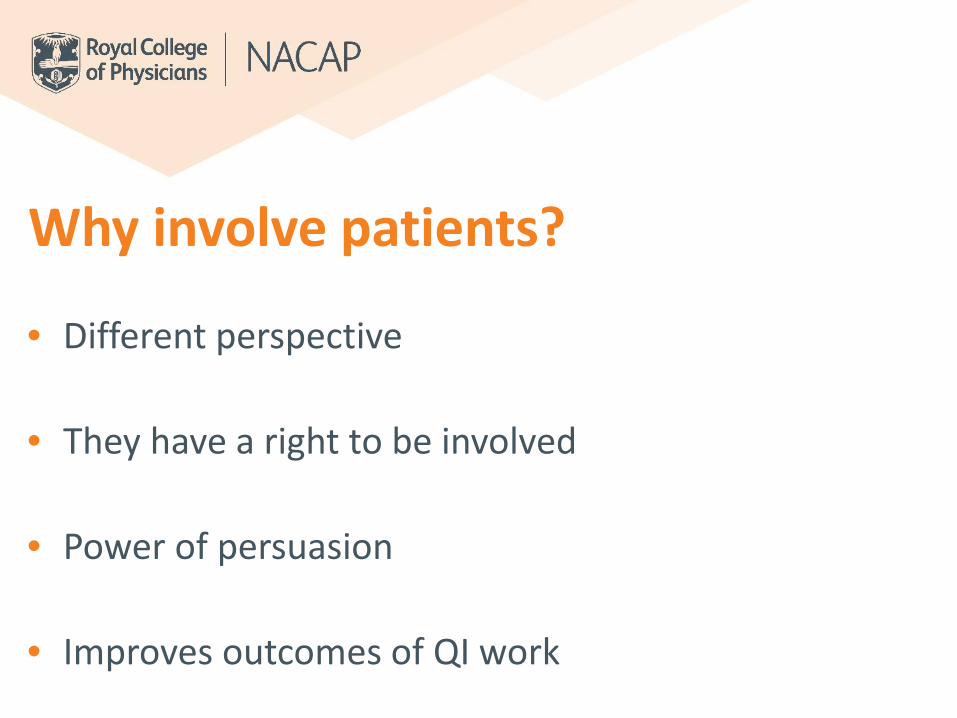
• Different perspective
• They have a right to be involved
• Power of persuasion
• Improves outcomes of QI work
Why involve patients?

• PPI is…– Patients and the public being members of the
improvement team – Working with patients to co-design or redesign a
service or elements of the service – Working with patients to prioritise areas of
improvement
Patient and public involvement

• PPI is not…– Designing improvements to a service without including
patients in the planning– Presenting your service improvements to members of
the public– Collecting data from patients based on measures
which matter to the service (without understanding what really matters to the patients)
Patient and public involvement

• Development of patient priorities
• Review of all audit materials, including datasets
• Co-design of patient reports
• Co-design of communications e.g. infographics
• Active members of programme governance groups
PPI in NACAP

PPI in practice Patient panel member – ‘Mrs A’
Understanding your data
• Meet with CCG to discuss COPD pathway
• Interpreting data
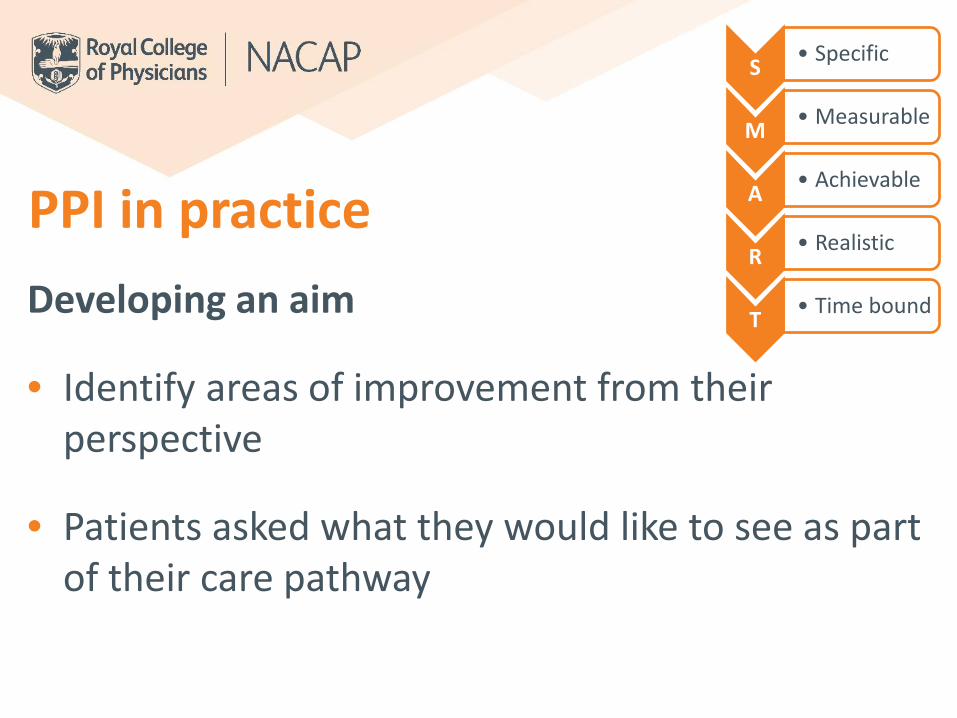
PPI in practice Developing an aim
• Identify areas of improvement from their perspective
• Patients asked what they would like to see as part of their care pathway
S • Specific
M • Measurable
A • Achievable
R • Realistic
T • Time bound

PPI in practice Identifying drivers to improvement
• Identifying drivers and barriers to change
• Patients can see the whole ‘Elephant’

PPI in practice Implementing change ideas
• GP, medic and patient training
• Funding applications
• Empowered to speak directly to CCG
Act Plan
DoStudy

PPI in practice Outcomes• New services commissioned
• Pathway re-design implemented Care is perceived by patients as more responsive to their needs
For Mrs A• Used to be in and out of hospital on a regular basis – now is mostly
treated at home
• Develop skills in public speaking and training
• Is now able to ask for better care
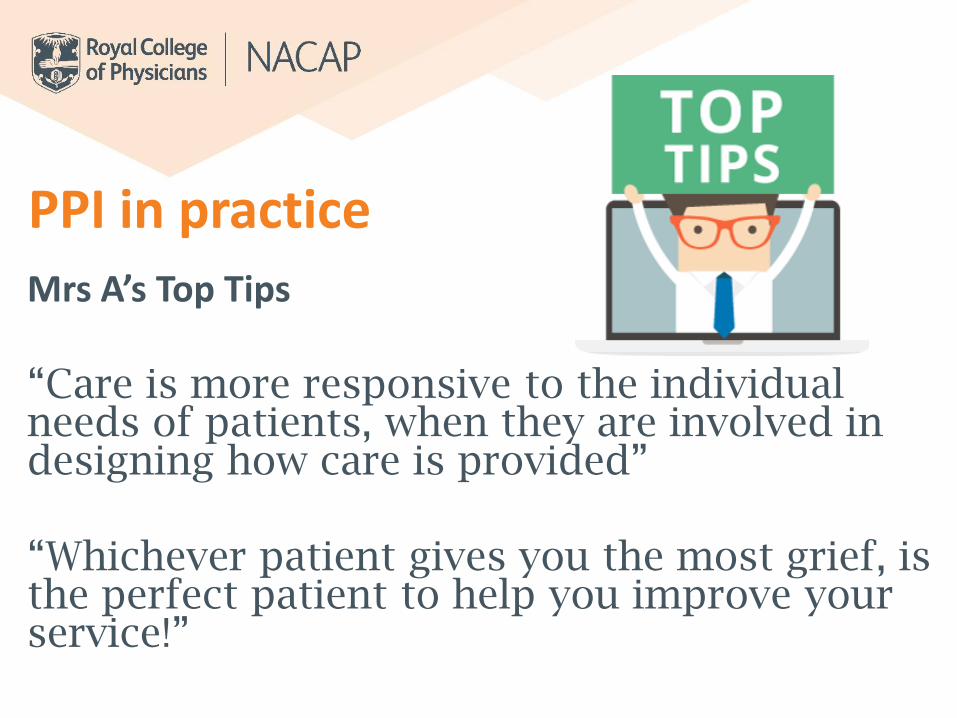
PPI in practice Mrs A’s Top Tips
“Care is more responsive to the individual needs of patients, when they are involved in designing how care is provided”
“Whichever patient gives you the most grief, is the perfect patient to help you improve your service!”

Table work• Review adult patient
priorities for your area of work (CYP audit patient priorities to come)
• Develop an action plan to better involve your patients in QI
• Provide feedback
87b

Next steps and conclusionsProf Mike Roberts

Next steps and conclusions• Follow up• Buddy system and peer review • Collaboratives
• Feedback form - please complete them to:• Help us improve• Help us understand what follow-up
would help you most!

Thank you!


