+ All Categories
Home > Documents > Plumas Lake Elementary School District 2009-10 First Interim Financial Report Governing Board...

Plumas Lake Elementary School District 2009-10 First Interim Financial Report Governing Board...

Date post: 15-Dec-2015
Category:
Upload: emilee-trewin
View: 215 times
Download: 0 times
Share this document with a friend
Popular Tags:
23
Plumas Lake Elementary School District 2009-10 First Interim Financial Report Governing Board Members Craig Bommarito Derek Bratton Merrilee Leinweber Chuck MacKay David Villanueva Each student will reach their fullest potential as we strive for district excellence through sound leadership, effective communication, accountability, and investment in our staff.
Transcript

Plumas Lake Elementary School District2009-10 First Interim Financial Report

Governing Board Members

Craig BommaritoDerek BrattonMerrilee LeinweberChuck MacKayDavid Villanueva

Each student will reach their fullest potential as we strive for district excellence through sound leadership, effective communication, accountability, and investment in our staff.

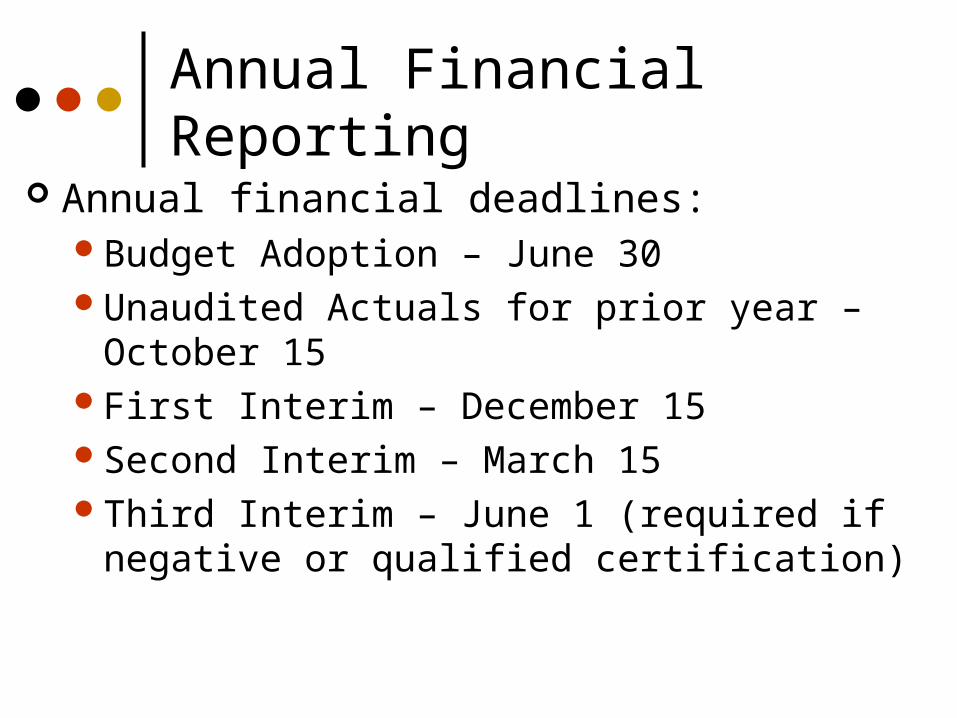
Annual Financial Reporting

Annual financial deadlines:Budget Adoption – June 30Unaudited Actuals for prior year – October 15First Interim – December 15Second Interim – March 15Third Interim – June 1 (required if negative or

qualified certification)

First Interim Financial Report

Education Code Section 42130 requires District to submit two financial interim reports to Yuba County Office of Education each fiscal year:

First Interim: Financial transactions from July 1 to October 31

First Interim must be adopted by the Board prior to December 15

District must certify one of the following:

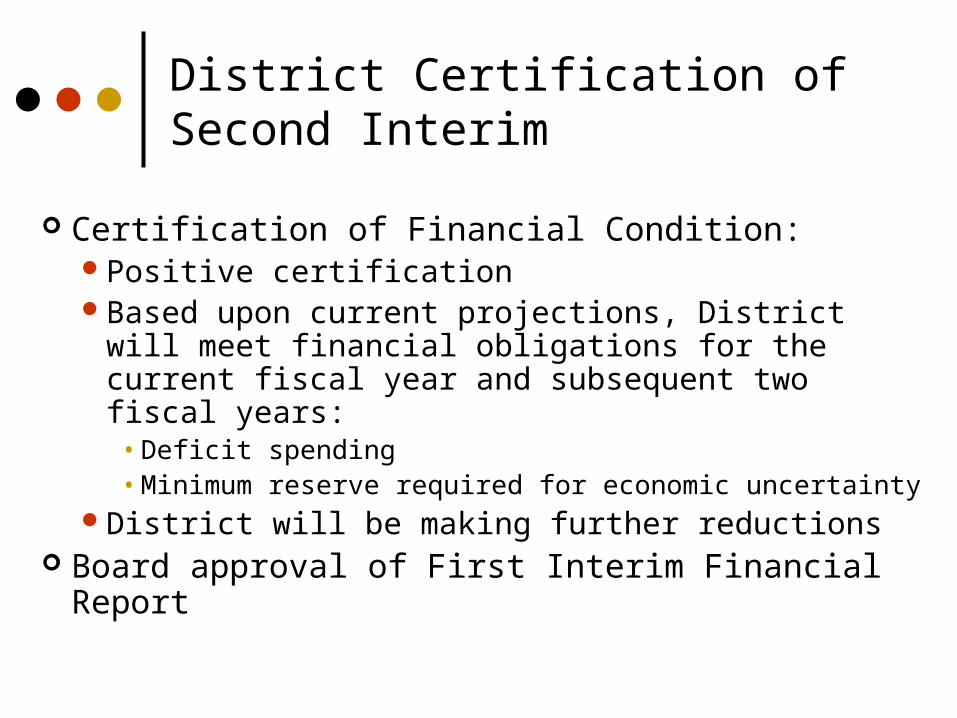
Positive: District can meet its current year and subsequent two year obligations;

Qualified: District may not be able to meet its current year and subsequent two year obligations; or

Negative: District cannot meet its current year and subsequent two year obligations.

Budget Assumptions

Budget Adoption Budget Act (used for First Interim)

2008-09 2009-10 2008-09 2009-10

COLA 5.66% 4.25% 5.66% 4.25%

Deficit Factor 11.428%($0.88572 per $1.00)

17.967%

($0.82033 per $1.00)

7.844%

($0.92156 per $1.00)

18.355%

($0.81645 per $1.00)

Revenue Limit (RL)

Deficited RL

Dollar loss per ADA

$6,347.36

$5,621.98

($725.38)

$6,597.36

$5,412.01

($1,185.35)

$6,347.36

$5,849.47

($497.89)

$6,597.36

$5,386.41

($1,210.95)

Other Revenue Limit Adjustments

-252.83 per ADA ($249,055)

State Categorical Programs

-15.38% -4.46%(Transportation: -65%)

-15.38% -4.46%(Transportation:-19.8%)

ARRA – SFSF

(RL)

$0 $234,292 $297,620 $0

ARRA – SFSF

(Categoricals)

$0 $0 $50,715 $0

Budget AssumptionsBudget Adoption Budget Act (used for First Interim)

2008-09 2009-10 2008-09 2009-10

ARRA – Sp Ed $81,444 $81,444 $81,546 $82,142

Lottery $109.50

$11.50$111.00

$13.25

Routine Restricted Maintenance

Contribution 1% Contribution 1% Contribution 1% Contribution 1%

Average Daily Attendance (ADA)

938.35 994.38

Beginning Fund balance

$1,677,314 $2,549,853

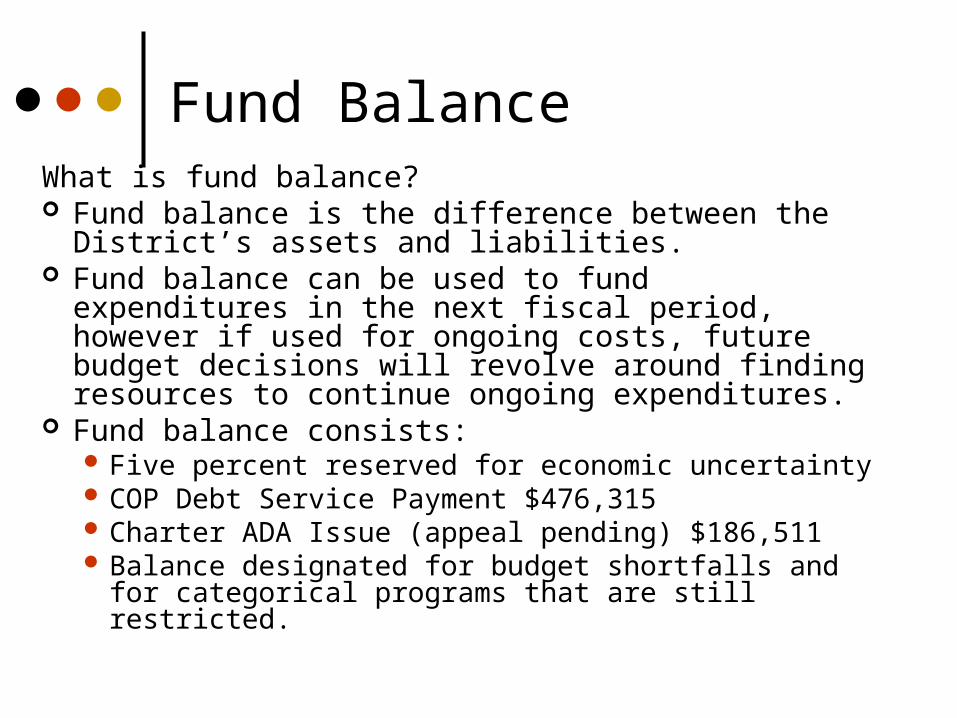
Fund BalanceWhat is fund balance? Fund balance is the difference between the District’s

assets and liabilities. Fund balance can be used to fund expenditures in

the next fiscal period, however if used for ongoing costs, future budget decisions will revolve around finding resources to continue ongoing expenditures.

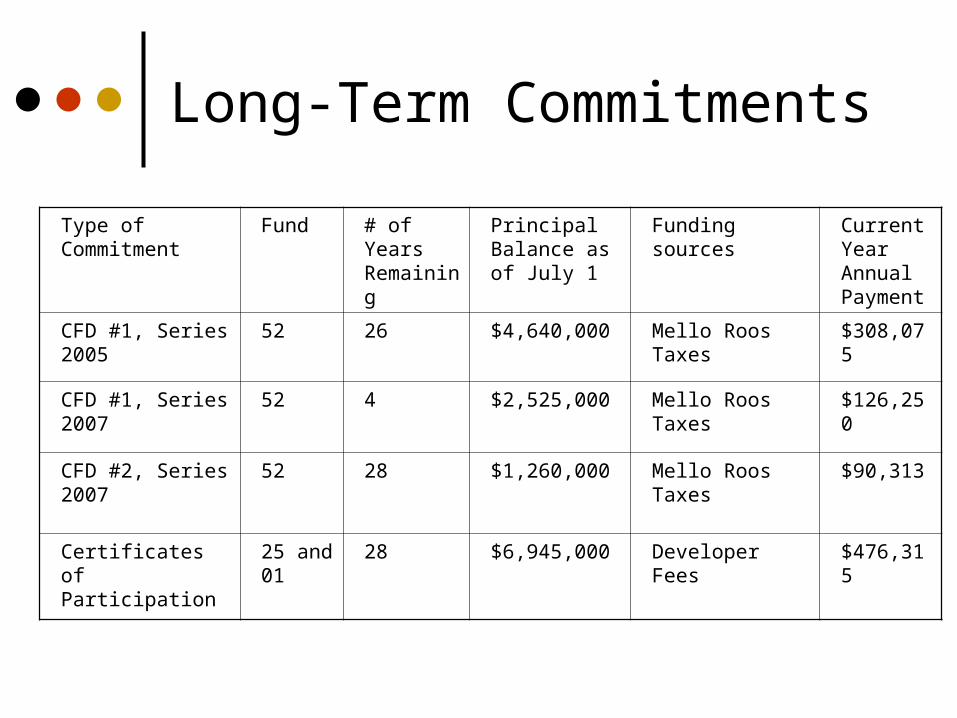
Fund balance consists: Five percent reserved for economic uncertainty COP Debt Service Payment $476,315 Charter ADA Issue (appeal pending) $186,511 Balance designated for budget shortfalls and for

categorical programs that are still restricted.

Why did the Fund Balance Increase?

Budget Adoption Unaudited Actuals Difference

Beginning Fund balance

July 1, 2008

$1,742,313 $1,742,313

Revenue $7,727,520 $8,244,359 $516,839

ARRA Funds $348,335

2008-09 mid-year cut $249,055

State/Local Revenue ($80,551)

Expenditures $7,743,263 $7,436,818 $306,445

Ending Fund Balance

June 30, 3009

$1,726,570 $2,549,853 $823,284

Revenue Sources

Revenue Limit – State aid and property taxes – general purpose funding based on student attendance

Federal – No Child Left Behind, Titles I, II, III, IV and V: special purpose funding

State – categorical programs: special purpose funding Local – Special Ed revenue from Yuba County Office of

Education, interest and facilities/other fees

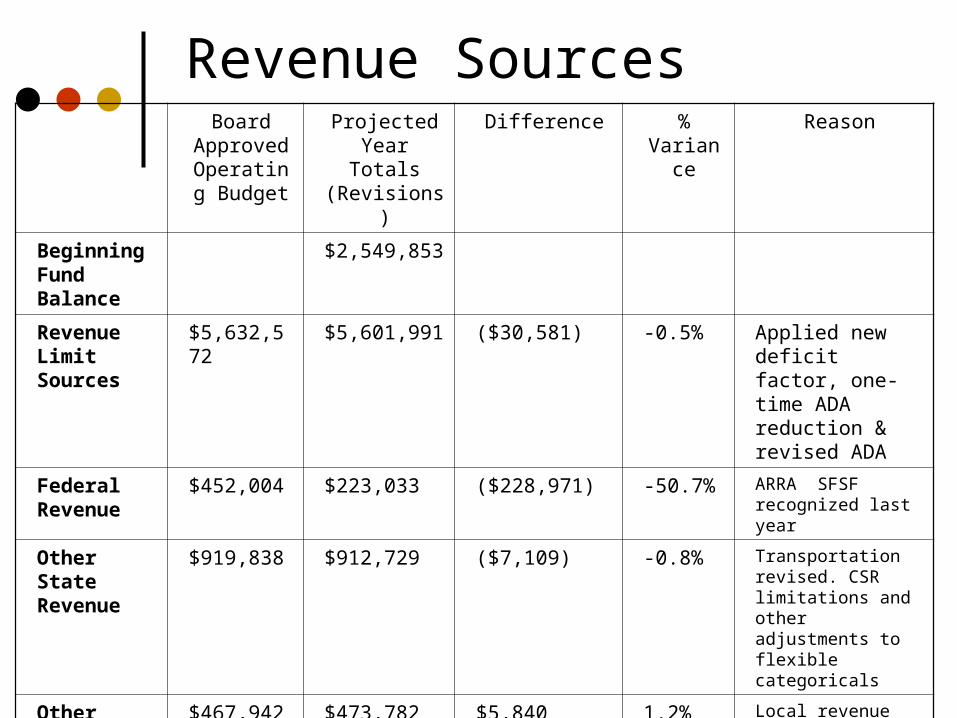
Revenue SourcesBoard

Approved Operating

Budget

Projected Year Totals (Revisions)

Difference % Variance

Reason

Beginning Fund Balance

$2,549,853

Revenue Limit Sources

$5,632,572 $5,601,991 ($30,581) -0.5% Applied new deficit factor, one-time ADA reduction & revised ADA

Federal Revenue

$452,004 $223,033 ($228,971) -50.7% ARRA SFSF recognized last year

Other State Revenue

$919,838 $912,729 ($7,109) -0.8% Transportation revised. CSR limitations and other adjustments to flexible categoricals

Other Local Revenue

$467,942 $473,782 $5,840 1.2% Local revenue adjusted

Expenditures

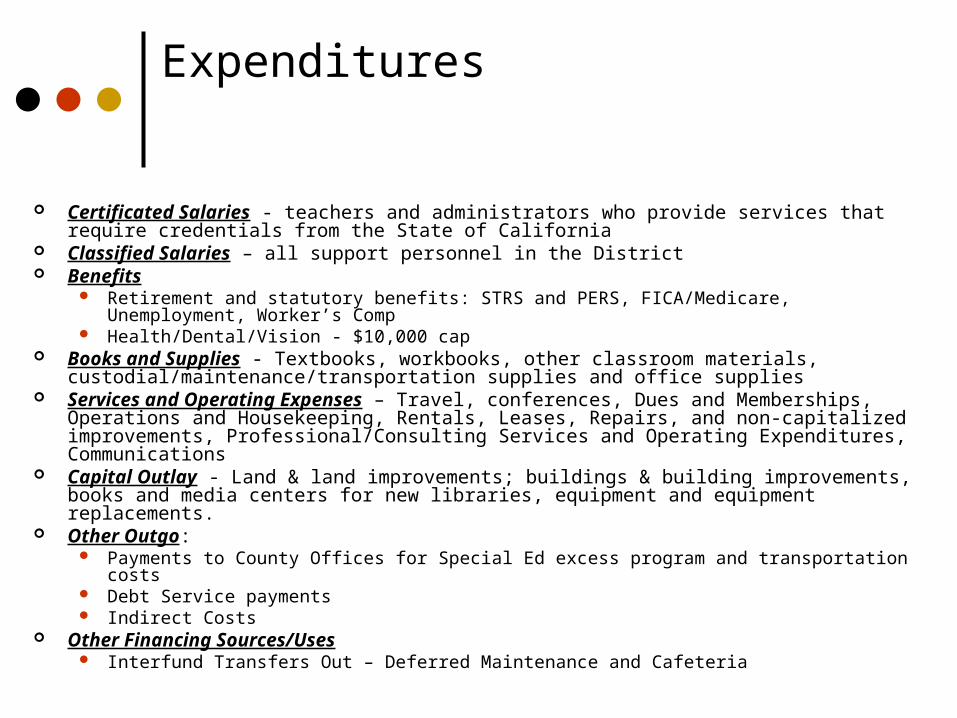
Certificated Salaries - teachers and administrators who provide services that require credentials from the State of California

Classified Salaries – all support personnel in the District Benefits

Retirement and statutory benefits: STRS and PERS, FICA/Medicare, Unemployment, Worker’s Comp

Health/Dental/Vision - $10,000 cap Books and Supplies - Textbooks, workbooks, other classroom materials,

custodial/maintenance/transportation supplies and office supplies Services and Operating Expenses – Travel, conferences, Dues and Memberships, Operations

and Housekeeping, Rentals, Leases, Repairs, and non-capitalized improvements, Professional/Consulting Services and Operating Expenditures, Communications

Capital Outlay - Land & land improvements; buildings & building improvements, books and media centers for new libraries, equipment and equipment replacements.

Other Outgo: Payments to County Offices for Special Ed excess program and transportation costs Debt Service payments Indirect Costs

Other Financing Sources/Uses Interfund Transfers Out – Deferred Maintenance and Cafeteria

Expenditures

Board Approved Operating

Budget

Projected Year Totals (Revisions)

Difference % Difference

Reason

Certificated Salaries $3,053,502 $3,202,627 $149,125 4.9% Added 3 FTE teachers; home school teacher; extra stipends (BTSA and extra duties)

Classified Salaries $1,218,379 $1,199,562 ($18,817) (1.5%) Adjusted salaries to contracts. Categorical budgets adjusted.

Employee Benefits $1,525,290 $1,568,926 $43,636 2.9% Added 3 FTE teachers and adjusted benefits

Books and supplies $315,230 $335,088 $19,858 6.3% Additional funding for Math adoption and categorical funding adjusted.

Services/Other Op Expenses

$1,164,609 $1,179,670 $15,061 1.3% Adjusted leases to buy-out copier lease and adjusted to professional and consulting services

Capital Outlay $6,600 $0 $6,600 (100%) Moved to debt service payment to other outgo

Other outgo $274,311 $280,911 $6,600 2.4% Moved debt service payment

Transfers of Indirect Costs

($17,232) ($17,751) $519 3.0% Based on Fund 13 expenditures

Other Financing Sources/Uses

($14,173) ($42,250) ($28,077) Eliminated contribution to Cafeteria

Net Increase (Decrease) in Fund Balance

($54,160) ($495,248)

Ending Fund Balance $2,495,693 $2,054,605 Economic Uncertainty – 5%; COP/Charter payments/Categorical carryover

Multi-year projections

2009-10 CBEDS for elementary schools – 1046 ADA projections

994.38 for 2009-10 and two subsequent years Projected COLA and deficit for subsequent years

2010-11: 0.50% with deficit factor of 18.355; 0.50% COLA for State categoricals

2011-12: 2.30% with deficit factor of 18.355%; 2.30% COLA for State categoricals

No changes to STRS, PERS, FICA/Medicare, Unemployment, Worker’s Comp and Health benefits

COP debt service payment not reflected in projections District will be deficit spending for current year and two subsequent

years District will meet minimum recommended reserve for economic

uncertainty requirement for 2009-10 and subsequent two fiscal years

Multi-year ProjectionsDescription 2009-10 2010-11 2011-12

Revenue $7,253,785 $7,419,385 $7,560,257

Expenditures and other financing uses

$7,749,033 $7,886,282 $8,085,417

Net Increase/Decrease in Fund Balance

($495,248) ($466,897) ($525,160)

Fund balance $2,054,605 $1,587,709 $1,062,549

Designated for Economic Uncertainties

$385,339 $394,315 $404,271

Other designations $1,664,165 $1,188,295 $653,178

Fund 13 Cafeteria Fund

Costs associated with pending CSEA contract:Increase Food Services Worker II from Range 6

to 9:• Salaries: $10,545• Statutory Benefits: $2,134• Indirect Costs: $573• Total Increase: $13,252

Note: Fund 13 budget was adjusted to include these costs

Cafeteria Fund – Fund 13Board

Approved Operating

Budget

Projected Year Totals (Revisions)

Difference % Difference

Reason

Beginning Fund Balance

$34,842 $34,842

Revenue $382,000 $397,000 $15,000 3.9% Increased free/reduced price meals and decreased paid meal based on Aug-Oct actuals

Expenditures

Classified salaries $138,207 $143,787 $5,580 4.0% Adjusted salaries to contracts

Employee Benefits $50,788 $45,281 ($5,507) -10.8 Adjusted benefits to contracts

Supplies $198,000 $198,000 - -

Services/Op Expenses $5,840 $5,623 ($227) -3.9% Direct costs – Fund 01

Other Outgo $17,232 $17,751 $519 3.0% Indirect – 4.52% of total expenses

Transfers In $28,077 $0 ($28,077) -100% Decreased contribution from General Fund

Net Increase (Decrease) in fund balance

$0 ($13,442)

Ending Fund Balance $34,842 $21,400

Deferred Maintenance – Fund 14

Board Approved Operating

Budget

Projected Year Totals (Revisions)

Difference % Difference

Reason

Beginning Fund Balance

$112,778 $112,778

Revenue $3,500 $3,500 0 - State apportionment unrestricted

Expenditures

Materials and Supplies

$10,500 $10,500 0 -

Services/Op Expenses

$19,500 $19,500 0 -

Transfers In 0 0 0 - Contribution from GF not required until 2012-13

Net Increase (Decrease in fund balance)

($26,500) ($26,500)

Ending Fund Balance

$86,278 $86,278

Fund 25 – Capital FacilitiesBoard

Approved Operating

Budget

Projected Year Totals (Revisions)

Difference % Difference

Note

Beginning Fund Balance (includes reserves for debt service payment with Trustee

$319,882 $319,882 Draft 08-09 audit adjusts beginning Fund Balance

Revenue $218,670 $218,670 0 - $188,985 (Impact Fees Y-T-D)

Expenditures

Services/Other Op Expense $75,000 $75,000 0

Other outgo $476,315 $476,315 0 - Auditors may ask us to move to Fund 52

Other financing sources $343,865 $343,865 0 -

Net Increase (Decrease) in Fund Balance

$11,220 $11,220

Ending Fund Balance

(includes reserves for debt service payment with Trustee)

$331,102 $331,102 With adjustment new fund balance $910,882

Debt Service Fund - Fund 52Board

Approved Operating

Budget

Projected Year Totals (Revisions)

Difference (Projected

– Approved)

% Difference

Notes

Beginning Fund Balance (includes reserves for debt service payment with Trustee

$1,059,723 $1,059,723

Revenue $672,925 $678,925 $6,000 0.9% Legal fees reimbursed

Expenditures

Other outgo $524,638 $524,638 0 -

Other financing sources $347,115 $347,115 0 Transfer to Fund 01 and 25 – Debt Service, admin, legal fees for CFD expenses

Net Increase (Decrease) in Fund Balance

($198,828) ($192,828)

Ending Fund Balance

(includes reserves for debt service payment with Trustee)

$860,895 $866,895 $469,121 w/ trustee

Fund 52 Multi-year Projections

Description 2009-10 Projected Budget

2010-11 2011-12

Beginning Fund Balance $1,059,723 $866,895 $803,207

Revenue $678,925 $672,925 $672,925

Other Outgo (debt service) $524,638 $524,613 $519,988

Other financing uses (transfers for COP payment)

$347,115 $212,000 $152,500

Net increase (decrease) in Fund Balance

($192,828) ($63,688) $437

Ending Fund Balance $866,895 $803,207 $803,644

Cash with fiscal agent $469,121 $470,000 $470,000

Needed for August Debt Service Payments of following year

$322,307 $319,995 $322,382

Balance - Other designations $75,467 $13,212 $11,262

Long-Term Commitments

Type of Commitment

Fund # of Years Remaining

Principal Balance as of July 1

Funding sources Current Year Annual Payment

CFD #1, Series 2005

52 26 $4,640,000 Mello Roos Taxes

$308,075

CFD #1, Series 2007

52 4 $2,525,000 Mello Roos Taxes

$126,250

CFD #2, Series 2007

52 28 $1,260,000 Mello Roos Taxes

$90,313

Certificates of Participation

25 and 01

28 $6,945,000 Developer Fees $476,315

Other Concerns

Governor recently announced $7B budget gap. Mid-year cuts expected. District using one-time money for ongoing

costs. How long will the economic crisis last? Contribution from Fund 52 to cover COP

payment decreases over the next two years. COP payment is an obligation of the General

Fund.

District Certification of Second Interim

Certification of Financial Condition:Positive certificationBased upon current projections, District will

meet financial obligations for the current fiscal year and subsequent two fiscal years:

• Deficit spending• Minimum reserve required for economic uncertainty

District will be making further reductions Board approval of First Interim Financial Report

Questions?


Recommended