30
i Basic Technical Paper Template (Rev. 2010‐04‐05) Richard P Helper; PSP and William J Mihelich 31805 and 04492 A Template for EPC Project Management and Execution January 26, 2016

i
Basic Technical Paper Template (Rev. 2010‐04‐05)
Richard P Helper; PSP and William J Mihelich 31805 and 04492
A Template for EPC Project Management and Execution
January 26, 2016

ii
Table of Contents
List of Figures iii
Abstract iv
Introduction 1
The Problem 2
Step 1: Define and Organize “What You Do” 6
Step 2: Integrate Recommended Practices 13
Step 3: Assign Responsibilities 18
Step 4: Verify Compliance 20
Collaboration across the enterprise 22
Conclusion 24
Bibliography 26

iii
List of Figures Figure 1 The TCM Framework
3
Figure 2 Key Activity Structure 7
Figure 3 EPC Project Life Cycle 7
Figure 4 Engineering Sub phases 8
Figure 5 Milestone Objectives 9
Figure 6 Front End Planning Execution Process Map 10
Figure 7 Front End Planning Management Process Map 11
Figure 8 Activity Flow Diagram 12
Figure 9 AACE RP to EPC Template Alignment 14
Figure 10 Estimate Classification System Matrix and Guideline 15
Figure 11 Estimate Input Checklist and Maturity Matrix 16
Figure 12 Company Specific Estimate Input and Maturity Matrix 17
Figure 13 Performance Requirements 19
Figure 14 Roles and Responsibilities 20
Figure 15 Milestone Checklist 21
Figure 16 Milestone Review Report 23

iv
Abstract
Cost, Scheduling, Earned Value, WBS, Risk Management, Change Management, KPIs, AACE
Recommended Practices ‐ there is an overwhelming amount of published information readily
available to today’s project management professionals. Trying to implement all the available tools,
techniques and practices without a system to organize, choreograph and integrate project
execution and management processes will not produce consistent results. Many organizations face
this problem. This paper will present a case study in how a major EPC contractor created an EPC
project template featuring graphical process maps and gated milestones. The processes
incorporate AACE Recommended Practices as well other industry and company practices. This
paper will also show how supporting documentation such as handbooks, manuals, milestone
review checklists and training programs are integrated, creating a complete operations system. The
EPC Template is the glue that holds all the elements of project execution and management
together in an organized, life cycle phased, collaborative environment developed using Microsoft
Office and Adobe Acrobat files all residing on a Share Point site.

1
Introduction
Project management professionals have been continuously looking for ways to improve the project
execution and management delivery process since the days of the Egyptians and Romans. The
development of the Critical Path Method in the late 1950s heralded in an era of exponential
knowledge growth and collaboration based around mathematical models for time management.
Time management evolved into resource and cost management. Subsequently, the knowledge
base broadened to include non‐mathematical solutions. Over the past several decades, several
organizations have formed which have made significant contributions in knowledge of techniques,
tricks, traps and lessons learned to elevate the competence of project management.
AACE International (AACE) was established in 1956. The Project Management Institute (PMI) was
established in 1969. The Construction Industry Institute (CII) was established 1983. These are
three leading organizations that provide standardization in terminology and methodologies for
managing projects. Additionally, AACE and PMI offer credentialing and certification.
For several decades, AACE have published the monthly “Cost Engineer” magazine, which featured
several technical papers. Each year, they compile the technical papers of presentations of the
Annual Meeting into the “Transactions”. Thousands of Technical Papers have been published. In
addition, they maintain a library of Recommended Practices.
CII has published almost seven hundred products consisting of Research Summaries, Research
Reports, Implementation Resources, technical specifications and training courses. Research
Reports are typically in excess of two hundred pages.
In more recent years, social media has provided a forum in which an overwhelming amount of
individual publications and commentaries are uploaded on a daily basis. On any given day, a
significant number of discussions can be found on LinkedIn addressing topics such as Project
Management, Cost Control, Scheduling and Risk Management.

2
This paper focuses on how a large, publicly traded Engineer, Procure, Construct (EPC) company
documented and organized their project execution and project management processes. After
mapping existing processes, they aligned AACE and CII publications to them. This allowed for
documenting integration of AACE Recommended Practices and CII Best Practices. Upon
completion, the company had a complete set of project execution and management processes
based on industry recommended and best practices. A system for assigning responsibility and
verifying compliance supports the implementation of the processes. All the documentation is
uploaded to a share point site available to project team members wherever they have an internet
connection.
The Problem: How to organize information for use within the company.
As previously stated, there are libraries of published books, journals, technical papers, research
papers in addition to spreadsheet tools, recommended practices, best practices which all contain
useful information and guidance. AACE and CII each have a system of organization of their
knowledge base.
AACE have developed the TCM Framework as shown in Figure 1 below. “The TCM Framework is a
structured, annotated process map that for the first time explains each practice area of the cost
engineering field in the context of its relationship to other practice areas including allied
professions”. [1]

3
Figure 1 - The TCM Framework [2] © 2015, AACE International, all rights reserved
CII have organized their body of knowledge into a topological form called Knowledge Areas. The
current list of Knowledge Areas is:
00 – General CII Information
01 – Project Planning
02 – Design Optimization
03 – Procurement and Materials Management
04 ‐ Construction
05 – Facility Startup and Operations
06 – Human Resources Management
07 – Project Organization and Management
08 – Business and Project Processes
09 – Project Controls
10 – Risk Management
11 – Safety, Health and Environment
12 – Information Management and Technology Systems
13 – Globalization Issues
14 ‐ Security

4
Knowledge Areas are further broken down into practice areas. Current practices are designated as
Best Practices; the remaining are designated as Other Practices.
In both cases, the knowledge repository consists primarily of publications. AACE publications are
typically knowledge sharing or case studies and focused on project controls. A knowledge sharing
publication may address how to perform a technical task, such as calculating Earned Value or
calculating acceleration. Case studies are similar to this paper: success stories resulting from the
application of knowledge sharing.
CII publications focus more widely on industry problems such as change management, craft
productivity improvement. Their scope expands beyond project controls into project execution
areas such as procurement, constructability and even guidelines for technical specifications.
Generally, they provide a technique for producing an intended result.
Both organizations represent a wide range of constituents from industrial, infrastructure, and
building contractors, owners and government organizations. As a result, they have to provide
somewhat generic solutions. Furthermore; they don’t address all the knowledge areas that
encapsulates an EPC contractor’s required expertise.
Some of the additional information needed to configure generic solutions to a specific company
include:
1. Who in the organization is responsible for implementing the actions included in the
solution?
2. How the solution integrates with company specific solutions?
3. When in the life cycle of the project is the solution implemented?
Knowledge areas not addressed include:
1. Process engineering
2. Detailed Design
3. Quality Control

5
The rest of this paper will address how one EPC company has solved the problem of organizing
knowledge areas and incorporating industry recommended practices in an integrated and
collaborative environment.
The case study company was incorporated in 1984. Initially, they provided maintenance and
repairs to oil tanks in Tulsa, Oklahoma. As their tank business grew, they added capabilities to
construct new tanks. This lead to acquiring an engineering group that could design tanks. Other
acquisitions lead to maintenance work in refineries. Yet other acquisitions lead to maintenance
and small cap capabilities in other industries. As the new organizations came onboard, they kept
their old ways of doing projects. The company has self‐perform competence in civil, concrete,
equipment installation, tank construction, process piping and high voltage substations. Industries
served include Electrical Infrastructure, Oil Gas and Chemical Facilities, Liquid and Gas Storage
facilities, mining and industrial facilities.
The company leadership has made a business decision to homogenize the various organizational
groups into an integrated company that can seamlessly work together to provide large cap EPC
services in addition to maintain their existing stand‐alone capabilities.
Initially, each operating unit had some degree of procedural documentation. However, the size
and complexity of projects contemplated required a significantly different approach to proposing
and executing projects. It was decided to start from a “clean sheet of paper”. Rather than write
handbooks or text, it was decided to build a corporate knowledge base in a graphical environment.
As the case study company is a member of CII and several managers are members of AACE; it was
decided to take advantage of the opportunity to integrate Recommended Practices and Best
Practices into the company specific processes.
The next step is to create the structure of the graphical environment and the process for
integrating AACE Recommended Practices and CII Best Practices.
6
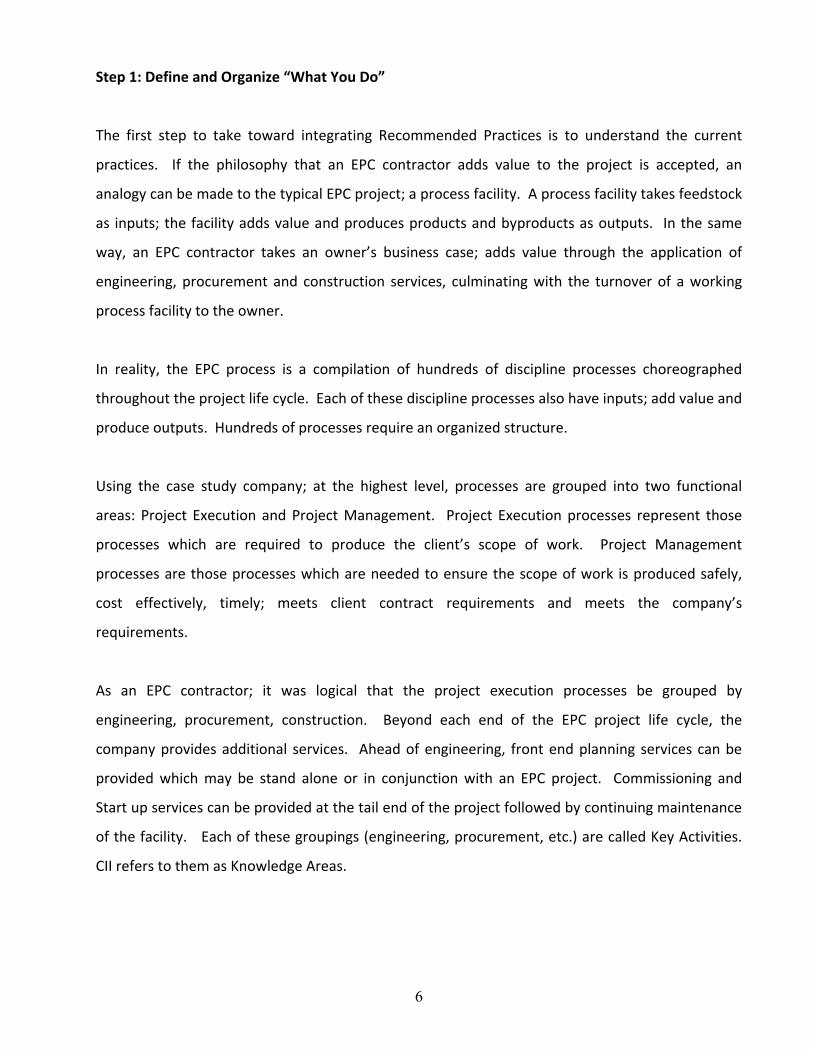
Step 1: Define and Organize “What You Do”
The first step to take toward integrating Recommended Practices is to understand the current
practices. If the philosophy that an EPC contractor adds value to the project is accepted, an
analogy can be made to the typical EPC project; a process facility. A process facility takes feedstock
as inputs; the facility adds value and produces products and byproducts as outputs. In the same
way, an EPC contractor takes an owner’s business case; adds value through the application of
engineering, procurement and construction services, culminating with the turnover of a working
process facility to the owner.
In reality, the EPC process is a compilation of hundreds of discipline processes choreographed
throughout the project life cycle. Each of these discipline processes also have inputs; add value and
produce outputs. Hundreds of processes require an organized structure.
Using the case study company; at the highest level, processes are grouped into two functional
areas: Project Execution and Project Management. Project Execution processes represent those
processes which are required to produce the client’s scope of work. Project Management
processes are those processes which are needed to ensure the scope of work is produced safely,
cost effectively, timely; meets client contract requirements and meets the company’s
requirements.
As an EPC contractor; it was logical that the project execution processes be grouped by
engineering, procurement, construction. Beyond each end of the EPC project life cycle, the
company provides additional services. Ahead of engineering, front end planning services can be
provided which may be stand alone or in conjunction with an EPC project. Commissioning and
Start up services can be provided at the tail end of the project followed by continuing maintenance
of the facility. Each of these groupings (engineering, procurement, etc.) are called Key Activities.
CII refers to them as Knowledge Areas.

7
The Key Activities identified in Figure 2 provide the vertical structure of the EPC Project Template.
PROJECT MANAGEMENT KEY ACTIVITIES PROJECT EXECUTION KEY ACTIVITIES
PM01 FRONT END PLANNING MANAGEMENT PE01 FRONT END PLANNING EXECUTION
PM02 PROJECT EXECUTION MANAGEMENT PE02 HSE IN DESIGN
PM03 CONTRACT MANAGEMENT PE03 SYSTEM ENGINEERING
PM04 RISK MANAGEMENT PE04 LAYOUT, 3D MODELING AND DISCIPLINE DESIGN
PM05 QUANTITY MANAGEMENT PE05 PROCUREMENT
PM06 ESTIMATING AND COST CONTROL PE06 SUBCONTRACTING
PM07 PLANNING AND SCHEDULING PE07 FABRICATION AND CONSTRUCTION
PM08 CHANGE MANAGEMENT PE08 COMMISSIONING
PM09 HSE MANAGEMENT
PM10 QUALITY MANAGEMENT
PM11 INFORMATION MANAGEMENT Figure 2 - Key Activity Structure
The naming structure is as follows: “PM” for Project Management; “PE” for Project Execution. This
prefix will follow through the naming of all documents of the EPC Template.
The EPC project life cycle provides the horizontal structure of the EPC Project Template. Figure 3
depicts the entire project life cycle beginning with Front End Planning (FEP) and continuing through
the EPC phases.
FRONT END PLANNING
FEP1 FEP3FEP2
ENGINEERING
PROCUREMENT
FABRICATION AND CONSTRUCTION
COMMISSIONING
MEPC1 MEPC2 MEPC3 MEPC4 MEPC5 MEPC6 MEPC8MEPC7 MEPC9 MSC1 MSC2 MSC3
PROPOSAL & KICK OFF
M P2
M P3
M P4
M P1
Figure 3 - EPC Project Life Cycle
The names of the phases are the same as those commonly used throughout the industry. As a
result of phase overlap during most of the project life cycle, the EPC project cannot be discreetly
defined as being in any single phase. However, each specific gate has interlocking relationships
between activities in each of the active phases at that point in time.
The red Proposal & Kickoff phase is depicted as movable. Because the case study company
provides Front End Planning (FEP), EPC and Construction (C) services, this phase “slides” to
represent the different points along the project life cycle a specific contract begins.

8
The magenta diamonds shown above the phases represent milestones or gates. The time
increment between milestones or gates is called a sub phase. Each sub phase has a unique Alpha‐
numeric number as well as a name to characterize the work performed during that time period.
Figure 4 depicts the first four sub phases after EPC contract award. These sub phase names reflect
engineering activities, but also include references to procurement and construction. While the
EPC Project Template shows the milestones in equidistant spacing; this does not represent time
intervals. As an example, it may only take eight weeks from project award to complete all the work
to achieve Milestone EPC 1 (MEPC1); whereas it will take several months to complete all the work
required to achieve Milestone EPC4 (MEPC4).
PROCUREMEN
Critical PO's Awarded; Basic Engineering
Completed
Layout & Main Structure Frozen
Global Design CompleteDetailed Engineering
Complete; Major Subcontracts Awarded
EPC1 EPC2 EPC3 EPC4
ENGINEERING
Figure 4 - Engineering Sub phases
The EPC Template is structured in two hierarchical levels of detail; Control Level and Execution
Level.
The Control Level is an executive and managerial level that reflects experience and knowledge. The
names of each sub phase try to capture the essence of activity in that sub phase. Significant
activities for each sub phase are “Milestone Objectives”. The completion of these objectives by
their required milestone date provides an executive or management level confidence the project is
on track.

9
The milestone objectives for the first four EPC sub phases are itemized in Figure 5.
Critical PO's Awarded; Basic Engineering
Completed
Layout & Main Structure Frozen
Global Design CompleteDetailed Engineering
Complete; Major Subcontracts Awarded
EPC1 EPC2 EPC3 EPC4Piping & Instrument Diagram -Material Selection reflected - Pipe spec & spec breaks -Valves shown -Lines shown with estimated sizes -Design Basis issued -'First Supplier Information' included for 1st Priority equipment Master Equipment List - Draft equipment list completed (Initial Info) - 'First Supplier Information' included for 1st Priority Equipment
Piping & Instrument Diagram -Critical lines sized - HAZOP performed-PCV/PSV and inline instruments sized-'First Supplier Information' included for 1st Priority equipment Master Equipment List -All Tagged items listed -'First Supplier Information' included for 2nd Priority Equipment
Piping & Instrument Diagram -All lines sized
-HAZOP comments incorporated -Vents & drains identified -P&ID/3-D model comparison done -'Frozen Supplier Interface Information' included for 1st, 2nd & 3rd Priority equipment Master Equipment List -Equipment list ready to be used as basis of design -All tagged items contain process data, load data -'Frozen Supplier Interface Information' included for 1st, 2nd & 3rd Priority Equipment
Piping & Instrument Diagram -All instrument logic reflected - Control and alarm settings included -Certified/final approved vendor info implementedMaster Equipment List -Equipment list ready to be issued as a construction/field support document -Information updated based on 'Final Approved Supplier Information' for all Equipment
Figure 5 - Milestone Objectives
At the Control Level, all projects are aligned to meet the same milestone requirements. This allows
for standardization of key performance indices across the enterprise.
The lower level is the “Execution Level”. The Execution Level is comprised of processes,
performance requirements, handbooks, manuals, forms or reports and milestone checklists. The
Execution Level is where standard processes are configured for the specifics of an EPC project. It is
also the level at which the project team performs their work.
A process is the fundamental building block of both the project and the organization. It is where
the company catalogs what they do. As stated earlier, a process adds value to inputs to create
outputs. In the engineering phase of an EPC project, the inputs and outputs are information.
Information can come from publications, such as AACE RPs; it can be a report, a calculation, a
building code or a client decision as examples. In the same way, outputs can be forms or reports,
calculations, drawings, specifications, data or other products.

10
Figure 6 is the map of Project Execution processes performed to complete the Front End Planning
deliverables for a process facility. Engineering is comprised of several iterative processes. The
process map is not a critical path schedule and therefore does not show all the logic relationship
lines.
Develop PFDs / UFDs
PE01-040-001-FEP2
MFEP3
FRONT END PLANNING
Key Activity: PE01 Front End Planning Execution:
MFEP0
MFEP1
MFEP2
Feasibility Concept Detailed Scope
Functional Description
PE01-080-001-FEP3
Develop P&IDs
PE01-070-001-FEP3
Develop Unit Arrangement
PE01-030-001-FEP1
Develop Block Model
PE01-020-001-FEP1
Functional Description
PE01-080-001-FEP2
Develop Layouts
PE01-110-001-FEP2
Develop Layouts
PE01-110-001-FEP3
Develop Single Line
DiagramPE01-100-001-
FEP2
Develop Single Line
DiagramPE01-100-001-
FEP3
Process Calculations
PE01-050-001-FEP2
Discipline Calculations
PE01-090-001-FEP2
Process Simulations
PE01-060-001-FEP3
Process Calculations
PE01-050-001-FEP3
Discipline Calculations
PE01-090-001-FEP3
Develop PFDs / UFDs
PE01-040-001-FEP3
Develop PFDs / UFDs
PE01-040-001-FEP1
Process Equipment
RFQPE01-120-001-
FEP2
Process Equipment
RFQPE01-120-001-
FEP3
Construction Methods
PE01-130-001-FEP2
Construction Methods
PE01-130-001-FEP3
Commissioning Strategy
PE01-140-001-FEP2
Commissioning Strategy
PE01-140-001-FEP3
Engineering Admin
PE01-010-001-FEP1
Engineering Admin
PE01-010-001-FEP1
Engineering Admin
PE01-010-001-FEP1
Figure 6 - Front End Planning Execution Process Map
Complementing the Project Execution processes, the Figure 7 shows the map of Project
Management processes to manage the development of Front End Planning deliverables of a
process facility.

11
Key Activity: PM01 Front End Planning Management:
MFEP3
Detailed ScopeConceptFeasibility
MFEP2
MFEP1
MFEP0
FRONT END PLANNING
Risk Management
PM01.3-FEP1
Risk Management
PM01.3-FEP2
Risk Management
PM01.3-FEP3
Cost Estimating
PM01.5-FEP1
Cost Estimating
PM01.5-FEP2
Cost Estimating
PM01.5-FEP3
Quantity Estimating
PM01.4-FEP3
Quantity Estimating
PM01.4-FEP2
Schedule Development
PM01.6-FEP1
Schedule Development
PM01.6-FEP2
Schedule Development
PM01.6-FEP3
PEP Development
PM01.2-FEP2
PEP Development
PM01.2-FEP3
FEP Management
PM01.1-FEP1
FEP Management
PM01.1-FEP2
FEP Management
PM01.1-FEP3
Figure 7 - Front End Planning Management Map
The previous two figures depict the processes defined for Project Execution and Project
Management that represent the work necessary to complete the Front End Planning deliverables
for a client. The processes are placed on the map in their respective sub phases to support the
Milestone Objectives. Some key driving logic is shown, however this is a process map and is
intended as a general flowchart and is not intended to be a substitute for Critical Path Method
logic.
Each of the processes shown on the process maps is supported by an exploded view called an
Activity Flow Diagram (AFD). The AFD shows all the internal and external inputs; relationships to
other processes and outputs resulting from the process. The AFD also includes references to its
position in the project life cycle through the goal post Milestones.
12
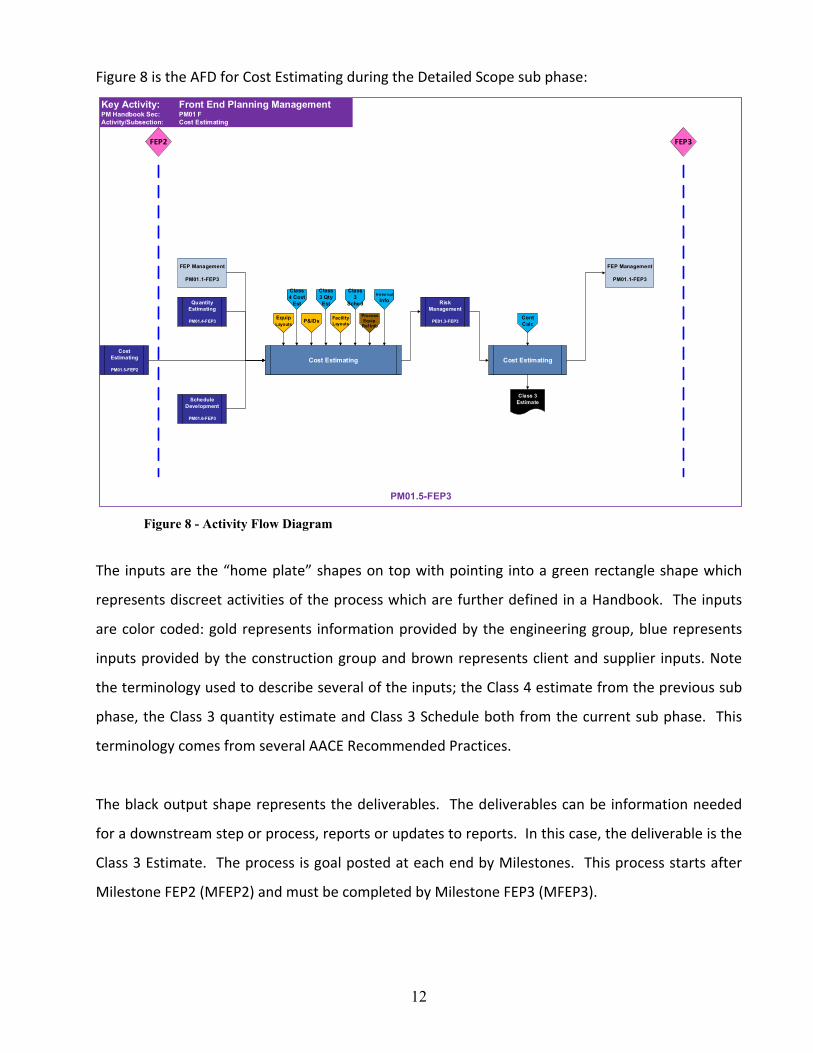
Figure 8 is the AFD for Cost Estimating during the Detailed Scope sub phase:
PM01.5-FEP3
FEP3FEP2
Cost Estimating
Facility Layouts
Equip Layouts
Key Activity: Front End Planning ManagementPM Handbook Sec: PM01 FActivity/Subsection: Cost Estimating
Class 3 Qty Est
Class 4 Cost
Est
Class 3
Sched
P&IDs
Cost Estimating
PM01.5-FEP2
FEP Management
PM01.1-FEP3
FEP Management
PM01.1-FEP3
Quantity Estimating
PM01.4-FEP3Process Equip.
Ref Info
Schedule Development
PM01.6-FEP3
Risk Management
PE01.3-FEP3
Historical Info
Cost Estimating
Class 3 Estimate
Cont Calc
Figure 8 - Activity Flow Diagram
The inputs are the “home plate” shapes on top with pointing into a green rectangle shape which
represents discreet activities of the process which are further defined in a Handbook. The inputs
are color coded: gold represents information provided by the engineering group, blue represents
inputs provided by the construction group and brown represents client and supplier inputs. Note
the terminology used to describe several of the inputs; the Class 4 estimate from the previous sub
phase, the Class 3 quantity estimate and Class 3 Schedule both from the current sub phase. This
terminology comes from several AACE Recommended Practices.
The black output shape represents the deliverables. The deliverables can be information needed
for a downstream step or process, reports or updates to reports. In this case, the deliverable is the
Class 3 Estimate. The process is goal posted at each end by Milestones. This process starts after
Milestone FEP2 (MFEP2) and must be completed by Milestone FEP3 (MFEP3).

13
Step 2: Integrate Recommended Practices
With the company’s current processes documented in the EPC Project Template, the next step is to
align with the industry practices considered for integration.
AACE provide a hyperlink on their website to download an Excel version of their Recommended
Practices list. The list includes the publication number, name, revision date and description. Once
downloaded, additional columns were added to the right of the description which are used to
provide implementation comments and to cross reference to the applicable EPC Project Template
processes and Handbook Sections.
CII publications are listed on the CII website, however, no list is available in a downloadable format.
It took many hours to consolidate a comprehensive list of publication numbers, descriptions,
publication date and description information in an Excel list from all the pages on their website. As
with the AACE list, the CII list was also used to cross reference to the EPC Project Template
processes and Handbook Sections.
Many of the Recommended Practices result in principles that can be applied, however many of
them result in discreet inputs and outputs of processes as well as specific terminology or
definitions that can be used.
An example of how the case study company aligned an AACE RP to the EPC Template is shown in
Figure 9. The background layer shows the data downloaded from AACE’s website and the
additional columns added for the case study company. The middle layer is a magnified portion of
the AACE Recommended Practice Description. The top layer is a magnified section that shows high
level comments regarding the extraction of relevant information from the AACE Recommended
Practice. Where applicable, specific EPC Template processes, Handbook Sections and
Forms/Report Numbers are included.

14
RP No. Publication Title Description PEMS Integration Comments
18R-97Cost Estimate Classification System – As Applied in Engineering, Procurement, and Construction for the Process Industries
As a recommended practice of AACE International, the Cost Estimate Classification System provides guidelines for applying the general principles of estimate classification to project cost estimates (i.e., cost estimates that are used to evaluate, approve, and/or fund projects). The Cost Estimate Classification System maps the phases and stages of project cost estimating together with a generic project scope definition
maturity and quality matrix, which can be applied across a wide variety of process industries. This addendum to the generic recommended practice (17R-97) provides guidelines for applying the principles of estimate classification specifically to project estimates for engineering, procurement, and construction
(EPC) work for the process industries. This addendum supplements the generic recommended practice by providing: • a section that further defines classification concepts as they apply to the process industries; and
• a chart that maps the extent and maturity of estimate input information (project definition deliverables) against the class of estimate. As with the generic recommended practice, an intent of this addendum is to improve communications among all of the stakeholders involved with preparing, evaluating, and using project cost estimates specifically for
the process industries. The overall purpose of this recommended practice is to provide the process industry definition deliverable maturity matrix which is not provided in 17R-97. It also provides an approximate representation of the relationship of specific design input data and design deliverable maturity to the estimate accuracy and methodology used to produce the cost estimate. The estimate accuracy range is driven by many other variables and risks, so
the maturity and quality of the scope definition available at the time of the estimate is not the sole determinate of accuracy; risk analysis is required for that purpose. This document is intended to provide a guideline, not a standard. It is understood that each enterprise may have its own project and estimating processes and terminology, and may classify estimates in particular ways. This guideline provides a generic and generally acceptable classification system for process industries that can be used as a basis to compare against. This addendum should allow each user to better assess, define, and communicate their own processes and standards in the light of generally-accepted cost engineering practice.
AACE Estimate and Scheduling classification terminology and principles are reflected in PM01.5-FEP1,FEP2, FEP3 and PM06.2-P2
PM01.5-FEP1PM01.5-FEP2PM01.5-FEP3PM06.2-P2
PM01 GPM06 F
19R-97 Estimate Preparation Costs in the Process Industries
This Recommended Practice presents benchmark information on the costs to prepare project cost estimates (for engineering, procurement, and construction) in the process industries. It includes qualitative and quantitative lessons that cost engineers and estimators can use to benchmark their cost estimating experiences against. The data on preparation costs was used to develop a parametric cost model that can be used to
estimate the cost of preparing estimates. This information supports AACE International’s Recommended Practice 18R-97 entitled Cost Estimate Classification System — as Applied in Engineering, Procurement, and Construction for the Process Industries. The
effort or cost to prepare a cost estimate is a secondary characteristic of a cost estimate classification. A primary value of this Recommended Practice is improved understanding of the variables and trends concerning estimate preparation costs. The amount and quality of published reference data is limited, therefore, the value of the quantitative cost model presented here as a benchmark for measuring estimating performance is limited. The cost model is a good starting point for further development.
RP principles reflected in PM00.1-P1 PM00.1-P1 PM00 C
20R-98 Project Code of Accounts
This guideline establishes the basic principles of codes of accounts (COA) for projects in any industry. It examines key characteristics including usage, content, structure and format and describes benefits of establishing standard COAs. Topics such as activity-based costing and work breakdown structures as they relate to COAs are addressed. The issues of properly defining a WBS and how it should be structured are outside the scope of this guideline. COAs are applicable to all phases of the asset life cycle, however, this guideline specifically addresses the project execution phases of asset design development through to start of
normal operation. A project code of accounts is a coded index of project cost, resource and activity categories. A complete COA includes definitions of the content of each account code and is methodically structured to facilitate finding, sorting, compiling, summarizing, defining and otherwise managing information the code is linked to. The information is used to support total cost management practices such as cost estimating, cost accounting, cost reporting, cost control, planning and scheduling. Other names used for COAs are coding matrices, coding structures, charge accounts, asset or material classification accounts, value categories, cost elements, work breakdown structures, resource breakdown structures and activity breakdown structures.
Not Applicable: see 21R-98
21R-98Project Code of Accounts – As Applied in Engineering, Procurement, and Construction for the Process Industries
This guideline is an industry-specific addendum to AACE International’s generic guideline for project code of accounts (Recommended Practice No. 20R-98). This document describes recommended practices for codes of accounts (COA) as applied to engineering, procurement, and construction (EPC) projects in the process industries. “Process industries” are those with facilities whose main function is to perform a process. This includes chemical, petrochemical, hydrocarbon, pulp and paper, pharmaceutical, power generation, thermal, metallurgical, assembly, fabrication, and other processing. The primary characteristic of these industries, as it relates to codes of accounts, is that process or manufacturing equipment is the core or primary physical component of the facility. Equipment differentiates these projects from commercial construction and
infrastructure where the core component is a structure, from software development projects where the core component is programming code, and so on. COAs are applicable to all phases of the asset life cycle, but this guideline specifically addresses the EPC for creation, modification, or termination of a process facility. This guideline does not apply to code of accounts to support ongoing operations of process facilities. Properly defining a work breakdown structure (WBS), and other project structures, and deciding how they should be structured are outside the scope of this
document. A project code of accounts is a coded index of project cost, resource, and activity categories. A complete COA includes definitions of the content of each account code and is methodically structured to facilitate finding, sorting, compiling, summarizing, defining and otherwise managing the project information that is linked to the code. The information is used to support total cost management practices such as cost estimating, cost reporting, cost accounting, planning, and scheduling. Refer to 20R-98 for a more complete description of the principles of COAs.
Principals reflected in PM06-10 and PM05-01.Process and Equipment is the primary physical component used in WBS.
PM05-01PM06-10
22R-01Direct Labor Productivity Measurement - As Applied in Construction and Major Maintenance Projects
This recommended practice of AACE International describes a direct method to measure, monitor and optimize construction and maintenance project labor productivity. The method described is statistical sampling of the work process, or: work sampling. The work process is made up of steps and activities that take input resources, add value, and produce the completed project. Understanding the capability of the process, or ‘management system,’ to produce efficiently is important for project planning and control. Sampling is a cost-effective way to provide information about the performance of the work process, i.e., about ‘how’ the work is
done, and how to do it better. Work sampling complements conventional project management methodology, which typically tracks ‘what’ work is done. Sampling provides project managers, supervisors, and the workforce with objective feedback re: the efficiency of the work process (not of individual workers, which is part of the foreman’s job) – and the ability to respond quickly to adjust. In addition, it provides a measure of management’s ability to effectively plan, coordinate, and control project execution. Analysis of the sampling data allows for prompt removal or reduction of roadblocks, optimizing the construction work process through redesign and innovation. Streamlining the work process ensures that performing productive work is made more convenient for the workforce, ensuring that, at all times, crafts and technicians have all the necessary tools, materials, parts, supplies, information, supervisory support and personal needs readily available. Work sampling, properly applied, recognizes that
productivity results from an optimal work process, i.e., from ‘managing smarter,’ not from people working harder. Construction labor productivity is a measure of work process efficiency. It can be defined as the ratio of the value labor produces to the value invested in labor. Productivity increases as needed labor resources are minimized and wasted efforts eliminated from the work process. This definition and the practice covered here treats productivity as a direct, absolute measure to be optimized.
The WBS uses process and equipment as the primary physical component of the work. For each component of the work, Rules of Credit are used to measure incremental progress. This effectively breaks the scope of work down into "samples".The processes for collecting the data used to credit progress are identified in PM05.5.The processes for calculating productivity are included in PM06.7
PM05.5PM06.7
PEMSAFD
HandbookSect
Form / Rept No.
Project Management HandbookAACE Recommended Practice Descriptions
Description
As a recommended practice of AACE International, the Cost Estimate Classification System provides guidelines for applying the general principles of estimate classification to project cost estimates (i.e., cost estimates that are used to evaluate, approve, and/or fund projects). The Cost Estimate Classification System maps the phases and stages of project cost estimating together with a generic project scope definition maturity and
quality matrix, which can be applied across a wide variety of process industries.
This addendum to the generic recommended practice (17R-97) provides guidelines for applying the principles of estimate classification specifically to project estimates for engineering, procurement, and construction (EPC) work for the process industries. This addendum supplements the generic recommended practice by providing:
• a section that further defines classification concepts as they apply to the process industries; and • a chart that maps the extent and maturity of estimate input information (project definition deliverables) against the class of estimate.
As with the generic recommended practice, an intent of this addendum is to improve communications among all of the stakeholders involved with preparing, evaluating, and using project cost estimates specifically for the process industries.
The overall purpose of this recommended practice is to provide the process industry definition deliverable maturity matrix which is not provided in 17R-97. It also provides an approximate representation of the relationship of specific design input data and design deliverable maturity to the estimate accuracy and methodology used to produce the cost estimate. The estimate accuracy range is driven by many other variables and risks, so
the maturity and quality of the scope definition available at the time of the estimate is not the sole determinate of accuracy; risk analysis is required for that purpose.
This document is intended to provide a guideline, not a standard. It is understood that each enterprise may have its own project and estimating processes and terminology, and may classify estimates in particular ways. This guideline provides a generic and generally acceptable classification system for process industries that can be used as a basis to compare against. This addendum should allow each user to better assess, define, and communicate their own processes and standards in the light of generally-accepted cost engineering practice.
PEMS Integration Comments
AACE Estimate and Scheduling classification terminology and principles are reflected in PM01.5-FEP1,FEP2, FEP3 and PM06.2-P2
PM01.5-FEP1PM01.5-FEP2PM01.5-FEP3PM06.2-P2
PM01 GPM06 F
PEMSAFD
HandbookSect
Form / Rept No.
Figure 9 - AACE RP to EPC Template Alignment
Having completed this for all the AACE Recommended Practices, alignment is complete. The next
step is to integrate the applicable information into company specific processes and handbook text.
The terminology in Figure 10 was carried over for use in the case study company’s processes. [3]
Figure 10 - Estimate Classification System Matrix and Guideline © 2016, AACE International, all rights reserved

15
AACE RP 27R‐03, Schedule Classification System uses the same class and maturity level information
– and in fact refers back to AACE RP 18R‐97. [5]
Comparing usage purposes for each of the estimate classes; note the alignment with sub phases in
the company EPC Template:
AACE End Usage EPC Template Sub Phase
Concept Screening FEP1
Study or Feasibility FEP2
Budget Authorization… FEP3
Control… P2 (EPC Proposal)
…Bid/Tender P2 (Plans & Specs Bid)
Additionally, the Estimate Input Checklist and Maturity Matrix in AACE RP18R‐97 shown in Figure
11, was used as the starting point for aligning company specific inputs. [4]
Figure 11 - Estimate Input Checklist and Maturity Matrix © 2016, AACE International, all rights reserved

16
Figure 12 shows the AACE Input Checklist and Maturity Index aligned to the EPC Project Template
structure. This figure is included in several Handbook locations; PM06 Estimating and Cost Control
and PM07 Planning and Scheduling. Each of the AACE estimate and schedule classifications
correlate to sub phases in the Front End Planning or Proposal phase. Vertically, deliverables are
organized by Key Activities. Additional deliverables were added that our case study company has
determined are necessary for a complete Front End Planning and/or proposal submission. They
also provided a more detailed description of the quality of information used to describe the
deliverables across the sub phases. The deliverables are further defined in the Estimating
Handbook as well as in client agreements and supplier agreements in order to communicate
expectations and ensure consistency for management review and risk analysis.

17
AACE Estimate and Schedule Class CLASS 5 CLASS 4 CLASS 3 CLASS 2 CLASS 1
EPC Template Subphase FEP1 FEP2 FEP3 P2 (EPC Proposal) EPC4/P2 (Plans&Specs)
Client Supplied Information / DecisionsSite Location Locations Identified Locations Identified Location Selected Location Selected Location Selected
Soils and Hydrology Assumed Soils Conditions Prelim Soils Rept Final Soils Rept Final Soils Rept Final Soils Rept
Plant Production / Facility Capacity Requirements providedR equirements reflect
Feasibility Study
Requirements Frozen
based on selected
technology
Requirements Frozen Requirements Frozen
Project Management DeliverablesProject Scope Description Feasibility Concept Defined As Sold Detailed
Project Execution Plan Draft Defined EPC Detailed
Contracting Strategy Draft Defined EPC Detailed
Risk Register (CII 280‐3) Identification Deterministic Probablistic Probablistic
Escalation Strategy Defined Detailed Detailed
WBS Level 1 Level 2 Level 3 Level 4/3 Level 5/4
Code of Accounts Stem Detail
Project Execution Deliverables
PE01 FEP ExecutionBlock Flow Diagrams Complete
Unit Arrangement Complete
PE03 System Engineering
Process Flow Diagrams (PFDs)
Based on Process Equip
Reference information;
Major Lines Sized
Based on Updated Process
Equip Reference Info;
Estimated BOP Equip Info
Based on Process Equip
Proposal Info; BOP Equip
Reference/Estimated
Information
Issued for Design
Utility Flow Diagrams (UFDs)
Based on Process Equip
Reference information;
Major Lines Sized
Based on Updated Process
Equip Reference Info;
Estimated BOP Equip Info
Based on Process Equip
Proposal Info; BOP Equip
Reference/Estimated
Information
Issued for Design
Heat & Material Balances
Based on Process Equip
Reference information;
Estimated BOP Equip
Based on Updated Process
Equip Reference Info;
Estimated BOP Equip Info
Based on Process Equip
Proposal Info; BOP Equip
Reference/Estimated
Information
Issued for Design
Functional Description
Based on Process Equip
Reference information;
Estimated BOP Equip
Based on Updated Process
Equip Reference Info;
Estimated BOP Equip Info
Based on Process Equip
Proposal Info; BOP Equip
Reference/Estimated
Information
Issued for Design
Site Plan
Based on Process Equip
Reference information;
Estimated BOP Equip
Based on Updated Process
Equip Reference Info;
Estimated BOP Equip Info
Based on Process Equip
Proposal Info; BOP Equip
Reference/Estimated
Information
Issued for Construction
Facility Plan
Based on Process Equip
Reference information;
Estimated BOP Equip
Based on Updated Process
Equip Reference Info;
Estimated BOP Equip Info
Based on Process Equip
Proposal Info; BOP Equip
Reference/Estimated
Information
Issued for Construction
Equipment Plan
Based on Process Equip
Reference information;
Estimated BOP Equip
Based on Updated Process
Equip Reference Info;
Estimated BOP Equip Info
Based on Process Equip
Proposal Info; BOP Equip
Reference/Estimated
Information
Issued for Construction
Piping and Instrument Diagrams (P&IDs)
Based on Process Equip
Reference information;
Major Lines Sized
Based on Updated Process
Equip Reference Info;
Estimated BOP Equip Info
Based on Process Equip
Proposal Info; BOP Equip
Reference/Estimated
Information
Issued for Design
Process Equipment List
Based on Process Equip
Reference information;
Estimated BOP Equip
Based on Updated Process
Equip Reference Info;
Estimated BOP Equip Info
Based on Process Equip
Proposal Info; BOP Equip
Reference/Estimated
Information
Issued for Design
Utility Equipment List
Based on Process Equip
Reference information;
Estimated BOP Equip
Based on Updated Process
Equip Reference Info;
Estimated BOP Equip Info
Based on Process Equip
Proposal Info; BOP Equip
Reference/Estimated
Information
Issued for Design
Electrical One Line Diagrams
Based on Process Equip
Reference information;
Estimated BOP Equip
Based on Updated Process
Equip Reference Info;
Estimated BOP Equip Info
Based on Process Equip
Proposal Info; BOP Equip
Reference/Estimated
Information
Issued for Design
PE04 Layout, 3D Model, Discipline Design
BOP Equipment Specifications and
Datasheets
Based on Process Equip
Reference information;
Estimated BOP Equip
Based on Updated Process
Equip Reference Info;
Estimated BOP Equip Info
Based on Process Equip
Proposal Info / Esimated
BOP Info
Issued for
Design/Purchase
General Equipment Arrangement Drawings
Based on Process Equip
Reference information;
Estimated BOP Equip
Based on Updated Process
Equip Reference Info;
Estimated BOP Equip Info
Based on Process Equip
Proposal Info / Esimated
BOP Info
Issued for Construction
Materials Specifications Reference Reference Issued for Construction
Mechanical Discipline Drawings Issued for Construction
Electrical Discipline Drawings Issued for Construction
Instr/Control System Discipline Drawings Issued for Construction
CSA Discipline Drawings Issued for Construction
PE05 Procurement
Spare Parts Lists
Based on Selected Process
Equip/Estimated BOP
Equip
Based on Process Equip
Proposal Info / Esimated
BOP Info
Based on BOP Frozen Info
Process Equipment Information Estimated Reference Proposal (to Owner) Proposal (to EPC) Issued for Construction
BOP Equipment Information Estimated Estimated Estimated Estimated / Proposal Issued for Const/Proposal
PE06 SubcontractingMajor Subcontract Information Estimated Estimated Estimated Proposal Proposal
Other Subcontract Information Estimated Estimated Estimated Estimated Proposal / Estimated
ESTIMATE & SCHEDULE CLASSIFICATION
EPC Template Subphase FEP1 FEP2 FEP3
Piping and Instrument Diagrams (P&IDs)
Based on Process Equip
Reference information;
Major Lines Sized
Based on Updated Process
Equip Reference Info;
Estimated BOP Equip Info
Figure 12 - Company Specific Estimate Input and Maturity Matrix

18
Some of the terminology is different and there are more deliverables, but the essence of AACE
Figure 4 has been included in the company specific chart. At this point, we have integrated AACE
RP18R‐97 and AACE RP27R‐03 into company specific processes as shown in the Activity Flow
Diagram and Handbook text.
Step 3: Assign Responsibilities
The next component of the EPC Project Template we will look at is called Performance
Requirements. This component shows the assignment for providing information, performing
tasks, producing reports, etc. to named roles of the project team and home office functions. On
larger projects, the Project Execution Plan assigns individual names to the roles. A named
individual may be assigned to a single role on very large projects, or to multiple roles for smaller
construct only projects. This helps to make the EPC Template scalable for the multitude of large
and small projects that a company may perform.
There is a Performance Requirements register for each Project Execution and Project Management
Key Activity. Performance Requirements are itemized tasks and deliverables that need to be
performed. Each performance requirement is also referenced to sub phases and handbook
sections where the requirement is narratively described.

19
Below, Figure 13 shows an example of Performance Requirements. This example is for Cost
Estimating for sub phase FEP3.
PROJECT MANAGEMENT HANDBOOKPERFORMANCE REQUIREMENTS
KEY ACTIVITY
Performance Requirement Corporate Hdqtrs Home Office Project Team
VP OPS
PM01 FRONT END PLANNING MANAGEMENT WFD PM-000
Cost Estimating AFD PM01.5-FEP1-FEP3
Develop Class 3 Estimate for selected technology X P K PM01 F PM01-13 X
Obtain PFDs - FEP3 for selected technology P K PM01 F X
Obtain P&IDs - FEP3 for selected technology K PM01 F X
Obtain Equipment Layout - FEP3 for selected technology
P K PM01 F X
Obtain Facility Layout - FEP3 for selected technology P K PM01 F X
Update estimate based on process equipment supplier information - FEP3
P S K PM01 F X
Provide Class 3 Direct Resource information to Scheduler
P S K PM01 F X
Determine Indirect, Support and CM Cost durations from Class 3 Schedule
P S K PM01 F X
Provide Costs to be used for Contingency Calculation P S K PM01 F X
Include Contingency Calculation - FEP3 from Risk Management
P S K PM01 F X
Update owner/other costs as required K PM01 F X
Schedule Development AFD PM01.6-FEP1-FEP3
DIR EST Form /
Exhibit Number
Handbook Reference
COST EN
G
SCHED
Process or Handbook
CEO
RMC
COO
G COUNSEL
VP HSE F
EP
2
"Co
ncep
t"
FE
P3
"D
etailed S
cop
e"
DIR PROJ SV
CES
FE
P1
"F
easibility"
PRES
PROJ D
IR
BUS D
EV
OU M
GR
DIR PROC
PAYROLL
PROJ M
GR
PROP M
GR
ACCTG
FRONT END PLANNINGDevelop Class 3 Estimate for selected technology
Obtain PFDs - FEP3 for selected technology
Obtain P&IDs - FEP3 for selected technology
Obtain Equipment Layout - FEP3 for selected technology
Obtain Facility Layout - FEP3 for selected technology
Update estimate based on process equipment supplier information - FEP3
Provide Class 3 Direct Resource information to Scheduler
Determine Indirect, Support and CM Cost durations from Class 3 Schedule
Provide Costs to be used for Contingency Calculation
Include Contingency Calculation - FEP3 from Risk Management
Update owner/other costs as required
Figure 13 - Performance Requirements
Each Performance Requirement is assigned to roles for a specific responsibility. In the case of the
Class 3 estimate; an FEP3 deliverable; the primary responsibility is assigned to the Director of
Estimating. The Vice President, Operations is responsible to approve it. The Project Manager is
responsible to be knowledgeable of the estimate development.

20
Figure 14 shows the assignment of responsibilities to roles for development of the Cost 3 estimate;
due at Milestone FEP3
PROJECT MANAGEMENT HANDBOOKPERFORMANCE REQUIREMENTS
KEY ACTIVITY
Performance Requirement Corporate Hdqtrs Home Office Project Team
VP OPS
PM01 FRONT END PLANNING MANAGEMENT WFD PM-000
Cost Estimating AFD PM01.5-FEP1-FEP3
Develop Class 3 Estimate for selected technology X P K PM01 F PM01-13 X
Obtain PFDs - FEP3 for selected technology P K PM01 F X
Obtain P&IDs - FEP3 for selected technology K PM01 F X
Obtain Equipment Layout - FEP3 for selected technology
P K PM01 F X
Obtain Facility Layout - FEP3 for selected technology P K PM01 F X
Update estimate based on process equipment supplier information - FEP3
P S K PM01 F X
Provide Class 3 Direct Resource information to Scheduler
P S K PM01 F X
Determine Indirect, Support and CM Cost durations from Class 3 Schedule
P S K PM01 F X
Provide Costs to be used for Contingency Calculation P S K PM01 F X
Include Contingency Calculation - FEP3 from Risk Management
P S K PM01 F X
Update owner/other costs as required K PM01 F X
Schedule Development AFD PM01.6-FEP1-FEP3
DIR EST Form /
Exhibit Number
Handbook Reference
COST EN
G
SCHED
Process or Handbook
CEO
RMC
COO
G COUNSEL
VP HSE F
EP
2
"Co
ncep
t"
FE
P3
"Detailed
Sco
pe"
DIR PROJ SV
CES
FE
P1
"Feasib
ility"
PRES
PROJ D
IR
BUS D
EV
OU M
GR
DIR PROC
PAYROLL
PROJ M
GR
PROP M
GR
ACCTG
FRONT END PLANNING
VP OPS
X P K
P K
K
P K
P K
P S K
P S K
P S K
P S K
P S K
K
DIR EST
DIR PROJ SV
CES
PROJ D
IR
OU M
GR
DIR PROC
PAYROLL
PROJ M
GR
PROP M
GR
ACCTG
Figure 14 – Roles and Responsibilities
Step 4: Verify Compliance
In order to ensure compliance with processes, Milestone Reviews are held upon reaching the
milestone date. To support a Milestone Review, Milestone Checklists are used to document
completion of the Performance Requirements.

21
A Milestone Checklist for Cost Estimating at FEP3 is shown in Figure 15. There are specific
checklists for each Key Activity at each milestone.
Figure 15 - Milestone Checklist
In most cases, the checklist items validate that the Performance Requirements have been
completed.
As the milestone date nears, the project or proposal manager reviews checklist status with his
direct reports. Upon reaching the milestone date, the completed checklists are reviewed and
assessed. Because this example is part of Front End Planning, the small team is located in an office
as opposed to on a jobsite.
The Project Execution Plan for an EPC project will identify for each milestone whether the review
will be a major review or minor review. The risk profile of the project is used to help make that
determination. A minor review is performed by the project team. They review their checklists and
identify corrective actions and/or punch list items. The results of this minor review should be
shared with the upper management or executive level of the company. A major review is audited
Project Title:
Project No.:
Client:
Milestone: FEP3 Sign Date
Proj Mgr:
Key Activity Auditor:
Process or Handbook SubsectionPerformance Requirement Responsibility Reqd Date Actual Date Remarks
PM01 FRONT END PLANNING MANAGEMENTCost Estimate
Class 3 Cost EstimateDirect costs calculated from quantity estimate; verified by quotes?
Reflects quantities from final quantity estimate?Labor rates based on applicable labor agreementPayroll Tax & Insurance rates verifiedIncludes evaluated Process Equipment costs from selcted technology provider?Includes budgetary quotes for significant BOP EquipmentIncludes budgetary quotes for significant Fab Material / AssembliesIncludes budgetary quotes for bulk materialsIncludes budgetary quotes for major subcontractors?Includes budgetary quotes for significant outside services
Indirect/Support/Management costs based on Class 3 Schedule?Support costs (indirect work accounts) calculated?
Includes budgetary quotes for major rental equipment / servicesEngineering Costs identified and calculated?General Conditions Costs identified and calculated?
Includes Currency hedging for multiple currency exchange ratesIncludes Duties/Taxes on imported equipment
Contingency Calculation finalized?Mark ups reflect management approval?
ScheduleClass 3 Schedule
Detailed ScopeClass 3 Cost EstimateDirect costs calculated from quantity estimate; verified by quotes?
Reflects quantities from final quantity estimate?Labor rates based on applicable labor agreementPayroll Tax & Insurance rates verifiedIncludes evaluated Process Equipment costs from selcted technology provider?Includes budgetary quotes for significant BOP EquipmentIncludes budgetary quotes for significant Fab Material / AssembliesIncludes budgetary quotes for bulk materialsIncludes budgetary quotes for major subcontractors?Includes budgetary quotes for significant outside services
Indirect/Support/Management costs based on Class 3 Schedule?Support costs (indirect work accounts) calculated?
Includes budgetary quotes for major rental equipment / servicesEngineering Costs identified and calculated?General Conditions Costs identified and calculated?
Includes Currency hedging for multiple currency exchange ratesIncludes Duties/Taxes on imported equipment

22
on site by upper management and possibly peers from outside the project team. The auditing
team and project team will collectively identify corrective actions and/or punch list items. The
results of a major review are always shared with executive management and/or the risk
management committee.
Upon review of the checklists, meetings and interviews, the Milestone Review is subjectively
graded using heat map designations:
Green – the Milestone Gate is passed with no corrective actions required and some minor
punch list items.
Yellow – the Milestone Gate is passed with no or some corrective actions required and
punch list items.
Red – the Milestone Gate is failed. The project has serious deficiencies requiring immediate
corrective action or the project will be at risk for failing to meet its objectives for the client
and/or the company.
A “Red” grade requires a written action plan to be followed up upon by the audit team. Yellow
and Green grades require written action plans which are followed up upon by the project team
with update reports issued to executive management. Any outstanding corrective actions from a
previous Milestone Review will result in an immediate “Red” grade for any downstream Milestone
Review.

23
Figure 16 is the Milestone Review Report. For each Key Activity, indicators for both Control Level
and Execution Level show whether or not deficiencies have been found requiring attention.
PROJECT MANAGEMENT PROJECT EXECUTIONPM02 Project Execution Management PM07 Planning & Scheduling PE03 System Engineering PE06 Subcontracting
Control Level Control Level Control Level Control LevelExecution Level Execution Level Execution Level Execution Level
Milestone Objectives Completed Milestone Objectives Completed Milestone Objectives Completed Milestone Objectives Completed
Corrective Actions Required Corrective Actions Required Corrective Actions Required Corrective Actions Required
Punchlist Items Punchlist Items Punchlist Items Punchlist Items
PM03 Contract Management PM08 Change Management PE04 Discipline Design PE07 ConstructionControl Level Control Level Control Level Control Level
Execution Level Execution Level Execution Level Execution Level
Milestone Objectives Completed Milestone Objectives Completed Milestone Objectives Completed Milestone Objectives Completed
Corrective Actions Required Corrective Actions Required Corrective Actions Required Corrective Actions Required
Punchlist Items Punchlist Items Punchlist Items Punchlist Items
PM04 Risk Management PM09 HSE Management PE05 Procurement PE08 CommissioningControl Level Control Level Control Level Control Level
Execution Level Execution Level Execution Level Execution Level
Milestone Objectives Completed Milestone Objectives Completed Milestone Objectives Completed Milestone Objectives Completed
Corrective Actions Required Corrective Actions Required Corrective Actions Required Corrective Actions Required
Punchlist Items Punchlist Items Punchlist Items Punchlist Items
PM05 Quantity Management PM10 Quality ManagementControl Level Control Level
Execution Level Execution Level
Milestone Objectives Completed Milestone Objectives Completed
Corrective Actions Required Corrective Actions Required
Punchlist Items Punchlist Items
PM06 Cost Control PM11 Information ManagementControl Level Control Level
Execution Level Execution Level
Milestone Objectives Completed Milestone Objectives Completed
Corrective Actions Required Corrective Actions Required
Punchlist Items Punchlist Items
Corrective Actions Required. The project has met the requirements to pass the Milestone Review. Plan implemented to complete required corrective actions.
MILESTONE REVIEW REPORTMilestone: EPC1
Milestone Objectives not met. The project has not met the requirements to pass the Milestone Review. Plan implemented to complete the Milestone Objectives. Follow up review required.
X
Punch List Items Open. The project has met the requirements to pass the Milestone Review. Plan implemented to close out open punch list items.
No Yes No Yes
Yes Yes Yes No
Yes Yes Yes No
Yes
Yes
Yes
Yes
Yes
No No No Yes
Yes Yes Yes NoYes Yes
Yes Yes Yes No
No Yes No No
Yes Yes Yes
Yes No Yes Yes
Yes No Yes Yes
Yes No
No Yes
Yes No
Yes No
Yes
No Yes
Yes No
Yes No
No
Yes No
Yes Yes
Yes
Yes No
Yes Yes
Yes Yes Yes Yes
No
Yes Yes
Yes No
Figure 16 - Milestone Review Report
Collaboration across the enterprise
All the EPC Project Template documentation shown has been produced using standard office
programs. The process maps and Activity Flow Diagrams are Microsoft® Visio® drawings. The
Handbooks and Manuals are Microsoft® Word® documents. The Performance Requirements,
Milestone Checklists and Control Level Objectives are Microsoft® Excel® spreadsheets. Forms
and reports are an assortment of these same files. Training modules are Microsoft® Powerpoint®
presentations.1
1 Microsoft®, Visio®, Word®, Excel®, Powerpoint®, SharePoint® are either registered trademarks or trademarks of Microsoft Corporation in the United States and/or other countries.

24
The EPC Project Template holds the knowledge base for the company; processes that are expected
to be followed to produce positive results. It needs to be available to project team members
wherever they are working. Large companies work on multiple projects simultaneously at multiple
locations. Consequently, project team members are geographically scattered to the various
jobsites.
In our case study company, the EPC Project Template is “owned” by operations. It is updated from
time to time to reflect changes in processes resulting from lessons learned and new Recommended
Practices. It’s a “living” system. Keeping the content in commonly used file formats allows
operations to make any necessary changes easily. As a result, an IT solution is relatively simple.
A Microsoft® SharePoint® site is used to make all the documents available throughout the
enterprise. The process maps open as web parts. Each process on the process map has hyperlinks
which allow the user to open the Activity Flow Diagram. From the Activity Flow Diagram, users can
hyperlink to related processes, other Activity Flow Diagrams, Handbooks, Performance
Requirements, Forms and Milestone Checklists. Also included are registers that hyperlink to CII
publications. We have included a register for AACE Recommended Practices, however we do not
hyperlink to them as AACE updates them from time to time.
Conclusion
Having graphically documented processes in an integrated structure provides a tangible medium
for incorporating AACE Recommended Practices and CII Best Practices.
Recommended Practices and Best Practices and other knowledge bases can be aligned once a
process structure is in place. After alignment, the content is reviewed for applicability. Process
maps and Activity Flow Diagrams are modified to reflect changes. Handbooks and Manuals are also
edited to provide the narrative support. Through Performance Requirements, responsibilities are
clearly communicated. Compliance is verified through the use of Milestone Checklists and

25
Milestone Reviews. With SharePoint, the entire knowledge base is always available throughout the
company.
While this paper focused on only a couple processes during the Front End Planning phase of a
project, this same methodology is used for all Proposal and EPC processes. Additionally, the
company can expand this to include other Operations areas such as Human Resources, HSE,
Quality, Labor Relations, Legal and Accounting. Several AACE Recommended Practices focus on
skills for cost engineers and schedulers; those subjects are typically outside the scope of projects,
but very necessary considerations for operations.
What has been presented in this paper is not proprietary knowledge. It does not require an
expensive software application or computer programming capability. Using the MS Office suite
operations and project management professionals can create a proactive, integrated system that
incorporates industry knowledge and increases chances of project success.

26
Bibliography
No. Description 1 Stephenson, H. Lance, CCP FAACE, AACE TCM Framework, 2nd edition, page 17, (2015)
2 Stephenson, H. Lance, CCP FAACE, AACE TCM Framework, 2nd edition, Figure 1.3‐1, page 31,
(2015).
3 AACE Recommended Practice 18R‐97 – Table 1 – Cost Estimate Classification Matrix for Process Industries, AACE International, page 3 of 15, (March, 2016).
4 AACE Recommended Practice 18R‐97, Table 3 – Estimate Input Checklist and Maturity
Matrix (Primary Classification Determinate), page 13 of 15, (March, 2016)
5 AACE Recommended Practice 27R‐03, Table 1 – Generic Schedule Classification Matrix, page 3 of 9 (November, 2010).


