32
PM 2.5 SOURCE CONTRIBUTIONS DEANNA HUFF ALASKA DEPARTMENT OF ENVIRONMENTAL CONSERVATION 1

PM2.5 SOURCE CONTRIBUTIONS
DEANNA HUFF
ALASKA DEPARTMENT OF ENVIRONMENTAL CONSERVATION1

OVERVIEW
Collaboration
Speciation Source Apportionment
Emissions Inventory
Air Quality Modeling
Summary
2

COLLABORATIVE EFFORT
ADEC, FNSB and EPA R10 staff – organization, monitor operation,
funding, direction & integration
Sierra Research – emissions inventory development and air quality
modeling
Penn State – meteorological modeling
UAF – air quality modeling, chemical analyses
CCHRC – Space heating fuel use and wood moisture level
University of Montana – chemical analysis and modeling
Washington University in St Louis – analysis of black carbon
measurements
University of Massachusetts – chemical tracer measurements
OMNI-Test Laboratories – space heating emission measurements3

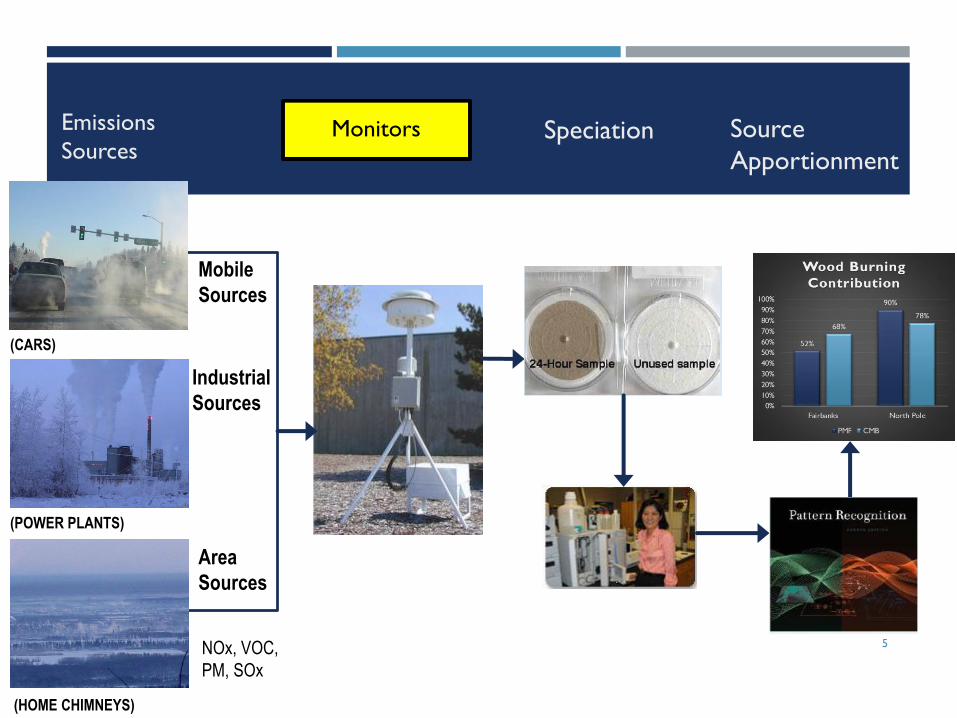
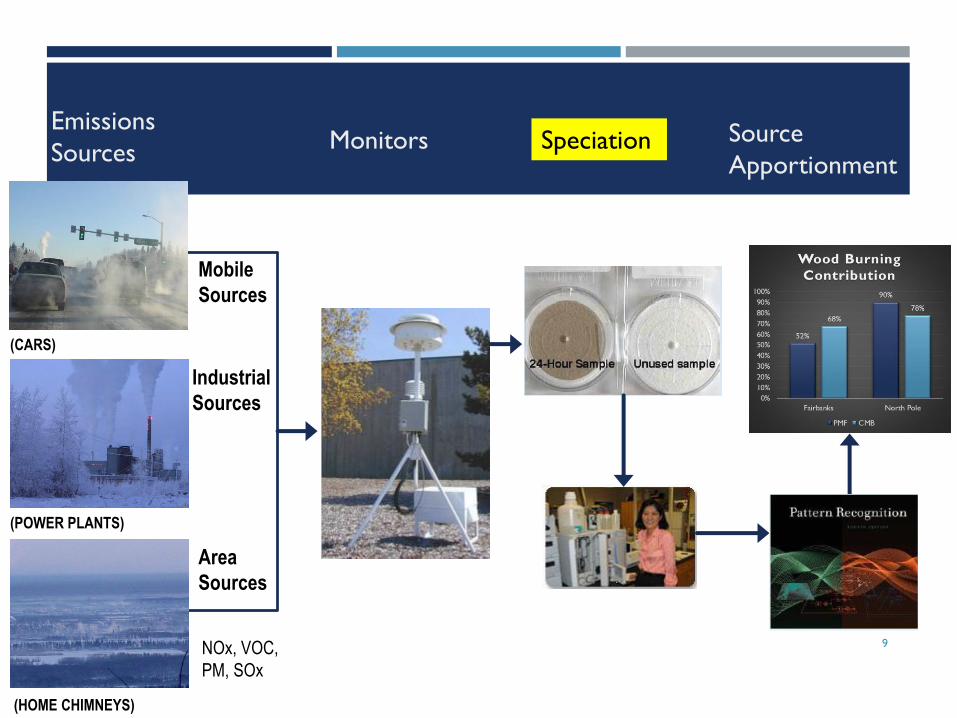
SPECIATION SOURCE APPORTIONMENT
PROCESS SUMMARY
Emissions of particulate matter from all sources are captured at the monitors.
Monitors give the concentrations (mass) of PM 2.5 on filters.
Speciation is the analysis of filters to determine the unique chemical
components of PM 2.5 (organic carbon, sulfate, nitrate…..).
Source apportionment models (PMF and CMB) process the speciation data
assigning contributions to different sources, or source groupings.
PMF and CMB are models that identify sources by their chemical patterns
(fingerprints) and can pull apart each different sources contribution to the total.
Sources with similar chemical patterns are difficult to distinguish.
4
5
Mobile
Sources
Industrial
Sources
Area
Sources
NOx, VOC,
PM, SOx
(CARS)
(POWER PLANTS)
(HOME CHIMNEYS)
SpeciationMonitors Source
Apportionment
MonitorsEmissions
Sources
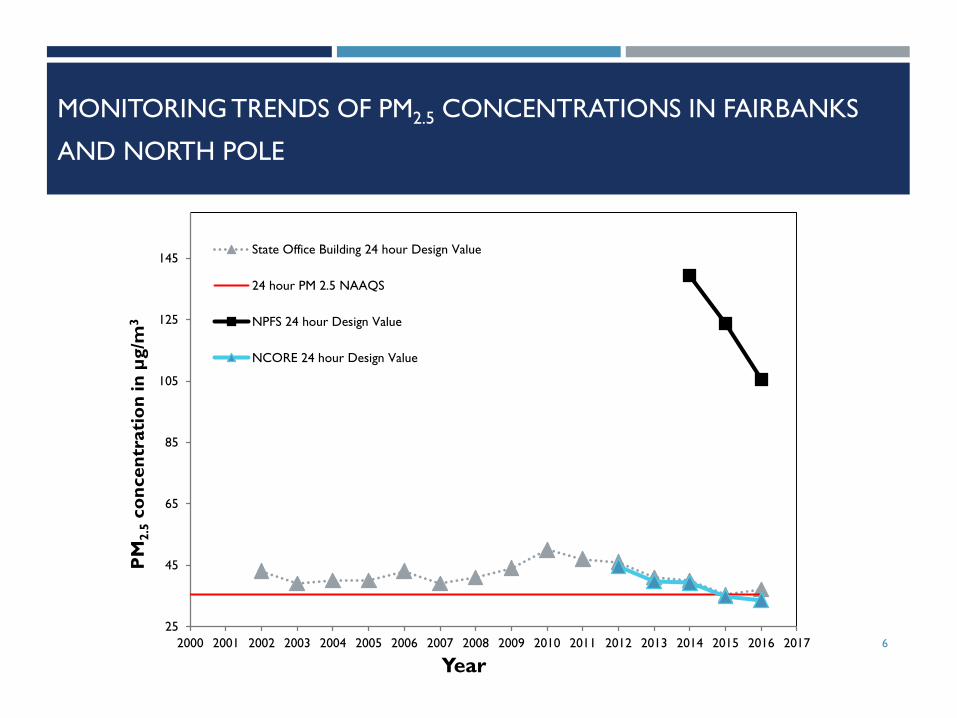
MONITORING TRENDS OF PM2.5 CONCENTRATIONS IN FAIRBANKS
AND NORTH POLE
6
25
45
65
85
105
125
145
2000 2001 2002 2003 2004 2005 2006 2007 2008 2009 2010 2011 2012 2013 2014 2015 2016 2017
PM
2.5
co
nce
ntr
ati
on
in
µg/m
3
Year
State Office Building 24 hour Design Value
24 hour PM 2.5 NAAQS
NPFS 24 hour Design Value
NCORE 24 hour Design Value
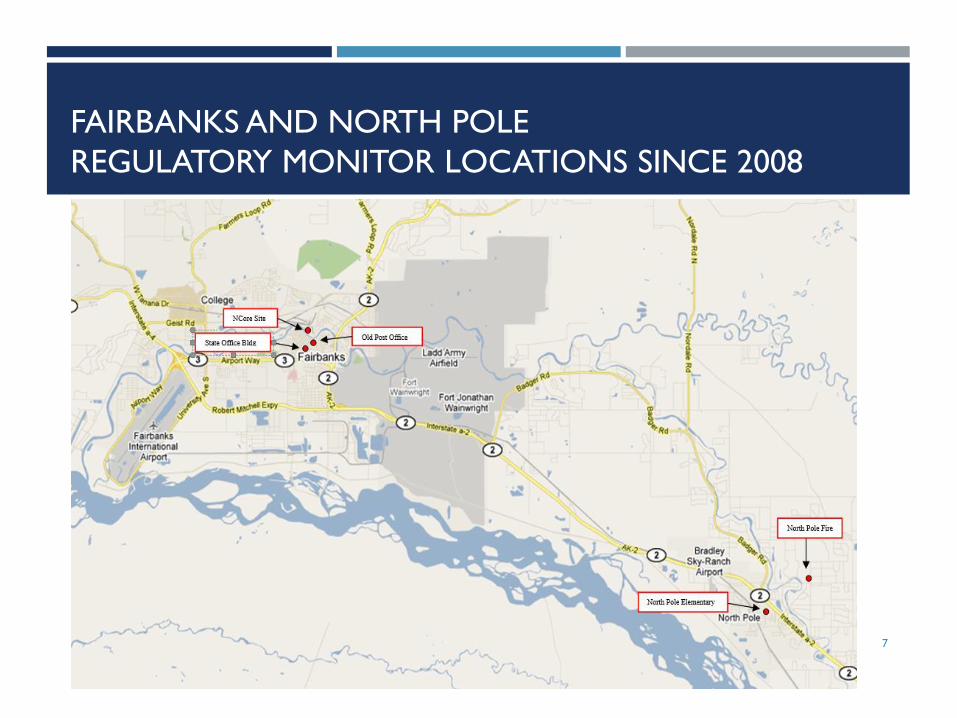
FAIRBANKS AND NORTH POLE
REGULATORY MONITOR LOCATIONS SINCE 2008
7
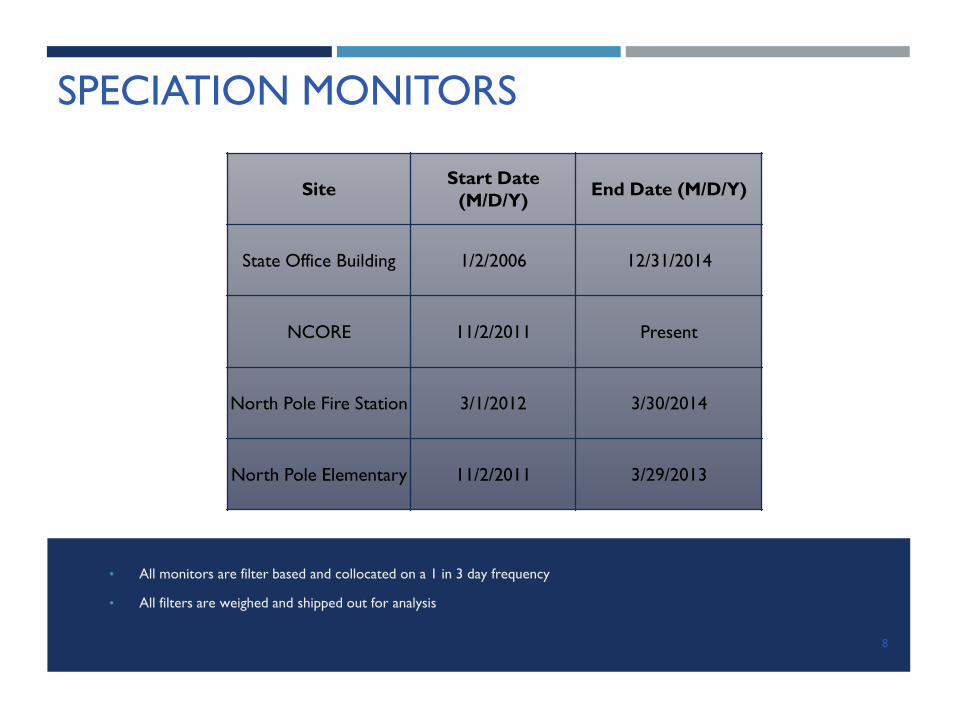
SPECIATION MONITORS
SiteStart Date
(M/D/Y)End Date (M/D/Y)
State Office Building 1/2/2006 12/31/2014
NCORE 11/2/2011 Present
North Pole Fire Station 3/1/2012 3/30/2014
North Pole Elementary 11/2/2011 3/29/2013
• All monitors are filter based and collocated on a 1 in 3 day frequency
• All filters are weighed and shipped out for analysis
8
Monitors
9
Mobile
Sources
Industrial
Sources
Area
Sources
NOx, VOC,
PM, SOx
(CARS)
(POWER PLANTS)
(HOME CHIMNEYS)
SpeciationEmissions
SourcesSource
Apportionment
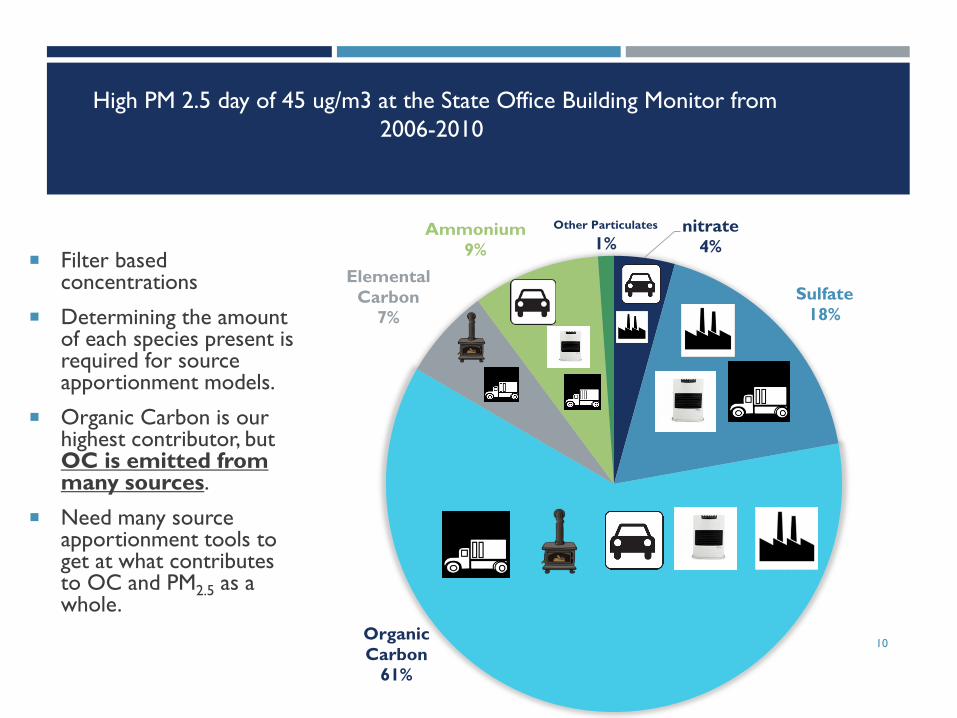
Filter based concentrations
Determining the amount of each species present is required for source apportionment models.
Organic Carbon is our highest contributor, but OC is emitted from many sources.
Need many source apportionment tools to get at what contributes to OC and PM2.5 as a whole.
10
High PM 2.5 day of 45 ug/m3 at the State Office Building Monitor from
2006-2010
nitrate
4%
Sulfate
18%
Organic
Carbon
61%
Elemental
Carbon
7%
Ammonium
9%
Other Particulates
1%

SPECIATION MONITOR DATA FROM STATE OFFICE
BUILDING AND NORTH POLE FIRE STATION
11
Organic
Carbon
54%
Elemental
Carbon
11%
Sulfate
20%
Nitrate
7%
Ammonium
7%
Other
1%
STATE OFFICE BUILDING AVERAGE WINTER HIGH PM 2.5
DAYS (38.9 UG/M3) FROM YEARS 2011-2015
Organic
Carbon
80%
Elemental
Carbon
9%
Sulfate
7%
Nitrate
2%
Ammonium
2% Other
0%
NPFS WINTER AVERAGE HIGH PM 2.5 DAYS
(131.6 UG/M3) FROM YEARS 2011-2015

Monitors
12
Mobile
Sources
Industrial
Sources
Area
Sources
NOx, VOC,
PM, SOx
(CARS)
(POWER PLANTS)
(HOME CHIMNEYS)
SpeciationEmissions
SourcesSource
Apportionment
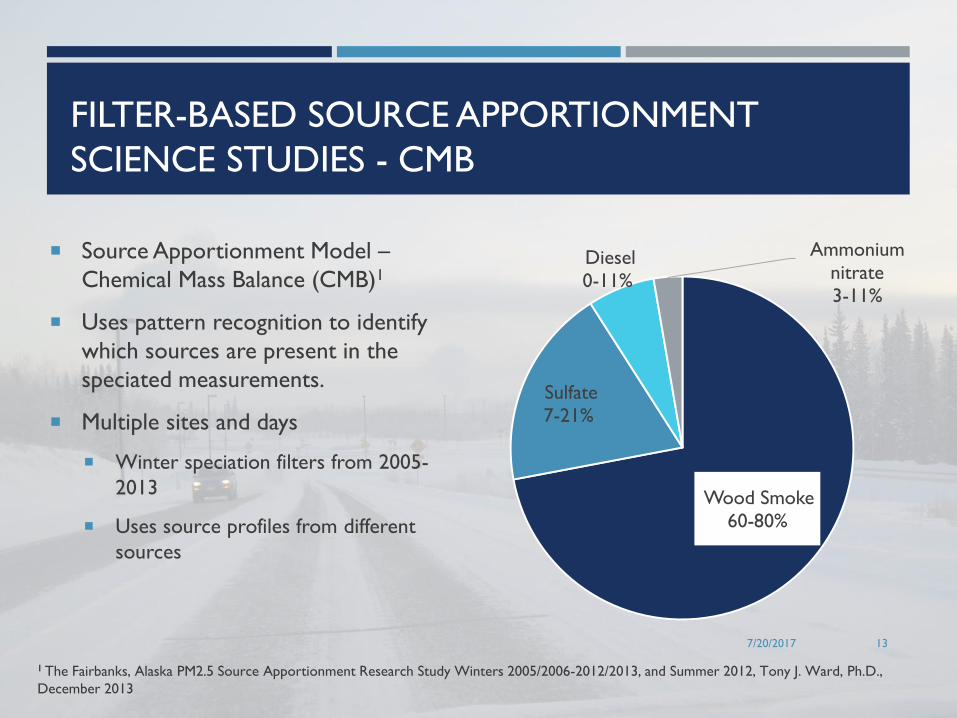
FILTER-BASED SOURCE APPORTIONMENT
SCIENCE STUDIES - CMB
Source Apportionment Model –
Chemical Mass Balance (CMB)1
Uses pattern recognition to identify
which sources are present in the
speciated measurements.
Multiple sites and days
Winter speciation filters from 2005-
2013
Uses source profiles from different
sources
13
Wood Smoke
60-80%
Sulfate
7-21%
Diesel
0-11%
Ammonium
nitrate
3-11%
7/20/2017
1 The Fairbanks, Alaska PM2.5 Source Apportionment Research Study Winters 2005/2006-2012/2013, and Summer 2012, Tony J. Ward, Ph.D.,
December 2013

FILTER-BASED SOURCE APPORTIONMENT
SCIENCE STUDIES - PMF
Source Apportionment Model -
Positive Matrix Factorization (PMF)1
2010-2015
Fairbanks and North Pole speciation
filters
Whole winter average
Wood burning is a major
contributor.
Results agree with CMB on wood
burning dominating PM2.5.
52%
90%
68%
78%
0%
10%
20%
30%
40%
50%
60%
70%
80%
90%
100%
Fairbanks North Pole
Wood Burning
Contribution
PMF CMB
14
1Source apportionment of PM2.5 at multiple Northwest U.S. sites: Assessing regional winter wood smoke
impacts from residential wood combustion, Robert A. Kotchenruther, 2016
15
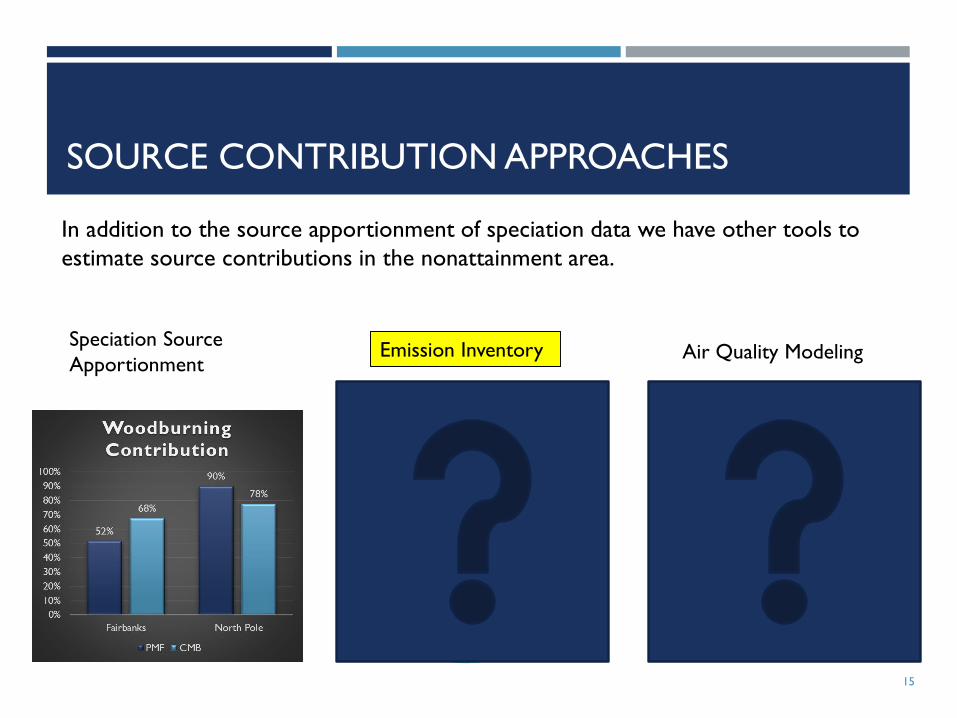
Speciation Source
ApportionmentEmission Inventory Air Quality Modeling
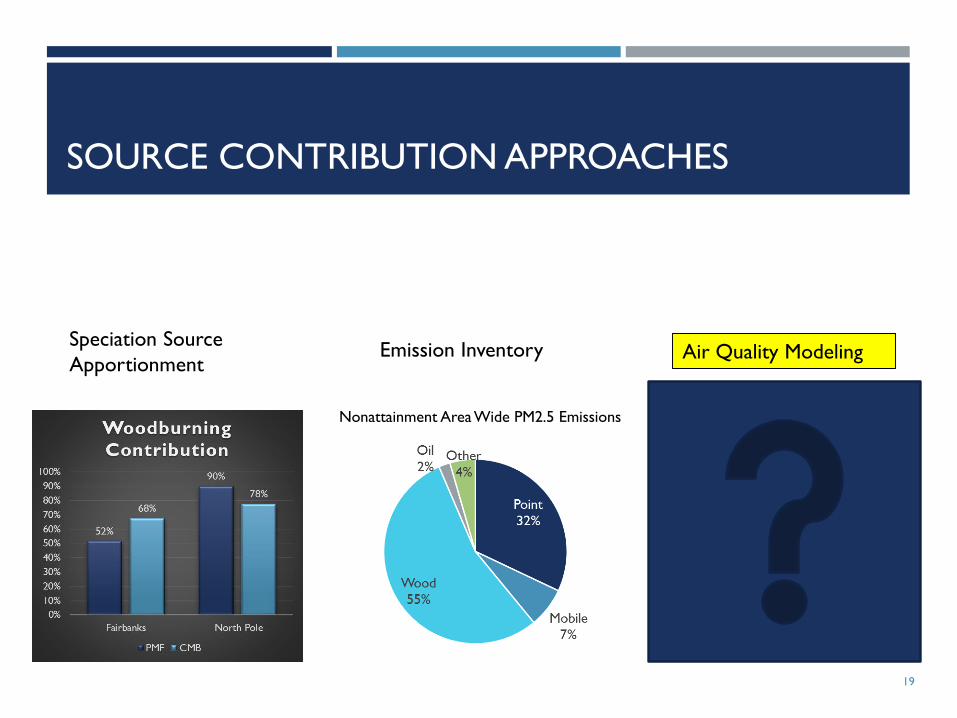
SOURCE CONTRIBUTION APPROACHES
In addition to the source apportionment of speciation data we have other tools to
estimate source contributions in the nonattainment area.

EMISSIONS INVENTORY PROCESS
Local information is collected:
Population
Activity
Fuels
Types of sources
Meteorology
Emissions are calculated for sources impacting the nonattainment area with EPA
approved methods using local data.
16

EMISSIONS SOURCE CHARACTERIZATION
Home Heating
Multi-year phone survey
In-home measurement study
Local fuel and device lab testing
Vertical allocations
Episode specific point source emissions
Transportation Modeling (MOVES)
Local fleet – DMV
Fairbanks activity – parking survey
Winter meteorology17

EMISSIONS SOURCE AVERAGES INTO THE ENTIRE NON ATTAINMENT AREA FOR 2013 (EARLY DRAFT)
18
* Not emitted at ground level
Source Category %
Space Heating – Wood 55%
Point Sources* 32%
On-Road Vehicles 7%
Other Sources (Other Area & Non-Road) 4%
Space Heating – Heating Oil 2%
Space Heating – Other (coal, waste oil, etc.) <1%
TOTAL 100%
19
Speciation Source
ApportionmentEmission Inventory Air Quality Modeling
SOURCE CONTRIBUTION APPROACHES
Nonattainment Area Wide PM2.5 Emissions

AIR QUALITY MODELING PROCESS
Air quality models can estimate the concentrations of PM2.5 within the
nonattainment area as well as source contributions.
These models combine meteorology, emissions inventories, and chemistry to
determine source contributions.
Air quality models account for both the location and height of the stack of a
source when estimating contribution.
Both the directly emitted PM2.5 and precursor contributions are determined by
the model.
20

PRELIMINARY MODELED SOURCE
CONTRIBUTIONS FOR FAIRBANKS
21
Point
9%
Mobile
10%
Wood
48%
Other
10%
Oil
6%
Sulfate
17%
2013 State Office Building Contributions
Point
5% Mobile
7%
Wood
63%
Other
8%
Oil
3%
Sulfate
14%
2013 North Pole Fire Station Contributions

22
Speciation Source
ApportionmentEmission Inventory Air Quality Modeling
SOURCE CONTRIBUTION APPROACHES
Nonattainment Area Wide PM2.5 Emissions
Point
9% Mobile
10%
Wood
48%
Other
10%
Oil
6%
Sulfate
17%
2013 State Office Building
Contributions

SOURCE CONTRIBUTION SUMMARY
23
Collaborative effort using multiple approaches
Wood burning is consistently found to be the major contributor to winter PM2.5.
This contribution holds true across multiple sites and years.
Point sources are not the largest contributor to the ground level concentrations.
NEXT STEPS
Develop emissions and air quality projections to 2019
Analyze control measures – emission reductions, implementation issues, costs,
and cost-effectiveness
Use results to:
Assess continuation/change in existing measures
Assemble packages of measures to demonstrate attainment
Assess time required to attain standard
Presentations of findings to the public and Assembly24

ACKNOWLEDGEMENTS
Mark Hixson, Sierra Research
Bob Dulla, Sierra Research
Denise Koch, Director, DEC
Bob Kotchenruther, USEPA Region10
Rob Elleman, USEPA Region10
25

Chemistry
Meteorology
EXAMPLE ** KEY FAIRBANKS MODELING
STEPS
26
Mobile
Sources
Industrial
Sources
Area
Sources
NOx, VOC,
PM, SOx
NOx, VOC,
PM, SOx
NOx, VOC,
PM, SOx
(CARS)
(POWER PLANTS)
(HOME CHIMNEYS)
Weather
Photo-
chemical
Statistical
Models

FAIRBANKS MONITOR FILTERS
27
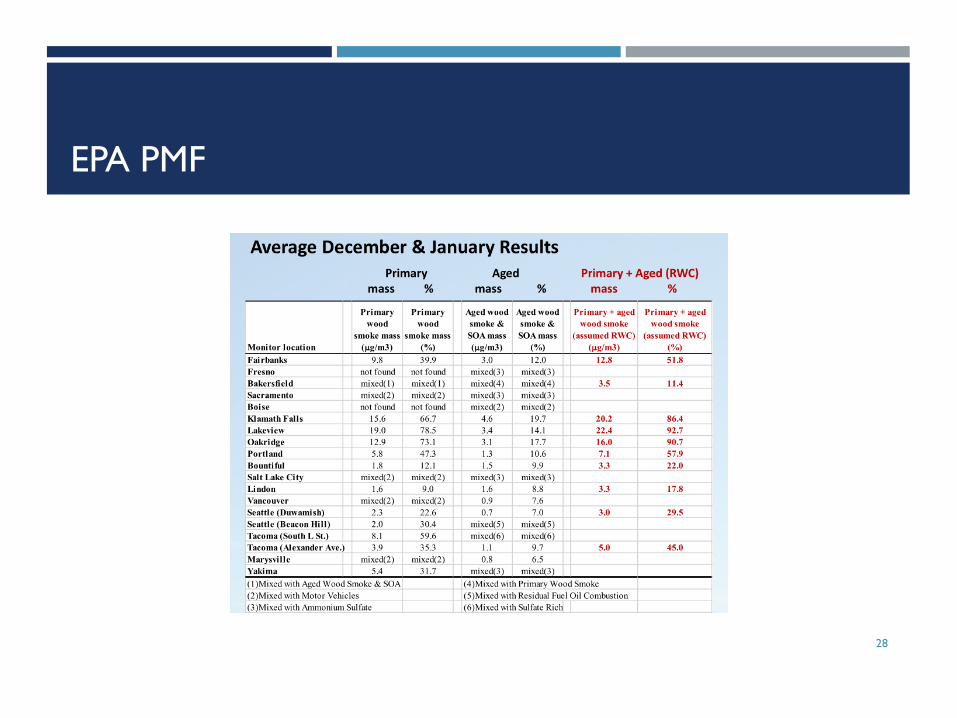
EPA PMF
28

CHEMICAL MASS BALANCE MODEL
Speciation filters from State Office
Building, NCORE North Pole
Elementary, North Pole Fire Station,
RAMS, Peger Road
Source mix changes based on
meteorology, focus is on high PM 2.5
days
Years of data (2005-2013) to cover
all winter days, conditions and
account for variability
Sulfate
17.9%
Ammonium
Nitrate
8.0%
Diesel
5.5%
Autos
0.5%
Wood
Smoke
67.7%
Unexplaine
d
0.6%
Avg PM2.5: 21.8 µg/m3
29
Winter 2012/2013 EPA source profiles State Office
Building
Sulfate
7.4%Ammonium
Nitrate
2.8%
Diesel
9.8%
Autos
1.4%
Wood
Smoke
77.6%
Unexplaine
d
1.0%
Avg PM2.5: 46.9 µg/m3
Winter 2012/2013, EPA source profiles NPF3

C14/LEVO/ORGANICS STUDIES
Comprehensive chemical analyses
for levoglucosan, hopanes, steranes
and PAHs have been performed on
up to 33 ambient PM2.5 samples
from Fairbanks.
A more comprehensive approach of
source apportionment using full
profiles of all sources and ambient
PM2.5 is much more appropriate for
this analysis. The results suffered
from data limitations for Fairbanks
sources and ambient PM2.5.
All tests had conflicting results for
tracers that could be marked fuel oil
and coal, in the end the results had
many qualifiers and were considered
inconclusive.
Estimated Laevoglucosan
woodsmoke 30-65% percent
Fuel Oil with an upper bound of
15%
Coal at estimated at 2.7%
30

CALPUFF CONFIGURATION AND INTEGRATION WITH CMAQ
WRF input files using MMIF and preserved layering
Modeled six power plants in the nonattainment coal and fuel oil
Single source impacts at the violating monitor and area wide
Corroborate with CMAQ on total PM2.5
contribution from points (7-22%).
31
OTHER MONITORING ACTIVITIES
FNSB:
6 pDRs in Schools
Sniffer vehicle
18 neighborhood monitors in two 9 sampler grids
DEC:
North Pole Saturation study
12 pDRs and sniffer vehicle during intensive 2 week sampling study up to 1.5 miles around NPFS SLAMS site
6 additional pDRs available for additional hot spot locations
Historically: FNSB used short term special purpose monitoring sites
3 sampling trailers available
4-12 weeks in one location
Evaluation of hot spots or complaints
32


