29
©TeamSAI NAVIGATING THROUGH THE UNPREDICTABLE UNCERTAINTY AND RISK . . . PMA POTENTIAL: AN INDUSTRY FORECAST MARPA ANNUAL CONFERENCE OCTOBER, 2014 10/02/2014

©TeamSAI
NAVIGATING THROUGH THE UNPREDICTABLE
UNCERTAINTY AND RISK . . .
PMA POTENTIAL: AN INDUSTRY FORECASTMARPA ANNUAL CONFERENCE
OCTOBER, 2014
10/02/2014

©TeamSAI
NAVIGATING THROUGH THE UNPREDICTABLE
GLOBAL FLEET AND MRO OUTLOOK
210/02/2014

©TeamSAI
23,010
28,019
32,906
0
5,000
10,000
15,000
20,000
25,000
30,000
35,000
2014 2019 2024
NB WB RJ TP
2014-2024 GLOBAL FLEET FORECAST
GLOBAL FLEET OUTLOOK – COMMERCIAL AIRLINE SECTOR
2014-2024 REGIONAL FLEET FORECAST
310/02/2014
- 5,000 10,000
NA
WE
AP
CH
LA&C
EE
ME
AF
IN
2014 2019 20242014-2024
CAGR2024
Mrkt Share Region
0.8% 24%
2.1% 18%
4.4% 17%
7.3% 12%
5.1% 8%
5.6% 6%
5.8% 6%
5.1% 5%
11.4% 3%
©TeamSAI 4
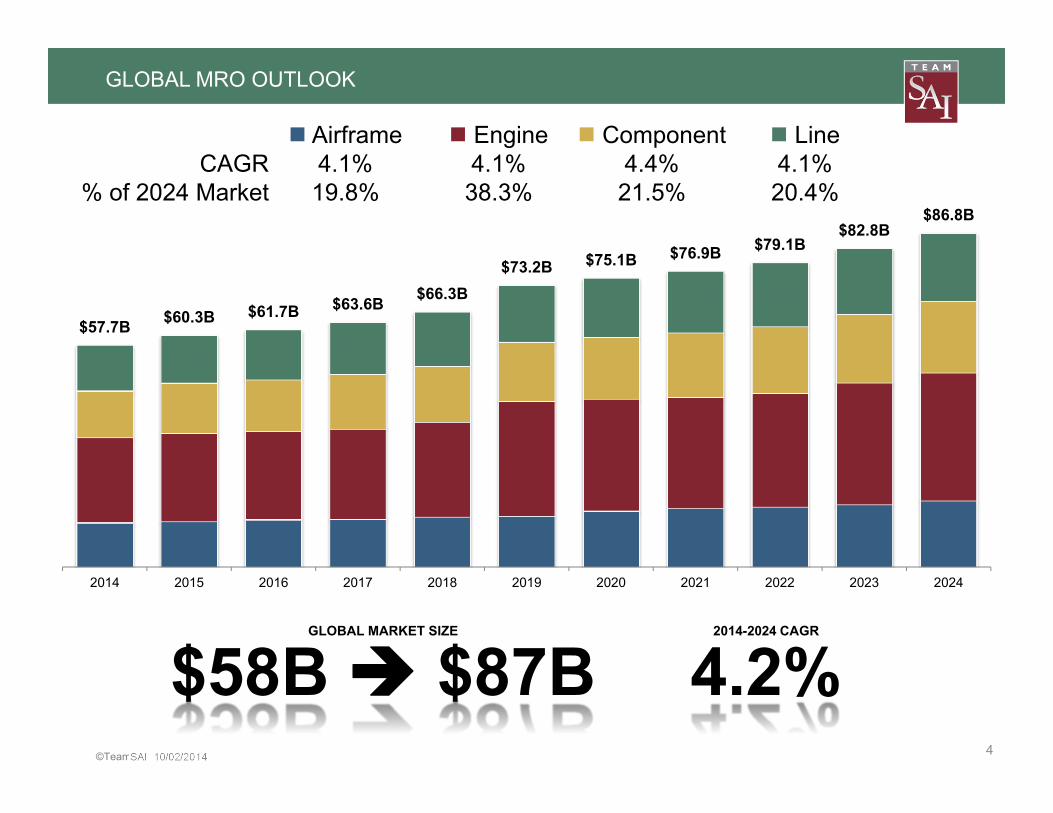
GLOBAL MRO OUTLOOK
10/02/2014
4.2%2014-2024 CAGR
$58B $87BGLOBAL MARKET SIZE
$11.5B $11.8B $12.3B $12.5B $13.0B $13.2B $14.6B $15.2B $15.6B $16.1B $17.2B
$22.1B $22.9B $22.9B $23.4B $24.7B$29.9B $29.1B $29.0B $29.5B $31.7B $33.2B
$12.2B $13.1B $13.5B $14.2B $14.5B$15.3B $16.0B $16.7B $17.4B
$17.8B$18.7B
$11.9B $12.5B $13.0B $13.6B$14.2B
$14.8B $15.4B $16.0B $16.6B$17.2B
$17.7B
$57.7B $60.3B $61.7B $63.6B $66.3B$73.2B $75.1B $76.9B $79.1B
$82.8B$86.8B
2014 2015 2016 2017 2018 2019 2020 2021 2022 2023 2024
Airframe Engine Component LineCAGR 4.1% 4.1% 4.4% 4.1%
% of 2024 Market 19.8% 38.3% 21.5% 20.4%

©TeamSAI
NAVIGATING THROUGH THE UNPREDICTABLE
GLOBAL MATERIAL MARKET OUTLOOK
510/02/2014

©TeamSAI 6
GLOBAL MRO MATERIAL DEMAND
10/02/2014
4.2%2014-2024 MATERIAL DEMAND CAGR
$37B $55BGLOBAL MATERIAL DEMAND
$20.9B $21.0B $20.6B $20.7B $21.5B $25.4B $26.6B $26.5B $26.9B $28.7B $31.5B
$36.8B $39.2B $41.1B $42.9B $44.8B$47.8B $48.5B $50.4B $52.2B
$54.1B$55.4B
$57.7B $60.3B $61.7B $63.6B $66.3B$73.2B $75.1B $76.9B $79.1B
$82.8B$86.8B
2014 2015 2016 2017 2018 2019 2020 2021 2022 2023 2024
Labor Material% of 2024 Market 36.2% 63.8%

©TeamSAI 7
MRO BASED DEMAND COMPOSITION
10/02/2014
MaterialCosts(2)
PARTS REPAIRCOSTS
MATERIALCOSTS(1)
Labor Costs
LABORCOSTS
MRO BASED DEMAND
(1) Expendable and Consumable only(2) Expendable and Consumable used to repair a Rotable

©TeamSAI 8
MRO BASED DEMAND COMPOSITION
10/02/2014
Labor60%
Labor9%
Labor41%
Labor77%
Material40%
Material91%
Material59%
Material23%
HMV & MOD Engine Component Line
Each MRO sector has unique labor & material demands

©TeamSAI 9
SPARES BASED DEMAND COMPOSITION
10/02/2014
ROTABLE SCRAP
REPLACEMENT
SPARES IN TRANSIT
SPARES ON THE SHELF
SPARES BASED DEMAND(1)
(1) Expendable, Consumable and Rotable
Rotables are generally capitalized and viewed as investments

©TeamSAI 10
GLOBAL MATERIALS DEMAND COMPOSITION
10/02/2014
MRO Based
Demand
Spares & Availability
Based Demand
Total Post-Delivery Parts
Demand

©TeamSAI 11
GLOBAL MATERIALS MARKET – DEMAND BY SEGMENT
10/02/2014
$4.6B $5.5B $7.4B
$20.1B
$27.2B
$30.3B
$7.2B
$9.0B
$11.0B
$2.8B
$3.7B
$4.5B
$2.1B
$2.4B
$2.1B
$36.8B
$47.8B$55.4B
2014 2019 2024
Total Materials Demand is 63.8% of MRO Total in 2024
Airframe Engine Component Line SparesCAGR 4.8% 4.2% 4.4% 4.9% 0.2%
% of 2024 Market 13% 55% 20% 8% 4%

©TeamSAI
4.6%$3.3B $5.2B2014-2024 HARVESTED MATERIAL CAGRHARVESTED MATERIAL IMPACT ON GLOBAL SPARE MATERIALS MARKET
12
GLOBAL MATERIAL MARKET – DEMAND FULFILLED BY HARVESTED MATERIAL
10/02/2014
$33.5B
$43.7B$50.2B
$3.3B
$4.1B
$5.2B
$36.8B
$47.8B$55.4B
2014 2019 2024
All Other Harvested% of 2024 Market 90.6% 9.4%

©TeamSAI
NAVIGATING THROUGH THE UNPREDICTABLE
PMA PARTS MARKET OUTLOOK
1310/02/2014

©TeamSAI 1410/02/2014
PMA PARTS DEMAND
Global MRO MarketGlobal MRO Market
Global Material Demand
Global Material Demand
Spares Based
Demand
MRO Based
DemandPMA

©TeamSAI 1510/02/2014
TOTAL PMA PARTS DEMAND
Airframe Engine Component Line SparesCAGR 0.8% 3.0% -0.1%
% of 2014 Market 11.5% 49.4% 29.0% 3.4% 6.8%% of 2024 Market 19.2% 39.7% 29.0% 7.2% 5.0%
$49.4M $71.1M$111.1M
$212.7M$220.2M
$229.8M
$124.7M$144.6M
$167.6M$14.6M
$24.6M
$41.4M
$29.2M
$29.1M
$28.8M
$430.6M$489.5M
$578.6M
2014 2019 2024
PMA Parts Demand is currently 1.2% of Total MRO Materials Demand

©TeamSAI 1610/02/2014
PMA PARTS DEMAND BY REGION 2014
$12.6M
$84.2M
$31.5M
$16.6M
$6.8M
$19.9M
$32.1M
$130.9M
$96.0M
Top three regions make up 73% of the PMA parts market

©TeamSAI 1710/02/2014
PMA PARTS DEMAND BY REGION 2019
Top three regions make up 66% of the PMA parts market
$16.9M
$99.6M
$49.3M
$21.7M
$10.6M
$27.9M
$43.4M
$120.4M
$99.6M

©TeamSAI 1810/02/2014
PMA PARTS DEMAND BY REGION 2024
Top three regions make up 60% of the PMA parts market
$21.6M
$115.9M
$71.2M
$28.4M
$17.4M
$37.8M
$55.8M
$124.2M
$106.3M

©TeamSAI 1910/02/2014
PMA PARTS DEMAND BY AIRCRAFT CLASS
Narrowbody Widebody Regional Jet TurbopropCAGR 3.9% 3.5% -4.2% 0.8%
2024 Penetration 1.1% 1.0% 1.1% 1.1%
$186.9M$227.3M
$274.2M
$180.1M
$207.2M
$254.0M$42.9M
$33.0M
$28.0M
$20.6M
$22.0M
$22.3M
$430.6M$489.5M
$578.6M
2014 2019 2024

©TeamSAI 2010/02/2014
PMA DEVELOPMENT TRENDS
0 2 4 6 8 10 12 14 16 18 20 22 24
Years Since New Model Introduction
PMA Development Activity Over Time
Warranty ExpiresOEM LTAs Begin
ExpiringAircraft Part-Outs Begin Picking Up
PMA Sweet SpotPMA Sweet Spot

©TeamSAI
NAVIGATING THROUGH THE UNPREDICTABLE
MARKET DYNAMICS
2110/02/2014

©TeamSAI
• Operators looking to reduce costs in all areas of operations –Including aircraft maintenance
• Or rather, maintenance is one of the more significant lever operators have to pull–So identifying specific areas of improvements within maintenance is critical
22
MARKET DYNAMICS
10/02/2014 Cost Distribution
2%Profit
6%Tax/Fee
17%Maintenance
10%Ownership
38%Fuel
23%Labor
4%Other
Segment Labor Material
Airframe 60% 40%
Engine 9% 91%
Comp. 41% 59%
Line 77% 23%
MRO 36% 64%
©TeamSAI 23
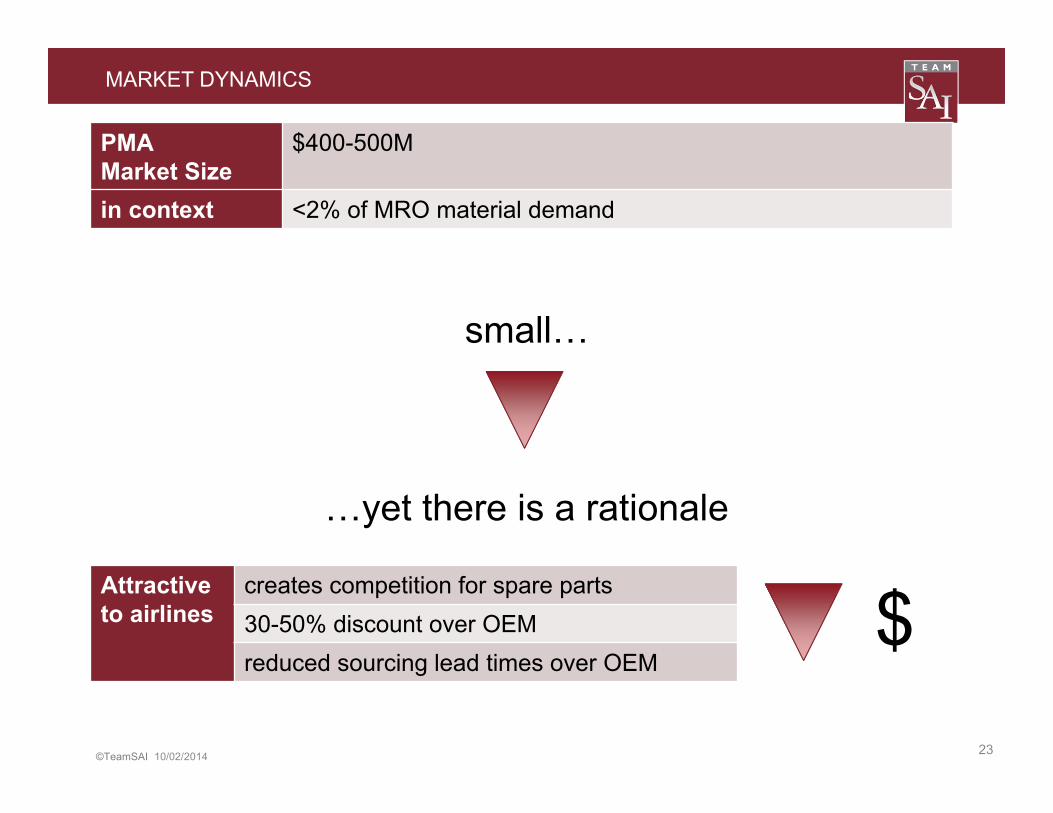
MARKET DYNAMICS
10/02/2014
PMAMarket Size
$400-500M
in context <2% of MRO material demand
…yet there is a rationale
Attractiveto airlines
creates competition for spare parts30-50% discount over OEMreduced sourcing lead times over OEM
small…
$

©TeamSAI
•Considering the many benefits, why doesn’t PMA take off?–The popularity of generic drugs is a common analogy
24
MARKET DYNAMICS
10/02/2014
OEM Product Improvement; LTSA; Fear
Cost Savings; Long Production
Runs
PMA
Succ
ess
PMA
Succ
ess
Answer: Competition!

©TeamSAI 25
MARKET DYNAMICS
10/02/2014
Constituency Position on PMA
Lessors Hesitant• Residual values• Marketability• Depends on acceptance
OEMs Opposed• Protect market share• Long-term Service Agreements (LTSA)
• Offering lessor-specific products (e.g., PML, V-Secure, Opera)
PMAs Proponent• Expanding MRO presence• Access end-user• Access OEM content
MRO

©TeamSAI 26
MARKET DYNAMICS
10/02/2014
•Engine PMA market likely to all but disappear in the distant future because…1. Fleets shifting to new generation
aircraft and engines2. OEMs locking up new gen
aftermarket on LTSA3. Dismantled aircraft providing
additional alternative supply of parts
OEM64%
Distributors9%
Surplus8%
PMA1%
Parts Repair18%
Engine Maintenance Material Providers
Sour
ce:
Team
SAI C
onsu
lting
Ser
vice
s an
alys
is
OEMs’ LTSA share of demand-side forecast for global engine MRO revenuesAvailable refers to engine MRO work not on long-term service agreements
So where will PMA growth come from?
How are PMA providers responding?

©TeamSAI 27
MARKET DYNAMICS – WHERE THE GROWTH WILL BE
10/02/2014
Airframe Engine Component Line SparesCAGR 0.8% 3.0% -0.1%
% of 2014 Market 11.5% 49.4% 29.0% 3.4% 6.8%% of 2024 Market 19.2% 39.7% 29.0% 7.2% 5.0%
$49.4M $71.1M$111.1M
$212.7M$220.2M
$229.8M
$124.7M$144.6M
$167.6M$14.6M
$24.6M
$41.4M
$29.2M
$29.1M
$28.8M
$430.6M$489.5M
$578.6M
2014 2019 2024
Airframe and Cabin Components as well as Line Maintenance…
…but these markets are notably smaller than engine

©TeamSAI 28
DIVERSIFICATION IS KEY
10/02/2014
Licensed suppliers
Producing parts in collaboration with OEMs to help meet demand & reduce cost of production
Competitive suppliers
Challenging OEMs for market share

©TeamSAI
NAVIGATING THROUGH THE UNPREDICTABLE
THANK YOU
2910/02/2014
David A. MarcontellPresident & COOTeamSAI, Inc.(404) [email protected]
WWW.TEAMSAI.COM


