The World Leader in High Performance Signal Processing Solutions PMB TM Di it l PMBus TM Digital PFC Controller with Integrated with Integrated AC Power Metering Marco Soldano Power Systems Architect S @ Marco.Soldano@Analog.com
Transcript
The World Leader in High Performance Signal Processing Solutions
PMB TM Di it l PMBusTM Digital PFC Controller with Integrated with Integrated
IntroductionDigital PFC Controller architectureUser interface keeping it simpleUser interface - keeping it simplePower Supply performance optimizationPMBus command set supportppPower MeteringConclusions
2
Mission StatementMission Statement
Flexible yet simple to use digital PFC controllerAccurate and cost effective Power Metering implementationHigh Performance THD and PFHigh Performance THD and PF Industry Standard PMBusTM command set supportReal time efficiency optimizationy p
3
Different “Flavors” of Digital PowerDifferent Flavors of Digital Power
ADP1047: Single Phase Digital PFC ADP1047: Single Phase Digital PFC Controller
VoutRelay
VRec
AC
BulkCap
Relay
ACInput
3.3V
VAC
AGND1
2
24
23
VDD
RES
PMBusPGND
VFB
OVP
ILIMNC
3
4
5
6
7
22
21
20
19
18
RTD
SDA
SCL
ADD
SYNC
CS+CS-
DGND
PSON
NC7
8
9
10
11
18
17
14
16
15
PGOOD
INRUSH
AC_OK
PWM2
SYNC
ADP1047VCORE12 13PWM
ADP1047 Block DiagramADP1047 Block Diagram
ADP1047
1
2
3
4
5
24
23
22
21
20PGND
VAC
AGND
VFB
OVP
VDD
RESRTD
SDASCL
ADD
ADP1047TOP VIEW
(Not to Scale)
6
7
8
9
10
11
19
18
17
14
16
15
CS+CS-
DGND
SCL
PSON
PGOODINRUSH
ILIM
AC_OK
NC
PWM2
SYNC
12 13VCORE PWM
24 13
1210.236BSC
PIN 1
0.154BSC
0.341BSC
SEATINGPLANE
0.0100.004 0.012
0.0080.025BSC
0.0690.053
0.0100.006
0.0500.016
8°0°
0.0650.049
COPLANARITY0.004
COMPLIANT TO JEDEC STANDARDS MO-137AE
24 Lead QSOP Package24 Lead QSOP Package
Time Continuous Sigma-Delta ADCTime Continuous Sigma-Delta ADC
Bits = Log2(Clock/BW)g2( )
FAST – LO Accuracy MID Speed/Accuracy SLOW – HI AccuracyFAST LO AccuracySome Protections,
trigger levels
MID Speed/AccuracyControl Loop,Protections
SLOW HI AccuracyTelemetry,
Power Metering
Time continuous Sigma-Delta+ inherent anti-alias filter
Nyquist rate (Flash or SAR)+ does not necessarily require high clock inherent anti alias filter
+ single-bit SD has guaranteed linearity+ smaller area- High clock rate needed for higher
resolution (over-sampling)
does not necessarily require high clock rate (but higher eases anti-alias requirement)
- Higher power consumption- Needs anti-alias filterresolution (over sampling)
- Requires a decimation filter post ADC - Linearity dependent on matching
8
ADP1047/48 Control LoopADP1047/48 Control Loop
VFB1 VAC rms2
VACIL
Compensator
K
Compensator
K
Hv(z)
_VAC,rms
_Hi(z)
DIREFfrequencyfz fp frequencyfz fp
Hv(z)VREF + +
Hi(z)VEA
Voltage Loop Compensator
(Normal and Fast)
Current Loop Compensator
(High and Low Line)
NORMAL COMPENSATION FAST COMPENSATIONHI LINE HI LINE LIGHT-LOAD
CURRENT FILTERHI LINE HEAVY-LOAD
CURRENT FILTERHI LINE CURRENT FILTER
FAST VOLTAGE FILTER
(Normal and Fast) ( g )
CURRENT FILTER
SLOW VOLTAGE FILTER
CURRENT FILTER
SLOW VOLTAGE FILTERFAST VOLTAGE FILTER
LO LINE LO LINE LIGHT-LOAD CURRENT FILTER
LO LINE HEAVY-LOAD CURRENT FILTER
LO LINE CURRENT FILTER
SLOW VOLTAGE FILTERSLOW VOLTAGE FILTER SLOW VOLTAGE FILTER
SLOW VOLTAGE FILTER
9
Voltage and Current Loop programmingVoltage and Current Loop programming
10
Fast Loop to Improve Transient Response Fast Loop to Improve Transient Response
V Iin
Load Step Change: 150W300W
Vrec
I
Iin
Iout
Iload
VbulkProgrammableRange Vout
Progr.Delay(1-8 half cycles)
out
Iin
Fast loop is enabled when Vout is outside programmable
FastloopIout
Fast loop is enabled when Vout is outside programmable range (from 1.5% to 12%) Switch between fast loop and regular loop happens at voltage zero-crossingsControl switches back to Normal filter after programmable
Vout
11
Control switches back to Normal filter after programmable delay of 1 to 8 AC line cycles
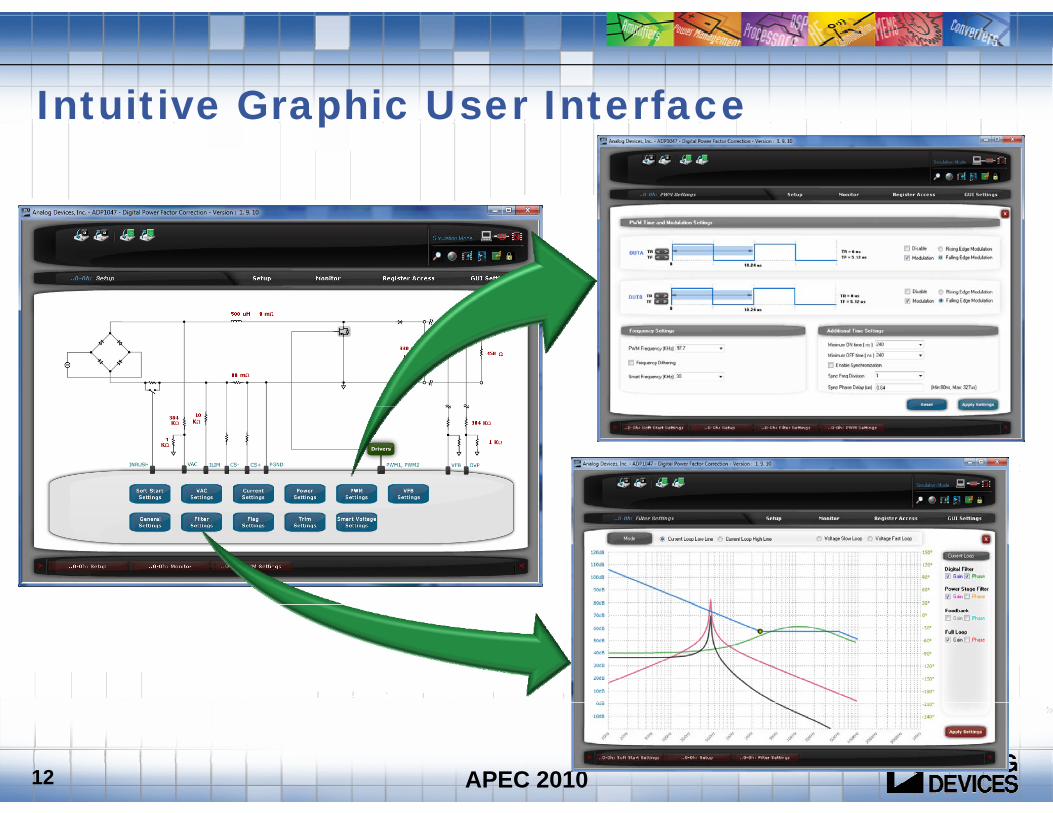
Intuitive Graphic User InterfaceIntuitive Graphic User Interface
APEC 201012
Power Factor and THD performancePower Factor and THD performance
Vin=90V PF>0.99, THD=0.9%
0.9
1
0.8
actor
Vin = 90V
Vin (V) Vo (V) Power Factor
Distortion (THD)
90 385 >0.99 0.9%
120 385 0 99 1%
0.6
0.7
Power Fa Vin = 120V
Vin = 150V
Vin = 180V
Vin = 210V
Vin = 240 V
120 385 >0.99 1%
150 385 0.99 1.4%
180 385 0.99 1.7%
220 385 0.99 2.5%Vin=220V PF=0.99, THD=2.5%
0.4
0.5
220 385 0.99 2.5%
260 385 0.99 3.2%
0 50 100 150 200 250 300 350
Output power (W)
13
ADP1047 – Programmable Inrush ControlADP1047 Programmable Inrush Control
Programmable start-up inrush control of external relay
Programmable soft start delay and timingand timing
14
Adaptive Boost VoltageAdaptive Boost Voltage
OutputVoltage
VOH240V AC input
VOL2
High line
VOH2
VOH1
Power
P1 100%
VOL1 Low line
P2P1 100%P2
Bulk Voltage tracking to improve efficiency and keep hold up time constant
Voltage is adjusted based on input Power and Input Line Voltageg j g
15
PMBus Command Set SupportPMBus Command Set Support
Native support for 31 PMBus commandsPIN, VIN, VOUT, IIN reporting in Linear FormatStandard Warning and Fault limit settingsStandard Warning and Fault limit settingsSupport of Standard PMBus Fault Responses
Additional 134 Manufacturer Specific CommandsAdditional functionalities not covered by PMBus
16
Data representation for Power Voltage and Data representation for Power, Voltage and Current – Linear Format
Mantissa (bits)
Exp (N) Min Range
Min LSB Max Range
Max LSB Exponent # of bits
VIN 11 -3 to -1 256V 0.125V 1024V 0.5V 3: -22 to 22-1
IIN 11 10 t 5 2A 0 976 A 64A 31 25 A 5 24 t 24 1IIN 11 -10 to -5 2A 0.976mA 64A 31.25mA 5: -24 to 24-1
PIN 11 -3 to +4 256W 125mW 32 8kW 16W 3: -22 to 22-1PIN 11 -3 to +4 256W 125mW 32.8kW 16W 3: -2 to 2 -1
VOUT 11 -3 to 0 256V 0.125V 2048V 1V 3: -22 to 22-1
17
AC Power MeasuringAC Power Measuring Input RMS Current/Voltage Sampling bandwidth is 24kHzp g Sampling window is synchronized with line frequency
Input True RMS Power is calculated cycle by cycle and then averaged Data is averaged over a programmable window Data is averaged over a programmable window from 133ms to 68s @ 60Hz from 160ms to 82s @ 50Hz
18
1047 Power Metering Data with ideal AC Input 1047 Power Metering Data with ideal AC Input Power Error in terms of percentage (Vout=385V)
3 00%
5.00%Vin = 90VVin = 120VVin = 150V
1.00%
3.00%
tage
Vin = 180VVin = 210VVin = 240 V
‐1.00%
Error p
ercent
‐3.00%
E
‐5.00%
0 50 100 150 200 250 300
19
Output Power (W)
1047 Power Metering Data with Non-ideal AC Input 1047 Power Metering Data with Non ideal AC Input Accuracy is within 1% at loads higher than 125W
VoltageAC Input
5.00350
frompower meter4.50
5.00350
2.00
3.00
4.00
200
250
300age of Error
power (W
)
from power meter
From 1047
Error pecentage
2.00
2.50
3.00
3.50
4.00
150
200
250
300
tage
of E
rror
Power (W
)
from power meter
From 1047
Error percentage
0.00
1.00
50
100
150
Percen
t
Inpu
t p
1 00
‐0.50
0.00
0.50
1.00
1.50
0
50
100
150
Percen
t
Inpu
t
20
‐1.000
0% 20% 40% 60% 80% 100%
percentage of full load
‐1.000
0% 20% 40% 60% 80% 100%Percentage of full load
1047 Power Metering Data with Non-ideal AC Input 1047 Power Metering Data with Non ideal AC Input Accuracy is within 1.5% at loads higher than 125W
Voltage AC Input
5 005.506.00
300
350
from power meter
5.00
300
350
2.002.503.003.504.004.505.00
150
200
250
300
e of Error
ut Pow
er(W
)
p
From 1047
Error percentage
2.00
3.00
4.00
150
200
250
300tage
of E
rror
ut Pow
er (W
)
from power meter
From 1047
Error percentage
‐1.00‐0.500.000.501.001.50
0
50
100
Percen
tage
Inpu
‐1.00
0.00
1.00
0
50
100 Percen
t
Inpu
21
0% 20% 40% 60% 80% 100%
Percentage of full load0% 20% 40% 60% 80% 100%
Percentage of full load
ADP1047 - SummaryADP1047 - Summary
Flexible, digital Power Factor correction controller Accurate Power Metering capabilityEasy to use GUIEasy to use GUIReal-time Efficiency optimizationEnhanced dynamic responsey pProgrammable soft start and Inrush ControlFrequency Spread Spectrum improves EMIPMBusTM Compliant


![MPC5643L Dual Motor Controller Board User GuideR363 populated M1 PFC UNI-3 M1 PFC output signal is connected to GPIO G[7] (PWM0-B3). R364 populated M2 PFC. MPC5643L Dual Motor Controller](https://static.documents.pub/doc/80x56/603986c4cefa7440cf45045c/mpc5643l-dual-motor-controller-board-user-guide-r363-populated-m1-pfc-uni-3-m1-pfc.jpg)


