Proceedings of the 30 th Conference of the International Group for the Psychology of Mathematics Education Prague, Czech Republic July 16-21, 2006 Volume 4 Research Reports Kun - Ros Editors: Jarmila Novotná Hana Moraová, Magdalena Krátká, Naća Stehlíková Charles University in Prague Faculty of Education
Transcript
Proceedings of the 30th Conference of the International Group for the
Psychology of Mathematics Education
Prague, Czech Republic July 16-21, 2006
Volume 4 Research Reports
Kun - Ros
Editors: Jarmila Novotná Hana Moraová, Magdalena Krátká, Na a Stehlíková
Charles University in Prague
Faculty of Education
4-ii PME30 �— 2006
Proceedings of the 30th Conference of the International Group for the Psychology of Mathematics Education
Kuntze, Sebastian & Reiss, Kristina Evaluational research on a video-based in-service mathematics teacher training project - Reported instructional practice and judgements on instructional quality
4-1
Kynigos, Chronis & Gavrilis, Kostas Constructing a sinusoidal periodic covariation
4-9
Kyriakides, Andreas O. Modelling fractions with area: The salience of vertical partitioning
4-17
Lavy, Ilana Dynamic visualization and the case of ‘stars in cage’
4-25
Leder, Gilah C. & Forgasz, Helen J. & Taylor, Peter J. Mathematics, gender, and large scale data: New directions or more of the same?
4-33
Lee, Kyung Hwa Evaluation and reconstruction of mathematics textbooks by prospective teachers
4-41
Lerman, Stephen & Zevenbergen, Robyn Maths, ICT and pedagogy: An examination of equitable practice in diverse contexts
4-49
Levav-Waynberg, Anat & Leikin, Roza Solving problems in different ways: Teacher’ knowledge situated in practice
4-57
Liljedahl, Peter Persona-based journaling: Alligning the product with the process
4-65
Lin, Chuan-Ju & Hung, Pi-Hsia & Lin, Suwei The power of goal orientation in predicting student mathematics achievement
4-73
4-iv PME30 �— 2006
Lin, Fang-Chi & Wang, Chih-Yeuan & Chin, Chien & Chang, Gi-Yuan Why do student teachers teach or not teach the professed values?
4-81
Lozano, Maria Dolores & Sandoval, Ivonne Twiggy & Trigueros, Maria Investigating mathematics learning with the use of computer programmes in primary schools
4-89
Lucus, Calin A. Is subject matter knowledge affected by experience? The case of composition of functions
4-97
Mackay, Irene F. Classroom factors supporting progress in mathematics
4-105
Maffei, Laura & Mariotti, Maria Alessandra A remedial intervention in algebra
4-113
Mamona-Downs, Joanna & Papadopoulos, Ioannis The problem-solving element in young students’ work related to the concept of area
4-121
Maracci, Mirko On students’ conceptions in vector space theory
4-129
Marcou, Andri & Lerman, Stephen Towards the development of a self-regulated mathematical problem solving model
4-137
Markovits, Zvia & Rosenfeld, Sherman & Eylon, Bat-Sheva Visual cognition: Content knowledge and beliefs of preschool teachers
4-145
Martinez, Mara & Brizuela, Barbara An unexpected way of thinking about linear function tables
4-153
Michael, Stalo & Elia, Iliada & Gagatsis, Athanasios & Theoklitou, Athina & Savva, Andreas Levels of understanding of patterns in multiple representations
4-161
Modestou, Modestina & Gagatsis, Athanasios Can the spontaneous and uncritical application of the linear model be questioned?
4-169
PME30 �— 2006 4-v
Monoyiou, Annita, Xistouri, Xenia & Philippou, George Primary students’ reasoning in problem solving and teachers’ evaluation of their arguments
4-177
Morselli, Francesca Use of examples in conjecturing and proving: an exploratory study
4-185
Moss, Joan & Beatty, Ruth Knowledge building and knowledge forum: Grade 4 students collaborate to solve linear generalizing problems
4-193
Mousoulides, Nicholas & Pittalis, Marios & Christou, Constantinos Improving mathematical knowledge through modeling in elementary schools
4-201
Mulligan, Joanne & Mitchelmore, Michael & Prescott, Anne Integrating concepts and processes in early mathematics: The Australian Pattern and Structure Mathematics Awareness Project (PASMAP)
4-209
Murphy, Carol Embodiment and reasoning in children’s invented calculation strategies
4-217
Neria, Dorit & Amit, Miriam When the wrong answer is the "good" answer: Problem-solving as a means for identifying mathematical promise
4-225
Nogueira de Lima, Rosana & Tall, David The concept of equations: What have students met before?
4-233
Nolan, Kathleen T. Teaching becomes you: The challenges of placing identity formation at the centre of mathematics pre-service teacher education
4-241
Novotná, Jarmila & Stehlíková, Na a & Hoch, Maureen Structure sense for university algebra
4-249
Okazaki, Masakazu Semiotic chaining in an expression constructing activity aimed at the transition from arithmetic to algebra
4-257
O�’Keefe, Catherine A. & Hua, Xu Li & Clarke, David J. Kikan-Shido: Through the lens of guiding student activity
4-265
4-vi PME30 �— 2006
Olivero, Federica Hiding and showing construction elements in a dynamic geometry software: A focusing process
4-273
Olson, Jo Clay & Colasanti, Meghan & Trujillo, Karmin Prompting growth for prospective teachers using cognitive dissonance
4-281
Österholm, Magnus Metacognition and reading – Criteria for comprehension of mathematics texts
4-289
Ouvrier-Buffet, Cécile Classification activities and definition construction at the elementary level
4-297
Ozmantar, Mehmet Fatih & Monaghan, John Abstraction, scaffolding and emergent goals
4-305
Panaoura, Areti & Panaoura, Georgia Cognitive and metacognitive performance on mathematics
4-313
Pantziara, Marilena & Philippou, George Measuring and relating primary students’ motives, goals and performance in mathematics
4-321
Papageorgiou, Pandelitsa & Monoyiou, Annita & Pitta-Pantazi, Demetra The intuitive rule more A-more B: The impact of a dynamic geometry software
4-329
Paschos, Theodorus & Farmaki, Vassiliki The reflective abstraction in the construction of the concept of the definite integral: A case study
4-337
Pehkonen, Erkki & Hannula, Markku S. & Maijala, Hanna & Soro, Riitta Infinity of numbers: How students understand it
4-345
Povey, Hillary & Angier, Corinne The assessment of undergraduate mathematicians: Recrafting assessment of learning to provide opportunities for assessment as learning
4-353
Powell, Arthur B. Social cognition emerging from student-to-student discursive interactions during mathematical problem solving
4-361
PME30 �— 2006 4-vii
Powell, Arthur B. & Hanna, Evelyn Understanding teachers’ mathematical knowledge for teaching: A theoretical and methodological approach
4-369
Prediger, Susanne Continuities and discontinuities for fractions: A proposal for analysing in different levels
4-377
Psycharis, Giorgos Dynamic manipulation schemes of geometrical constructions: Instrumental genesis as an abstraction process
4-385
Radford, Luis & Bardini, Caroline & Sabena, Cristina Rhythm and the grasping of the general
4-393
Radu, Iuliana & Tozzi, Barbara & Weber, Keith Developing mathematical initiative in minority students
4-401
Rezat, Sebastian A model of textbook use
4-409
Ridlon, Candice L. Identical twins’ perceptions of two different instructional approaches to learning mathematics
4-417
Roche, Anne & Clarke, Doug M. When successful comparison of decimals doesn’t tell the full story
4-425
Rodríguez, Félix & Gutiérrez, Angel Analysis of proofs produced by university mathematics students, and the influence of using Cabri software
4-433
Rolka, Katrin & Rösken, Bettina & Liljedahl, Peter Challenging the mathematical beliefs of preservice elementary school teachers
4-441
Ron, Gila & Dreyfus, Tommy & Hershkowitz, Rina Partial knowledge constructs for the probability area model
4-449
Rösken, Bettina & Rolka, Katrin A picture is worth a 1000 words – The role of visualization in mathematics learning
4-457
Rossi Becker, Joanne & Rivera, Ferdinand Establishing and justifying algebraic generalization at the sixth grade level
4-465
4-viii PME30 �— 2006
2006. In Novotná, J., Moraová, H., Krátká, M. & Stehlíková, N. (Eds.). Proceedings 30th Conference of the International Group for the Psychology of Mathematics Education, Vol. 4, pp. 1-8. Prague: PME. 4 - 1
EVALUATIONAL RESEARCH ON A VIDEO-BASED IN-SERVICE MATHEMATICS TEACHER TRAINING PROJECT -
REPORTED INSTRUCTIONAL PRACTICE AND JUDGEMENTS ON INSTRUCTIONAL QUALITY1
Sebastian Kuntze, Kristina Reiss University of Munich, Germany
In this study, we concentrated on aspects of evaluational research on a video-based in-service teacher training program with more than 30 participating upper secondary mathematics teachers. As the program aimed at encouraging the teachers in improv-ing cognitive activation in their classrooms, the evaluation focused both on compo-nents of the teachers’ professional knowledge and on indicators for implementation in instructional practice. The results indicate that teachers modified their perception of instructional situations and reported to have introduced more student-centered work on activating tasks in their classrooms.
THEORETICAL BACKGROUND Research on impacts of in-service teacher training projects often concentrates on four levels of observation (cf. Lipowsky, 2004; Kirkpatrick, 1979): The first level of ob-servation includes feedback by participating teachers e.g. with respect to the useful-ness of the training project or self-reported changes in their classrooms. On a second level of observation, the development of professional knowledge can be analysed. The third level includes ratings of the teachers’ actions in the classroom by external observers. Finally, there are studies treating possible impacts of teacher training pro-grams on student achievement and other data linked to the learners, which can be identified as a forth level of observation. These four levels of observation are linked to the question to what extent teachers enrolled in an in-service teacher training pro-ject implement its contents in their professional and instructional practice. For im-plementation, professional knowledge and instruction-related beliefs seem to play a mediating role: Professional knowledge is likely to be a prerequisite for experiment-ing with contents of the in-service teacher training project in their classroom practice. If a teacher, for instance, perceives a contradiction between her or his instruction-related beliefs and contents of the teacher training, she or he might react differently to the teacher training project than teachers who see their beliefs in line with the aims of the training. This is why teacher training projects often focus on the implementation of improved instructional practice and the development of professional knowledge. A practice-relevant domain of professional knowledge concerns judgements on in-structional quality (Clausen, Reusser & Klieme, 2003) in classroom situations. Im-proving the teachers’ ability to judge on instructional quality might have an impact on instructional practice, as the decision-making by teachers involves general, situa- 1 This study was funded by the Robert Bosch Foundation
Kuntze & Reiss
4 - 2 PME30 — 2006
tion-specific, and content-specific cognitions and beliefs (Malara, 2003; Escudero & Sanchez, 1999). In particular, this seems to be the case for decisions teachers make in instructional classroom situations. The theoretical background for components of pro-fessional knowledge investigated in this research project (e.g. Shulman, 1987; Leinhardt & Greeno, 1986) has been described in more detail in Kuntze & Reiss (2005). In the following, we concentrate on contents and aims of a teacher training project addressing professional knowledge and classroom practice. The in-service teacher training project The findings of the TIMSS Video Study (Baumert et al., 1997) were a starting point for the in-service teacher training project, which was subject to the evaluational re-search of this study. These findings revealed a teaching script typical for German classrooms that can be described as a teacher-centered interaction marked by ques-tions and tasks of a rather low level of complexity. Challenging and cognitively acti-vating tasks were often lacking, and the students had little time to develop answers containing several steps of a solution. For the special case of lessons on geometrical proof, we could replicate these results in an own study (Kuntze & Reiss, 2004). Un-der the condition of the teaching script, meta-knowledge on the subject was not em-phasised and the students were likely to encounter difficulties in building up mathe-matical concepts, in the particular case the concept of mathematical proof (cf. Reiss, Klieme & Heinze, 2001). Based on these findings, three measures were identified that might improve cognitive activation as an important dimension of instructional quality (Clausen, Reusser & Klieme, 2003):
Fostering argumentation processes among the students in the classroom inter-action can enable them to develop multi-step problem solutions in challenging situations (cf. Reiss, Klieme & Heinze, 2001).
Using mistakes in the classroom for working on conceptual understanding and as opportunities for argumentational exchange can be used to provide cogni-tively activating and authentic learning opportunities (cf. Heinze, 2005).
Together with the measures above, more challenging tasks like those suggested in standards should be addressed. Additional learning environments focusing on conceptual understanding and requiring multi-step individual or cooperative student work could help to contribute to improve cognitive activation.
As these possible measures are well in line with the goals of recently introduced German standards for mathematics education, the aim of the in-service teacher train-ing project was to encourage teachers to introduce changes in their classrooms in ac-cordance with these goals. The teacher training project had two components: The first component consisted of video-based discussions of instructional situations. These discussions should help the teachers to improve their observation of instructional quality and to consider alternative teacher actions. Additionally, the participants were encouraged to make experiments in their own classrooms, trying to provide more cognitively activating instructional situations. The second component of the teacher
Kuntze & Reiss
PME30 — 2006 4 - 3
training focused on the development and implementation of a student-centered, coop-erative learning environment on the in-depth understanding of a mathematical con-cept. Written argumentation of the students was part of this learning environment. We expected that, before the training project, the teachers’ instructional practice as well as their instruction-related beliefs were consistent with the teaching script re-vealed in the TIMS Video Study. Furthermore, we tried to find out whether changes of such “traditional” beliefs and practices towards more appreciation of fostering cognitive activation, argumentation and discourse took place during the project.
RESEARCH QUESTIONS The study aims at providing evidence for the following research questions: (i) How do the teachers describe their instructional practice? Is there evidence in the teachers’ self-reported instructional practice, whether they implemented contents of the teacher training project, in particular of the video-based work? (ii) Is there a development of the teachers’ situation-specific professional knowl-edge about instructional quality in classroom situations? Are such changes consistent with the results concerning the teachers’ reported implementation in the classroom?
METHODS AND SAMPLE The evaluation of the teacher training project concentrated on two levels of observa-tion: In the first place, judgements of the participating teachers and their perceptions of their own instructional practice were included. We used an instrument developed in the group of Eckhard Klieme (DIPF, Frankfurt a. M., Germany). Secondly, the evaluation focused on the development of situation-specific and more general com-ponents of professional knowledge (cf. Kuntze & Reiss, 2005).
Figure 1: Structure of the in-service teacher training project and evaluational design In this study, we concentrated on data of 32 German participants who answered pa-per-and-pencil questionnaires both before and after the training project (cf. fig. 1). The video-based instrument on situation-specific professional knowledge concerned introductory lessons on geometrical proof. In this questionnaire, the teachers were
feedback
experiences in phase of implementation, cooperation
beliefs about learning environment
prof. knowledge (gen. comp.), reported instructional practice
prof. knowledge (sit.-specific comp.)
instr. quality (video-based)
feedback feedback
second teacher training weekend
third teacher training weekend
first phase of implementation
second phase of implementation
instr. quality (video-based)
prof. knowledge (gen. comp.), reported instructional practice
experiences in phase of implementation, cooperation
beliefs about learning environment
first teacher training weekend
Kuntze & Reiss
4 - 4 PME30 — 2006
asked to give judgements on two classroom situations: Video A showed patterns of interaction marked by argumentational exchange and cognitively activating discourse between the students and the teacher, whereas video B could be characterized as a teacher-centered interaction comparable to the dominant teaching script in Germany. According to our research questions, we will report results from questionnaires con-cerning reported instructional practice and experiences in the phases of implementa-tion. For situation-specific professional knowledge, we will analyse additional data gained with the video-based instrument for judgements on instructional quality.
RESULTS The scales of the questionnaire on instructional practice shown in table 1 were con-firmed by a factor analysis. Table 1 also contains sample items for the scales. Scale Sample item
“In my maths lessons…”
Number of items
Cronbach’s before / after the training project
teacher-centered inter-action (German script)
“... I am talking, asking questions and some students give answers.” 2 .50 / .74
presentation by teacher “... I am presenting, while the students are listening.” 2 .76 / .63
Student-centered work on activating tasks
“... I have the students finding out on their own about solutions to challenging problems.”
4 .69 / .71
Open organisation of classroom work
“... the students are working on different projects.” 3 .43 / .72
Students presenting their learning results
“... I have the students presenting things they have worked out be-fore in groups or individually.”
2 .63 / .83
Table 1: Scales on self-reported instructional practice. Scale Sample item
Number of items
Cronbach’s Phase 1 / 2
focused observation “I have observed the cognitive activa-tion of my maths instruction with more attention than before.”
3 .89 / .84
experimenting / cognitive activation
“I have remarked changes in my mathematics instruction, that I attrib-ute to my experimenting in the class-room.”
5 .83 / .88
using opportunities for learning from mistakes and fostering argu- mentational exchange
“I have observed that the intensity of argumentation in the classroom interaction was increased by the measures I took.”
4 .73 / .78
Table 2: Scales concerning experiences in the phases of implementation.
Kuntze & Reiss
PME30 — 2006 4 - 5
For the questionnaire on experiences in the phases of implementation, reliability data and sample items for the scales related to the implementation of the video-based teacher training are given in table 2. The means for the scales concerning instructional practice reported by the teachers are shown in figure 2. The values before the training project indicate that the German teaching script revealed in the TIMS-Study seems to be dominant in the reported instructional practice as well. In comparison with the data collected after the training project, there is a significant change for the scale “student-centered work on acti-vating tasks” (T=-3.25; df=31; p<0.01; d=0.45). As an example for changes on the item level, the participants reported to use group work of their students more often than before the training project (T=-2.88; df=31; p<0.01; d=0.49).
Figure 2: Reported instructional practice The indicators for implementation linked to the video-based work of the teacher training presented in table 2 can provide further evidence (cf. fig. 3). The participating teachers were asked to what extent they observed their own practice and whether their focused experiments in the classroom improved the instructional quality in their classrooms. For two of the three scales, there was a highly significant change indicating improved implementation activities of the participating teachers in the second phase of implementation. However, the means reflect rather moderate judgements in general.
using opportunities forlearning from mistakes andfostering argumentational
exchange
1. phase of implementation 2. phase of implementation** **
positive answer
negative answer
1
2
3
4
5
teacher-centeredinteraction
(German script)
presentation byteacher
student-centeredwork on activating
tasks
open organisationof classroom work
studentspresenting learning
results
before the training project after the training project(almost) in
every lessonseveral times
per weekonce
per weekonce or twice
per monthless than once
per month
**
Kuntze & Reiss
4 - 6 PME30 — 2006
As the scale “student-centered work on activating tasks” (cf. table 1 and fig. 2) seemed very relevant for the aims of the teacher training project, we focused on developments in that domain. We verified whether the indicators for implementation linked to the video-based work presented in figure 3 were linked to the findings in figure 2: There were significant correlations between the pre-/post-difference of “student-centered work on activating tasks” and “fostering argumentation/ learning from mistakes” (both questionnaires; .40* resp. .36*) as well as “experimenting/ cognitive activation” (second questionnaire; .38*). This means that teachers, who said to have implemented the contents of the video-based work in their classrooms more intensively, also tended to perceive a higher increase in student-centered work on activating tasks in their classrooms. For the development of situation-specific professional knowledge concerning instructional quality, we had observed rather diverging judgements on instructional quality of the videotaped classroom situations before the beginning of the in-service teacher training (cf. Kuntze & Reiss, 2005). As we liked to observe especially the development of professional knowledge of teachers holding more “traditional” beliefs with respect to the dominant German teaching script, we distinguished between “traditionally oriented” teachers and “teachers favouring discourse” using a cluster analysis (fig. 4). On the base of judgements on instructional quality before and after the project, a certain convergence of the judgements of the two clusters can be stated. Additionally, especially the cluster of the rather “traditionally oriented” teachers rated video A more positively after the project. According to our approach, this videotaped classroom situation was marked by a relatively strong argumentational exchange. Consequently, the participants’ perceptions and opinions related to video A were very important for us as indicators for the impacts of the video-based discussions in the teacher training project. For instance, when asked to compare the videotaped classroom situations to their own instructional practice, the two clusters show the developments represented in figure 5.
Figure 4: Situation-specific components of professional knowledge: Judgements on
instructional quality of videotaped classroom situations
1
2
3
4
5
6
7
Cogn.activa-tion
video A
Intensityof
argum. video A
L. frommis-
takes video A
Cogn.activa-tion
video B
Intensityof
argum. video B
L. frommis-
takes video B
Cogn.activa-tion
video A
Intensityof
argum. video A
L. frommis-
takes video A
Cogn.activa-tion
video B
Intensityof
argum. video B
L. frommis-
takes video B
Pretest - Judgements on instructional quality Posttest - Judgements on instructional quality
Figure 5: Reported similarity of own instruction compared to the videotaped
classroom situations After the training project, the participants report their own instructional practice to be closer to video A than before the project. Taking a look at possible interdependencies between the comparison of video A to the teachers’ own instructional practice and indicators for implementation, there are significant correlations: The pre-/post-difference of “student-centered work on activating tasks” correlates with the per-ceived similarity of the own instructional practice to the content and task structure of video A (.40*). Moreover, three of the six variables in figure 3 show significant cor-relations to the perceived similarity of the own instructional practice to video A (cor-relations ranging from .39* to .48*).
INTERPRETATION OF THE RESULTS AND IMPLICATIONS FOR THE THEORETICAL AND PRACTICAL CONTEXT Comparing the results of the teachers’ reported instructional practice to the results of the TIMSS Video Study, the values before the training project give a plausible out-line of what might happen in the participants’ classrooms. After the training project, especially the domain “student-centered work on activating tasks”, which was very relevant for the aims of the project, appears to have been fostered. Taking a closer look, there are interdependencies with other indicators for implementation and devel-opments of situation-specific professional knowledge that reveal to the video-based work in the project. Also, the higher perceived similarity of the participants’ own in-teractional patterns to the situation in video A might be interpreted as further evi-dence for changes in the participating teachers’ classrooms. However, the results should be interpreted carefully. The data do not allow causal implications like: “Developments in professional knowledge have caused changes in the reported instructional practice“. The correlations found in the study might just reflect simultaneous developments of the enrolled teachers in the different domains. The changes in situation-specific professional knowledge and reported instructional practice were generally rather moderate. The findings might indicate that the partici-pating teachers acquired additional alternative possibilities of conceiving mathemat-
ics instruction and acting in the classroom. Hence, two of the impacts of the teacher training project might have been enriched patterns of perception for instructional situations and diversified possibilities of acting in the classroom. References Baumert, J., Lehmann, R., Lehrke, M., Schmitz, B., Clausen, M., Hosenfeld, I., Köller, O.,
& Neubrand, J. (1997). TIMSS – mathematisch-naturwissenschaftlicher Unterricht im in-ternationalen Vergleich. Deskriptive Befunde. Opladen: Leske + Budrich.
Clausen, M., Reusser, K., & Klieme, E. (2003). Unterrichtsqualität auf der Basis hoch-inferenter Unterrichtsbeurteilungen. [Using high-inference ratings to assess quality of in-struction]. Unterrichtswissenschaft, 31 (2), 122-141.
Escudero, I. & Sanchez, V. (1999). The relationship between professional knowledge and teaching practice: the case of similarity. In O. Zaslavsky (Ed.), Proc. 23th Conf. of the int. Group for the Psychology of Math. Education (Vol. 2, pp. 305-312). Haifa: PME.
Heinze, A. (2005). Mistake-handling activities in the mathematics classroom. In H. L. Chick & J. L. Vincent (Eds.), Proceedings of the 29th Conference of the International Group for the Psychology of Mathematics Education (PME), Vol. 3 (pp. 105-112). Mel-bourne: University.
Kirkpatrick, D. (1979). Techniques for evaluating training programs. Training and Devel-opment Journal, 33 (6), 78-92.
Kuntze, S. & Reiss, K. (2004). Unterschiede zwischen Klassen hinsichtlich inh. Elemente und Anforderungsniveaus im Unterrichtsgespräch beim Erarbeiten von Beweisen – Er-gebnisse einer Videoanalyse. [Differences in Argumentation and Proof in German Class-rooms - Results of a Video-Based Study]. Unterrichtswissenschaft, 32 (4), 357-379.
Kuntze, S. & Reiss, K. (2005). Situation-specific and generalized components of profes-sional knowledge of mathematics teachers. In H. L. Chick & J. L. Vincent (Eds.), Pro-ceedings of the 29th Conference of the International Group for the Psychology of Mathematics Education (PME), Vol. 3 (pp. 225-232). Melbourne: University.
Lipowsky, F. (2004). Was macht Fortbildungen für Lehrkräfte erfolgreich? Befunde der Forschung und mögliche Konsequenzen für die Praxis. [What makes in-service teacher training programs successful? Research findings and possible consequences for practice]. Die Dt. Schule, 96(4), 1-20.
Leinhardt, G. & Greeno, J. (1986). The cognitive skill of teaching. Journal of Educational Psychology, 78, 75-95.
Malara, N. (2003). Dialectics between theory and practice: Theoretical issues and aspects of practice from an early algebra project. In N. Pateman et al. (Eds.), Proc. 27th Conf. of the int. Group for the Psychology of Math. Education (pp. 33-48). Honolulu: PME.
Reiss, K., Klieme, E., & Heinze, A. (2001). Prerequisites for the understanding of proofs in the geometry classroom. In M. van den Heuvel-Panhuizen (Ed.), Proc. 25th Conf. of the int. Group for the Psychology of Math. Education (Vol. 4, pp. 97-104). Utrecht: PME.
Shulman, L. (1987). Knowledge and Teaching: foundations of the new reform. Harvard Educational Review, 57 (1), 1-22.
2006. In Novotná, J., Moraová, H., Krátká, M. & Stehlíková, N. (Eds.). Proceedings 30th Conference of the International Group for the Psychology of Mathematics Education, Vol. 4, pp. 9-16. Prague: PME. 4 - 9
CONSTRUCTING A SINUSOIDAL PERIODIC COVARIATION Chronis Kynigos, Kostas Gavrilis
Educational Technology Lab, University of Athens, Sch. of Philosophy. We investigated meanings generated by 32 14-15 year olds on the concept of sinusoidal periodical change. They experimented with a microworld which we designed combining figural, coordinate and symbolic representations of covariation and a corresponding sequence of activities. Their experimentations led to the forming of situated abstractions on periodicity properties involving the nature of periodic curve, periodic cycle and periodic behaviour of the values of x in the respective function.
FRAMEWORK A central element in the growth of the concept of covariation is the construction of a coordination between the changes of two quantities. According to Thompson (1994) the understanding of covariation is a developmental process that includes (1) the construction of a mental image of the change of one quantity (2) the coordination of the mental images of the changes of two quantities and (3) the construction of a mental image of simultaneous covariational changes of two quantities. Little research has been done on students’ understanding of periodical change. It has been showing that the difficulties in learning are related to a) the lack of a deeper comprehension of the mathematical notion of periodicity, (Dreyfus & Eisenberg, 1980, Bagni, 1997, Shama, 1998), b) the lack of connection to natural phenomena (Buendia & Cordero, 2005), or c) the lack of experiences related to the concept of covariation (Mariotti et al., 2003). Lobo da Costa, & Magina, (1998) propose the combination of experimental worlds with computer environments as the optimal frame of learning trigonometrical change and hence periodical change. In this paper we report research aiming to explore how 32 15 year-old students constructed meanings around the concept of sinusoidal periodic covariation with a microworld we designed with ‘Turtleworlds’, a piece of geometrical construction software which combines symbolic notation through a programming language with dynamic manipulation of variable procedure values (Kynigos C., 2002). Our perspective on learning combines the idea of constructionist learning (Kafai and Resnick, 1996) together with the use of computational media perceived as one of the representational registers for mediating mathematical thinking along with language and pencil and paper (Mariotti, 2000). The students worked in 14 small collaborative groups during a computer-based project established in their school. They were engaged in this project in order to explore the microworld’s figural model constructed by two variables, by manipulating the values of these variables and by constructing a relationship between these. Their ultimate goal was to fix the behaviour of the microworld which was designed to be buggy. We studied the mathematical meanings mediated and developed by the students as they interacted with the microworld in
Kynigos & Gavrilis
4 - 10 PME30 — 2006
order to investigate the existence and the nature of a relationship between the two variables and to convert the symbolic notation to reflect their conjectures about it and to fix the bug. We were particularly interested in the ways the students expressed their ideas through these interactions (Noss, 1997).
RESEARCH SETTING AND TASKS Our research was based on students work with the ‘Turtleworlds’ microworld and a set of activities which we designed. ‘TurtleWorlds’ is based on Logo-driven Turtle graphics combined with tools to dynamically manipulate variable values and observe a D.G.S.–like change in the figures as these values change. It can be thus used to encourage the development of the processes of coordination between two variables in multiple ways, as it combines the changes of the geometrical model which are caused from the dynamic manipulation of the value of its variables with the numerical negotiation of these and the mathematical symbolism. We designed a sequence of activities which encouraged the negotiation of changes and the coordination of these with the aim to explore the ways in which the students utilize the computational tools and their experiences to develop and express meanings for periodical coordination (Psycharis & Kynigos, 2004).
The microworld of the ‘clown’: A specially designed procedure with two variables was given to the students. Variable :x corresponds to the angle between the equal sides of an isosceles triangle, variable :y corresponds to the length of the opposite side. The equal sides are a constant 100 turtle steps and the equal angles are expressed in relation to angle :x (the students had recently worked with angle relationships in isosceles triangles). The relationship between :x and :y (:y=200sin(:x/2)) was not revealed to the students. The microworld was designed so that the relationship under investigation would not be obviously sinusoidal to the students. The procedure also had a final command ‘face’ which constructed the features of the clown in relation to the two variables. The code of the ‘face’ procedure was available to the students but was not an object of this study since the students took it as a ‘black box’ primitive. A triangle is thus formed only when the values of :x and :y are appropriate, in all other cases it looks as if the triangle is not closed (fig. 1). The students could execute the procedure with two values and then drag any of the two sliders of ‘Turtleworlds’ variation tool (fig. 1). They could subsequently click on an axis for each variable and use the 2D variation tool to drag the mouse freely on the coordinate plane thus varying :x and :y simultaneously. They could also click on a point on the plane to observe the figure with :x and :y values corresponding to the coordinates of the point. The figure below shows a few points that have been placed on the 2d variation tool so that the ‘clown’ triangle is well shaped and one where the triangle is not well shaped. The students could click on a point and then drag it to a place where the ‘clown’ was well shaped. They could then choose another point and repeat the process and could record the coordinates of the points they chose on a table of values.
Kynigos & Gavrilis
PME30 — 2006 4 - 11
Task: The students were asked (1) to find out and describe all the possible forms which the clown could take and (2) to correct the procedure so that the ‘clown’ was always well shaped. So, the students had to investigate whether there was a pattern of appropriate points and conjecture what kind of relationship between :x and :y reflected the pattern. The students initially worked with the “2D tool” and the “variation tool”. Then they processed the values of the two variables with which a good shape of the "clown" is taken, and finally, they worked with the code of the program in order to correct it.
Fig. 1. The ill-formed ‘clown’ corresponds to the one point on the 2d variation tool outside the sinusoid pattern of points. The ‘clown’ is well formed when the coordinates correspond to any of the points on the pattern. Dragging the outlying point on the pattern has the effect of the clown progressively being ‘fixed’.
METHOD Design research was adopted where the researcher undertook the role of an observing teacher (Cobb et al, 2003). The students worked in small groups (14 totally). Each group participated in 6-7 sessions – per week – for 1.30 hour roughly, while three discussion sessions with all participants took place as well. The work of the students was video-recorded and cassette-recorded. The data were studied in two phases. In the first phase episodes of meaning generation were identified (cases where the students expressed meanings relating to the periodical change) for each group. In the second phase each episode was analyzed in depth. The episodes were grouped in the
Kynigos & Gavrilis
4 - 12 PME30 — 2006
areas of meaning which appear as section headings below. In this paper we report episodes from different student groups which were characteristic of the respective areas of meaning.
FINDINGS
Local covariations: The first meanings related to the covariation of the two variable quantities which were formulated during the dragging and spatial arrangement of the respective points on the 2d variation tool and in particular during the coordination of the changes of the two varying quantities of the shape. In the following episode, the students of group M11 were discussing how to move the outlying point (fig. 2) in order to shape the ‘clown’ well:
M11_1 (2): We should move it horizontally so that the awry segments connect and the ‘clown’ gets shaped.
R: How far can you move it? M11_1 (2) & M11 (3): Until they (the three sides of the
triangle) are linked R: Can you predict its place without moving the point? M11_1 (2): We will move it until it reaches the straight line.
The students predicted the place of point correctly, because they managed to make covariation reasoning (Carlson, et al., 2002), coordinating the way of change of the changing quantities of the geometrical model. This coordination was considerably facilitated from the perception which was created for the form of the curve where the suitable points belong, a situated abstraction according to Noss and Hoyles, 1996, which resulted from the experiments of spatial arrangement of the points.
From the straight line to curvature: The students decided they were not happy with the extent of the movement of the clown with the range of values they had at hand, extended the range and were surprised when placing new points on the extension of the line which they had thought to be the right point pattern resulted in a ‘buggy’ clown. They dragged a point along the linear pattern and realised that while at the beginning their clown was ok, it gradually developed a bug. Then they were encouraged by their teacher (researcher) to insert more points and make new conjectures. They used the ‘2d tool’ to experiment with a larger range for the two variables. This had as a result to extend the range of changes of the angle beyond 360o and to negative values as well.
R: Are there any other movements that the ‘clown’can perform? M1_1 (3): Can we put in the x minus something? Minus 360? M1_1 (2): No. Are there any negative values for the angles?
Fig. 2. The students work with the “2D tool” in which the width and the altitude is defined by the values of :x and :y.
Kynigos & Gavrilis
PME30 — 2006 4 - 13
M2_1 (3): ....
R: See the ‘clown’. It is being shaped by the turtle. What will happen if you make the turtle turn right -30?
M1_1 (1): It will turn left. But I have not tried it.
Extending the range thus led to the students’ altering of their initial perceptions for the curve and to the formulation of the opinion that the points belong to a parabola. In the episode that follows, the students of team M11 were involved in a game of prediction of the place of a new point. While up to that point in time their predictions concerned places in the extension of the supposed straight line, suddenly student 3 selected a new point in a faraway place and not on the extension:
M11_2 (3): I will take a point here.
R: Why did you choose this place? What do you have in your mind?
M11_2(3): I will show with my mouse how the curve is. Here it goes this way, afterwards it goes here to the top point and afterwards it goes this way curved (she shows with the indicator of her mouse a parabola)
The unexpected choice showed that in her mind she formed a non-linear curve of suitable points. This is possibly due to the fact that the divergence of the news points in relation to the initial perception of the straight line helped her to formulate the existence of a curve, which she called parabola, because she had been taught it in the previous school year. The students realised that the new points are extended to both directions of the range of the angle and created two inverse parabolas every 360 degrees. Subsequently they expressed the opinion that these two parabolas constitute one single curve.
Covariation “many for one”: The investigations that followed for the finding of suitable points with the value of variable y given, helped the students to develop the notion of covariation of the two values between the different periods (many x for one y). In the episode that follows the students of team M10 inquire the place the points with y = 80, while they have extended the domain of change of angle x in [-2000, 2000]. One of the students places the slider of variation tool of variable y in the value 80, and moves only the slider of variation tool of variable x and he counts the points defined by the horizontal straight line in the curve of the points:
M 10 _ 8(2): one, two, three… six.
R: And what about the other side?
M 10 _ 8(2): Six
R: And if we extend the domain of x even more? If we go up to 20000?
M 10 _ 8(2): To 20000? Many.
Kynigos & Gavrilis
4 - 14 PME30 — 2006
The finding of many x for every y, and the negotiation that followed for the value and place of variable x, gave the students the chance to discover rules of covariation that concerned the whole of the range of curve: (1) The rule of 720 (‘if in the x we add or subtract 720 and maintain the same y we will find a new point in the curve’). (2) The rule of 360 (‘if in the x we add or subtract 360 and select the opposite y we will find a new point in the curve’). (3) The rule of symmetrical points (‘if we select the opposite of x and the opposite of y we will find a new point in the curve’).
M1_1(3): The new point has the same height (with the given point) when the turtle moves two more cycles.
These rules were confirmed by the students with the variation tool, defining as a step of change of variable x the 720 or the 360 and observing the form of the ‘clown’ in each change. The finding of rules of covariation changed once more the perception of the students about the forming of the curve as they managed to describe its extension with the help of them using the points that correspond to the points of a period. Formal expression of the relationship: Discussion on a possible relationship between x and y brought the students to look for one by going back to the figure and making sketches in their writing books. They had been taught about basic properties of isosceles, Pythagoras theorem and the trigonometric ratios in a right triangle, so their conjectures were about which properties would be useful here.
M3_6(1): For the clown to work we need to find the relationship between x and y (they refer to a pencil and paper sketch of a triangle which they had figured out was isosceles and had discussed the height being also the dichotomy and the median).
M3_6(2): Let’s find it via the Pythagoras theorem. M3_6(1): No, with the sin. Sin x/2 is equal to the opposite perpendicular divided by the
hypotenuse. (She wrote in her writing book sin(x/2)=y/2/100 or y=200sin(x/2).
M3_6(2): Is this relationship good for us? M3_6(1): Let’s substitute it in the code. (After they place it in the code and run the program with one variable). There (as they
move the slider) it never spoils. M3_6(2): Now it will not get on our nerves. So, sin(x/2)=y/200.
This characteristic dialog shows how the students had dissociated from the figural and coordinate representations of the screen looking for a generalized rule. They used the microworld to express the relationship formally and appreciated the new behavior
The students found out that the intersection points follow the three rules.
Kynigos & Gavrilis
PME30 — 2006 4 - 15
of the clown figure while dragging the slider. In this process, experimentation with covariation and periodicity led to the conjecture of some properties of the sinusoidal function and subsequently to a search for a generalized relationship. This relationship was then expressed formally in order to fix the ‘bug’ in the clown tool. This involved the expression of one of the variables of the procedure in relation to the other, the relation being a sinusoidal function. In this sense, formal expression of mathematical ideas was just part of a representational repertoire which the students put to use in their experiments.
CONCLUSION The episodes reported above showed that in the environment of the ‘clown’, the students used the computational tools in order to develop new practices of experimentation and to generate meanings for periodical covariation (Lobo daCosta & Magina, 1998). They were involved in a developmental process of constructing meanings for the periodical change which were expressed in the environment as situated abstractions (e.g. the form of the curves) or as tools of control of the environment (variation tool with step 720 or 360). One other abstraction of this kind was that the students initially perceived of the shaped curve as a simple welding of individual parabolas. These were situated in the sense of Noss and Hoyles (1996), since they emerged directly from the experience at hand and were dependent and bound to that experience. From the moment however when their first abstractions were refuted, as in the case of the linear relationship, the students seemed prepared for further refutations and their attachment to the tools and the experiment at hand seemed weaker. They seemed more ready to dissociate for the concrete tools and think about the relationships in the abstract. A first example was meanings involving the division of the range of the one variable in equal intervals (period) and the notion of continuous extension of the range in both directions with the application of rules of covariation having the form “many in one”. Finally, the experimentations with the figural and the dynamic coordinate variation representations led the students to conjecture on a generalised relationship between the two variables and by expressing it formally to change the code to fix the procedure of the animated clown. The research suggests that this kind of constructionist experimental activity with the use of carefully designed representational registers for covariation may provide students with the means to mediate (in the sense of Mariotti, 2000) mathematical ideas leading to the deeper understanding of periodicity which they seem to lack (Dreyfus and Eisenberg, 1980). Their experiences related to covariation and periodicity were crucial in that process. The study therefore agrees with Lobo daCosta and Magina’s proposal for experimentation with periodical change.
References Bagni, G.T. (1997). Trigonometric functions: learning and didactical contract, D’Amore, B.
& Gagatsis, A. (Eds.), Didactics of Mathematics-Technology in Education, Erasmus ICP-96-G-2011/11, Thessaloniki, 3-10.
Kynigos & Gavrilis
4 - 16 PME30 — 2006
Buendia G. & Cordero F. (2005). Prediction and the periodical aspect as generators of knowledge in a social practice framework. Educational Studies in Mathematics 58: 299–333.
Carlson, M., Jacobs, S., Coe, E., Larsen, S., & Hsu, E. (2002). Applying covariational reasoning while modelling dynamic events: A framework and a study. Journal for Research in Mathematics Education, 33(5), 352-378.
Cobb, P., Confrey, J., diSessa, A., Lehrer, R., Schauble, L. (2003). Design Experiments in Educational research. In Educational Researcher 32(1), 9-13.
Dreyfus T. and Eisenberg T. (1980). On teaching periodicity INT. J. MATH. EDUC. SCI. TECHNOL.., 1980, VOL. 11, NO. 4, 507-509.
Kafai, Y. & Resnick, M. (Eds) (1996). Constructionism in practice. Designing, thinking and learning in a digital world (NJ, Lawrence Earlbaum).
Kynigos, C. (2002). Generating Cultures for Mathematical Microworlds Development in a Multi-Organizational Context Educational Computing Research, Baywood Publishing Company, Inc. 2, vol 27 (1&2) (185-211).
Lobo da Costa, N., Magina, S. (1998). "Making Sense Of Sine And Cosine Functions Through Alternative Approaches: Computer And ‘Experimental World’ Contexts". PME 22, vol. 2, pp. 224-231. Africa do Sul, 1998.
Mariotti M.A, Laborde C., Falcade R. (2003). Function and Graph in a DGS environment, Proceedings of the 2003 Joint Meeting of PME and PMENA, vol. 3, 237 - 244.
Mariotti, M. A. (2000). Introduction to proof: The mediation of a dynamic software environment, Educational Studies in Mathematics 44: 25-53.
Noss R., (1997). “Meaning Mathematically with Computers”, in Nunes T. and Bryant P. (eds), Learning and Teaching Mathematics, An International Perspectives. Psychology Press Ltd.
Noss, R. & Hoyles, C. (1996). Windows on Mathematical Meanings, Kluwer. Psycharis, G., Kynigos, C (2004). Normalising geometrical constructions: A context for
generation of meaning for ratio and proportion. In Proceeding of the 28h PME Conference, Bergen, Norway. Vol. 4, 65-72.
Shama G., (1998). “Understanding Periodicity As A Process With A Gestalt Structure”, Educational Studies in Mathematics 35: 255–281.
Thompson, P. W. (1994). Students, functions, and the undergraduate curriculum. In E. Dubinsky, A. H. Schoenfeld, & J. J. Kaput (Eds.), Research in Collegiate Mathematics Education, I: Issues in Mathematics Education, (Vol. 4, pp. 21-44). Providence, RI: A. M. S.
2006. In Novotná, J., Moraová, H., Krátká, M. & Stehlíková, N. (Eds.). Proceedings 30th Conference of the International Group for the Psychology of Mathematics Education, Vol. 4, pp. 17-24. Prague: PME. 4 - 17
MODELLING FRACTIONS WITH AREA: THE SALIENCE OF VERTICAL PARTITIONING
Andreas O. Kyriakides The Open University, United Kingdom
Dedication: In grateful memory of my sister Georgia Kyriakidou.
A four-month constructivist teaching experiment with a class of 22 fifth graders was carried out in order to explore and study how children could use rectangular area models to represent fractions. The teacher’s narratives along with students’ written work and transcripts of audio-taped class discussions constitute the primary data source for analysis. This study provides strong evidence that vertical partitioning occupies a salient position in children’s perception of proper fractions. It also describes children’s attempts to articulate their inner experience as they move from conception to formal concept.
INTRODUCTION Gusev and Safuanov (2003) challenge pedagogical psychologists’ traditional premise that child’s thinking develops sequentially from initial visual experiences to conceptual forms. Their main argument against pedagogical psychology is that thinking in images has an independent role in the intellectual development of pupils and is not replaced but be transformed into the superior forms of conceptual thinking. The latter opposition is not surprising. ‘Psychology is plagued by seeking morphisms between the material world and the inner world of experience’ (Mason, 1987a, p. 213). This generates a series of questions about the existence of mental images or the reliability of mathematics representations whereas little attention is given to how students can be helped to appreciate the power and role of mathematics images (Mason, 1987a). The important implication here is to draw our attention not so much “on the images” (either mental or concrete) but “through the images”. Paraphrasing Mason (1987b), I argue that mathematics images ‘are not mere marks on paper but indicate or speak to entities that are almost palpable, almost substantial’ (p. 74). In a topic such as fractions where ‘there is no scarcity of documentation of the complexity of fraction ideas and the difficulties children have in building a meaningful understanding of them’ (Maher, Martino, & Davis, 1994, p. 209), training students to discern the characteristics of their own images of fractions and encouraging them to speak directly from them sounds more promising than dragging them directly into formal rules or, even worse, into our own way of interpretation. The current paper describes how a class of fifth graders use the area model as a tool for representing proper fractions. Particular attention is drawn to students’ inclination towards vertical or horizontal partitioning.
Kyriakides
4 - 18 PME30 — 2006
THEORETICAL BACKGROUND Mental models such as the area model, the number line or the circle are important tools for mathematical problem solving and insight (Keijzer & Terwel, 2003). Such models can accompany a symbolic development, since, by virtue of their concreteness, they can function as essential components ‘for creating the feeling of self-evidence and immediacy’ (Fischbein, 1987, p. 101). However, Perkins and Unger (1999) point out that the possession of a model is not sufficient. The model needs to “come to mind in the moment” when it is appropriate. Against this background and given research reports documenting a considerable gap between practical experiences and formal calculations with fractions (Ma, 1999; Thompson & Saldanha, 2003), the question arises as to which models are most suitable for the representation of fractions? The value of the rectangular area model as a tool for scaffolding the meaning of fractions lies in the multidimensional role area plays in human life. The concept of area ‘is not only a mathematical one, which is taught in schools but one which carries different cultural dimensions’ (Kordaki & Potari, 1998, p. 314). Area has been used since ancient Babylonian times; it is part of our culture both in science and technology but also in everyday life (Hirstein, Lamb, & Osborn, 1978). By the dialectic relation it establishes between space and numbers, area plays a key role in the comprehension of these two worlds (Skemp, 1986; Douady & Perrin, 1986). Among other spatial measures such as length and volume, the measure of area plays ‘a privileged role in the building of multiplicative structures. This from two points of view: numbers operate on areas and areas appear as products of lengths’ (Douady & Perrin, 1986, p. 253). Due to its close link with the number concept, area is also ‘used as an embodiment to introduce other mathematical concepts’ (Kordaki & Potari, 1998, p. 303). The potential learning outcomes from using area models in teaching mathematics are readily apparent, especially for a topic like fractions, which ‘are often considered the most complex numbers in elementary school mathematics’ (Ma, 1999, p. 55). I therefore adopt the suggestion of Kordaki and Potari (1998) that ‘there is a need to concentrate on the concept of area to make mathematics alive and relevant’ (p. 313).
METHOD To investigate how primary school children could use the area model when asked to represent a proper fraction I followed an approach that extends the ‘constructivist teaching experiment’ (Cobb & Steffe, 1983) to the complexity of a public school classroom. In this methodology, which is similar to the one described by Cobb, Wood and Yackel (1990), teachers also act as researchers by trying to interpret children’s actions while constructing mathematical knowledge. An important parameter of the constructivist view is that teachers ‘should continually make a conscious attempt to ‘see’ both their own and the children’s actions from the children’s points of view’ (Cobb & Steffe, 1983, p. 85). Children’s mathematical knowledge, on the other hand, is personal and depends on the ways that children interpret their experiences,
Kyriakides
PME30 — 2006 4 - 19
however influenced by the social environment. Through communication with their teachers and classmates children articulate their reasoning, exchange views and develop mathematical meanings. The constructivist teaching experiment is perfectly compatible with my research objective because in line with Cobb and Steffe (1983), I believe that the activity of exploring children’s construction of mathematical knowledge must involve teaching. As Cobb and Steffe (1983) explain, researchers who do not engage in intensive and extensive teaching of children run the risk that their theoretical interpretations of children’s constructive activities will be distorted to reflect their own mathematical knowledge. To this end, a classroom teaching experiment was implemented in a primary school in Cyprus. The duration of the experiment spanned September to December of 2005. The participants were a group of 22 fifth graders (10 boys and 12 girls) taught by the author. Because I had to address all the objectives of fifth grade mathematics set by the Cyprus national curriculum, I decided to focus only once a week on activities that would employ the use of area models in the teaching of fractions. Throughout the four months of the experiment, I was in close contact with and supported by colleagues in the UK in planning the weekly tasks, reflecting on the students’ constructive activities, and discussing further instructional steps. Every week I reported my experience in a journal. The teacher’s narratives along with students’ written work and transcripts of audio-taped class discussions constitute the data for analysis.
RESULTS As initially stated this paper focuses on how 11-year-olds partition an area model when asked to represent a fraction. Teaching episodes quoted here are drawn from the teacher’s journal in order to shed light on a hidden tendency towards a specific type of partitioning. Teaching Episode 1: The first evidence for some sort of preference [13-10-2005]
In the short discussion we had this morning I noticed that my students appeared more fluent in finding a fractional part of a whole when the rectangle they drew could be divided in parts vertically rather than horizontally. For instance, when I drew on the board an area model of 20 (5 columns x 4 rows) and asked them to find 3/5 I’ve noticed many kids raising their hands spontaneously. When, however, I drew the same rectangle but reversed 90 degrees clockwise (4 columns x 5 rows) and asked them the same question, the majority of my students seemed stuck. I repeated the same story a couple of times and I noticed the same sort of reactions from my audience.
Teaching Episode 2: Natural inclination versus social conflict [18-10-2005] The teacher that day provided a worksheet using area models for numbers 21 (7 columns x 3 rows), 48 (8 columns x 6 rows), 12 (3 columns x 4 rows), 20 (5 columns x 4 rows), 28 (4 columns x 7 rows) and 18 (6 columns x 3 rows). Children were asked to represent 1/3 of 21, 2/6 of 48, 1/3 of 12, 2/4 of 20, ¾ of 28 and 5/6 of 18 by
Kyriakides
4 - 20 PME30 — 2006
shading the appropriate part of the respective area. The area models of numbers 21, 48 and 20 required horizontal partitioning whereas the rest, required vertical partitioning.
…A quick walk around my students’ tables was enough to stress me out; the majority of my 11-year-old pupils as soon as they got their papers started dividing the given rectangles vertically even though the tasks did not all imply so. Instead of saying directly to them that what many of them did was wrong I asked for their attention and invited them to tell me what ¼ of a whole means. Some kids raised their hands and they all seemed to agree that one fourth means one out of four equal parts. Then I drew a rectangle with an area of 36 [4 columns x 9 rows], and asked them to show me one fourth of it. Unsurprisingly, the majority of my audience seemed to agree that one fourth of the given rectangle could be represented with the first column shaded. Soon after, I drew the same rectangle but reversed 90 degrees clockwise and asked them again to indicate one fourth of it. The hands raised up were much less than the previous time so I preferred to shade myself the first column and invite them to tell whether what I shaded was ¼ of the rectangle. After this reflection, an interesting discussion was initiated among my students. Some of them said “yes” and some of them “no”, so I encouraged them to try to persuade each other about the correctness of their answer. The “no” group seemed to me much more confident than the “yes” group and this is probably why they decided to speak first. After a few representatives of the “no” group explained that what I illustrated on the board was not a division of the rectangle into 4 equal parts but a division, instead, into 9 equal parts, the other group of students started whispering between themselves. Some comments I heard were: “Oh, you are right, I was counting the boxes instead of the columns” or “I saw number 4 and I thought…”.
After the brief intervention 11 of the 22 fifth graders at least once altered their way of partitioning the area model. All the children who erased their initial drawing, shifted successfully from vertical to horizontal partitioning. Ina, for instance, an 11-year-old girl, when embarked upon the area model of 21 (7 columns x 3 rows), she immediately shaded the first column to represent 1/3. After the class discussion, she erased it and shaded, instead, the top row (see Figure 1). She wrote on her worksheet: “I first shaded 1 vertical line but after we discussed it I understood it and I shaded one row because it is 1/3 whereas the vertical one I did earlier was 1/7”.
Figure 1: Ina’s representation of 1/3 of 21 Teaching Episode 3: Natural inclination versus social conflict [31-10-2005]
This morning I decided to give my fifth graders a couple of more story problems and invite them to come on the board and draw the appropriate area model. The very first scenario I posed was the following: “Georgia has 16 roses. She gave 4/8 of them to her mother. How many does she have?” One of my fifth graders (Larkos: all names are pseudonyms) volunteered to come on the board and draw an area model representation of it. Soon after he finished his drawing (see Figure 2), many kids started raising their hands expressing an apparent disagreement. Larkos seemed somehow bewildered; he pointed to
Kyriakides
PME30 — 2006 4 - 21
the shaded part and said: “this is 4 out of 8”. His comment, however, did not sound very convincing to his classmates who continued to raise their hands even more energetically. Larkos, then, drew a second area model (see Figure 3). Meanwhile, neither did I say anything nor did I allow to the class to interrupt his thinking.
8 8
2 2
Figure 2: Larkos’ initial representation Figure 3: Larkos’ second representation As soon as he finished his second drawing, Syria shouted aloud from her chair: “What are you doing there? You should have divided it into 2 rows, not 4 and then take 4 out of the 8 columns”. Syria’s comment came up so spontaneously that Larkos seemed really puzzled. I decided to let this chat evolve without interrupting any of the two kids. Larkos then said: “Oh, you are right” and turned to me, saying: “It’s because I’m writing on the board… that’s why I was confused”.
Teaching Episodes 4 & 5: Consistent preference to vertical partitioning [16 & 23 – 11- 2005] On the 16th of November the teacher provided a worksheet using three identical area models for 100 (10 columns x 10 rows) and asked students to represent ½, 3/5 and 4/10, respectively. A week later - on the 23rd of November - the teacher wrote in his journal:
I was curious to see if there is any difference when I ask my students to shade a part of a given area model and when I ask them to draw the area to represent a part of it for themselves. Therefore, I changed the order of the tasks I submitted last week (16th of Nov.) and I omitted the rectangular regions - wholes, which they had to shade.
Table 1 summarizes how the examined 11-year-olds represented ½, 3/5 and 4/10 of 100 in the presence (16th of Nov.) and in the absence (23rd of Nov.) of an area model. Number of fifth graders Representing ½ Representing 3/5 Representing 4/10
consistent in vertical partitioning
11
12 13
consistent in horizontal partitioning
7 4 6
inconsistent in vertical or horizontal partitioning
4 6 3
Table 1: Children’s consistency in vertical and horizontal partitioning
Kyriakides
4 - 22 PME30 — 2006
CONCLUSIONS This study has demonstrated the complexity of construing a fraction as part of a whole. ‘Construing, or making sense, or getting-a-sense-of some idea takes place in the midst of manipulating and expressing’ (Mason, 1987a, p. 210). By manipulating, Mason (1987a) means physically moving objects, or drawing diagrams, or metaphorically manipulating symbols. Expressing, on the other hand, refers to the attempt to articulate ‘some inner experience that is quite possibly fuzzy, vague, or ill defined’ (p. 210). In the current study children not only manipulated rectangular area models but also tried hard to put into words their internal struggles to represent the meaning of the fraction concept. Larkos’ attempts in Teaching Episode 3 to develop an area model that would satisfy both himself and his audience (classmates and teacher) mirror perfectly Mason’s and Pimm’s (1984) acknowledgment that there are big gaps between “seeing” something, being able to “say” something, and being able to “record” that saying on paper. In order to be of maximal assistance, teachers and researchers need to understand how children use representations to make sense of mathematical ideas. This study provides strong evidence that vertical partitioning occupies a salient position in children’s perception of rectangular area models for proper fractions. Despite the teacher’s intentional and, thus, sometimes hard efforts to maintain a neutral stance towards all types of partitioning, and the textbook’s equal emphasis on both vertical and horizontal partitioning, the majority of the examined 11-year-olds exhibited a consistent preference (see Table 1) towards vertical division of rectangular area models. This finding, though rarely documented in the literature appears to be in line with research findings of the 80s concerning vertical symmetry. Bornstein, Ferdinandsen, and Gross (1981), for instance, found that 4-month-old infants processed vertically symmetrical patterns faster and more sufficiently than otherwise equivalent horizontally symmetrical or asymmetrical patterns. In an analogous study, Fisher, Ferdinandsen and Bornstein (1981) examined infants’ discrimination among vertically symmetrical, horizontally symmetrical, and asymmetrical patterns. They found that infants, as young as four months, could differentiate vertical symmetry from asymmetry and vertical symmetry from horizontal symmetry but that infants failed to distinguish horizontal symmetry from asymmetry. The latter studies both suggest infants’ perceptual advantage for vertical symmetry. To the knowledgeable other (the teacher or the researcher) vertical and horizontal partitioning of area models presented by different children may appear similar and may seem helpful to learners. Children, however, view and use them in different ways; they may even find alternative types of partitioning confusing. In Teaching Episode 2, for instance, though the two initially opposed groups of children seem to agree eventually on a mutually accepted representation, it is not clear whether this is an outcome of convincing argumentation or a matter of compromise to an implicit social contract. As Lampert (2001) notes, ‘the classroom is the microcosm of the larger social world’ (p. 447) where ‘in extreme cases, a teacher’s attempts to initiate reflective shifts in discourse can degenerate into a social guessing game in which
Kyriakides
PME30 — 2006 4 - 23
students try to infer what the teacher wants them to say’ (Lampert & Cobb, 2003, p. 241). Kaput (1987) argued that by looking at ‘what the characteristics are of particular representations’ mathematics educators could determine why those representations are ‘effective in some cases and ineffective in others’ (p. 101), and this study suggests an example. But the most important outcome of this experience is that focusing on children’s inner learning struggles enabled me to notice new aspects of my classroom and subsequently begin to modify my own behaviour. References Bornstein, M. H., Ferdinandsen, K., & Gross, C. (1981). Perception of symmetry in infancy.
Developmental Psychology, 17, 82-86. Cobb, P., & Steffe, L. P. (1983). The constructivist researcher as teacher and model builder.
Journal for Research in Mathematics Education, 14(2), 83-94. Cobb, P., Wood, T., & Yackel, E. (1990). Classrooms as learning environments for teachers
and researchers. In R. B. Davis, C. A. Maher & N. Noddings (Eds.), Journal for Research in Mathematics Education: Constructivist views on the teaching and learning of mathematics (Vol. 4, pp. 125-146). Reston, VA: NCTM.
Douady, R., & Perrin, M.-J. (1986). Concerning conceptions of area (pupils aged 9 to 11). In L. Burton & C. Hoyles (Eds.), Proc. 10th Conf. of the Int. Group for the Psychology of Mathematics Education (pp. 253-258). London, England: PME.
Fischbein, E. (1987). Intuition in science and mathematics: An educational approach. Reidel, Dordecht: The Netherlands.
Fisher, C. B., Ferdinandsen, K., & Bornstein, M. H. (1981). The role of symmetry in infant form discrimination. Child Development, 52(2), 457-462.
Gusev, V. A., & Safuanov, I. S. (2003). Thinking in images and its role in learning mathematics. In N. A. Pateman, B. J. Dougherty & J. T. Zilliox (Eds.), Proc. 27th Joint Conf. of the Int. and North American Group for the Psychology of Mathematics Education (Vol. 4, pp. 87-94). Honolulu, USA: PME.
Hirstein, J. J., Lamb, C. E., & Osborn, A. (1978). Student misconceptions about area measure. Arithmetic Teacher, 25(6), 10-16.
Kaput, J. J. (1987). Messy context. In C. Janvier (Ed.), Problems of representation in the teaching and learning of mathematics (pp. 101-102). Hillsdale, NJ: Erlbaum.
Keijzer, R., & Terwel, J. (2003). Learning for mathematical insight: a longitudinal comparative study on modelling. Learning and Instruction, 13, 285-304.
Kordaki, M., & Potari, D. (1998). Children's approaches to area measurement through different contexts. Journal of Mathematical Behavior, 17(3), 303-316.
Lampert, M. (2001). Teaching problems and the problems of teaching. New Haven: Yale University Press.
Lampert, M., & Cobb, P. (2003). Communication and language. In J. Kilpatrick, W. G. Martin & D. Schifter (Eds.), A research companion to principles and standards for school mathematics (pp. 237-249). Reston, VA: NCTM.
Kyriakides
4 - 24 PME30 — 2006
Ma, L. (1999). Knowing and teaching elementary mathematics: Teachers' understanding of fundamental mathematics in China and the United States. Mahwah, NJ: Erlbaum.
Maher, C. A., Martino, A. M., & Davis, R. B. (1994). Children's different ways of thinking about fractions. In J. P. da Ponte & J. F. Matos (Eds.), Proc. 18th Conf. of the Int. Group for the Psychology of Mathematics Education (Vol. 3, pp. 208-215). Lisbon, Portugal: PME.
Mason, J. (1987a). Representing representing: Notes following the conference. In C. Janvier (Ed.), Problems of representation in the teaching and learning of mathematics (pp. 207-214). Hillsdale, New Jersey: Erlbaum.
Mason, J. (1987b). What do symbols represent? In C. Janvier (Ed.), Problems of representation in the teaching and learning of mathematics (pp. 73-81). Hillsdale, New Jersey: Erlbaum.
Mason, J., & Pimm, D. (1984). Generic examples: Seeing the general in the particular. Educational Studies in Mathematics, 15(3), 277-289.
Perkins, D. N., & Unger, C. (1999). Teaching and learning for understanding. In C. M. Reigeluth (Ed.), Instructional-design theories and models. A new paradigm of instructional theory (Vol. 2). Mahwah, NJ: Erlbaum.
Skemp, R. (1986). Psychology of learning mathematics. England: Penguin Books.
2006. In Novotná, J., Moraová, H., Krátká, M. & Stehlíková, N. (Eds.). Proceedings 30th Conference of the International Group for the Psychology of Mathematics Education, Vol. 4, pp. 25-32. Prague: PME. 4 - 25
DYNAMIC VISUALIZATION AND THE CASE OF 'STARS IN CAGES' Ilana Lavy
The Max Stern Academic College of Emek Yezreel, Israel The present study presents an example of a situation in which university students had to solve geometrical problems which were presented to them in a dynamic version. In the process of solving the problem, the students used ten different solution strategies which were classified into three main categories: distracting, reducing and confusing. One student group had to solve the same problem in its non-dynamic version. The results received from both groups were compared and analyzed. Analysis of the solution strategies and the process of the categorization revealed that the percentage of success in both groups was similar and in the case of the given problem, the dynamic visual mode of the problem distracted the students' attention away from proper handling of the solution of the problem.
INTRODUCTION A great deal of research discusses the advantages of visualization with regard to problem solving (Presmeg, 1986a; Presmeg, 1986b; Kent, 2000; Mariotti, 2000; Slovin, 2000). Visualization enables a range of ways of thinking, different from traditional approaches where formalism and symbolism dominate teaching. Visual thought can offer an alternative and powerful resource in learning mathematics. Problem representation has been viewed as an important stage of the problem solving process (Mayer, 1992), especially in its initial stages (Lowrie & Hill, 1996). Research also discusses difficulties which involved imagery with regard to visual thinking (Presmeg, 1986a; Presmeg, 1986b): (1) the one-case concreteness of an image or diagram may tie thought to irrelevant details, or may even lead to false data. (2) An image of a standard figure may induce inflexible thinking which prevents the recognition of a concept in a non standard diagram. (3) An uncontrollable image may persist, thereby preventing the opening up of more fruitful avenues of thought, a difficulty which is particularly severe if the image is vivid. (4) Imagery which is vague needs to be coupled with rigorous analytical thought processes if it is to be helpful. Distinction should be drawn between difficulties that are intrinsic to visualization such as the difficulties described in the previous paragraph and difficulties that are extrinsic to visualization such as described in the given task. Intrinsic difficulties mean difficulties that emerge as a consequence of visual thinking. Extrinsic difficulties mean difficulties that emerge as a consequence of the use of certain modes of visual representations of a problem. In case of the given problem, questions might be raised as to whether intrinsic and extrinsic difficulties have a reciprocal influence on each other.
Lavy
4 - 26 PME30 — 2006
CONTEXTUAL FRAMEWORK AND BACKGROUND The present study examines the effect of dynamic representation of a geometrical problem given in the interactive environment of the “Microworlds Project Builder” on the process of solving the said problem. Hence, a brief survey which includes references to the role of visualization regarding problem solving and to the environment of the “MicroWorlds Project Builder”(MWPB) is presented. Visualization and problem solving. Visualization has an important role in the development of thinking and mathematical understanding and in the transition from concrete to abstract thinking with regard to problem solving.
“Computing technology is making it much more rewarding for mathematics to use graphics, and in turn mathematics is showing an increased interest in visual approaches to both teaching and research”. (Zimmermann and Cunningham, 1991 p. 75)
Presmeg (1986a, 1986b, 1989, and 1992) classified the different types of visualization appearing in mathematical activities in general and in problem solving in particular: concrete pictorial imagery, pattern imagery, memory images of formulae, kinesthetic imagery and dynamic imagery. Visualization is a process of construction or use in geometrical or graphical presentations of concepts, or ideas built by means of paper and pencil, a computer software or imagination. Visualization is important for building a concept image, and helps in understanding of concepts (Hershkovitz, 1990). In addition, it is considered in supporting intuition and in the learning of mathematical concepts (Dreyfus, 1991). There is a distinction between external presentation (signifier) and an internal presentation (signified) of concepts (Kaput, 1989; Janvier et al., 1993). The external representations of concepts include diagrams, graphs and models and are essential for communication while the internal representations of concepts include mental or cognitive models with which a person examines and interprets new knowledge. Zimmermann and Cunningham (1991) refer to visualization which is computer based. The graphics and the dynamics provided by computers enabled visual representation of mathematical ideas and concepts. The problem given to the participants in this study was computer-based and presented in a visual mode. Although researchers pointed out various advantages regarding the use of visualization in the process of problem solving, some of them refer to the difficulties that might be raised (Arcavi, 2003; Presmeg, 1986a). Dreyfus (1991) denoted that it is important to be aware of difficulties that might arise due to improper use in visualization, difficulties in reading graphs properly, lack of distinction between the geometrical image and its visual presentation. Arcavi (2003) classified the difficulties surrounding visualization into three main categories: cultural, cognitive and sociological. The cultural category refers to the beliefs and values regarding what is mathematically legitimate or acceptable and what is not. The cognitive difficulties refer to the discussion regarding the issue of whether visual thinking is easier or more difficult. In addition, reasoning with concepts in visual settings may imply that there are not always procedurally “safe” routines to rely on and as a consequence this mode
Lavy
PME30 — 2006 4 - 27
of cognition is rejected by students. The sociological difficulties refer to issues of teaching. Some teachers find analytic representations, which are sequential in nature, to be more appropriate and efficient than visual representations (Presmeg, 1991). The “Microworlds Project Builder” environment. Mathematical microworlds that were developed in recent years presented a solution to a need for a learning environment in which learners can create a common language and be engaged in mathematical processes such as generalization, abstraction, problem solving and gradual transition from intuitive to formal description of mathematical concepts. The present research was carried out in an interactive computerized environment called ‘MicroWorlds Project Builder”1 which is a Logo-based construction environment. The MWPB is an interactive Logo based programming environment consisting of objects (i.e. turtle, textbox, button, color and slider) and a set of operations such as changing the turtle shape, making it move in different directions with varying speeds and so forth. The general aim of the course in which this research was carried out is to expose the students to innovative learning/teaching approaches. In this course the students interact with activities including major computer science concepts such as objects, variables, procedures, functions and recursion through the engagement with programming in the Logo language which is taking place in an interactive multimedia environment. One of the MWPB's objects are the colors. The operation of a programmed color can be done in two different ways: (a) by clicking with the mouse on the programmed color; (b) by a turtle touching the programmed color. When either of the two options is performed, certain commands that were previously programmed for that specific color will be executed. For example, one can program the blue color to change the shape of the turtle when the turtle touches it, or one can program the pink color to change the shape of the current2 turtle when she/he clicks with the mouse on the pink color. In the problem presented to the students I used the programmed attributes of the colors. In the present study although a new microworld was not developed, I used a simple environment which can be viewed as a kind of microworld since it consists of two colors (of the shape and of the background), a turtle and simple Logo commands. THE STUDY The participants. 92 undergraduate university students participated in this research. 78 of the participants had to solve the problems which were presented in a dynamic visualized version while 14 of the students were given the same problems without their dynamic visualized version. Most of them were a second or third semester students. The research was carried out during 5 consecutive semesters and between 15 to 20 students participated in each semester. They were all students of the computers teaching education department. 1 MicroWorlds Project Builder is a product of Logo Computer Systems Inc. (LCSI). For more details see the company’s Web site: http://www.microworlds.com 2 The turtle, which made the last movement or operation on the computer screen, is considered to be the current turtle.
Lavy
4 - 28 PME30 — 2006
The tasks – The dynamic visualized version. 78 students had to solve the following problem: A painted circle is drawn on a white background and a turtle is posed inside the circle (figure 1). The turtle is programmed to move forward one step at a time repeatedly, and the color of the background (white) is programmed as follows: each time a turtle reaches the edge of the circle and touches the background, the turtle will make a turn of a certain angle (say, for example: right turn (RT) of 1350). At the first stage, I addressed the whole class with the following questions: What they think will happen when we click on the turtle (make it step forward one step at a time repeatedly)? The students were asked to write down their assumptions first and after they had finished, I “activated” the turtle and the students could view the path of the turtle. At the second stage, the students copied the problem to their computers and had to relate to the following questions: (a) What should the turtle’s initial conditions be (regarding his head direction) for never leaving the circle? (b) What should the turtle’s initial conditions be (regarding his head direction) for leaving the circle? (c) Does the turtle move in a certain path in the circle? Could you describe the path? The name ‘stars in cages’ was formed for the symbolization of the turtle’s movement (a star shape path) – that for certain initial conditions never leaves the ‘cage’ (circle). The non-dynamic version of the problem. The same questions as above were given but without the dynamic visualization. The questions were written on paper and figure 2 was added . The process of the data analysis. The data included the following components: the written assumptions of the students before they could view the turtle’s path inside the circle. These notes were classified according to the raised assumptions, and the names of the students were documented for comparison with their responses to the above questions (a, b and c). At the second stage, for both versions of the problem, the students were asked to solve the given tasks (a, b and c) and provide a formal proof for their solutions. In case they did not succeed in providing a formal proof, they could present informal proof and reflect about the difficulties they had during the solution process. With regard to the dynamic visualized version of the problem, the analysis of the data consisted of four main phases: in the first phase the students’ assumptions were classified according to their content and were compared with the answers they provided to the questions they were asked. In the second phase the students' solutions (to questions a, b and c) were classified according to the solution strategies they used. In the third phase of the data analysis, the students' strategies were classified into three main categories according to the character of the resulting solution strategies. The fourth phase includes the analysis and discussion of the reported difficulties received from the students during the solution
Figure 1: Visual representation
Figure 2
Lavy
PME30 — 2006 4 - 29
process and a discussion which refers to the synthesis of the third and the fourth phase will be presented. Finally, a comparison between the results received from both versions of the problem is presented and analyzed. RESULTS AND DISCUSSION With regard to the dynamic visualized version, analysis of the students' solutions revealed that the majority of them (75 out of 78) did not succeed in providing a complete solution including formal proof for the given problem. In their attempts to solve the problem, the students used a variety of strategies. The students’ assumptions regarding the movement of the turtle – dynamic visualized version. As was previously mentioned, the students were asked to raise conjectures regarding the turtle’s path inside the circle before they could view the turtle’s actual movement on the computer screen. The most common conjecture (70 out of 78) was that the turtle will make one turn of 1350 and then leave the circle. 8 students conjectured that the turtle will never escape the circle since each time it touches the background, it makes a turn of 1350. At this stage of the discussion, I demonstrated to the class the turtle’s motion in the circle: (1) when it moves in a radial direction; (2) cases in which it escapes the circle; (3) cases in which its movement is parallel to the radial direction. Then I asked the students to try to solve the given problem individually; they could use programming and/or geometrical considerations.
The distribution of the solution strategies used by the students – dynamic visualized version. The students’ solutions were then classified into 10 solution categories according to the nature of the presented solution (table 1.)
# strategy No' of students %
1. Descriptive Solution – no proof 21 27%
2. Referring only to certain moves (private cases) 15 19.2%
3. Using internal instead of external angles 14 18%
4. Random situation – no regularity in the turtle's movement 10 12.8%
5. Geometrical considerations such as areas and lengths 4 5.2 %
6. Focusing in the programming rather on the problem 3 3.8%
7. Solution and a proof 3 3.8%
8. Focusing on the turtle's location inside the shape 2 2.6%
9. Referring only to the turning angle of the programmed background
1 1.2%
10. others 5 6.4%
total 78 100%
Table 1: The distribution of the solution strategies used by the students
Lavy
4 - 30 PME30 — 2006
About the categorization – dynamic visualized version. The above solution strategies (except no. 7 and 10) were classified into three main categories according to their characteristics. The categories are: distracting, reducing and confusing. Observation of the solution strategies 4, 6 and 8 reveals that these strategies originated in a situation of distraction. The visual representation of the problem includes additional factors that could distract the students’ attention in the process of the problem solving. Strategies 6, 8 and 4 demonstrate a situation of distraction. The students could not focus on the relevant data for solving the problem; rather they focused on peripheral details that distracted their attention and prevented them from arriving at the correct solution. The second category which includes strategies 1, 2 and 9 was termed 'reducing' since in each of these strategies the students reduced either the problem’s question (1 and 2) or the data of the problem (9). Namely, in strategy 2 the students referred in their solution only to partial cases of the problem, ignoring the rest. In strategy 1 they reduced their solution only to a description of the solution process and did not show any attempts of trying to prove their solution. In strategy 9 the students reduced the data components that should be taken under consideration in the process of solving the problem. The third category which includes strategies 3 and 5 was termed as 'confusing' since in both strategies the students confused between geometrical relations and used them in the turtle geometry environment in which these relations are different. Namely, in geometry, we refer to internal angles when drawing a triangle, while in the turtle geometry environment we refer to the external angles when we draw a triangle. In both strategies the students referred to internal instead of external angles, their justifications were in fact incorrect.
Comparison between solution strategies of both versions. With regard to the non-dynamic version of the problem 64% (9 out of 14 students) handed in an almost complete solution. All the 9 students refer to the case in which the object moves in a radial direction, and in what conditions the object will escape the circle. Their solutions also included a correct graphing description of the object’s path. As to the rest of the students (5 out of 14), they handed in incorrect solutions. I was expecting that the percentage of success of correct solutions of the dynamic visualized version would be higher than that of the non-dynamic version. Actually, if we refer to strategies 1,2, and 7 (in table 1: 27%+19.2%+3.8% = 50%) as equivalent to the students’ solutions of the non–dynamic version, we can see that the percentage of success in the dynamic version is lower than in the non –dynamic one. These results raise the question, with regard to this specific problem situation, whether the dynamic version has advantages over the non-dynamic one. External-visualization and problem solving. From the above results it could be concluded that different aspects of visualization of the given problem hampered the students during the process of the problem’s solution. Few of the study participants referred to the difficulties they had tackled during their solution attempts.
"The movement of the turtle inside the circle distracted my mind and it was difficult for me to transfer its movement to a geometrical problem".
Lavy
PME30 — 2006 4 - 31
"I could not see the connection between the turtle's movement and the related geometrical problem and I could not transfer it to the mathematical world – I was fascinated by the turtle running inside the circle"
Here the students refer to the aspect of motion. Most of the geometrical problems the students deal with during their studies are static. They usually get a defined list of data and a question that has to be answered. In this case, they had to face a problem which was presented to them in its dynamic version which they had to transfer to a static geometrical problem; to decide what are the relevant data for each case of the problem; what are the sub problems included in it, and then to solve each one of them.
"I find it difficult to solve the problem when I don't have a stating point from which the turtle stats its path".
In the above quote the student raises a problem which is connected to the aspect of motion, mentioned earlier, and refers to the fact that since the turtle is in a constant state of motion, it is hard to decide what the starting point of its movement should be when we transfer this dynamic situation to a static problem. In this case the student has to decide where and how (the turtle’s head direction) to locate the turtle inside the circle before it starts its motion, and part of the students had difficulties regarding this decision. CONCLUDING REMARKS This study demonstrates a situation in which undergraduate university students of computer science teaching education were asked to solve a geometrical problem represented in two versions: a dynamic computerized version and a non-dynamic (pen and paper) version. With regard to the dynamic version, the students used various solution strategies during their attempts to solve the problem. These solution strategies were categorized into three main categories according to the characteristics of strategies used. These categories point at some difficulties affected by the dynamic visual representation. Comparison between the solutions received from both versions of the problem reveals that the percentage of success in both versions was similar, which might lead to the conclusion that the dynamic visualized representation of the given problem did not facilitate the process of the problem solving. Some of the students had difficulties in filtering the relevant data and as a result failed in solving the problem. The data ‘flood’ gave the impression that the problem is constituted intrinsically from many sub-problems and as a result some of the solution strategies used by some students included reduction of the data components. Although the act of reduction can often be used as a constructive strategy in the process of problem solving, in this case, it caused situations in which the students failed in solving the problem. References Arcavi, A. (2003). The role of visual representations in the learning of mathematics.
Educational Studies in Mathematics, 52: 215-241
Lavy
4 - 32 PME30 — 2006
Dreyfus, T. (1991). On the status of visual reasoning in Mathematics and Mathematics Education. Proceedings of the 15th International Conference for the Psychology of Mathematical Education. 1, 33-48
Hershkowitz, R. (1990). Psychological aspects of learning geometry. In Nesher, P., & Kilpatrick, J. (Eds.) Mathematics and Cognition, 70-95, Cambridge, England: Cambridge University Press.
Janvier, C., Girardon, C. & Morand, J-C. (1993). Mathematical Symbols and Representations. In: P.S. Wilson (Ed.) Research ideas for the classroom, highschool Mathematics. Macmillan Publishing Company N.Y. 79-102
Kaput, J.J. (1989). Supporting concrete visual thinking in multiplicative reasoning: Difficulties and Opportunities. Focus on Learning Problems in Mathematics. 11 (1), 35-47
Kent, L. B. (2000). Connecting Integers of Meaningful Context. Mathematics Teaching in the Middle School, 6 (1) 62-66
Lowrie, T. & Hill, D. (1996). The development of a dynamic problem-solving model. Journal of Science and Mathematics Education in Southeast Asia, XXIX(1). 1-11
Mariotti, M.A. (2000). Introduction to proof: the mediation of a dynamic software environment. Educational Studies in Mathematics, 44 (1-2) 25-53
Mayer, R.E. (1992). Thinking, problem solving, cognition (2nd ed.). New York: W.H. Freeman.
Presmeg, N. (1986a). Visualization in high-school mathematics. For the Learning of Mathematics, 6 (3), 42-46
Presmeg, N. (1986b). Visualization and mathematical giftedness. Educational Studies in Mathematics, 17 (3), 297-311
Presmeg, N. (1989). Visualization in multicultural mathematics classrooms. In: Focus on Learning Problems in Mathematics,11 n(1-2),17-24
Presmeg, N. (1991). Classroom aspects which influence use of visual imagery in high school mathematics. In F. Furunghetti (Ed.) Proceedings of Fifteenth International Conference on the Psychology of Mathematics Education (PME) Conference. Vol. 3, 191-198, Assisi, Italy.
Presmeg, N. (1992). Prototypes, metaphors, metonymies and imaginative rationality in high school mathematics. Educational studies in Mathematics, 23 (6), 595-610
Slovin, H. (2000). Moving to proportional reasoning. Mathematics Teaching in the Middle School. 6 (1) 58-60
Zimmermann, W. and Cunningham, S. (1991). What is Mathematical Visualization? In: Zimmermann, W. Cunningham, S. (Eds.).Visualization in Teaching and Learning Mathematics. 1-8.
2006. In Novotná, J., Moraová, H., Krátká, M. & Stehlíková, N. (Eds.). Proceedings 30th Conference of the International Group for the Psychology of Mathematics Education, Vol. 4, pp. 33-40. Prague: PME. 4 - 33
MATHEMATICS, GENDER, AND LARGE SCALE DATA: NEW DIRECTIONS OR MORE OF THE SAME?
Gilah C. Leder Helen J. Forgasz Peter J. Taylor La Trobe University Monash University University of Canberra
It is now frequently argued that intervention programs aimed at improving schooling for females have been so successful that males, as a group, should be perceived as disadvantaged: in terms of educational participation, adjustment to schooling, and achievement in most subjects - including mathematics. In this paper we examine two large data bases for possible gender differences: the Australian Mathematics Competition [AMC] – for which participation is voluntary - and the mathematics course in the Victorian Certificate of Education [VCE] most frequently used as a prerequisite for entry into many tertiary courses. Greater male participation was found for both tests. Gender differences at the high performance levels also favoured males, but were more marked for the AMC. INTRODUCTION Historically, mathematics has been viewed as the preserve of white, middle-class, males. Over the past three decades in particular, stringent efforts have been made in many different countries to re-dress this perception (Leder, 2001). Intervention programs aimed at improving female participation rates and attaining equity in levels of achievement have flourished, with variable results (Forgasz & Becker, 2005; Leder, Forgasz, & Solar, 1996). For example, in a recent publication, Gallagher and Kaufman (2005) wrote that “the one consistent finding has been the performance gap in standardized tests of mathematics favoring males … even when comparing scores for students … who have taken the same math courses” (p. ix). At the same time they noted that “research examining gender differences in classroom grades … has generally reported no differences, or differences favoring females, even in high-level mathematics courses” (p. ix). In recent years evidence of gender differences in performance has become more equivocal, with females at times reported, and perceived, as outperforming males (Forgasz & Leder, 2000). Indeed, in some quarters it is now argued that intervention programs aimed at improving mathematics learning for females have been so successful that males, as a group, should now be perceived as disadvantaged: in terms of educational participation, adjustment to schooling, and achievement in most subjects - including mathematics e.g., Department of Education, Science and Training (2003), Freeman (2004), and Lingard and Douglas (1999). DATA SELECTION In a recent review of research on mathematics teacher education, Adler et al. (2005) observed that small-scale qualitative research now predominates, pointed to “a notable absence of large scale studies” (p. 370), and argued that findings from the
Leder, Forgasz & Taylor
4 - 34 PME30 — 2006
latter are needed for testing hypotheses. These comments are equally pertinent for research in mathematics education more generally. Through a careful interrogation of large scale data sets – administered to American students and collected primarily in the 1970s and 1980s – Chipman (2005) effectively illustrated the complex and contradictory nature of gender differences in mathematics participation and performance, and cited, among a range of other factors, differences in performance patterns on compulsory and optional tests. Some years earlier, Lingard and Douglas, (1999, p. 98) already pointed to the continuing need for “nuanced and careful readings … (of relevant data) to understand the complexity of the picture of male/female differences (and similarities) in educational performance”. In this paper we draw on the approach used by Chipman (2005) and advocated by Lingard and Douglas (1999). We examine current gender differences in participation and performance in mathematics by focusing on data from two large scale mathematics tests for students in grade 12 - one voluntary, the other part of the formal grade 12 examination. THE STUDY Records from two large data sources, the Australian Mathematics Competition [AMC] and the Victorian Certificate of Education [VCE] (Victoria is the second most populous state in Australia), in the years 2002-2004 were used to examine the following questions: (1) Are there gender differences in participation in mathematics by senior high school students, i.e., students in grade 12? (2) Are there gender differences in patterns of performance? (3) If gender differences are found, are they consistent for both tests? The sample The sample comprised students in grade 12 participating in the relevant (Senior) Australian Mathematics Competition [AMC] paper and students enrolled in a grade 12 mathematics subject, for the years 2002-2004. Space constraints do not allow comparisons for all three grade 12 mathematics subjects available. We focus on students enrolled in the VCE Mathematical Methods paper because of its importance for entry into many tertiary courses, similarities in the proportions of males and females entering the AMC (see Table 1), and similarities in the format and content of the two tests (Australian Mathematics Trust, 2005; VCAA, 2005). To allow appropriate comparisons to be made, the numbers of students in grade 12 across Australia and in Victoria for the years examined are also provided (See Table 1). The mathematics tests As described above, the AMC and the VCE served as our main data sources. Both attract large numbers of students each year. Participation in any level of the AMC is voluntary and the results obtained on the paper have no direct effect on future educational or career pathways. In contrast, the VCE is a high stake examination,
Leder, Forgasz & Taylor
PME30 — 2006 4 - 35
compulsory for students enrolled in grade 12 (the final year of high school for students across Australia) who wish to proceed to university as VCE results are converted into a score used for tertiary entrance. More detailed information about the AMC and about the Victorian VCE mathematics subject of interest to this study is presented in the next sections. The Australian Mathematics Competition [AMC] The first AMC was conducted in 1978, with 60,000 students from some 700 schools entering the competition. By 2004 over 340,000 students from more than 2,450 schools throughout Australia participated in the competition, i.e., about one-quarter of Australia’s secondary school students. The consistently high student participation rates are clear testimony of the value assigned by schools to the AMC. There are now five separate papers in the AMC. Collectively these cover the school years from grade 3 to grade 12. Each paper comprises 30 multiple choice questions. All items, devised by a committee drawn from experienced teachers and university academics from within and beyond Australia, are moderated for syllabus suitability. For the purposes of this article, only the data from the grade 12 entrants (those who sat for the Senior AMC paper) are of interest. These students invariably include mathematics among the subjects studied that year. The AMC’s organisers aim to reward outstanding performance as well as giving “average” students a sense of achievement. Thus a range of awards are distributed: Prizes (to the top approximately 0.3 % of students within their geographic region and grade level), High Distinctions (to students in the top 2% of their grade level and geographic region and who have not received another award), Distinctions (students in the top 15% of their grade level and geographic region and who have not received a higher award), Credits (students in the top 50% of their grade level and geographic region and who have not received a higher award), and a Participation Certificate (students who have participated in the AMC but have not received a higher award). Until the 2002 paper, all incorrect responses to items attracted a penalty. That year a new scoring system was introduced so that students who attempted the last 10 (and most difficult) questions on the paper were not penalized if a response was incorrect. The Victorian Certificate of Education [VCE] For the years 2002-2004 three mathematics subjects were offered at the grade 12 level in the VCE: Specialist Mathematics, Mathematical Methods, and Further Mathematics. Of these, Specialist Mathematics is the most difficult, Mathematical Methods is studied by the largest number of students and is considered the necessary pre-requisite for most higher education programs requiring mathematics as a background (including most science and engineering courses), and Further Mathematics is the least demanding. For each of these subjects, a final grade is determined by combining the results of three assessment tasks: a school-assessed task and two examinations – the first comprised of multiple-choice and short answer items; the second of problems requiring extended written solutions. The
Leder, Forgasz & Taylor
4 - 36 PME30 — 2006
achievement levels for each task are reported separately (e.g., Victorian Curriculum and Assessment Authority, 2004), The highest grade level attainable is A+, followed in decreasing order by: A, B+, B, C+, C, D+, D, E+, E and UG (ungraded).
RESULTS In the first instance, the findings are reported separately for each research question. (1) Are there gender differences in participation in mathematics by senior high school students, i.e., students in grade 12? Participation data across Australia for grade 12 and for the Senior (grade 12) AMC paper, and for all grade 12 students and VCE Mathematical Methods enrolments for the years 2002-2004 are shown in Table 1.
2002 2003
N(students) M F Total M:F M F Total M:FAust Gr.12 91959 101713 193672 .90 92396 101220 193616 .91 Senior AMC 13158 11398 24556 1.15 12528 10347 22875 1.21% in Senior AMC 14.3% 11.2% 12.7% 1.28 13.6% 10.2% 11.8% 1.33Vic Gr 12 22977 26554 49531 0.87 23468 26409 49877 0.89Vic Maths Meths 9586 8318 17904 1.15 9797 8349 18146 1.17 2004
N(students) M F Total M:F
Aust Gr.12 92108 101167 193275 .91
Senior AMC 11149 8941 20090 1.25
% in Senior AMC 12.1% 8.8% 10.4% 1.37
Vic Gr 12 23543 26432 49975 0.89
Vic Maths Meths 9769 8216 17985 1.19
Table 1: Australia: Grade 12 and Senior AMC enrolments overall and by gender, and Victoria: Grade 12 and Mathematical Methods enrolments overall and by gender From Table 1 it can be seen that in each year, 2002-2004, more females than males were enrolled in grade 12 Australia-wide and in Victoria, but more males than females entered the Senior (grade 12) AMC paper and studied the VCE subject, Mathematical Methods. The ratio of male to female participation (M:F) in the Senior (grade 12) AMC paper increased steadily over that period, from 1.28 to 1.33 to 1.37. A small increase was also noted for male participation in the VCE Mathematical Methods enrolments with M:F ratios increasing from 1.15 to 1.17 to 1.19. Although females remained in the majority overall, there was also a small increase in male participation in the VCE, with the M:F ratio increasing from 0.87 to 0.89.
Leder, Forgasz & Taylor
PME30 — 2006 4 - 37
(2) Are there gender differences in patterns of performance? Achievement data for the Senior (grade 12) AMC paper are shown in Table 2.
2002 N within merit category % within gender M F All N - M:F %M %F %All % -
Table 2: 2002-2004: AMC (Senior) paper – achievement by merit category, gender, and M:F within merit category (N - M:F), and within gender cohorts (% - M:F) The data in Table 2 reveal that in each of the years 2002-2004 more males than females gained the three highest awards (Prize, High Distinction, and Distinction)
Leder, Forgasz & Taylor
4 - 38 PME30 — 2006
both absolutely and proportionately. For example, in 2002, 329 males and 95 females (M:F = 3.46) were awarded a High Distinction. In terms of within gender cohort proportions, 329 represented 2.5% of all males, and 95 represented 0.83% of all females (M:F = 3.0) Achievement data from the 1st (largely multiple-choice format) Mathematical Methods examination for 2002-2004 are shown in Table 3. These data were selected for analysis because the paper’s multiple choice format was comparable to that of the AMC. Only results for the first four achievement levels (A+ to B) are shown. These collectively represent some 50% of examinees and are thus most relevant for comparison with the AMC data.
2002 2003 Grade M %1 F %1 All % M:F M % F % All % M:F
1 Within male/female cohort percentages. For total cohort numbers, see Table 1. Table 3: VCE Mathematical Methods achievement data (multiple-choice item examination) by gender (adapted from data downloadable from VCAA website: www.vcaa.vic.gov.au) The data in Table 3 indicate that in each of the years 2002-2004, more males than females were awarded each of the four achievement levels, (e.g., in 2003, 1406 males and 1268 females were awarded B+). However, with respect to their gender cohort representations within the subject, it was only at the A+ level in 2002-2004, and at the A level in 2003 and 2004 that a higher proportion of males than females was awarded the particular achievement grade. At the other achievement levels, the proportions were either the same (M:F = 1) or a higher proportion of females achieved the particular grade (M:F < 1). (It may be of interest for readers to know that greater numbers and higher proportions of males than females also achieved the A+ level in the two other assessment tasks for Mathematical Methods in 2002-2004. Presentation and analyses of these data are, however, beyond the scope of this paper.)
Leder, Forgasz & Taylor
PME30 — 2006 4 - 39
(3) If gender differences are found, are they consistent for both tests? As is apparent from the discussion above, on balance the answer to this question is “No”. For the period 2002-2004, there were more males than females – both numerically and in relation to their within gender cohort proportions – who achieved at the highest levels in both the AMC and the VCE Mathematical Methods multiple-choice examination. On multiple-choice format tests males continue to surpass females, at least at the very highest levels of achievement at the grade 12 level. The evidence presented, however, reveals that males appeared to be much more successful at the highest levels of achievement than females on the Senior AMC paper than on the multiple-choice examination of VCE Mathematical Methods. Several explanations can be postulated to explain these differences in the patterns of achievement. First, the AMC still has sections (the first 20 questions on the paper) that include penalty scoring. Males have been found to be greater risk-takers than females and to be less likely to leave blanks in multiple-choice situations (e.g., Leder & Forgasz, 1991). A second explanation may be that females may not take the AMC as seriously as males, putting more effort into their studies in their final year of schooling. These, or alternate explanations, can be tested effectively through interviews. These data were not part of this study. FINAL WORDS The data reported here indicate that retention rates in the final year of secondary schooling are higher for females than for males Australia-wide. Yet more grade 12 males than females engaged in formal (VCE) and informal (AMC) mathematical endeavours. At the highest levels of achievement, males outperformed females in both of the tests monitored, whether comparisons were made with or without adjustment for the differences in cohort sizes. Male dominance was more marked and more consistent for the voluntary AMC than for Mathematical Methods, the important VCE gate keeping subject. From an equity perspective, persistent differences in performance remain of concern. Careful monitoring of large scale data continues to be important for precise descriptions of gender differences in mathematics participation and performance but more fine grained explorations are needed to understand why these differences persist. Acknowledgement We wish to thank Toni Paine for her help in extracting the AMC data. References Adler, J., Ball, D., Krainer, K., Lin, F-L, & Novotna, J. (2005). Reflections on an emerging
Australian Mathematics Trust (2005). Fact Sheet. Retrieved November 11, 2005 from: http://www.olympiad.org.amcfact.html.
Chipman, S. F. (2005). Research on the women and mathematics issue: A personal case history. In A. M. Gallagher & J. C. Kaufman (Eds.) Gender differences in mathematics. (pp.1-24) Cambridge, UK: Cambridge University Press
Leder, Forgasz & Taylor
4 - 40 PME30 — 2006
Department of Education, Science and Training (2003). Educating boys: Issues and information. Canberra: Australian Commonwealth Government
Forgasz, H. J., & Becker, J. R. (2005). Mathematics and gender: Should we still care? In H. L. Chick, & J. L. Vincent (Eds). Proceedings of the 29th Conference of the International Group for the Psychology of Mathematics Education (Vol 1, p. 205). Melbourne, Australia: The University of Melbourne.
Forgasz, H. J., & Leder, G. C. (1991). To guess or not to guess: A question of risk? Mathematics Competitions, 4(2), 58-69.
Forgasz, H. J., & Leder G. C. (2000). The ‘mathematics as a gendered domain’ scale. In T Nakahara & M Koyama (Eds.) Proceedings of the 24th Conference of the International Group for the Psychology of Mathematics Education (pp 2-273-2-279). Hiroshima: Department of Mathematics Education, Hiroshima University.
Freeman F. (2004). Cultural influences on gifted gender achievement. High Ability Studies, 15(1), 7-23.
Gallagher, A. M., & Kaufman, J. C. (2005). Preface. In A. M. Gallagher & J. C. Kaufman (Eds.) Gender differences in mathematics. (pp. ix-xi) Cambridge, UK: Cambridge University Press
Leder, G. C. (2001) Pathways in mathematics towards equity: a 25 year journey . In M. van den Heuvel-Panhuizen (Ed.) Proceedings of the 25th conference of the International Group for the Psychology of Mathematics Education (Vol 1, pp. 41-54). Utrecht, the Netherlands: Freudenthal Institute, Faculty of Mathematics and Computer Science, Utrecht University
Leder, G. C., & Forgasz, H. J. (2000). Mathematics and gender: Beliefs they are a changin’. In J. Bana & A. Chapman (Eds.) Mathematics education beyond 2000 (Proceedings of the 23rd Annual Conference of the Mathematics Education Research Group of Australasia Inc) (pp. 370-376). Perth, Western Australia: Executive Press.
Leder, G. C., Forgasz, H. J., & Solar, C. (1996). Research and intervention programs in mathematics education: A gendered issue. In A. Bishop, K. Clements, C. Keitel, J. Kilpatrick, & C. Laborde (Eds.), International handbook of mathematics education, Part 2 (pp.945-985). Dordrecht, Netherlands: Kluwer.
Lingard, B., & Douglas, P. (1999). Men engaging in feminisms: Pro-feminism, backlashes and schooling. Buckingham: Open University Press.
Victorian Curriculum and Assessment Authority. (2004). Mathematical methods. Retrieved December 18, 2005 from:
http://www.vcaa.vic.edu.au/vce/statistics/2004/section3/mathmethodsga04.pdf Victorian Curriculum and Assessment Authority. (2005). Mathematics. Victorian
Certificate of Education study design. Retrieved December 28, 2005 from: http://www.vcaa.vic.edu.au/vce/studies/mathematics/mathsstd.pdf
2006. In Novotná, J., Moraová, H., Krátká, M. & Stehlíková, N. (Eds.). Proceedings 30th Conference of the International Group for the Psychology of Mathematics Education, Vol. 4, pp. 41-48. Prague: PME. 4 - 41
EVALUATION AND RECONSTRUCTION OF MATHEMATICS TEXTBOOKS BY PROSPECTIVE TEACHERS
Kyung Hwa Lee Korea National University of Education
This paper provides an analysis of prospective teachers’ evaluation and reconstruction of mathematics textbooks. Thirty-four prospective teachers participated in the three-hour lecture and discussion for 15 weeks. Data consisted of final reports written by the prospective teachers, interviews and lecture observations. The purpose of this study is to grasp the process in which prospective teachers, based on the study of Kulm et al. (2000) and of Shield (2005) on the evaluation of textbooks and the researches related to analysis by Kang & Kilpatrick (1992), Dowling (2001), and Herbst (1997), establish their own evaluation and analysis method of textbooks. In addition, this research intends to identify the process in which they reconstruct textbooks based on the results of their analysis. INTRODUCTION Ball (2003) insists that we need better insight into the ways that materials and institutional contexts can either assist or impede teachers’ efforts to use mathematical knowledge as they teach. She also suggests to consider questions such as how teachers’ guides can be crafted to provide opportunities for teachers to learn mathematics, how they can be designed such that teachers understand the mathematical purposes pertinent to an instructional goal, how those guides can be designed to help teachers use their mathematical knowledge as they prepare lessons, make sense of students’ mistakes, and assess students’ contributions in a class, etc. Kulm et al. (2000) presented a method to evaluate mathematics textbooks based on the detailed standards of the statement of objectives, suggestion and development of contents elements and the evaluation processes, etc., and the data earned from the comparison and evaluation of various textbooks. Shield (2005), starting from the achievement of Kulm et al. (2000), offered the process of pertinently transforming specific contents elements in a curriculum into the knowledge in a textbook and, based on which, the way to evaluate textbooks. In a situation where various kinds of mathematics textbooks are being published, it is a part of the specialty of a mathematics teacher to decide on which standards he would apply in choosing and using a textbook. Kang & Kilpatrick (1992) analysed didactic transposition of mathematics textbooks and identified potential extremes in the didactic phenomena. Kang(1990) elaborated the process of the construction of school mathematics as the body of knowledge declared by mathematics educators. Dowling (2001) analysed mathematics textbooks in a sociological perspective and presented an interpretative framework that exist between teachers and students, and between students. Herbst (1997), through the analysis of number-line metaphor found in mathematics textbooks, showed the
Lee
4 - 42 PME30 — 2006
mathematical discourse of a textbook as an environment where one can find mathematical discourse that is subject to a regime, possibly different from official the discourse of mathematicians. The ability to analyse a textbook in diverse perspectives is another part of the specialty of a mathematics teacher. The purpose of this research is to grasp the process in which prospective teachers, based on the study of Kulm et al. (2000) and of Shield (2005) on the evaluation of textbooks and the researches related to analysis by Kang & Kilpatrick (1992), Dowling (2001), and Herbst (1997), establish their own evaluation and analysis method of textbooks. In addition, this research intends to identify the process in which they reconstruct textbooks based on the results of their analysis. PROCEDURES Thirty-four prospective teachers participated in the three-hour lecture and discussion for 15 weeks in the fall of 2005. In the first 10 weeks, they confirmed the contents of the studies of Kulm et al. (2000), Shield (2005), Kang & Kilpatrick (1992), Dowling (2001), and Herbst (1997) through lecture and discussion of illustrated materials. And for five weeks thereafter, they tried the evaluation and analysis of Korean textbook A, Korean textbook B and teacher’s guides for the 8th grade students. A total of 10 teams, which consisted of 3 or 4 people, evaluated, analysed and announced the results thereof, and then were asked to criticize the attempts of each team and draw significant conclusions. Discussion among team members during the preparation of the announcement was recommended; in most cases, they prepared the arranged version of the contents discussed, sent it to the e-mail account of the researcher to receive his criticism three or four times. In a website, the announced materials, related theses, contents of discussion of each team were uploaded to be shared, and free discussion on the website was also made possible. After 15 weeks, they finally prepared the report on the results of their evaluation and analysis and the plan for their own reconstructed version, and submitted them. Three prospective teachers of P1, P2 and P3 participated in the interview, which was held based on their final reports. The announcements, discussions of prospective teachers during the 5 weeks and the interviews with the three prospective teachers were recorded and analysed. The researcher looked at a group of prospective teachers interacting, connecting ideas, and building their understanding together as Droujkova et al. (2005) properly addressed. In this research, the evaluation of mathematics textbooks was made, applying the seven categories suggested by Kulm et al. (2000), which are ‘Identifying Sense of Purpose,’ ‘Building on Student Ideas about Mathematics,’ ‘Engaging Students in Mathematics,’ ‘Developing Mathematical Ideas,’ ‘Promoting Student Thinking about Mathematics,’ ‘Assessing Student Progress in Mathematics’ and ‘Enhancing the Mathematics Learning Environment.’ Utilizing all the 24 evaluation standards under the 7 categories, High, Medium and Low were given the scores of 3, 2, and 1, respectively, and the average was produced. Analysis of textbooks was made by team applying the selected method after consulting the contents of the researches conducted by Shield (2005), Kang & Kilpatrick (1992), Dowling (2001) and Herbst
Lee
PME30 — 2006 4 - 43
(1997). All the prospective teachers were asked to try reconstructing the textbooks based on the results of evaluation and analysis and submit it. RESULTS AND DISCUSSION The average scores of evaluation results by category of the two textbooks on which prospective teachers submitted the report are as follows:
Category A B Identifying a Sense of Purpose 1.6 1.7
Building on Student Ideas about Mathematics 1.0 1.1 Engaging Students in Mathematics 1.1 1.3
Assessing Student Progress in Mathematics 2.3 2.2 Enhancing the Mathematics Learning Environment’ 1.6 1.4
Table 1: Evaluation of mathematics textbooks by the prospective teachers As shown in Table 1, the prospective teachers gave similar ratings to the two textbooks and they particularly gave low ratings on the categories of ‘Building on Student Ideas about Mathematics,’ ‘Engaging Students in Mathematics’ and ‘Enhancing the Mathematics Learning Environment’ (see shaded parts in Table 1). As to ‘Developing Mathematical Ideas’ and ‘Assessing Student Progress in Mathematics,’ both the two textbooks were given relatively high ratings. Building on Student Ideas about Mathematics According to Kulm et al. (2000), this category consists of the evaluation standards of ‘Specifying Prerequisite Knowledge,’ ‘Alerting Teacher to Student Ideas,’ ‘Assisting Teacher in Identifying Ideas’ and ‘Addressing Misconceptions.’ The reports of prospective teachers showed that the two textbooks explicitly deal with what prerequisite knowledge of students is required. However, the textbooks, according to the report of the prospective teachers, made almost no attempt to identify the misconceptions students might have, or a certain mathematical knowledge or functions they are presumed to have developed based on common knowledge. Particularly, to the question of ‘Does the material include suggestions for teachers to find out what their students think about familiar situations related to a benchmark before the mathematical ideas are introduced?”, both the two textbooks were judged not to provide good materials to teachers. The prospective teachers’ interpretation of this was, since traditional approach has been aiming at an “efficient and correct method,” a diverse, intuitive or experimental approach has rarely been adopted. This seems to be a problem common to most of Asian textbooks where compact-style textbooks are generally pursued. On the other hand, the prospective teachers agonized over to what extent a textbook should reflect the ideas and functions students in general might have. Also, the argument over whether those ideas are as numerous as the number of the students was continued. Eventually, the argument was settled after one of the ten teams conducted a research
Lee
4 - 44 PME30 — 2006
on misconceptions, with the students attending the middle school attached to the college of the prospective teachers as subjects, classified the types of misconceptions and announced them. And they reached the conclusion that since the misconceptions students might have had already been studied, if a research was conducted with some students using a modified examination paper, results that can be classified into types to an extent can be obtained, and this need to be reflected in textbooks whenever necessary. Engaging Students in Mathematics The reports of prospective teachers showed that the two textbooks explicitly deal with what prerequisite knowledge of students is required. However, the textbooks, according to the report of the prospective teachers, made almost no attempt to identify the misconceptions students might have, or a certain mathematical knowledge or functions they are presumed to have developed based on common knowledge. Particularly, to the question of ‘Does the material include suggestions for teachers to find out what their students think about familiar situations related to a benchmark before the mathematical ideas are introduced?”, both the two textbooks were judged not to provide good materials to teachers. As sub-standards of this category, Kulm et al. (2000) suggested “Providing Variety of Contexts” and “Providing Firsthand Experiences.” The prospective teachers judged the domestic textbooks fail to offer diverse problematic situations. For example, in the unit of probability, most of the situations in problems were composed of coins, dice, card, etc.; and those cases where students were given the opportunity to collect materials through experiments were judged to be rare. Also, teaching an outer center or inner center of triangle unduly relied on deductive explanation; and seemed to be lacking the attempts to make students feel that mathematics is related to the realities of life. The prospective teachers displayed the highest interest in providing diverse problematic conditions, particularly firsthand experiences; and from this high interest, the major viewpoint in reconstructing textbooks was drawn. For example, they thought coins or dices are not appropriate as an introduction to experimental probability and tried reconstruction using a game of Yut, a local folk game, as the problematic situation. A yut is formed with a round face and a flat face, and unlike a coin, the two faces are not symmetrical, which means they do not have the same possibility. Therefore, their theory goes since students can compare the numerical difference in possibility of the two faces only after going through sufficient number of experiments, using Yut enables them to start with the meaning of experimental probability. In the case of the inner center and outer center of a triangle, they suggested imposing the problematic situation of restoring cultural artefacts as a starting point. They argued that to restore the original form of an artefact that is broken, the effort to first find out the outer center by drawing a triangle has to be made, and accordingly, through the effort, the students can experience how mathematics can be applied practically.
Lee
PME30 — 2006 4 - 45
Enhancing the Mathematics Learning Environment The prospective teachers insisted that a teacher’s guide has to offer a variety of information on the backgrounds of the contents to be taught, and judged the current teacher’s guides fall far short in this aspect. They thought though the guide contains knowledge about the history of mathematics and the knowledge of various fields other than mathematics, the level of knowledge offered was no better than superficial. According to them, a positive change has been detected in that they accommodate the diverse opinions of students and take them as subjects of discussion, not acknowledging only those that are suggested in textbooks as truths. However, they argued this need to be pursued more positively. Some of the prospective teachers pointed out that textbooks are being written in such a way that is more favourable to male students: in many cases, the problematic situations offered in the textbooks are the ones related to the fields of sports or science, which may make the problem more difficult for female students to understand. Also, some participants noted that the explanations given in textbooks are overly compressed and make learning more difficult for slower students. Case of P1 P1, a prospective teacher, used a notion related to extreme teaching phenomenon that was presented in Kang & Kilpatrick (1992) as a major tool in analysing textbooks. She maintained that the series of contents in the textbooks that express a repeating decimal as a fraction after indicating a rational number as a decimal and classifying a decimal into a finite decimal, an infinite decimal and a repeating decimal, is treated in an unstable manner, which leads teachers to reach the phenomenon of extreme teaching. The following is a part of conversation between the researcher and P1:
1 R: Do you think the textbook caused the phenomenon of extreme teaching? 2 P1: Yes. If the process of converting a repeating decimal into fraction was 3 clearly expressed in mathematical viewpoint, it does not matter. But the 4 demonstration suggested in the textbooks applied the measuring system for 5 the finite to the infinite without providing any justification. 6 R: How is that related to the phenomenon of extreme teaching? 7 P1: Because the teacher ends up without underlining the principle or the 8 meaning of demonstration emphasizing the formula which alters it to a 9 fraction.
The prospective teacher P1 also explained why the current textbooks make such an approach: there is no alternative in order to introduce an irrational number to the middle school students who are not aware of the notion of utmost limits. In the case like this where the mathematical exactness is not satisfied, she argued, textbooks should give students opportunity to think and let them know they will later have another chance to learn it more clearly.
Lee
4 - 46 PME30 — 2006
Case of P2 P2, a prospective teacher, analysed the two textbooks in the light of the question Dowling asked in 2001, “What are the relationships between mathematics and non-mathematical practices such as shopping?” According to the report of P2, A and B, the two mathematics textbooks, used the market, bank, sports stadium, volunteer activity as contexts to show mathematics are used in ordinary life, and tried to reflect a mathematical system, a teaching objective, in each of those contexts. However, he felt the effort of naturally linking mathematics and non-mathematical practices failed in most cases; on the contrary, they caused the students to feel that mathematics is far from their everyday life. In the interview with the researcher he told the researcher like the following:
When we buy things in the market, we happen to face various discounting methods that even change at the will of the merchant at times. More importantly, we do not usually meet the situation where we have to go through a complex process of calculating the prices. In real life we confirm the prices of each article to buy one by one and then calculate the money to spend, rather than produce the price of an article by establishing simultaneous equations. Everything is done in a reverse order only in the mathematics textbooks. If the textbooks rely too often on the handling methods not used in everyday life, students will doubt all the situations depicted as every day life in their mathematics textbook.
In his opinion, offering a new world that students can come across only during the mathematics class is more effective that offering the conditions of everyday life in making students feel the usefulness of mathematics. His opinion was very unique and often collided with those of other students. He said he would reconstruct the textbooks in such a manner that, while analysing them, he would not pay attention to other conditions except for mathematical ones about the problematic situations he regards as unnatural. Case of P3 P3, a prospective teacher, suggested that the textbooks and the teacher’s guide should be analysed using the mixture of many analysing methods and then the category-classifying method of Kulm et al. (2000) should be modified. He suggested the category 1 have two sub-standards of ‘1.1 Justifying the Sequences of Activities,’ and ‘1.2 Conveying Purpose.’ In his opinion, there is no need to divide unit purpose and lesson purpose and make a separate evaluation on them because ‘Justifying the Sequences of Activities’ is so much important. He also suggested that in the case of the category 3, ‘Providing Firsthand Experience’ be deleted or replaced. His theory is that, if firsthand experiences are emphasized too much in middle school mathematics, it might become more difficult for students to give attention to reasoning. He argued that though there are conditions where intuition or induction is to be emphasized; there also exist the conditions where attention should be paid to the progress in justification and reasoning; therefore, it is important to replace ‘providing firsthand experience’ with ‘Justifying the characteristics of activities.’
Lee
PME30 — 2006 4 - 47
The following is a part of conversation between the researcher and P3: 1 R: What is the meaning of “Justifying characteristics of activities?” 2. P3: Activities contain a variety of characteristics. It is necessary to offer the 3 kind of activities that fit the knowledge to be instructed. Rather than having 4 the students engage themselves in activities unconditionally… How should 5 I put it……? Sometimes, deductive reasoning, neither experimental nor
6 inductive reasoning, can serve as an important point.
The participating prospective teachers confirmed that the contents provided in the textbooks reflect the results of considering many aspects, and in some cases, they found their users could be exposed to various dangers through the contents. More than anything, they agreed to the fact that prospective teachers themselves have to grow as active users of curricula and textbooks. In the first discussion, a considerable portion of them believed there would be no errors in mathematics textbooks and accordingly, there was no need to reconstruct the contents of textbooks. However, in their final reports, all of them reached the conclusion that mathematical textbooks have merits in some aspects and demerits in other aspects--- incomplete products that need to be complemented by teachers. Also, they came to think conversion in teaching by textbook is just imaginary and rather, a desirable conversion in teaching can be completed by the teacher. This change in viewpoint means they have come to regard developing selectivity of textbooks as an important element of their specialty. In most cases of reconstructing mathematics textbooks, the prospective teachers tried to utilize traditional costumes, folk games, etc.; and many attempts to apply technology were noted. P1, the prospective teacher, said “Even though mathematics has a long history, people in general are not aware of it, probably because it is not related to our native culture.” “The Study of Yut game,” developed by her seemed very suitable to be used in teaching the concept of probability, and actually the entire prospective teachers acknowledged its value most positively. She said she planned to study the reconstruction methods of textbooks all her life and maintained that a major part of class depends on teacher’s ability to reconstruct the textbook. On the other hand, it was found out that the prospective teachers were active in applying engineering to their reconstruction effort, which seemed to be because they are familiar with advanced cell phones and computers.
CONCLUSION The participants of this research, who are prospective teachers, expressed the experience of participating in this research as “self-discovery as an expert,” “self-awakening to the difficulties of teaching” and “delicacy of converting knowledge,” etc. This means they perceived this research as a stage of growth to become a teacher. Particularly, this research played an important role in leading them to make an approach to the mathematics curricula and mathematics textbooks not merely as a passive user but a developer, or a user who is also a positive improver.
Lee
4 - 48 PME30 — 2006
With the experience of reconstructing mathematics textbooks, the prospective teachers seem to have come into contact with the opportunity to perceive the characteristics of school mathematics. For the reconstruction, they were asked to confirm the contents that they had analysed in the past; and some participants, who keep making superficial criticisms with the unproductive viewpoint of analysis, were induced to reform their viewpoint of analysis in the process of reconstruction. This suggests that in educating prospective teachers, the cycle of textbook analysis and reconstruction should be continued on a steady basis. The evaluation, analysis and reconstruction of mathematics textbooks require discreet and concrete approach. Attempts of this kind should also be made on a steady basis in educating incumbent teachers, which is believed to be one way of promoting conversation between researchers and teachers. References Ball, D. L. (2003). Mathematical Proficiency for All Students: Toward a Strategic Research
and Development Program in Mathematics Education. Santa Monica: Rand. Dowling, P. (2001). Reading mathematics texts, In Gates, P. (2001). Issues in Mathematics
Teaching. London: Routledge, 180-196. Droujkova, M. A.. Berenson, S. B., Slaten, K., & Tombes, S. (2005). A Conceptual
Framework for Studying Teacher Preparation: the Pire-Kieren Model, Collective Understanding, and Metaphor. In Helen L. C. & Jill, L. V. (Eds.), Proc. 29th Conf. of the Int. Group for the Psychology of Mathematics Education (Vol 2. pp.289-296), Melbourn, AUSTRALIA: PME.
Herbst, P. (1997). The Number-Line Metaphor in the Discourse of a Textbook Series. For the Learning of Mathematics 17(3), 36-45.
Kang, W. (1990). Didactic Transposition of Mathematical Knowledge in Textbooks, unpublished doctoral dissertation, Athens, GA, University of Georgia.
Kang, W. & Kilpatrick, J. (1992). Didactic transposition in mathematics textbooks. For the Learning of Mathematics 12(1), 2-7.
Kulm, G., Morris, K., & Grier, L. (2000). Project 2061 Appendix C – Methodology, from http://www.project2061.org/tools/textbook/matheval/appendx/appendc.htm.
Shield, M. J. (2005). Building a Methodology for the Comparison and Evaluation of Middle-Years Mathematics Textbook. In Clarkson, P. Downton, A, Gronn, D. Horne, M., McDonough, A., Pierce, R. & Roche, A. (Eds.). (2005). Proc. 28th Conf. of the Mathematics Education Research Group of Australiasia, (Vol 2. pp.680-687), Melbourn, AUSTRALIA: MERGA.
2006. In Novotná, J., Moraová, H., Krátká, M. & Stehlíková, N. (Eds.). Proceedings 30th Conference of the International Group for the Psychology of Mathematics Education, Vol. 4, pp. 49-56. Prague: PME. 4 - 49
MATHS, ICT AND PEDAGOGY: AN EXAMINATION OF EQUITABLE PRACTICE IN DIVERSE CONTEXTS
Stephen Lerman London South Bank
University, UK
Robyn Zevenbergen Griffith University,
Australia This paper explores the use of ICTs in the middle years of schooling where the tools have been used to support mathematics learning towards more equitable outcomes. Drawing on the productive pedagogies framework to analyze over 40 classrooms lessons, it was found that there were some aspects of pedagogy that were more evident than others. The results suggest that there may be some resistance to change pedagogy in mathematics classrooms in response to the potential of ICTs and to the call for improving achievement amongst traditionally failing students. The paper concludes by conjecturing as to why this may be the case.
PRODUCTIVE PEDAGOGIES AND NEW BASICS Recognising that there are critical issues facing schools and education, many education authorities see it as vital that reforms are enacted that will keep students in schools longer and prepare them for the changing world and workplace. As part of its goal to reform schools so as to make them more relevant and engaging for young people, Education Queensland has sought to develop a reform that embraces new forms of learning, curriculum and assessment that meet the needs of Australian society. As part of the process to inform such reform, the Education Department of Queensland undertook a major review of Queensland schools. Known as the Queensland Schools Longitudinal Reform Study (QSLRS) (1999), the project was undertaken over a period of three years with over 1000 classrooms being observed. All curriculum areas were considered. The brief of the review had been informed by the quality learning project emanating from the United States and lead by Newmann and colleagues (1996). Using a framework developed by Newmann and expanded by a team at the University of Queensland, it was found that that whilst teachers are very good at providing nice, friendly classrooms the intellectual quality was very low (QSLRS, 1999). In this framing, what is outstanding from the study is that mathematics was consistently ranked as one of the poorest taught areas in the curriculum. As a consequence of these findings, the government instigated wide changes which were lead by Prof Allan Luke who was seconded to the Department of Education to oversee the introduction of these reforms in 2000. Known as the New Basics the reform was, at first, restricted to 20 trial schools across the state with more coming on line the following year. However, many schools are now implementing the approach as it is a novel and engaging reform that appeals to teachers. Furthermore, most states in Australia have now taken up the reform in some guise or another. Due to the autonomy of each state in Australia, they have modified the
Lerman & Zevenbergen
4 - 50 PME30 — 2006
reform to make it unique to that particular state but the general premises of the reform can be seen in each state’s protocols. The New Basics are built on tripartite model which is based on Bernstein’s theoretical framework of curriculum, pedagogy and assessment (Education Queensland, 2006). The New Basics has New Basics as its basis to curriculum, productive pedagogies as the basis to pedagogy and Rich Tasks as the assessment tools. While each of these areas are important and integrally connected to each other, a description is beyond the scope of this paper. Of interest in this paper is the productive pedagogies component. This aspect of the reform was designed to provide a framework upon which to consider aspects of quality teaching practice. A brief overview of the framework is provided in Table One.
Productive Pedagogy Key question Higher order thinking Are higher order thinking and critical analysis
occurring? Deep knowledge Does the lesson cover operational fields in any
depth detail or level of specificity? Deep understanding Do the work and response of the students provide
evident of understanding concepts and ideas? Substantive conversation
Does the classroom talk break out of the initiation/response/evaluation pattern and lead to sustained dialogue between students, and between students and teachers?
Knowledge as problematic
Are students critiquing and second guessing texts, ideas, and knowledge?
Inte
llect
ual q
ualit
y
Metalanguage Are aspects of language, grammar and technical vocabulary being foregrounded?
Knowledge integration Does the lesson range across diverse fields, disciplines and paradigms?
Background knowledge Is there an attempt to connect with students’ background knowledge?
Connectedness to the world
Do lessons and assigned work have any resemblance or connection to real life contexts?
R
elev
ance
Problem based curriculum
Is there a focus on identifying and solving intellectual and/or real world problems?
Student control Do students have any say in the pace, direction or outcome of the lesson?
Supp
ortiv
e Sc
hool
Social support Is the classroom a socially supportive, positive environment?
Lerman & Zevenbergen
PME30 — 2006 4 - 51
Engagement Are students engaged and on-task Explicit Criteria Are criteria for student performance made
explicit? Self regulation Is the direction of students’ behaviour implicit
and self-regulatory? Cultural knowledges Are diverse knowledges brought into play? Inclusivity Are deliberate attempts made to increase
participation of all students from different backgrounds?
Narrative Is the teaching principally narrative or expository?
Group Identity Does teaching build a sense of community and identity?
Rec
ogni
tion
of d
iffer
ence
Citizenship Are attempts made to foster active citizenship?
Gore et al (2006) argue that the productive pedagogies framework is most useful as a tool for reflecting on practice. In this project we were seeking to identify a method through which we could examine the teaching practices of teachers as they used ICTs to support numeracy learning. To this end, we have employed the productive pedagogies framework to analyse a series of lesson conducted by a range of teachers across various sites in Queensland.
THE PROJECT - NUMERACY, EQUITY AND ICTS This is a three-year study in which the project explored the ways in which middle school teachers used ICTs to support mathematical learning. The overall study aimed to investigate: * How ICTs are used in maths classrooms to support numeracy learning * The out-of-school numeracy and ICT practices of students * Synergies/gaps between home and school numeracy and ICT practices * Elements of best practice that will help teachers to develop practices in schools when using ICTs that will support and enhance numeracy learning for students most at risk of failure in school numeracy and/or mathematics.Of interest to this paper is the first aim. The final aim was discussed by the authors elsewhere (Lerman & Zevenbergen, 2005). Drawing on the analysis conducted on the classrooms observed, we will link these outcomes with the final aim.
Lerman & Zevenbergen
4 - 52 PME30 — 2006
The Method Over the two years that data were collected in schools, a total of 8 schools participated in data collection. The schools were carefully selected using purposive sampling techniques. For the study, we were cognizant of representing the diversity in Australian schools. As such, the schools represented rural/remote and urban; a range of socio-economic background; indigenous and non-indigenous; high use of technology/reduced use of technology; and public and private schools. All schools were co-educational.
Teachers working in the middle years of schooling, that is the upper primary/lower secondary, were invited to participate in the study. An initial full-day workshop was conducted at which participants were provided with an overview of the project and professional development to support their use of ICTs in mathematics lessons. At a follow-up workshop in the following year, schools were provided with resources to use in the classroom as well as sharing time in which participants shared their learning from the project and the activities they had been undertaking in their classrooms.
Data were collected through the use of video cameras. Each school was provided with a camera, tripod and digital videos. In part this method was selected so as to enable considerable data to be collected and subjected to multiple analyses within the context that many of the schools were considerable distances from the University. In one case, the school was over 2000 kms from the University, the next most distant school was approximately 450 kms. As such, a method was needed that would enable some consistency in data collection. However, the method was not easy for teachers to implement. Consequently throughout the project, the research team would visit schools with the intention of supporting data collection. This was met with mixed success. In some cases, it was possible to video lessons, in other cases, despite the distance travelled by the research team the possibility to collect video data was hindered by the lack of lessons that used ICTs being undertaken in the schools.
Analysis While a number of analyses are being conducted on these videos, the focus of this paper is on the use of the productive pedagogies framework. We adopted the method used by the research team conducting the wide-scale longitudinal QSLRS project. The method involves 2-3 reviewers observing the lesson, in this case a video of the lesson. Independently they rate the dimensions of the productive pedagogies for overall evidence in a particular lesson. In our case, this involved one of us working with the research team in the initial lessons, and then the research team (3 research assistants) taking responsibility. From time to time, one of the researchers would work with the team to ensure that there was validity within the framework.
By focusing on the overall lesson the dimensions of the productive pedagogies become significant. For example, it may be the case that in the introduction to a lesson that the teacher uses a particular strategy (e.g. encouraging the students to
Lerman & Zevenbergen
PME30 — 2006 4 - 53
negotiate the task) but as the lesson gets under way it may be very teacher-directed. As such, the intent of the framework is to examine the overall emphasis of the lesson rather than elements of the lesson. At the completion of each lesson, the researchers independently rate the lesson on a 5-point scale where 0 means there was no evidence of a particular dimension of the scale whereas 5 indicates it was evident throughout the lesson. Once these ratings are completed, the team then must agree to a common score. This may require negotiation of meaning around a particular dimension and the degree to which they interpret the presence of a dimension. At the end of each observation, there is a commonly agreed upon score for each dimension of the framework.
RESULTS In presenting these data, we are only using the combined data set of all lessons from all schools. In doing this, our intention is to identify the presence of particular aspects of pedagogy in mathematics classrooms when teachers use ICTs to support student learning.
Dimension of Productive Pedagogy Mean SD Comment Depth of knowledge 1.64 1.36 Problem based curriculum 2.19 1.38 medium Meta language 1.69 1.07 Background knowledge 1.76 1.16 Knowledge integration 1.48 1.27 Connectedness to the world 1.38 1.44 Exposition 1.19 1.64 Narrative 0.31 0.78 low Description 2.24 1.02 medium Deep understanding 1.43 1.47 Knowledge as Problematic 1.14 1.47 Substantive conversation 1.26 1.40 Higher order thinking 1.31 1.55 Academic engagement 2.23 1.38 medium Student control 0.79 0.92 low Self regulation 3.24 1.12 high Active citizenship 0.30 0.78 low Explicit criteria 2.83 1.17 high
Lerman & Zevenbergen
4 - 54 PME30 — 2006
Inclusivity 0.33 0.75 low Social support 2.51 0.25 high
Table 2: Results of Productive Pedagogy Analysis The results in Table Two give some indication of the scoring of pedagogy when teachers used ICTs to support mathematical learning. While it was not possible to apply a reliable inferential statistical measure on these data, it is possible to note some trends. On a 5-point scale, scores below one included student direction, active citizenship, inclusivity and narrative. These aspects of productive pedagogies were consistently poorly attended to in the teaching of mathematics. This can also be seen in the low standard deviation measures suggesting that it was relatively common across all sites. In considering those aspects that scored above the midpoint (i.e. above 2.5) self regulation, explicit criteria and social support scored well. Just below the midpoint, also worthy of consideration, were problem-based curriculum; description; and academic engagement. Perhaps, for us, the most disconcerting aspect of these scores is the low scores for intellectual quality and relevance dimensions. Given the massive amount of work that has been undertaken in this reform as well as mathematics education more generally, these scores are alarming. However, they are not surprising since they are aligned with the scores obtained in the original QSLRS. DISCUSSIONThe key categorisation framework, but not the only one, that we wish to use here to discuss the results and their potential effect on students is that of Bernstein’s visible and invisible pedagogies. For Bernstein the dominant communicative principle in the classroom is the interactional which regulates ‘the selection, organisation, sequencing, criteria and pacing of communication (oral, written, visual) together with the position, posture and dress of communicants (Bernstein, 1990, p 34). The communicative principle offers recognition and realisation rules which need to be acquired by communicants in order to achieve ‘competence’. The framing of the pedagogic interactions can range from strong to weak. In the latter case the pedagogy is what Bernstein calls invisible, that is, means of gaining the approved discourse and being able to demonstrate the acquisition of that knowledge are hidden from the students. Middle-class children, however, have generally acquired these rules from their home life and are therefore not disadvantaged by the weak framing, whereas working class children have not and therefore find themselves in a position where they cannot demonstrate their knowledge. Research (e.g. Cooper and Dunne, 2000) shows that mathematics questions set in everyday contexts is a form of invisible pedagogy in that pupils who have not acquired the appropriate way to read such questions may find themselves responding in everyday mode and not the ‘esoteric’ school mathematics mode that is required. As teachers we tend to assume that pupils have picked up the correct reading in informal ways, and we are rarely explicit about those recognition and realisation rules. We know, however, that such classrooms fail most students for a range of reasons. In particular, if children cannot meet the requirements of reading, coping with the pacing of school discourse, and so
Lerman & Zevenbergen
PME30 — 2006 4 - 55
on, at the early stage of their entry into schooling they are likely to find themselves in an unending spiral of remedial situations, through which they are publicly identified and because of which they fall further and further behind (Bernstein, 2004, pp. 204/5). Research shows that working within a progressive paradigm, that is, where the pedagogy is invisible, but mitigating the weak framing through strengthening some of the features of the pedagogy can make a substantial difference to the success of disadvantaged students (e.g. Morais, Fontinhas & Neves, 1992). Looking at the outcomes of the productive pedagogy research the higher scores indicate both invisible pedagogy (self regulation) and aspects of visible pedagogy (explicit criteria). Potentially that can indicate pedagogical interactions that respond to popular calls for a reform curriculum mitigated by a strengthening of the framing that can assist students from traditionally failing social groups to acquire the rules they need to succeed in mathematics (Lerman & Zevenbergen, 2004). The low score on narrative, which is contrasted against an expository style of teaching, also indicates a strengthening of framing towards, in fact, a more traditional (in Bernstein’s terms, performance) mode. The scores just below the middle of problem-based curriculum seem to indicate the teachers’ compliance with the curriculum aspect of the New Basics in Queensland. The low score of student direction, however, appears to contradict the teachers’ use of explicit criteria. Teachers’ lack of awareness of the different needs of different social groups in terms of criteria may be reflected in the low score on inclusivity. We remind readers that all the lessons that were observed, video-taped and analysed using the productive pedagogies framework were ones in which the teachers were using ICTs. Of course there are many ways of using ICTs and not all of them enhance the learning of mathematics in the same way, or even at all (for further discussion of how teachers in the project were using ICTs see Zevenbergen & Lerman, 2005 and Zevenbergen, 2004). In conclusion we might observe that under the influence of New Basics in Queensland and mediated by teachers’ practices ICTs are being used and the framing of these classrooms may in fact offer the opportunity for successful learning by more students. We conjecture, however, that, without explicit awareness by teachers of the implications of different forms of pedagogy on different social groups the aims of the New Basics in terms of more equitable outcomes are not likely to be met. References Bernstein, B. (1990). The Structuring of Pedagogic Discourse, Class Codes and Control,
Vol. IV. London: Routledge. Bernstein, B. (2004). Social Class and Pedagogic Practice. In S.J. Ball (Ed.) The
RoutledgeFalmer Reader in Sociology of Education (pp. 196-217). London: RoutledgeFalmer
Cooper, B., & Dunne, M. (2000). Assessing Children's Mathematical Knowledge Buckingham, UK: Open University Press.
Lerman & Zevenbergen
4 - 56 PME30 — 2006
Education Queensland (2006). New Basics Project. http://education.qld.gov.au/corporate/newbasics. Accessed Jan 2, 2006.
Gore, J. Griffiths, T. & Ladwig, J. (2006). Productive Pedagogy as a Framework for Teacher Education: Towards Better Teaching http://www.aare.edu.au/01pap/gor01501.htm. Accessed Jan 9, 2005.
Lerman, S. & Zevenbergen, R. (2004). The Socio-Political Context of the Mathematics Classroom: Using Bernstein's Theoretical Framework to Understand Classroom Communications. In P. Valero & R. Zevenbergen (Eds.) Researching the socio-political dimensions of mathematics education: Issues of power in theory and methodology. (pp.27-42) Dordrecht: Kluwer
Morais, A., Fontinhas, F. and Neves, I.P. (1992). 'Recognition and realisation rules in acquiring school science: the contribution of pedagogy and the social background of pupils' British Journal of the Sociology of Education, 13,2 247-70
Newmann, F. M. and Associates. (1996). Authentic Achievement: Restructuring Schools for Intellectual Quality, San Francisco: Josey-Bass Publishers.
Queensland School Reform Longitudinal Study. (QSRLS) (1999). School Reform Longitudinal Study: Report, March 1999. St. Lucia: University of Queensland Graduate School of Education.
Zevenbergen, R. (2004). Researching numeracy teaching and learning with ICT: Facing the problems of innovation. In I.Putt, R. Faragher & M. McLean (Eds) Mathematics education for the third millennium: Proceeding of the 27th annual conference of the Mathematics Education Research Group of Australasia. (pp. 618-621). Townsville: MERGA.
Zevenbergen, R. & Lerman, S. (2005). Classroom Interactions: Scaffolding Students’ Learning with ICT. In M. Goos, C. Kanes & R. Brown (Eds.) Proceedings of the Fourth International Mathematics Education and Society Conference (pp. 340-350), Centre for Learning Research, Griffith University, Queensland, Australia.
2006. In Novotná, J., Moraová, H., Krátká, M. & Stehlíková, N. (Eds.). Proceedings 30th Conference of the International Group for the Psychology of Mathematics Education, Vol. 4, pp. 57-64. Prague: PME. 4 - 57
SOLVING PROBLEMS IN DIFFERENT WAYS: TEACHERS' KNOWLEDGE SITUATED IN PRACTICE
Anat Levav-Waynberg and Roza Leikin University of Haifa, Israel
This study is part of a larger longitudinal research concerned with teachers' knowledge development in the context of connecting tasks. We find this study important in the view of the existing gap between practice and theory of employing connecting tasks in school mathematics. In this paper we focus on the development of teachers' problem-solving performance as a result of systematic learning and their teaching practice associated with connecting tasks. This study is aimed to deepen our understanding of the role of both systematic (though learning) and craft (through teaching) teachers' knowledge development. We argue for the necessity of combining systematic and craft modes of development in teacher education.
THEORETICAL BACKGROUND Connecting tasks: The gap between theory and practice In this study a task is called a “multiple-solution connecting task” (connecting task for short) when it can be solved in different ways using: (a) different definitions or representations of a mathematical concept; (b) hierarchy, which is expressed in seeing an idea as a special case of a more general idea; (c) different mathematics tools and theorems from a particular mathematical topic; and (d) different mathematics tools and theorems from different branches of mathematics (Leikin Levav-Waynberg, Gurevich & Mednikov, 2006). Figure 1 presents an example of a connecting task in our study. The rational for the implementation of connecting tasks in school mathematics is rooted in the view that connections form an essential part of mathematical understanding (e.g., Skemp, 1987; Hiebert & Carpenter, 1992). One of the well recognized ways for developing connectedness of one’s mathematical knowledge is solving problems in different ways (e.g., House & Coxford, 1995; NCTM, 2000). Stigler and Hiebert (1999), showed that multiple solutions to problems increased the quality of mathematical lessons. Consequently, we consider integrating connecting tasks in one’s teaching practice critical for fostering the connectedness of students’ mathematical knowledge both by teaching students multiple solutions to problems and recognizing that in a class of students there are multiple ways in which pupils do solve problems. Despite the importance of implementing connecting tasks as stressed in the research literature, teachers seldom solve problems in different ways either for themselves or in their classes. Stigler and Hiebert (1999) as well as Ma (1999) showed that in US classrooms teachers rarely introduce their students to multiple-solution tasks. Our study has shown that Israeli teachers as well rarely employ connecting tasks
Levav-Waynberg & Leikin
4 - 58 PME30 — 2006
systematically in their classes (Leikin et al., 2006). We conjecture that this gap between theory and practice turns connecting tasks into the powerful environment for the development of teachers' knowledge.
Figure 1: Example of the task in the study
Teachers' knowledge In our study we address epistemological complexity of teacher's knowledge by integrating two well recognized theoretical perspectives on teachers’ knowledge (e.g., Shulman, 1986; Kennedy, 2002; for elaboration of the model see Leikin, 2006). We briefly explain two dimensions of teachers' knowledge in the context of connecting tasks. Dimension 1 'KINDS OF TEACHERS' KNOWLEDGE' is based on Shulman's (1986) components of knowledge: Teachers’ subject-matter knowledge (SMK) comprises their own knowledge of mathematical connections of different types, their ability to solve problems in multiple ways and to hold a rich collection of examples of connecting tasks. Along with Ma's (1999) definition of profound understanding of mathematics we consider problem solving in different ways as an integral part of teachers' subject matter knowledge. Teachers’ pedagogical content knowledge (PCK) includes knowledge of how students cope with connecting tasks, as well as knowledge of appropriate learning setting. Teachers’ curricular content knowledge includes knowledge of different types of curricula, connections between different curricular topics and understanding different approaches to teaching connecting tasks. Dimension 2 'SOURCES OF TEACHERS' KNOWLEDGE' is based on Kennedy's (2002) classification of teachers' knowledge according to the sources of its development: Teachers' craft knowledge related to connecting tasks is largely
Quadrilateral ABCD is inscribed in a circle. The diagonal AC is the diameter of the circle. The angle A is 60 degrees. We mark angle BAC as . Which values of give the maximal area of quadrilateral ABCD?
)(21
hhRSSS ADCABCABCD SABCD is maximal when h1+h2 is maximal Solution 1: Calculus-based solution of the minima-maxima problem:
30),2
3(cos321 Rhh ;
60)2
3sin(0)'( 21 hh
Solution 2: Properties of trigonometric functions cos )260( o =1 is the maximal value of the function 30
Solution 3: Geometric solution (circle properties) Segment BD is constant (cord BD is 120o) for all values of
Thus the two diagonals of the quadrilateral are constant. The area of such a quadrilateral is maximal when the diagonals are perpendicular: when the AC bisects angle BAD. Thus 30
Solution 4: Symmetry considerations Segment BD is constant. In a symmetric situation, BD is perpendicular to AC and the area of the quadrilateral equals 1/2BD·AC. If we break the symmetrical situation we decrease the sum of the heights (h1+h2) and therefore reduce the area of the quadrilateral. Thus 30 .
60o- 120o-2
2 R
R
A
B
C
D
h1
h2
Levav-Waynberg & Leikin
PME30 — 2006 4 - 59
developed through classroom experiences with connecting tasks. Systematic knowledge is acquired mainly through systematic studies of mathematics and pedagogy in colleges and universities. Prescriptive knowledge is acquired through institutional policies, which are transparent in tests, accountability systems, and texts of diverse nature. Along with Kennedy's definitions – we incorporate in our study two modes of teacher knowledge development: the systematic (through learning) mode and the craft (through teaching) mode. At the same time we acknowledge the irreducibility of the prescriptive sources into the process of knowledge development
THE STUDY
Our longitudinal study is based on Teacher Development Experiment (TDE: Simon, 2002) using interview and observation research methods. It is aimed at developing a model of Teachers' Knowledge Development (TKD) which describes and characterizes development of teachers' SMK and PCK in systematic and craft modes. For the analysis of the development of teacher systematic knowledge, during the first year of the study, we observed 12 secondary school mathematics teachers who volunteered to take part in a 56-hour professional development course focusing connecting tasks (Course A). Ten of them were interviewed before course (int-A) and all 12 teachers were interviewed at the end of the course (int-B). In order to analyze the development of teachers' craft knowledge the teachers were asked to teach connecting tasks in their classes during the second year of the intervention. Seven of the 12 teachers fulfilled this requirement and six of them further participated in the whole-group discussions focusing on teaching connecting tasks (Course B). Nine teachers were interviewed at the end of the second year of the research intervention (int-C). We report here data regarding five teachers who consistently took part in all the stages of the study. This sample is a representative of the whole group of teachers from the perspective of the teachers' educational background and teaching experience.
This paper is focused on the question: How does teachers' problem-solving performance change (a) in systematic (through learning) mode and (b) in craft (through teaching) mode? We demonstrate that teachers' problem-solving performance is situated in their practice of different kinds (Lave, 1996).
The mathematical problems in the interview: In order to answer research questions presented in this paper we asked teachers to solve problems in different ways. The problems in all three interviews were chosen based on the following considerations: (1) To explore teachers' subject matter knowledge problems should belong to different topics and include different types of connections. (2) To explore the sources of teachers' knowledge, some of the problems we used were solved in different ways in the textbooks (e.g., #1, Figure 2), others were not (##2, 3, 4, Figure 2). (3) To address the teachers’ curricular knowledge, some solutions to the problems belonged to the school curriculum and are often presented in the textbooks (e.g., prescribed solutions in Figure 2), whereas other solutions are rarely found in school textbooks (non-prescribed solutions in Figure 2).
Levav-Waynberg & Leikin
4 - 60 PME30 — 2006
# Problems Types of solutions: Connections Connecting task with Curricular-prescribed Multiple Solutions (CMS tasks) 1 Solve the system of equations:
6262
yxyx
Prescribed solutions: Substitution, linear combination, graphing.
Non-prescribed solutions: Symmetry, matrices
Different representations, techniques, topics in algebra, fields in mathematics
Connecting tasks with no curricular-prescribed (Unconventional) Multiple Solutions (UMS tasks) 2 Max-Min Problem
(see Problem 1 – Figure 1) Prescribed solution:
Solution 1, Figure 1 Non-prescribed solutions:
Solutions 2, 3, 4 – Figure 1
Different fields in mathematics, different properties of mathematical objects.
3 Word (motion) problem Dan and Moshe walk from the train station to the hotel. They start out at the same time. Dan walks half the time at speed v1and half the time at speed v2. Moshe walks half way at speed v1 and half way at speed v2. Who gets to the hotel first: Dan or Moshe?
4 Geometry problem In an isosceles trapezoid ABCD the diagonals are perpendicular. Prove that the height of the trapezoid equals its midline.
Prescribed solution: Midline in a trapezoid theorem and right-angle isosceles triangle
Non-prescribed solution: Four midlines in the quadrilateral theorem and diagonals in a square
Different concepts, theorems and definitions
Figure 2: Examples of mathematical problems used in the interviews As mentioned earlier, to simplify the presentation of the results we show only the data related to 5 teachers who equally participated in all the stages of the intervention. Our report focuses on 4 types of tasks, which were included in all the three interviews (see Figure 2). RESULTS Knowledge situated in practice Table 1 summarizes teachers' problem-solving performance with different types of tasks in the three interviews. Curricular orientation of teachers' SMK Data from int-A show that teachers' reasoning was pretty much curricular-prescribed. We draw this conclusion from the analysis of the number and the nature of the solutions the teachers gave for the problems of different kinds in int-A. For the system of equations (CMS task, Figure 2) most of the teachers gave three different solutions all of which were curriculum-prescribed. In contrast, for UMS tasks in most of the cases the teachers suggested only one solution, which matched the place in the
Levav-Waynberg & Leikin
PME30 — 2006 4 - 61
textbook where the task appeared. Clearly the teachers had difficulties in suggesting multiple solutions for UMS tasks. For example, T2 expressed this difficulty in thinking about a different solution when solving a minima-maxima problem (presented in Figure 1).
Interviewer: [After presentation of calculus-based solution] Can you, please, think of another solution?
T2: I don’t know, because of the word "maximal". I keep thinking about the derivative. I have never thought about this type of problems from a different perspective.
Table 1: Teachers' problem-solving performance on Connecting tasks
Inte
rvie
w
Type of
task
The task T1 T2 T3 T4 T5
Ave
rage
no
of
solu
tions
pe
r tea
cher
Tota
l no
of
diff
eren
t so
lutio
n gi
ven
by
CMS System of linear equations 3 2 3 3 3 2.8 5 Min-Max problem 2* 1 2* 1 0 1.2 2 Word (motion) problem 1 1 1 2* 0 1 2 UMS Geometry 2 1 1 0 0 0.8 2
A
Average no of solutions per problem 2 1.25 1.5 1.5 0.75 1.45 CMS Simple quadratic inequality 6** 3 6** 3 3 4.2 7
Min-Max problem 3** 3** 3** 2* 2** 2.6 4 Word (motion) problem 3** 2 2 3** 4* 2.8 5 UMS Geometry 2 2 2 1 2 1.8 3
B
Average no of solutions per problem 3.5 2.5 3.25 2.25 2.75 2.85 CMS Absolute value inequality 3 3 3 3 2 2.8 5
Min-Max problem 3 5* 4** 2* 0 2.8 6 Word (work) problem 1 3 2 3* 1 2 7 UMS Geometry 3 3 4 3 2 3 5
C
Average no of solutions per problem 2.5 3.5 3.25 2.75 1.25 2.65 * - non-prescribed solution
the teacher taught tasks of this kind during the 2nd year of experiment according to the curriculum the tasks of this kind was incorporated in teaching as multiple-solution connecting tasks during the 2nd year of experiment
Another evidence for the curricular-prescribed nature of teachers' knowledge in the field of connecting tasks may be seen in T3's reply to the maxima-minima problem (see Figure 1). After suggesting calculus-based solution for this problem, when stimulated by the interviewer, this teacher intuitively suggested symmetry-based solution. However, she considered this solution mathematically insufficient. In her opinion it was a tool for the development of [students’] intuition rather than formal mathematical proof:
T3: If I increased till it's 60 degrees then I lose the quadrilateral and get a triangle. One triangle of 30, 60, 90 … so the area of the reduced quadrilateral is 32R . It's the same situation if I decrease to zero. But if I keep the "intermediate" situation I get two triangles with the area of 32R . Intuitively it's the best situation…
Many times you see something intuitively but you can't prove it, but then you are in a much better position than someone who can't see it intuitively… If you succeed in proving what you are seeing, you prove the problem.
Levav-Waynberg & Leikin
4 - 62 PME30 — 2006
Two other teachers who suggested non-prescribed solutions (T1 and T4, Table 1: int-A) clearly indicated systematic sources for these solutions: T1 suggested symmetry-based solution for maxima-minima problem as learned in a teacher-development workshop while T4 suggested graphical solution for a word problem as studied in the teacher certificate program she had recently completed. Nonetheless, in general, the data from int-A demonstrates that teachers had hardly met different approaches to solving problems in systematic framework before their participation in our study. Knowledge situated in problem-solving practice Analysis of teachers' learning in systematic mode was performed by comparison between teachers' solutions in int-A and int-B as well as the analysis of teachers' problem-solving discourse during the course. We found that (rather naturally) the teachers significantly improved their performance on connecting tasks through their participation in course A: The number of solutions they gave to all the problems as well as the number of non-prescribed solutions they suggested increased. This is evident from the study of each teacher’s and the whole group’s performance (see Table 1). On the average there were twice as many solutions per problem per teacher provided in int-B as solutions provided in int-A (2.85 vs. 1.45). For the CMS task in int-B the teachers provided 7 different solutions, some of which non-prescribed (T1 and T3). We observed changes in teachers' reaction to the request to find multiple solutions: the replies became more fluent and positive. This change is evident in T2's reply when solving max-min problem during int-B. In contrast to her response in int-A (as shown earlier) after the course she enjoyed having several ideas for approaching a problem of this kind:
T2: It's not the only way [using derivative]… we may build a table and show the students that moving the X from 1 to 5 increases the area and then it starts to decrease. This is a quadratic function, so the principle of continuity should work here. We can also find the minimal point of a parabola without using the derivative… If x=0 then we get 100, and of x=10 then we also get 100. It gets the largest value in the two edges. It is not just the largest but equal. This is parabola. Then because of the symmetry axis it has to be in the middle: 5. Oh it's beautiful!
We argue that through their participation in the course the teachers developed both their "feeling of different solutions" and positive position with respect to this kind of mathematical activities, they became more creative and confident. After participation in our course all the teachers provided multiple solutions for all the problems (except T4 for geometry problem) and each teacher suggested non-prescribed solutions for at least two problems in the interview. Knowledge situated in teaching The number of solutions suggested per problem by each teacher changed from average of 4.2 in int-B to 2.8 in int-C, and the number of non-curricular solutions also decreased. We found clear relationship between the teachers' problem-solving performance in int-C and the topics they taught during the period of time between interviews B and C in general and the incorporation of the connecting tasks in their lessons in particular.
Levav-Waynberg & Leikin
PME30 — 2006 4 - 63
All the teachers taught CMS task (Table 1: int. C, absolute value inequality) between the int-B and int-C. We learned that when teachers taught this task they used curricular-prescribed solutions only. This practice was reflected in teachers’ solutions during the interviews: all the teachers suggested curricular prescribed multiple solutions for the CMS task. Analysis of teachers' problem solving performance on UMS tasks revealed several phenomena: First we saw that teachers improved their results from int-B to int-C on the tasks that were incorporated in teaching as multiple-solution connecting tasks (e.g., Table 1: T2 and T3 on min-max problem; T1 on geometric problem). Moreover, non-prescribed solutions suggested by the teachers during int-C appeared for this kind of task in most cases. Second, teachers at least maintained their previous success on UMS tasks, which they did teach without special attention to multiple solutions (e.g., Table 1: T1 on min-max problem, T2 and T3 for word problem). Teachers' problem solving performance on UMS tasks that belonged to the topics that teachers did not teach during the year in many cases wasn’t as good as it appeared in int-B (e.g., Table 1: T1 on word problem, T5 on min-max and word problem). A specific tendency was found for geometric problems. All the teachers, except T2, taught geometry problems during the year. For all the teachers the number of solutions they suggested for geometric problems increased. We connect this phenomena with the fact that the teachers (according to their multiple reports at the end of course A and in int. B) became more attentive to students' solutions, started collecting them and allowed students "always present all the solutions they found" without saying "this is good but we do not have enough time". We hypothesize that this combination of awareness and flexibility allowed teachers learn multiple solutions in geometry from their students.
DISCUSSION AND CONCLUSIONS By analyzing teachers' knowledge at the beginning of the intervention we suggest some explanations for the gap between theory and practice in the field of connecting tasks: We find teachers' mathematical and pedagogical knowledge of connecting tasks curricular oriented and prescribed. Our data demonstrates that teachers associate responsibility for the success of their students with institutional policies, which are evident in the tests system that "proscribes" implementation of connecting tasks in school. On the positive side we show that implementation of connecting tasks in systematic mode meaningfully develops teachers' SMK and their problem-solving performance on multiple-solution connecting tasks with further improvement in craft mode whereas implementation in teaching is a necessary condition for the maintenance of this development. In this way our analysis highlights the situatedness of teachers' knowledge (Lave, 1996). Based on this study results we argue that combination of the systematic and craft mode are most effective for teachers’ knowledge development. The development of the related instructional materials by curricular designers and mathematics educators as well as curricular changes may foster changes in teachers' disposition towards multiple-solution connecting tasks.
Levav-Waynberg & Leikin
4 - 64 PME30 — 2006
References: Hiebert, J. & Carpenter, T. P. (1992). Learning and Teaching with Understanding. In D. A.
Grouws (Ed.): Handbook of research on mathematics teaching and learning (pp. 65-97). New York, NY: Macmillan.
House, P.A. & Coxford, A. F. (1995). Connecting Mathematics across the Curriculum: 1995 Yearbook. Reston, Va.: NCTM.
Kennedy, M. M. (2002). Knowledge and teaching. Teacher and Teaching: theory and practice, 8, 355-370
Lave, J. (1996). Teaching, as learning, in practice. Mind, Culture & Activity, 3 (3), 149-164. Leikin, R. (2006). Learning by teaching: The case of Sieve of Eratosthenes and one
elementary school teacher. In R. Zazkis & S. Campbell (Eds.), Number Theory in Mathematics Education: Perspectives and Prospects. (pp. 115-140). Mahwah, NJ: Erlbaum.
Leikin, R., Levav-Waynberg, A., Gurevich, I, & Mednikov, L. (2006). Implementation of multiple solution connecting tasks: Do students’ attitudes support teachers’ reluctance? FOCUS on Learning Problems in Mathematics, 28,1-22.
Ma L. (1999). Knowing and teaching elementary mathematics: Teacher’s understanding of fundamental mathematics in China and the United States. Hillsdale, New Jersey: Lawrence Erlbaum Associates.
National Council of Teachers of Mathematics. (NCTM) (2000). Principles and standards for school mathematics. Reston, VA: NCTM.
Shulman, L. S. (1986). Those who understand: Knowing growth in teaching. Educational Researcher. 5 (2), 4-14.
Simon, M. A. (2000). Research on the development of mathematics teachers: The Teacher Development Experiment. In A. E. Kelly & R. A. Lesh (Eds.), Research design in mathematics and science education. (pp. 335- 359). New Jersey: Lawrence Erlbaum Associates.
Skemp, R. R. (1987). The psychology of learning mathematics. Lawrence Erlbaum Associates, Publishers: Hillsdale, NJ.
Stigler J. W., & Hiebert J. (1999). The teaching gap: Best ideas from the world’s teachers for improving education in the classroom. New York: The Free Press.
2006. In Novotná, J., Moraová, H., Krátká, M. & Stehlíková, N. (Eds.). Proceedings 30th Conference of the International Group for the Psychology of Mathematics Education, Vol. 4, pp. 65-72. Prague: PME. 4 - 65
PERSONA-BASED JOURNALING: ALLIGNING THE PRODUCT WITH THE PROCESS
Peter Liljedahl
Simon Fraser University, Canada
Students' problem solving experiences are fraught with failed attempts, wrong turns, and progress that move in fits and jerks, oscillating between periods of inactivity, stalled progress, rapid advancement, and epiphanies. Students' problem solving journals do not always reflect this rather organic process, however. Without proper guidance some students tend to 'smooth' out their experiences and produce journals that are less reflective of the process and more representative of their product. In this article I present research on the effectiveness of a persona-based framework for guiding students' journaling to more accurately reflect the erratic to-and-fro of the problem solving process. Results indicate that the framework is effective in producing more representative journals.
For mathematicians, problem solving is a process that incorporates not only the logical processes of inductive and deductive reasoning, but also the extra-logical processes of creativity, intuition, imagination, insight, and illumination (Dewey, 1938; Fischbein, 1987; Hadamard, 1945; Poincaré, 1952). However, as creative a process as problem solving may be, the results of these processes are "encoded in a linear textual format born out of the logical formalist practice that now dominates mathematics" (Borwein & Jörgenson, 2001). This discordance between the process of problem solving and the presentation of its products is nicely summarized in the comments of Dan J. Kleitman, a prominent research mathematician.
In working on this problem and in general, mathematicians wander in a fog not knowing what approach or idea will work, or if indeed any idea will, until by good luck, perhaps some novel ideas, perhaps some old approaches, conquer the problem. Mathematicians, in short, typically somewhat lost and bewildered most of the time that they are working on a problem. Once they find solutions, they also have the task of checking that their ideas really work, and that of writing them up, but these are routine, unless (as often happens) they uncover minor errors and imperfections that produce more fog and require more work. What mathematicians write thus bears little resemblance to what they do: they are like people lost in mazes who only describe their escape routes never their travails inside. (Liljedahl, 2004, p. 157)
The discordance between process and product, however, is not a dilemma that is restricted to the domain of professional mathematicians. Students of mathematics also have a difficult time breaking away from the formalist practices of conventions as delivered to them in the form of curriculum, textbooks, and classroom instruction.
Liljedahl
4 - 66 PME30 — 2006
JOURNALING Journal writing in mathematics education has a long and diverse history of use. Journaling helps students learn mathematical concepts (c.f. Chapman, 1996; Ciochine & Polivka, 1997; Dougherty, 1996). It has been shown to be an effective tool for facilitating reflection among students (c.f. Mewborn, 1999) as well as an effective communicative tool between students and teachers (c.f. Burns & Silbey, 2001). Journaling has also become an accepted method for qualitative researchers to gain insights into their participants' thinking (c.f. Mewborn, 1999; Miller, 1992). This is especially true of problem solving journals, which can allow the researcher to enter into the otherwise private world of problem solving. In order for this to be effective, however, the problem solving journals need to be representative of the problem solving process. This is not always the case. Students' problem solving experiences are fraught with failed attempts, wrong turns, and progress that move in fits and jerks, oscillating between periods of inactivity, stalled progress, rapid advancement, and epiphanies. Without proper guidance students may tend to 'smooth' out these experiences and, as a result, present stories in their journals that are less reflective of ttheir 'travails inside the maze' and more representative of their 'escape route'. A MODEL FOR A MORE STRUCTURED METHOD OF JOURNALING As mentioned above, literature that detail mathematician's problem solving efforts is unrepresentative of the true process of 'doing' mathematics. One rare exception to this is an account written by Douglas R. Hofstadter called Discovery and Dissection of a Geometric Gem (1996) that tells the story of a mathematical discovery with amazing sincerity. It is detailed and complete, from initiation to verification. It tells the story of being lost in a maze, searching for answers, and in a flash of insight, finding the path out. Perhaps the reason that the account is so different is that Hofstadter is not a professional mathematician. He is a college professor of cognitive science and computer science, and an adjunct professor of history and philosophy of science, philosophy, comparative literature, and psychology. As such, he has a unique appreciation for tracking his own problem solving processes. In analysing Hofstadter's account it becomes clear that one of the reasons that it is so sincere is because of the way in which he incorporates the use of three different personas, a trinity of voices, in telling his tale. I have come to name these personas the narrator, the mathematician, and the participant. These personas are not explicit in Hofstadter's writing in that he does not introduce them, annotate them, or even acknowledge them. Instead they are implicit, emerging from the active analysis of his writing more so than from the passive reading of his chapter. Each of these personas contributes to the anecdotal account in a different way. The narrator moves the story along. As such, he often uses language that is rich in temporal phrases: 'and then', or 'I started'. He also fills in details of the non-mathematical variety seemingly for the purpose of providing context and engaging content. The mathematician is the persona that provides the reasoning and the rational underpinnings for why the mathematics behind the whole process is not only valid, but also worthy of discussion. Finally, the
Liljedahl
PME30 — 2006 4 - 67
participant speaks in the voice of real-time. This persona reveals the emotions and the thoughts that are occurring to Hofstadter as he is experiencing the phenomenon. To demonstrate these personas, I present a portion of the chapter that contains within it all three voices. Before I do, however, it would be useful to introduce the general context of his mathematical encounter. At the time of writing the chapter, Hofstadter has only recently come to be impassioned with Euclidean geometry and had never been introduced to the Euler line of a triangle. When he did learn about it, however, two things immediately struck him: the connectivity of seemingly different attributes, and the exclusion of the incentre. So, he began a journey of trying to find a connection between the Euler line and the incentre. At the point in the passage presented below Hofstadter has just discovered something about the incentre.
One day I made a little discovery of my own, which can be stated in the following picturesque way: If you are standing at the vertex and you swing your gaze from the circumference to the orthocentre, then, when your head has rotated exactly halfway between them, you will be staring at the incentre. More formally, the bisector of the angle formed by two lines joining a given vertex with the circumcentre and with the orthocentre passes through the incentre. (A more technical way of characterizing this property is to say that O and H are "isogonic conjugates".) It wasn't too hard to prove this, luckily. This discovery, which I knew must be as old as the hills, was a relief to me, since it somehow put the incentre back in the same league as the points I felt it deserved to be playing with. Even so, it didn't seem to play nearly as "central" a role as I felt it merited, and I was still a bit disturbed by this imbalance, almost an injustice.
(Hofstadter, 1996, p. 4)
O
H
I
Figure 1: Triangle with Incentre, Orthocentre, and Circumcentre
Even from this brief excerpt it can be seen how the three personas interact with each other, while at the same time presenting different aspects of the mathematical experience. It begins with "One day …", a clear indicator that the narrator will be speaking.
One day I made a little discovery of my own, which can be stated in the following picturesque way: If you are standing at the vertex and you swing your gaze from the circumference to the orthocentre, then, when your head has rotated exactly halfway between them, you will be staring at the incentre.
Liljedahl
4 - 68 PME30 — 2006
Hofstadter is telling us what he has found in an informal yet descriptive way. This is followed by his mathematician persona coming in and formalising this finding in a more precise and mathematical way.
More formally, the bisector of the angle formed by two lines joining a given vertex with the circumcentre and with the orthocentre passes through the incentre. (A more technical way of characterizing this property is to say that O and H are "isogonic conjugates".) It wasn't too hard to prove this, luckily.
Finally, the participant reveals how he feels about his finding and what thoughts this find is precipitating.
This discovery, which I knew must be as old as the hills, was a relief to me, since it somehow put the incentre back in the same league as the points I felt it deserved to be playing with. Even so, it didn't seem to play nearly as "central" a role as I felt it merited, and I was still a bit disturbed by this imbalance, almost an injustice.
The interplay present in this passage is typical of the first six pages of Hofstadter's chapter. At that point in the account Hofstadter makes a profound discovery, which is revealed in his last use of the participant's voice. After this point there is a brief interplay between the narrator and the mathematician and then the voice of the narrator also disappears. The last seven pages of the chapter are comprised of the mathematician articulating and proving his discovery. As mentioned above, the three personas that exist within Hofstadter's writing emerge through the descriptive analysis of his chapter1, rather from any prescriptive declaration of intent. This, however, does not prevent one from turning the description analysis of this piece of text into a prescriptive method for writing.
METHODOLOGY Participants for this study are drawn from two different offerings of an elementary mathematics methods course (Designs for Learning Mathematics: Elementary) and two different offerings of a secondary mathematics methods course (Designs for Learning Mathematics: Secondary) taught by the author in two consecutive years. Each of the courses ran for 13 weeks, with weekly four hour classes. During all four offerings of the course the participants were immersed into a problem solving environment. That is, problems were used as a way to introduce concepts in mathematics, mathematics teaching, and mathematics learning. There were problems that were assigned to be worked on in class, as homework, and as a project. Each participant worked on these problems within the context of a group, but these groups were not rigid, and as the weeks passed the class became a very fluid and cohesive entity that tended to work on problems as a collective whole. Communication and interaction between participants was frequent and whole class discussions with the instructor were open and frank.
1 Andrew Waywood (1992) found very similar voices in the journals of year 11 mathematics students. He identified them as the recount, summary, and dialogue.
Liljedahl
PME30 — 2006 4 - 69
Throughout the course the participants kept problem solving journal in which they recorded their problem solving processes. In one of the elementary methods courses (E1, n=34) and one of the secondary methods courses (S1, n=39) instructions regarding problem solving journals were built around an insistence that the journals should reflect the problem solving process. This was reiterated through a series of discussions on the non-linear, and collaborative, nature of problem solving. In the second elementary methods course (E2, n=39) and the second secondary methods course (S2, n=36) instructions regarding problem solving journals were specifically focused on using personas in their writing. This was done over a period of four lessons, having students work on three different problems. In the first lesson the first problem was to be solved and using as precise a mathematical language as possible, with a focus on logic, and ONLY the solution was to be written up (the voice of the mathematician). The second problem was to be solved, but only the story of how they arrived at the solution was arrived at was to be written up (the voice of the narrator). The third problem was to be attempted, but only the feelings they experienced in attempting the problem were to be documented and subsequently presented (the voice of the participant). During the fourth class these three journaling styles were discussed and the STUDENTS proposed that they should be allowed to use all three voices in their journaling. This proposal was then formalized with an introduction to the three personas; the mathematician, the narrator, and the participant. From that point forth it was explained that they were to write the remainder of their problem solving journals using the voices of all three personas. No specifications were made as to how these voices were to be integrated, or what proportions of voices were to be used. All the participants submitted their problem solving journals for marking in week nine or ten of the course. These journals were not returned until the end of the course. The Data Aside form the problem solving journals, all the participants in this study were also asked to keep a reflective journal in which they responded to assigned prompts. These prompts varied from invitations to think about assessment to instructions to comment on curriculum. One set of prompts, given in week 11 or 12 of the course, were used to have them reflect on some of their problem solving experiences. These prompts were:
Reflect on your own problem solving process. (1) How do you go about solving problems? (2) Does it always work, if so how often? (3) For which problems in this course did this process work? (4) For which didn't it, and what was it about those problems that made it so it didn't work?
The reflective journals were submitted in week 13 of the course. Analysis With both the problem solving journals and the reflective journals in hand an analysis was done for each participant in which reflections on their problem solving processes
Liljedahl
4 - 70 PME30 — 2006
(see prompt 3 and 4 above) were compared to their relevant problem solving journals. In particular, I was looking to see if their after-the-fact reflections of specific processes (as presented in their reflective journals) correlated with their in-the-moments documentation of problem solving processes (as presented in their problem solving journals).
RESULTS
Given the significant difference in the nature of the participants enrolled in elementary version from the participants enrolled in the secondary version of the course, the results have been disaggregated accordingly.
Comparison of E1 and E2
In general, participants enrolled in the elementary methods courses are quite adept at, and equally receptive to, journaling. There are many possible reasons for this, foremost of which is that they have experience with undergraduate course in which writing in general, and journaling in particular, are more common. This includes their requisite enrolment in a Foundations of Mathematics for Elementary School Teachers course in which there is always a problem solving journal assignment.
E1 (n=34)
E2 (n=39)
Number of participants whose reflective journals correlated with their problem solving journals.
24
33
Percentage of participants whose reflective journals correlated with their problem solving journals.
70%
85%
Table 1: Correlation comparison between E1 and E2
Notwithstanding this comfort with journaling, the aforementioned analysis still revealed a difference between the two groups. This difference is presented in Table 1. Although not remarkable, the results indicate greater correlation in the E2 group. At a more qualitative level, however, the difference between the two groups' problem solving journals is quite remarkable. The E2 group produced journals much richer in descriptions of the extra-logical (Dewey, 1938) processes of mathematics, such as instances of insight, intuition, and aesthetic sensitivities. These problem solving journals were also much more reflective of the social and collaborative nature of the problem solving process encouraged in class.
Liljedahl
PME30 — 2006 4 - 71
Comparison of S1 and S2 Participants enrolled in the S1 and S2 course offerings, by the very nature of the course, tended to have more courses in undergraduate mathematics. As such, they had more exposure to a culture of presenting mathematical work logically, rather than chronologically. The result of this exposure has, in the past, been reflected in their problem solving journal writings. This was very much the case for the S1 group. Their problem solving journals were more reflective of an after-the-fact reorganization of what they have found into a mathematically sound explanation, rather than an in-the-moment description of their process. Their only deviation from this was in response to my insistence that they "tell me the story of how they solved the problem". This, more often than not, resulted in an overlay of narration on top of their logically organized solution.
S1 (n=39)
S2 (n=36)
Number of participants whose reflective journals correlated with their problem solving journals.
14
26
Percentage of participants whose reflective journals correlated with their problem solving journals.
36%
72%
Table 2: Correlation comparison between S1 and S2 However, this propensity to write logically, rather than chronologically, was overcome through the use of the more structured persona-based framework. The results, presented in Table 2 show the significant difference in correlation between the two groups. Like the E2 group (above) the descriptions of problem solving processes of the S2 group was also much richer, including both the extra-logical and the social aspects of problem solving. CONCLUSIONS The person-based framework for structuring the writing problem solving journals proved to be very effective in producing journals that correlated well with the participants' reflections on their problem solving processes. This effectiveness was most noticeable visible within preservice secondary mathematics teachers. For both elementary and secondary preservice teachers, however, the persona-based framework facilitated the production of richer descriptions of problem solving processes. As such, this method of journaling shows great potential as a qualitative instrument for capturing some of the less visible aspects of problem solving, such as: insight, intuition, and aesthetics. More research is needed in order to determine to what extent this form of journaling can be developed within students, to what extent it contributes to the meta-cognitive
Liljedahl
4 - 72 PME30 — 2006
processes of problem solving, and to what extent it is able to accurately represent the extra-logical aspects of problem solving. References Borwein, P., & Jörgenson, L. (2001). Visible structures in number theory. MAA Monthly,
2001(February). Burns, M. & Silbey, R. (2001). Math journals boost real learning. Instructor, 110(7), 18-20. Chapman, K. (1996). Journals: Pathways to thinking in second-year algebra. The
Mathematics Teacher, 89(7), 588-590. Ciochine, J., & Polivka, G. (1997). The missing link? Writing in mathematics class!
Mathematics Teaching in the Middle School, 2(5), 316-320. Dewey, J. (1938). Logic: The theory of inquiry. New York, NY: Henry Holt and Company. Dougherty, B. (1996). The write way: A look at journal writing in first-year algebra. The
Mathematics Teacher, 89(7), 556-560. Fischbein, E. (1987). Intuition in science and mathematics: An educational approach.
Dordrecht, Holland: Kluwer Academic Publishers Group. Hadamard, J. (1945). The psychology of invention in the mathematical field. New York,
NY: Dover Publications. Hofstadter, D. (1996). Discovery and dissection of a geometric gem. In J. King & D.
Schattschneider (Eds.), Geometry turned On: Dynamic Software in Learning, Teaching, and Research. Washington, pp. 3-14. DC: The Mathematical Association of America.
Liljedahl, P. (2004). The AHA! experience: Mathematical contexts, pedagogical implications. Doctoral Dissertation, Simon Fraser University, 2004.
Mewborn, D. (1999). Reflective thingking among preservice elementary mathematics teachers. Journal for Research in Mathematics Education, 30(3), 316-341.
Miller, L. (1992). Teacher benefit from using impromptu writing in algebra classes. Journal of Mathematics Teacher Education, 23(4), 329-340.
Poincaré, H. (1952). Science and method. New York, NY: Dover Publications, Inc. Waywood, A. (1992). Journal writing and learning mathematics. For the Learning of
Mathematics, 12(2), 34-43.
2006. In Novotná, J., Moraová, H., Krátká, M. & Stehlíková, N. (Eds.). Proceedings 30th Conference of the International Group for the Psychology of Mathematics Education, Vol. 4, pp. 73-80. Prague: PME. 4 - 73
THE POWER OF GOAL ORIENTATION IN PREDICTING STUDENT MATHEMATICS ACHIEVEMENT
Chuan-Ju Lin*), Pi-Hsia Hung*), Suwei Lin**) *) National University of Tainan, Taiwan
**) National Hualien University of Education, Taiwan The purpose of this study is to investigate the relationships between student achievement in mathematics, and student social economic status (SES) and goal orientation. The data used in this study is derived from 2005 TASA-MA pilot testing for the sixth-grade students. The result suggested that the better performance in mathematics tended to be associated with higher SES and more mastery-oriented goal orientation. SES factor accounts for 3.3% of the variance, and student goal orientation accounts for additional 11% of the variance. The major implication obtained from this study is that goal orientation is much more significant than SES in predicting student performance in mathematics.
INTRODUCTION To ensure students�’ readiness for meeting the future challenges, many education systems periodically evaluate student learning. The national depiction can be extended and enriched through comparative international analyses. In respond to the trend of international comparative analyses and the need of education statistics, Taiwan has been participating in several projects of comparative international analyses, and furthermore, the construction of the national database of education statistics in Taiwan is being implemented. For example, National Academic for Educational Research Preparatory Office recently devotes great amount of resources to collection of Taiwan educational statistics based on the new mathematics curriculum standards, and plan to establish the database of Taiwan Assessment of Student Achievement (i.e., TASA). Mathematics is one of the five subjects being assessed, also the focus of this paper, and the corresponding assessment is named TASA-MA. In addition to assessing cognitive performance, TASA-MA collects information about students�’ beliefs to help depict student achievement in context. Students�’ beliefs could be developed within the mathematics learning process in the school system, or influenced by motivation. Recently, most researchers tend to postulate motivational achievement goal theory for its providing more appropriate reasons for an individual to engage in a learning situation (Covinton, 2000; Pintrich & Schunk, 1996; Pintrich, 2000; Elliot, 1999). Various motivational goals that learners endorse may have different impacts on student achievement performance. Learners with mastery goals would tend to appreciate the learning task and work hard to master it, while those with performance goals would wish to outperform others (Ames, 1992; Covinton, 2000; Pintrich & Schunk, 1996).
Lin, Hung & Lin
4 - 74 PME30 �— 2006
The purpose of this study is to investigate the relationships between student achievement in mathematics, and student social economic status (SES) and goal orientation. SES was found to be highly correlated with students' mathematics achievement in several international comparative studies, but we hardly can do anything about SES to improve students�’ achievement. However, the way students�’ orient themselves to mathematics tasks is a strong indicator of their engagement and performance. The focus on the students�’ beliefs and how these orientations related to their learning could be the first step to show our willingness to negotiate with our students and grant them autonomy. Accordingly, we would like to examine, with the effect of SES removed, the predictive power of goal orientation on student mathematics achievement. The Assessment of Competencies Assessment-Content Specifications for Pilot Test. Table 1 presents the framework of mathematics assessment used for the 2005 TASA-MA pilot test. The item pool for the assessment includes 114 multiple-choice items and 26 constructed-response items. The percentage of items also indicates the percentage of instruction time suggested.
Content Multiple choice
Constructed response
Total (column %)
Number properties and operations 57 6 45%
Measurement 23 5 20%
Geometry 23 5 20%
Data analysis and probability 2 5 5%
Algebra 9 5 10%
Total number of items 114 26 100%
Table 1: Content Specification for TASA-MA Pilot Test Time. In the 2005 TASA-MA pilot test, two types of instruments were used to collect data about students. Each examinee received an assessment booklet containing mathematics cognitive questions, and a background questionnaire. The cognitive test requires 60 minutes, and the background questionnaire requires 5 minutes of testing time afterwards. Task Type. For the cognitive testing, all items in the pool were clustered into 13 blocks. The 13 blocks of mathematics items were assembled into 26 booklets using balanced incomplete block (BIB) design. Each booklet consisted of 3 item blocks, and thereby 24 multiple-choice and 3 constructed-response items.
Lin, Hung & Lin
PME30 �— 2006 4 - 75
From the background questionnaire, we identified two demographic variables (i.e., fathers�’ and mothers�’ highest levels of education), and one learning experience variable (i.e., goal orientation) as predictor variables. Four education levels were defined in the questionnaires, and students were asked to check the appropriate boxes for their parents�’ highest education levels. In addition, four types of goal orientation were specified according to the responses of the 6 goal-orientation items specific to this mathematics assessment in the questionnaires. Sample Questions. For illustration purpose, a multiple-choice and a constructed response items, and a goal-orientation items are presented in the following section. C1. Figure 1 is a poster. The poster is 40 cm in length and 30 cm in width. Allen wants to enlarge the poster to have a length of 60 cm (see Figure 2). If Allen wants to keep the proportion invariable, what will be the width after enlarging?
Figure 1 Figure 2
(1) 30cm (2) 35cm ᧦(3) 45cm (4) 50cm
C2. There are 1,200 kg of aluminum ingot, 50 liter of glue, and 200 meters of iron wire in the factory. Making a robot needs to use 70 kg of aluminum ingot, 3 liter of glue, and 15 meters of iron wire. Uses the materials on hand, the most, how many robots can be made in the factory? G1. If you had a chance to take a similar test two months later, would you study
harder for that test? (A) Yes, because I�’d like to improve my mathematics ability. (B) Yes, because I am afraid that my parents would preach me if I did not study
harder. (C) Yes, because I am afraid that I would have worse performance than others in
the class if I did not study harder. (D) No, because it is no use to study hard.
Lin, Hung & Lin
4 - 76 PME30 �— 2006
Sample for Pilot Test
The analyses in this study are based on the sample for 2005 TASA-MA Sixth-Grade Pilot Test in Taiwan. The sample comprised 2019 students, and most examinees (94.8%) are from the schools in the west region, while only 101 (5%) students are sampled from the east region (See Table 2 for details).
Table 2 shows the distributions of student reported parental highest education level. Four education levels were defined in this study, which were levels of less than high school, graduated from high school, graduated from college, and graduated from graduate school, The patterns of the education-level distributions were similar for fathers and mothers. Most parents were high school graduates, 45.3% (915 out of 2019) for fathers and 50.2% (1013 out of 2019) for mothers. Nevertheless, more fathers (25%) have bachelor degrees and above than mothers (19.8%).
North Middle South East Total
F M F M F M F M F M
Less Than High
School
234
(11.6)
240
(11.9)
168
(8.3)
159
(7.9)
160
(7.9)
166
(8.2)
37
(1.8)
41
(2.0)
599
(29.7)
606
(30.0)
High School
372
(18.4)
411
(20.4)
244
(12.0)
282
(14.0)
247
(12.2)
267
(13.2)
52
(2.6)
53
(2.6)
915
(45.3)
1013
(50.2)
College 185
(9.2)
175
(8.7)
97
(4.8)
76
(3.8)
98
(4.9)
87
(4.3)
9
(0.4)
4
(0.2)
389
(19.3)
343
(16.9)
Graduate School
69
(3.4)
34
(1.7)
18
(0.9)
10
(0.5)
26
(1.3)
11
(0.5)
3
(0.1)
3
(0.1)
116
(5.7)
58
(2.9)
Total 860
(42.6)
860
(42.6)
527
(26.1)
527
(26.1)
531
(26.3)
531
(26.3)
101
(5.0)
101
(5.0)
2019
(100)
2019
(100)
Table 2: Numbers of Students by Geographic Region and Parental Highest Level of Education in Taiwan for 2005TASA-MA Sixth-Grade Pilot Test
Note: The values in ( ) are percentages of cases.
Lin, Hung & Lin
PME30 �— 2006 4 - 77
Variables The dependent variable is student performance in mathematics or scale score. The scale score for TASA-MA is a linear transformation of an IRT composite score. The Independent or exploratory variables used in this study were parents�’ education levels, and students�’ goal orientation.
Results Three Mathematics achievement levels or performance standards were derived in this study-- Basic, Proficient, and Advanced, and the corresponding cutoff scale scores are 201, 277, and 348, which classify examinees into four ordered performance categories labeled as below basic, basic, proficient, and advanced. The standard for minimal competency for the three levels was set at an expected correct-response probability of 0.7, and thus students are required to correctly answer 70% of the easy, average, and hard items to be regarded basic, proficient, and advanced, respectively. As a consequence, this study not only reports the descriptive statistics of the scale scores by the selected background measures, but also the corresponding percentages of examinees in the four ordered performance categories.
Relationships between Student Achievement in Mathematics and, SES and Goal Orientation
Social Economic Status. In this study, Social Economic Status (SES) for students is indicated by their parents�’ highest level of education. The higher education levels represent higher SES, and vice versa. The result indicated that higher scale score in mathematics tends to be associated with higher SES with exceptions at the graduate-school levels. In terms of the percentages of students in the four performance categories for each parental education level the percentage of examinees in the below-basic-performance category appeared to be highest with the lowest SES or less-than-high-school groups, and lowest with the second highest SES or graduated-from-college groups. On the other hand, the percentage of examinees in the advanced-performance category appeared to be highest with the highest SES groups or graduated-from-graduate-school groups, and lowest with the lowest SES groups. Taken as a whole, higher levels of SES were found to be related to higher levels of student performance with exceptions at the highest SES level.
Goal orientation. Four types of goal orientation were specified in this study, which were mastery intrinsic orientation, mastery extrinsic orientation, performance approach orientation, and avoidance orientation. Accordingly, four ordered categories of goal orientation are identified with �“Level 1�”, the lowest level, representing avoidance orientation, �“Level 2�” performance approach orientation, �“Level 3�” mastery extrinsic orientation, and �“Level 4�”, the highest level, mastery intrinsic orientation. Table 3 displays the scale-score means for each orientation,
Lin, Hung & Lin
4 - 78 PME30 �— 2006
indicating that higher scale score in mathematics tends to be associated with higher level of goal orientation. That is, sixth-grade students with mastery intrinsic orientation have the greatest scale score on the average, those with avoidance orientation obtain the lowest average scale score, and the other types of orientation have average scale scores in between.
Table 3 also provides the percentages of students for the four performance categories by goal orientation. In general, greater examinee percentages in the below-basic-performance category observed for lower learning-approach-level groups, and greater examinee percentages in the advanced-performance category observed for higher goal-orientation-level groups, which is line with the outcome of better scale score being associated with higher goal-orientation level.
N Mean SD
Below Basic
᧤%᧥
Basic
᧤%᧥
Proficient
᧤%᧥
Advanced
᧤%᧥
Avoidance Orientation 87 216.48 50.66
36
᧤41.4%᧥
31
᧤35.6%᧥
19
᧤21.8%᧥
1
᧤1.1%᧥
Performance Approach
Orientation 359 226.03 43.96
115
᧤32.0%᧥
165
᧤46.0%᧥
74
᧤20.6%᧥
5
᧤1.4%᧥
Mastery Extrinsic
Orientation 600 241.79 48.55
137
᧤22.8%᧥
258
᧤43.0%᧥
184
᧤30.7%᧥
21
᧤3.5%᧥
Mastery Intrinsic
Orientation 973 266.34 46.88
102
᧤10.5%᧥
337
᧤34.6%᧥
444
᧤45.6%᧥
90
᧤9.2%᧥
Total 2019 249.72 50.09390
᧤19.3%᧥
791
᧤39.2%᧥
721
᧤35.7%᧥
117
᧤5.8%᧥
Table 3᧶Descriptive Statistics of Scale Scores and Passing Rates by Goal orientation
The Variance of Student Achievement Explained by SES and Goal Orientation In this study, the first type of predictor variables of student achievement is Social Economic Status, indicated by fathers�’ and mothers�’ highest levels of education, and 2.9% of the variance is explained by these two variables. The second type of predictor variable is student�’s goal orientation, and accounts for additional 11% of the variance.
Lin, Hung & Lin
PME30 �— 2006 4 - 79
Table 4 summaries the regression analyses implemented for this study. In Table 6 the �“Model�” column identifies the various models. The �“Explained Variance (%)�” column provides the amount and percentage of Y variance explained by the corresponding predictive variables, and the percentage is obtained by dividing the explained Y variance by the original total Y variance (e.g., 67.64÷2301.36=2.9%). The �“Additional % of Explained Variance�” column displays the most important information in this study. Each percentage in this column represents the proportion of the Y variance explained by the additional predictive variable(s) after the effect of the predictive variables in the previous model are removed. For example, the unique contribution of goal orientation in predicting student achievement can be denoted by 11%, and obtained by subtracting the percentage explained by SES from the total percentage explained by SES and goal orientation (i.e., 13.9%-2.9%=11%).
Model Predictive Variable
Unexplained Variance
Explained Variance
(%)
Additional % of
Explained Variance
Y = 0 +E None 2301.36 0 NA
Y = 0 + 1*(FE) + 2*(ME) + E
FE, ME 2233.72 67.64
(2.9%)
2.9%
Y = 0 + 1*(FE) + 2*(ME) + 3*(GO)+ E
FE, ME, GO
1980.50 320.86
(13.9%)
11.0%
Table 4᧶Summary Table for Regression Models and Effect Sizes
CONCLUSION AND DISCUSSION The results of this study show that most sixth-grade students in Taiwan perform at the basic level performance in mathematics. The higher proficiency in mathematics tends to be associated not only with higher SES, but also with more mastery-oriented learning approach (i.e., mastery goal orientation). SES accounts for 2.9% of the variance, which is much lower than that uniquely accounted for by student�’s goal orientation (11%). This major finding implies that goal orientation is much more significant than SES in predicting students�’ achievement of mathematics. The present study also showed that more than 50% 6th graders were somewhat concerned about how they performed in mathematics relatively to others in Taiwan. The challenge teachers and educators face now concerns how to create conditions that facilitate students�’ learning commitment by reducing the excessive focus on relative performance.
Lin, Hung & Lin
4 - 80 PME30 �— 2006
References Ames, C. (1992). Classrooms: goals, structures, and motivation. Journal of Educational
Psychology, 84, 261-271. Covington, M. V. (2000). Goal Theory, Motivation, and School Achievement: an
integrative review. Annual Review of Psychology, 51, 171-200. Pintrich, P. (2000). An achievement goal theory perspective on issues in motivation
terminology, theory and research. Contemporary Educational Psychology, 25, 92-104. Pintrich, P. R. & Schunk, D. H. (1996). Motivation in education: Theory, research, and
2006. In Novotná, J., Moraová, H., Krátká, M. & Stehlíková, N. (Eds.). Proceedings 30th Conference of the International Group for the Psychology of Mathematics Education, Vol. 4, pp. 81-88. Prague: PME. 4 - 81
WHY STUDENT TEACHERS TEACH OR DO NOT TEACH THE PROFESSED VALUES?
*Fang-Chi Lin, **Chih-Yeuan Wang, *Chien Chin & *Gi-Yuan Chang *Department of Mathematics, National Taiwan Normal University
**General Education Centre, Lan Yang Institute of Technology
This study investigates the relationship between student teachers’ awareness of, and their willingness to teach certain values. Findings from an interpretive case study indicate that the relationship between students’ awareness of the professed values and the values that they are willing to, and actually teach, in the classroom is much more complicated than expected. Their willingness to actualize certain values is closely related to the substance of values, the extent to values awareness and the classroom situation for practice. Such relationship is modified in and from the teaching practice in which the taught and professed values are dialectically and pedagogically informed.
INTRODUCTION Issues about values in mathematics education have been increasingly discussed, and recognised as an important domain of portraying teachers�’ thinking and classroom practice, in recent PME conferences (e.g., Bishop, FitzSimons, Seah & Clarkson, 2001; Chin, 2002; Seah, 2005). The Taiwanese VIMT (Values In Mathematics Teaching) projects and the Australian VAMP (Values And Mathematics Project) have reported details about the extent to which mathematics teachers are able to clarify their own value positions and understand their own intended and implemented values. Two aspects about teachers�’ intrinsic motives of thinking and action (i.e. awareness and willingness) from which the above two projects are derived, play as two crucial affective requirements of learning-to-teach values for student teachers (Bishop, Seah & Chin, 2003). The former is concerned with the extent to which teachers are aware of teaching some values in the classroom; the latter is about their willingness to teach those values. But, what relationships connect these two constructs are still unclear. This paper describes part of the results from the first year of a 3-year follow-up project of VIMT, in which 6 student teachers of secondary mathematics are selected as cases for longitudinal study, hoping to provide some insights into the questions of �‘What are the relationships between values awareness and willingness to teach?�’ and �‘What factors might influence such relationships?�’ Many mathematics educators believe that the values which teachers of mathematics bring to various aspects of their work profoundly affect what and how they teach, and therefore what and how their students learn (Bishop et al., 2003, pp. 718). As a result, the more mathematics teachers understand about their own pedagogical value positions, the more flexible they will be in their thinking about, and practice of, classroom teaching of mathematics (Chin & Lin, 2001, pp. 114). Based on case study
Lin, Wang, Chin & Chang
4 - 82 PME30 �— 2006
of one expert secondary mathematics teacher�’s value positions and value clarification process, a 5-stage cognitive-affective transition process was suggested, and the teacher�’s values teaching was closely related to both his awareness of, and willingness to, teach such values in the classroom (Chin & Lin, 2001). Pollard (2002) indicated the importance of identifying our value-positions from three aspects. First, it helps teacher to assess whether we are consistent, both in what we believe and in reconciling differences which may exist in a school. Second, it helps teacher to evaluate and response external pressure. Finally, it can help teacher to assess whether what we believe is consistent with how we actually behave. Thus, the awareness or clarification of values that teachers posit can bring them more concentrated on the classroom teaching and learning activities that values are loaded (Chang, 2005). The question of �‘Are teachers aware of this (values) possibility?�’ was raised and discussed in PME 25. Mathematics teachers may portray certain values in their teaching that are not intended (Bishop, 2001), but, if teachers are conscious or aware of their own values, then will they practice certainly? If values are hold by individuals to which they attach special priority or worth (Hill, 1991), teachers will certainly want to enact the values professed. And yet, the two initial states as �‘felt difficult to act however unwilling to act�’ and �‘felt difficult to act and yet willing to act�’ in student teachers�’ learning-to-teach pedagogical values were also observed (Chin, 2002). This report reminds us to take both the individuals�’ willingness and abilities more seriously in studying (student) teachers�’ values and their classroom practices. The inconsistencies between individual beliefs and subsequent actions were also evident in several studies (e.g., Raymond, 1997). And different situation might lead to different choice of actions (Seah, 2005). As a result, the relationship between teacher-aware values and the values that they actually teach in the classroom may be pedagogically dialectical (Bishop et al., 2003), and we should therefore take this circumstance of practice into account. This paper examines the relationship between awareness of, willingness to teach, and classroom practice of the student teachers�’ professed values.
RESEARCH METHOD The case study method, including questionnaire survey, interviews and classroom observations, was used as the major approach to investigate the pedagogical values of a group of 6 student teachers. The systematic induction process and the constant comparisons method (Strauss & Corbin, 1998) based on the grounded theory were used to process data and confirm evidence characterized the method of our study. According to a questionnaire survey with statistical factor analysis (Statistics Package for Social Sciences, 2004), 6 student participants (Ning, Ji, Han, Tong, Yu and Ying) were selected as the cases for this 3-year longitudinal study from a class of 46 student teachers who participated in the �‘teaching methods for secondary mathematics�’ course at the third year of the teacher preparation programme. We separated the study into two stages (pre-micro teaching and in/post-micro teaching) to collect the first year empirical data. In the pre-micro teaching, the main activity of the course was to observe and comment on the topic of mathematical induction videotaped from 5
Lin, Wang, Chin & Chang
PME30 �— 2006 4 - 83
secondary expert teachers�’ values teaching, and then followed by asking the students to propose a teaching plan for micro teaching in groups. They were then separated in 6 groups to practice the values that they formerly professed and intended to teach, through micro teaching for few selected topics in the secondary school curriculum. Following, we report Ying case in more detail followed by a briefing of the Yu case.
RESULTS At the stage of pre-micro teaching, according to the responses from values priority questionnaire and interviews, Ying consistently identifies with the following 5 professed values: (1) mathematical essence (2) mathematical forms (3) mathematical communication (4) mathematical reasoning (5) learning with pleasure. Ying regarded the first two values as the most important guidelines for her micro teaching. In the interviews, she said �“if there are no mathematical forms in my teaching, then I don�’t know how to teach the subject and my students would also do not know how to learn the content, thus, �‘forms�’ should play an important role in my teaching�”. She also identified with the values of �‘preparing knowledge for students�’ and �‘describing mathematical concepts with the real life situations�’ that one expert teacher addressed in his video, and was willing to enact them in micro teaching afterward. She also conceived the value of mathematical communication as her favourite. In the interviews, she said �“I care about students�’ response very much; it is not a good feeling if I am the only person talking in the classroom while students are not with me�”. She also agreed with the idea of “building a vivid atmosphere in the classroom for students to ask and response freely and interactively” after observing the teaching videos. She anticipated “a class with teacher-student dialogue under harmonious atmosphere”.
Besides, she expected her students to learn to explain mathematical ideas and study mathematics happily. The meaning of mathematical reasoning for her was connected to the abilities to clearly explain mathematical concepts, for “through explanations one shows what you have already understood” and learning with pleasure was “to keep students out of a long face at least”. She added to the former that “mathematics allows us to learn to analyse and reason, and students who learn this ability will become orderly people”, although “there is a gap between being orderly and reasoning mathematically, since it is not everybody that can achieve it, I will not require students to achieve this even though it is valuable for me”.
Specifically, she indicated the value of learning with pleasure as the most favourite, and yet she saw �‘felt happiness and pleasure�’ as the least important guideline for planning teaching activities. That is to say, though she loved certain values, but would rather lay it aside in teaching. When we asked the reasons of saying so, she referred to her out of class tutoring experiences, reflecting the feelings of “not to be so serious to students and do not let students reject mathematics at least”. However, she also re-addressed that “it is impossible for the students to be happy all the way through; though I conceive pleasure as being important for teaching and learning mathematics, creating happy atmosphere for learning mathematics perhaps is only
Lin, Wang, Chin & Chang
4 - 84 PME30 �— 2006
an ideal teaching goal”. In this case, her willingness to teach the value gets no stronger at the present stage. At the stage of in/post-micro teaching, the topic of Ying�’s micro teaching was the completing square of a quadratic equation with one variable in the junior high school mathematics curriculum. She was the third of team to teach the lesson lasting about 15 minutes. In this 15-minute micro teaching, we observed that she requested students many times to pay attention to the formula of completing squares. We asked whether she had intended to create a kind of mathematical forms in such activity, she firmly said “I will request students to solve problems according to my method in the classroom that is what I should do to be a teacher, if I present too many ways at the same time, students will be confused”. Thus for her, the mathematical forms have to be emphasised in teaching. When we asked her what aspect of the micro-teaching she was most unsatisfied with, she replied that �“it would be the moment of interacting with students�”. Moreover, she wouldn�’t spend much time in teacher-student communication, but would try it when the crucial moment comes. When asking her how to train the students�’ abilities to think mathematically, she said “it can be accomplished in class one to one, but it is impossible to proceed with the entire class together�”. Though, she hopes that students can learn mathematics within a relaxed atmosphere, and might just enact it on the premise that school tests and homework are few. As a result, though she emphasised learning motivation, feeling or students�’ thinking, she would teach the class smoothly at present not too radically. At this stage, on the one hand, Ying attempted to perform some values that she identified at previous stage such as �‘mathematical essence and forms�’ and �‘mathematical communication�’. On the other hand, she liked to talk more to the students and to improve the quality of classroom teacher-student communications. Besides, she also identified with the values of mathematical reasoning and learning with pleasure, although she still expressed a lower willingness to teach such values after micro-teaching. We summarize the 2-stage results for her as follows (see table 1).
Table 1: Categories of Ying�’s values observed Unlike the high consistency of Ying, other cases presented inconsistent across these two stages. Yu as an example, at the pre-micro teaching stage, she consistently identifies with the following three professed values: (1) thinking individually (2)
Lin, Wang, Chin & Chang
PME30 �— 2006 4 - 85
mathematical communication (3) learning with pleasure. She said “mathematics teaching should promote thinking ability and teachers should let students feel that mathematics is interesting to improve their learning motive”. But she also declared that “teachers are not necessarily leading them to get the feeling that learning mathematics is a happy moment and I can’t force students to feel happy in such a process”. In this case, Yu shows a lower willingness to teach the value of learning with pleasure. At the micro teaching stage, Yu and Ying were in the same team and taught the same topic. Yu was the last one to teach the lesson for about 8 minutes. However, we did not observe the enactment of the above three professed values. She said “I am very nervous in teaching and I can’t know the reaction of classmates.” She confessed that she didn�’t consider the values while designing the relevant teaching activities. Also, the teaching plans were written by the group, she just “did the best to follow it”. When we talked about her portion of micro teaching, she said �“I hoped that I could highlight the importance of thinking individually by interacting with students if I have enough teaching experience”. And unexpectedly, she showed a higher willingness to teach such value after micro teaching. In her end of the term reflective journal, she referred to the experience of tutoring in which students�’ bad moods could convey to her as well. Thus, she will try to design mathematical activities to let students feel happy in her teaching. As a result, of her limited experience, Yu neglected the previously professed values in practice, but she still expressed a higher willingness in trying to strengthen the roles of some values in her classroom teaching later. We summarize the 2-stage results for her as follows (see table 2).
Pre-micro teaching In & post-micro teaching Values
awareness willingness Practice Thinking individually 9 9 ;
Mathematical communication 9 9 ;
Learning with pleasure 9 ; ;
Table 2: Categories of Yu�’s values observed DISCUSSIONS The cases of Ying and Yu offer us a foreseeable relationship of awareness and willingness related to the enactment of values. They are all aware of certain values, but they may not have willingness to teach them. Even though they all show a higher willingness to enact certain values in the classroom, they do not or even refuse to practice such values. This seems to indicate that teachers may acknowledge some pedagogical values and regard them as important ones, but this doesn�’t necessarily assure that they will actually teach them in the classroom. That is to say, the relationship between teacher�’s awareness of the professed values and the values that they actually have willingness to implement in the classroom is much more complicated than the researchers initially assumed it might be pedagogically and dialectically related. There may be other factors influencing this relationship, or pre-
Lin, Wang, Chin & Chang
4 - 86 PME30 �— 2006
conditions for enacting certain values. We will re-consider the relationship as follows by focussing on analysing the reasons for clear awareness but low willingness to teach the professed values. Willingness to teach and the substance of values It has long been recognised that the values are unable to exist alone; it exists on the basis of some concrete value-carriers. Since both teachers and students even mathematics are value-carriers (Bishop et al., 2003), this theory offers us a framework to re-think Ying�’s case. If we conceive her values from the mathematical, interactive and learning aspects in relation to the different substance of each value, then apparently, the values of mathematical forms and essence can be classified as �‘mathematical�’ that Ying likes to implement in the classroom; the value of mathematical communication can be grouped as �‘interactive�’ that she anticipates to teach with the students; and the values of mathematical reasoning and learning with pleasure can be relegated to �‘the learners�’ that she considers as being too hard to be actualised in the classroom. In this case, we suspect that it is the learning domain that she finds difficult to handle, and then show a lower willingness to teach such values. And this tendency has been lasted over the two research stages consistently. On the other hand, some values with higher willingness to teach are concerned with the mathematics or classroom interaction. Other cases in the study also show similar phenomena, like Yu. Although they all hope to get students to enjoy in learning mathematics, and yet they still hesitate to include it in the teaching plans. Since this may involve students�’ affect of learning mathematics, and they both conceive it as �“very difficult to control�”. Thus, we suggest that the willingness to teach is closely related to the substance of values. Since the student teachers have less experience in teaching until to the end of their teacher education program, they also do not acquire mastery of teaching. As a result, the teachers�’ abilities and the extent of understanding toward students may affect their willingness to teach those values in the classroom. Thus, the more pedagogical values are related to learners, the less willingness they intend to teach the values. This observation echoes also to the theory of learning-to-teach that student teachers�’ orientations toward teaching are grounded in a teacher-centred classroom (Wilson, Cooney & Stinson, 2005). It is difficult for them to control over or face to the relevant classroom situations except mathematics and themselves. Willingness to teach and the situation of practice Two forms of values teaching are salient in this study. First, the students who actually teach the values that they are willing to teach. For instance, Ying clearly acknowledges her intended pedagogical values and enacts it in the micro teaching. This confirms the idea of �‘values as beliefs in action�’ (Clarkson & Bishop, 1999). Second, the students who do not teach the values that they are willing and suppose to teach. For example, Yu even neglects the values nominated before micro teaching when they design the teaching plans. One reason is about the shared nature of the teaching plan for the whole team, as the team members can only complete the planned curriculum and no one has the rightness to change it. Another reason is
Lin, Wang, Chin & Chang
PME30 �— 2006 4 - 87
concerned with the immediate nature of classroom teaching situation, as the moment goes by, they care only about the teaching contents, the notes made on board, and the performance on the platform. In the light of Fuller�’s theory of concerns (Fuller & Bown, 1975), our cases are clearly still at the state of self-concerned, perhaps including lack of teaching experiences, the familiarity of the teaching topic, or some socially interactive experiences (Raymond, 1997). Willingness to teach and the extent of awareness Do teachers really acknowledge clearly their own values? Or, how clear teachers are of their values? Though we don�’t have more specific evidence to answer these questions, we can still get some insights from the case of Yu. She firstly identifies with the value of learning with pleasure but unwilling to act at the micro teaching stage; and after that stage, she eventually shows a higher willingness to teach such a value. Perhaps this is because of the experiences in and reflections on her micro teaching section; and also during the process of interacting with students she becomes realized that the importance of values in her teaching, and this quasi-practical shock may then stimulate her to re-consider the possibility of teaching that value. Thus, it may be that �‘the deeper the extent of awareness they are, the higher the willingness that they will have�’. She may be more aware of, or willing to, teach her formerly professed values. The increasing of awareness and willingness in and from practice We should re-consider student teachers�’ professed values by taking practice into account, for some students although identify with certain values; however they may not necessarily be aware of the value actually being taught. If we re-consider the question of �‘how clear teachers are of their values�’, then we are forced to consider how clear teachers are of their values �‘in and from practice�’? As to our student teachers, micro teaching seems to make them fluster on the platform. They just go through the teaching section and have no attention or intention to think of other things, including the professed values. This might have been related to the limited experiences that student teachers have, thus even they are fully aware of their own values in the classroom, and they still may not necessarily be willing to implement them. Lastly, some of them choose not to implement certain values. But there are students who change the value tendency after classroom practice. For example Yu, she eventually shows a higher willingness to teach the value of learning with pleasure. Though a lot of classroom realities might hinder a teacher to teach certain values, perhaps more teaching practices may re-cycle them to have higher willingness to teach that values. In the final year of this 3-year project, the 6 student teachers have been attached to different secondary schools. There are social and pedagogical tensions for them to challenge their formerly intended and implemented values. Will they still be clear and aware of, as well as to implement their own values in the real classroom situations? The 1st in-school classroom supervision shows that Ying talks to different students 27 times in a 50-minute lesson, does this mean that her previous values are
Lin, Wang, Chin & Chang
4 - 88 PME30 �— 2006
eventually changing? Or, she just re-arrays the former values priority in consideration of the classroom reality? This is a newly follow-up question for us. References Bishop, A. J., FitzSimons, G. E., Seah, W. T., & Clarkson, P. C. (2001). Do teachers
implement their intended values in mathematics classrooms? In M. van den Heuvel-Panhuizen (Ed.), Proceedings of the 25th Conference of the International Group for the Psychology of Mathematics Education (Vol. 2, pp. 169-176). Utrecht, Netherlands: Utrecht University.
Bishop, A. J., Seah, W. T., & Chin, C. (2003). Values in mathematics teaching-the hidden persuaders? In A. J. Bishop, M. A. Clements, C. Keitel, J. Kilpatrick, & F. K. S. Leung (Eds.), Second International Handbook of Mathematics Education (pp. 717-765). Dordrecht: Kluwer.
Chang, G. Y. (2005). Pedagogical values identification of student teachers: Six case studies. Unpublished master�’s thesis, National Taiwan Normal University. (In Chinese)
Chin, C., & Lin, F. L. (2001). Mathematics teacher�’s pedagogical value clarification and its relationship to classroom teaching. In Proceedings of the National Science Council, Part D: Mathematics, Science, and Technology Education, 11(3), 114-125.
Chin, C. (2002). Developing student teachers�’ pedagogical values: two initial states and a co-learning cycle. Proceedings of the 26th Conference of the International Group for the Psychology of Mathematics Education (Vol. 2, pp. 241-248). Norwich: UEA.
Clarkson, P. C., & Bishop, A. J. (1999, July). Values and mathematics education. Paper presented at the 51st Conference of the International Commission for the Study and Improvement of Mathematics Education, University College, Chichester, UK.
Fuller, F., & Bown, O. (1975). On becoming a teacher. In K. Ryan(Ed.), Teacher Education: The 74th Year Book of the National Society for the Study of Education (pp. 25-52). Chicago: University of Chicago Press.
Hill, B. V. (1991). Values education in Australian schools. Hawthorn, Victoria: ACER. Pollard, A. (2002). Reflective teaching: effective and evidence-informed professional
practice. New York: Continuum. Raymond, A. (1997). Inconsistency between a beginning elementary school teacher�’s
mathematics beliefs and teaching practice. Journal for Research in Mathematics Education, 28(5), 550-576.
Seah, W. T. (2005). Negotiating about perceived value differences in mathematics teaching: the case of immigrant teachers in Australia. Proceedings of the 29th Conference of the International Group for the Psychology of Mathematics Education (Vol. 4, pp. 145-152). Norway: Bergen University.
Strauss, A., & Corbin, J. (1998). Basis of Qualitative Research: Techniques and Procedures for Developing Grounded Theory (2nd ed.). Thousand Oaks: Sage Publications.
Wilson, P., Cooney, T., & Stinson, D. (2005). What constitutes good mathematics teaching and how it develops: Nine high school teachers�’ perspectives. Journal of Mathematics Teacher Education, 8(2), 83-111.
2006. In Novotná, J., Moraová, H., Krátká, M. & Stehlíková, N. (Eds.). Proceedings 30th Conference of the International Group for the Psychology of Mathematics Education, Vol. 4, pp. 89-96. Prague: PME. 4 - 89
INVESTIGATING MATHEMATICS LEARNING WITH THE USE OF COMPUTER PROGRAMMES IN PRIMARY SCHOOLS
Maria Dolores Lozano, Ivonne Twiggy Sandoval, Maria Trigueros ILCE, Enciclomedia, México
The purpose of this paper is to report on the development of a methodology designed to investigate the way in which primary school students learn mathematics with the use of computer interactive programmes. Our work is part of a Mexican project devised to enrich teaching and learning in the classrooms with the use of multimedia resources. Our approach is guided by enactivism, a theory for learning about learning (Reid, 1996) in which multiple perspectives are used and where methods are continuously being refined in the process of doing research. Learning is investigated through the observation of classroom cultures and of students’ mathematical actions. Illustrative examples show how our way of working is helping us in looking at how the computer programmes are being used in the classrooms.
INTRODUCTION Enciclomedia is a large-scale Mexican project that has been devised with the purpose of enriching primary school teaching and learning by working with computers in the classrooms. An electronic version of the mandatory textbooks that are used in all primary schools in Mexico is being enhanced with links to computer tools designed to help teachers with the teaching of all subjects. As members of the Mathematics group in Enciclomedia, we create resources and strategies which can help teachers and students in their teaching and learning of mathematical concepts. An additional and extremely important part of our work is to investigate how students learn mathematics as they use the computer tools that Enciclomedia provides them with. The purpose of this paper is to report on the development of ways of working that can enable us to characterise the learning of mathematics with Enciclomedia. To begin with, we consider some theoretical ideas about the learning of mathematics; in particular, with the use of computer interactive programmes. We also give a brief description of the interactive programmes that are being used in mathematics lessons. Later, we discuss the way in which the learning of mathematics with these programmes can be investigated. We talk about the approach we have taken in Enciclomedia and the methods we are developing for our project. In addition, we give some examples of the results we have obtained with our investigation so far.
SOME IDEAS ABOUT THE LEARNING OF MATHEMATICS What do we mean by �‘learning mathematics�’? How can we investigate the way in which students learn of mathematics with the use of a computer? Our theoretical ideas about mathematics learning are based on enactivism, a theory of knowing which considers learning as effective or adequate action (Maturana and Varela, 1992). Our minds are seen as �‘embodied�’ and cognition as �‘embodied action�’. These
Lozano, Sandoval & Trigueros
4 - 90 PME30 �— 2006
ideas of �‘embodiment�’ entail two fundamental senses: on the one hand cognition is seen as �‘dependent upon the kinds of experience that come from having a body with various sensorimotor capacities�’ and on the other, individual sensorimotor capacities are considered to be �‘themselves embedded in a more encompassing biological and cultural context�’ (Varela, 1999, p. 12). The first meaning of embodiment locates cognition in our bodies, and prevents us from thinking about it as an abstract notion that is detached from our everyday experience. The second situates our learning in a wider social and cultural context. In enactivism learning occurs when individuals interact with each other, changing their behaviour in a similar way. In a particular context or location, the participants create together the conditions that will allow actions to be adequate. Learning outcomes cannot be predetermined or predicted, but the criteria for the adequateness of actions are, specified by teachers and students. As members of a particular community interact with each other, patterns of behaviour are created, constituting what in this paper we call a classroom culture (see Maturana and Varela, 1992). With these ideas in mind is that we are interested in investigating the learning of mathematics with Enciclomedia by looking at the actions that take place in the classroom and that we consider to be effective. Learning mathematics with computer tools From an enactivist perspective, the use of computer tools is part of human living experience since �‘such technologies are entwined in the practices used by humans to represent and negotiate cultural experience�’ (Davis et. al., 2000, p. 170). Tools, as material devices and/or symbolic systems, are considered to be mediators of human activity. They constitute an important part of learning, because their use shapes the processes of knowledge construction and of conceptualization (Rabardel, 1999). When tools are incorporated into students�’ activities they become instruments. Instruments are mixed entities that include both tools and the ways these are used. For this reason, instruments are not merely auxiliary components or neutral elements in the teaching of mathematics; they shape students�’ actions and therefore they are important components of the learning processes:
Instruments constitute the means that shape and mediate knowledge and our registers of situations and because of that they exert an influence that can be considerable�… they influence the construction of knowledge (ibid, 1999, p. 204)
Every tool generates a space for action, and at the same time it poses on users certain restrictions. This makes possible the emergence of new kinds of actions. In that sense, the use of a tool can contribute in the opening of the space of possible actions for the learner (Rabardel, 1999). The influence that tools exercise on learning is not immediate. Actions are shaped gradually, in a complex process of interaction. Instruments are not given, they do not exist in themselves, and they do not imply a predetermined way of working. Rather, people incorporate tools into their activities and they shape them as they use them (ibid, 1999). Solving mathematical problems with the use of computer programmes is closely related to the tools available, and
Lozano, Sandoval & Trigueros
PME30 �— 2006 4 - 91
students need, on the one hand, adequate actions related to the mathematics involved and, on the other, actions that are effective in relation to the use of the tools themselves. In the classrooms, students construct meanings through their actions which are contextualised in phenomenological experience, that is, in a process of social interaction and with the guide of the teacher (Mariotti, 2001). The purpose in, Enciclomedia, is to develop programmes which can broaden students�’ experiences with mathematics. We have developed different kids of programmes; they vary, for example, in the kinds of interactivity they promote and in the types of problems they pose to the users. So far we have developed programmes related to different mathematical concepts or areas such as fractions, probability, area, perimeter and proportionality. The programmes are closely related to the activities in the students�’ textbooks, but they are mostly thought of as spaces for mathematical exploration. They usually provide the users with something they would not get if they used the textbook alone. For example, programmes give the students immediate feedback on their actions on the computer, and they often simulate situations that are difficult to recreate or experience in the classroom, such as large number of occurrences of random events. Many also show different representations of the same concept, such as numeric and graphic, which are linked together in the programme. The investigation of the way students learn mathematics as they use these programmes in their classrooms is a crucial part of the process of development of the tools themselves and one we are addressing through this work.
SOME IDEAS ABOUT METHODOLOGY The choice of methods used in our investigation of mathematics learning is also inspired by the enactivist approach. �‘Enactivism, as a methodology [is] a theory for learning about learning�’ (Reid, 1996, p. 205). Research is considered to be a way of learning, and therefore researchers are seen as individuals developing their learning in a particular context. From an enactivist perspective, researchers interpret the world in a particular way, influenced by their previous experiences. In addition, in the process of doing research, researchers influence and shape the context in which they are immersed (ibid, p. 206). The interdependence of context and researchers makes the research process a flexible and dynamic one. Research does not occur in a linear fashion; rather, it is seen as a recursive process of asking questions. The work reported in this paper is only the first part of a complex process of interaction and development of ideas. Because of the nature of our work we consider it to be not only research but �‘action research�’. We think of our educational initiatives as dynamic suggestions which are under constant modification. The development of the computer programmes in Enciclomedia is an ever-changing process and our work as researchers is also being continuously shaped and modified by our interactions with textbooks, teachers, students and with each other. The methods we have started using to investigate mathematics learning will change in the future according to what we observe in the classrooms and to the feedback we receive from colleagues.
Lozano, Sandoval & Trigueros
4 - 92 PME30 �— 2006
Research questions We were interested in investigating those activities that we found to be effective as students worked in mathematics problems using Enciclomedia. We wanted to investigate and analyse the way in which the use of the computer interactive programmes contributed in shaping students�’ actions, and especially, we wanted to observe the development of actions that could be described as mathematical. In order to do this, we decided to get a sense of the culture of the classrooms and more specifically, to identify mathematical actions that could be observed during the lessons. In what follows we describe in more detail the methods we used, and some preliminary descriptions of what we have observed so far.
INVESTIGATING THE CLASSROOM CULTURE In order to research the learning of mathematics with Enciclomedia, we contacted a school in Mexico City where we worked with two Year 5 and two Year 6 groups of about 25 students each (aged 11-13). Two of us visited the classrooms at a time and our role was that of participant observers. We helped the teacher in giving general directions on how to use the computer programmes and we walked around the room, making comments or asking questions about students�’ work. As we entered the classrooms we contributed in creating certain kinds of classroom cultures �– that is, patterns of actions and interactions. When digital technologies are used, these change the way students and teachers interact with each other and therefore particular classroom cultures emerge. Furthermore, the roles of the teacher and of the students change as the culture of the classroom is modified by the use of the programmes. The classroom cultures we investigated were influenced by the pedagogical approach taken by the national curriculum, which is being followed by the textbooks and by Enciclomedia. In agreement with this, certain activities were explicitly fostered in the classroom while others were discouraged. For example, an attitude of tolerance and respect for others�’ opinions was promoted; students were invited to work collaboratively, to ask questions and to participate in discussions. In addition, they were asked to justify their opinions and to work in an orderly fashion. In order to register the characteristics and the development of the classroom cultures, we carried out detailed observations of students�’ actions. We used multiple methods for the collection of data. We used audio recording during the lessons. We recorded whole group discussions as well as interactions that occurred between two or three students and/or between students and teachers or researchers. We also used a video camera, with the purpose of recording, for each lesson the actions of a particular pair of students. So far we have videoed different students on every session. Additionally, for each lesson, we filled in an observation sheet in which the following aspects of students�’ behaviour appear: Active/Passive, Attentive/Inattentive, Working with others/Working individually, Freedom/Constraint, Giving correct answers/ Formulating explanations, Understanding/Remembering. These aspects had emerged in a previous study in which they had been helpful in analysing students�’
Lozano, Sandoval & Trigueros
PME30 �— 2006 4 - 93
mathematical actions related (Lozano, 2004). We thought we could start investigating our classroom cultures by looking at these categories, keeping in mind that some of them might turn out to be irrelevant, while we might need to add others. The following examples are taken from the notes written on the observation sheets on several dates. Key words, which are highlighted in the documents, appear in italics: Students are active when they work with the programmes. They constantly interact with the programmes and with their peers. They also ask questions and often want to explain or show things to the teacher and researchers. Many students are eager to participate in whole-group discussions. A few of them are quiet, but all of them are attentive. Students get distracted when, working with the interactive programme, they cannot solve a problem after many attempts. Individual work seems to be more frequent when students are working with activities from the textbook; when they start exploring the problem with the interactive programme; and when their solutions are giving them unexpected feedback (due to incorrect answers). Students appear to work in groups more frequently once they have an understanding of the problem. The programme (�‘The Balance�’) seems to give s students freedom to explore with different situations and to experiment with different strategies. The textbook and, at times, the teacher, restricted students�’ actions. Most students are looking for correct answers. This seems to be reinforced by the teacher who stresses the importance of getting them. The computer programme �‘Perimarea�’ gives further emphasis to this approach. Sometimes students�’ explanations include phrases such as �‘that is the way we were taught�’ �‘that is how the formula goes�’ which indicate memorisation. A few students, however, give sophisticated explanations with complex mathematical ideas involved. These explanations are not necessarily correct in a conventional sense. Students’ mathematical actions When entering the classrooms we were particularly interested in looking at those actions which students performed during the lessons and that could be considered mathematical. With the purpose of identifying these actions, the audio and video tapes we obtained from each lesson were analysed from a different perspective than the one taken when thinking of the classroom culture. In addition, when we observed the lessons, we wrote down, individually, those actions that we thought were mathematical. We used a second observation sheet with the following headings: Initial mathematical behaviour (which refers to students�’ actions related to mathematics during the whole group introductory discussion at the beginning of the lesson), Mathematical actions (those observed during the rest of the lesson, which are related to the mathematical concept(s) in the textbooks�’ chapter) and Other mathematical actions (they do not explicitly address concepts in that chapter). Particular incidents, where mathematical behaviour is observed, were written at length under each heading. In addition, we have kept records of students�’ work with
Lozano, Sandoval & Trigueros
4 - 94 PME30 �— 2006
paper and pencil. Acting mathematically does not necessarily mean, to us, solving a problem in a conventional �‘correct�’ manner. We collectively decide on what is mathematical by having discussions in which we talk about our notes, our transcripts from the audio tapes, and about what we observe on the videos. To support our interpretations about mathematical actions, we also read the literature on the teaching and learning of the different areas or mathematical concepts which are being explicitly addressed in each lesson. We use the textbooks to identify these concepts, and to learn about the purpose of the chapters in them. We are working on the development of criteria for identifying mathematical actions, which are not fixed but ever-changing. For example, the following extract was taken from the notes that were written under Initial mathematical behaviour on the 15/10/2005, which were later contrasted and complemented with the transcripts from the audio tape from the same date:
T- What does the word area mean? Use your own words. Students: �‘The centre of the shape�’ (S1) �‘The opposite to the perimeter?�’ (S2) �‘The part that is not on the edge�’ (S3) T- Can you show me? What is the area of the board? (Student touches the central part) T- Anyone else? What is the area of this rectangle? (Student fills in its central part) T- Who can say something different? What does �‘area�’ mean? S5- Everything except for the border.
Afterwards, the group worked with the interactive program �‘Perimarea�’, where they were supposed to calculate the area for different shapes by counting the squares on a grid that is shown on the screen (see Figure 1).
Figure 1. Perimarea
We noticed, both during the lesson and on the video from that session, that students were giving the answers by trial and error. They got feedback from the programme; telling them whether they were missing or they had too many square units. By the end of the lesson, it was evident that they had not changed their ideas about the area being the central section of the surface of the shape.
In other lessons, students worked with a programme called �‘The Balance�’, comparing fractions and solving problems from the textbook where they had to fill in boxes that represent weights on a scale. The problem in the textbook�’s chapter can be reproduced with the programme (Figure 2). Immediate feedback is given, as the programme shows whether the scales are in equilibrium or not. During these lessons, the following mathematical actions were registered (28/11/05):
Lozano, Sandoval & Trigueros
PME30 �— 2006 4 - 95
Students ask questions such as �‘Why is this heavier than this?�’
Students give explanations about how to equilibrate the balance: �‘fractions have to get smaller�’. Other explanations are more sophisticated, for example, a student used graphic representations (of pizzas) on the board to show how a fraction with odd numerator can be divided in two.
Figure 2. The Balance
Students compare rational numbers, identifying �‘more or less heavy�’ weights.
We noticed that when students first began using The Balance, many also answered with trial and error. However, they gradually refined their strategies and started producing more efficient and systematic methods for obtaining fractions that equilibrated the balance. Using �‘random�’ numbers proved to be an inadequate manner of addressing the problem. Their effective behaviour, after a few sessions, was very different from the one we had observed when they used Perimarea.
CONCLUSIONS: SOME REFLECTIONS ON METHODOLOGY AND DIRECTIONS FOR FUTURE RESEARCH Learning mathematics is a complex process. The introduction of digital technologies in the teaching of mathematics has been considered by some as an answer to the mechanical problems students present when they learn mathematics, allowing for the examination of conceptual understanding. This has proved not to be the case, as tools often introduce different problems and their use generates new sets of questions about student�’s learning (Lagrange, et. al., 2001; Laborde, 2004). Investigating the learning of mathematics with the use of computer tools implies addressing the complexity that is intrinsic to learning and devising methods that allow researchers to explore the way in which these tools shape students�’ actions. Using multiple perspectives is a feature of the enactivist methodology (Reid, 1996, p. 207) that we have found particularly useful in our investigation. This refers to the exchange of ideas with other researchers and also to the examination and re-examination of different kinds of data. Through the comparison of different events, in different ways, we are able to explain more. Our way of doing research, which is being gradually developed in the practice of creating resources and using them in the classrooms, has allowed us to find differences in the way students�’ use different computer programmes. We believe that the careful collection of different types of data, and the discussions we have amongst each other have greatly enriched and strengthened our interpretations. We found that Perimarea, by restricting students�’ activities and options for answers, reinforces the students�’ tendency to try out responses without giving much reflection to them. The Balance, on the contrary, seemed to invite students to act mathematically, using concepts form the textbooks in a variety of ways. We noticed that students started looking for explanations which could help them interact with their peers and teachers as they talked about their work with the Balance. Patterns of behaviour were shaped;
Lozano, Sandoval & Trigueros
4 - 96 PME30 �— 2006
that is, changes in the classroom cultures could be observed. This is a gradual process, we have been observing these students�’ for three months and it is only by detailed observation that we could appreciate the changes in students�’ actions. Our own learning has also been shaped by our work in these classrooms. Our methods have already started being modified. The instruments we are using for data collection are being refined. For example, on observation sheet 2, which we use for noting down mathematical actions, we now want to include a heading in which we specify mathematical actions observed when a student works with a particular computer programme. This with the idea of analysing, in more detail, the way in which students interact with the tools and how they become instruments in that process of interaction. Are students�’ mathematical actions with the programmes different from the ones they carry out when they are not working with the computer? How do students interact with the programmes we have not yet investigated? How can we modify programmes like Perimarea so that they invite students to be more reflective? These are the questions guiding us after the first phase of our investigation of the learning of mathematics with the computer programmes we are developing. References Davis, B., Sumara, D. and Luce-Kapler, R. (2000). Engaging Minds: Learning and
Teaching in a Complex World. London: Lawrence Erlbaum. Laborde, C. (2004). Instrument et processus d�’instrumentation. M2-EIAHD UE 3.
Université Joseph Fourier, Grenoble, 1-8. Lagrange, J.; Artigue, M.; Laborde, C. and Trouche, L. (2001). A meta studio on IC
Technologies in Education. In M. Heuvel-Panhuizen van den (Ed.), Proc. 25th Conf. of the Int. Group for the Psychology of Mathematics Education (Vol. 1, pp. 111-122). Utrecht, The Netherlands: PME.
Lozano, M. D. (2004). Characterising Algebraic Learning: an enactivist longitudinal study. Unpublished doctoral dissertation, University of Bristol.
Mariotti, M. A. (2001). Introduction to Proof: The mediation of a Dynamic software environment. Educational Studies in Mathematics 44, 25�–53.
Maturana, H. and Varela, F. (1992). The Tree of Knowledge: The Biological Roots of HumanUnderstanding. Revised Edition, Boston, Shambala.
Rabardel, P. (1999). Eléments pour une approche instrumentale en didactique des mathématiques. Actes de l'école d'été de didactique des mathématiques, Houlgate 18-21 Août, IUFM de Caen, 203 �– 213.
Reid, D. (1996). Enactivism as a Methodology. In L. Puig and A. Gutierrez (Eds.), Proc. 20th Conf. of the Int. Group for the Psychology of Mathematics Education (Vol. 4, pp. 203-209). Valencia, Spain: PME.
Varela, F. (1999). Ethical Know-How: Action, Wisdom and Cognition. Stanford, Stanford University Press.
2006. In Novotná, J., Moraová, H., Krátká, M. & Stehlíková, N. (Eds.). Proceedings 30th Conference of the International Group for the Psychology of Mathematics Education, Vol. 4, pp. 97-104. Prague: PME. 4 - 97
IS SUBJECT MATTER KNOWLEDGE AFFECTED BY EXPERIENCE?
THE CASE OF COMPOSITION OF FUNCTIONS Calin A. Lucus
Simon Fraser University, Canada
This study investigates inservice and preservice teachers’ subject matter knowledge as related to the topic of composition of functions. The study compares the subject matter knowledge of inservice and preservice teachers, with the purpose of probing into the effect of teaching experience on this component of the content knowledge, as defined by Shulman. The results of the study show that teaching experience did not affect teachers’ subject matter knowledge with regards to the composition of functions.
RESEARCH ON SUBJECT MATTER KNOWLEDGE OF FUNCTION The research literature that focuses on subject matter knowledge and its importance in the process of teaching/learning is fairly extensive. Shulman (1986), for example, focuses on the general importance of the subject matter knowledge. He divides content knowledge into three categories: subject matter knowledge (SMK), pedagogical content knowledge (PCK), and curricular knowledge (CK).
Teachers�’ content knowledge in general is also the focus of Ma�’s (1999) study. She introduces the notion of teaching with profound understanding of fundamental mathematics (PUFM). She describes what PUFM would encompass: an understanding of the terrain of fundamental mathematics that is deep, broad, and thorough:
"It is the awareness of the conceptual structure and basic attitudes of mathematics inherent in elementary mathematics and the ability to provide a foundation for that conceptual structure and instil those basic attitudes in students" (Ma, 1999, p. 124).
In the addition to the research done on the importance of the general subject matter knowledge, there is an extensive literature written on teachers�’ content knowledge of the topic of functions. Different researchers use different terms to analyze teachers�’ content knowledge, but most of these new terms overlap with the categories defined by Shulman (1986). Norman (1992) uses the terms of practical knowledge, pedagogical knowledge and content knowledge to describe teachers' knowledge related to the topic of functions. These categories are very similar to the categories defined by Shulman and they contain the same notions as the attributes that defined Ma�’s PUFM. The results of Norman�’s study indicate that "a majority of the teachers exhibited gaps, sometimes disturbing ones, in their conceptualizations of functions" (Norman, 1992, p. 229).
Lucus
4 - 98 PME30 �— 2006
Even (1993) investigates both subject matter knowledge and pedagogical content knowledge, and tries to determine the connection between them for a group of preservice mathematics teachers. Even finds that many of the participants in the study lacked the necessary subject matter knowledge. This fact had influenced their pedagogical thinking. Even sees this situation as problematic for the quality of the teaching: "A situation in which the secondary teachers at the end of the 20th century have a limited concept image of function similar to the one from the 18th century is problematic" (Even, 1993, p, 114). Her findings are in line with Shulman�’s opinion that pedagogical knowledge needs to be tightly connected with the subject matter knowledge, in order for the teaching to be successful. Loyd and Wilson (1998), in their study of the understanding of the concept of function of a secondary mathematics teacher, and its impact on the teaching of functions, define categories of knowledge to describe the participant�’s understanding of the function concept. These categories are: definition and image of the function concept, repertoire of functions in the high school curriculum, the importance and use of functions in varying contexts, and multiple representations and connections among them. These categories are similar to the themes described by Ma and Shulman. The findings of the study suggest that "teachers' comprehensive and well-organized conceptions contribute to instruction characterized by emphases on conceptual connections, powerful representations and meaningful discussions" (Loyd and Wilson, 1998, p. 270). The connection between subject matter knowledge and the impact this knowledge has on the class instruction with regards to the concept of function is the topic of the study conducted by Stein, Baxter and Leinhardt (1990). As a result of their study of Mr. Gene's (a classroom teacher) understanding of the concept of function, and his class instruction on the topic of functions, the researchers conclude: "limited subject matter knowledge led to the narrowing of instruction in three ways: (a) the lack of provision of groundwork for future learning in this area, (b) overemphasis of a limited truth, and (c) missed opportunities for fostering meaningful connections between key concepts and representations" (Stein, Baxter & Leinhardt, 1990, p. 659). Despite researchers' interest in the concept of functions, the specific topic of composition of functions is a subject that has a limited number of references in the literature. My study attempts to fill this gap. Vidakovic (1996) is among the few researchers that focused their attention on the topic of composition of functions and the inverse function of a function. She investigates how university students enrolled in a calculus class are able to work with the concept of inverse function, and how a computer environment might enhance students' ability to understand the concepts of composition of functions and the inverse function of a function. Vidakovic derives a description of a construction process for the developing schema of the inverse function of a function, based on general theory, observations of students, and her own understanding of the inverse function of a function concept. As a result of the study, Vidakovic designs an instructional treatment that might help the students �“to go through the steps of reflective abstractions which appear in a
Lucus
PME30 �— 2006 4 - 99
genetic decomposition of the inverse function�” (Vidakovic, 1992, p. 311). The treatment consists of a series of activities that use the computer programming language ISETL, with the goal to instil in students a better understanding of the composition of functions and of the inverse function of a function concept.
THEORETICAL FRAMEWORK To analyze the field data collected for this study, I use a theoretical framework derived from the framework proposed by Even (1990). Even�’s original framework contains seven facets: essential features, different representations, alternative ways of approaching the concept, the strength of the concept, basic repertoire, knowledge and understanding of the concept, and knowledge about mathematics. This theoretical framework is suited to investigate the subject matter knowledge as well as the pedagogical subject knowledge of teachers. The modified framework that I use for analyzing the field data contains the following criteria: 1. Essential features, the knowledge and understanding of the mathematical concept; 2. Knowledge about mathematics 3. Different representations and alternative ways of approaching the topic; 4. Basic repertoire; 5. Knowledge of the mathematics curriculum. The preliminary data analysis prompted me to modify the theoretical framework proposed by Even. I decided to condense two of the aspects described by Even, the essential features and the knowledge and understanding of mathematical concepts, in one criterion. I based this decision on the fact that the mathematical topic of composition of functions has what can be considered a dual character. This is in the sense that it can be understood as a mathematical operation, or it can be considered as a mathematical concept. Both meanings are adaptable to the analysis of its features, as well as to the kind of understanding teachers should display. At the same time, both criteria address teachers�’ subject matter knowledge, which is the focus of this study. The aspects of the content knowledge that each criterion addresses determined the other modifications of Even�’s framework. Consequently, the criteria of different representations and alternative ways of approaching a topic were combined in one criterion since they both relate to teachers�’ pedagogical content knowledge. A new criterion was introduced, "the knowledge of the mathematics curriculum", as it is related to Shulman�’s vertical curricular knowledge. The last modification of the framework is the integration of the �“strength of concept�” criterion into the �“knowledge about mathematics�”, and �“knowledge about the mathematics curriculum�” criteria. I decided on this modification of the initial framework because the preliminary data analysis made the task of distinguishing between the two last criteria and the strength of concept disputable. It seemed to me that the elements
Lucus
4 - 100 PME30 �— 2006
given by Even as characterizing the strength of concept should be integrated with the elements of the other two criteria. The first and second criteria of the new framework address the SMK of the participants in the study. The third and fourth criteria address the PCK of the participants, as well as the relation between the SMK and the PCK. The fifth criterion addresses specifically the CK of the participants in this study.
METHODOLOGY The Participants The participants in the study are a group of 10 preservice teachers, and a group of 8 practicing teachers. The preservice teachers were enrolled in the last university course before being eligible for certification. The practicing teachers were enrolled in a Masters program in Mathematics Education, and were professionals with various amounts of experience in teaching high school mathematics. In this paper I will use as illustrative examples the data collected from Sam, a preservice teacher, and Terry, an inservice teacher. Terry has over ten years of experience in teaching high school mathematics courses, while Sam completed his teaching practicum by teaching high school mathematics. Purpose of the Study The general purpose of my research was to explore teachers' and preservice teachers' knowledge as related to the topic of composition of functions. The specific purpose of my research was to attend to the question of the influence of teaching experience on the SMK. With this question in mind, this study probes into the difference between the SMK of preservice teachers vs. inservice teachers. Data Collection The instrument used to collect the field data was the clinical interview. The participants were asked to describe the prerequisites the students need to know before being taught the composition of functions, and then they were asked to describe the main ideas behind the topic of composition of functions. As a clarifying task, the interviewees were asked to find the composite function of two problematic examples of functions, and to explain their result. The task that the interviewees had to complete emphasized the role of the domains and ranges in the composition of functions.
RESULTS AND ANALYSIS For the first question of the interview, the participants answered in similar ways. They considered that the prerequisites for a successful teaching/learning process of the topic of composition of functions encompass the following: the students need to be able to manipulate algebraic expressions, the students need to know the definition of a function and various representations of this concept, and finally, the students need to be able to use the Cartesian graphs. Below I present an excerpt from the interview with Sam, the preservice teacher:
Lucus
PME30 �— 2006 4 - 101
Interviewer: When you teach composition of functions, what would you consider necessary for your students to know, prior to your teaching?
Sam: You mean like prerequisites? Interviewer: Yes, prerequisites for composition of functions. Sam: Number one, they need to know what a function is, being able to define it,
and to graph it. It is also necessary that they know what domain and range are, the vertical line test �… And they need to be able to manipulate algebraic expressions, as well as they have to be able to substitute for variables.
As seen from above, Sam considered that the first thing his students need to know is the definition of the function. Also, he mentioned the notions of domain and range. Terry�’s response to this question was very similar, with only a subtle difference. She said that she would reteach some of the previously learned topics, especially the definition of the concept of function, and would emphasize the need for the students to know about domain and range. For all individuals, the essential features that condition a successful learning/teaching experience of the composition of functions are the knowledge of the concept of function (including the notions of domain and range) and algebraic fluency. These prerequisites omit the multiple representations of the concept of functions, which seems to be essential in the teaching of functions in general and composition of functions in particular.
As a follow up question, the interviewees were asked to give a mathematical definition for the concept of function. The definitions given by Sam and terry are presented below:
Sam: Mathematically, a function is similar to a relation ... but the difference between a relation and a function is that for every domain, there's only one value that appears in the range. To be clearer, every x element from the domain has only one y element from the range that corresponds to it.
Terry: A function is a relation in which each element of the domain has exactly one correspondent in the range.
These definitions are acceptable definitions for high school mathematics. The individuals did not enunciate a modern definition for the concept of function. This, using the second criterion of the theoretical framework, denotes a relatively limited knowledge about mathematics.
The answers of the participants to the question �“What are the main ideas that you emphasize when teaching the composition of functions?�” were similar again. All participants put emphasis on the computational/mechanic process of computing the composite function. Following is an excerpt from Terry�’s interview:
Interviewer: What are your main goals when you teach the topic of composition of functions?
Terry: Composition of functions �… well I�’m teaching them how to do it, how to substitute a function within another function
Lucus
4 - 102 PME30 �— 2006
Interviewer: Okay �… Terry: I also mention that sometimes, the order in which you compose functions
counts. You don�’t get the same result if you reverse the order.
Sam answered along the same lines, mentioning though the notion of non-commutative operation explicitly:
Sam: I would tell the students that when you compose functions, the order matters. I would probably tell them that the composition of functions is non-commutative.
Analysis of the answers to this question through the lenses of the theoretical framework, reveals that the participants displayed a limited knowledge regarding the essential features of the topic of composition of functions. They did not mention the definition of the composite function or the roles of the domain and range.
Since the interviewees mentioned as a prerequisite the notions of domain and range, and none of them mentioned these concepts when talking about composing functions, I tried to clarify their idea about the role of these two notions in composing function. With this purpose, I asked the interviewees to compose two problematic functions. The two functions that the participants had to compose had restricted domains and ranges. They were asked to compose 24)( xxf , 2,0,2,2 yx and
9)( 2xxg , ),0[,3,3 yx . In the case of composing g with f, there are no overlaps between the range of the function f and the domain of the function g. For this reason, the two functions cannot be composed in this order. After correctly calculating the composite function, Sam obtained the result
5))(( 2xxfg . He rightly observed that this function cannot be defined in terms of high school mathematics, since the argument of the square root is negative for any x (complex numbers are not part of the high school curriculum in the public schools where Sam and Terry were teaching). He failed to give any explanation for his finding. The expected explanation is a direct consequence of the role played by the domains and ranges in the composition of functions. For this particular case, as mentioned above, the explanation is provided by the incompatibility between the range of the function f and the domain of the function g.
To the same task, Terry answered as follows: Interviewer: Well, I would like you to compose for me the following two functions:
24)( xxf and 9)( 2xxg .
Terry: Which way do you want them to be composed, f with g, or g with f? Interviewer: I think that I prefer ))(( xfg .
Terry: Ok [she completed the computations correctly]. Hmmm. I get something that does not make sense, 52x . I should slow down on my calculations ...
Interviewer: I think that your algebra is fine ...
Lucus
PME30 �— 2006 4 - 103
Terry: Then what is the problem? Interviewer: That is a question for you. The two starting functions were "Grade 11
functions", we completed the procedure correctly, so, what is going on? Terry: Um, you are right, my work is correct ... the functions are right, what is
wrong? Why do I get an impossible answer? You know, if I would work with complex numbers ...
Interviewer: Yes, but we do not teach complex numbers, and beside that, the starting functions do not deal with complex numbers ... we can restrict their domain ...
Terry: Hmmm. You know, I don't think I can answer this question right on the spot. I did not see something like this in the textbook or in the IRP's ... I probably have to go back and think about it more. [When referring to the �“IRP�’s�” (Integrated Resource Packages), Terry was referring to the official documents from the Ministry of Education which contain the prescribed curriculum.]
From the above transcript, the participants performed almost identical on the given task.
CONCLUSION The essential features/main ideas presented by the participants in this study denote a computational/mechanical/procedural approach in treating the topic of composition of function, and a poor conceptual knowledge of the topic. The inability to explain the results of their computations for the given task denotes a poor knowledge about mathematics. Initially, as exemplified by Sam and Terry, the participants seemed to be aware of the role of the domain and range for the teaching of composition of functions. However, when asked to clarify this role, they failed to prove that they actually knew what the role of domain and range is for the topic of the composition of functions. The reference to the definition of function, and domain and range as prerequisites seemed to be a mechanical "reflex", as opposed to a conceptual knowledge of the mathematical topic. Essential features and knowledge about mathematics are two of the framework�’s criteria that characterize the SMK. It is fair to conclude that the SMK displayed by the participants in this study is relatively weak. The inservice and preservice teachers gave similar answers to the questions of the interviews, and, similarly to Terry and Sam, the way they approached the "problematic example" of composing functions did not differ significantly. This suggests that in the case of composition of functions, the SMK is not influenced by the teaching experience. The findings of this study are counterintuitive, since one would expect that over the years of practice, the SMK of teachers would improve. The explanation could reside in the fact that the education system where the participants in the study practice, emphasizes the pedagogical aspects of teaching more so than the mathematical content of high school curriculum. The focus is on how to teach, and not on what to teach. What Shulman (1986) refers to as the
Lucus
4 - 104 PME30 �— 2006
missing paradigm from the study of teaching, namely teachers�’ and preservice teachers�’ content knowledge, is considered to be self developing once one starts teaching. This study brings arguments towards the fact that the SMK does not change with the teaching experience. References Even, R. (1990). Subject matter knowledge for teaching and the case of functions.
Educational Studies in Mathematics, 21(6), 521-544. Even, R. (1993). Subject-matter knowledge and pedagogical content knowledge:
prospective secondary teachers and the function concept. Journal for Research in Mathematics Education, 24(2), 94-116.
Loyd, G.M., & Wilson M. (1998). Supporting innovation: The impact of a teacher's conception of function on his implementation of a reform curriculum. Journal for Research in Mathematics Education, 29(3), 248-274.
Ma, L. (1999). Knowing and Teaching Elementary Mathematics. Mahwah, New Jersey: Lawrence Earlbaum Associates.
Norman, A. (1992). Teacher's mathematical knowledge of the concept of function. In G. Harel & E. Dubinsky (Eds.). The Concept of Function, Aspects of Epistemology and Pedagogy. (p. 215-232) Washington, DC: Mathematical Association of America.
Shulman, L.S. (1986). Those who understand: Knowledge growth in teaching. Educational Researcher, 15(2), 4-14.
Stein, M.K., Baxter J.A. & Leinhardt G. (1990). Subject matter knowledge and elementary instruction: A case from functions and graphing. American Educational Research Journal, 27, 639-663.
Vidakovic, D. (1996). Learning the concept of inverse function. Journal for Computers in Mathematicsand and Science Teaching, 15(3), 295-318.
2006. In Novotná, J., Moraová, H., Krátká, M. & Stehlíková, N. (Eds.). Proceedings 30th Conference of the International Group for the Psychology of Mathematics Education, Vol. 4, pp. 105-112. Prague: PME. 4 - 105
CLASSROOM FACTORS SUPPORTING PROGRESS IN MATHEMATICS
Irene F. Mackay University of Hawai'i
This research study investigated factors related to the classroom environment and their effects on pupil progress in mathematics during the transition from primary to secondary school. The focus of this report is on classroom elements and factors that contribute to a classroom environment that supports pupil progress in mathematics. The results indicated that certain elements within the mathematics classroom environment supported progress. The primary school classroom also had an important part to play. INTRODUCTION The results of international comparative surveys such as the Third International Mathematics and Science Survey (TIMSS) raised concerns in Scotland, as in other countries, about pupil progress in mathematics with an official report (SOEID, 1997) identifying a particular concern regarding pupil progress in the early secondary years. Changes at the transition to secondary school have been shown to be the cause of a number of negative effects on pupils, such as drop in performance and decrease in self-esteem (Croll, 1983; Hirsch and Rapkin, 1987). There are many areas where pupils must make adjustments at the transition and unfortunately not all pupils are capable of making the same level of adjustment (Nisbet & Entwistle, 1969) The classroom is where teaching and learning take place, and the classroom environment is considered by Haladnya, Shaughnessy & Shaughnessy (1983) to be among the most powerful indicators of student outcomes. If this is so then what happens within the classroom environment is vital to pupil success. Black and Wiliam (1998) considered that certain countries/state policies viewed the classroom as a ‘black box’ where the theory is that if inputs are fed into the ‘box’ from outside then specific outputs, such as pupil improvement will follow. When the desired outcome is not evident one of the reasons offered is that “teachers have to make the inside work better”. However, although certain events within the environment are within the teacher’s control, there may be others that are not. The focus of this report is on the elements of support that exist within the mathematics classroom environment and factors that affect pupil progress. LITERATURE The classroom environment comprises a number of elements and dimensions. Fraser (1994, p493) describes these as a subtle concept, not only including participants’ perceptions and experiences within that environment but also their relationships with each other. Studies of the classroom environment show pupils are affected in a number of ways, for example attainment and personal characteristics. In fact, the
Mackay
4- 106 PME30 — 2006
classroom environment effects were considered by O’Reilly (1975) to be a stronger influence on attainment than on pupils’ personal and social characteristics. As the transition to secondary school coincides with the transition to adolescence for many pupils, Eccles et al. (1993) considered that the secondary school classroom environment should contain elements that support adolescent growth, such as increased opportunities for pupils to show independence and use higher cognitive skills. The researchers found that in many classrooms that there was a mismatch of pupil needs and supportive classroom elements. Hunt’s (1975) person-environment fit theory has been used by a number of researchers, such as Fraser and Fisher (1983) to study the effects of the classroom environment on the pupil, and the results showed that pupils are supported by certain elements in the secondary school classroom environment. These were found to help pupils to become more socially and academically confident (Ryan & Patrick, 2001). Other studies have highlighted supportive elements related to the classroom (Dart et al., 2000; Fisher & Rickards, 1996) such as a high level of teacher interaction with pupil and pupil perception of performance. In contrast, some pupils identified negative elements associated with the classroom environment, including pupil dissatisfaction with the class and pupil perception of strictness of teachers (Anderman & Maehr, 1994). In identifying positive and negative aspects of a classroom environment there emerges the possibility of the existence of an ideal classroom environment, one where the elements support academic and psychosocial growth. The ideal classroom might be similar to the arena of comfort described by Simmons et al. (1987, p1231), that is an area where the pupil is comfortable, especially with role relationships, and challenged and to which s/he can withdraw to be invigorated. Through consideration of the ‘person-environment fit’ theory and establishment of good practice within the classroom, it may be that the ideal environment can be created, although it may be that the ideal classroom environment for one pupil may not be perceived as such by another. This report is part of a larger study investigating factors at the transition affecting pupil progress in mathematics and shows that certain elements of the classroom environment relate to support for the pupil. AIM OF THE CURRENT STUDY The research reported here is part of a broader study (Mackay, 2005) investigating specific classroom environment factors that affect pupil progress in mathematics. There are many elements and dimensions that comprise the mathematical classroom environment and the focus of this report is the classroom profile that supports pupil progress in mathematics and the possibility of an ideal classroom. METHOD This study set out to measure, in quantitative terms, the progress of pupils in mathematics. A longitudinal programme was employed that pre-tested pupils at the end of primary school (P7) and post-tested the same pupils at the end of first year in
Mackay
PME30 — 2006 4- 107
secondary school (S1). These quantitative results were set within an understanding of the classroom environment. This environment is complex and multifaceted and not readily quantified and therefore it was important to use a range of qualitative data collection techniques to capture its dynamics. A number of additional measures were therefore combined, including surveys of teachers and pupils’ perceptions of the classroom environment, from which a view of the classroom was constructed. The final two measures were a series of observations and interviews for although teacher and pupil perceptions set the structure for the description of the environment an additional dimension can be added through contributions from an observer, who can comment objectively on items such as teacher behaviour (Fraser, 1994). Classroom environments are usually measured through the use of questionnaires with each questionnaire consisting of a number of items for each dimension. The pupil questionnaire, My Class Inventory (Fraser, Malone and Neale, 1989), contains six dimensions each with four items and was used as the basis for the pupil questionnaire in this study. The six dimensions used were pupil satisfaction (S), parental interest (PI); value of mathematics (V); classroom interaction (CI); perceived performance (PP) and teacher interest (TI). The flexibility of the use of the questionnaires makes the measurement of environments particularly suitable for ‘before and after’ events such as the primary-secondary transition. The teacher questionnaire also reported on specific dimensions related to those of the pupil questionnaire and was adapted from the teacher questionnaire, TCEM (Feldlaufer, Midgley and Eccles, 1988). The dimensions were: pupil enjoyment of the classroom (S), enjoyment of teaching mathematics (V and PP), the difference s/he makes (TI), classroom interaction (CI), and parental interest (PI). Lastly, the observer schedule evolved after a series of observations in the pilot study, and contained objective and subjective items related to the classroom environment and the interaction within it. A pilot study of two years was designed to precede the research study. This enabled the initial data collection measures produced to be to validated and future problem areas for the main study identified. The main study was planned to have two planned cycles each of two years. The sample pupils for this study were selected from a group of primary schools associated with three secondary schools in North East Scotland and represented 25-30 per cent of the S1 group. RESULTS The results show the measure of pupil progress, the construction of a classroom profile combining data from the analyses and a factor analysis to highlight combinations of the classroom dimensions. Pupil progress The research results confirmed that most pupils (74.5%) made progress in mathematics in S1, with one small group, improvers, (23/267) making exceptional progress and another (17/267) where pupils regressed exceptionally, regressors. In
Mackay
4- 108 PME30 — 2006
the correlation analysis of the classroom dimensions and pupil progress, results showed a significant relationship between pupil perceived performance and progress over S1. Classroom profile A classroom ‘profile’ was constructed for all primary and most (28/38) secondary school classes with the structure based on the scoring of results from pupil perceptions of classroom dimensions, teacher perceptions of their classroom environment, pupil comments and observer perceptions. A significant relationship between Secondary Perceived Performance (SPP) and primary score, SPP and secondary score, and SPP and progress, with correlation coefficients 0.330**, 0.462**and 0.289** respectively (N=267, **p<0.01). The mean scores of the total S1 pupil perceptions of the six classroom dimensions were used as the basis for the initial classification of class sets into three categories. Mean scores for the 28 classes ranged from 7.4 to 10.9 out of a maximum of 12. The mean score for each teacher’s five dimensions was then calculated, the scores ranged from 15 to 20 out of a possible 24. The third element of the classroom profile was the set of pupil comments and these were graded on a 5-point scale, with a highest score of five awarded to where the total number of pupil comments in a class contained no more than one negative comment ranging to a score of one in classes where many pupils did not respond or most comments were negative. The final element contributing to the class profile was from the observer schedule. A 5-point scale was used for each class with five as the highest possible score. The 5-point scale was related to the scoring recorded in the observer’s schedule. From a combination of these scores an ‘index’ figure was calculated, and classes then placed in rank order according to the index. The calculation attempted to incorporate a balance of all numerical scores available and added pupil mean, half of teacher mean (to reduce the mark out of 24 to out of 12), the observer score and the pupil comment score.
Class Class Mean Score
Teacher Mean Score
Pupil Comment
Observer Comment
Index (rounded to 1d.p.)
A 10.5 16.6 5 5 7.2 B 8.6 15.0 3 4 5.8 C 7.9 18.2 1 1 4.8
Table 1.1 Elements of a Secondary Classroom Profile The mean of the scores was then calculated. The index could not be used for another study, as the reliability of the figure had not been tested. The final profile was then classified into one of three categories: highly positive (++), positive (+) and less positive (+-). Table 1.1 displays scores from the elements of the secondary school classroom that contributed to the calculation of a class index. Pupils who were exceptional improvers and regressors were then identified in their class. Table 1.2 displays this information for primary pupils, distinguishing those who merely improved/regressed and those who improved/regressed exceptionally,
Mackay
PME30 — 2006 4- 109
and Table 1.3 for those in secondary school classes. Each classroom profile was then extended to include information such as the level and spread of attainment of the class, level of teacher/pupil interaction (high, medium or low), teacher’s comments on their class, class size and gender split, number of sample pupils and any other relevant data gathered during the observation visits. Category Number
of classes Number of sample pupils
Number of improvers n = 23
Percentage of improvers
Number of regressors n = 17
Percentage of regressors
Highly Positive
7
134
13
56.5
5
29.4
Positive 7 85 9 39.1 4 23.5 Less positive
3
48
1
4.3
8
47.1
Total 17 267 23 17
Table 1.2 Three Categories of Primary Classes showing improvers and regressors
No. of classes In each category
No. of pupils in class
Sample size (% N=267)
Improvers (n=23)
Progressed (% n=199)
Regressed (% n=68)
Regressors (n=17)
Index
8 ++ 214 82 (30.7)
13 71 (35.7)
11 (6.2)
3 6.5-7.4
15 + 363 112 (41.9)
9 82 (41.2) 30 (44.1) 5 5.5-6.4
5 +- 119 42 (15.7)
1 22 (11.1) 20 (29.4) 6 4.5-5.4
Table 1.3 Three Categories of Primary Classes showing improvers and regressors This information helped to identify factors that might relate to support for pupil progress in the classroom environment. Class sets labelled as Upper, Middle (mixed) or Lower sets related to the secondary school ‘setting’ and all three categories in Table 1.3 were found to contain classes at each level. Teacher/pupil level of interaction in each class was measured by the observer and found to be ‘high’ in all highly positive classrooms. Classroom Factors The 12 items on primary and secondary classroom dimensions for all pupils were subjected to principal components analysis (PCA) using SPSS. Prior to performing PCA the suitability of data for factor analysis was assessed. Principal components analysis revealed the presence of five components with eigenvalues greater than one, explaining 19.8%, 14.0%, 11.2%, 9.8% and 9.4% of the variances respectively. To help the interpretation of these components Varimax rotation was performed showing the components on each factor. (Table 1.4).
Mackay
4- 110 PME30 — 2006
Classroom Dimensions
Component 1 Mathematics
Component 2 Primary School
Component 3Secondary classroom
Component 4 Parental Interest
Component 5Classroom Interaction
SPP 0.712 SV 0.689 0.413 PPP 0.644 PV 0.576 0.546 PTI 0.781 PS 0.641 SS 0.691 STI 0.789 PPI 0.834 SPI 0.684 PCI 0.792 SCI 0.748
Table 1.4 Varimax Rotation of Five Factor Solution for Classroom Dimensions The factors identified highlighted perceived performance in P7 (PPP) and S1 (SPP) and perceived primary teacher interest (PTI). CONCLUSION AND DISCUSSION In this study, a small number of secondary school classrooms with common elements were identified where participants held highly positive views of the classroom, had a high level of two-way teacher and pupil interaction and contributed to a positive climate of enjoyment and challenge for all pupils. Certain factors were evident in these classrooms that were significantly related to pupil progress: teacher/pupil relationship, primary teacher enthusiasm and interest, pupil perceived performance (one of the classroom dimensions), and most pupils returned positive comments about their experience in the mathematics classroom. This group of classrooms environments with a highly positive profile therefore supported most pupils but were they ideal? It appeared that for some pupils the classrooms supported them academically and provided stimulation and challenge, confirming that certain criteria for the ideal classroom had been met. If the ideal classroom exists, then there are a number of issues to resolve. The first main one relates to why and for whom the classroom is ideal. Classes considered ideal in this study were seen to contain mostly pupils who either improved or were improvers. It was evident that the majority of pupils in the class appreciated the positive aspects and for them the classroom environment was ideal. Small numbers of pupils did not progress in these classes so for them the classroom may not have been ideal. It is not possible to gauge if the pupil would have made more or less progress in another environment. The second issue is related to the possibility of the creation of the ideal classroom. It might be that it just ‘happens’ coincidentally. All essential components might be in place at one time, or perhaps an element of teacher manipulation contributes to such an environment. If the ideal classroom was the result of teacher manipulation, then it is likely that all teachers would attempt to
Mackay
PME30 — 2006 4- 111
create this type of environment. Elements may exist that prevent the creation of such a classroom such as location and resources such as the composition of pupils in the class and the support available for adolescent growth to confirm their status in secondary school. A third issue relates to the composition of the class and the pupil relationships with the teacher and each other. It may be that their behaviour contributes to the negative classroom profile but in turn the negative profile does not support these pupils’ progress. An important factor for pupil success in secondary school was the primary school classroom environment. The results showed that a small number of primary school classroom environments had a highly positive profile and were significantly related to pupil progress. It was interesting to note that pupils who were improvers in secondary school had mostly come from primary schools with a highly positive or positive profile. The teacher was the key to the primary classroom profile. The teacher variable was dependent on his or her knowledge, confidence in teaching mathematics, enthusiasm about the subject and interest shown in the pupils and their progress. The classroom profile is important in that if a highly positive classroom can be created then pupils placed there are more likely to make progress than if they were placed in one with a less positive profile. The findings from this study support part way the existence of an ideal classroom environment, a ‘comfort zone’. However, this study did not investigate the effects on pupil adjustment to multiple change including the move to secondary school.
References Anderman, E. M., & Maehr, M. L. (1994). Motivation in schooling in the middle grades.
Review of Educational Research, 64(2), 287-309. Black, P. & Wiliam, D. (1998). Inside the black box: raising standards through classroom
assessment. Assessment in Education, 5(1), 7-74. Croll, P. (1983). Transfer and pupil performance. In M. Galton & J. Willcocks (Eds.),
Moving from the primary classroom. London: Routledge and Kegan Paul. Dart, B., Burnett, P. C., Purdie, N., Boulton-Lewis, G., Campbell, J., & Smith, D. (2000).
Students' concept of learning, the classroom environment and approaches to learning. Journal of Educational Research, 93(4), 262-271.
Eccles, J. S., Wigfield, A., Midgley, C. Reuman, D., Maciver, D., & Feldlaufer, H. (1993). Negative effects of traditional middle schools on students' motivation. The Elementary School Journal, 953(5), 553-574.
Fisher, D., & Rickards, T. (1996). Associations between teacher student interpersonal behaviour and student attitudes in mathematics classes. Paper presented at the West Australian Institute of Educational Research,
http://education.curtin.edu.au/waier/forums/199 Fraser, B. J. (1994). Research on classroom and school climate. In D. Gabel (Ed.), Handbook of Research on Science Teaching and Learning. New York: Macmillan
Mackay
4- 112 PME30 — 2006
Fraser, B. J., & Fisher, D. L. (1983). Use of actual and preferred classroom environment scales in person-fit environment fit research. Journal of Educational Psychology, 75(2), 303-313.
Fraser, B. J., Malone, J. A., & Neale, J. M. (1989). Assessing and improving the psychosocial environment of mathematics classrooms. Journal for Research in Mathematics Education, 20(2), 191-201.
Haladnya, T., Shaughnessy, J., & Shaughnessy, J. M. (1983). A causal analysis of attitude toward mathematics. Journal for Research in Mathematics Education, 14(1), 19-29.
Hirsch, B. J., & Rapkin, B. D. (1987). The transition to Junior High School: A longitudinal study of self-esteem, psychological symptomatology, school life and social support. Child Development, 58, 1235-1243.
Mackay, I. F. (2005). A time of change. Unpublished Ph.D. thesis, Open University, Milton Keynes, United Kingdom.
Nisbet, J. D., & Entwistle, E. (1969). The transition to secondary education. London: London University Press.
O'Reilly, R. (1975). Classroom climate and achievement in secondary school mathematics classes. The Alberta Journal of Educational Research, XXL (3, December), 241-248.
Ryan, A. M., & Patrick, H. (2001). The classroom social environment and changes in adolescents' motivation and engagement during middle school. American Educational research Journal, 38(2), 437-460.
Scottish Office Education And Industry Department (1997). Achievement for all. Edinburgh: SOEID.
Simmons, R. C., Burgeson, R., Carlton-Ford, S., & Blyth, D. A. (1987). The impact of cumulative change in early adolescence. Child Development, 58, 1220-1234.
2006. In Novotná, J., Moraová, H., Krátká, M. & Stehlíková, N. (Eds.). Proceedings 30th Conference of the International Group for the Psychology of Mathematics Education, Vol. 4, pp. 113-120. Prague: PME. 4 - 113
A REMEDIAL INTERVENTION IN ALGEBRA Laura Maffei – Maria Alessandra Mariotti
Mathematics Department – University of Siena
This report presents the first results of a pilot study involving three 9th grade classes The study was based on a teaching experiment, consisting of a remedial activity centred on the use of the Algebra microworld, Aplusix, and aimed at detecting and overcoming well known pupils difficulties in symbolic calculation. A specific research goal of this study concerns the evolution of students’ attitudes towards their errors, comparing their behaviour within and without the software environment. The analysis of the collected data shows the effectiveness of the intervention not only in terms of decrease of the number of errors, but mainly in terms of development of consciousness, self confidence, and self control.
INTRODUCTION Difficulties encountered by pupils in getting competence in algebraic calculation are well-known, they have been addressed many times and from different point of views (Freudenthal, 1983, Tall & Thomas 1991, Kieran 1992). In this contribution we don't intend to deal with the issue of algebraic manipulation in general, but to present and discuss some results, coming from a pilot study conducted in three 9th grade classes, and showing how computer mediated activities affect the meta-cognitive level. The experimentation consists of a remedial activity devoted to students showing specific difficulties in symbolic calculation. More specifically, we aim to investigate the effectiveness of the use of a particular Algebra microworld, Aplusix, in this remedial activity. Even if we present a very limited contribution to a general didactical problem, we believe that it acquires its value beyond the limits of algebra domain. In fact, the obtained results seem to open new interesting perspectives concerning the use of a particular software both in respect to the specific objective in terms of calculus skills and in respect to the more general objective concerning the development of meta-cognitive attitudes, i.e. consciousness and control on one’s own activity. In other words, the specific interaction between the subject and the machine, set up in the Aplusix environment, seems to determine significant changes in pupils’ attitude towards errors and impasse.
THE DIDACTICAL PROBLEM According to the Italian traditional school approach, at the 9th grade, a great part of the school time is devoted to symbolic calculation. After being introduced to the notion of literal expression and to the main rules for expanding and factorizing, students are requested to memorize the formulas of the main products (second, third
This research study is part of the TELMA-project (www.itd.cnr.it/telma).
Maffei & Mariotti
4 - 114 PME30 — 2006
power of a binomial, difference of squares…). Lots of students, for different reasons, meet great difficulties in getting this basic competence, which on the contrary assumes a great value, both for the students and the teachers. In our study we focused our educational objective on specific aspects of students’ difficulties in symbolic calculation in order to analyse and, possibly, give some suggestions to solve this didactical problem. We formulated two related hypothesis. On the one hand, the intrinsic complexity of memorizing (Norman, 1988) leads to the difficulty to memorize a specific formula, even if its origin and its meaning has been well understood; on the other hand, an aspect of the didactic contract (Brousseau, 1997), related to algebraic calculation, leads students to interpret the task only in terms of memorization, hindering them to exploit alternative strategies, when the required formula is not available to memory. These hypotheses have been developed in the light of the new relationship between the machine and the student; in particular, the feedback offered by the machine seemed to present a great potential in both supporting memorization and overcoming the constraints coming from the didactic contract (Mariotti & Maffei, 2005). This contribution is centred on results concerning a specific aspect related to the internalization of the machine control.
THE MICROWORLD APLUSIX Aplusix is a computer-system in which students work within the domain of arithmetic and algebra (Nicaud & al. 2004). In this environment pupils may develop the calculations that they are used to perform in paper and pencil.
The peculiarity of the microworld consist of its twofold functionality (action /revision): on the one hand it offers the user (for instance a student) a well-structured space where to perform tasks, on the other hand it allows the user (a teacher, a researcher, or a student) to revise step by step the given solution. Moreover, in the ‘action’ functionality, the microworld provides two main kinds of feedbacks, that we call with control and without control mode. In the with control mode Aplusix verifies the calculations by checking the equivalence between two consequent steps and points out the presence of errors (Fig. 1). Blue cross lines show that the expression you are writing is not well-formed (i.e. a plus sign need an argument), black lines show that the first expression is equivalent to the second, red cross lines show that the first expression is not equivalent to the second.
Fig. 1. The three different signs provided by Aplusix in the with control mode.
Maffei & Mariotti
PME30 — 2006 4 - 115
In the without control mode no feedback is provided (Fig. 2).
Fig. 2. In the wihout control mode, a single black line links permanently two consequent steps.
Thanks to a good editor, tasks can be organized creating suitable lists of exercises, so that the teacher may plan pupils’ activities according specific didactic goals. Afterwards, it is possible to revise the work done by means of the Trace function. This facility is very useful for the teacher who, passing through the sequence of his /her actions, can observe the difficulties encountered and the errors committed by a pupil; but it is also useful for the students who can revise their work and correct their own errors. This command present significant advantages compared with the revision of a work done with paper and pencil, where many of the traces of the solution process are lost, so that one can't reconstruct the precise order in which the calculations have been developed. Finally, Aplusix offers another interesting tool: the command detached step. This command opens a new independent working space, where new calculations can be carried out. In the following, we are going to focus on the functioning and the effect of this particular facility.
THE OBJECTIVES OF THE STUDY The study had a twofold objective. On the one hand, a didactical goal consisting of the retrieval of specific skills in algebraic manipulation, i.e. to help students to memorize formulas without losing, rather on the contrary consolidating, their algebraic meaning. On the other hand, a research goal concerning the study of the role played by the specific microworld in reaching the didactical goal: if, and in affirmative case, how interacting with Aplusix may help to overcome the encountered difficulties. In particular, attention focused on investigating the functioning of Aplusix’s tools, both in the cognitive processes involved in formulas’ memorization, and in the meta-cognitive processes related to become aware of one’s own difficulties and to manage one’s own resources to improve calculation performances. In this latter direction, Aplusix’ potentialities seem to be very promising, especially thanks to its specific kind of control on pupils’ actions. The following section presents a brief analysis of this control function according to a specific theoretical framework.
Maffei & Mariotti
4 - 116 PME30 — 2006
THE THEORETICAL FRAMEWORK The hypotheses we started from became more refined through the choice of a theoretical frame providing the key elements both to plan the intervention and to analyze the obtained results. In the following we are going to briefly identify these key elements; they come from different theoretical frames, but find a coherent application in the description and interpretation of phenomena we are interested in. Memorization As far as memory is concerned, the management of resources seems to be centred on the use of particular artefacts, which constitute a support to memorize. As Norman points out, it is not easy to build an effective support to help the act of remembering.
"There are two different aspect to a reminder: the signal and the message. […] the ideal reminder has to have both components, the signal that something has to be remembered, the message of what it is." (Norman, 1988)
Moreover, the design of artefacts aiming to foster the memorization process, has to take into account that each support is efficient if, and only if, it promotes strategies of utilization. This general criteria inspired the organization of the didactical environment starting from the functionalities provided by the software Aplusix; thus, the default message of error was integrated with a message of help, suggesting the use of the detached step and orienting pupils’ actions to autonomously reconstruct the missing formula. In so doing we aimed not only to foster the memorization process, but also to overcome the constraints of an inadequate didactic contract. The attitude to errors The core of a remedial activity concerns the evolution of the relationship between the student and his/her own error, in particular the assumption that pupils have to personally assume the responsibility for overcoming their own errors.
"Even if the teacher recognises the student’s error and intervenes, it is up to the student to modify his behaviour: but if the student is to significantly change his behaviour he first has to be convinced that the change has to be made, that the existing behaviour lead to failure." (Zan, 2002a)
The teacher's intervention concerns the organization of a context where pupils are led to modify, in an autonomous way, those behaviours that bring them to fail. Zan identifies two essential processes that a teacher has to foster and to strengthen: the attainment of consciousness and the possibility to activate personal control processes (Zan, 2002b). Consistently with this hypothesis, we assume that the interaction with the machine contribute to make students aware that something is wrong, but at the same time stimulate them to engage themselves in detecting what is wrong and in correcting it. The role of the medium As far as memorization is concerned, and more generally the control and management of memory resources, the vygotskian frame offered us an additional
Maffei & Mariotti
PME30 — 2006 4 - 117
element to plan and analyse our intervention. According to Vygotsky, the use of particular supports to memorize may have not only a specific effect improving the performance in a specific situation, but also a general effect supporting the development of general abilities regarding the memorization function (Vygotsky, 1974). Moreover, Vygotsky claimed more general effects regarding the development of consciousness and control on one’s own actions.
"The use of auxiliary signs breaks up the fusion of the sensory field and the motor system and thus makes new kinds of behaviour possible." (Vygotsky, 1978)
Assuming such general hypothesis, drawn from the Vygotsky’s theory, we assume the internalization of specific control means, rooted in the use of Aplusix tools. In particular the use of the detached step may originate a sophisticate way of control consisting in isolating difficulties and careful treating of complex calculations.
THE EXPERIMENT The activity starts with an initial test in paper and pencil, the same test will be repeated at the end of the teaching intervention, with the aim evaluating the improvement in pupils’ performances. Then three different phases of intervention are planned, centred on the use of Aplusix. Each phase is characterized by:
a list of tasks to be accomplished in the “with control mode”; a specific message of help accompanying the default message of error.
The first phase aims to consolidate the basic understanding of symbolic manipulation as the successive application of the distributive law, and to make pupils conscious of the fact that memorization, although not indispensable, is useful and possible. Consistently with this goal, the help message appearing on the screen suggests to use a detached step, where to accomplish the complete calculation. This suggestion is meant to induce the students to repeat the same schema of calculation, again and again. As a consequence, we expect the need for shortcuts emerge, motivating the use of formulas in order to speed the time of calculations. The second phase, aims at fostering the memorization of the main formulas. The message of help invites the students to reflect in order to correct their mistakes and, as a last chance, offers to open a "help-window". This window shows a list of possible formulas from which the students are invited to select the formula they need. The list is temporally and penalty is counted. Finally, the last phase aims at helping pupils to overcome the specific difficulty related to apply formulas. Here again the main suggested support is given by the use of the detached step that we expected can play a crucial role. After each session students are requested to write a report on what they think they have learnt, both in terms of formulas and in terms of strategies of solution, and comment on their use of Aplusix. The specificity of any phase is not so much in the type of task proposed, rather in the interaction between the user and the machine mediated by the feedback of the software and in particular by the help message, suggesting to reflect, and employ alternative strategies. At the end of three phases, the post-test is passed in the “without control mode”, and finally, in the last session
Maffei & Mariotti
4 - 118 PME30 — 2006
Fig. 3a Fig. 3b
Scrivere in una forma equivalente senza parentesi
Scrivere in una forma equivalente senza parentesi
students are asked to revise their work using Trace. In this revision the control will indicate the errors, and students are asked to correct them on their notebook. During all the phases, students will work individually; the teacher’s intervention is limited to answer technical questions.
RESULTS AND DISCUSSION Besides the encouraging results concerning pupils’ performances (Maffei, 2004), the analysis of the data confirms our hypotheses concerning the crucial role played by Aplusix tools, in particular the detached step, in making students overcome their difficulties. It seems that students, after a first phase when just follow the suggestion of the help message, develop personal strategies adapted to their needs. By reason of brevity, we cannot give detailed examples of this evolution, but we can use the words of Alessio for a description of his experience. During an interview Alessio explains his use of the detached step.
Interviewer: To what goals did you use the detached step? Alessio: It has been useful for the cube of a binomial given that at the beginning I
didn't remember it well, as a consequence I have rewritten the formula in order to know it better. Most of the times I have used the step for these reasons, well, but sometimes also to accomplish some calculus.
Interviewer: What kind of calculus? Alessio: Well, because if I noticed that I had made an error to apply a formula,
then I wouldn’t have erased all, I was used to use the help, I mean...in the detached step I made the whole exercise with the distributive.Then, after pasting the result above I saw what was wrong by comparing the wrong solution with the correct solution.
Finally, consider the following example showing a typical behaviour after the remedial intervention. The task requires the expansion of main products and it is part of the test-session, thus it is carried out in the without control mode.
Antonio (Fig. 3a) shows difficulties in applying the formulas, and in order to overcome these difficulties uses the detached step command, that is, opens a new environment where he writes the formula of the cube of a binomial. Antonio moves to the detached step to overcome the impasse. The instruction means "Write in an equivalent form without parenthesis" and the comment means "Cube of binomial". Back to the main working space, Antonio successfully applies the formula (Fig. 3b).
Maffei & Mariotti
PME30 — 2006 4 - 119
Even more significant is the Antonio’s behaviour during the revision session after the final test. The control activated in this phase makes Antonio realize of his error; according to the requirements of the task the student provides the correct version of the exercise in his notebook (Fig. 4a e 4b).
The student shows to be able of identifying the type of error; actually, he writes “Maybe the signs?”. The hypothesis he makes suggests him a more global approach, thus he moves to a new line where he reconstruct the needed formula. In other terms, Antonio reproduces the way of acting as if he worked in the environment created by the detached step. According to our hypothesis such a behaviour can be interpreted as the effect of the student’s internalization of the support provided by the microworld, which reappears in a different context, the paper and pencil environment, still maintaining significant features of the original Aplusix tool, for instance the structure of the writing, respecting the equivalence between two following lines. According to the vygotskian theory, the microworld seems to have acted as a medium suitable to develop general schema for the retrieval of formulas. Moreover, according to the Zan's assumptions, the individual relationship student-error seems to be confirmed: Antonio, like many other students, seems to have achieved a good level of self-consciousness and self-control as a consequence of his work within Aplusix. Generally speaking, the control offered by the microworld seems to lead students to change the way to relate to their own errors, as the following extract from an interview can witness:
"Aplusix has some good features: everything seems easier than in paper and pencil. When I see the red lines, I understand that I have made an error (or more than one), I like it very much...on the contrary, when my teacher corrects my test I don't even look at the errors, the most important thing I pay attention to is the good or bad mark I got." (Ylenia)
This comment shows a development in perceiving ones own errors. In particular, it is interesting to remark how the student compares the feedback provided by Aplusix (“when I see the red lines”) with the teacher feedback on errors. It is worth to remark that this change is consistent with what was suggested by Zan, who claims that the students have to clearly realize their errors, before they make any effort to overcome the encountered difficulties.
Scrivere in una forma
equivalente senza parentesi
Fig. 4b. What appears on the screen and Antonio’s self-correction The final comment means “So the correct exercise is (…) I had got the the last sign wrong.
Maffei & Mariotti
4 - 120 PME30 — 2006
CONCLUSIONS In spite of its limits, the pilot experiment provided good evidence confirming our hypotheses: not only all the students involved in the experiment improved their performances in algebraic calculation, but mainly improved their performances at the meta-cognitive level: in particular, the study showed clear evidence of the evolution of students’ awareness and self control. The study is still in progress, and new teaching experiments have been planned for the current academic year. A fine grain analysis of data is expected to confirm the first result, but mainly is expected to provide further insight on the meta-cognitive processes, in particular on the functioning of the software tools in the evolution consciousness and self control. References Brousseau G. (1997). Theory of didactical situations, in mathematics. Dordrecht: Kluwer. Freudenthal, H. (1983). Didactical phenomenology of mathematical structures. Dordrecht:
Kluwer. Kieran, C. (1992). The learning and teaching of School Algebra. In D. A. Grouws (Ed),
Handbook of Research on Mathematics Teaching and Learning. N.C.T.M. Maffei, L. (2004). Un intervento di recupero in algebra. Tesi di Laurea in Matematica
presso 'Università degli Studi di Pisa'. Mariotti, M.A. & Maffei, L. (2005, in press). Difficoltà in algebra: un intervento di
recupero. La matematica e la sua didattica. Norman, D. (1988). The psychology of everyday things. Basic Book. Nicaud & al. (2004). Mixing microworld and Cas features in building computer systems
that help students learn algebra. Inter. Jour. of Comp. for Math. Learning, 9(2), 169-211. Tall, D. & Thomas, M. (1991). Encouraging versatile thinking in algebra using the
computer. Educational Studies in Mathematics 22, 125-147. Vygotsky, L.S. (1974). Storia dello sviluppo delle funzioni psichiche superiori e altri scritti.
(trad. It. a cura di M. S. Vaggetti, Giunti-Barbera, Firenze). Vygotsky, L. (1978). Mind in society: The development of higher psychological processes.
Cambridge, MA: Harvard University Press. Zan, R. (2002a). Episode II: Marco and Anna - Each following their own path da Learning
from learners. Proceedings of the 26th PME Conference, Norwich, UK. Zan, R., (2002b). Metacognizione, convinzioni e affettività: un approccio integrato alle
difficoltà in Matematica. A. Contardi, B. Piochi (eds) 'Le difficoltà in matematica. Metodologia e pratica di insegnamento.
2006. In Novotná, J., Moraová, H., Krátká, M. & Stehlíková, N. (Eds.). Proceedings 30th Conference of the International Group for the Psychology of Mathematics Education, Vol. 4, pp. 121-128. Prague: PME. 4 - 121
THE PROBLEM-SOLVING ELEMENT IN YOUNG STUDENTS' WORK RELATED TO THE CONCEPT OF AREA
Joanna Mamona-Downs* Ioannis Papadopoulos**
University of Patras, Greece* University of Macedonia, Greece**
There are extant many studies that examine primary and early secondary students' existing and developing understanding of the concept of area for plane figures. In this paper, the focus is shifted to consider the problem-solving skills that may accrue from exposition to tasks related to the calculation of area. In particular, the working of two 7th grade students on one specific task is examined vis-à-vis certain executive control issues about the selecting, handling and adaptation from a body of previously known methods concerning area determination.
INTRODUCTION Empirical studies made by educators investigating students' understanding of mathematical concepts often utilise non-standard tasks in order to test and challenge fully the students' cognition about the notions under examination. However, the introducing of non-standard tasks might bring in aspects of problem solving based on strategy making, which does not necessarily contribute any new insight about the concept image. (See, e.g., Tall & Vinner, 1981, for the idea of the concept image.) On the other hand, the stratagems made will tend to refer to the relevant conceptual backdrop implied in the task environment. When the strategy facet dominates the students' attention, we shall say that the students are engaged on problem-solving activity ancillary to a concept; this is to be contrasted with concept enhancement evinced from exposition to non-standard tasks. As the strategy facet is still relevant to the concept, though in a more operational or functional role, it can be regarded intermediate to teaching about problem solving and teaching via problem solving, a distinction often made in the literature (for example, Schroeder & Lester, 1989). In this paper, we shall present part of a study that, by careful design of the tasks given to the participating students, encouraged problem-solving activity ancillary to the concept of area. This study was motivated by an earlier research project involving primary students geared to examine and to extend understanding of area and its preservation under certain actions. The results from this earlier undertaking, though revealing many new interesting angles through its novel, computer aided, teaching material, had similarities to those found in other papers treating the same topic at the same level (for example, Baturo & Nasons, 1996; Clements & Stephan, 1998). However, it came to our attention that the students had problems in setting up their methods in order to apply their conceptual knowledge (beyond appropriately evoking it). This problem-solving aspect deserves explicit examination, but this perspective
Mamona-Downs & Papadopoulos
4 - 122 PME30 — 2006
has not been taken up explicitly in research as yet. Hence the new study presented here. The students were 7th graders who had participated in the project in earlier years; the topic area still deals with area measurement. Given the limitation of the length of the paper, we restrict ourselves to one case study involving one task and two students. This case is chosen because it displays much interesting executive control exercised in the handling, and even adaptation, of a body of methods in calculating or comparing areas known by the students. (For a full exposition of executive control, see Schoenfeld, 1985.) Clearly, focusing on these methods means that the control must relate to the conceptual background. Given this, the following issues are of particular significance:
Did the students exploit the source of previously known methods and if so, how?
What was the quality of the rationale behind the changes of direction in approach that the students made?
What modes of verification did the students employ? The paper will describe the problem-solving activity ancillary to the area concept evident in the two students' working, especially with regard to the three issues listed above concerning executive control.
STUDENTS’ BACKGROUND, DESCRIPTION OF THE TASK AND METHODOLOGY
The two participants (Nikos and Katerina) were 7th graders attending secondary school in Greece. Through their regular classes in mathematics, they were taught some basic concepts of geometry, including certain shapes and their properties (mostly limited to triangles, quadrilaterals, and circles). They also knew the formulas for the calculation of the area of each kind of these shapes. However, in addition both students took part in earlier stages of our research project that took place in parallel with the normal teaching. Their attendance of this gave them experience in the usage of various tools enabling them to calculate area of more irregular plane figures. The tools available to them included: the usage of grids in a geo-board, the subdivision of an area unit (usually a square) into sub-units, length measuring tools that allowed calculating area especially for the separate parts of a decomposed region, and the cut and paste method. For the limited problem-solving component at this stage of the project, both these students showed themselves particularly adept. Our expectation, then, was that they would fare better than other students when the design of the tasks emphasized control skills; such design aspects were aimed for in the final stage of the project. In this paper we select one of the tasks from the final stage and present the students' problem-solving behavior for it.
Mamona-Downs & Papadopoulos
PME30 — 2006 4 - 123
Figure 1: Presentation of the task
Apply two cut and paste actions to obtain the rectangle from the triangle. Is the area of the rectangle bigger, smaller or the same as the area of the triangle?
Our rationale in forming the above task is the following: The students were familiar with the cut and paste technique, and indeed had experience with tasks where several cut and paste actions were required. However they were never confronted with the circumstance where multiple actions were required in such a way that the different actions were inter-dependent, as it is in the case of the task given here. In terms of problem solving the special interest of the task is to see whether the students could coordinate the two actions; the making of the first action must anticipate the second. Another interest is whether the students would attempt to answer using other methods despite the directions given in the task statement. This task is drawn from a session of about two hours where four other tasks were given. The students worked individually and were asked to vocalise their thoughts while they were performing the task. This was conducted on the lines of protocol analysis as set out by Simon & Ericsson (1984). Protocol analysis gathered in non-interventive problem solving sessions is especially appropriate for documenting the presence or absence of executive decisions in problem solving, and demonstrating the consequences of those executive decisions (Schoenfeld, 1992). Protocol analysis in character minimises the interference of the interviewers (the authors), but it was desirable to use more direct questioning concerning the motivation of the students' s working. In order to do this, we interviewed the students a few days after the session. Both sets of data were tape-recorded, transcribed and translated from Greek into English for the purpose of this paper.
RESULTS Katerina’s problem solving processes. After reading the task, Katerina started immediately on a putative solution procedure. She initially constructed the grid squares lying completely in either the given triangle or rectangle. An influence for this is that over the last two years, there was an accumulated experience where the task environment included such an array of dots, hence the construction of the grid squares was a familiar strategy for her. The next step (also according to past experience) was to divide the partial square units into
Mamona-Downs & Papadopoulos
4 - 124 PME30 — 2006
sub-units. When we asked her in the interview to explain her decision, she justified ‘As I saw it, I immediately remembered the tasks we dealt with in primary school’. But a few seconds later she rejected her initial approach, making her first shift in her thinking process:
K.4.5 What I have done is useless.
We asked her why she had rejected her first thought. Her response was: �“The instructions are talking about two movements. If I were to use grid I would have to move the square units one by one and consequently I would realise more than two movements in order to solve the problem.�”
She decided then to divide the triangle into three parts ‘a’, ‘b’ and ‘c’ (Figure 2): K.4.10 I do not have to move the ‘c’ part at all, because it is already in the
interior of the rectangle.
Katerina very quickly made clear that the c-part is the common area between the two shapes, a finding that would help her to proceed to the solution of the problem. But the way she approached the solution after this decision was purely arithmetical. She tried to estimate the area of each sub-shape based again on grounds of square units formed from the array of dots provided. The existence of partial square units within the shapes was an obstacle; as a response, she made a second change of direction. She noticed the right angle in the d-part of the rectangle outside the triangle. Accordingly, she decided to 'move' the a-part (a right-angled triangle) inside the 'excess' part of the rectangle such that the right angles coincide.
A question remained how she managed to draw the hypotenuse of the triangle in its new position. In the interview her response was: “I counted the dots. I knew that the right angle fits perfectly in the upper left corner so I counted the distance between the edges”. Then, she transferred the b-part as it is shown in Figure 2. Finally, Katerina appreciates the conservation of area in this context. In the question concerning which area was bigger, her response was: “Just the same. Since no piece is left over”. Niko’s Problem Solving Processes.
Nikos initially spent an amount of time to be familiar with the task before deciding how to proceed. His initial thought was that the ABX triangle was an isosceles one (Figure 3). He tried to prove it by measuring the length of the two supposedly ‘equal’ sides. This was based on the dots of the array provided but his measurements were inaccurate because the array allows exact measurement only
Figure 2. Katerina’s partition of the triangle and transfer of the resulting parts.
Mamona-Downs & Papadopoulos
PME30 — 2006 4 - 125
horizontally or vertically. He obtained approximations of the real length. This finally prompted him to declare that his effort was useless. At this point he made his first shift:
N.4.17 Perhaps I have to cut this triangle….that is outside and put it in the interior of the other shape….
He drew then the BDW and EWX triangles. He had already made an appropriate dissection but as yet did not see how to transfer the resulting parts into the rectangle: N.4.46 I have to find a triangle that is exactly the same with the AEC one.
Because of his inability to work in a geometrical context, he turned to an arithmetical one, for a second time
during this session, by comparing lengths. At this point he stated that the point E is the middle of the line segment AX.
N.4.71 The E point separates the AX segment line into 2 equal parts. So, the AE segment line fits exactly to the EX one.
N.4.72 A region is left over… It’s a right angle N.4.76 It means that I have to put the triangle so as the EX side to be adjacent the
EA side….. N.4.81 It seems logical that the two triangles EWX and BDW will have together
the same area with the AEC triangle. N.4.82 I have to verify that this is true. I will find the area of the two former
triangles and I will compare it with the area of the AEC one.
Despite that his intuition informed him that the two triangles together had the same area with the third one, he felt that he had to be sure about that. He again resorted to an arithmetical approach. He measured approximately bases and heights, he applied the known formula for the calculation of the area of a triangle but the two outcomes were different. He accredited this to inaccurate measurements.
N.4.89 It means that I probably made some errors during the process of the calculation of the area of one of the shapes.
N.4.90 I have to look it again, to try again.
His instinct, then, made him to insist to show that his initial intuition was correct, suggesting that this intuition was so strong to make him to assume that his failure for verification was due to erroneous calculations. Indeed when we asked him later why he insisted, he said.
�“I was pretty sure that the area of EWX and DWB together was the same as the area of AEC so, when I could not confirm it arithmetically I was convinced that it was due to my erroneous calculations and consequently I had to try again with numbers�”.
Figure 3. Nikos’ partition of the triangle
Mamona-Downs & Papadopoulos
4 - 126 PME30 — 2006
Finally he came back to the geometrical approach. N.4.114 I will cut the DBW triangle and I will adjust it to the ACE angle. N.4.115 Then, I will cut the EXW triangle and I will put it so as the side EX to be
adjacent to the AE side and the W vertex to look towards the C point.
Nikos' explanation why he delayed to reach the solution is interesting: N.4.122 I think I delayed to reach the solution because I dealt from the very
beginning with the formulas and I did not consider it as a single shape. N.4.123 I did not try to find the relationship between the shape I was asked to
make through the transformation and the already existed one.
DISCUSSION Below we interpret the results from the fieldwork: 1) What techniques did the students employ? Katerina read the problem and immediately chose to apply one method from the stock of previously met methods dealing with area measurement. There is evidence that this decision was influenced by the fact that an array of dots were provided in the presentation of the task, and this acted as a cue to argue in terms of completing and counting unit squares lying completely in the figure. (In Mamona-Downs, 2002, it is claimed that some configurations (�‘cues�’) act as a mental trigger to access particular domains of knowledge.) This was done despite of the direction to use the cut and paste method. Nikos’s initial behaviour on encountering the task contrasts with that of Katerina. First, he took some time in familiarising himself with the task environment and in making some preliminary exploration. This could be related to Polya' s suggested first step 'getting Acquainted' in obtaining a solution in problem solving, (see Polya, 1973, p. 33). Second, Nikos’s starting point involves a structural conjecture (a particular triangle is isosceles) and brings in his past experience in measuring lengths within the context of the array of dots as a validation device. In fact both students employed this method to check on their geometric ideas in other places. However, perhaps more significant was that in the end both students assigned the first transfer of region not exactly fitting in with the cut and paste protocol. This is because the shape is put into the frame of the rectangle, but not such that one side is shared with the figure that it had been cut from. The heuristic in Polya about ‘can you use the result?’ seemed to influence them to widen old methodology into one that is more flexible and approaches the more general image of dissection, as described in Hartshorne, 2000, p. 213. 2) The decision making Both students made various changes in approach in their solving activity. Katerina rejects her original idea employing the grid because this method did not meet with the task specification of ‘two movements’. However, this reason would seem a side consideration towards explaining her previous remark: ‘What I have done is useless’. Clearly, she found difficulties in her method, but instead of trying to articulate these she picks out a task specification that she had previously neglected. However, this
Mamona-Downs & Papadopoulos
PME30 — 2006 4 - 127
proved to be in practice a useful act of control; if a method that one is using does not seem to be working, look back at the task formulation to make sure that there is not a clue there how to proceed in another direction. This allowed Katerina to completely change her focus, and she creates a partition of the triangle into three parts. She states a motive for doing this; one part is common to both the triangle and the rectangle and so would be invariant, leaving just the other two parts to be transferred. This could be regarded as an act of control, based on exploiting perceived structural similarities (Mamona-Downs & Downs, 2005). Nikos started his work by trying to show a triangle was isosceles, where there did not seem much purpose in doing this vis-à-vis the task requirement. (Taking such blind directions and their effect have been reported in Schoenfeld, 1985.) However, Nikos soon rejects this approach, but like Katerina, does this out of practical considerations: the soundness of the basic idea remains unchallenged. Later, Nikos encounters a clash between some data obtained from measurement and his geometric intuition. He makes a decision: to regard the measurement as unsound, and to direct his attention to strengthen his argument based on visualisation (such that the role of measurement would become redundant). This he does quite convincingly in the end. As a final note, one of Nikos' s closing remarks (N.4.123) suggests that he felt in retrospect his working should have been more directed towards what was required, again pointing to the heuristic 'Can you use the result'.
3) Verification In previous exercises for which these students encountered the method of cut and paste, the ‘transferral of area’ was perceived by eye; the more sophisticated context of this task, though, made both students feel the need to verify that the two transferrals indeed achieved what was desired. This in itself is an important act of control; the matching of the pieces was not so transparent that it could be left un-argued. The two students finally did the verification differently; Katerina’s was based on measurement, Nikos on visualisation. Notice that Katerina’s line of verification was far more utilitarian compared to Nikos’, so likely Nikos’ final apprehension of the solution was the more insightful.
CONCLUSIONS Executive control is concerned with the solver’s evaluation of the status of his/her current working vis-à-vis the solver's aims. In general, this requires mature deliberation in projecting the potential of the present line of thought, married with an anticipation how this might fit in with the system suggested from the task. Schoenfeld (1985) has indicted that many undergraduate mathematics students have very poor executive control skills. On the other hand, some quite young students do seem to have some ability to make deliberate decisions that lead to effective changes in approach. (Schoenfeld, 1992). The paper contributes to the research question: What executive control skills can we expect from younger students? Our study, involving 12 year olds, reveals in particular:
Mamona-Downs & Papadopoulos
4 - 128 PME30 — 2006
(i) Students can have the ability to adapt and extend known methods in response to a novel problem-solving situation, via understanding that the situation affords a broader approach. (ii) Students can affect changes in approach, but the evidence from this study suggests that these changes are mostly motivated by not being able to advance rather than pin-pointing why the approach is not functioning as wished. Students are able to take advantage of overt structural features appearing within the task environment to frame their strategies. (iii) When students understand in outline a likely way of solving the task, they can insist on forming verifications rather than just assuming that their ‘mental’ plan will work out. References Baturo, A. and Nasons, R. (1996). Student teachers' subject matter knowledge within the
domain of area measurement. Educational Studies in Mathematics, (31), 235-268. Clements, D. & Stephan, M. (1998). Measurement in Pre K2 mathematics. In Clements D,
Sarama J, and Dibiase AM (Eds), Engaging young people in mathematics: Standards for Early Childhood Mathematics Education, (pp. 299-320), Mahwah, NJ, Lawrence Erlbaum Ass.
Hartshorne, R. (2000). Geometry: Euclid and Beyond. New York: Springer - Verlag. Mamona-Downs, J. (2002). Accessing knowledge for problem solving. In Vakalis I.,
Hughes Hallet D, et al (Compilers), Proceedings of the 2nd Conference on the teaching of mathematics at the undergraduate level (electronic form), Iraklion (Greece), John Wiley, NY.
Mamona-Downs, J. and Downs, M. (2005). The identity of problem solving. Journal of Mathematical Behavior (24), 385-401.
Polya, G. (1973 Edition). How to solve it. Princeton: Princeton University Press. Schoenfeld, H.A. (1985). Mathematical problem solving. Academic Press, Inc. Schoenfeld, H.A. (1992). Learning to think mathematically: problem solving, metacognition
and sense-making in mathematics. In Grouws D (Ed.), Handbook for Research on Mathematics Teaching and Learning. (pp. 334-370). New York: MacMillan.
Schroeder, L.T. and Lester, K.F. (1989). Developing Understanding in Mathematics via Problem Solving. In Traftor R Paul (Ed.), New Directions for Elementary School Mathematics (pp. 31-42). Reston: NCTM.
Simon, H. and Ericsson, A. (1984) Protocol Analysis. Verbal Reports as Data. Cambridge, MA: MIT Press.
Tall, D. O. and Vinner, S. (1981). Concept Image and Concept Definition in Mathematics with particular reference to Limits and Continuity, Educational Studies in Mathematics, 12(2), 151 - 169.
2006. In Novotná, J., Moraová, H., Krátká, M. & Stehlíková, N. (Eds.). Proceedings 30th Conference of the International Group for the Psychology of Mathematics Education, Vol. 4, pp. 129-136. Prague: PME. 4 - 129
ON STUDENTS’ CONCEPTIONS IN VECTOR SPACE THEORY Mirko Maracci
Dipartimento di Matematica, Università di Siena, Italia.
The study we are going to present is part of a research project which aimed to identify and analyze undergraduate and graduate students�’ difficulties and errors in solving Vector Space Theory problems. We report on some students�’ errors related to very basic notions of that mathematical domain. More precisely we introduce the ck¢ model, and then we investigate, with the aid of such theoretical framework, the possibility to interpret some students�’ emerged errors as instantiations of knowing.
INTRODUCTION The importance of Linear Algebra in many fields of mathematics, science and engineering is widely acknowledged by both mathematicians and scientists, who consider Linear Algebra as an important mathematical prerequisite for undergraduate students in science and technology. Coherently Linear Algebra courses are basic for a wide variety of disciplines at the tertiary level such as mathematics, physics, computer science and engineering. Nevertheless Linear Algebra education is a quite recent research field. In 2000 Dorier edited an extensive overview on the state of research in Linear Algebra education at tertiary level, later revised by Dorier himself and Sierpinska (2001) on the occasion of an ICMI Study on math education at tertiary level. From those surveys it emerges that researchers seemingly share the view that difficulties in Linear Algebra (no matter what concepts are involved) are due to general features of the field or to the axiomatic approach usually followed in teaching Linear Algebra. As a matter of fact, in their review Dorier and Sierpinska do not mention any studies focusing on specific concepts of Linear Algebra; and indeed, as far as we know, the only exception is constituted by Nardi’s study on students’ concept-images of span and spanning set (Nardi, 1997). This apparent ‘characteristic’ of research in Linear Algebra education contrasts, for instance, with research in Calculus where many studies are devoted to the analysis of the cognitive difficulties related to specific concepts such as those of limit, continuity, function, derivative and so on.
OUR STUDY In this paper we report on a part of our doctorate research project (Maracci, 2005). The general goal of that research was to identify undergraduate and postgraduate students’ errors and difficulties in solving Vector Space Theory (VST from now on) problems.
Maracci
4 - 130 PME30 — 2006
More in detail, our study focuses on students’ difficulties and errors related to basic notions of VST: linear combination, linear dependence/independence, spanning set, basis, and dimension. Methodology Our research is articulated in two different but interlaced phases: (a) the analysis of undergraduate textbooks, and (b) the observation and qualitative analysis of undergraduate and graduate students’ behaviours to solve VST problems. This report focuses only on the findings of this latter phase. The study involved 15 students in Mathematics: 8 first year undergraduates1, 4 last year undergraduates and 3 PhD students. The methodology of investigation was that of the clinical interview (Ginsburg, 1981; Swanson et al., 1981; Cohen & Manion, 1994): each student was presented with two or three different problems to be solved in individual sessions; no time constraints was imposed over the problem solving sessions, which were recorded. The use of the clinical interview is motivated by its flexibility which makes this methodology highly suitable for uncovering phenomena, providing rich descriptions and generating hypotheses (Swanson et al., 1981). The analysis of the transcripts of the interviews highlighted a number of students’ difficulties concerning basic notions of VST. Some preliminary results have been discussed in Maracci, 2003 and 2004. Here we present some of the observed difficulties and errors of which we propose an analysis in terms of the ck¢ model2 (Balacheff, 1995 and 2000; Gaudin, 2002). We are going to introduce such model in the next section.
THE CK¢ MODEL The ck¢ model is an attempt to model the subject’s knowing of mathematics within the theory of situations (Brousseau, 1997). This model explicitly takes in charge the assumption – widely accepted in the community of mathematics educators – that:
‘errors are not only the effect of ignorance, of uncertainty, of change, […] but the effect of a previous piece of knowledge which was interesting and successful, but which now is revealed false or simply unadapted.’ (Brousseau 1997, p. 82)
and it attempts to acknowledge both the possible lacking of global coherence and the local efficiency of the subject’s knowing. The problem of elaborating such a model is faced by formally defining the notion of ‘conception’3. According to the ck¢ model a conception is the particular instantiation 1VST is a subject matter of the first year undergraduate courses in the Mathematics Faculties of the
Italian Universities.
2ck¢ is the acronym for conception, knowing and concept. 3Artigue (1991) remarks that the notion is widely used even if rarely defined in math education.
Maracci
PME30 — 2006 4 - 131
of a knowing which, as such, has proved to be efficient with respect to a certain domain. Within the model, a conception is defined as a quadruplet constituted by:
a set P of problems, on which the conception is efficient – also said the sphere of practice of the conception;
a set R of operators, i.e. a set of both physical and mental actions which the individual can perform to solve a problem;
a system L of signifiers, which allows to represent both problems and operators;
a control structure , which is usually implicit and allows to choose operators, decide their relevance, evaluate their efficiency and decide whether a problem is solved or not.
The first three components are those to which Vergnaud refers in order to define a concept (Vergnaud, 1991); to these components the control structure is added. Once conceptions are defined, one can also formally define knowings and concepts, anyway we won’t present here the complete modelization which can be found in Balacheff, 1995 and 2000. Let us remark that a given problem may not belong to the sphere of practice of any conception. On the other hand, we can attest a conception because it emerges as a means to solve a problem:
‘c’est sa manifestation en tant que moyen de résolution dans le problème qui nous permet d’attester d’une conception’ (Gaudin 2002, p. 37).
The need emerges to precise the relationship among problems (and their solutions) and conceptions. According to the ck¢ model, the solution of a given problem is a sequence of operators of possible different conceptions which transform the problem itself into one belonging to the sphere of practice of a conception. As consequences, the subject’s errors in solving problems might be interpreted in terms of conceptions, i.e. in terms of knowings efficient on certain sets of problems.
OUR QUESTIONS We can now explicitly pose the questions we address in this report:
Is it possible to interpret subjects’ difficulties in terms of operators and corresponding controls?
More precisely, is it possible to recognize hypothetical operators and controls with a ck¢-conception like internal consistency? Let us note that we are not facing the problem of fully characterizing the conceptions to which operators and controls could be referred. To what extent a conception can be characterized on the basis of the analysis of students’ behaviours is an interesting point which we can not address here. Up to now just a few studies have been carried on within the ck¢ model, as a consequence many relevant methodological questions need to be deepened.
Maracci
4 - 132 PME30 — 2006
THE PROBLEM The problem we will refer to during our discussion is the following:
Problem. Let V be a R-linear space and let u1, u2, u3, u4 and u5 be 5 linearly independent vectors in V. Consider the vector u= 2u1-1/3u2+u3+3u4 �– u5.
Do there exist two 3-dimensional subspaces of V, W1 and W2, such that W1 W2=Span {u} ?
Do there exist two 2-dimensional subspaces of V, U1 and U2, which do not contain u and such that u belongs to U1+U2 ?
The answer to both the questions is that such subspaces of V exist. In order to successfully approach the problem one might try to describe the conditions which the subspaces must fulfil in terms of their possible generators. For instance, Span{u, u1,u2} and Span{u,u3,u4} verify the conditions posed in the former question and Span{u1,u2} and Span{u3+3u4,u5} verify the conditions posed in the latter one. Although different other approaches to the problem are possible (and many other couples of subspaces could be found) all the interviewed students followed the one sketched above.
DATA ANALYSIS In this section we will show and analyze few excerpts from the transcripts of the interviews. Before that, we are going to specify the methodology followed for the analysis4. Methodology of analysis We articulate our analysis in 3 steps:
1. coherently with the ck¢ definition of solution of a problem, we look for possible operators among what the subjects said and did to solve the given problem.
2. Then we take as possible controls those results (definitions and propositions) of VST which are ‘coherent’ with the highlighted operators.
3. We express operators and controls in the same semiotic system whenever it is possible and suitable.
The choice made explicit in step 2 is motivated by the hypotheses that:
one constructs operators and controls also attending lectures, studying textbooks, lecture notes, that is by studying the mathematical theory itself;
being knowing, operators and controls share potentialities coherent with the mathematical theory.
4As previously remarked, also because of the low number of studies with the ckc model, we think
that methodological aspects are particularly interesting and relevant.
Maracci
PME30 — 2006 4 - 133
Moreover as far as operators or controls are compatible with results of the mathematical theory, they also share at least part of the domain of validity of those results. An example In this paragraph we present and analyze a brief excerpt of Nic’s interview. Nic, a last year undergraduate student, has correctly answered the former question of the problem. When she approached the latter, she asserted since the very beginning that the answer is negative.
83. Nic: I think it is not possible... because... because in order to write u I need 5 linearly independent vectors, in order to write it as [element of the] sum of two 2-dimensional vector spaces I can at most use 4 vectors, because they are linearly independent...
Nic spent several minutes to investigate the second question of the problem, without questioning this assertion neither succeeding to elaborate more deeply on it. The argument exposed in this item represents the core of her solution to the problem. In the quoted item we can recognize the mobilisation of at least two different operators:
r1: in order to write u I need 5 linearly independent vectors r2: in order to write it as [element of the] sum of two 2-dimensional vector spaces I can
at most use 4 vectors
As for r2, it is perfectly coherent with many results (not stated by the subject) of VST, among the others let us quote:
s2a: The dimension of the sum of two 2-dimensional vector spaces is less then or equal to 4.
s2b: A subspace W of a given vector space V is itself a vector space. s2c: The dimension of a vector space is the number of vectors of its bases. s2d: Given a basis of a vector space, its vectors can be expressed as linear combination
of the vectors of the basis. s2e: The dimension of a vector space is the highest possible number of linearly
independent vectors.
In fact consistently with the five above statements, one can conclude that the elements of a 4-dimensional vector space, such as U1+U2, can be expressed as linear combination of the elements of one of its bases, which contains 4 vectors. Moreover, a 4-dimensional vector space does not contain any linear combination of 5 linearly independent vectors because it does not contain systems of 5 linearly independent vectors at all. Though r2 is coherent with many results of VST, it does not appear adequate to solve the given problem. In our opinion such inadequacy may derive from the fact that s2b induces to consider a subspace (U1+U2) as a vector space neglecting the peculiarities of being a subspace: that is the existence of an ‘over’ vector space where systems of
Maracci
4 - 134 PME30 — 2006
5 (or more) linearly independent vectors may exist as well as linear combination of more than 4 linearly independent vectors. Even if r2 is not adequate for the given problem, it is anyway adequate when referred to vector spaces. Finally, we want to stress the importance within VST of s2b, which has played a central role in our analysis: indeed s2b allows to ‘transfer’ notions and properties (i.e. notions of dimension, basis, spanning set) from vector spaces to subspaces and it makes the notion of subspace itself meaningful and relevant. Let us now discuss r1.
r1: in order to write u I need 5 linearly independent vectors
Possible controls coherent with r1 may be: s1a: If v1,..., vk are linearly independent vectors of a given vector space V over a field K,
and a1,...,ak, b1,...,bk are scalars in K such that a1v1+...+akvk=b1+...+bk then aj=bj for each j=1,...,k.
s1b: Given a basis of a vector space, each vector of V may be expressed in a unique way as a linear combination of the elements of that basis.
The two statements express similar results: the former one is more coherent to r1 which does not explicitly mention bases, whereas the latter one shares with r1 the same semiotic system of representation. According to s1a and s1b a linear combination a1v1+...+anvn of n linearly independent vectors v1,...,vn cannot be written as linear combination of a subset of those vectors themselves (but some of the scalars a1,...,an are zero). That is, coherently with s1a and s1b, the number of vectors in a linear combination can not be decreased. Here again, r1, s1a and s1b constitute a coherent system which is coherent with VST too, even if inadequate to solve the given problem. Throughout this section we have spoken of adequacy or inadequacy of operators and controls to solve problems. When we say that operators and controls are adequate or inadequate to solve a problem, we express the point of view of a conception5 – the observer’s one – over another conception – the subject’s one: operators and controls mobilised by the subject cannot be inadequate from her own perspective. More excerpts For the sake of brevity we cannot discuss other examples so in detail, anyway we present some more excerpts from the collected data which, in spite of slight differences, reveal the mobilisation of operators and control consistent with the ones just discussed. Let us quote the cases of Fra and Lau, respectively first year and last year undergraduate students: they both correctly answered to the former question of the
5 Within the model, formal definitions are given of some possible relations (i.e. falsity) between
different conceptions.
Maracci
PME30 — 2006 4 - 135
problem and then they both failed to solve the latter one. The following items contain the main arguments on which Fra’s and Lau’s respective solutions are based.
74 Fra: I think that it is not possible because u is linear combination of 5 linearly independent vectors… and if one can write it as… that is, it should be an element which can be written as the sum of an element of U1 and of an element of U2, and then it should be linear combination of at most 4 linearly independent vectors [...]
86 Fra: [...] anyway u is written as linear combination of 5 linearly independent vectors… then I cannot write u with only 4 linearly independent vectors
286 Lau: u is linear combination of 5 linearly independent vectors, how can I find the fifth if I have at most 4 linearly independent vectors [in U1+U2]?
295 Lau: u is linear combination of 5 linearly independent vectors... yes, no, well, 5 linearly independent vectors which I cannot find in the sum [of U1 and U2], because the sum is made by 4, at most 4 linearly independent vectors.
The operators respectively mobilised by Fra and Lau evoke more possible controls in addition to the previously discussed ones; unfortunately we cannot analyze them in detail. Just to give some more hints of a possible further analysis, we specify an operator mobilised in the item 74 and we quote some of the corresponding controls.
r3: u can be written as the sum of an element of U1 and of an element of U2, and then it should be linear combination of at most 4 linearly independent vectors .
Many of the above discussed controls are more or less directly related to r3, to them we can add at least the following:
s3a: The elements of U1+U2 can be written ad the sum of an element of U1 and of an element of U2.
s3b: The sum of 2 linear combinations of 2 vectors each, is a linear combination of 4 vectors.
s3c: Four two by two linearly independent vectors may be not linearly independent.
SUMMARY In the previous section we reported a few excerpts which reveal similar errors and difficulties of different students. The highlighted errors and difficulties concern very basic notions of VST: linear combination, linear independence, basis, spanning set. As for the analysis of such errors and difficulties within the ck¢ model, we highlighted systems of operators and controls which present the internal consistency of a conception, in ck¢ terms, and we showed that some of the emerged difficulties may be interpreted in terms of such operators and controls. The hypothesized systems of operators and controls are at some extent coherent with definitions and propositions of VST: in fact problems exist to which such operators and controls give solutions consistent with and acceptable within VST. Therefore these systems of operators and controls express a knowing which shares potentialities consistent with the mathematical theory. Difficulties and errors are due
Maracci
4 - 136 PME30 — 2006
to the inadequacy – from the point of view of VST – of this knowing to solve the posed problem. References Artigue, M. (1991). Epistémologie et didactique. Recherches en Didactiques des
Mathématiques, 10 (2/3), 241- 285. Balacheff, N. (1995). Conception, connaissance et concept. In D. Grenier (Ed.) Didactique
et technologies cognitives en mathématiques, séminaires 1994-1995(pp. 219-244). Grenoble, France: Université Joseph Fourier.
Balacheff, N. (2000). Les connaissance, pluralité de conceptions le cas des mathématiques. In P. Tcherinikine (Ed.) Actes de la conférence �‘Ingénierie de la Connaissance�’ (pp. 83-90). Toulouse, France.
Brousseau, G. (1997). The theory of didactical situations in mathematics. Kluwer Academic Publishers, The Netherlands.
Cohen, L. & Manion, L. (1994). Research Methods in Education. Routledge, London and New York.
Dorier, J.-L. (Ed.) (2000). On the teaching of linear algebra. Kluwer Academic Publishers, The Netherlands.
Dorier, J.-L. & Sierpinska, A. (2001). Research into the teaching and learning of linear algebra. In D. Holton (Ed.) The Teaching and Learning in Mathematics at University Level - An ICMI Study. Kluwer Academic Publisher, The Netherlands, pp.255-273.
Gaudin, N. (2002). Conceptions de fonction et registres de représentation: étude de cas au lycée. For the Learning of Mathematics, 22 (2), pp. 35-47.
Ginsburg, H. (1981). The Clinical Interview in Psychological Research on Mathematical Thinking: Aims, Rationales, Techniques. For the Learning of Mathematics, 1(3),pp.4-11.
Maracci, M. (2003). Difficulties in Vector Space Theory: a compared analysis in terms of conceptions and tacit models. In N.A. Pateman, B. J. Doherty, & J. Zilliox (Ed.s) Proceedings of the 2003 Joint Meeting of PME and PMENA (Vol. 3, pp. 229-236). Honolulu, Hawai‘i, USA: PME and PMENA.
Maracci, M. (2004). On some difficulties in Vector Space Theory. To appear in European Research in Mathematics Education IV. Proceedings of the 4th Conference of the European Society of Mathematics Education. Barcelona, Spain: CERME. Available at the URL: http://cerme4.crm.es/Papers%20definitius/14/wg14listofpapers.htm
Maracci, M. (2005). Nozioni elementari di teoria degli spazi vettoriali: uno studio esplorativo su concezioni e modelli (PhD dissertation). Università di Pisa, Italia.
Nardi, E. (1997). El encuentro del matemàtico principiante con la abstracciòn matemàtica: una imagen conceptual de los conjuntos generados en el anàlisis vectorial. Educaciòn Matemàtica , 9(1), pp.47-60.
Swanson, D. et al. (1981). The Clinical Interview: Validity, Reliability and Diagnosis. For the Learning of Mathematics, 2(2), pp. 31-38.
Vergnaud, G. (1991). La théorie des champs conceptuels. Recherches en Didactiques des Mathématiques , 10 (2/3), 133-169.
2006. In Novotná, J., Moraová, H., Krátká, M. & Stehlíková, N. (Eds.). Proceedings 30th Conference of the International Group for the Psychology of Mathematics Education, Vol. 4, pp. 137-144. Prague: PME. 4 - 137
TOWARDS THE DEVELOPMENT OF A SELF-REGULATED MATHEMATICAL PROBLEM SOLVING
MODEL Andri Marcou, Stephen Lerman
London South Bank University
Various models of Mathematical Problem Solving (MPS) have been suggested since 1957; however most of them did not take place within a structure of a theory. In this paper we focus on the theory of Self-Regulated Learning (SRL) in order to develop a satisfactorily comprehensive model of MPS, especially adjusted to the principles of the aforementioned theory. After examining the relevant literature on both theories of MPS and SRL, a first draft of the model was developed. Two research studies were conducted in order to check and validate the mapping of the model so as to become a useful tool for upper primary school students while they are working on process mathematical problems. The final version of the model is expected to constitute a powerful tool for independent and student-guided problem solving.
THEORETICAL BACKGROUND The theory of Self-Regulated Learning (SRL) encourages debate about imperative changes in current teaching practices (Boekaerts, 1997), stressing the necessity for the transmission of responsibility of learning from teacher to student by providing tools for independent learning with which children can take charge of their own learning and seek after lifelong learning (Tanner & Jones, 2003). Mathematical Problem Solving (MPS), as one of the most valuable aspects of math lessons (Bruder, Komorek, & Schmitz, 2005) and as one of the most difficult tasks primary school students have to deal with (Verschaffel, De Corte, Lasure, Vaerenbergh, Bogaerts, & Ratinckx, 1999), appears to be a challenging area for MPS and SRL researchers. Since the 1980s their main concern has been to conduct studies aiming at improving students’ self-regulation skills in MPS; however, most of the experiments in MPS were not closely related to a specific theoretical perspective on self-regulation (De Corte, Verschaffel, & Op’t Eynde, 2000) but aimed at improving certain aspects of self-regulation, such as metacognition. There is a strong need to suggest an integral model of SRL adjusted to MPS procedures. Therefore, the aim of this paper is to gather and discuss the relevant literature in order to suggest an integral and comprehensive model of SRL adjusted to primary “process” MPS procedures and to report on research to validate the model. A “process” problem is the one that can be solved using more than one strategy or “process” (LeBlanc, 1982) and thus it is considered as even more difficult for young children.
Marcou & Lerman
4 - 138 PME30 — 2006
Models of Self-Regulated Learning Various models of SRL were studied and compared in terms of their suitability to be applied to the MPS procedures. Some of these were the model of cyclical phases of self-regulation (Zimmerman, 2004), the six component model of SRL (Boekaerts, 1997), the model of cognitive, metacognitive and resource management strategies (Pintrich, 1999), and the four-phased model of SRL suggested by Winne and Hadwin (1998; in Winne & Perry, 2000). The models were compared according to four parameters that were determined as crucial to the process of MPS. The first parameter was the visual aspect of the model which was explained in terms of hierarchy and cycling. Hierarchy is tantamount to the order the solver proceeds through while trying to solve a mathematical problem; for instance, first reading the text of the problem and then obtaining an answer. Cycling can be interpreted as going through the procedure from the beginning, by rereading the text, checking for understanding and so on. The second parameter has been the incorporation of the, crucial to MPS, strategy-use aspect (Posamentier & Krulik, 1998). By strategy-use is meant not only the MPS strategies (e.g. finding a pattern) but also the use of SRL strategies (e.g. distinguish relevant from irrelevant data). The third parameter that was set was whether the model was taking into account the theory of motivational beliefs, since it is suggested that it promotes the use of self-regulated learning strategies (Pintrich, 1999; Marcou & Philippou, 2005). The fourth parameter was whether the model presents SRL as an aptitude or event (Winne & Perry, 2000). Aptitude SRL entails the ability to demonstrate SRL behaviour in various domains whereas event SRL develops only during one particular event (Winne & Perry, 2000). In the present quest, SRL will be studied as an event, since its application will be restricted in one domain, namely process mathematical problems and not learning in general. The models that appeared to satisfy most the parameters set for SRL models were the ones proposed by Zimmerman (2004) and Pintrich (1999). Zimmerman (2004) describes children’s development of academic self-regulation from a social-cognitive perspective proposing that students’ academic effectiveness depends on their use of key SRL strategies and their beliefs about the effectiveness of those processes. This procedure is happening in three cyclical phases: forethought, performance and self-reflection. Zimmerman’s model includes hierarchical and cyclical structure, it incorporates motivational beliefs, views SRL as an event, and it includes strategic aspects. A key point of Pintrich’s (1999) theory is the use of SRL strategies, cognitive, metacognitive and resource management. Cognitive learning strategies are the rehearsal, elaboration, and organisational strategies (Weinstein & Mayer, 1986; in Pintrich, 1999). Some examples are the recitation of information (rehearsal), explaining of ideas to a fellow student (elaboration) and selecting, outlining and organizing the main ideas using a network (organisational). Self-regulation of cognition is considered in many studies (e.g. Panaoura & Philippou, 2003; Tanner & Jones, 2003) as a basic dimension of metacognition; thus Pintrich names these as metacognitive strategies and are used for planning, monitoring, and regulation of cognition. Examples of metacognitive strategies are skimming a text and generating
Marcou & Lerman
PME30 — 2006 4 - 139
questions before the actual reading of it in order to activate any relevant prior knowledge (planning), self-questioning to check understanding and to inform whether or not a goal is being achieved (monitoring), going back and rereading a piece of complicated text, and reviewing aspects of one’s work (regulating) in order to “…bring the behaviour back in line with the goal” (Pintrich, 1999; p.461). Finally, the resource management strategies are the time and study environment control strategies, the effort regulation strategies, peer learning and help seeking. For example, peer learning implies the students’ willingness to collaborate with their peers to reach inside of what they cannot attain on their own and help seeking enables students to identify when they are not able to proceed further and so find the appropriate source of assistance (e.g. teachers, peers). Models of Mathematical Problem Solving A procedure of studying and comparing the models of MPS (see Table 1) was also followed. Some of the models were the well-known four-step model of Polya (1957), the three-stage problem solving strategy suggested by Schoenfeld (1985), the four-stage-cognitive regulation strategy for MPS of Lester, Garofalo and Kroll (1989; cited in De Corte et al., 2000), and the five-step cognitive self-regulatory strategy of Verschaffel et al (1999). Given that the new model is to apply to primary age children, the parameters set for the comparison were the number of stages, the terminology of each stage of the problem, the social context and MPS content (e.g. types of problems) in which the model of MPS was implemented. After the comparison, it appeared that a combination of Shoenfeld’s (1985) and Polya’s (1957) model would fit better the proposed model.
Polya (1957) Schoenfeld (1985)
Lester et al (1989; in De Corte
et al., 2000)
Verschaffel et al (1999)
1. Understanding 2. Devising a plan 3. Carrying out the plan 4. Looking back
1. Build a mental representation of the problem 2. Decide how to solve the problem 3. Execute the necessary calculations 4. Interpret the outcome and formulate an answer 5. Evaluate the solution
Table 1: Models of Mathematical Problem Solving Towards the development of a self-regulated MPS model The proposed model emerged after comparing the models of both theories of SRL and MPS and selecting not their “best” aspects but the most suitable for the purposes of this study. Many of those aspects were combined in order to construct a model, as comprehensive as possible, for primary school students, and applicable to process
Marcou & Lerman
4 - 140 PME30 — 2006
mathematical problems, typically most difficult for Cyprus primary teachers and students. The following figure summarizes what has been argued so far.
Figure 1: MPS as a cyclical SRL event (based on Zimmerman, 2004)
SRL strategies are the cognitive, metacognitive and resource management strategies suggested by Pintrich (1999), whereas MPS strategies are the strategies that can be applied on MPS per se, such as making a drawing, intelligent guessing and testing, finding a pattern, and working backwards (Posamentier & Krulik, 1998). The next step was to try to delve more deeply into each phase by describing the actual SRL strategies that can be used within each phase.
THE FIRST STUDY The first study, carried out in the UK, was designed to check the mapping of our model and to allocate the SRL strategies in each of the three phases of the model. Five students, one of year 4, two of year 5 and two of year 6 were given in written form a set of three process problems. Children decided to work as a group and were asked to solve at least two of the three problems by writing down details of their work and thinking aloud. The researcher’s role was restricted to observing the students without interfering. The session lasted for 40 minutes and was audio-taped. After transcribing and analysing the audio-taped session, the results confirmed the cyclical and hierarchical structure of the model for both problems. The analysis contributed also to the allocation of each strategy in each phase. For example, highlighting or underlining key-words was observed in the Reading and analysing the text phase, whereas the reviewing aspects of their work was observed in the Looking back phase. The strategies that were not observed, such as time and study environment control, were excluded from the model. After the mapping of the model was revisited, there was a need to conduct a second study in order to evaluate the new structure of the model and to estimate its value as a tool, used by both teachers and students during classroom practices.
Mathematical Problem Solving
Forethought Phase: Analysing the text
SRL Strategies
Performance Phase: Carrying out the plans
SRL Strategies and MPS strategies
Self-Reflection Phase: Looking back
SRL Strategies
Marcou & Lerman
PME30 — 2006 4 - 141
THE SECOND STUDY A primary school in Cyprus was selected to participate in this study. Five teachers of year 4, 5 and 6 were taught about the SRL theory and the new model and asked to proceed to a teaching intervention in order to implement the theory and the model in real classroom settings. More specifically, the aims were to receive feedback from the teachers about the efficiency of the model as tool of teaching MPS, to investigate the impact of the model on students’ behaviour and to validate the structure of the model. The teaching intervention was implemented in at least three lessons within two months, according to which the regulation of the learning process is gradually passed from the teacher to the students. Two or three students from each class worked in mixed ability groups on process problems for about 30 minutes, before and after the teaching intervention. Since young children find it difficult to express their thoughts about their cognitive and metacognitive ability (Panaoura & Philippou, 2003), clinical interviews were conducted with students, so as to observe the use of SRL strategies as these appear naturally within the context of MPS. The interviews were video-taped so as to seek for and detect any possible changes in students’ behaviour. The researcher, as clinical interviewer, presented the problem, modified questions if the child seemed to misunderstand them and challenged answers to test the strength of the students’ conviction. These were achieved mostly by asking questions like “how did you do that”, “can you do it loud”, “how did you figure that out”, “can you show me how you did it”, and “how do you know”. Results Teachers stated that the model can indeed be a powerful tool for both teachers and students in MPS, since it “puts an order to students�’ thinking and to teachers�’ teaching”. However, they recommended that some of the strategies could be combined to one strategy (e.g. distinguish relevant from irrelevant data with finding key-words) and that the one-way arrows should be replaced by two-way arrows since children can oscillate between phases while working on problems. In order to check the impact of the model on students’ behaviour, the behaviour of each group of students was examined by producing time-line graphs, a procedure similar to the one used by Schoenfeld (1985).
Figure 2: Time spent in each phase of the model before the teaching intervention
Marcou & Lerman
4 - 142 PME30 — 2006
Figures 2 and 3 demonstrate the time that was spent in each phase of the model for one group of students of year 4 before and after the intervention, while working on isomorphic problems.
Figure 3: Time spent in each phase of the model after the teaching intervention As can be observed from the above figures, students in the pre-teaching phase tend to spend more time in the Performance phase and no time to the Self-reflection phase, contrary to their behaviour during the post-teaching phase in which they spend more time in the Forethought and Self-reflection phases. In other words, students spend more time to read, analyze and understand the text of the problem and on verification processes in order to review and correct their work. Furthermore, as can be seen on Figure 2, students, after reading the text, decided to follow a certain approach and then stuck to it without trying to change it. However, after the teaching intervention, as shown on Figure 3, students were oscillating between analysing the text and performance, indicating their effort to find the most suitable approach to tackle the problem. Another interesting result was that students, after the teaching intervention, appeared to have developed a SRL language while talking to each other. Excerpts from their talking, such as “I am not sure if this is correct…I think we should leave out the irrelevant information” and “we need to check it…to go back” demonstrate that the model had an impact on students’ language. Taking into consideration the teachers’ suggestions and the analyses of the clinical interviews, the structure of the model was critically revisited and evaluated. For reasons of space the full model will be shown at the research presentation.
DISCUSSION The impact and efficiency of the model can not be clearly decided after being implemented for the short period of three lessons within two months. Although there were some very positive indications of its suitability in the second study, there is a need to investigate the impact of the model when this is being implemented in teaching for a longer period of time, perhaps for a whole school year. In this case, it will be possible to examine its impact on students’ ability in MPS, as well as on students’ motivational beliefs. As mentioned before, primary students’ use of SRL strategies was found to be positively related to their motivational beliefs concerning MPS (Marcou & Philippou, 2005). This implies that teaching students how to
Marcou & Lerman
PME30 — 2006 4 - 143
effectively use the SRL strategies while tackling mathematical problems can have an impact on their self-efficacy, task value and goal orientation beliefs (Pintrich, 1999). A new research study aiming to investigate the impact of the revised model, when it is implemented for a longer period of time by more experimental classes, is now being designed. The results will shed further light on whether teaching MPS according to the revised model can help primary school students become self-regulated problem solvers. References Boekaerts, M. (1997). Self-regulated learning: A new concept embraced by researchers,
policy makers, educators, teachers and students. Learning and Instruction 7(2), 161-186. Bruder, R., Komorek, E., & Schmitz, B. (2005). Development and evaluation of a concept
for problem-solving and self-guided learning in maths lessons. In H. L. Chick, & J. L. Vincent (Eds.), Proc. 29th Conf. of the Int. Group for the Psychology of Mathematics Education (Vol. 1, p. 230). Melbourne, Australia: PME.
De Corte, E., Verschaffel, L., & Op’ t Eynde, P. (2000). Self-regulation: A characteristic and a goal of Mathematics Education. In M. Boekaerts, P. R. Pintrich, & M. Zeidner (Eds.), Handbook of Self-Regulation (pp. 687-726). Academic Press.
LeBlanc, J. F. (1982). A model for elementary teacher in problem solving. In F.K. Lester, & J. Garofalo (Eds.), Mathematical Problem Solving: Issues in Research (pp.111-116). Philadelphia, Pennsylvania: The Franklin Institute Press.
Marcou, A. & Philippou, G. (2005). Motivational believes, Self-regulated learning and Mathematical problem solving. In H. L. Chick, & J. L. Vincent (Eds.), Proc. 29th Conf. of the Int. Group for the Psychology of Mathematics Education (Vol. 3, pp. 297-304). Melbourne, Australia: PME.
Panaoura, A., & Philippou, G. (2003). The construct validity of an inventory for the measurement of young pupils’ metacognitive abilities in mathematics. In N. A. Pateman, B. J. Doherty, & J. Zilliox (Eds.), Proc. 27th Conf. of the Int. Group for the Psychology of Mathematics Education (Vol. 3, pp. 437-444). Honolulu, USA: PME.
Pintrich, P.R. (1999). The role of motivation in promoting and sustaining self-regulated learning. International Journal of Educational Research, 31(6), 459-470.
Polya, G. (1957). How to solve it. Princeston University Press. Posamentier A. S., & Krulik, S. (1998). Problem-solving strategies for efficient and elegant
solutions: A resource for the mathematics teacher. Corwin Press, Inc. Schoenfeld, A. H. (1985). Mathematical problem solving. New York: Academic Press. Tanner, H., & Jones, S. (2003). Self-efficacy in mathematics and students’ use of self-
regulated learning strategies during assessment events. In N. A. Pateman, B. J. Doherty, & J. Zilliox (Eds.), Proc. 27th Conf. of the Int. Group for the Psychology of Mathematics Education (Vol. 4, pp. 275-282). Honolulu, USA: PME.
Verschaffel, L., De Corte, E., Lasure, S., Vaerenbergh, G. V., Bogaerts, H., & Ratinckx, E. (1999). Learning to solve mathematical application problems: A design experiment with fifth graders. Mathematical Thinking and Learning, 1(3), 195-229.
Marcou & Lerman
4 - 144 PME30 — 2006
Winne, P. H., & Perry, N. E. (2000). Measuring Self-regulated learning. In M. Boekaerts, P. R. Pintrich, & M. Zeidner (Eds.), Handbook of Self-Regulation (pp. 531-566). Orlando, FL: Academic Press.
Zimmerman, B. J. (2004). Sociocultural influence and students’ development of academic self-regulation. A social cognitive perspective. In D. M. McInerney, & S. Van Etten (Eds.), Research on sociocultural influences on motivation and learning: Big theories revisited (Vol. 4, pp.139-164). United States of America.
2006. In Novotná, J., Moraová, H., Krátká, M. & Stehlíková, N. (Eds.). Proceedings 30th Conference of the International Group for the Psychology of Mathematics Education, Vol. 4, pp. 145-152. Prague: PME. 4 - 145
VISUAL COGNITION: CONTENT KNOWLEDGE AND BELIEFS OF PRESCHOOL TEACHERS
Zvia Markovits, Oranim Academic College of Education and Weizmann Institute of Science
Sherman Rosenfeld, Weizmann Institute of Science, Israel
Bat-Sheva Eylon, Weizmann Institute of Science, Israel
The present study investigates some aspects of preschool teachers�’ prior content knowledge and beliefs in the area of visual cognition, before they taught the Agam Program for Visual Cognition in their schools. Results show that teachers do not possess well-developed visual cognition abilities in some areas (e.g. estimation, visual memorization, reproduction of visual stimuli etc.) and in some areas their performance is similar to that of third grade students, suggesting that visual cognition abilities do not necessarily develop spontaneously with age without directed practice. Teachers believe that visual abilities develop with practice, but some are sceptical about young children�’s abilities to cope with complex visual tasks. The implications of these findings to the professional development of preschool teachers in the area of visual cognition are discussed.
INTRODUCTION In recent years there has been a growing recognition of the importance to include visual cognition as part of preschool education. Although the training of visual cognition has been traditionally neglected, research indicates that early and systematic training in this area is desirable. For example, research shows that the early development of visual cognition contributes to the development of basic skills in geometry and mathematical thinking (Clements and Sarama, 2000; Denton and West, 2002) and also to other fields, such as writing, mapping skills and school readiness (Clements and Sarama, 1999; Eylon and Rosenfeld, 1990).
One of the most systematic programs that develop visual cognition in young children is the Agam Program for Visual Cognition. The central goal of the Agam Program is to help children develop their visual thinking, as a means to improve their over-all cognitive development. The vehicle for achieving this goal is through a curriculum, created by the artist Yaacov Agam and refined, implemented and evaluated by staff of the Department of Science Teaching at the Weizmann Institute of Science. The Agam Program is based upon 36 units each of which deals with a different visual concept or a combination of concepts. The program integrates the acquisition of each of these concepts with specific skills, i.e., identification, memorization, reproduction and reproduction from memory. In achieving its goals of teaching a visual language and educating the eye, the Agam
Markovits, Rosenfeld & Eylon
4 - 146 PME30 — 2006
Program uses several distinguishing didactic means which include (1) a structured approach, (2) multiple models of representation (3) a cumulative presentation strategy and (4) minimal use of verbal language.
Research conducted on the program (Eylon and Rosenfeld, 1990; Razel and Eylon, 1990) showed that preschool children in the experimental group significantly outperformed similar children in the comparison group, on tests measuring visual concepts, spatial skills and transfer effects. Moreover, children in the experimental group demonstrated a statistically significant improvement on tests measuring general intelligence and math readiness. In other words, the Agam Program enhanced children's learning in a wide variety of areas. These positive effects were found equally for boys and girls, as well as for children from privileged and underprivileged backgrounds. The research on the Agam Program strongly suggests that when preschool children undergo a systematic program aimed at developing their visual cognition, they develop thinking tools and general abilities which improve their overall “cognitive competence” (Eylon and Rosenfeld, 1990). Spatial intelligence, identified by Gardner (1983) as one of the multiple intelligences, has components that are very similar to those incorporated in the Agam Program.
This year the Israeli Ministry of Education and the Weizmann Institute of Science are conducting a study with 40 preschools in an attempt to identify the necessary conditions for up-scaling the implementation of this program. Preschool teachers are a central focus of this study. In this paper we report on an investigation of preschool teachers' knowledge and beliefs regarding visual cognition and how it can be enhanced. One would assume that in order to help children to develop competencies in this important area, teachers need to possess such knowledge themselves. Content knowledge (Shulman, 1986) has been proven to be a significant factor affecting students’ learning and achievements (e.g. Ball, 1988). Although studies show that elementary school teachers of mathematics lack specific content knowledge in different areas they teach, they are expected to have at least the content knowledge which they gained through training and experience as teachers. Since the subject of visual cognition is not a part of teachers' training and is usually not practiced intentionally in school, it seems that teachers’ content knowledge in this area is the one developed by themselves as human beings. Thus it is important to investigate to what extent do preschool teachers possess the necessary prior knowledge to help their students in the area of visual cognition.
Teachers’ beliefs play an important role in what teachers teach, on the ways that they teach and on the ways that their students learn (e.g., Leder, Pehkonen and Torner, 2002). Thus, revealing teachers’ beliefs regarding visual cognition and its enhancement is important since it might have an impact not only on their abilities to teach this subject but also on their willingness to do so.
In this study we focus on the following questions:
Markovits, Rosenfeld & Eylon
PME30 — 2006 4 - 147
RESEARCH QUESTIONS 1. What is the prior knowledge of preschool teachers in selected areas of visual cognition? How well can they cope with visual tasks and what are their strategies in performing such tasks? 2. What are the prior beliefs of these teachers regarding children’s visual cognition and ways for developing children’s abilities in this domain?
METHODOLOGY Subjects Twenty five preschool teachers participated in this study. These teachers have been chosen to implement the Agam Program for Visual Cognition in Israeli preschools, but had no prior experience with this program. All of them were experienced teachers with 6-33 years of experience (with an average of 19 years). Most of them with B.Ed or B.A (64%), some with M.Ed credential (12%), and the others with preschool senior teachers' credentials. The preschool teachers received their education in different colleges and universities in Israel. Test Items The subjects were given a test which included items aimed to investigate their knowledge in some areas of visual cognition and items aimed to investigate their beliefs. The test was administered during a three-day workshop, in which the teachers met for the first time with the Agam Program for Visual Cognition. The test included three parts; a) 4 “knowledge” tasks b) 4 “knowledge” tasks, each followed by “belief” questions c) 4 belief questions. We describe here in detail only those items that we analyze in this paper. Visual cognition �“knowledge�” items 1. Visual Estimation - three pictures with dots (see Figure 1) were shown, one at a time, for a very short period of time (about 2 seconds). The teachers were asked to write down the number of dots they saw and to explain how they reached that number. The dot pictures are part of the “Numerical Intuition” Unit (unit # 28) in the Agam Program.
Figure 1 – Dot pictures
2. Free Recall - Teachers were presented with 4 flash cards (see Figure 2) one at a time. They were asked first to look at all four cards, and then to find them among 18
Markovits, Rosenfeld & Eylon
4 - 148 PME30 — 2006
such cards which they had in front of them. The teachers were shown cards number: 22, 20, 26 and 18. Card 26 was rotated by 90º before it was shown to the teachers. 3. Graphical Reproduction - Teachers were given a dotted paper equally distanced (11 dots x 16 dots) and were asked to draw as many squares as they can such that the squares differ in size. Tasks #2 and #3 are part of the “Square” Unit (unit # 2) in the Agam Program. The first two tasks are part of the "memorization" tasks of the Agam program. They are different in nature. While the first task requires reproduction of some aspects of the stimulus stored in memory, the second is a direct identification task. The third task is a typical reproduction task dealing with visual stimuli.
Two questions were given following the second “knowledge” task. 1. In your opinion, what does such a task develop among preschool children? 2. In your opinion, how many such flash cards can be given in such a way to the children that they will be able to recall? The tests included more “knowledge” items, investigating abilities in additional areas of visual cognition. Some of the items were followed by “belief” questions similar to the questions above. Other “belief” questions asked teachers about the importance of developing visual cognition abilities in general, and among preschool children in particular. Teachers were also asked to write down names of children whom they think will succeed with visual cognition tasks and children who will have difficulties and to explain the reasons for each child.
RESULTS The analysis of the data is both quantitative and qualitative. For some of the items we looked at the numerical answers. For example in “knowledge” item #3 we counted
Markovits, Rosenfeld & Eylon
PME30 — 2006 4 - 149
the number of different squares. For the open-ended items, categories were established according to teacher responses. Visual cognition ”knowledge” items Visual estimation
The relative percentage of errors for pictures a, b and c was 20%, 26% and 28.5%, with an average of 25%. The dots in picture b appear in a structured arrangement which suits a known figure (square). This is probably the reason why picture 2 was easier for the teachers to cope with. Five strategies were used by the teachers:
Counting strategy – Teachers counted as many dots as they could in the short period of time available and added some more
Grouping strategy – Teachers mentally divided the dots into small groups, usually of equal number, which they then multiplied by the total number of groups.
Comparison strategy – Teachers compared the number of dots to that in a previous picture.
Spatial strategy – Teachers estimated the number of dots according to the size of the dots, their arrangement and the space they hold.
Global perception strategy – It seems that teachers who used this strategy could not explain how they arrived at their answer. Some of them glanced at the picture and gave their estimate.
Table 1 presents the strategies expressed by the teachers in the three visual estimation pictures. There were 73 strategies altogether (in two cases teachers did not explain the strategy) and the figures in Table 1 present the number of explanations per strategy for each picture.
Strategy Picture a Picture b Picture c Overall in percentages
Table 1 – Strategies demonstrated on the Visual estimation tasks As can be seen from Table 1 the most popular strategy was the grouping strategy. The counting strategy was present mostly for the first picture where teachers had to cope with this kind of task for the first time and probably found counting to be familiar. The comparison strategy was used in very few cases and only in pictures b
Markovits, Rosenfeld & Eylon
4 - 150 PME30 — 2006
and c, where there was something to compare with. In picture b almost all teachers used the grouping strategy, since picture b “invites” division of the dots into groups. Teachers were not consistent in the use of strategy. Only three of the teachers used the same strategy, the grouping strategy, for all 3 pictures. It is interesting to compare these results to results we obtained in a previous study in which third grade students were presented with the same dot pictures (Markovits and Hershkowitz, 1997). The average relative error of the third graders was 27%, which is very similar to that of the preschool teachers. As to the strategy used, the third graders used four strategies: counting (42%), grouping (31%), comparison (11%) and global perception (16%). The teachers used the counting strategy only in very few cases. They used much more the grouping strategy and also used the spatial strategy which was not used by the children at all. This comparison might suggest that visual estimation abilities of this kind do not necessarily improve with age, but with age there is a change on the kind of strategy being used for estimation. Free Recall
84% of the teachers recognized flash card #18, 72% card #20, 56% card #22 and only 40% card #26. Card # 18 had the most correct answers both because it is not too much similar to one of the other 18 cards on the flash card board, the squares are “regular” squares (not rotated) and it was the last card presented in the series of four, thus the best remembered (recency effect). Card #22 is very similar to card #23 which is located just next to it on the flash card board, and indeed 44% of the teachers mentioned card #23 instead of #22. Card #26 was the most difficult, not only because of the relationship between the two given squares, in which one is not in the “regular” position, but also because the flash card was rotated with 90º, and the subjects had to do one more visual operation in their minds. Only three preschool teachers correctly recognized all 4 cards, 11 recognized 3 cards, 7 teachers recognized 2 cards and 4 teachers recognized only 1 of the four cards. Since we had experience with kindergarten children (ages 5-6) who were able, after practice, to recognize 6 and even more flash cards, we expect that many of the preschool teachers will improve with practice. Graphical Reproduction
Most of the teachers drew “regular” squares of different shapes. By “regular” we mean squares which are formed of two vertical and two horizontal lines in relation to the position of the given dotted paper. Only 4 teachers drew squares by connecting the dots with slope lines. Table 2 presents the sizes of “regular” squares drawn by the teachers. The largest possible square was of 10X10 “dot spaces”.
Table 2 – Percentages of appearance of each square size
Markovits, Rosenfeld & Eylon
PME30 — 2006 4 - 151
It can be seen that teachers drew squares of all sizes with an even number of “dot spaces” on each side. They did have difficulties in finding squares with dimensions of 5x5, 7x7 and 9x9. This occurred since many of the teachers drew a series of squares one placed inside the other, starting with 10x10, and this kind of series includes squares with even number of “dot spaces”. Then they added outside this pattern some more squares, with odd number of “dot spaces”, but only the small once. Visual cognition ”belief” items Beliefs regarding the flash cards item
Eighty percent of the subjects said that this task develops memory, 56% said that it develops concentration, 40% mentioned visual thinking or visual cognition, 24% said that it develops focus and the ability to pay attention to details and 16% mentioned retrieval from memory. It seems that the subjects realized what are the main abilities needed to carry out successfully this task and mentioned them as having the potential to develop. In the second question, where the preschool teachers were asked about the number of flash cards which can be shown to children, the following answers were given:
a) I do not know until I try it with my children – 8%. b) Very few because for children at this age is very difficult to cope with such a
task – 20%. c) We should start with 1 or 2 and then progress – 32%. d) We should start with 2 or 3 and then progress – 28%. e) More than 4 since children can learn and be better than us – 12%.
It seems that about three quarters of the teachers conceive visual cognition
expressed in this task as an ability that can develop with practice. Some are more sceptical about children's initial performance saying they would start with 1 card or two, while others suggest that one should start with three cards even with small children. Three teachers (12%) even suggest that children will be able to cope with a large number of flash cards in this task, stating that visual abilities are not necessarily related to age. On the other hand, 4 teachers seem to be very sceptical, giving no much chance to the children on this task.
It is interesting to mention that only 4 teachers related to individual differences and suggested that the number of cards, children are able to deal with, depends on the child’s visual abilities. Most teachers judged that all children in their preschool would perform at the same level.
DISCUSSION Visual cognition develops with practice. Research shows that young children improve their visual abilities when they participate in a systematic program such as the Agam Program. Teachers are usually not exposed to programs that develop visual cognition in a directed manner neither during the pre-service training, nor during in-
Markovits, Rosenfeld & Eylon
4 - 152 PME30 — 2006
service programs. They also do not usually experience the systematic treatment of visual cognition in their practice. Thus it is not surprising that their performance on visual estimation tasks was about the same as that of third graders, and on the free recall task, very few were able to remember four cards while kindergarten children, after practice, are able to remember six and even more cards. These results are probably typical of the condition of many adults who do not develop the various visual cognition abilities and remain at the level of younger children. Thus it seems necessary to provide teachers with opportunities to develop their visual cognition through the in-service training accompanying the implementation of the program. However, because of time limitations, the practice that teachers can have through this training is limited. It is plausible to assume that in addition to this training, the teachers participating in this study will undergo “on the job training”, meaning that they will probably develop their visual cognition abilities as they implement the program with their preschool children. It is interesting to investigate whether, and if so in what ways, being involved in the teaching of visual cognition will affect teachers’ visual cognition. The tests we plan to give teachers at the end of the year will help us answer this question. These tests will also enable us to compare prior teachers’ beliefs as revealed in this study to their beliefs at the end of the year, as they can observe the development of visual cognition of their students. References Ball, D. l. (1988). Unlearning to teach mathematics. For the Learning of Mathematics, 8(1),
30-48. Clements, D. H., and Sarama, J. (1999). Preliminary Report of Building Blocks Foundations
for Mathematical Thinking, Pre-Kindergarten to Grade 2: Research- Based Materials Development. NSF Grant No. ESI-9730804. Buffalo, N.Y.: State University of New York at Buffalo, 1999.
Clements, D. H., and Sarama, J. (2000). Young Children’s Ideas about Geometric Shapes. Teaching Children Mathematics, Vol. 6, 482–88.
Denton, K., and West, J. (2002). Children�’s reading and mathematics achievement in kindergarten and first grade. Washington, DC: National Center for Education.
Eylon, B. and Rosenfeld, S. (1990). The Agam Project: Cultivating Visual Cognition in Young Children. Technical Report. Rehovot, Israel: Department of Science Teaching, Weizmann Institute of Science.
Gardner, H. (1983). Frames of Mind. New York: Basic Books. Leder, G. C., Pehkonen, E., and Torner, G. (2002). Beliefs and hidden variable in
mathematics education. Dordrecht: Kluwer Markovits, Z. and Hershkowits, R. (1997). Relative and absolute thinking in visual
estimation processes. Educational Studies in Mathematics, 32(1), 29-47. Razel, M. and Eylon, B. (1990). Development of Visual Cognition: Transfer Effects of the
Agam Program. Journal of Applied Development Psychology, 11, 459-485. Shulman, L.S. (1986). Those who understand knowledge growth in teaching. Educational
Researcher, 15(2), 4-14.
2006. In Novotná, J., Moraová, H., Krátká, M. & Stehlíková, N. (Eds.). Proceedings 30th Conference of the International Group for the Psychology of Mathematics Education, Vol. 4, pp. 153-160. Prague: PME. 4 - 153
AN UNEXPECTED WAY OF THINKING ABOUT LINEAR FUNCTION TABLES
Mara Martinez & Barbara Brizuela Tufts University, Education Department
This paper is inscribed within the research effort to produce evidence regarding primary school students’ learning of algebra. Given the results obtained so far in the research community, we are convinced that students as young as third graders can successfully learn algebra. In our research, we introduce algebra from a functional perspective. A functional perspective moves away from the mere symbolic manipulation of equations and focuses on relationships between variables. In this paper, we present a case study where a third grader, Marisa, produces an unexpected strategy when trying to come up with the formula of a linear function while she was working with a function table.
INTRODUCTION Past research has provided examples of third-grade students’ emerging understanding of functional relations (e.g., Schliemann, Carraher, & Brizuela, 2001), showing that third graders are able to begin to think functionally and to make use of functional notation. In particular, function tables and graphs have been shown to encourage children to focus on functional relationships.
Vergnaud (1994), in his theory of conceptual fields, proposes the concept of theorem-in-action. This turns out to be a very useful concept in the kind of approach and analysis mentioned above because it allows for the explicit differentiation and connecting between subject knowledge and target knowledge. Vergnaud (1994) provides the following definition for theorems-in-action:
A theorem-in-action is a proposition that is held to be true by the individual subject for a certain range of the situation variables. It follows from this definition that the scope of validity of a theorem-in-action can be different from the real theorem, as science would see it. It also follows that a theorem-in-action can be false. But at least it can be true or false, which is not the case for concepts-in-action.(p. 225)
In his analysis of the multiplicative conceptual field, Vergnaud differentiates between two approaches: the scalar and the functional. In this paper, we analyze Vergnaud’s theory of conceptual fields by interpreting Marisa’s theorem-in-action, which is neither scalar nor functional. Her theorem-in-action seems to be intermediate, between the scalar and functional approaches described by Vergnaud (1988, 1994). We will discuss the features that Marisa’s theorem-in-action shares with both approaches (scalar and functional), analyze its validity, and its relationship with the target knowledge of the lesson.
Martinez & Brizuela
4 - 154 PME30 — 2006
METHODOLOGY The data for this paper is drawn from a third grade mathematics classroom in an urban public school in the Boston, Massachusetts (USA) area. The classroom was composed of 15 students that the EA Project worked with during the 2003-2004 school year. As members of the EA Project, we went into this third grade classroom twice a week for 50 minutes each session. The EA classes these children participated in were in addition to their regular mathematics classes. In addition to these lessons, two EA homework sessions were held by the regular classroom teacher each week, reviewing the problems assigned by the EA project team members. The children in this study entered the EA project at the beginning of their third grade. They had a total of twenty-one EA lessons in the Fall semester, and thirty in the Spring semester. All classes were videotaped by two members of the research team. An additional team member taught each one of the lessons. In addition to videotapes, we collected students’ written work for each one of the lessons. This paper focuses on three particular lessons that took place in the Spring 2004 semester of third grade, as well as on an individual interview that was carried out in June 2004 with one of the students in the class, Marisa.
CHILDREN’S APPROACHES TO FUNCTIONS DURING THE ALBEGRA LESSONS
Lessons 35 and 511 The problems presented to the children in these lessons dealt with a restaurant with different configurations for tables. In lesson 35, the square dinner tables could be put together, so the function describing the relationship between independent and dependent variables is not proportional, as it had been in the previous lesson. Lesson 51 took place at the end of the Spring 2004 semester. This lesson was a variation on lesson 35. In lesson 51, numbers such as 100 and 200, as well as n, were included in the function table presented to the third grade children. Strategies Used by Students During Lessons 35 and 51 Within the range of theorems-in-action used, we identified two that had previously been described in the literature (Vergnaud, 1988, 1994). The Scalar Theorem-In-Action. Vergnaud (1994) describes this theorem-in-action as being introduced through iterated addition; it therefore relies upon the additive isomorphism property from which the multiplicative isomorphism property is derived. In the context of the problem used in lessons 35 and 51, this theorem-in-action consists of adding by twos while going down the columns in the function table. In order to get f(3), the child does f(2)+2. In general terms, you can solve for f(n)=f(n-1)+2 by simply knowing f(1). 1 Lessons were numbered beginning at 1 in the first lesson taught in the Fall, 2003 semester, in third grade.
Martinez & Brizuela
PME30 — 2006 4 - 155
This theorem-in-action is an easy and quick way of finding out the values of the dependent variable (e.g., the maximum number of people that can be seated at the dinner tables), because students just have to add two to the previous row in the function table. Note that, in order to use this theorem-in-action, a “first” value for the dependent variable is required. Using this theorem-in-action, children only have to apply the algorithm “adding two”. What they are adding two to remains implicit and can be achieved by just using the values for the dependent variable and maintaining the independent variable implicit. With this theorem-in-action the child does not need to keep track or use any information about the independent variable—in this case, the number of dinner tables.
The Functional Theorem-In-Action. Vergnaud (1994) explains that this theorem-in-action uses the constant coefficient property instead of the previous isomorphism property. The students who use this theorem-in-action multiply the number of dinner tables by 2 and then, add 2. These children use a theorem-in-action that yields the maximum number of people that can be seated depending explicitly on a particular number of dinner tables. This theorem-in-action can be described as functional because children explicitly relate the numeric value of the independent variable (e.g., maximum number of people that can be seated) to the numeric value of the dependent variable (e.g., number of dinner tables).
In the context of this dinner tables problem, a third type of theorem-in-action arose, reflecting another way of thinking about the problem. This third theorem-in-action was unexpected because it is not described in the literature (see, for example, Vergnaud, 1988, 1994).
MARISA’S UNEXPECTED THEOREM-IN-ACTION
The unexpected theorem-in-action we will describe focuses on Marisa’s conceptualization of the relationships embedded in the dinner tables problem used in lessons 35 and 51. Marisa was a quiet third grade student that worked hard and was not labeled as a brilliant student at school. Marisa usually held strong convictions about the problems she was working on and she was always very careful to justify these convictions. When presented with an alternative perspective or explanation for a problem, she would listen carefully but would not change her mind until she was absolutely sure she understood the change thoroughly and could explain it herself. This third (unexpected) way of conceptualizing the relationship between maximum number of people seated and number of dinner tables is neither scalar nor functional. At the same time, it is both scalar and functional. As such, it can be thought of as an intermediate theorem-in-action. During Lesson 51, and while working with the function table shown below (see Figure 1), Marisa said that she saw “another pattern,” besides the scalar and functional relations that her peers were describing. The researcher who was teaching this particular lesson asked her to explain the pattern she saw:
Martinez & Brizuela
4 - 156 PME30 — 2006
Marisa: 1 to 4 is 3, 2 to 6 is 4, 3 to 8 is 5… Bárbara: Actually that is a hint of what’s going on. You do plus 3, you do plus 4,
plus 5, you do plus 6, you do plus 7. The number that you have to add is always one more. It’s always one more.
Number of Tables Seating
1 + 3 4
2 +4 6
3 +5 8
4 +6 10
5 +7 12
6 +8 14
50 102
60 122
100 202
t tx2+2
Figure 1. Function table presented to students in Lesson 51. The first column was filled and the second was empty.
The “pattern” that Marisa described consists in adding a number to the value of the independent variable in order to get to the value for the dependent variable. For example, to get from 1 (dinner table) to 4 (people), we have to add 3; from 2 (dinner tables) to 6 (people), we have to add 4; from 3 (dinner tables) to 8 (people), we have to add 5; and so on. Marisa says that every time you go down from one row to the next, you add one more than you did in the previous row to get from one column to the next. That is, the number you add to get from one column to the next increases by one each time you go down a row in the function table. At first, the research team wondered whether or not this theorem-in-action would be considered mathematically “appropriate,” or correct. We wondered what made this theorem work, and whether it would work with any linear function. Our questioning was grounded in the adoption of a conceptual field framework (Vergnaud, 1988, 1994). Within this framework, an analysis and understanding of the contents of knowledge and a conceptual analysis of the domain are considered essential towards developing an understanding of children’s cognitive development. While we were expecting scalar and functional theorems-in-action among the children’s responses, we did not want to assume that Marisa’s approach was necessarily incorrect or mathematically inadequate. The theory of conceptual fields allowed us to frame our analysis of Marisa’s responses.
Martinez & Brizuela
PME30 — 2006 4 - 157
This was not the only time that Marisa used this “unexpected” theorem-in-action, and she was not the only one in the class to use this theorem-in-action. Marisa used this theorem-in-action during lesson 35, during the review lesson 51, and during an individual interview held in June 2004 with the first author of this paper. During lesson 35, Hannah, another girl in Marisa’s class, used this same theorem-in-action.
MATHEMATICAL ANALYSIS OF MARISA’S UNEXPECTED THEOREM-IN-ACTION
As outlined above, and as detailed by Vergnaud (1988, 1994), it is fundamental to analyse the relationship between knowledge produced by the learner in particular situations and contexts, and the knowledge from the perspective of the discipline we are trying to teach them about. We need to evaluate the relationship between what they know and what we want them to learn, in order to design interventions that foster their learning beyond what they can spontaneously do.
In terms of Marisa’s theorem-in-action, as interpreted through a mathematical lens, given any linear function, f (x) mx b defined in its natural domain, we can think of the information in each one of the rows of the function table given to Marisa as follows “What function can be added to x to obtain mx+b?”
In order for us to examine the characteristics of the function g(x), and specifically to examine if it is a linear function, we are assuming that f(x) is any linear function, as in the case we are analyzing. By analyzing these characteristics, we hope to better understand why Marisa’s theorem-in-action works. We want to solve the equation (I)
)()( xfxgx (I)
for g(x), where bmxxf )( with bm, , and, we are looking for a function g(x) that added to the identity function i(x)=x yields f(x).
Replacing f(x) by mx+b in equation (I), we obtain equation (II):
bmxxgx )( (II)
Manipulating equation (II) to obtain g(x),
xbmxxg )( bxmxg )1()(
In Lesson 51, Marisa points out the fact that first you add 3, then 4, then 5, and then 6. You add one more each time you go down one row in the function table. In this way, she is relating the auxiliary number that she introduced in the first row (see Figure 1), to the auxiliary number in the row right below it. So, in Marisa’s theorem-in-action, she identifies a recursive function on the intermediate, auxiliary column added by her.
Martinez & Brizuela
4 - 158 PME30 — 2006
It seems that Marisa observed in the numeric sequence of the auxiliary column that to get from one row to the row below it, it is enough to add 1 more2. The auxiliary column can be generated by “adding one” from one row to the next to the value in the auxiliary column.
Scalar and Non-Scalar Features of Marisa’s Theorem-in-Action
Why is Marisa’s theorem-in-action not entirely scalar? If Marisa had adopted a scalar theorem-in-action, she could have gone down the output column (see Figure 1) adding by twos. But in her theorem-in-action, Marisa is not adding two from one row to the next in order to get the output. She did not use repeated addition by twos in order to produce the sequence of outputs in the y column of the function table. Thus, we cannot consider her theorem-in-action as purely scalar. In addition, the amount that she is adding to the input varies each time; it is not a constant amount as in the scalar approach, further justifying a characterization of her approach as non-scalar. However, if we focus on the auxiliary column highlighted in Figure 1, we can identify one potential constant being added, although the constant is not added directly to the output column (if it were, then we would identify Marisa’s theorem-in-action as scalar); instead, the constant of 1 (“each time you go down a row in the table, you add one more,”) is added to the number in the auxiliary column to get the output.
Marisa is applying some sort of scalar approach to the sequence of numbers that have to be added to the input in order to get the output. There are two elements that we can identify as characteristic from a scalar approach. The first is that she mainly uses addition in this theorem-in-action; she focuses on looking for the number to be added to the input in order to get the output. The second element characteristic of a scalar approach is that Marisa searches for a scalar pattern in the function g(x).
Functional and Non-Functional Features of Marisa’s Theorem-in-Action
Why is Marisa’s theorem-in-action not entirely functional? Her theorem-in-action does have the intention of relating input and output “directly” by seeking the function that might describe the relationship between variables. Marisa takes into account input and output, and she comes up with a way of acting on the input in order to get the output (i.e., “each time we go down a row we have to add to the input one more than what we added to the previous input column to get the output”). Her establishment of a relationship between both variables can be identified as an element of the functional approach.
2 Marisa used a similar strategy when she solved a problem in the end of year assessment implemented by the EA research team. In this problem, the input column of the linear function table she was presented with skip-counted by threes until a certain point in the table. However, this was not the case for the rest of the values in the input column of the table. In the case where the skip from one row to the next was not three,, Marisa gave a wrong answer based on the counting by three model she had generated for the intermediate column.
Martinez & Brizuela
PME30 — 2006 4 - 159
Marisa developed a theorem-in-action that allows her to produce outputs within a non-scalar model. Her theorem-in-action relates inputs with outputs. While we have said above that her theorem-in-action has features of a functional approach, we would not consider this as a strictly functional approach because Marisa is not using multiplication in order to get the output and because in order for her theorem-in-action to work we have to know what was added to the input in the previous row. Therefore, a “first” step is needed in order to generate the recursive sequence of numbers to add to the input to get the corresponding output. Marisa found the first number to be added by doing f(1)-1; she also calculated f(2)-2, f(3)-3 and so on. As can be seen, this is something that can be done having some consecutive pairs (x, f(x)) of the function in order to infer how it behaves. In some sense, this is a disadvantage because if we want to extend Marisa’s theorem-in-action, we need consecutive pairs of values and these are not always available. Limitations and Potential of Marisa’s Theorem-in-Action One central piece in the mathematical analysis of children’s strategies is the assessment of both what the theorem-in-action allows for and what it does not allow for. That is, both what are the strengths of the theorem-in-action as well as what are its limitations. Identifying the limitations or weaknesses of the theorem allows us to find a way of helping children reflect on their strategies (see Martinez, Schliemann, & Carraher, 2005). As we just pointed out, the disadvantage or limitation of this theorem is that in order for it to work, Marisa has to know both the inputs and the outputs. By knowing both inputs and outputs, Marisa is producing a new intermediate sequence of numbers, that we called the numbers in the auxiliary column in Figure 1. Each one of these numbers (4, 5, and 6) are added to the input to get the output. We might also hypothesize that Marisa’s theorem-in-action was conceptualized and described a posteriori; that is, it was not a theorem-in-action that helped her solve the problem, but a theorem-in-action that helped her to describe a relationship between variables that she had already solved and established beforehand. In the individual interview we found that when Marisa encountered a gap in the sequence of numbers presented in the function table, her intermediate theorem-in-action did not help her to find the corresponding number of people to be seated at the dinner tables. As explained before, she could have still solved this by using multiples (finding out the difference between values in the gap in the function table), but this is not the approach adopted by Marisa. Using the function table in Figure 1, Marisa was adding one more to the numbers in the auxiliary column, from 1 through 6, adding from 3 to 8 respectively to each of these inputs. When she got to the 50 in the input column, she stopped because she did not have the number in the auxiliary column corresponding to 49 that would have made her theorem-in-action work. At this point, her theorem-in-action stopped working because there was a gap in the function table: from 6 to 50 in the input column. We might hypothesize that by encountering these types of shortcomings and difficulties inherent to her theorem-in-action, she might modify her intermediate theorem-in-action into a functional approach, to be able to
Martinez & Brizuela
4 - 160 PME30 — 2006
adopt a general rule for all cases, regardless of gaps in a sequence of inputs in the function table or for the case of a variable amount such as n.
CONCLUDING REMARKS It is our intention to look beyond the prescribed and expected ways of looking at children’s thinking and approaches. We feel encouraged by this analysis of children’s responses, and their grounding from a mathematical perspective, which allows us to further our understanding of children’s approaches to functions, to connect these unexpected approaches to those that are expected, and to reconsider the conceptual field that they are connected to. We hope that Marisa’s unexpected quasi-scalar, quasi-functional theorem-in-action, as well as others we can describe and analyze, can form part of our repertoire of learners’ expected approaches to linear function tables. Marisa’s necessary theorem-in-action will be different at any given time in her development. Similarly, our repertoire of necessary descriptions of children’s approaches should be continually evolving. References Martinez, M., Schliemann, A. D., & Carraher, D. W. (2005). Issues of Generalization in K-
12 Algebra. Paper presented at the annual meeting of the American Educational Research Association, Montreal, Canada.
Schliemann, A. D., Araujo, C., Cassundé, M. A., Macedo, S., & Nicéas, L. (1998). Multiplicative commutativity in school children and street sellers. Journal for Research in Mathematics Education, 29(4), 422-435.
Schliemann, A. D. & Carraher, D. W. (1992). Proportional reasoning in and out of school. In P. Light & G. Butterworth (Eds.) Context and Cognition (pp. 47-73). Hemel Hempstead: Harvester Wheatsheaf,
Schliemann, A. D., Carraher, D. W., & Brizuela, B. M. (2001). When tables become function tables. In Proceedings of the XXV Conference of the International Group for the Psychology of Mathematics Education (Vol. 4, pp. 145-152). Utrecht, The Netherlands.
Schliemann, A.D., Carraher, D.W., & Brizuela, B. (in press). Bringing Out the Algebraic Character of Arithmetic: From Children’s Ideas to Classroom Practice. Studies in Mathematical Thinking and Learning Series. Mahwah, NJ: Lawrence Erlbaum Associates.
Vergnaud, G. (1988). Multiplicative structures. In J. Hiebert and M. Behr (Eds.), Number concepts and operations in the middle grades (pp. 141-161). Hillsdale, NJ: Lawrence Erlbaum Associates.
Vergnaud, G. (1994). Multiplicative conceptual field: What and why? In G. Harel and J. Confrey (Eds.), The development of multiplicative reasoning in the learning of mathematics (pp. 41-59). Albany, NY: State University of New York Press.
2006. In Novotná, J., Moraová, H., Krátká, M. & Stehlíková, N. (Eds.). Proceedings 30th Conference of the International Group for the Psychology of Mathematics Education, Vol. 4, pp. 161-168. Prague: PME. 4 - 161
LEVELS OF UNDERSTANDING OF PATTERNS IN MULTIPLE REPRESENTATIONS
Stalo Michael, Iliada Elia, Athanasios Gagatsis, Athina Theoklitou, Andreas Savva Department of Education, University of Cyprus, Cyprus
This study explores the influence of different forms of representations on pupils’ performance in complex and simple structured patterns at activities which involved continuing a pattern, predicting terms in further positions and formulating a generalization. Data were obtained from pupils in grades 5 and 6 on the basis of a test. Three levels of cognitive complexity (CC) of the understanding of mathematical relations in patterns were validated based on pupils’ performance: empirical abstraction of mathematical relations, implicit use of a general rule and explicit use of a general rule. Findings also revealed that the initial representational form affected pupils’ performance especially at complex patterns. Pupils dealt more efficiently with the pictorial form of representation relative to the verbal one. INTRODUCTION AND THEORETICAL FRAMEWORK Schoenfeld (1992) describes Mathematics as the science of patterns. Like patterns, which involve a series of components progressing in a clear and consistent way, mathematics involve a systematic attempt to discover the nature of the principles and laws that characterize in a rational and consistent manner different theoretical systems or real world models. This commonality indicates that pattern tasks, i.e. recognizing patterns, formulating generalizations, provide the opportunity for a genuine and substantial mathematical activity. During the past 20 years research has focused on a great number of possible methods that increase the meaning of the algebraic procedure and objects (Arcavi, 1994). The fact that many countries have introduced an algebra chapter in their new syllabuses from preschool years proves the increasing interest in the subject, as well as the importance and need for the development of algebraic thinking from a young age. In particular, Blanton and Kaput (2005) maintain that incorporating algebra in elementary school helps in the conceptual development of complex mathematics in children�’s thinking. It offers pupils the chance to observe and articulate the generalizations and express them in a symbolic way. The use of tasks through which pupils of the elementary and high school are lead to generalizations through patterns is considered important for achieving the transition to typical algebra (Lannin, 2005; Zaskis & Liljedahl, 2002). Representations and the understanding of patterns Pupils come across a variety of representations in mathematics classes every day at school. These representations are necessary to present and communicate mathematical ideas such as patterns, and can take on one or more forms: verbal, symbolic, pictorial, etc (Gagatsis & Elia, 2004). Zaskis and Liljedahl (2002)
Stalo, Elia, Gagatsis, Theoklitou & Savva
4 - 162 PME30 �— 2006
distinguish patterns into different categories on the basis of the form of representation or other criteria, i.e. number patterns, pictorial/geometric patterns, patterns in computational procedures, linear and quadratic patterns, repeating patterns, etc. Diverse representations activate different procedures and strategies (Orton, Orton & Roper, 1999). The significant role of different representations on mathematics learning by students of different grade levels was revealed by several researchers regarding the understanding of mathematical concepts and problem solving (Duval, 2002; Gagatsis & Elia, 2004; Mousoulides & Gagatsis, 2004). Based on the findings of the aforementioned studies, understanding a concept presupposes the ability to recognise a concept in a variety of representations and the ability of a flexible handling of the concept within the specific representation systems. Thus it can be implied that recognising relations in patterns in different representations and coordinating different representational forms of a pattern may have an important role on pupils�’ understanding of generalizations and developing of algebraic thinking. Lannin (2005) examined what reasons children produce for the generalizations they produce in patterns in a figurative or a verbal representation and how these justifications help them to understand the generalizations. The reasons that the children were found to produce for the patterns were classified with respect to five stages, as follow: Level 0: No justification, Level 1: Appeal to external authority, Level 2: Empirical evidence, Level 3: Generic example and Level 4: Deductive justification. Kyriakides & Gagatsis (2003) explored the development of first to sixth grade pupils�’ competence in patterning activities by developing and validating a model comprised by six pattern-specific factors, as follow: a) repeating patterns in symbolic numerical form, b) repeating patterns with geometric shapes, c) developing patterns in symbolic numerical form, d) developing patterns with geometric shapes (increasing one or both dimensions), e) patterns requiring simple numerical calculations, namely simple patterns, and f) patterns requiring more complex numerical calculations, namely complex patterns. This study attempts to synthesize some of the basic ideas of the two latter studies, i.e., pattern�’s structure complexity (Kyriakides & Gagatsis, 2003) and levels of students�’ understanding of patterns (Lannin, 2005), so as to investigate the role of different representations on the understanding of patterns in a more comprehensive and systematic manner. On the basis of Lannin�’s stages we propose the following CC levels of the understanding of mathematical relations in patterns: Level 1, Empirical abstraction of mathematical relations. Pupils at this level are able to continue a pattern; Level 2, Implicit use of a general rule. Pupils at this level are in a position to predict terms in further positions of a pattern; and Level 3, Explicit use of a general rule. Pupils at this level are able to generalize the pattern giving a symbolic or a verbal rule. What�’s new in this study is that it a) proposes three levels of CC of the understanding of mathematical relations in patterns; b) attempts to provide empirical evidence for the validation of the aforementioned levels; and c) explores the role of verbal,
Stalo, Elia, Gagatsis, Theoklitou & Savva
PME30 �— 2006 4 - 163
pictorial and symbolic representations of the patterns on pupils�’ abilities at all of the three levels. In the light of the above, the present study aimed to investigate the following research questions: (a) Can the proposed levels of CC of the understanding of mathematical relations be validated empirically on the basis of pupils�’ performance at patterning tasks designed to correspond to these levels? (b) How does the initial representation influence the successful completion of simple and complex patterns in different levels of CC?
METHOD Participants The sample of the study consisted of 67 pupils in grade 5 and 72 pupils in grade 6, that is 139 pupils in total, from two urban elementary schools of Nicosia. Research instrument A test was developed and administered to all of the participants in November 2005. The test consisted of the following six patterns: (a) a verbal pattern of simple structure (in the sense given by Kyriakides and Gagatsis, 2003) with the generalization +1, (b) a simple symbolic one with the generalization +3, (c) a simple pictorial one with the generalization +2, (d) a complex (Kyriakides & Gagatsis, 2003) verbal pattern with the generalization ( . )+1, (e) a complex symbolic one with the generalization ( . )+2 and (f) a complex pictorial one with the generalization .( +2). For each of the aforementioned patterns pupils were first asked to continue the pattern by filling in a table for the three following terms (level 1). Then they had to predict terms in further positions, like the 20th and 100th terms (level 2). Finally, pupils were asked to write the general rule of the pattern with symbols or, if they preferred, in words (level 3). Examples of the tasks that correspond to the three levels of the complex symbolic pattern are shown in Figure 1. Figure 1: Tasks examples corresponding to the three levels of the complex symbolic pattern For coding pupils�’ responses at each of the eighteen tasks we used the following symbols: S= simple patterns, C=complex patterns, v=verbal form, p=pictorial form, s=symbolic form, 1=level 1, 2=level 2, 3=level 3. For example, the variable �“Ss1�” stands for continuing the simple pattern in symbolic form by finding the three next terms.
3 6 11 18 …… …… ……. 1. Find the three following terms of the above pattern. 2. Fill in the table.
Position 1st 2nd 3rd 4th 5th 6th 7th 20th 100th Number
3. Describe or write in symbols a rule which may help you to find a number in any position.
Stalo, Elia, Gagatsis, Theoklitou & Savva
4 - 164 PME30 �— 2006
Data analysis Primarily, the success percentages were accounted for the tasks of the test for each age group. A similarity diagram and an implicative diagram were also constructed for the whole sample by using the statistical computer software CHIC (Bodin, Coutourier & Gras, 2000). The similarity diagram allows for the arrangement of pupils�’ responses at the tasks of the test into groups according to their homogeneity. The implicative diagram, which is derived by the application of Gras�’s statistical implicative method, contains relations that indicate whether success to a specific task implies success to another task related to the former one.
RESULTS Great differences were observed in pupils�’ performance between simple (55-100%) and complex patterns (7-78%). Simple patterns in symbolic form seemed to be the easiest (78-100%) for pupils of both age groups. Pupils responded at the tasks of the first level asking for a continuation of a simple pattern with great success (90-100%). Patterns whose initial representation form was the pictorial one in the higher level seemed to be the most difficult for pupils of grade 6 (67%), while pupils of grade 5 encountered the same level of difficulty (55%) with patterns of verbal form at this level. As regards complex patterns, the lowest scores for both age groups were observed at the patterns in verbal form (7-69%), while higher performance appeared in pictorial patterns, especially for pupils of grade 5 (15-81%). As far as complex patterns are concerned, both age groups tackled first level tasks (69-78%) with much more ease in comparison to the other levels (7-46%).
Like the success rates, there were not great differences between the two age groups at the similarity or the implicative diagram of their responses, thus the results that follow refer to the outcomes of the pupils of both groups. Two distinct clusters, namely Cluster A and B, are identified in the similarity diagram of the pupils�’ responses at the tasks of the test in Figure 1. Most of the similarity relations in Cluster B indicate that the original representation influenced pupils at complex patterning activities of high CC levels. Within Cluster B it is evident that pupils dealt with complex patterns in the same representational form in a similar way (Cs2-Cs3, Cp2-Cp3, Cv2-Cv3) when asked to predict terms in further positions and write a general rule (levels 2 and 3).
Moreover, a similarity group in Cluster B is comprised by pupils�’ responses at two simple patterns (Ss2, Ss3) and a complex one (Cs1) of different levels, but with one commonality, that is the symbolic representational form. Thus, the formation of this cluster reveals the consistency by which pupils tackled these symbolic patterns. It also indicates the distinct way of dealing with these patterns in symbolic form relative to the corresponding patterns with respect to their structure and CC level in other representational forms, indicating the significant role of the form of representation of a pattern on pupils�’ solution procedures.
Stalo, Elia, Gagatsis, Theoklitou & Savva
PME30 �— 2006 4 - 165
Ss1 Sv1 Sp1Ss2 Ss3 Cs1 Sv2 Sp2
Sv3 Sp3Cs2 Cs3 Cp2
Cp3Cv2 Cv3 Cv1 Cp1
Sv1
Ss2 Sv2 Sp2
Ss3 Cp1
Cs1
Sv3 Cv1
Sp3 Cp2
Cs2
Cs3
Cp3
Cv2
Cv3
Figure 1: Similarity diagram of pupils�’ responses at the tasks
Figure 2: Implicative diagram of pupils�’ responses at the tasks
It should be noted that the form of representation of the patterns is not the only factor that affects pupils�’ ways of dealing with the various patterning activities, especially the simple ones. Cluster A which involves the variables Ss1, Sv1 and Sp1 indicates that pupils dealt similarly with the simple patterns asking for the following terms (level 1), irrespective of their forms of representation. Pupils�’ distinct way of approaching these tasks relative to the other tasks may be a consequence of the simplicity of the patterns and the low-demanding character of the tasks (level 1). The common high success rates (90-100%) of both age groups at these tasks provide further evidence to this remark. Correspondingly, pupils responded similarly at the tasks involving simple patterns of the same level (Sv2-Sp2, Sv3-Sp3) asking them to predict terms in further positions or write a general rule despite their difference in the representational form (verbal and pictorial). Thereby further support is provided to the influence of the tasks�’ CC along with the complexity of the structure of the patterns on how pupils dealt with pattern problems. A global view of the implicative diagram of pupils�’ responses at the patterning tasks in Figure 2 indicates that pupils�’ success at dealing with the complex patterns implies success at handling the simple patterns. A more analytic observation of the variables referring to complex patterns reveals that success in finding the general rule of complex patterns, which correspond to the highest CC level (level 3), implies success in predicting terms in further positions of these patterns (level 2), which in turn implies success in continuing the pattern by finding the next terms (level 1). These
Cluster A Cluster B
Stalo, Elia, Gagatsis, Theoklitou & Savva
4 - 166 PME30 �— 2006
relations indicate that level 3 tasks are more difficult for the pupils than level 2 tasks, which consecutively are more complicated than level 1 tasks. It is noteworthy that most implicative relations among pupils�’ responses at the tasks of the three levels are formed within the same representational form of the patterns (e.g., Cs3, Cs2, Cs1; Cp3, Cp2, Cp1), indicating that the different CC levels of pupils�’ understanding are �“intra-representational�”. Analogous implicative relations appear also between the variables concerning simple patterns, with the exception of the variables standing for success at the tasks of level 1 in symbolic and pictorial form. Pupils�’ responses at these tasks which asked the following terms of a simple pattern are not included in the diagram, indicating their autonomous character, since they were identified as the ones with the highest success rates. In the implicative diagram, the role of representations on pupils�’ success is detected principally at the tasks which required predicting terms in further positions (level 2) of a complex pattern (Cv2, Cs2, Cp2). Pupils�’ success at the verbal pattern implies success at the symbolic one, which in turn implies success at the pictorial one. This finding is in line with pupils�’ success rates at the corresponding tasks, indicating that pupils encountered greater difficulty at the verbal pattern and greater facility at the pictorial one. Pupils�’ success in level 1 tasks is not influenced by the form of representation of the pattern probably because of their straightforward character, while pupils�’ success in attaining a generalization (level 3) depends more on the cognitive complexity of the task rather than the representation of the pattern involved. The above findings which concur with pupils�’ success percentages at the tasks, provide empirical support to the proposed classification of the patterning activities and thus to the CC levels of the understanding of mathematical relations in patterns, proposed in this study, in simple and complex patterns as well as in the different forms of representation. DISCUSSION Findings derived from the application of Gras�’s implicative analysis on pupils�’ performance provided evidence to the three CC levels of the understanding of mathematical relations in patterns, proposed in this study, and their hierarchical ordering. The first level refers to the empirical abstraction of mathematical relations, which in this study involves the continuation of a pattern. In the second level, which stands for the implicit use of a general rule, pupils are able to predict the terms of further positions. The third level, which incorporates the explicit use of a general rule, involves the formulation of a general rule. It was also revealed that pupils, who demonstrated deficits in the first level of understanding mathematical relations in patterns, would encounter difficulties in the second level, and fail to articulate a generalization in the third level. Almost all pupils have acquired the first level in simple patterns. Pupils continued accurately a pattern, since they were used to tasks of this form. The next stage, the one of predicting terms in further positions, was acquired by fewer pupils, especially
Stalo, Elia, Gagatsis, Theoklitou & Savva
PME30 �— 2006 4 - 167
in complex patterns. Orton et al. (1999) have ascertained that an important obstacle for successful generalization is the numerical incapability and clinging to repetitive methods. These methods do not allow them to see the general structure of all the elements (Zazkis & Liljedahl, 2002). Considering the third level of reasoning in patterns, only a small number of pupils were in position to formulate a rule. However, generalization was more easily attained in simple patterns rather than complex ones. A main concern of this study was also to investigate the role of different representations on activities involving simple and complex patterns in the three CC levels of mathematical relations in patterns. Despite the intra-representational character of the hierarchy of the three CC levels (as it holds for each form of representation of a pattern), the findings of this study and more specifically the differences between pupils�’ scores at tasks of the same CC level and structure provide support to the influence of the different representational forms on pupils�’ performance. In complex patterns, the pictorial form of the representation makes it easier for the pupils to predict the terms of further positions or articulate a generalization compared to the verbal form of representation, especially in grade 5. The pictorial representation in these activities is easier, possibly because it helps pupils recognise some relations, which are not visible in the verbal representation. These results are in line with Lannin�’s (2005) findings suggesting that such situations allowed pupils associate the rule with a visual representation. The complex patterns of verbal form seemed to be more difficult for all pupils at all the CC level tasks compared to the other representation forms, probably because they had to decode the data of the verbal pattern into symbols and then compare the terms to numbers. This difficulty is in line with previous studies�’ findings that pupils tend to have difficulties in transferring information gained in one context to another (Gagatsis & Elia, 2004). In simple structured patterns, the role of representation was found to give way, probably because pupils were able to recognise the same pattern behind the different representations. However, simple patterns in symbolic form were found to be tackled with greater success relative to the corresponding patterns in other forms, probably due to the fact that pupils were familiar with this kind of patterns in the particular representation from school mathematics. The above findings have direct implications for future research as regards the understanding of patterns. It could be interesting for a study to propose and validate empirically a model that incorporates the functioning and the interrelations of the three dimensions of the understanding of patterns examined here, i.e., cognitive complexity levels, multiple representations, patterns�’ structure, in order to analyze the understanding of mathematical relations in patterns and specify the factors that influence its development. References
Arcavi, A. (1994). Symbol sense: Informal sense-making in formal mathematics. For the Learning of Mathematics, 14 (3), 24-35.
Stalo, Elia, Gagatsis, Theoklitou & Savva
4 - 168 PME30 �— 2006
Blanton, M.L., & Kaput. J.J. (2005). Characterizing a classroom practice that promotes algebraic reasoning. Journal for Research in Mathematics Education, 36(5), 412-446.
Bodin, A., Coutourier, R., & Gras, R. (2000). CHIC : Classification Hiérarchique Implicative et Cohésive-Version sous Windows – CHIC 1.2. Rennes : Association pour la Recherche en Didactique des Mathématiques.
Duval, R. (2002). The cognitive analysis of problems of comprehension in the learning of mathematics. Mediterranean Journal for Research in Mathematics Education, 1(2), 1-16.
Gagatsis, A., & Elia, I. (2004). The effects of different modes of representations on mathematical problem solving. In M. J. Høines & A. B. Fuglestad (Eds.), Proc. 28th Conf. of the Int. Group for the Psychology of Mathematics Education (Vol. 2, pp. 447-454). Bergen, Norway: PME.
Kyriakides, L. & Gagatsis, A. (2003). Assessing Student Problem-Solving Skills. Structural Equation Modeling: A Multidisciplinary Journal, 10 (4), 609-621.
Lannin, J. K. (2005).Generalization and Justification: The challenge of Introducing Algebraic Reasoning Through Patterning Activities, Mathematical Thinking and Learning, 7(3), 231-258.
Mousoulides, N., & Gagatsis, A. (2004). Algebraic and geometric approach in function problem solving. In M. Johnsen Høines & A. Berit Fuglestad (Eds.), Proc. 28th Conf. of the Int. Group for the Psychology of Mathematics Education (Vol. 3, pp. 385-392). Bergen, Norway: PME.
Orton, A., Orton, J. & Roper, T. (1999). Pictorial and practical contexts and the perception of pattern. In Orton, A. (Ed.), Pattern in the Teaching and Learning of Mathematics. London: Cassell.
Schoenfeld, A. H. (1992). Learning to think mathematically: Problem solving, metacognition and sense making in mathematics. In D. A. Grouws (Ed.), Handbook of Research on Mathematics Teaching and Learning (pp. 334-370). New York: Macmillan.
Zazkis, R. & Liljedahl, P. (2002). Generalization of patterns: The tension between algebraic thinking and algebraic notation. Educational Studies in Mathematics, 49, 379�–402.
2006. In Novotná, J., Moraová, H., Krátká, M. & Stehlíková, N. (Eds.). Proceedings 30th Conference of the International Group for the Psychology of Mathematics Education, Vol. 4, pp. 169-176. Prague: PME. 4 - 169
CAN THE SPONTANEOUS AND UNCRITICAL APPLICATION OF THE LINEAR MODEL BE QUESTIONED?
Modestina Modestou & Athanasios Gagatsis Department of Education, University of Cyprus
In this research paper we attempt to put in question students’ spontaneous and uncritical application of the simple and neat mathematical formula of linearity. This is impelled with the help of a written test, where students are instructed to select only one problem among three word problems of geometrical nature, so that it matches with a given numerical answer. The results show that students’ choices are systematic and are based on the solutions given to the tasks. Therefore, more than half of the students that solved the pseudo-proportionality problems linearly chose them as the most appropriate for each group of problems.
Linear relations constitute the easiest way for getting access to the world of functions. Therefore, they have been given a special attention and status, starting from the early years of age. Linear or proportional relations refer to the function of the form f(x) = ax (with a 0) and are represented graphically by a straight line passing through the origin (De Bock, Verschaffel, & Janssens, 2002). The basic linguistic structure for problems involving proportionality includes four quantities (a, b, c, d), of which, in most cases, three are known and one unknown, and an implication that the same relationship links a with b and c with d. �“A pianist needs 5 minutes to perform 2 musical themes. How much time does he need to execute 3 themes of the same duration as the first ones?�” In this case, of true proportionality, the relationship is a fixed ratio (2 x 2,5 =5, 3 x 2,5 = ) (Behr, Harel, Post, & Lesh, 1992). However, there is a case where a problem matches this general structure without being a proportional one. In this case the problem is considered �“pseudo-proportional�”, because of the strong impression it creates for the application of the linear model. For example, in the case of the constant problem: �“A pianist needs 5 minutes to execute a musical theme. How much time do 3 pianists need in order to execute the same theme?�”, students spontaneously answer that they need 15 minutes, falling in this way to the pseudo-proportionality trap; that is they do not consider the fact that the 3 piano players perform the theme simultaneously. Therefore, if a problem matches the general linguistic structure of proportionality, the tendency to evoke direct proportionality can be extremely strong even if it does not befit these problems (Verschaffel, Greer & De Corte, 2000). In recent years, researchers (De Bock, Verschaffel, & Janssens, 1998; De Bock, Van Dooren, Janssens, & Verschaffel, 2001; De Bock et al., 2002; Modestou, Gagatsis, & Pitta-Pantazi, 2004; Van Dooren, De Bock, Hessels, Janssens, & Verschaffel, 2005) have examined students�’ tendency to deal linearly with non-proportional tasks, and have suggested ways of overcoming it. In particular, De Bock et al., (1998, 2002) showed an alarmingly strong tendency among 12-16 year old students to apply
Modestou & Gagatsis
4 - 170 PME30 �— 2006
proportional reasoning to problem situations concerning areas, for which it is not suited. Furthermore, the use of a number of different experimental scaffoldings did not yield the expected results. The inclusion of visual support at the non-proportional problems, like self-made or given drawings, did not have a beneficial effect on students�’ performance, as students most often relied on formal strategies such as using formulas (De Bock et al., 1998). Students in some cases even discarded the results given from well-used formulas for finding the area and volume of a figure, in favour of the application of the linear model (Modestou et al., 2004). Students�’ involvement in a real-problem situation with real materials and authentic actions led students to avoid the linear model, and therefore to show high performance at the task (Van Dooren, De Bock, Janssens, & Verschaffel, in press a). However, the results were only temporary, as students failed at a post-test with non-proportional tasks. The inclusion of an introductory warning, before the actual test that informed students of the non routine character of the tests, yielded small but significant effects on students�’ performance (De Bock et al., 2002). In the same study, the rephrasing of the usual missing value problems into comparison problems proved to be substantial help for many students. However, in both cases students�’ success rates at the proportional items decreased, as some students started to apply non proportional methods to these problems. Similar drawbacks were observed and in a series of ten experimental lessons aiming at students�’ conceptual change (Van Dooren, De Bock, Hessels, Janssens, & Verschaffel, 2003). The actual processes and the mechanisms used by students while solving non-proportional problems were unravelled by means of interviews (De Bock et al., 2001). It appears that the "illusion of linearity" is not the only factor responsible for the inappropriate proportional responses. Other factors include intuitive reasoning, shortcomings in geometrical knowledge and inadequate habits and beliefs about solving word problems. In addition, Van Dooren, De Bock, Janssens & Verschafell (in press b) argue that the explanatory elements of the phenomenon of the illusion of linearity can also be found in (1) students�’ experiences in the mathematics classrooms, (2) the intuitive, heuristic nature of the linear model, and (3) elements related to the specific mathematical problem situation in which linear errors occur. From the literature review it becomes evident that the �“illusion of linearity�” is not a result of a particular experimental setting. It does not occur due to ignorance, uncertainty or chance, but it results from the application of a previous piece of knowledge - that of linearity - which was interesting and successful, but in another context is revealed as false or simply un-adapted (Brousseau, 1997). This error is not erratic and unexpected, but is reproducible and persistent. Therefore, we argue that it occurs due to the epistemological obstacle of linearity, in the sense given by Brousseau (1997). Linearity appears to be deeply rooted in students�’ intuitive knowledge and is used in a spontaneous and even unconscious way, which makes the linear approach quite natural, unquestionable, and to certain extends inaccessible to introspection or reflection (De Bock et al., 2001). Therefore, the purpose of this study is to
Modestou & Gagatsis
PME30 �— 2006 4 - 171
investigate whether the need to select one problem, among three word problems of geometrical nature (an appropriate, a pseudo-proportional and a distracter of impossible mathematical character), so that it matches with a given numerical answer, could make students question the spontaneous and uncritical application of linearity. The originality of our research lies in fact in the formation of the written test in general, as well as in the mathematical character of the tasks selected to accompany the pseudo-proportional problem in each group. These tasks were not linear, as in most researches discussed above, and in most cases required the application of mathematical formulas for their solution.
METHOD The sample of this study consisted of 244 students of grade 10 (15-year olds) of 6 different lyceums in Cyprus. The particular grade was chosen as the test consisted of tasks of geometrical nature that required the use of mathematical formulas for their solution. Therefore, 15-year old students could more easily handle such tasks. The students were administered a 40 minutes test that consisted of 9 geometrical word problems concerning the perimeter, the area and the volume of different figures, grouped in threes. Each group of problems was accompanied by a given number. According to the instructions of the test, the students first had to solve all the three problems of each group and then to choose the problem that was appropriate for the given number, i.e. the one problem that had the same solution as the number given at the beginning of each group of word problems (Elia, 2003).
Table 1: Example of the problem formulation in the first group of problems Each group of problems consisted of the Appropriate for the given number problem ( 1, 2 & 3), of one Pseudo-proportional problem, where the application of the linear model would give the given number as an answer (Pa1, Pa2, Pv3), and one Impossible problem (Im1, Im3), that functioned as a distracter. In the case of the mathematically impossible problems, any attempt to solve them would result the given number as an answer. As an exception to the formulation of the groups, a perimeter pseudo-proportional problem (Pl2) was included in the place of the
1. 50
A. Mr. Ben emptied all the water of an open cubic tank, in order to paint it. If he needs 10L of paint to paint the bottom of the tank, how much paint will he need for the entire tank? (Appropriate - A1)
B. George measured the surface of his classroom floor and found that its area is 25m². The gym�’s floor has double the dimensions of the classroom. What is the area of the gym�’s floor? (Pseudo-proportional - Pa1)
C.
A classroom has two rectangular blackboards joint together with a common width. The first blackboard�’s perimeter is 30m and the second one�’s 20m. How many meters of ribbon are needed in order to frame both blackboards together? ( Distracter - Im1)
Modestou & Gagatsis
4 - 172 PME30 �— 2006
impossible problem, in the second group of problems. An example of the first group�’s problems is given above, in Table 1. The other two groups were formed accordingly. It is obvious that with a large number of students�’ making the Errors (ElPa1, ElPa2, ElPl2, ElPv3, ElIm1 ElIm3) that lead them to the same answer as the given number, the Choosing (C 1, C 2, C 3, CPa1, CPa2, CPl2, CPv3, CIm1, CIm3) of only one problem as appropriate for the given number would create students an internal conflict. With this way we attempted to question the spontaneous and uncritical use of the linear model for solving all multiplicative word problems. For the analysis of the collected data two separate analyses were conducted. A chi-square (Phi Cramer�’s V) was conducted with the use of the statistical package of SPSS, as well as an implicative statistical analysis using the computer software CHIC (Bodin, Coutourier, & Gras, 2000). The latter research data analysis (CHIC) enables the distribution and classification of variables, as well as the implicative identification among the variables.
RESULTS An initial analysis of the data showed that almost 19% of the students either choose more than one problems as suitable for the given number, or did not make a choice at all. In particular, 71% of these students preferred not to make a choice rather than disobey the instructions of the test.
1st group of
problems (Ans. 50)
2nd group of problems
(Asn. 18 )
3rd group of problems (Ans. 30)
Appropriate (A) 46,2% 44,7% 60,4% 17,8%
Pseudo-proportional (P) 19,3% 37,5%1
9,7%
Impossible (Im) Distracter 34,5% - 29,9%
Table 2: Choice percentages for the problems of each group From the students that did make only one choice, the majority (46,2%, 44,7%, 60,4%) chose the appropriate problems for the given numbers of all three groups (Table 2). Almost one third of the students (34,5%, 29,9%) chose the impossible problems (distracters) whereas the pseudo-proportional problems where the least preferred by the students. However, these results are not indicative of students questioning neither the application of the linear model at the non-proportional problems nor the credibility of
1 The particular problem, even though non-proportional, had the same linguistic formulation as the impossible problem of the 1st group of problems, something that led students to handle it as such.
Modestou & Gagatsis
PME30 �— 2006 4 - 173
the given results. Therefore, it was important to examine the factors that led students to choose each problem. These factors are related with the finding of the given number as a solution to each problem. They can be synopsized to the correct solution of the appropriate problems, as well as the errors of applying the linear model at the pseudo-proportional problems and the attempt to solve the impossible problems. Table 3 presents students�’ percentages at each group�’s problems in respect to the above factors; that is how many students found the correct answer at the appropriate problems, how many applied the linear model while solving the non-proportional problems and how many attempted to solve the impossible problems. The data presented in Table 3 show that almost one third of 10th grade students erroneous applied the linear model in order to solve the non-proportional problems of all three groups (31%, 30,5%, 29,9%). However, more than 50% of the students fell into the linear trap at the second pseudo-proportional problem (Pl2) of the 2nd group because of its resemblance with the linguistic formulation of the impossible problem (distracter) of the 1st group of problems.
1st group
of problems (Ans. 50)
2nd group of problems (Asn. 18 )
3rd group of problems (Ans. 30)
Factors
Appropriate (A) Correct answer 53,8 % 66% 74,6%
30,5% Pseudo-proportional (P)
linear model application 31 %
55,8% 29,9%
Impossible (Im) distracter
solving the problem 48,2 % - 48,7%
Table 3: Factors that affect the choosing of each problem for the three groups A more detailed analysis of the data presented in Table 3 in relation to the choice percentages for each problem (Table 2) gives more insides to the way students made their choices. In particular, 55,7%, 51,7%, 27,1% and 61,8% of the students that used the linear model to solve the area (Pa1, Pa2), volume (Pv3) and perimeter (Pl2) pseudo-proportional tasks, respectively, chose them as the right problems for the given numbers (Cramer�’s V Pa1=0.619, p<0.01; Cramer�’s V Pa2=0.587, p<0.01; Cramer�’s V Pa3=0.387, p<0.01; Cramer�’s V Pl2=0.563, p<0.01). The fact that almost 50% of the students questioned their own linear answers is encouraging, since a more thorough evaluation of the linear model�’s applicability in all multiplicative comparison problems is impelled. However, the number of students that obstinately used the linear model and chose the pseudo-proportional problems remains too large to be overlooked. Similarly, in the case of the distracters (Im1, Im3), 68,4% and 53,1% of the students that solved them by just combining the problem�’s data, chose
Modestou & Gagatsis
4 - 174 PME30 �— 2006
them as the appropriate for each group�’s given numbers (Cramer�’s V Im1=0.688, p<0.01; Cramer�’s V Im3=0.493, p<0.01). Having seen the influence of students�’ errors at choosing the correct problem for the given numbers, it is important to consider the influence of finding the correct solution at the appropriate problems, on this choice. Therefore, it appears that in these problems ( 1, 2, 3) 81,1%, 65,4% and 78,9% of the students that solved them correctly, chose them and as the representative of each group of tasks (Cramer�’s V
1=0.756, p<0.01; Cramer�’s V 2=0.580, p<0.01; Cramer�’s V 3=0.649, p<0.01). Quite noticeable, however, remains the fact that almost 25% of the students that solved the appropriate problems correctly did not select them, as they were more inclined towards the solutions of the pseudo-proportional and impossible problems.
The implications among students�’ choices, errors and solutions given at each task are presented graphically in Figure 1. The majority of relations that are formed in the implicative diagram concern two variables that refer to the same problem.
Figure 1: Implicative diagram among students�’ choices and the solutions and errors presented in each task
In particular, the implicative relations of the left hand side show that the students who chose the appropriate problems for each group of tasks (CA1, CA2, CA3) had previously solved them correctly. Reversely, the students that chose the pseudo-proportional problems as the appropriate ones for the given numbers (CPa1, CPa2, CPv3, CPl2), used proportional reasoning in order to solve the problems, falling in this way to the linear trap. Students behaved in a similar way and in the case of the impossible problems (Im1, Im3). Therefore, the students that chose the particular problems had already given them a solution. The analogy that exists between the implicative relations that concern the appropriate problems and the respective relations that concern the non-proportional tasks indicates that the linear solution of a pseudo-proportional problem attains students with the same confidence and certainty for its correctness as any truly correct solution.
DISCUSSION This study provides further indications concerning the application of linearity in pseudo-proportional problems of geometrical nature. The results showed that even at the age of 15 almost one third of the students use the proportional reasoning spontaneously in order to solve multiplicative comparison word problems. These findings even though not the ones sought after, they seem encouraging compared to
Modestou & Gagatsis
PME30 �— 2006 4 - 175
the findings of our previous work (Modestou & Gagatsis, 2004), where only 9% of the 13 year old students could solve correctly the respective problems. All the results given from the implicative diagram as well as the chi-square�’s analysis, concerning students�’ decisions on the appropriate problem for each group of word problems, conclude that students make choices that are methodical, and which are based on the answers given to the tasks. In particular, it appears that that the majority (75%) of the students who correctly solved the appropriate problems chose them at the same time. In an analogous manner 61% of the students that attempted to solve the impossible problems (distracters), chose them and as the appropriate ones for each numerical answer. Students�’ behavior differentiated slightly in the case of the non-proportional tasks, as almost half of the students that applied the linear model in order to solve them, did not choose them and as the appropriate ones. The research design, therefore, seems to have helped students question to some degree linear model�’s applicability in all multiplicative comparison problems. However, the number of students that persistently used the linear model and chose the pseudo-proportional problems, as they felt confident in the correctness of their solutions, remains too large to be overlooked. This fact is even more significant considering that a large amount (17%) of these students rejected the appropriate problems, which they had previously solved correctly, in favour of the pseudo-proportional ones. The strong belief in the correctness of the results given by the application of the linear model indicates that students did not make random choices, but however were inclined to them by, what we argue constitutes, the epistemological obstacle of linearity. Linearity resisted occasional contradictions for the establishment of a better piece of knowledge, making for one more time obvious its�’ deep rooted, natural and unquestionable character. Therefore, in order to handle this epistemological obstacle, a proper didactical situation must be organised (Brousseau, 1997) in such a way that the contestation of linearity will arise spontaneously as a necessary tool for the solution of the problem. References Behr J. M., Harel G., Post T., & Lesh R. (1992). Rational number, Ratio and Proportion. In
D. A. Grows (Ed.) Handbook of Research on Mathematics Teaching and Learning (296-333). New York: Macmillan.
Brousseau, G. (1997). Theory of didactical situations in mathematics (N. Balacheff, M. Cooper, R Sutherland & V. Warfielf, Eds & Transl.). Dordrecht, The Netherlands: Kluwer.
Bodin, A., Coutourier, R., & Gras, R. (2000). CHIC : Classification Hierarchique Implicative et Cohesitive-Version sous Windows – CHIC 1.2. Rennes: Association pour le Recherche en Didactique des Mathematiques.
De Bock, D., Van Dooren, W., Janssens, D., & Verschaffel, L. (2001). Secondary school pupils�’ improper proportional reasoning: an in depth study of the nature and persistence of pupils�’ errors. In M. van den Heuvel-Panhuizen (Ed.), Proceedings of the 25th
Modestou & Gagatsis
4 - 176 PME30 �— 2006
Conference of the International Group for the Psychology of Mathematics Education (Volume 2, 313-320). Utrecht: The Netherlands.
De Bock, D., Verschaffel, L., & Janssens, D. (1998). The predominance of the linear model in secondary school students' solutions of word problems involving length and area of similar plane figures. Educational Studies in Mathematics, 35, 65-85.
De Bock, D., Verschaffel, L., & Janssens, D. (2002). The effects of different problem presentations and formulations on the illusion of linearity in secondary school students. Mathematical Thinking and Learning, 4 (1), 65-89.
Elia, I. (2003). The influence of the Didactical Contract on problem solving: Matching usual word problems with given problems. In A. Gagatsis & S. Papastavridis (Eds.). Proceedings of the 3rd Mediterranean Conference on Mathematical Education (pp. 235-246). Athens: Greece.
Modestou, M., & Gagatsis, A. (2004). Students�’ improper proportional reasoning: A multidimensional statistical analysis. In D. De Bock, M. Isoda, J. A. G. Cruz, A. Gagatsis & E. Simmt (Eds.), Proceedings of ICME 10 – Topic Study Group 2: New developments and trends in secondary mathematics education (87-94). Copenhagen: Denmark.
Modestou, M., Gagatsis, A., & Pitta-Pantazi, D. (2004). Students' improper proportional reasoning: The case of area and volume of rectangular figures. In M. J. Hoines & A. B. Fuglestad (Eds.), Proceedings of the 28th Conference of the International Group for the Psychology of Mathematics Education (Volume 3, 345-352). Bergen: Norway.
Van Dooren, W., De Bock, D., Hessels, A., Janssens, D., & Verschaffel, L. ( 2004). Remedying secondary school students�’ illusion of linearity: a teaching experiment aiming at conceptual change. Learning and Instruction, 14, 485-501.
Van Dooren, W., De Bock, D., Hessels, A., Janssens, D., & Verschaffel, L. (2005). Ups and downs�’ is students�’ over-reliance on proportional methods. Cognition and Instruction, 23 (1), 57-86.
Van Dooren, W., De Bock, D, Janssens, D., & Verschaffel, L. (in press a). Students�’ over-reliance on linearity: A shcolastic effect. Paper submitted for publication.
Van Dooren, W., De Bock, D, Janssens, D., & Verschaffel, L. (in press b). Students�’ over-use of linearity: A quest for its roots and an evaluation of its impact. Paper submitted for publication.
Verschaffel, L., Greer, B., & De Corte, E. (2000). Making sense of word problems. Lisse: Swets & Zeitlinger.
2006. In Novotná, J., Moraová, H., Krátká, M. & Stehlíková, N. (Eds.). Proceedings 30th Conference of the International Group for the Psychology of Mathematics Education, Vol. 4, pp. 177-184. Prague: PME. 4- 177
PRIMARY STUDENTS’ REASONING IN PROBLEM SOLVING AND TEACHERS’ EVALUATION OF THEIR ARGUMENTS
Annita Monoyiou *, Xenia Xistouri ** & George Philippou *** Department of Education, University of Cyprus
We examine 5th and 6th grade students’ ability to reason during problem solving activity and teachers’ evaluation of their arguments. Three tasks were distributed to 236 students asking them to decide on the conclusion and justify their decisions. Indicative examples of the students’ responses were given to 16 teachers for assessment during semi-structured interviews. The results suggest that a considerable proportion of students provide no mathematical justification and another proportion supported their argument on numerical examples. Some teachers were found to value justifications based on numerical examples as equally good and occasionally even better than mathematically valid statements. It seems that any effort for improvement should start from changing teachers’ views and didactical processes.
INTRODUCTION
Principles and Standards for School Mathematics NCTM (2000) draw attention on developing of students’ mathematical reasoning, as well as on the assessment of this competence. Teachers should encourage students to justify their assertions and statements, and search for new methods and means to develop students’ mathematical reasoning. However, it is not easy to specify the type of arguments that should be expected by students and the kind of reasoning that should be taught to primary students. Research shows that not all students’ statements and arguments in mathematical problem solving (MPS) are mathematically valid arguments (see e.g., Evens & Houssart, 2004). Students often reason according to their personal experiences, and teachers who seek to understand what is actually behind an argument should escape their “egocentricity” and think through a child’s perspective (Tang & Ginsburg, 1999). Therefore, teachers’ assessment of students’ arguments is essential to developing of students’ mathematical reasoning. However, no piece of research seems to have investigated how teachers appraise students’ arguments.
THEORETICAL BACKGROUND AND AIMS
Mathematical reasoning or justification is a type of “weak proof” for a mathematical assertion. Russel (1999, p.1) argues that reasoning refers to “what we use to think about the properties of these mathematical objects and develop generalizations that apply to whole classes of objects”. Recent studies (e.g., Pehkonen, 2000) suggest that primary students have difficulty in mathematical reasoning. It is, however, important in Mathematics teaching to let students develop the habit to ask for reasons and provide arguments in their mathematical activities as a preparation for the ultimate goal, which is to produce formal proofs in high school.
Monoyiou, Xistouri & Philippou
4 - 178 PME30 — 2006
In this study we adopt the categorization of students’ arguments proposed by Evens and Houssart (2004), which refers to reasoning in MPS; they propose four types of responses: 1) wrong or irrelevant, 2) restatement or reinforcement, 3) providing numerical examples and 4) justification. The first type refers to responses that are irrelevant to the solution of the problem, either due to incorrect course of solution or to arguments that are not rationally connected to the problem. The second type refers to mere restatements of the data, most likely in ones’ own words, without any substantial addition to already given information. The third type concerns arguments limited to direct or indirect use of examples, a type of justification that might be accepted for primary students, as non-well articulated inductive reasoning. The last type refers to responses that have the element of generalization, without being based on testing examples. The same authors found that a large percentage of 11-year olds (42%) managed to give some form of valid mathematical reasoning, even with weakness in expression. On the contrary, similar studies (i.e. Healey & Hoyles, 2000) suggest that students support their responses on testing examples. Assessment in mathematics is the process of gathering information concerning students’ mathematical abilities, to be used for various educational purposes (Lappan & Briars, 1995); it should not be considered as the final part of teaching. Assessment is an integral part of teaching, giving feedback to teachers about the efficiency of the teaching/learning process; it is an aid to adjust and redesign their teaching in view of the outcomes (Cooney, Badger & Wilson, 1993). Since problem solving is at the heart of mathematics, it should also be at the heart of assessment (Lester & Kroll, 1990). Assessment of MPS gives a measure of the level of success of the learning process, though assessment tasks are frequently limited to routine-problems and short-answer questions asking reproduction of knowledge (Webb, 1992). Teachers rarely ask students to give written reasons, due to time pressure and students’ difficulties to express their thoughts in writing (Philippou & Christou, 1997). In the light of the above discussion, the aim of this study was to examine primary school students’ ability to reason in problem solving and to investigate how teachers assess students’ reasons in MPS. The research questions were: 1. How able are 5th and 6th grade students to reason in MPS and what kind of
arguments do they give? 2. How do the teachers conceive and appraise students’ arguments in MPS?
METHODS Participants were 236 primary school students of the 5th and 6th grade, 120 boys and 116 girls from six schools. Students were given about 40 minutes to consider the following three tasks, state whether they agree or disagree with Mary and explain their reasons in writing: TASK 1: Consider a rectangle with 6 cm in length and 4 cm wide. If we half the width of the rectangle and double the length, we see that the area remains the same. Mary says: “This does not stand for all rectangles.”
Monoyiou, Xistouri & Philippou
PME30 — 2006 4 - 179
TASK 2: Mary tried several examples to check the sum of two odd numbers. She tried: 1+3=4, 3+5=8, 7+3=10, and concluded: “If you add two odd numbers, you will never have an odd sum.” TASK 3: The rule for generating the number sequence: 1, 4, 7, 10, 13, 16 … is “add 3 each time”. Mary says: “No matter how far you go, there will never be a multiple of three in the sequence.” (Evens & Houssart, 2004). Based on the categories proposed by Evens and Houssart (2004), students’ responses were assorted in five types: nothing on script, wrong or irrelevant, restatement, numerical examples, and justification. Each category is presented with progression from the least to the most sophisticated answers, when applicable. Semi-structured interviews with 16 teachers of the participating schools were conducted. They were asked to mark some of the students’ arguments, on a scale 0 to 5. The arguments presented to the teachers were examples that covered each of the categories for each of the three tasks. The quotes were given one after the other from the simpler one to the most sophisticated. FINDINGS Table 1 summarizes the frequencies of students’ responses on each of the tasks. Clearly, in each of the three tasks, about one third of the students either provided no justification or gave wrong or irrelevant answers.
(N=236) Task 1 Task 2 Task 3 Reasons f % f % f % Nothing on script 19 8.1 22 9.3 30 12.7 Wrong or irrelevant 65 27.5 51 21.6 52 22 Restatement 32 13.6 56 23.7 20 8.5 Examples given/tested 98 41.5 99 41.9 81 34.3 Some degree of justification 22 9.3 8 3.4 53 22.5
Table 1: Frequencies of students’ reasons given in each task In all tasks, the highest proportion of students justified their answer on the basis of numerical examples (41.5%, 41.9%, 34.3%). It is noteworthy that some students simply restated the information already given in the question (13.6%, 23.7%, 8.5%). The lowest proportion of mathematically acceptable explanations was given in Task 2 (3.4% of the students), while the highest proportion of acceptable explanations was given in Task 3 (22.5% of the students) and less than ten percent of students gave valid arguments in Task 1 (9.3%). The above five categories were next analysed on the basis of specific students’ responses in each task separately. Following the analysis of each task we present and discuss the teachers’ appraisals of each response type. Task 1 Wrong or irrelevant answers: In task 1, some students gave explanations that were irrelevant with Mary’s statement for example: “This does not stand for all rectangles
Monoyiou, Xistouri & Philippou
4 - 180 PME30 — 2006
because simply the length gets larger and the width gets smaller” (S1). Many students failed to work out the example correctly, for instance “I don’t agree because 4 6=24 but 2 18=36”. Others worked Mary’s numerical example right, but argued that this does not stand for all rectangles because: “The area of the rectangle with sides 6cm and 4cm is 24. If the sides are 12cm and 2cm the area is again 24 but this does not happen in all rectangles”. Other students thought that since the dimensions of the rectangle change, the area would also change: “Since the two sides change the area will also change”. Restatement: Some students simply restated the information already given in the question: “I agree because if we split the width and double the length the area will remain the same” (S2). Numerical examples: Some students tried to explain their answer by using Mary’s numerical example: “Because 6 4=24 and 12 2=24, so the area is the same”. Some children also drew Mary’s rectangle: “I drew a rectangle, I multiplied the one side and I divided the other and the area remained the same”, while other students went beyond the example already given applying their own examples. Some students gave additional examples “If the one side is 8 and the other 10 the area is 80. If 8 became 4 and 10 became 20 then 4 20 is again 80” (S4), while others just mentioned that they worked some “This stands for all rectangles because I tried others as well” (S3). Justifications: Some children justified their answer by the argument we multiply the length and divide the width with the same number, though not making finite mention why the area remains constant: “This stands for all rectangles because we multiply one side and divide the other with the same number”. Other children moved further, making the general statement: “Because multiplication and division are reverse operations, divided by two and times two” (S5). Table 2 shows that most teachers (N=11) gave no marks for irrelevant answers. Half of the teachers gave more than 3 points to simple restatement, arguing, “It’s correct. It seems that he/she understands Mary’s statement”. The most accredited response seems to be Statement 4 (S4), which gets 3 points or more, from all the teachers. It is noteworthy that teachers who gave high grade to S4 argued, “The student gave a clear example. He/she explained very well. S5 is not clear. It needs an example”. This shows that all teachers accept reasoning by arithmetical examples, as even better than actual justification, which received less than 3 points; one teacher gave zero to S5 arguing, “I can’t understand this thought. He/She must explain better by giving an example like in S4”. It needs to be noted that although both S3 and S4 justify by examples, S3 was graded worse because the examples were not given.
Task 2 Wrong or irrelevant answers: Some students gave irrelevant answers such as: “It can’t be an even number all the times”. A common mistake among the students was to add an odd number with an even number: “Because 3+2=5… so it’s not always an even number”. One student added three odd numbers, found an odd sum and rejected Mary’s statement: “Because if I add 3+3+3 then the sum is an odd number, 9” (S1).
Restatement: Again some students restated the data of the task: “Because that’s how it always goes” (S2), “If we add two odd numbers the sum will be an even number” (S3).
Numerical examples: In task 2, few students gave reasons using the examples already given in the task: “I did the additions given and the sum is always an even number”. Other students gave their own examples such as: “I added many odd numbers 9+9=18, 9+5=14, 1+3=4 and the sum is always an even number” (S4). Some students provided numerical examples by adding two-digit odd numbers such as: “35+35=70, 53+57=110 so when you add odd numbers the sum is even number”. Other students simply mentioned that they tested numerical examples but they did not provide any: “I did several additions with odd numbers and the result was always an even number.”
Justification: Some students gave a form of valid justification by arguing that: “Because each odd number is one more than even” (S5). One student tried to explain it more extensively by using a numerical example as an aid to express the general rule s/he had in mind: “I said 7+5 take away 1 will became 6 and another 1 from 5 will become 4. If we add them the sum will be even and if we add the two it will be even again” (S6).
Table 3 shows that again most teachers gave no marks to irrelevant responses arguing, “This student didn’t understand the problem. He/She added three instead of two odd numbers”. As far as restatements are concerned, S2 was granted no marks from most teachers, while some teachers gave marks and one teacher gave full marks. The teacher who gave full marks argued that “The student seems to understand the problem but he/she can’t express his/her thoughts” while the teachers who did not give marks argued “He/she does not explain. His/her justification is not mathematical”. A longer restatement (S3) received better marks, while there appears again lack of homogeneity in teachers’ grading. Almost half of the teachers gave 3 or more points to this statement arguing, “It is correct. He/She could explain better or give an example but he/she is in a correct path” while the others gave less than 3 arguing, “He/she doesn’t explain at all. He/She simply restates the data given in the task”. Reasoning by example was highly received in this task, even higher than justification. Many teachers mentioned that although S5 and S6 are correct, students could enrich their justification by the use of examples like those in S4. Others did not understand students’ arguments, due to poor language expression.
Wrong or irrelevant answers: In task 3, a few students gave irrelevant answers such as: “I agree with Mary because three is not an even number so there isn’t a multiple of three in the sequence”. Some students argued that if the sequence continues there will be a multiple of three without giving an explanation: “Mary is wrong. There are multiples of three in the sequence”. Some students made numerical mistakes such as: “Because 1, 4, 7, 10, 13, 16, 19, 21 (3 7=21), so there is a multiple of three. Mary is wrong” (S1).
Restatement: Restatements in this task were of the type: “If you add three each time there will never be a multiple of three in the sequence” (S2).
Numerical examples: In task 3, some students provided explanations using the numbers already given: “The numbers 4, 7, 10, 13, 16 are not divided by three. There aren’t multiples of three”. Some students continued the sequence to justify that there are no multiples of three: “I continued the pattern 19, 22, 25, 28, 31, 34, 37, 40, 43, 46, 49, 52. There aren’t multiples of three” (S3). Other students mentioned that the sequence continues without mentioning the numbers: “I continue the sequence and there isn’t a multiple of three” (S4). One student continued the sequence but he/she stopped at 31, arguing that there is a pattern at the unit digit: “I continued the sequence but I stopped at 31. There is a pattern at the units 1, 4, 7…. Until 31 there isn’t any multiple of three” (S5).
Justification: Some children focused at the starting point of the sequence providing a valid form of justification: “I have to start from 3 or 0 to have a multiple of 3” (S6). Other students focused on comparing the numbers of the sequence with the multiples of three: “Because it is one bigger from multiples of 3”. Some students mentioned both the starting point of the sequence and the comparison of numbers: “Because it starts from 1 not from 0, the numbers will always be one more than the multiples of 3” (S7).
Table 4 summarises the teachers marking of students’ arguments. Clearly, most teachers give no marks to wrong response, though some of them would appreciate students’ efforts arguing, “He/she tried to continue the sequence… He/she just made a numerical mistake”. There is again lack of homogeneity in teachers’ grading as far as restatement is concerned. Some teachers referred that the student simply restated the data while others argued, “He/she understands the problem. It’s correct” giving 3 or more points. Examples received high marks again with S4 receiving relatively lower marks because the examples were not given. Once again teachers supported numerical examples as valid forms of justification and not many expressed the need for a general rule. Although in this task justification received higher marks than numerical examples, most of the teachers referred “Students in statement 6 and 7 could give an example. They could continue the sequence like student in S3”.
Table 4: Teachers’ Assessment of Task 3 CONCLUSIONS The findings of this study indicate that an alarmingly large proportion of the students were unable to give a relevant response, while the majority of the remaining gave arguments based on numerical examples. The latter is in line with results by Healey and Hoyles (2000), who argue that preference to using numerical examples, as opposed to accepted forms of proof, is found even amongst older students. Arguing by example should not be surprising, as it may form the basis of inductive reasoning, provided one guards against overdue generalization. Though Mathematics is renowned as prime area that offers the chance to develop students’ ability to reason, the outcomes seem to fall short of objectives. This is line with earlier findings (Evens & Houssart, 2004; Pehkonen, 2000), though our findings indicate a wide variation of students’ arguments within each category. The situation seems to be more complex regarding teachers’ assessment. Apparently, teachers’ appraisals are based on subjective criteria and differ far from one another. This was evidenced in the range of points they proposed in responses classified as restatement, where some teachers found them as good answer giving high grades, while others gave low grade because students simply rephrased. In the case of numerical examples, most teachers gave high grades. It is noteworthy that they were graded evenly with mathematical justification and occasionally higher. It is important that, even in the case of actual justification, students’ responses did not receive high marks, due to poor expression, which made their statements not explicable to the teachers. The teachers’ trend to accept as valid, argumentation by example may contribute to and enhance the students’ conception about the validity of this type of argument. A point of possible focus in teaching and assessing ability to reason is to engage students’ in group discourse asking the classical question “why”, drawing distinction between general properties and special cases, providing simple examples, preferably from everyday life, and counterexamples. So far, it seems that the goal for an early appreciation by students of the meaning and value of reasoning, and the process of “proving” seems to remain simply an ambition. As in most cases change should start from developing and testing in practice paradigms directed to teachers needs; how to initiate discussion, to build on false students’ arguments, encourage analysis of examples, draw attention on possible obstacles, etc.
Monoyiou, Xistouri & Philippou
4 - 184 PME30 — 2006
References Cooney, T. J., Badger, E., & Wilson, M. R. (1993). Assessment, Understanding
Mathematics and Distinguishing Visions from Images. University of Georgia, Georgia. Evens, H., & Houssart, J. (2004). Categorizing pupils’ written answers to a mathematics test
question: “I know but I can’t explain”. Educational Research, 46 (3), 269-282. Healey, L., & Hoyles, C. (2000). A study of proof conceptions in algebra. Journal for
Research in Mathematics Education, 31 (4), 396 – 428. Lappan, G., & Briars, D. (1995). How should mathematics be taught? In I. M. Carl (Ed.),
Prospects for school mathematics. Reston, VA: NCTM. Lester, F. K., & Kroll, D. L. (1990). Assessing Student Growth in Mathematical Problem
Solving. In G. Kulm (Ed.). Assessing Higher Order Thinking in Mathematics. Washington, DC: American Association for the Advancement of Science.
National Council of Teachers of Mathematics (2000). Principles and Standards for School Mathematics. Reston, VA: NCTM.
Pehkonen, L. (2000). How do primary pupils give written arguments in a conflicting mathematical situation? Nordisk matematikk didaktikk, 1, 23 – 33.
Philippou, G. N., & Christou, C. (1997). Cypriot and Greek primary teachers’ conceptions about mathematical assessment. Educational Research and Evaluation, 3 (2), 140- 159.
Russell, S. J. (1999). Mathematical Reasoning in the Elementary Grades. In L. V. Stiff. & F. R. Curcio (Eds.), Developing Mathematical Reasoning in Grades K-12 (pp.1-12). Reston, VA: NCTM.
Tang, E. P., & Ginsburg, H. P. (1999). Young Children’s Mathematical Reasoning: A Psychological View. In L. V. Stiff & F. R. Curcio (Eds.), Developing Mathematical Reasoning in Grades K-12 (pp.45-61). Reston, VA: NCTM.
Webb, N. L. (1992). Assessment of students’ Knowledge of mathematics: Steps toward a theory. In D. A. Grouws (Ed.), Handbook of research on mathematics teaching and learning (pp. 661- 686). New York: Macmillan Publishing Company.
2006. In Novotná, J., Moraová, H., Krátká, M. & Stehlíková, N. (Eds.). Proceedings 30th Conference of the International Group for the Psychology of Mathematics Education, Vol. 4, pp. 185-192. Prague: PME. 4 - 185
USE OF EXAMPLES IN CONJECTURING AND PROVING: AN EXPLORATORY STUDY
Francesca Morselli Dipartimento di Matematica Università di Torino – Italy
In this paper we report the first part of a study concerning the use of examples in conjecturing and proving, in Elementary Number Theory. The study was carried out on protocols of university students: we analyzed students’ behaviours and we seized different uses of examples among the groups with different mathematical background and relationship with mathematics.
INTRODUCTION This paper deals with the first part of a study on the use and value of examples in the process of conjecture and proof, seen as a special case of problem solving. In particular, it is an open problem solving (Pehkonen, 1991), since the starting point (i.e. the property to be proved) is not given in the text: the student has to find out the property and afterwards justify it. Exploring, in order to find out a property, and argumenting, in order to find arguments that justify the property, are crucial activities. Polya (1945), dealing with the phases of problem solving (understanding the problem, devising a plan, carrying out the plan, looking back), underlined the importance of looking at the problem from different standpoints, searching for a fruitful idea. Among the heuristic strategies, Polya mentioned induction, which is the discovery of general rules through the observation and combination of specific examples. Schoenfeld (1992) stressed that heuristic strategies (among which, the reflection on specific cases) are fundamental for the success in problem solving. In the special case of Elementary Number Theory, it seems worthwhile to analyze the heuristic strategies concerning the use of examples, also referring to more recent and specific contributions (e.g. Alcock, 2004) that deal with the use of examples by experts and students. This is the focus of the research reported here.
THEORETICAL BACKGROUND The activity of conjecturing and proving encompasses many specific phases. These phases are listed here below, according to an ideal schema; we are aware that, in the real process, the phases occur and are intertwined in different ways (see Carlson & Bloom, 2005 for general problem solving); we’ll refer to the ideal schema in order to single out some typical behaviours linked to them:
1. exploring the problem, in order to find out a property 2. formulating and communicating the conjecture 3. exploring the conjecture and discovering theoretical arguments that validate it 4. constructing a proof, that must be acceptable by the community of mathematicians
Morselli
4 - 186 PME30 — 2006
Examples may be useful in each of these phases. First of all, they may help to understand the text and get into the problem. Afterwards, they may be worked out in order to discover a property (phase 1). Studies on the cognitive unity of theorems (Garuti, Boero & Lemut, 1998) showed that the arguments mobilized to produce a conjecture may give important hints for the subsequent proof:
“During the production of the conjecture, the student progressively works out his/her statement through an intensive argumentative activity functionally intermingled with the justification of the plausibility of his/her choices. During the subsequent statement-proving stage, the student links up with this process in a coherent way, organising some of the previously produced arguments according to a logical chain” (p.345)
This “intensive argumentative activity” may consist in a reflection on examples. Once perceived the property, the examples may be useful to check its validity and to formulate and communicate the conjecture (phase 2). Reflection on examples may also help to find some arguments for which the property holds (phase 3). Many studies showed that students are keen to use examples in argumenting and proving. Harel & Sowder (1998) dealt with the inductive proof scheme, that consists in ascertaining for themselves (or persuading others) by “quantitatively evaluating their conjecture in one or more specific cases”. Balacheff (1987) described pragmatic proofs, carried out through the action on the representations of mathematical objects: among these proofs, the naïf empiricism, that consists in validating a statement by verifying it on some cases, and the crucial experience, that consists in validating a statement by verifying it on a “difficult” case. According to Balacheff, another proof is qualitatively different from the previous ones: the generic example, that consists in showing the validity of a statement through transformations on a mathematical object, considered as the typical representative of the mathematical object involved in the conjecture. All the aforementioned studies describe a sort of natural tendency of the students to refer to examples in proving and stress that this use of examples must be overcome to reach a formal proof. Regarding the phase of proving (phase 4), Moore (1994) suggested that one of the causes of difficulty in producing a formal proof is the fact that “students are unable, or unwilling, to generate and use their own examples” (p.251). This difficulty is linked to a poor concept usage, defined as “the ways one operates with the concept in generating or using examples or in doing proofs” (p.252). Other authors (Weber & Alcock, 2004; Alcock & Weber, 2005) dealt with the potentialities of referring to examples in proving: they distinguished between a syntactic approach to proof, where proof is carried out by manipulating definitions and relevant facts in a formal way, and a referential approach to proof, where “the prover uses (particular or generic) instantiation(s) of the referent objects of the statement to guide his or her formal inferences” (Alcock & Weber, 2005, p.33). The authors observed that a syntactic approach may lead to formally correct proofs that do not give the sense of the property, whilst a semantic approach may foster the production of a proof that convinces and explains (Hanna, 1990); of course, it is important to be able to link semantic and syntactic aspects. Alcock & Weber also argued that the students do not exploit a semantic approach because they are unable
Morselli
PME30 — 2006 4 - 187
to use examples to generate a proof or because they don’t feel allowed to do it, for a sort of generalization of the maxim “you can’t prove by example”. In summary, examples seem to have an ambiguous role: they are useful during the exploration, but they don’t have the value of general reasoning. On the other hand, the use of instantiations allows a semantic control and may guide the construction of the proof. Furthermore, Alcock (2004) showed that expert mathematicians (university professors) use examples in three classes of situations (understanding a statement, generating an argument, checking an argument). Those professors also note with surprise that their university students are not able to refer to examples in the same way. This remark suggests us to investigate whether and how those who are not expert mathematicians refer to examples during an open problem solving, where the exploration is particularly encouraged by the open form. We wonder whether, where and how students refer to examples and whether may take place a sort of referential approach to proof, in the context of Elementary Number Theory. In the present study, we propose two levels of analysis: a cognitive level, on the effective role of examples in conjecturing and proving, and a cultural level, on the value the students give to examples and the ways of working with them.
METHODOLOGY We observed the processes carried out by university students with a different mathematical background and a different relationship to the discipline. Totally, 47 students were involved in the study: 7 students (volunteers) attending the first year of the course for the degree in Mathematics, all the students (11) attending the third year of the course for the degree in Mathematics (these students had all chosen the curriculum for the formation of Mathematics teachers for Secondary School), all the students (29) attending the third year of the course for the degree to become Primary Teacher (these students had all chosen a curriculum for the formation of generalist teachers for Primary School). Henceforth, we’ll call apprentice mathematicians the students attending the course for the degree in Mathematics, whose curriculum is strongly characterized by Mathematics courses, and non-mathematicians the students attending the courses for the degree to become Primary Teachers, in whose curriculum Mathematics has a marginal role. Referring to our theoretical framework, the choice of such a population was done to verify whether there are, and what are, differences in the use of examples according to the mathematical background and relationship to mathematics. The students were given the following problem:
What can you tell about the divisors of two consecutive numbers?
The choice of the context of Elementary Number Theory is functional to our focus (in Elementary Number Theory, algebra can be used to prove arithmetic properties that are easy to perceive through suitable examples) and to our intention of comparing the processes carried out by students with different mathematical background (the problem is at the grasp of the non mathematicians). The problem is accessible in terms of mathematical concepts involved, property that characterizes the divisors of two consecutive numbers (the only common divisor is 1) and for the fact that a proof
Morselli
4 - 188 PME30 — 2006
can be carried out at different mathematical levels (considerations on divisibility, properties of the remainder, algebraic proofs). The students worked out the problem individually, writing down their process of solution (it was explicitly required to write down all the attempts and, as much as possible, to comment them); afterwards, we realized semi-structured individual interviews, where the students were asked to reconstruct their process (following the written trace) and comment it. If a student had not completed the task, during the interview he/she was asked to try and complete the solution, interacting with the interviewer. The interviews were audio-recorded.
AN ANALYSIS OF SOME STUDENTS’ BEHAVIOURS An overview of students’ behaviours The analysis of the protocols was focused on the functionalities of examples during the process and not on the validity of the final product (meaningfulness of the conjecture, correctness of the proof). This analysis evidenced a great variety of uses of examples. In order to organize this variety, we singled out four typical profiles related to the use of examples in the various phases. The first profile is characterized by an exploration carried out through work on algebraic formulas. The manipulation of formulas leads to the discovery of the property, which is formally expressed (phase 2), and, at the same time, to the algebraic proof of such a property (phases 1 and 3 coincide). Afterwards, the proof may also be rewritten in a more rigorous way (phase 4). Numerical examples are never used. The second profile is characterized by a short exploration on numerical examples (phase 1) that leads to the discovery of a property. The conjecture is formulated (phase 2), and an algebraic proof is carried out (that is to say, phases 3 and 4 coincide). Sometimes the students, since they have the project of carrying out an algebraic proof, seem to use numerical examples just to get some hints for a symbolic representation. The third and fourth profile are both characterized by an exploration (phase 1), carried out through numerical examples, with the aim of understanding the problem, recalling the mathematical concepts involved (that is, the concept of divisor) and discovering a significant property. In the third profile, the reflection on numerical examples leads to a sense of understanding of the reasons why the property holds (for example, properties of the remainder); these reasons are used as arguments in phase 3. The conjecture is formulated in the natural language and accompanied by numerical examples, which have the function of checking the conjecture and illustrating it (phase 2). The argumentation is carried out in the form of a generic example, or with arguments expressed in natural language and accompanied by illustrative examples. There isn’t any algebraic proof.
Morselli
PME30 — 2006 4 - 189
In the fourth profile, the exploration often lacks of method and is badly oriented (for instance, the divisors of the two numbers are listed all together, without the intention of comparing them). The conjecture is expressed in natural language and accompanied by numerical examples, that have the functions of checking the conjecture and illustrating it (phase 2). The phase 3 is made up of a pragmatic proof (check on numerical examples) or is completely absent.
Once identified the four profiles, we realized that these profiles were differently distributed amongst the apprentice mathematicians and the non-mathematicians. All the apprentice mathematicians are characterized by profiles 1 (3 students) and 2 (15 students), whilst the non mathematicians are characterized by profiles 3 (8 students) and 4 (21 students). We may note that the apprentice mathematicians attending the first year of courses have a mathematical background which is the same (secondary school with scientific orientation) of some non mathematicians, but the former are all characterised by profile 2, whilst the latter are all in the profiles 2 and 3. The apprentice mathematicians attending the first year, even if just enrolled, seem to have a relationship to mathematics completely different from that of the non-mathematicians, relationship that may determine a different behaviour.
Analysis of some typical behaviours
We may observe that some apprentice mathematicians (those belonging to profile 1) seem not to need the reference to numerical examples, in order to discover the property or to argument: they are keen to exploit symbolic manipulations. For these students, formulas seem to play the role of examples, since they represent the structure of the problem and foster the reflection. A typical excerpt comes from the protocol of Valentina, apprentice mathematician (profile 1):
“Given n N, if it is divisible by d N, then the remainder of the division of n by d is 0, that is to say n mod d is 0, that is to say in Zd n=0. When I consider n+1, reasoning in the same way I realize that dividing by d I get remainder 1, that is to say n+1=1 in Zd d 1. Then, the only common divisor for n and n+1 is 1.”
The exploration carried out by Valentina seems to be very useful: at the same time Valentina discovers the property and proves it, since the reasoning is already carried out in general terms. Valentina doesn’t need any numerical example because her “mathematical culture” allows her to “read” the formulas and exploit them. We stress the attention on the following quotation from the a posteriori interview (Valentina had been asked about the use of numerical examples):
“[…] this could be dangerous because induction does not always works, I mean, if we have limited cases, it is not a good method, it could even be absolutely wrong. But one could start from them; afterwards of course it is necessary to prove it in general… […] and just consider the hypothesis and try and think about them, from a general point of view, just…non numerical, but n, n+1, what they mean, and try exactly to think about them, what this data mean […].”
Morselli
4 - 190 PME30 — 2006
The proof carried out by Valentina may be considered a sort of referential proof (Alcock & Weber, 2005). Another interesting use of formulas is in the protocol of Michela, apprentice mathematician (profile 1):
“To say that is divisible by means that = . n= divisor of n. n=( )+1= +1. Hence, two consecutive numbers cannot have the same divisor. […]”
The formulas seem to be, for these apprentice mathematicians, as concrete and meaningful as numbers. Moreover, they are general. In this sense, we may say they have the same generality of the geometric figure as equivalence class of drawings (Parsysz, 1988), even if, the syntactic work on a formula may allow to discover and prove at the same time, whilst the work on the geometric figure can only mediate the access to propositions, that afterwards have to be organized in a logical chain. Other apprentice mathematicians (those belonging to profile 2) seem to neglect an exploration that could lead to the comprehension of the reasons, and prefer to engage in a syntactic algebraic proof that doesn’t allow grasping the sense. Sometimes, they refer to numerical examples just to get some hints for a symbolic representation. This has a sort of negative effect: numerical examples, when observed in a superficial way, may lead to focus on the distinction odd/even and, consequently, to choose 2n and 2n+1 as a suitable representation of the two numbers. Actually, such a representation diverts from the real main character, namely the generic divisor of the first number, which cannot divide the successive number. We present, for instance, the attempt of proof carried out by Debora, apprentice mathematician (profile 2):
“If a even a+1 odd. If a odd a+1 even. 2 is not a common divisor. 2k is not a common divisor. If a=3k a+1=3k+1. 3 is not a common divisor. 3k is not a common divisor. If a=5k a+1=5k+1. 5 is not a common divisor. 5k is not a common divisor.”
Debora’s first attempt of proof ends at this point; We report an excerpt from the a posteriori interview:
“[…] I could not find a general criterion, I mean, a way of saying all those things without doing it for 5, 7, 11… otherwise, it would have been endless! […]”.
Actually, the “general criterion”, that is to say a general version of Debora’s reasoning, should have been realized through a generalization on the divisor and not on the first natural number. Whilst Debora is able to turn to an algebraic proof (by contradiction), other apprentice mathematicians get lost in manipulations, that are heavy because of the choice of the representation and because the algebraic work is not guided by a sense of the property. For instance, Sara, apprentice mathematician (profile 2), after having discovered the property by means of two numerical examples (1-2, 2-3), writes:
“Two consecutive numbers are “made up” of an even number, divisible by 2 (=2n, n N) and an odd number (=2n+1, n N). Let’s suppose that 1 is not the only common divisor, that is k such that k/2n e k/2n+1. 2n= ka, a N also in ka there must be the factor 2
Morselli
PME30 — 2006 4 - 191
k=2c or a=2d; 2n+1= kb, b N since k is common, k=2c, or b=2e. But only the product of two odd numbers is an odd number I could not finish for a matter of time.”
The two last excerpts show that some apprentice mathematicians are keen to turn to an algebraic proof, neglecting an argumentation that could give the sense of the property. On the contrary, some non-mathematicians (those belonging to profile 3) seem to work better on numerical “concrete” examples. Monica, non-mathematician (profile 3), after having perceived the property through a numerical exploration, writes the following argumentation:
“[…] Certainly, two consecutive numbers cannot have common divisors that are even, since odd numbers cannot be divided by an even number. They also cannot have common divisors different from 1, because between the two numbers there is only one unity; if a number is divisible by 3, the next number that is divisible by 3 will be greater of 3 units, and not of only one unit. Since 3 is the first odd number after 1, there are no other numbers that can work as divisors of two consecutive numbers.”
This argumentation, carried out through a generic example, gives an insight into the reasons why the property holds and is linked to the concept image (Tall & Vinner, 1981) of divisibility held by Monica. The student doesn’t seem to need to pass from such an argumentation to an algebraic proof. We may say that the non mathematicians belonging to profile 3 need to rely to numerical examples to reflect on the structure, maybe because they don’t have at disposal a powerful proving strategy (such as the proof by contradiction) and they are less accustomed to algebraic manipulation. For this reason, their reflection on numerical examples is rich, as we can see in this excerpt from Carola’s protocol (non mathematician, profile 3):
“[…] If I take a natural number, I can, analysing its digits, to find its divisors. Adding 1, the divisors change. For example: 20 is divisible by 2, by 5, by 10 because the final digit is 0, and it is also divisible by 1, by itself and by 4. If I add 1 to 20, I have 21: the divisors of 21 are different, the last digit has changed then I cannot use the divisors.[…] The rule is that if I add 1 to a number, the divisors I have found for the first number cannot work for the second number (otherwise I would not have a natural number) […].
We observe that the non-mathematicians carry out a free and boundless exploration, which leads to a sense of the property, but afterwards there is the problem of organizing the arguments into a general proof, that is not always possible at this level of mathematical culture.
CONCLUSIONS Concerning the use of examples in conjecturing and proving in Elementary Number Theory, we observed how the exploration on numerical examples might be fruitful, if it is carried out within a project (that influence the choice of examples and the way of looking at them) and not done “at random”. Similarly, algebraic formulas may play the role of (generic) examples and foster the reflection on the structure of problem, if the work on such formulas is consciously oriented towards a solution and not a mere sequence of blind manipulations. Furthermore, we argued a relevance of the
Morselli
4 - 192 PME30 — 2006
relationship to mathematics in determining these different ways of exploiting examples. We wonder whether, and in which way, our results are specific to the context of Elementary Number Theory. For this reason, we are currently analysing processes of conjecture and proof carried out by the same students in the context of Real Analysis. References Alcock, L. (2004). Uses of example objects in proving. Proc. of PME-28 (vol.2, pp.17-24).
Bergen, Norway: PME. Alcock, L. & Weber, K.(2005). Referential and syntactic approaches to proof: case studies
from a transition course. Proc. of PME-29 (vol.2, pp. 2-33). Melbourne, Australia: PME Balacheff, N. (1987) Processus de preuves et situations de validation. Educational Studies
in Mathematics, 18(2), 147-176 Carlson, M. & Bloom, I. (2005). The cyclic nature of problem solving: an emergent
multidimensional problem-solving framework. Educational Studies in Mathematics, 58, 45-75.
Garuti, R., Boero, P., Lemut, E. (1998). Cognitive unity of theorems and difficult of proof. Proc. of PME-22 (vol.2, pp.345-352). Stellenbosch, South Africa: PME
Hanna, G. (1990). Some pedagogical aspects of proof. Interchange 21 (1), 6-13. Harel, G. & Sowder, L. (1998). Students’ proof schemes: Results from exploratory studies.
In A.H. Schoenfeld, J. Kaput & E. Dubinsky (eds), Research in Collegiate Mathematics Education, v.III, American Mathematical Society (234-283). Providence, RI.
Moore, R. (1994). Making the transition to formal proof. Educational Studies in Mathematics, 27, 249-266.
Parzysz B. (1988). « Knowing » vs. « seeing ». Problems of the plane representation of space geometry figures. Educational Studies in Mathematics, 19, 79-92.
Pehkonen, E. (1991). Developments in the understanding of problem solving. Zentralblatt Fur Didaktik der Mathematik ZDM , 91/2, 46-49.
Polya, G. (1945). How to solve it. Princeton, New Jersey: Princeton University Press. Schoenfeld, A.H. (1992). Learning to think mathematically: problem solving, metacognition
and sense making in mathematics. In A.D.Grows (editor), Handbook of research in mathematics learning and teaching, 334-370.
Tall, D. & Vinner, S. (1981). Concept image and concept definition in mathematics with particular reference to limits and continuity. Educ. Studies in Mathematics, 12, 151-169.
Weber, K. & Alcock, L.(2004). Semantic and syntactic proof productions. Educational Studies in Mathematics, 56, 209-234.
2006. In Novotná, J., Moraová, H., Krátká, M. & Stehlíková, N. (Eds.). Proceedings 30th Conference of the International Group for the Psychology of Mathematics Education, Vol. 4, pp. 193-199. Prague: PME. 4 - 193
KNOWLEDGE BUILDING AND KNOWLEDGE FORUM: GRADE 4 STUDENTS COLLABORATE TO SOLVE LINEAR
GENERALIZING PROBLEMS Joan Moss and Ruth Beatty
Ontario Institute for Studies in Education, University of Toronto
We have been investigating the potential of a web-based discourse platform Knowledge Forum (Bereiter & Scardamalia) to support grade 4 students' understanding of functions through linear generalizing problems. We will present verbatim discussions from the KF database that occurred when students from diverse urban classrooms were linked electronically to collaborate on a series of problems. Analyses of student contributions to the database revealed their increasing understanding of explicit functional relationships, formulate generalizations, and negotiations of multiple rules and representations. It appeared that KF supported students in providing justifications for their conjectures of functional rules within the context of specific problems.
PATTERNS AND FUNCTIONS: AFFORDANCES AND DIFFICULTIES Pattern and functions is one of the four strands identified in the early algebra standard (NCTM). Pattern activities offer a powerful vehicle for understanding the dependent relations among quantities that underlie mathematical functions (e.g., Blanton & Kaput, 2004; Schliemann et al., 2001; Warren, 2000) as well as a concrete and transparent way for young students to begin to grapple with the notions of abstraction and generalizations. However, research demonstrates that the route to functional thinking through patterning is difficult (e.g., Kieran, Noss, Stacey). Linear generalizing problems are often presented in textbooks in geometric contexts with the goal of providing visual support for rule finding. One difficulty for students is a tendency to focus solely on the numeric aspect of these patterning activities, even when patterns are presented visually (Noss et al., 1997). Mason (e.g. 1997) observes that when geometric sequences are introduced, the emphasis is on the construction of a table of values from which a closed form formula is extracted and checked with one or two examples. Mason suggests that students instead be given opportunitities to find multiple kinds of patterns and that visualization and manipulation of the figures on which the generalizing process is based can facilitate rule finding and formula making. Lee (1996) uses the term "perceptual agility" to characterize the ability to see multiple patterns coupled with a willingness to abandon those that do not prove useful. Another fundamental difficulty is the lack of rigor and commitment to justifications that students demonstrate (e.g., Stacey, 1989; Mason, 1996; Lee, 1996; Lannin, 2002). Stacey found that students construct rules and generalizations too readily with
Moss & Beatty
4 - 194 PME30 — 2006
an eye to simplicity rather than accuracy. Cooper and Sakane (1986) further reported that once students select a rule for a pattern, they persist in their claims even when finding a counter example to their hypothesis.
OUR RESEARCH METHODS AND PROCEDURES
For the past two years we have been working on a researchproject with grade 4 children in diverse urban settings to foster an understanding of patterns and functions as well as flexibility of perception and a disposition for providing justifications (e.g., Moss, 2005; Moss & Beatty, 2005). Participants in the sudy reported here included students from a University laboratory school (n=22) and two classrooms from an at-risk inner city public school (n=48) and their teachers. The intervention that we implemented was comprised of two distinct parts. Initially students were presented with an instructional sequence designed to have them gain experience in building and manipulating geometric sequences, and integrate these experiences with numeric functions learned through "guess my rule" activities. The second part of the intervention - the focus of this paper - involved collaborative problem solving on the web based knowledge building platform, Knowledge Forum (KF)(Bereiter & Scardamalia, 2003). For this part of the study students from two schools were linked electronically and invited to collaborate on solving generalizing problems presented on the database. The problems included both linear and quadratic functions embedded in various different contexts - three pairs of structurally similar problems. At no point were the solutions to the problems given, nor were students told whether their solutions were correct or incorrect. In addition, no teacher or researcher posted notes on the database, so that it was clear to students that it was their responsibility to work together to find the solutions to these problems. Our conjecture was that incorporating KF as a means of allowing children to collaboratively problem solve on a database would allow students access to multiple pattern "seeings" (Mason) and that the discourse structure would provide an authentic context for collaboration that would necessitate the provision of proofs and justifications.
DATA SOURCES AND ANALYSES
In order to assess student learning we collected quantitative data based on students' gains on pre- and post-tests of functional understanding. We also videotaped and transcribed interviews with targeted high, medium and low achieving students to track the development of their learning. Finally we analyzed all of the discussions that took place on the database and it is these database results that we present in this paper. our analyses of the KF database not only involved a general tracking of student learning but also involved quantitative and qualitative analyses of all of the students'; contributions in terms of the type and purpose of each note posted. Before going to the final presentation of these results, it is important to describe how KF works and to elucidate the theoretical framework that underlies its design.
Moss & Beatty
PME30 — 2006 4 - 195
KNOWLEDGE FORUM Knowledge Forum, originally known as CSILE (computer supported intentional learning environment) was developed as a forum for discussion and knowledge building by learning theorists Bereiter & Scardamalia based on their early work in intentional learning (please see Bereiter & Scardamalia, 2003). When students work on KF they have the potential to contribute individual ideas or to build onto ideas of others. An important feature of KF that sets it apart from other threaded discourse systems is the ownership given to the student participants. Students work on the database independently of their teachers, thus it is not the teacher who asks for clarification and revision of the ideas or conjectures but rather the students themselves who take on this responsibility. Students work in problem spaces called views. Figure 1 presents a view of the Perimeter Problem. The small squares represent student notes and the connecting lines represent discussions created as students read and respond to each other's contributions. the notes with small circles are referred to as build-ons, or responses to notes posted by other students. The database views are continuously evolving interactive discourse spaces, where each thread of conversation is documented, webs of interchanges graphically displayed, and collective understandings captured as they progress. Six different views were created for each of the six linear generalizing problems used in this study. A note (Figure 2) contains a space for composing text and metacognitive scaffolds designed to encourage students to engage in theory building while they write their notes (Scardamalia, 2003). These scaffolds include my theory, I need to understand, new information, a better theory, and putting our knowledge together. The note in Figure 2 is a student's contribution to the Perimeter Problem. Her theory was posted with the anticipation that others would respond (even though the author has already revised her own thinking, using the scaffold A better theory). Students can also use the graphics palette to create illustrations, or they can scan in drawings, function tables or photographs to further explain their thinking. In our study students included visual, numeric and written representations for two purposes - as tools for problem solving, and as a means of illustrating their understanding. The database is a permanent record of each student's thinking, and the thinking of others that can be revisited at any time.
EPISTEMIC AGENCY While students are usually good at generating ideas, the notion of taking responsibility for continuous idea improvement does not come naturally to them (Scardamalia, 2003). The KF database fosters a shift in responsibility for cognitive advancement form the teacher to the students. In the KF database students are responsible for generating theories, improving ideas, building models and monitoring the progress of the ideas. It is not the teacher who asks for clarification and revision of the ideas or conjectures presented, but rather the students themselves who take on
Moss & Beatty
4 - 196 PME30 — 2006
this responsibility. Students' theories are not offered as final "fair accomplies" but their contributions are taken as stepping-stones for further idea development. Both the metacognitive scaffolds and the visual linking of build-on notes encourage students' push to examine conjectures of their classmates critically, with the goal of making them better. Although idea generation currently occurs in traditional classrooms, it is this rigor for continuous idea improvement that delineates the knowledge building database. In our study we saw this "epistemic agency" instantiated through the students' offering ideas in such a way that a fit between personal ideas and the ideas of others was negotiated.
ANALYSES AND RESULTS In all there were 297 notes with individual contributions ranging from 3 - 18 notes per student. The majority of these notes (72%) advanced the collective knowledge either by contributing or building onto ideas and theories. The remaining notes either offered encouragement ("I think you almost have it, keep trying") or congratulations ("Good job, I like how you explained your answer!"). it must be noted that these collaborative exchanges were posted by students from very different mathematical, cultural, and socioeconomic backgrounds.
Given this level of diversity, of particular interest were the analyses we conducted comparing differences in the kinds of notes created by high- and low-achieving students. In these analyses we compared the number of original notes to the number of build-on or response notes posted by both groups. The graph in Figure 3 displays the overall results. For higher achieving students 53% of their notes were responses, and 46% were original ideas. In contrast 70% of the notes contributed by the lower achieving group were responses to other notes, and 30% were notes contributing original ideas.
Qualitative analyses revealed that when lower achieving students read and built onto the theories of higher achieving students, they did so by translating the ideas of others into modified representations, indicating that they were not just repeating the ideas of others but were incorporating them into their own understanding using language, drawings or other representations that were meaningful to them. for example in the following notes MB, a higher achieving students, presents his solution to the Trapezoid Table problem (in this problem students are challenged to find a rule for predicting the number of chairs that can fit around any number of trapezoid-shaped tables placed end to end). LS who had not yet found a solution is able to take MB's solution and incorporate the ideas to support and move her own understandings forward.
My theory - MB
My theory is that the rule is x3+2. I figured it out because there are always 2 chairs at the 2 ends of one or more trapizoids joined together and there are always 2 on the long side which is on the top or bottom and whatever the opposite side is it has 1 chair. 2+1=3 so I then figured out the rule was x3+2. my evidence is I thought abut it
Moss & Beatty
PME30 — 2006 4 - 197
then i tried on a piece of paper by drawing the trapizoid tables, I also made a T-chart and it worked. Your right! - LS I agree with you because 3 tables equal 11 and you said times 3+2. So 3 tables times3=9 then you said +2 and that = 11. You are right. In LS's response to MB, we can see that she (LS) was able to move her thinking forward by applying MB's rule and figuring out that it worked. In the exchange that we present next, which took place between 5 students working on finding solutions to the Perimeter problem, the discussion that the students engage in furthers the understanding of all of the participants. These students were from all three of the classrooms involved in the study, and represent students of both high and low math ability. The problem read: A 3 y 3 grid would have 8 squared shaded in the perimeter, a 5 by 5 grid would have 16 squares shaded in the perimeter, how many shaded squares would there be in the perimeter of an n by n grid? Eureka! AW My theory is that for the 5x5 question you do 5x5=25 the square of 25 is 5 and you minus two from the square and square that then minus it from your original number and you have your answer! First i drew the five by five grid and there was nine in the middle to take away - 3x3=9 so then i figured out a 6x6 square was 36 and i know that inside there would be a 4x4 square to take away so the difference between 6 and 4 is 2 so it was 36-16=20 nxn=nsquared - (n-2) squared - so minus (n-2) squared from nsquared Another rule - ST I have another rule for you and it is the output x 4-4. in the rule it is x4 because there is 4 sides in a square. It is -4 because when you multiply 4 you are repeating the corners twice so you -4 Both right? - GA I agree with you and disagree with you AW because you got the answer but in a complicated way. I disagree with you because there's an easier way than taking the square of 25, subtracting 2 from it and square that and then subtract that from your original answer. I got the rule times 4-4 because a square has 4 sides and you don't count the corners twice. i agree with you because you got it right. 2 rules - AW But there might be two rules because we got the same answer for both so i think there is more than 1 way to figure the problem out. The perimeter with squares - TG My theory is that the output is equal to the input x input - unshaded squares. Also it works for every one so that's how I know that it is one of the rules. I built some
Moss & Beatty
4 - 198 PME30 — 2006
squares with cubes and subtracted the unshaded squares and tried a different rule and the rule was that the input x input - unshaded squares = shaded squares.
Same Way - AW
I think that i go the same answer as you but i worded it differently i wrote it on a note called Eureka! we used the same way to figure it out but different wording between personal ideas and the ideas of others was negotiated.
These exchanges demonstrate the kinds of discourse that the students engaged in on the database and how the access to other students' ideas appeared to contribute to and broaden their reasoning and strategies. The students negotiated the idea of multiple solutions to a particular problem, and discussed approaches for solving the problem, rather than merely accepting ideas as "right" or "wrong".
DISCUSSION By the end of the intervention, students were able to collaboratively formulate solutions for complex generalizing problems. Furthermore, throughout the database there are examples of students demonstrating a disposition to rule finding and evidence building that is unusual for many students (Stacey, 1989; Lee, 1996; Mason, 1996; Lannin, 2002). Students also displayed a propensity to prove their solutions within the context of a problem. They displayed an ability to view problems in a multitude of ways, and shared their understandings through a variety of representations including drawings, functional tables, natural language, syncopated language (Sfard, 1995) and more formal algebraic notation. In addition, students recognized the benefits of working together to synthesize their Research understanding in a way that was accessible to all members of the group. In the words of one student, "looking at others improved my ideas and how I thought about the question, and when I did my own I could use some of the ideas that were already there." References Bereiter, C. & Scardamalia, M. (1989). "Intentional Learning as a Goal of Instruction," in
Knowing, Learning, and Instruction, edited by L. Resnick. Lawrence Erlbaum Associates: Hillsdale, New Jersey, pp. 361-392.
Bereiter, C., & Scardamalia, M. (2003). Learning to work creatively with knowledge. In E. De Corte, L. Verschaffel, N. Entwistle, & J. van Merriënboer (Eds.), Powerful learning environments: Unravelling basic components and dimensions. (Advances) in Learning and Instruction Series). Oxford, UK: Elsevier Science
Blanton, M., & Kaput, J. (2004). Elementary grades students' capacity for functional thinking. In M. Jonsen Hoines & A. Fuglestad (Eds.), Proceedings of the 28th Conference of the International Group for the Psychology of Mathematics Education (Vol. 2, pp. 135-142).
Kieran, C. (1992). The learning and teaching of school algebra. In D.A. Grouws (Ed.), The handbook of research on mathematics teaching and learning. New York: Macmillan,390-419.
Moss & Beatty
PME30 — 2006 4 - 199
Lee, L ., (1996). An initiation into algebraic culture through generalization activities, n N. Bednarz, C. Kieran and L. Lee (eds.), Approaches to Algebra: Perspectives for Research and Teaching, Kluwer Academic Publishers, Dordrecht, pp. 65–86.
Mason, J., (1996). Expressing generality and roots of algebra, in N. Bednarz, C. Kieran and L. Lee (eds.), Approaches to Algebra: Perspectives for Research and Teaching, Kluwer Academic Publishers, Dordrecht, pp. 65–86.
Moss, J. & Beatty, R. (2005). Grade 4 children work together to build their understanding of mathematical functions. Paper presented at the Institute for Knowledge Innovation and Technology 2004 Summer. University of Toronto. (August 2005).
Moss, 2005. Integrating numeric and geometric patterns: A developmental approach to young students’ learning of patterns and functions. Paper presented at the Canadian mathematics education study group 29 Annual Meeting at the University of Ottawa May 27-31.
Noss, R., Healy, L., & Hoyles, C. (1997). The Construction of Mathematical Meanings: Connecting the Visual with the Symbolic. Educational Studies in Mathematics, 33(2), pp. 203-233.
Schliemann, A.D., Carraher, D.W. & Brizuela, B.M. (2001). When tables become function tables. Proceedings of the XXV Conference of the International Group for the Psychology of Mathematics Education, Utrecht, The Netherlands, Vol. 4, 145-152.
Sfard, A. (1995). The development of algebra: Confronting historical and psychological perspective. Journal of Mathematical Behavior, 12, 353-383.
Stacey, K. (1989). Finding and using patterns in linear generalising problems. Educational Studies in Mathematics, 20, 147-164.
Warren, E. (2000). Visualisation and the development of early understanding in algebra. In M. v. d. Heuvel-Penhuizen (Ed.), Proceedings of the 24th conference of the international group for the psychology of mathematics education (Vol. 4, pp. 273-280). Hiroshima.
4 - 200 PME30 — 2006
2006. In Novotná, J., Moraová, H., Krátká, M. & Stehlíková, N. (Eds.). Proceedings 30th Conference of the International Group for the Psychology of Mathematics Education, Vol. 4, pp. 201-208. Prague: PME. 4 - 201
IMPROVING MATHEMATICAL KNOWLEDGE THROUGH MODELING IN ELEMENTARY SCHOOLS
Nicholas Mousoulides, Marios Pittalis & Constantinos Christou
Department of Education, University of Cyprus
The study presents the results of a 6th grade class (11 year olds) working on a modeling activity. Traditional mathematics textbooks mostly provide single and straightforward solution problems at which students only apply a formula to reach a solution. On the contrary, students’ work on modeling activities focus on analysing a problematic situation, setting and testing conjectures and model construction. In modeling activities students work in small groups and they are actively engaged in fruitful discussions with their peers and teacher. The results of the study showed that: (a) students with no prior experience in modeling activities applied effectively their informal mathematical knowledge to solve an authentic problem, and (b) social interactions in groups enhanced the discovery of mathematical knowledge.
INTRODUCTION The economy and work force demand for school graduates to be able to work collaboratively in demanding projects, to effectively use new technological tools and to possess more flexible, creative, and future-oriented mathematical skills. Professional organizations (AAAS, 1998; NCTM, 2000) address the need for a change in the school mathematics and propose reforms in mathematics education. Most of these reforms emphasize a critical need for students to study mathematics in real world contexts and to construct models in exploring and understanding problem situations (Greer, 1997). In mathematical modeling students develop important mathematical processes, such as describing, explaining, predicting, representing, and organising data (NCTM, 2000). Mathematical modeling that explores interesting and non trivial situations for students, can become an effective medium for students to be actively engaged in acquiring mathematical knowledge (Blum & Niss, 1991) in experientially real contexts (Gravemeijer, Cobb, Bowers, & Whitenack, 2000).
THEORETICAL FRAMEWORK In the present study, a model is defined as a construct consisting of elements, relations and operations that can be used to describe, explain or predict the behaviour of some other familiar systems (Doerr & English, 2003). Models focus on the structural characteristics of the systems that they are referring to, and are expressed using a variety of representational media, including written symbols, diagrams or graphs (Lesh, & Lehrer, 2003; Lesh & Doerr, 2003). Models constructed by students for a problematic situation may also inform teachers and researchers about students’
Mousoulides, Pittalis & Christou
4 - 202 PME30 — 2006
mental models and conceptions about mathematical constructs (Greer, 1997; Lesh & Doerr, 2003). Modeling activities move beyond traditional problem solving experiences, by addressing adequately the knowledge, the processes, and the social developments that students require in dealing with increasingly sophisticated systems (Lesh, & Lehrer, 2003; English & Watters, 2005). Modeling activities for young learners, designed for group work, are inherently social experiences (Lesh, Cramer, Doerr, Post, & Zawojewski, 2003) and provide the basis of effective communication and teamwork. Students need to effectively communicate with their peers to develop and refine models that can be applied in a range of contexts (English, 2003).
Modeling activities involve mathematizing – by quantifying, dimensioning, coordinating, categorizing, algebraizing, and systematizing relevant objects, relationships, actions, patterns, and regularities (Lesh et al., 2003). Modeling activities aim to help students externalize their understanding of situations by developing models which can serve in conceptualizing mathematical ideas and processes (Lesh et al., 2003). These models focus on significant mathematical structures, patterns, and regularities and the development of such products requires multiple cycles of interpretations, descriptions, conjectures, explanations and justifications (Schorr & Amit, 2005; Lesh et al., 2003).
Current research in mathematics education is demonstrating that young learners can be benefited from working with authentic modeling problems (English & Watters, 2005). In particular, it has been argued that modeling activities can help students to build on their existing understandings, to engage in thought-provoking, multifaceted problems within authentic contexts that allow for multiple interpretations and different approaches (Schorr & Amit, 2005; Doerr & English, 2003). Specifically, in a project with modeling activities, 10 year old students were able to work successfully with mathematical problems when presented as meaningful, real-world case studies. Students were also able to discover relationships and patterns in data and applied their learning in working with similar problems (English, 2003). Finally, Doerr and English (2003) showed that students working with modeling activities developed their abilities in planning and revising their models by challenging one another’s assumptions and claims, and asking for clarification and justification for problem solutions.
THE PRESENT STUDY
The Purpose of the Study
The aim of the present study is to explore the ways in which students work in modeling activities to develop the concept of average. To this end, it is expected from students to work with authentic mathematical problems, using their prior mathematical knowledge to investigate, make sense and understand specific problems which lead to a conceptual understanding of average.
Mousoulides, Pittalis & Christou
PME30 — 2006 4 - 203
Participants and Modeling Activities
Twenty students (12 females and eight males) from an intact 6th grade class in an urban school in Cyprus participated in two modeling activities. None of these students had prior experience in solving problems in a mathematical modeling context.
In this study two modeling activities were presented to students, namely the “Drug Industries Golden Award” and the “Summer Camp Job”. Both activities derived from a list of problems found in Lesh and Doerr (2003). The purpose of the first activity was to provide opportunities for students to organize and explore data, to use statistical reasoning and to develop appropriate models for solving the problem. The “Summer Camp Job” activity provided opportunities for students to apply the models and new learnings they had developed in the content of the “Drug Industries Golden Award” activity. The second activity also provided a setting for students to focus and work with the notions of ranking, selecting, aggregating ranked quantities and weighting ranks.
The application of the “Drug Industries Golden Award” activity (see Figure 1) followed three stages: (a) the warm-up stage in which students read an article about Ian Fleming with the purpose to familiarize themselves with the context of the modeling activity, (b) the readiness stage which involved the discussion of the article, and (c) the modeling stage in which students were engaged in constructing a model to answer the basic questions of the problem.
Procedure
Students spent two 40 minutes sessions in completing each of the two modeling activities. Each activity started with a whole class discussion on the warm-up task and readiness questions. Then students worked in groups of three or four to provide solutions for the activity. After completing their work, each group presented its models to the rest of the class for questioning, comparing with others’ models and constructive feedback. Students again worked back in their groups to revise and refine their models. Finally, a whole class discussion focused on the key mathematical ideas and processes that were developed during the modeling activity.
Data Sources and Analysis
The data for this study were collected through (a) videotapes of students’ responses during whole class discussions, (b) audiotapes of students’ work in their groups, (c) students’ worksheets and final reports detailing the processes used in developing models, and (d) researchers’ field notes. Videotapes and audiotapes were analyzed using interpretive techniques (Miles & Huberman, 1994), for evidence of students’ mathematical developments towards the statistical concepts appeared in the modeling activity. Due to space limitations, we mainly present the results of one group of students, working on the “Drug Industries Golden Award” activity.
Mousoulides, Pittalis & Christou
4 - 204 PME30 — 2006
Use the reaction times in the table below to rank the four drugs by their effectiveness. Write a letter, explaining and documenting your results, to the chairman of the Drug Industries Association.
Figure 1: The Drug Industries Golden Award Activity
RESULTS Students’ purpose in the modeling activity was to provide a reasonable answer of how to select the best drug. The results are presented on the basis of the modeling cycles developed in students’ work after the analysis of the transcripts.
Cycle 1: Focusing on Subsets of Information The first purpose of students’ work was to rank the four pain-relief drugs, according to their effectiveness. In this first attempt, students’ efforts focused on subsets of information, as they only concentrated on the smallest reaction time for each drug. The transcript below shows how students perceived the solution of the problem. These initial solutions created the need for students to search for more justifiable solutions.
Helen: I believe that Saracetamol is the most effective since it has the least reaction time. Other drugs need more time.
Alex: Yes, but what about Kefapol? In three cases it needs the least time to act.
Mousoulides, Pittalis & Christou
PME30 — 2006 4 - 205
Alice: Check over here! Kefapol’s times are 17, 17 and 17 while Saracetamol’s are 11, 11 and 12 respectively.
Alex: You are right, but Saracetamol has also 20 and 25 minutes reaction time.
The students engaged in debates over how to generate a comprehensive model which could handle both small and big reaction times. This first discussion led them to approach the problem in a more systematic way. Students used their informal knowledge to make a number of conjectures and justify their claims:
Helen: Let’s circle in each line the drug with the smallest reaction time. Researcher: How will you rank the drugs? Alice: We will count the number of circles for each drug.
The above process did not lead to an appropriate answer to the problem; however, this approach forced students to argue about its usefulness since there were drugs with the same reaction time. Alex suggested circling both drugs. Based on this idea, students ranked the drugs in the following order: Saracetamol, Ralpol, Kefapol and Kanatol. A similar but more “refined” approach was used by a second group of students. Their solution was to circle both the smallest and biggest reaction times and then subtracting the two numbers. That group ended with a different drug ranking: Saracetamol, Kefapol, Ralpol and Kanatol. Since none of the groups used a systematic approach to tackle the problem, there were long debates during students’ presentations. Different approaches and contradicting results led students to face the need to mathematize their procedures. Thus, students began to use two main mathematical operations to handle the data for each drug, namely, (a) totalling the amounts of reaction time for each drug, and (b) finding the average for each drug and comparing the averages.
Cycle 2: Using Mathematical Operations and Processes The core characteristic of the solutions appeared in the second cycle was the adoption of more sophisticated mathematical processes. Alex’s group next approach was based on the assumption that any new development should consider all reaction times and not only the best or/and worst reaction times.
Alex: We should add all reaction times for each drug. Alice: Why should we do that? Helen: Alex is right. By adding all numbers ... find the drug with the least sum.
This one will be the most effective pain relief drug.
This new mathematical approach, based on finding the sum of reaction times for each drug changed the ranking of the drugs to: Saracetamol, Ralpol, Kanatol and Kefapol. Students were really surprised since the last ranking was quite different from previous ones. The big numbers that students encountered while working with “sums-model” started a new round of discussion. Helen suggested that they could divide the sums by the number of the cases to find the average, because “it’s difficult to work out the sum of
Mousoulides, Pittalis & Christou
4 - 206 PME30 — 2006
reaction times, especially if we have more cases”. Alex realized that Helen’s model would produce the same ranking, since “we divide the sums by the same number, so nothing will change in the ranking”. Alice was a little bit confused and remained unconvinced; however, she asked for more clarifications as shown in the transcript below:
Helen: First we add all times and divide by ... (she was interrupted by Alice) Alice: Four. We have four drugs. Alex: No, this is not correct. We do not find the average like this. We need to
divide by twenty, the number of cases. Alice: You mean that we add all reaction times and divide by 20? Alex: No, there is no reason to add all reaction times. We only add the reaction
times for each drug because we need to calculate the average for each drug.
Helen: We do not always divide by 20 but with the number of cases. We need one average for each drug to find the differences between the four drugs. We could also calculate one average for all drugs, but only to compare these four drugs with other ones.
Most groups used a systematic approach to find a solution to the problem, either by finding the sums of reaction times or by working with the average. It should be noted that not all students approached the problem using a mathematical approach. For example, James, even after the discussion and the groups’ presentations of appropriate solutions, believed that the “best drug” was the one having the smallest reaction time in one case. A representative and interesting snapshot of students’ work appeared in the letter they sent to the Chairman of the Drug Association. They made evident that they spent a lot of time searching for the best solution, and they were confident that their final solution was correct. Quite impressive was a group’s comment on the transferability of their model:
“Comparing the averages is also appropriate for similar competitions you will have in the future. Our solution can be used to find the most effective drug, even in cases with more than four drugs. You also can use average to compare other products, like day skin creams. Be careful though, since in other cases, you might need to find the highest and not the lowest average”.
The final presentation of students’ suggested models and solutions resulted in one more round of arguments and a discussion on the meaning of average. One student pointed that a drug’s average is the time needed for the drug to react in most of the cases. Alex disagreed with her, mentioning that: “the average actually shows the reaction time of a drug if that time is the same for all cases”.
DISCUSSION An important conclusion of the present study is that the participating students were able to work successfully with mathematical modeling problems when presented as meaningful, real-world case studies. The framework, within the problem was
Mousoulides, Pittalis & Christou
PME30 — 2006 4 - 207
presented, helped students to realize and to get familiar with the problematic situation and thus enhanced their statistical understandings (English, 2003). At the same time, the activity did not narrow students’ freedom and autonomy to approach and analyze the problem taking into account their prior and informal knowledge. On the contrary, students’ work was impressive; they analyzed the problem using different viewing angles, set and test hypotheses, evaluate, modify and refine their models and solutions, just like professional mathematicians! On the problem presented here, the students progressed from focusing on subsets of information which resulted in not suitable models to applying the appropriate mathematical concepts and processes that helped them finding an effective mathematical model. This new model was reusable, shareable and could serve to construct more sophisticated models for solving even more demanding problems (Doerr & English, 2003). It was also clear that many students identified the structural elements of the problem in developing their final model, in such a way that they could easily transfer and modify their models in the second activity. At the same time it is impressive that students’ models took place in the absence of any formal instruction, and involved the children in describing, analyzing, explaining, justifying, checking, and communicating their ideas with peers and teachers (Lesh et al., 2003). Quite important were also students’ efforts in documenting their solutions in a letter to the Chairman of the Drug Association. Few problems in traditional textbooks generate learning of this nature and quality (English, 2003) and students appeared to be successful and productive. An important aspect of students’ work is the communication and social interaction that took place naturally within the groups. These interactions engaged students in analyzing, planning and revising courses of action, challenging one another’s assumptions and claims, and ensuring the group worked as a team. Given the importance of communication and sharing of ideas in mathematics education (NCTM, 2000), there is evidence that modeling activities can successfully serve in this direction. Finally, a possible direction for future research in the area could be the investigation of students’ ability to transfer effectively their constructed models in solving similar structured problems and to modify ready made models (by peers) in solving problems. Quite interesting would also be the examination of the role of new technological tools in solving non routine authentic problems like the one presented here and to investigate whether the use of technological tools can provide alternative approaches and developed models. References American Association for the Advancement of Science (1998). Blueprints for reform:
Science, mathematics, and technology education. New York: Oxford. Blum W., & Niss M. (1991). Applied mathematical problem solving, modeling,
applications, and links to other subjects – State, trends and issues, Educational Studies in Mathematics, 22, 37-68.
Mousoulides, Pittalis & Christou
4 - 208 PME30 — 2006
Doerr, H. M., & English, L. D. (2003). A Modeling perspective on students’ mathematical reasoning about data. Journal of Research in Mathematics Education, 34(2), 110-136.
English, L. D. (2003). Reconciling theory, research, and practice: A models and modeling perspective. Educational Studies in Mathematics, 54, 225–248.
English, L. D., & Watters, J. (2005). Mathematical modeling with 9-year-olds. In H. L. Chick, & J. L. Vincent (Eds.), Proc. 29th Conf. of the Int. Group for the Psychology of Mathematics Education (Vol. 2, pp. 297-304). Australia: University of Melbourne.
Gravemeijer, K., Cobb, P., Bowers, J., & Whitenack, J. (2000). Symbolizing, modeling and instructional design. In P. Cobb, E. Yackel, & K. McClain (Eds.), Symbolizing and communicating in mathematics classrooms (pp. 225-274). Mahwah, NJ: Lawrence Erlbaum Associates.
Greer, B. (1997). Modeling reality in mathematics classrooms: The case of word problems. Learning & Instruction, 7, 293–307.
Lesh, R., Cramer, K., Doerr, H. M., Post, T., & Zawojewski, J. (2003). Model development sequences. In H. M. Doerr & R. Lesh (Eds.), Beyond constructivism: A models & modeling perspective on mathematics problem solving, learning & teaching (pp. 35–58). Hillsdale, NJ: Lawrence Erlbaum Associates, Inc.
Lesh, R., & Doerr, H. M. (2003). Beyond Constructivism: A Models and Modeling Perspective on Mathematics Problem Solving, Learning and Teaching. Hillsdale, NJ: Lawrence Erlbaum
Lesh, R., & Lehrer, R. (2003). Models and modeling perspectives on the development of students and teachers, Mathematical Thinking and Learning, 5(2&3), 109–130.
Miles, M. & Huberman, A. (1994). Qualitative Data Analysis (2nd Edition). London: Sage Publications.
National Council of Teachers of Mathematics (2000). Principles and standards for school mathematics. Reston, VA: Author.
Schorr, R.Y., & Amit, M. (2005). Analyzing student modeling cycles in the context of a “real world” problem. In H.L. Chick, & J.L. Vincent (Eds.), Proc. 29th Conf. of the Int. Group for the Psychology of Mathematics Education (Vol. 2, pp. 297-304). Australia: University of Melbourne.
2006. In Novotná, J., Moraová, H., Krátká, M. & Stehlíková, N. (Eds.). Proceedings 30th Conference of the International Group for the Psychology of Mathematics Education, Vol. 4, pp. 209-216. Prague: PME. 4 - 209
INTEGRATING CONCEPTS AND PROCESSES IN EARLY MATHEMATICS: THE AUSTRALIAN PATTERN AND
STRUCTURE MATHEMATICS AWARENESS PROJECT (PASMAP)
Joanne Mulligan*, Michael Mitchelmore* & Anne Prescott** *Macquarie University, Sydney, Australia
**University of Technology, Sydney, Australia A broad descriptive study of 103 first graders and 16 longitudinal case studies found that children’s perception and representation of structure1 generalised across a wide range of mathematical domains. Children’s strategies showing use of pattern and structure were determined from task-based interviews. A high positive correlation (0.944) was found between children’s performance on forty Pattern and Structure Assessment (PASA) tasks, and four stages of structural development: pre-structural, emergent, partial, and structural. Multiplicative structure, including unitising and partitioning, and ‘spatial structuring’, were found as critical to development of pattern and structure.
BACKGROUND The development of mathematical concepts involves the recognition of patterns and structural relationships within and between mathematical objects and situations. Mathematical patterns encountered in school range from number sequences and spatial arrays to algebraic generalisations and geometrical theorems. Broadly, a pattern may be defined as a numerical or spatial regularity, and the relationship between the various components of a pattern constitute its structure. Pattern and structure may be regarded as inherent or constructed from, brought to or imposed on mathematical systems. Research on children’s development of mathematical concepts and their representations (e.g., counting, grouping, unitising, partitioning, estimating, base ten and multiplicative structure, and algebraic reasoning) has highlighted the role of pattern and structure. Goldin (2002) described the development of structure in children’s representations and found that it leads ultimately to the construction of autonomous representational systems. However, there have been few studies with young children that have described general characteristics of structural development and how pattern and structure are integral to concept development. In our PME 28 report (Mulligan, Prescott & Mitchelmore, 2004) we described how the mathematical structure present in children’s representations generalised across five mathematical domains: time (clockface), number, space and algebra (triangular pattern), measurement (unitising area and length) and data (picture graph). Individual profiles of responses were reliably coded as one of four broad stages of structural 1 In this paper we refer to the term ‘structure’ to encompass our definition of both pattern and structure.
Mulligan, Mitchelmore & Prescott
4 - 210 PME30 — 2006
development: pre-structural, emergent, and partial structural stages, followed by a stage of structural development. At PME 29 (Mulligan, Prescott & Mitchelmore, 2005) we reported the consistency of this structural development across tasks for eight high achieving and eight low achieving individuals, who were tracked over a two-year period. A fifth stage, an advanced stage of structural development was identified for high achievers, where the child’s structural ‘system’ depicted an increased level of abstraction. However developmental patterns for the low-achieving cases were inconsistent; the transition from a pre-structural to an emergent stage was somewhat haphazard and some children reverted to earlier, primitive images after a year of schooling. There was further new and compelling evidence that structural development was impeded because children fail to perceive structure initially and thus they continue to produce increasingly crowded and chaotic responses that often rely on replication of superficial, non-mathematical features. In this paper we report the primary analyses of structural development for 103 first graders who participated in the first year of the study. An aim of the study was to investigate the consistency of children’s strategies for solving a wide range of mathematical tasks that incorporated common features of pattern and structure. The use of multiplicative structure and unitising were key features of the tasks. We provide evidence that early mathematics achievement is strongly linked with the child’s development of mathematical structure; mathematical structure is an underlying characteristic that generalises across content domains. We build further upon previous analyses (Goldin, 2004, in communication; Goldin, 2002; Gray, Pitta & Tall, 2000; Tall, 2005, in communication; Thomas, Mulligan & Goldin, 2002), with the aim of making as explicit as possible the bases for our identification of developmental stages of mathematical structure. The implications of this research for classroom-based research using a Pattern and Structure Assessment (PASA) interview instrument and a Pattern and Structure Mathematics Awareness Program (PASMAP) are outlined.
THEORETICAL FRAMEWORK Our studies on the role of structure in early mathematics have integrated a number of theoretical perspectives that can be traced to previous work on multiplicative reasoning (Mulligan & Mitchelmore, 1997). These studies were based largely on theories of Fischbein (‘intuitive models’) and Vergnaud (‘conceptual fields’). Further research on children’s representations of multiplicative situations and the structure of the numeration system led us to adapt Goldin’s model of cognitive representational systems (Goldin, 2002; Thomas, Mulligan & Goldin, 2002). We also took into account more explicitly, theories on imagery and ‘procepts’ to explain qualitative differences in low-achieving students’ use of imagery and concept development (Gray & Tall, 2000; Pitta-Pantazi, Gray & Christou (2004). The study of two- and three-dimensional structures (Battista, Clements, Arnoff, Battista & Borrow, 1998), and measurement concepts (Outhred & Mitchelmore, 2000) directed us to include the study of ‘spatial structuring’ as a critical feature, as it involved the process of
Mulligan, Mitchelmore & Prescott
PME30 — 2006 4 - 211
constructing an organisation or form. This drew our attention to construction of multiplicative features shown in groups, arrays, grids, equal-sized units and graphs. Further development of our research project complements other recent studies of early mathematics aimed at describing underlying conceptual bases of abstraction and generalization and the role of mathematical modelling and reasoning. For example, studies such as the Measure Up (MU) project (Slovin & Dougherty, 2004) where children approach mathematics through measurement and algebraic representations or those by English and Watters’ (2005) that focus on structural characteristics such as patterns, and relationships rather than superficial features of problem-solving situations. We also integrate some features from studies of early algebraic reasoning (Blanton & Kaput; Schliemann, Carraher, Brizuela, Goodrow, & Peled, 2003; Warren, 2005) focused on number patterns and functional thinking.
Number Measurement Space/Graphs/Patterns Subitising: visualise array 2 3
Length: use informal equal sized units
Pattern/visual memory: reconstruct triangular pattern of dots
Rote counting: multiples of 2, 5 & 3
Length: partitioning halves and thirds (continuous)
2 Dimensional space: use one unit to calculate area of 2D shape
Perceptual counting: multiples of 2 (1–30)
Length: construct units on ‘empty’ ruler
2 Dimensional /3 Dimensional: units of volume in 2D net and box
Area/Unitising: visualise and calculate area using one unit
Angles: represent and draw corners of a square
Ten as a unit using currency
Area: drawing units in partial grid
Picture graph: use grid and table
Partitioning 2x8x2 grid Mass: unitising, comparing informal units of mass
Picture graph: construct picture graph from table
Partitive & quotitive sharing
Volume: use one unit in 2D net and box
Create/ draw self generated patterns
Combinatorial: 2x3 Time: draw o’clock on ‘empty’ clockface
Table 1: Framework of pattern and structure assessment (PASA) tasks
METHOD AND ANALYSES
Task-based videotaped interviews were conducted with 103 first graders representative of a wide range of mathematical abilities and diverse socio-economic and cultural backgrounds. (For method see Mulligan et al, 2004; 2005). Forty individual tasks representing thirty different mathematical concepts and sub- categories were integrated into an initial assessment framework (see Table 1).
These were representative of key concepts and processes that had been the subject of investigation in related studies usually focused on a single mathematical content domain such as counting or unitising. The assessment included tasks that were beyond mathematics curriculum expectations. Each task required children to use
Mulligan, Mitchelmore & Prescott
4 - 212 PME30 — 2006
elements of mathematical structure such as equal groups or units, spatial structure such as rows or columns, or numerical and geometrical patterns. Children were required to explain their strategies and draw representations such as reconstructing from memory, a triangular pattern and to visualise, then draw and explain their mental images. The analyses of data involved both qualitative and quantitative methods involving systematic coding of videotaped interviews, and interpretation of children’s drawn and written representations. The primary analysis of the first interview data focused on the reliable coding of responses as correct/incorrect for all forty tasks and the matrix examined for patterns. A composite score was compiled for each student to gain a general picture of the performance data and item difficulty. Subsequently, individual children’s responses to all forty tasks (individual profiles) were assigned a strategy indicating evidence of structural features.
As a result of this process, each child was assigned a stage of structural development. It was found that the children could be unambiguously sorted into four broad groups and correlations were generated for student performance by grouping (pre-structural, emergent structure, partial structure, structure). The presence of structural features shown in the drawn representations to five of these tasks (clock face, triangular pattern, area, length and picture graph) were analysed in depth because they gave the most convincing evidence of the child’s use of structure. However, it was not assumed that this would be consistent with the child’s performance data or that it would be consistent across most tasks.
DISCUSSION OF RESULTS Between 50% and 70% of the children could solve most of the tasks, but these were solved with a wide range of strategies depicting the relative use of structural features. Several tasks proved most difficult: counting in multiples of three, a quotition problem without the use of materials, using ten as a unit of currency, a combinatorial problem and showing thirds on a continuous length. Most students completed the graphs’ tasks showing the correct quantity but were unable to construct a graph with appropriate alignment. Most children could recognise corners in the angles task but could not draw a matching angle. The pattern (visual memory) task proved very difficult for students (see Mulligan et. al., 2005).
Table 2 and Figure 1 show students grouped by stage of structural development across the four levels of structural development. The correlation between level of structural development and the composite PASA score was 0.944, significant at the 0.01 level.
Children at the emergent stage represented larger variability than the other groups. Although there were indicators of emergent structure within 80% of the children’s responses, the quality and type of structural features was not consistent across individuals, for example, the inconsistent use of equal sized units in both the area and length tasks. The categorisation of this group may well reflect several sub-categories depicting different forms of emergent structure that are context or task dependent.
Table 2: Classification of students by stage of structural development.
The children in Groups 2 and 3 were less consistent in their responses in terms of assigning a level of structural development: there was more variability in responses of children in these groups: some 20% of responses showed pre-structural or partial structural responses. For example, a child at the emergent stage could score well on counting tasks but was generally unaware of the presence of structural features in other areas. Similarly some 20% responses at the partial structural stage were more likely to show structural rather than emergent features.
4 - S3 - PS2 - ES1 - PRS
Level#
35
30
25
20
15
10
5
0
TOTAL
Figure 1: Performance (total score) by level of structural development
All the low achieving children fell into Group 1 (pre-structural). Conversely, the high achieving children all fell into Group 4 (structural) and readily expressed mathematical structure in all or almost all of the tasks. The children in Groups 1 and 4 were all identified on classroom-based assessment measures and other independent psychometric tests to be considered as having low or high mathematical ability respectively.
CONCLUSIONS & LIMITATIONS It is not conclusive from our data whether the awareness and appropriate use of pattern and structure is a good predictor, or a consequence of, successful acquisition of basic mathematical concepts and skills. What we can conclude from the qualitative analyses is that children at the pre-structural stage did not perceive mathematical structure in most of their responses. For example, even in a simple counting task of multiples of two, these children were able to count aloud using the pattern correctly but could not show the corresponding pattern in units partitioned on a numeral track. Similarly partitioning and visualising in equal sized units proved to be difficult across a range of tasks. Children who had an advanced awareness of pattern and structure excelled across most conceptual areas and showed strong indications of early algebraic reasoning.
Mulligan, Mitchelmore & Prescott
4 - 214 PME30 — 2006
Our findings support our initial hypothesis that the more that a child’s internal representational system has developed structurally, the more coherent, well-organised, and stable in its structural aspects will be their external representations, and the more mathematically competent the child will be. We extend Goldin’s (2002) model to include two substages of developing structure and an advanced stage of structural development that was not expected from such young children. With a larger and more diverse sample and a broader range of tasks we may well find further substages within these stages. But rather than focusing on validation of stage-based developmental theories, we find it more important to identify and describe common structural characteristics across these stages that can enhance the development of mathematically coherent representations and well formed conceptual ideas. In support of Goldin’s theoretical stages of structural development, our analyses shows that mathematical structure does not develop in isolation. It develops from an emergent (inventive/semiotic) stage or stages in which characters or configurations in a new system (or new concept or task) are first given meaning in relation to previously constructed structural features. For example, the notion of equal-sized groups (multiplicative structure) is found across counting patterns, representations of these patterns on numeral tracks; in partitioning and sharing problems, in constructing and counting units of length, area and volume. We have also identified that children who operate at a pre-structural level may not necessarily progress to an emergent stage because they do not perceive some structural features with which to construct new ideas. With the advance of new concepts and skills in formal schooling young children’s transition from a pre-structural stage to an emergent stage becomes problematic, somewhat impeded and increasingly chaotic over time, as seen in the many examples of superficial and non-mathematical aspects of pre-structural children’s drawn representations. Imagery, visual memory, and recognising similarity and difference, each play an important role in the development of pattern and structure. But the development of multiplicative structures including the base ten system, unitising and partitioning are critical to building structural relationships. Spatial structuring was found to play a key role in visualising and organising these structures. Our findings show that young children are capable of developing more complex mathematical structures, rather than relying on unitary counting and additive structures, and informal units of measure. We aim to provide an integrated theoretical perspective on the underlying bases of early mathematical development: the development of pattern and structure is generic to a well-connected conceptual framework in early mathematics.
FURTHER RESEARCH AND IMPLICATIONS FOR PRACTICE There is a considerable body of research showing that low-achieving students of all ages have a poor grasp of mathematical patterns and structures. Rather than dismissing this finding as a characteristic of an immutable “low ability”, we believe that it gives the clue to preventing difficulties in learning mathematics. Our recent classroom research suggests that young students can be taught to seek and recognise
Mulligan, Mitchelmore & Prescott
PME30 — 2006 4 - 215
mathematical patterns and structures, and that the effect on their overall mathematics achievement can be substantial. In 2003, a school-based numeracy initiative, including 683 elementary school students aged from 5 to 12 years, and 27 teachers, was trialled over a 9-month period using the PASA instrument and the Pattern and Structure Mathematics Awareness Program (PASMAP). Many PASMAP activities developed students’ visual memory as they observed, recalled and represented numerical and spatial structures in processes such as counting, partitioning, subitising, grouping and unitising. Activities were regularly repeated in varied form to encourage generalisation. For example, Year 1 students learnt that in a 2 x 3 rectangular grid of squares, the squares are of equal size, they touch each other along their sides, there are the same number in each row and in each column, and the total number can be counted in multiples or patterns. In one lesson, students who initially copied the grid using a scattering of open circles later used squares of a reasonable size showing some structure. This occurred once the teacher had focused the students’ attention on the importance of the structure of the grid. PASMAP was further developed in 2005 to reflect more explicitly, aspects of early algebraic reasoning. PASMAP was trialled consistently in a design study of one first grade classroom over a nine-month period employing 28 children representing a wide range of mathematical abilities. The effectiveness of this initiative reflected the strong commitment of the recent graduate teacher under mentorship of the first researcher. Both initiatives aimed at developing teachers’ pedagogical knowledge about the awareness of children’s use of pattern and structure across key mathematical concepts. So far we have sufficient empirical and qualitative evidence to warrant an independent evaluation of the PASMAP program. Currently we are evaluating the effects of a PASMAP intervention for younger low-achieving children, aged 4 years 6 months to 6 years, in the first year of formal schooling.
References Battista, M. T., Clements, D. H., Arnoff, J., Battista, K., & Borrow, C. (1998). Students’
spatial structuring of 2D arrays of squares. Journal for Research in Mathematics Education, 29, 503-532.
Blanton, M. & Kaput, J. (2002). Design principles for tasks that support algebraic thinking in elementary school classrooms. In Cockburn, A.D.; & Nardi, E. (Eds.), Proceedings of the 26th PME International Conference, 2, 105-112.
English, L. D. & Watters, J. J. (2005). Mathematical modelling with 9-year-olds. In Chick, H.; Vincent, J. (Eds.), Proceedings of the 29th PME International Conference, 2, 297-304.
Goldin, G.A. (2002). Connecting understandings from mathematics and mathematics education research. In Cockburn, A.D. & Nardi, E. (Eds.), Proceedings of the 26th PME International Conference, 1,161-166).
Gray, E. M. & Tall, D. O. (2001). Relationships between embodied objects and symbolic precepts: an explanatory theory of success and failure in mathematics. In Van den
Mulligan, Mitchelmore & Prescott
4 - 216 PME30 — 2006
Heuvel-Panhuizen, M. (Ed.), Proceedings of the 25th PME International Conference, 3, 65-72.
Gray, E., Pitta, D., & Tall, D. (2000). Objects, actions, and images: A perspective on early number development. Journal of Mathematical Behavior, 18, 401-413.
Mulligan, J. T., & Mitchelmore, M. C. (1997). Young children's intuitive models of multiplication and division. Journal for Research in Mathematics Education, 28, 309-331.
Mulligan, J.T., Prescott, A., & Mitchelmore, M. C. (2004). Children’s development of structure in early mathematics. In Høines, M.J & Fuglestad, A. (Eds.), Proceedings of the 28th PME International Conference, 3, 393-401).
Mulligan, J. T., Mitchelmore, M. C. & Prescott, A., (2005). Case studies of children’s development of structure in early mathematics: A two-year longitudinal study. In Chick, H. & Vincent, J. (Eds.), Proceedings of the 29th PME International Conference, 4, 1- 8).
Outhred, L., & Mitchelmore, M.C. (2000). Young children’s intuitive understanding of rectangular area measurement. Journal for Research in Mathematics Education, 31,144-168.
Pitta-Pantazi, D., Gray, E. & Christou, C. (2004). Elementary school students’ mental representations of fractions. In Høines, M.J & Fuglestad, A. (Eds.), Proceedings of the 28th PME International Conference, 4, 41-48).
Schliemann, A., Carraher, D. W., Brizuela, B. M., Earnest, D., Goodrow, S., Lara-Roth, S. & Peled, I. (2003). Algebra in elementary school. In Pateman, N. A.; Dougherty, B.; Zilloux, J. (Eds.) Proceedings of the 27th PME International Conference, 4, 127-134.
Slovin, H. & Dougherty, B. (2004). Children’s conceptual understanding of counting. In Høines, M. J.; Fuglestad, A. B. (Eds.), Proceedings of the 28th PME International Conference, 4, 209-216.
Thomas, N., Mulligan, J. T., & Goldin, G. A. (2002). Children's representations and cognitive structural development of the counting sequence 1-100. Journal of Mathematical Behavior, 21, 117-133.
Warren, E. (2005). Young children’s ability to generalise the pattern rule for growing patterns. In Chick, H. & Vincent, J. (Eds.), Proceedings of the 29th PME International Conference, 4, 305- 312).
2006. In Novotná, J., Moraová, H., Krátká, M. & Stehlíková, N. (Eds.). Proceedings 30th Conference of the International Group for the Psychology of Mathematics Education, Vol. 4, pp. 217-224. Prague: PME. 4 - 217
EMBODIMENT AND REASONING IN CHILDREN’S INVENTED CALCULATION STRATEGIES
Carol Murphy University of Exeter
This paper explores the reasoning of young children in invented calculation strategies. It draws on the non-objectivist philosophies of embodied learning to analyse the use of the Laws of Arithmetic in invented strategies. In doing so it raises questions regarding the ‘a priori’ view of mathematical reasoning and the nature of children’s learning of informal and formal arithmetic. It raises questions regarding the implications of embodied learning in the primary mathematics classroom.
INTRODUCTION Through recent developments in cognitive science it is becoming accepted that humans, along with other animals, have an innate, inherited numerosity that may guide the acquisition of mathematics (Butterworth, 1999; Dehaene, 1997). Numerosity is combined with the human ability to use symbols, language and prediction to develop counting and, with the use of numerals, to create mathematics.
Lakoff and Nunez (1997, 2000) proposed a theory of embodied learning in mathematics where cognition is situated in the mind and developed through psychological and biological processes. Grounding and linking metaphors support the development of schema. These are influenced both by the body and the environment and develop understanding of mathematical ideas. The theory explores deep issues related to the universal nature of mathematical ideas and the role of culture in shaping the content of mathematics. Epistemologically the theory is non-objectivist. Mathematics is viewed as human imagination where mathematical reasoning is based on bodily experiences (Johnson, 1987). There is much evidence that young children develop their own strategies in arithmetic (Carpenter and Moser, 1984; Steinberg, 1985; Kamii et al., 1993; Foxman and Beishuizen, 1999). The use of invented strategies has been traditionally viewed as evidence of individual construction of mathematics in a Piagetian sense (Steffe, 1983). In this way the coordination of knowledge of numeration and arithmetic operations has been seen as abstract logico-mathematical reasoning and not experimental abstraction (Giroux and Lemoyne, 1998). An embodied view would suggest that the reasoning involved in these strategies is inductive and that abstraction is experimental. This paper draws on the non-objectivist philosophies of embodied learning to analyse the use of the Laws of Arithmetic in invented strategies. It challenges the notion of young children’s mathematical reasoning as deductive and explores the possibility of experiential learning in determining commutativity and associativity.
Murphy
4 - 218 PME30 — 2006
A NON-OBJECTIVE VIEW OF MATHEMATICS
A Piagetian view of mathematics sees construction of knowledge as a progression from children’s spontaneous concepts and individual, egocentric views to a ‘true’ scientific knowledge (Piaget, 1962). The child’s ultimate intellectual aim is to arrive at a ‘scientific concept’, a detached abstract view of mathematics. Although Piaget recognised mathematics as a “science as a result of man’s mental activity” (Piaget and Beth, 1966, p.305), mathematical reasoning was seen as absolute and ‘a priori’.
Cultural studies provide a different ‘world view’ and challenge Piaget’s constructivism (Lerman, 1996). Epsitemologically, Vygotsky suggested a non-objectivist view of socially constructed, shared knowledge where “concepts are socially determined and thus socially acquired” (p.146) but that cultural tools and concepts exist “outside of the individual’s mind” (p.135). “Objects in mathematics are objective in an intersubjective sense, agreed, useful, long lasting but potentially changeable” but the created reality “takes on a life of its own” (p.146).
This interpretation of Vygotsky suggests that there is an externally created reality to be internalised, the implication being that children appropriate the teacher’s (albeit) cultural knowledge (Steffe & Tzur, 1994). In seeing this as the ultimate aim it still suggests an esoteric, expert/novice model of socio-cultural learning that can reinforce the elitist academic view of mathematics.
Traditionally cognitive science in the 1970s has supported the objectivist view of mathematics by examining individual reasoning and the manipulation of arbitrary symbols (Nunez et al, 1999). Mathematics was seen as non-corporeal and it did not consider how mind and body worked together. Embodied learning provided an alternative approach in cognitive science that rejected objectivism. Epistemologically “reality is constructed by the observer, based on non-arbitrary culturally determined forms of sense making which are ultimately grounded in bodily experience” where “cognition is about enacting or bringing forth adaptive and effective behavior, not about acquiring information or representing objects in an external world”. (Nunez et al, 1999, p.49)
The view of mathematics as an external reality either in an objective or an intersubjective sense may lead it to be taught in an authoritarian way where the mathematics is presented as “fully formed and perfectly finished knowledge” (Ernest, 1994, p.1). In this way academic mathematics may be seen as esoteric, elitist and decontextualised where students acquire very specific meanings to the mathematics taught in schools. The embodied notion of mathematics as internal and ‘mind-based’ may help to remove such an authoritarian view and, in turn, support affective views of mathematics.
Murphy
PME30 — 2006 4 - 219
GROUNDING METAPHORS AND EXPERIENTIAL LEARNING Lakoff and Nunez (1997, 2000) proposed two types of metaphors from which the conceptual structure of mathematics has been developed. The first are termed ‘grounding metaphors’. These allow everyday experiences to project onto abstract concepts. The second are termed ‘linking metaphors’ that yield more sophisticated abstract ideas and allow different branches of mathematics to be linked. In exploring children’s invented strategies the first type is of interest. These are said to be based on commonplace physical activities such as collecting objects into groups, splitting groups of objects and moving objects together and apart. These are linked with basic numerosity skills of subitising and counting. In this way the three basic grounding metaphors are:
Arithmetic is Object Collection Arithmetic is Object Construction Arithmetic is Motion
The first is a “precise mapping from the domain of physical objects to the domain of numbers” (Lakoff and Nunez, 2000, p.55) and is reflected in our language by the word ‘add’ as the physical placing of objects or substances into a container or group of objects. For example: “Add some logs to the fire”. In arithmetic this becomes “If you add 4 apples to 5 apples, how many do you have?”. This metaphor, along with the other two grounding metaphors, can be seen to base arithmetic firmly in experience and as a human construction. There are objects that exist in reality but the idea of a collection or group of objects is a human construction. This does not contradict socio-cultural or constructivist views of mathematics as a human construction. Vygotsky (1978) saw the perception of real objects as a human construction in that we do not just see a world of shape and colour but impose a sense and meaning. Constructivists such as von Glasersfeld (1994) have stated that mathematics would not exist without the notion of ‘unit’ and that this notion is “derived from the construction of objects in our experiential world” and quotes Einstein in referring to the concept of objects as “a free creation of the human … mind” (p.5).
INVENTED STRATEGIES AND EXPERIENTIAL LEARNING As stated earlier there is evidence of young children inventing their own calculation strategies. The innate basis for arithmetic would seem to be limited to subitising small numbers of objects (Butterworth, 1999; Dehaene, 1997) but arithmetic is said to exist as a human construction of numbers. For example addition would not be closed under subitising and relies on the human creation of counting and infinity. Although there may be an innate basis for arithmetic, not all arithmetic is innate (Lakoff and Nunez, 2000). With the invention of their own calculation strategies young children often rely on the Laws of Arithmetic. For example when putting a larger number first in counting-
Murphy
4 - 220 PME30 — 2006
on in addition children will rely on commutativity. When partitioning numbers into tens and units or ‘bridging’ across the decades children will rely on associativity.
The question arises ‘How do children learn to use these?’ There is a possibility that social mediation plays a role as children check their answers using these strategies but this does not explain how children develop them in the first instance. Some children will have developed their own strategies before starting school or in a formal mathematics classroom where their use is discouraged.
Lakoff and Nunez proposed that the Laws of Arithmetic only exist through human construction of numbers and that the laws are a metaphorical entailment of the Arithmetic Is Object Collection metaphor. Young children can determine commutativity experimentally. In object collections, adding A to B gives the same result as adding B to A. The claim is then that they will find that, for numbers, adding A to B gives the same result as adding B to A. Similarly associativity can be determined experimentally where adding B to C and then adding A to the result is the same as adding A to B and adding C to the result in both collection of objects and numbers.
Gelman and Gallistel’s (1978) empirical studies of young children’s counting have found that children develop numerical reasoning as they develop the principles of counting beyond ‘one-one correspondence’. A further principle of counting, ‘order-irrelevence’, requires a more abstract view of number as the child finds out that the order in which you count a set of objects does not affect the number you end up with. This can then extend to addition and the realisation that this can be commutative.
“Addition in the child’s view, involves uniting disjoint sets and then counting the elements of the resulting set. According to the order irrelevance principle it does not matter whether in counting the union you first count the elements of one set and then the elements from the other or vice versa” (p.191).
When extended to three sets, associativity is also implicit in the child’s numerical reasoning. In such a way young children may implicitly determine commutativity and associativity as Laws of Arithmetic that tell them how numbers can be manipulated. They have moved beyond the innate numerosities and are beginning to reason with number.
INFORMAL AND FORMAL ARITHMETIC By analysing the use of commutativity and associativity in invented strategies in terms of experiential learning it is possible that children develop early reasoning in number inductively but that this reasoning may be intuitive or implicit. Roter (1985) found that children were able to carry out unconscious abstract processes to some degree. By exploring inductive cognitive activities based on sequences of simple geometric shapes determined by complex rules it was found that children could abstract complex knowledge from the environment where the knowledge obtained was tacit.
Murphy
PME30 — 2006 4 - 221
This suggests the development of implicit, informal mathematical practices as used in everyday life. These practices are often intuitive and are used with little or no formal justification. They may be accepted on a pragmatic basis and empirically determined. The notion of embodied learning, grounding metaphors and the deductive determination of the Laws of Arithmetic through the order-irrelevance principle would support this implicit experiential learning of informal mathematics and the unconscious abstraction of knowledge from the environment.
Formal mathematics, on the other hand, is based on proofs and axioms where reasoning is deductive. Tall (2001) questioned the founding of formal constructions in mathematics from natural or informal embodied concepts. Formal mathematics is seen to focus on definitions and formal deduction to “avoid any appeal to intuition” (p.203). It is recognised that informal ideas often come before the axiomatic theories and that they may persist after but Tall indicated they could sometimes be contradictory. In this way Tall asserted that not all “thought is related to embodied perception” (p.207) and saw formal and informal mathematics as two distinct perceptions of mathematics. Auslander (2001) also critiqued the role of metaphor in the development of more advanced mathematics and queried how the “spontaneous use of young children meets with the analysis of academic mathematics” (p.2).
An embodied view of learning would see all reasoning as imagination based on bodily experiences (Johnson, 1987). Based on experiential philosophy, it looks to the brain and the body to explain all understanding from a naturally based account (Lakoff and Johnson, 1999). Lakoff and Nunez (2000) asserted the role of metaphors as the “basic means by which abstract thought is made possible” (p.39). It is explained that
“much of the ‘abstraction’ of higher mathematics is a consequence of the systematic layering of metaphor upon metaphor, often over the course of centuries” (p.47)
It is also however recognised that mathematics viewed as formal and disembodied will look ‘very different’ to embodied mathematics.
There is insufficient space in a paper of this length to explore this fully but there is enough to see that a contention exists between the development of natural, informal mathematics and the understanding of formal mathematics and the role that conceptual metaphors may play in this.
From a pedagogical perspective this raises questions related to the teaching of arithmetic and the relationship between children’s informal, intuitive arithmetic and the formal mathematics that may be presented to them in the classroom. Figure 1 presents two extreme paths through informal and formal arithmetic. No curriculum would follow just one of these paths. The path that follows through from experiential learning suggests the inductive development of early mathematical reasoning from empirical experience. We know that many children do invent strategies so this grounded route must play a role in many children’s mathematics. It is anticipated that
Murphy
4 - 222 PME30 — 2006
Fig. 1: Paths for Informal and Formal Development of Arithmetic
Innate – subitising
Numerosity
Informal Formal Experiential Symbol manipulation
Counting as
Physical experience.
Collection of objects
Counting as repetition of
number names, symbols
Order
irrelevance
Operations as movement of
objects
Operations as facts
Invented strategies
Commutativity, Associativity
Taught mental
calculations
Standard Algorithms
children following this route would arrive at the use of the standard algorithms with a greater capacity for reasoning intuitively. If the curriculum includes the teaching of mental calculations that are presented formally it is possible that children will base this on the practical experiences
Murphy
PME30 — 2006 4 - 223
developed from counting rather than the early reasoning based on order-irrelevence and the implicit use of the Laws of Arithmetic. If however children move from a less experiential route and calculations have been learnt as facts with little concrete verification they may learn to use standard algorithm based on limited numerosity skills. The child’s thinking about the algorithms will be limited and learning may be procedural.
CONCLUSION The notion of embodied mathematics provides further lenses with which to investigate learning in mathematics. By reviewing children’s learning in mathematics through these lenses we begin to raise further questions related to pedagogy. It has not been possible to explore the contentions between formal and informal mathematics fully but whether the transition from informal mathematics to formal mathematics is seen as bridging a distinct gap or as an evolution from embodied experience to abstract thought, metaphors could be seen as having a key role. A further question would be to consider the different metaphors children use in carrying out informal invented strategies and formal algorithms. This analysis has explored children’s informal use of arithmetic and their unconscious, implicit abstraction of mathematics and begun to consider the pedagogical implications in the teaching of arithmetic from an informal and a formal perspective. It is possible to explain children’s invented strategies from an embodied perspective that challenges the constructivist notion that the mathematical reasoning underpinning these strategies is deductive logico-mathematics in a positivist sense. Empirical studies are needed to determine this so that we can better understand how children’s early reasoning develops into their first mathematical thinking beyond numerosities and how they use this to develop mental calculations and later become proficient at a range of informal and informal strategies.
References Auslander, J. (2001). Embodied Mathematics, American Scientist Online, 89(4).
http://www.americanscientist.org/template/BookshelfReviews/issue/396 Butterworth, B. (1999). The Mathematical Brain. London: Macmillan Carpenter, T. and Moser, J. (1984). The acquisition of addition and subtraction concepts in
grades one through three, Journal for Research in Mathematics Education, 15(3), 179-202.
Dehaene, S. (1997). The Number Sense: How the mind creates mathematics. New York: Oxford University Press
Ernest, P. (1994). Constructing Mathematical Knowledge. The Falmer Press: London. Foxman, D. and Beishuizen, M. (1999) Untaught mental calculation methods used by 11-
year-olds, Mathematics in School, 28(5), 5-7. Gelman, R. and Gallistel, C. (1978). The Child’s Understanding of Number. Cambridge,
Massachusetts: Harvard University Press.
Murphy
4 - 224 PME30 — 2006
Giroux, J. and Lemoyne, G. (1998). Coordination of Knowledge of Numeration and Arithmetic Operations on First Grade Students, Educational Studies in Mathematics, 35(3), 283-301.
Johnson, M. (1987). The Body in the Mind. Chicago: University of Chicago Press. Kamii, C., Lewis, A. and Jones Livingston, S. (1993). Primary arithmetic: children
inventing their own procedures, Arithmetic Teacher, 41(4), 200-203. Lakoff, G. and Johnson, M. (1998). Philosophy in the flesh. New York: Basic Books. Lakoff, G. and Nunez, R. (2000). Where mathematics come from. New York: Basic Books Lakoff, G. and Nunez, R. (1997). The metaphorical structure of mathematics: sketching out
cognitive foundations for a mind-based mathematics. In L. English (Ed.) Mathematical reasoning: analogies, metaphors and images. (pp. 21-89). New Jersey: Lawrence Erlbaum Associates.
Lerman, S. (1996). Intersubjectivity in mathematics learning: A challenge to the radical constructivist paradigm? Journal for Research in Mathematics Education 27(2), 133-150.
Nunez, R., Edwards, L. and Matos, J. (1999). Embodied Cognition, Educational Studies in Mathematics, 39, 45-65.
Piaget, J. (1962). Comments on Vygotsky’s critical remarks. Massachusetts: MIT Press Piaget, J. and Beth, E. (1966). Mathematical Epsitemology and Psychology. Dordrecht: D.
Reidel Publishing Company. Roter, A. (1985). Unconscious abstraction processes: Can children process as well as
adults? Paper presented at the Annual Symposium of the Jean Piaget Society. May 1985. (p.18) Philadelphia.
Steffe, L. (1983). Children’s algorithms as schemes, Educational Studies in Mathematics, 14, 109-125.
Steffe, L. and Tzur, R. (1994). Interaction and Children’s Mathematics. In In P.Ernest (Ed.), Constructing Mathematical Knowledge. (pp. 8-32). The Falmer Press: London.
Steinberg, R. (1985). Instruction on derived facts strategies in addition and subtraction, Journal for Research in Mathematics Education, 16(5), 337-355.
Tall, D. (2001). Natural and formal infinities, Educational Studies in Mathematics, 48, 199-238.
von Glasersfeld, E. (1994) A radical constructivist view of basic mathematical concepts. In P.Ernest (Ed.), Constructing Mathematical Knowledge. (pp. 5-7). The Falmer Press: London.
Vygotsky, L. (1978). Mind in society: The development of higher psychological processes. Cambridge, MA: Harvard University Press.
2006. In Novotná, J., Moraová, H., Krátká, M. & Stehlíková, N. (Eds.). Proceedings 30th Conference of the International Group for the Psychology of Mathematics Education, Vol. 4, pp. 225-232. Prague: PME. 4- 225
WHEN THE WRONG ANSWER IS THE "GOOD" ANSWER: PROBLEM-SOLVING AS A MEANS FOR IDENTIFYING
MATHEMATICAL PROMISE Dorit Neria, Miriam Amit
Ben Gurion University of the Negev
Cognitive characteristics of mathematical talent include flexibility in data management, and the ability to generalize and abstract. These features can be detected in non-routine problem-solving processes. A qualitative analysis of solution strategies – regardless of the answers' correctness – can provide pertinent information on students' mathematical thinking. Solution paths - even when the final result is wrong – may reflect sophisticated mathematical thinking. On the other hand, correct answers are not always achieved by strategies indicative of mathematical promise. Our paper presents examples supporting these claims.
THEORETICAL BACKGROUND A number of cognitive, metacognitive, and affective characteristics distinguish talented math students from other students. The cognitive differences are observed in four major areas: (1) obtaining mathematical information, (2) processing the information, (3) retaining the information, and (4) a general component, a mathematical cast of mind. The processing of math information includes several components, such as the ability to generalize, the ability to think in curtailed structures, the striving for simplicity, and flexibility in thinking (Krutetskii, 1976). Mathematically talented students are recognized by their ability to formulate problems spontaneously, their flexibility in data management, and their capacity to generalize and abstract (Greenes, 1981).
By solving math problems, students have an opportunity to demonstrate and develop certain cognitive abilities, such as generalization, reasoning, data analysis, and the use of a variety of representations and strategies (NCTM, 2000).
Success in problem-solving depends on various cognitive, metacognitive and affective factors (Garofalo & Lester, 1985; Schoenfeld, 1992). Previous studies have shown that students with a talent for math are strong problem solvers (Dahl, 2004; Krutetskii, 1976; Schoenfeld, 1992; Sriraman, 2003). These students are often identified by standardized tests, even though this method does not always reveal their unique cognitive characteristics (Niederer & Irwin, 2001; Wertheimer, 1999).
When looking for students with these cognitive assets, it is important to examine not only the correctness of the answers, but also the essence of the solution process, since
Neria & Amit
4 - 226 PME30 — 2006
wrong answers are not always incongruent with mathematical promise and correct answers are not necessarily congruent with mathematical potential.
This research investigated how mathematically talented students solve non-routine problems. The paper will provide examples of wrong answers that substantiate students with mathematical promise, on the one hand, and correct solutions that fail to demonstrate the cognitive characteristics of talented math students, on the other hand.
METHODOLOGY
Population The research population was made up of thirty-nine 7th-8th grade mathematically talented students who participate in "Kidumatica" - an after-school math club in Israel for ten- to seventeen-year olds. Kidumatica offers a variety of games, riddles, and competitive activities, and the opportunity to develop sophisticated creative math thinking.
Settings and Tool The research tool was a questionnaire with five non-routine exercises that included the "Hanukah Problem" (Fig. 1). Although the students had a sufficient background to meet the challenge, the problem was considered non-routine because the arithmetic progression was unfamiliar to them. In addition, most of them had just begun learning algebra.
Fig. 1: The "Hanukah" Problem
All of the students received the questionnaires at the same time and date. They had to come up with solutions accompanied by justifications or explanations. There was ample time for completing the questionnaire.
In Hanukah (a Jewish holiday), we light candles each day of the 8 day holiday. Every day we light one leading candle and additional candles, according to the day of the holyday. On the first day we light the leading candle and one more candle, On the second day we light the leading candle and two more candles, On the third day we light the leading candle and three more candles, And so on, until the last day of celebration.
A. How many candles do we light altogether in all the eight days of the holiday? B. If the holiday was 30 days long, how many candles would we have to light? C. If the holiday was n days long, how many candles would we have to light?
Neria & Amit
PME30 — 2006 4 - 227
Analysis Methods The answers were analysed qualitatively according to three criteria (Neria & Amit, 2004): correctness of the answers, solution strategy, and the mode of representation in the solution path. (Note: our paper omits the third category). Correctness of answers: The analysis included the right answer, the wrong answer, and no answer. This category referred only to the final answer, regardless of solution paths. Solution strategy: These are the actions or methods used to understand and solve the problem (Sriraman, 2003). The categories were based on previous studies and included such strategies as: systematic list, non-systematic list, selecting and calculating operations, guessing and testing, pattern seeking, etc. (Hembree, 1992; Szetela & Nicol, 1992). A number of cognitive skills were examined in the Hanukah problem: data management, pattern recognition, generalization, and abstraction. The problem "opened the door" to a variety of solution strategies (see examples and detailed explanations in Figs. 2, 3, 4, 5). In Question A, in order to deal with the data, the students had to understand the patterns of an arithmetic progression. The solution required adding up the numbers. Question B demanded pattern recognition, as well as forming a number of generalizations, although a correct answer could be obtained simply by adding up the numbers. Question C dealt with pattern generalization and its application in abstract form.
RESULTS
Correctness of answers: 31 students (79.5%) got the correct answer for Question A, while only 11 students (28.2%) and 6 students (15.4%) succeeded with Questions B and C respectively. See Table 1:
Question A Question B Question C Correct Answer 31 (79.5%) 11 (28.2%) 6 (15.4%) Wrong Answer 6 (15.4%) 23 (59.0%) 19 (48.7%) No Answer 2 (5.1%) 5 (12.8%) 14 (35.9%) Total 39 (100%) 39 (100%) 39 (100%)
Table 1: Distribution of the correctness of answers Solution strategies: Table 2 refers to the distribution of the strategies used in Questions A and B. The strategies for question C are not presented because most of
Neria & Amit
4 - 228 PME30 — 2006
the answers were incorrect and could not be categorised (examples of students' answers will appear in the research report). In Question A, the majority of students employed a strategy that usually entailed adding up the number of candles that were lit each day (increasing numbers). They calculated the number of candles on the first day (2 candles), second day (3 candles), and so on until the eighth day (9 candles) (Fig. 5). A minority of students chose another track. They discovered that by pairing the candles and multiplying by half the number of days, they arrived at the total number of candles (Figs. 3, 4). Two students solved the problem by using the formula for the sum of an arithmetic progression series; therefore the task was not considered a non-routine problem for them.
Question A Question B Selection of operations and calculation 30 (76.9%) 17 (43.6%) Patterns search 5 (12.8%) 12 (30.8%) Formula application 2 (5.1%) 2 (5.1%) No solution path demonstrated 3 (7.7%) No answer 2 (5.1%) 5 (12.8%) Total 39 (99.9%) 39 (100%)
Table 2: Distribution of solution strategies Two different approaches appear in Question B. The addition of increasing numbers was used by 17 students (43.6%) (Fig. 2) while 12 students (30.8%) searched for non-routine problem-solving patterns.
ANALYSIS AND DISCUSSION Looking for the correct final answer is not always the most accurate way to pick out talented math students. An in-depth analysis of solution paths is also required.
The answers to Question B (Figs. 2, 3, and 4) are all correct, even though they differ in the solution strategy. The answer in Fig. 2 was arrived at through the cumbersome process of adding up thirty numbers, whereas the answers in Figs. 3 and 4 were obtained in a more sophisticated way – by recognizing a pattern and then generalizing it. Furthermore, although the student in Fig. 5 failed to solve Question B, he demonstrated a high level of mathematical thinking by his formulation of a series of partial sums in an arithmetic progression - a solution path that indicates intuitive algebraic thinking.
Answers to question C shows that wrong answers can demonstrate sophisticated mathematical thinking. A correct answer required not only the ability to generalize, but also the ability to write the generalization in abstract form. Although the answers
Neria & Amit
PME30 — 2006 4 - 229
in Figs. 3 and 4 are incorrect, they illustrate the students' ability to generalize and think abstractly, while possibly lacking the formal knowledge required for writing the correct answer. The two students identified the data pattern and figured out how to apply it to concrete situations, as in Questions A and B. They generalized the number pattern, but failed to express in abstract form the connection between the number of days (n) and number of candles. One student made one step further (Fig. 3) and used the variables x, y, and z to express the candles in each day. A creative student (Fig. 4) "invented" an original form of symbols: to express the first day she wrote "x<" (meaning: small x) and the last day "x>" (meaning: big x).
The student in Fig. 5 chose a different solution strategy altogether. In order to answer Question A, he used addition, and then proceeded to search for the relationship between the number of days and number of candles. He made a chart and systematically tried to find the algebraic expression for the required connection, using only n as a variable. Having failed to do so, he was unable to answer Questions B and C.
Although the answers to question C in Figs. 3, 4, and 5 are wrong answers, because the students did not obtain a correct solution, they are in fact good answers, since the solution strategies indicate mathematical promise.
Fig. 2
In fig. 2, Solving question B the student used the strategy of selecting operations and calculating. He spread out the days (right column), the candles to be lighted each day (middle column), and partial sums (left column).
The correct total sum, 495 candles, appears on the right.
Neria & Amit
4 - 230 PME30 — 2006
Fig. 3
Fig. 4
In fig. 4 the student wrote the answers to questions A and B without demonstrating how she obtained them. it is reasonable to assume that she was unfamiliar with the sum of arithmetic progression formula, otherwise she would have used them in question C.
The surprising formula in C is elaborated in the analysis of results and discussion section of this paper.
In fig. 3 the upper part is the answer to question A. The student wrote the number of candles to be lighted each day, and paired them (1st and 8th day, 2nd and 7th day and so on). She found that there were four equal sums of 11 (11 4).
The answer to question B is located in the center. The student applied the pattern she found in question A to B, and got a correct answer.
In the lower part is the answer to question C. The student marked the number of candles lighted on the first day as x (and not 2, as expected), y stood for the number of candles lighted on the second day and z stood for the number of candles on the last day. She then proceeded and multiplied the sum of candles (x+y+…+z) by half of the number of days (n), just as she had found in questions A and B.
Neria & Amit
PME30 — 2006 4 - 231
Fig. 5
CONCLUSIONS AND IMPLICATIONS Our study supports the claim that quantitative assessments, such as multiple-choice questions, are insufficient for discovering mathematical talent and that additional assessment methods are needed (e.g. Ablard & Tissot, 1998; Sheffield, L.J., 1999; Wertheimer, 1999). By concentrating exclusively on correct final results, important information about math thinking may be overlooked. We have noted that "wrong" answers are sometimes "good" answers because they identify talented students who demonstrate mathematical creativity and sophistication. Thus, the inclusion of non-routine problems and the documentation and analysis of solution paths are crucial for the discernment and cultivation of mathematically talented students. References Ablard, K.E., & Tissot, S.L. (1998). Young students' readiness for advanced math:
Precocious abstract reasoning. Journal for the Education of the Gifted, 21 (2), 206-223. Dahl, B. (2004). Analysing cognitive learning process through group interviews of
successful high school pupils: Development and use of a model. Educational Studies in Mathematics, 56, 129-155.
In fig. 5 the answer to question A is in upper part. The student added up the number of candles to be lighted each day.
In order to answer question B, the student wrote two columns: in the left column he numbered the days and in the right column he wrote, for each day, the accumulated number of candles that have been lighted until that day (included). This strategy did not lead to a final result. However, in his attempts he demonstrated sophisticated mathematical thinking, in fact, he formulated a series of partial sums.
Right to these columns, the student tried to answer question C, by generalising the sums he calculated in question B.
Neria & Amit
4 - 232 PME30 — 2006
Garofalo, J., & Lester, F.K. (1985). Metacognition, cognitive monitoring, and mathematical performance. Journal for Research in Mathematics Education, 16(3), 163-176.
Greenes, C. (1981). Identifying the gifted student in mathematics. Arithmetic Teacher, 28(6), 14-17.
Hembree, R. (1992). Experiments and relational studies in problem solving: A meta-analysis. Journal for Research in Mathematics Education, 23(3), 242-273.
Krutetskii, V.A. (1976). The psychology of mathematical abilities in schoolchildren. Chicago: University of Chicago Press.
National Council of Teachers of Mathematics (2000). Principals and standards for school mathematics. Reston, Va.: Author.
Neria, D. & Amit, M. (2004). Students preference of non-algebraic representations in mathematical communication. In: M. Johnson Hoines and A. Berit Fuglestad (Eds.). Proceedings of the 28th PME (Vol. 3, pp. 409-416). Bergen, Norway: Bergen University College.
Niederer, K., & Irwin, K.C. (2001). Using problem solving to identify mathematically gifted students. In: M. van den Heuvel-Panhuizen (Ed.). Proceedings of the 25th PME (Vol. 3, pp. 431-438). Utrecht, the Netherlands: Utrecht University.
Schoenfeld, A.H. (1992). Learning to think mathematically: problem solving, metacognition, and sense making in mathematics. In: D.A. Grouws (Ed.), Handbook of research on mathematics teaching and learning (pp. 334-370. New York: Macmillan.
Sheffield, L.J. (1999). Serving the needs of the mathematically promising. In L. J. Sheffield (Ed.), Developing mathematically promising students. (pp. 43-55). Reston, VA: NCTM.
Sriraman, B. (2003). Mathematical giftedness, problem solving, and the ability to formulate generalizations: The problem-solving experiences of four gifted students. Journal of Secondary Gifted Education, 14(3), 151-165.
Szetela, W., & Nicol, C. (1992). Evaluating problem solving in mathematics. Educational Leadership, 49, 42-45.
Wertheimer, R. (1999). Definition and identification of mathematical promise. In: L. J. Sheffield (Ed.), Developing mathematically promising students. (pp. 9-26). Reston, VA: NCTM.
2006. In Novotná, J., Moraová, H., Krátká, M. & Stehlíková, N. (Eds.). Proceedings 30th Conference of the International Group for the Psychology of Mathematics Education, Vol. 4, pp. 233-240. Prague: PME. 4 - 233
THE CONCEPT OF EQUATIONS: WHAT HAVE STUDENTS MET BEFORE?
Rosana Nogueira de Lima (PUC/SP – Brasil)1
David Tall (University of Warwick – UK)
In this paper, we present results from a research study designed in collaboration with teachers to investigate how Brazilian 15-16-year old students interpret the concept of equation and its solution. Data from a questionnaire, an equation-solving exercise and interviews with selected students are reported and analysed in terms of how the students are affected by their earlier experiences in arithmetic and algebra.
INTRODUCTION Teaching and learning algebra has long been seen as a source of difficulty. The situation in Brazil reveals problems similar to those in the literature. Freitas (2002) categorised student errors solving linear equations in terms of misunderstanding algebraic rules. Our purpose here is to use a theory of long-term mathematical growth involving embodiment, symbolism and proof (Tall, 2004) to seek deeper reasons for these phenomena.
LITERATURE REVIEW Kieran (1981) gave evidence that the equals symbol is often seen as a “do something symbol” rather than a sign to represent equivalence between the two sides of an equation: ‘2+3=5’ means ‘add 2 and 3 to get 5’ and an equation such as 4x 1 7 is seen as an operation to find a number which when multiplied by 4 and 1 is subtracted, gives 7. Filloy & Rojano (1989) emphasised the difficulty when the unknown appears on both sides of the equation, by naming it ‘the didactic cut’ between arithmetic and algebra. As process-object encapsulation theories appeared, Linchevski and Sfard (1991) suggested that a major problem is that students view algebraic expressions as procedures of evaluation rather than as mental entities that can be manipulated. Tall & Thomas (2001) distinguished three levels of algebra: evaluation algebra (the evaluation of algebraic expressions such as 4*A1+3 as in spreadsheets or in the initial stages of learning algebra), manipulation algebra (where algebraic expressions are manipulated to solve equations), and axiomatic algebra (where algebraic systems such as vector spaces or systems of linear equations are handled by definition and formal proof). The story emerging from these theories tells how operations in arithmetic are expressed as generalized expressions of evaluation, which in turn become mental entities for manipulation, later to be translated into formal terms. 1 The first author was supported by the CAPES Foundation, Ministry of Education of Brazil.
Nogueira de Lima & Tall
4 - 234 PME30 — 2006
Reflecting on this development, Tall (2004a) theorized that this development is a life-long journey through three distinct worlds of mathematics:
A conceptual-embodied world of perception in which sense making becomes increasingly sophisticated by verbalizing properties of objects through description, definition, thought experiment and (Euclidean) proof. A proceptual-symbolic world of action-schemas, such as counting, that are symbolized and routinized as procedures, where they may remain to give procedural thinking or be seen as an overall process symbolized as an entity, such as number, whose symbol is used flexibly as process or concept (procept). A formal-axiomatic world of formal definition and mathematical proof.
These three worlds will be named ‘embodied’, ‘symbolic’ and ‘formal’ in the remainder of this paper. It is theorized that the embodied and symbolic worlds develop in parallel, but operate in different ways. Human meaning begins from coherent embodiment of connections between concepts. Action-schemas, however, can be routinized and learnt by rote. We hypothesise that symbolic meaning comes from two distinct sources: from relationships with meaningful embodiment and from the internal coherence of the symbolism. Watson (2002) revealed a parallel between compression of knowledge in the embodied and symbolic worlds, which arises through a shift of attention from the steps of an action-schema to its overall effect. For instance, 2x+4 is a different sequence of actions (double the value and add 4) from 2(x+2) (double the result of adding two to the value), but has the same underlying effect. Such a viewpoint gives a practical way of conceptualizing the shift from procedure of evaluation to flexible algebraic manipulation. One further element in long-term learning is the effect of prior knowledge, based on structures ‘set-before’ in our genes or ‘met-before’ in our experience. Tall (2004a) termed a current structure resulting from earlier experiences a met-before. Some met-befores—such as those in a well-designed curriculum—can be a positive foundation for successful development, others, such as epistemological obstacles studied by the French School (Brousseau, 1997), can cause conflict in a new context and have a negative effect on learning. The theory of met-befores therefore represents these positive and negative aspects in a single theory. It is our purpose in this paper to use this framework to analyse the conceptions developed by students studying algebra. RESEARCH METHODS AND DATA COLLECTION The first author worked in collaboration with five secondary Brazilian teachers to discuss issues concerning equations and to design instruments for collecting data. The research involved 77 students in three groups of 15-16 year-old high school students: 26 first year and 32 second year from a public school in Guarulhos/SP, 19 second year students from a private school in São Paulo/SP. Three instruments were designed by teachers and researchers in collaboration and a further test was inserted by the researcher to clarify issues arising during analysis of data, as follows:
Nogueira de Lima & Tall
PME30 — 2006 4 - 235
A brainstorming session to categorize words used in algebra starting with EQUATION, conducted by the teacher in class, observed by the researchers. A written questionnaire concerning the notion of equation, its solution and its use in solving problems, administered in class by the teachers (table 1). A written equation-solving task, added by the researcher after reviewing the data from written questionnaire, administered by the teachers (table 2). Interviews with selected students conducted by the researcher in the presence of an observer, based on aspects arising from the earlier data.
Table 1: Questionnaire
Solve: 3x 1 3 x 5t 3 8 2m 4m m2 9 3l2 l 0 a2 2a 3 0 r2 r 2
Table 2: Equation-solving task ANALYSIS OF DATA Here we analyse the data collected in the Questionnaire, Equation Solving Task and the Interviews, supplemented by the initial brainstorming task.
Questionnaire Students’ most frequent responses to question 1 (What is an equation?) were of the form: “It is a mathematical calculation” or “It is a calculation you do to find the solution, to find x”. These suggest that most students seem to see an equation either as an arithmetic calculation, or as a calculation in which it is necessary to find the value of x, meaning the unknown. (Similar results were found by Dreyfus and Hoch,
Nogueira de Lima & Tall
4 - 236 PME30 — 2006
2004.) In addition, while some students (21 out of 77) referred to the unknown as an important feature of equations, no student explicitly mentioned the equals sign. This is consistent with the likelihood that students do not see the equals sign as an integral part of an equation, but as “sign to do something” in the sense of Kieran (1981). This “action to be performed” is almost certainly a met-before from the students’ previous experience of arithmetic, where the equals sign indicates that an arithmetic calculation is to be performed.
The responses to question 2 (What is an equation for?) relate mainly to mathematical contexts such as “to find the unknown value”, rather than real-life problem solving (“Not much in daily life, but may be useful to people who like maths”).
Question 3 (Give an example of an equation) had 47 valid responses such as ‘ 2193 xx ’, or ‘ 0322 xx ’ and 23 other responses that included ‘ 30 20 15 5 ( 5 1) ’ or ‘ 15x 5 ( 3x 7x) 5 ( 3) ’. The latter reveal an equation as a numeric process to be calculated or an algebraic expression to be evaluated to find a value to give the right-hand side. Forty-six students actually solve the equations or evaluate the expressions given.
In question 4, (What does the solution of an equation mean?), students responded in terms of “The solution to a mathematics problem”, or “The unknown value”. Some responses involved “The calculation of angles and measures”, where equations expressed known facts such as two angles adding to a right angle. Every case involved an expression to be evaluated. No student related equations to a real-world problems.
Question 5, 6 required the solutions of t2 – 2t = 0 and (y – 3).(y – 2) = 0. Analysis of the solutions suggested the need to study a wider range of problems, which are analysed in the equation-solving task, discussed below.
The practical “fence” problem in question 7 produced a few responses using the numbers given in an equation such as 40 + 40 + x + x = 200, but no one gave an equation in the form x.(40 – x) = 200 that would lead to the required solution. One student only gave a correct numerical solution with sides 10m and 20m, writing the answer straight down, probably because he noticed that these numerical values satisfied the condition. Thus none of the students symbolised the physical problem as an algebraic equation.
In question 8, where students were asked to analyse and comment on John’s one-line solution of the equation (x – 3).(x – 2) = 0, three students checked that the solution was correct by explicitly substituting the values for x and checking the arithmetic. Apart from this, the most common response from sixteen students was to try to solve the equation and compare results. Only 3 of these were correct. Solution methods varied, with 14 students beginning by multiplying out the brackets, performed correctly by only 6. Five students attempted to use the quadratic formula. No student mentioned the fact that ‘if the product of two numbers is zero, then one of them must be zero.
Nogueira de Lima & Tall
PME30 — 2006 4 - 237
The two methods illustrated were either the remembered quadratic formula, or the use of arithmetic method of checking an equation by carrying out a calculation. The former is procedural; the latter need only treat the equation as a calculation process giving a numerical result. Both are clearly met-befores: the use of the formula to solve the equation, and the experience of checking a calculation to verify that it is correct. Neither goes beyond the procedural calculation of evaluation algebra to move to the flexible use of algebraic expressions as process or concept characteristic of manipulation algebra (in the sense of Tall & Thomas, 2001). Equation-solving task This task, added by the researcher, to supplement questions 5 and 6 above began with three linear equations:
3x 1 x 3, 5t 3 8 and 2m 4m . The most used and successful met-befores to solve them were the rules of “change side change sign”, transforming 3x – 1 = x + 3 into 3x – x = 3 + 1 and, on reaching an equation of the form 2x = 4, to “move the coefficient of x to the other side of the equals sign and divide by it”, in this case giving x = 4/2. Such solutions involve a movement of the symbols, together with an extra technical element (such as changing the sign) to give the correct result. As such they could easily be rote-learnt as meaningless embodied actions, shifting symbols and doing something else at the same time. Such operations may be fragile and applied inappropriately, for instance, students may change sides without changing signs, or change the sign of the coefficient of x as they shift it to the other side, or change ax = b erroneously to x = a/b. These errors were also noted by Freitas (2002) and theorised by Linchevski and Sfard (1991) as ‘pseudo-conceptual entities’. Other errors in interpreting linear equations related to the equals sign. Several students interpreted 2m = 4m as a sum, giving 6m. Perhaps students needed to “do something”, so they perform an operation. Some students also need to find the value of m and 2m = 4m was turned into 6m, then m = –6. In the case of quadratic equations, four new equations were given:
m2 = 9, 3l2 – l = 0, a2 –2a – 3 = 0, r2 – r = 2 and analysed together with
t2 – 2t = 0, (y – 3).(y – 2) = 0 from the original questionnaire. The first equation m2 = 9 was often seen as a problem to find the square root knowing the square is 9, so the solution is m = 9 and so m = 3. The other equations were approached either by testing numeric values to see if they were solutions or by using the quadratic formula. None of the students used the property that if the product of two factors is zero, then one of the must be zero, even in the case of (y – 3).(y – 2) = 0. In interview, students did not seem to believe it. The only met-befores seem to be numeric ‘guess and test’ to seek solutions, or an attempt to use the quadratic formula.
Nogueira de Lima & Tall
4 - 238 PME30 — 2006
The students are therefore at a procedural level relying on a single procedure, without the appreciation of several procedures to give alternative approaches and certainly not approaching a flexible level of moving between expressions as processes to evaluate and concepts to be manipulated. They respond at a fragile procedural level rather than proceptual.
Interviews Fifteen students were selected for interview to give a spectrum of levels of response, including mainly those who used non-standard algebraic manipulations. They were asked to talk about their responses. The equals sign (which was not mentioned in the written responses) arose in two responses, however, it was still regarded as a sign to give a result. Calculations were often made in a fragile way that led to error, for instance, some students said that t2 is equal 2t because it is t . t, which is the same as 2t, so t2 – 2t = 0. When a fuller explanation of their understanding of equation was requested, the responses again indicate mainly a focus on the calculation involved and on the need to find the value of the unknown.
Students often referred to the use of rules to solve equations. None mentioned the idea of performing the same operation in both sides (just as none of them used this technique in the equation-solving exercise). The rules given involved operating on the symbols as “a rule that must be used to solve an equation, otherwise the right solution will not be found”. The language used often seemed to have an embodied meaning relating to actions performed on the symbols in the equation such as “pick this number and put it at the other side of the equals sign”, “I take off the brackets”, or “the power two passes to the other side as a square root”. These actions have underlying embodied foundations that relate not to real-world activities, but to moving symbols around, with a mysterious twist to make things right. It seems as if students are more comfortable trying to shift symbols rather than to perform the same operation to both sides.
Rules that they have met before in arithmetic were sometimes misapplied. For instance, when solving t2 – 2t = 0, a student wrote 1t2 – 2t1 = 0 and performed the subtraction as –1t = 0, because “you have to subtract powers as well” (subtracting the constants 2 from 1 and the exponent 1 from 2).
Another student solving the equation 3l2 – l = 0 explained, “I leave 3 aside, pick up 2 (the exponent), then make 2l and put 3 and l together”, reaching 2l – 3l = 0. To subtract these terms, she said, “plus with minus is minus; different signs, add numbers” and wrote down –5l = 0.
Discussion The data collected shows that these students’ conceptions of equations and ways of solution are fundamentally based on arithmetic met-befores, where the equals sign is conceived as “something to do” to “get the solution” and on what they recall from previous experience in algebra. Their main solution method is the quadratic formula,
Nogueira de Lima & Tall
PME30 — 2006 4 - 239
which could give a correct solution whether or not it is fully understood, but was often fragile and applied incorrectly. There was no aspect of embodiment of real-world contexts in their conceptions of equations. There was no mention of equivalence between the two sides of the equation, nor of applying the same operation to both sides to simplify the equation in the process of moving towards a solution.
Discussion with the teachers revealed that there was a widespread belief that algebra was difficult and so there was a strong focus on the quadratic formula because it was seen as the most efficient way of getting a solution with less possibility of students making mistakes. This focus on a single procedure seems to have the effect of impeding the development of any flexibility to give meaning to equations and their solution. There is no possibility of a shift from procedural methods of evaluation to more flexible operations of manipulation algebra.
We share the widespread belief that the teaching of algebra in general and equations in particular should be based on experiences that give meaning. Embodiment gives human meaning, but does not feature in the experiences of these students. Symbolic meaning arising from the coherent relationships between different methods of solution is also unlikely. Instead the students have limited procedural knowledge that is fragile and prone to error.
References Brousseau G. (1997). Theory of Didactical Situations in Mathematics, Kluwer, Netherlands. Dreyfus, T. & Hoch, M. (2004). Equations – a structural approach, Proceedings of 28th
International Conference for the Psychology of Mathematics Education, Bergen, Norway, vol. 1, p. 152-155.
Filloy, E. and Rojano, T. (1989). Solving equations, the transition from arithmetic to algebra, For the Learning of Mathematics, 9(2), 19-25.
Freitas, M. A. de (2002). Equação do primeiro grau: métodos de resolução e análise de erros no ensino médio. Master’s Dissertation. São Paulo: PUC-SP.
Kieran, C. (1981). Concepts associated with the equality symbol. Educational Studies in Mathematics, 12, 317-326.
Linchevski, L. & Sfard, A. (1991). Rules without reasons as processes without objects – The case of equations and inequalities. Proceedings of 15th International Conference for the Psychology of Mathematics Education, Assisi: Italy. 2, 317– 324.
Tall, D. O. (2004). Thinking through three worlds of mathematics, Proceedings of the 28th Conference of the International Group for the Psychology of Mathematics Education, Bergen, Norway, 4, 281–288.
Tall, D. O. & Thomas, M. O. J. (2001). The long-term cognitive development of symbolic algebra, International Congress of Mathematical Instruction (ICMI) Working Group Proceedings - The Future of the Teaching and Learning of Algebra, Melbourne, 2, 590-597.
Nogueira de Lima & Tall
4 - 240 PME30 — 2006
Watson, A. (2002). Embodied action, effect, and symbol in mathematical growth. Proceedings of the 26th Conference of the International Group for the Psychology of Mathematics Education, Norwich, UK, 4, 369–376.
2006. In Novotná, J., Moraová, H., Krátká, M. & Stehlíková, N. (Eds.). Proceedings 30th Conference of the International Group for the Psychology of Mathematics Education, Vol. 4, pp. 241-248. Prague: PME. 4 - 241
TEACHING BECOMES YOU: THE CHALLENGES OF PLACING IDENTITY FORMATION AT THE CENTRE OF MATHEMATICS
PRE-SERVICE TEACHER EDUCATION Kathleen T. Nolan
University of Regina In spite of introducing new forms of instruction and assessment during teacher education programs, traditional textbook and teacher-directed approaches prevail in mathematics classrooms. Such approaches still dominate because of a number of socio-cultural issues relating to pedagogical identity, classroom culture, the perceived nature of mathematics, and personal epistemological beliefs. Because new and innovative forms of instruction and assessment look very different from current classroom practices, attempts to implement them highlight several obstacles to change in the teaching of mathematics. In this paper, I briefly discuss three such obstacles that emerged and dominated the discourse during a research process with secondary mathematics pre-service teachers.
INTRODUCTION As many mathematics researchers have documented, there are a range of personal, political, and social factors that influence the development of mathematics teachers and their pedagogical identities (Goos, 2005; Kaartinen, 2003, Lerman, 2005; Nichol & Crespo, 2003; Walshaw, 2005). If one acknowledges the importance of these factors, many dimensions of a mathematics teacher's pedagogical identity can be viewed through socio-cultural lenses. For instance, in terms of the preparation of mathematics teachers within a teacher education program, a socio-cultural perspective would propose that �“teacher preparation is not just the technology that equips future teachers with knowledge and proficiency. It rather lays the foundations for novice teachers�’ enacting of new or modified patterns of interaction.�” (Jaworski & Gellert, 2003, p. 850) In spite of introducing new modes of classroom interaction during teacher education programs, traditional textbook and teacher-directed approaches prevail in mathematics classrooms. According to several researchers (Jaworski & Gellert, 2003; Lerman, 2005), such approaches still dominate because of a number of socio-cultural issues relating to classroom culture, the perceived nature of mathematics, acceptable styles of interaction, and personal epistemological beliefs. These issues are often neither trivial nor overt in the lives of pre-service teachers but, instead, embedded within their actions and motivations. As will be discussed in this paper, enacting such new and modified patterns is not an easy task for novice teachers who find themselves faced with the conservative power of school tradition and culture. Since new and modified patterns of interaction often fly in the face of current status quo practices, they highlight the obstacles to change in the teaching of mathematics. While it is important to recognize that �“teachers of mathematics are all in the process of pedagogical identity development through
Nolan
4 - 242 PME30 �— 2006
which they are learning to see themselves as becoming the teachers that they value most�” (Bishop, Seah & Chin, 2003, p. 755), it became apparent in this study that placing an exploration of mathematics pedagogical identity �‘at the centre�’ is a challenging task indeed. Rather, the data gathered through the study described in this paper indicates that at the centre of mathematics teacher education lie many unexplored and unquestioned obstacles to change.
DESIGN AND PURPOSE OF STUDY The research study was designed as a case study to investigate the experiences of three pre-service teachers during their internship in secondary school mathematics classrooms. The study emerged out of a recognized disconnect between the theory of a university-based curriculum course on alternative instruction and assessment and the practical implementation of these ideas in mathematics classrooms. The university curriculum course focused on studying the theory and practice of alternative instruction and assessment strategies such as problem-based learning (PBL), portfolio assessment, journal writing, anecdotal records, student interviews, and self-assessment. The strategies clearly represented a paradigm shift in mathematics teaching and learning for these pre-service teachers (Nolan, 2004; Nolan & Corbin Dwyer, in press). Their perceptions of what it means to know, to teach, and to learn mathematics did not readily enable (let alone encourage) them to integrate these new and different ideas into practice. In fact, as the instructor, I encountered substantial student resistance based in their perceptions of the reality of mathematics classrooms, curricula, and students. The study referred to in this paper was designed to mentor pre-service secondary mathematics teachers as they negotiated transitions from the theories of this university course to the practices of the classroom. The intent was to provide opportunities for pre-service teachers to �‘try out�’ the innovative instruction and assessment strategies they studied in their university course work through a reflective and integrated approach during their internship field experience. The main question posed in the study was: What happens in a secondary mathematics classroom when pre-service teachers who have been introduced to alternative and innovative instruction and assessment strategies in a university-based curriculum course attempt to realize the strategies in practice? Since this question was explored throughout the pre-service teachers�’ internship semester, the research study attempted to view the mathematics classroom as a curriculum laboratory (Vithal, 2000) where new ideas could be tried under the guidance of experienced cooperating teachers and a mentoring teacher educator. While the results of this study successfully point to a number of key issues for future directions and further research (Nolan, forthcoming), in this paper I wish to highlight results of a different sort�—results that point to how the research was resisted and �‘explained away�’ (Skovsmose, 2005). The data and results presented in this paper describe how the original intent to explore the kind of teacher one wants to become, while providing opportunities to �‘try out�’ one�’s developing pedagogical identity, ended up being overshadowed by obstacles to change and to the research process itself. In other words, in this paper the results
Nolan
PME30 �— 2006 4 - 243
point to a need to reflect on the question: do you become a math teacher or does a math teacher become you?
THEORETICAL FRAMEWORK AND DESCRIPTION OF STUDY While there are a range of theoretical landscapes for describing and understanding how/when/if learning occurs, socio-cultural views of learning are being drawn upon more and more by educators and researchers due to an increasing belief that learning embodies social, political, historical and personal dimensions. To explore learning through socio-cultural lenses means to open the nature(s) of learning to scrutiny by (1) viewing learning as situated with/in the social interactions of members of a social group (Bauersfeld, 1988), (2) understanding cognition to be both in the minds of individuals and distributed across communities of practice (Bohl & Van Zoest, 2003; Eames & Bell, 2005), (3) exploring how particular practices of schooling are implicated in the constitution of teacher and student identities (Walshaw, 2005) and, (4) exploring how meaning is negotiated through the cultural tools (especially language) that operate within school discursive practices (Lerman, 1994; Radford, 1997). In addition, research with/in a socio-cultural framework can highlight the importance of a critical mathematics education (Skovsmose & Borba, 2004) by drawing attention to assumptions that remain unquestioned while highlighting possible alternative images of mathematics practices and discourses (Simmt & Nolan, in press). Unquestioned assumptions came to the foreground more in this study than was originally anticipated and, in the words of Skovsmose (2005), the data revealed a noticeable tendency to �‘explain away�’ some of these assumptions. The assumptions functioned as obstacles to change in much the same way as Begg, Davis & Bramald (2003) describe how it is necessary for teachers to �‘overcome the momentum of habit�’. These authors discuss how certain teacher habits are �“tied to our long history with traditional schooling practices and are supported by such things as curricula, evaluation regimes, and student expectations [and that] changes in practice involve more than conscious decisions to do things differently�” (p. 622). But what about conscious decisions to not do things differently? Such decisions that resist and obstruct a change process can be �‘explained away�’ in a number of ways that remove any chance for personal and professional agency in the formation of a teacher�’s pedagogical identity. In analyzing how pre-service teachers encounter a myriad of socially-sanctioned filters, Brown (2003) indicates that a set-of-rules approach to teacher education is generating resistance to the desire to work toward a professional identity of one�’s own (p. 155). The data in this study points to such a resistance, with a focus on the tendency to deny agency and to �‘explain away�’ the obstacles to change.
METHODS AND DATA SOURCES Acting in the capacity as both the researcher in this study and the instructor for the university curriculum course, I wanted to make a deliberate effort to follow the
Nolan
4 - 244 PME30 �— 2006
course discussions, assignments, and learnings into secondary mathematics classrooms. My main criterion for selection of the case study pre-service teachers was that they expressed a willingness to make an effort to incorporate alternative instruction and assessment practices into their internship classroom. Once the three pre-service teachers were selected, I met with each of them (and their cooperating teachers) to discuss the instruction and assessment strategies they preferred to try in their classroom and to create a tentative plan for the internship semester. Since the primary objective of the study was to understand what happens when pre-service teachers attempt to incorporate alternative instruction and assessment practices into their classroom, the methods chosen to gather information needed to be such that the pre-service teachers�’ beliefs, concerns, and practices could be brought to light. The methods included individual interviews with the three pre-service teachers (monthly), focus group discussions with the pre-service teachers and their cooperating teachers (monthly), and maintaining an ongoing reflective artefact in the form of a written journal or a weblog. Data was collected by audio-taping and then transcribing the interviews and discussions and also by keeping a researcher�’s journal, in which I made notes of the issues discussed, any challenges or questions encountered by the interns, and general thoughts and feelings regarding the research conversations. In addition to these formal methods for data collection, my commitment to an on-going mentorship approach meant making an effort to maintain regular contact with the interns throughout the semester through individual conversations (in person, via telephone, webcam, and e-mail).
RESULTS AND DISCUSSION As previously mentioned, the alternative instruction and assessment strategies introduced in the university course represented a paradigm shift in mathematics teaching and learning for pre-service teachers. Since their experiences and perceptions of what it means to know, to teach, and to learn mathematics did not prepare them to integrate such new and different ideas into practice, I was not entirely surprised (or even initially discouraged) by the reluctance of my participants to dive headfirst into the study and try several forms of alternative instruction and assessment strategies in their internship classroom. What did surprise and discourage me, however, was the extent to which the interns and their co-operating teachers spent time �‘explaining away�’ the obstacles to change in ways that had me �‘backing away�’ from my original intentions in the study. The data gathered through interviews and focus groups in this study indicate that at the centre of mathematics teacher education lie many obstacles to change. These centre-stage obstacles include such concerns as the drive to cover content, to master a set of management techniques, to bring student skills up to an established grade level norm, to passively mimic (rather than actively engage in) problem solving, and a host of other issues that became the fodder for �‘explaining away�’ possibilities for change. For the purposes of this paper, I will briefly discuss three change obstacles that emerged during the research process and ended up dominating the
Nolan
PME30 �— 2006 4 - 245
discourse. These three obstacles were brought to light through conversations with the interns and co-operating teachers in which they chose to �‘explain away�’ a change process in instruction and assessment. Tied closely to each �‘explaining away�’ experience was another obstacle�—one that emerged and became part of my own researcher identity in deciding to �‘back away�’ from the planned research process.
“Just like my mom” One intern explained away her ability to implement alternative instruction and assessment by comparing her cooperating teacher�’s expectations to those of her mother. She stated: �“It�’s just like when I was growing up�— with my mom there was always a particular way to fold the towels. According to my mom, this was not only a best way to fold towels, but a correct way. It�’s like that with [my coop] in teaching math�— she�’s been teaching for a long time and she knows the best way to do it. I just don�’t think I can go against that right now.�” This intern felt that the effort involved in attempting to convince her cooperating teacher that group problem solving was a valuable instructional strategy, and a way to supplement the traditional individual class work on mathematics problems, was just not worth it. This, of course, was tied closely to the intern�’s already skeptical view about whether she actually believed herself that the change in instructional approach was worthwhile. My response as a researcher and mentor was to back away from applying pressure. I thought to myself that it would be best to allow her to go with the flow of the established classroom dynamics for the sake of her internship experience, rather than try to force my research plan.
“It’s my duty” During a conversation with one cooperating teacher, she made it abundantly clear that the Department of Education has charged her with the responsibility of teaching all the content in the curriculum guide and she feels it is her duty (to government, to students, to parents, etc.) to cover everything. �“I do not have the right to choose and make decisions about what content to cover and what not to cover. It�’s all there and I need to be sure to not miss anything. What if I skip a topic that would have been of interest to even one or two of my students?�” This was the cooperating teacher�’s effort to explain away the possibility of teaching in a constructivist manner through a math trail or investigation because it would take too much time. As a researcher and colleague, my response was to remain silent. In doing so, however, I believe I reinforced her views as I backed away from my desire to draw her attention to the differences between covering curriculum content and learning curriculum content.
“I tried teaching that way” During the first meeting with interns and their co-operating teacher I found myself treading water, walking on thin ice, and a number of other clichés to describe how I introduced the research project. I was confident that implementing alternative instruction and assessment strategies would create opportunities for the currently
Nolan
4 - 246 PME30 �— 2006
unsuccessful mathematics student to experience and demonstrate mathematics knowledge in diversely legitimate ways. When speaking with cooperating teachers and interns, however, I became quite cautious in how I advocated for changes in mathematics teaching and learning. I felt that, ultimately, a desire to change practice reflects dissatisfaction with current practice. How was I to express this dissatisfaction with the very source of the current practice without alienating myself and the research project from the practicing teachers and interns? As part of the conversation, one cooperating teacher responded to my call for more student-centred problem solving by saying, �“I tried teaching in more constructivist ways where the students try to solve the problem on their own, but the students said they preferred it if I just did an example first and then they could follow it to do more.�” I felt strongly that this teacher was explaining away the obstacle of student resistance to alternative (that is, new) ways to learn mathematics by, in fact, confessing that students do not actually learn better that way and that they prefer the way things are done now. I wanted to talk to her about how students have learned to play the rules of the game over many years and so it is expected that they would resist changing the rules and/or the game without understanding why, but I remained silent. In remaining silent, I took another step backward from my research agenda.
CONCLUDING THOUGHTS Given the intense motivation and perseverance required to resist the strong current of tradition once inside the classroom walls, my research study sought to design a means to assist pre-service teachers as they negotiated their way through theory/practice transitions on their journey to shaping a pedagogical identity of their own. I desired to conduct a study that could bring about significant changes to the cultural and discursive practices of schooling that currently stifle innovative instruction and assessment in mathematics and work to maintain the power of dominant school traditions and images of mathematics knowledge. The obstacles encountered were not so much surprises in themselves but the ways in which they were explained away left me speechless and, in some cases, paralyzed with/in the research process. Begg et al. (2003) discuss that obstacles can work in invisible ways to �“channel our activities in particular ways�—the patterns of acting, the habits of interpretation, the momentum of history, and so on that give shape and meaning to everyday activities�” (p. 596). If truly invisible, then it is reasonable to �‘explain away�’ resistance to change as hegemony at work�— masking the obstacles �“as the natural shoreline�” (p. 596). The data in this study, however, suggests that explaining away functions to take the spotlight off teacher agency in the development of a mathematical pedagogical identity, and instead places the spotlight on a pre-determined �‘destiny-focused�’ math teacher identity. In other words, if we continue to explain away and back away from perceived obstacles to change then maybe all we really have left to study is how a math teacher becomes us. And this seems, in fact, not very becoming at all.
Nolan
PME30 �— 2006 4 - 247
References Bauersfeld, H. (1988). Interaction, construction, and knowledge�—Alternative perspectives
for mathematics education. In D. A. Grouws & T. J. Cooney (Eds.), Perspectives on research on effective mathematics teaching: Research agenda for mathematics education (Vol.1, pp.27-46). Reston, VA: NCTM and Lawrence Erlbaum Associates.
Begg, A., Davis, B. & Bramald, R. (2003). Obstacles to the dissemination of mathematics education research. In Bishop, et al. (Eds.), Second International Handbook of Mathematics Education Research: Part Two (pp. 593-634). Dordrecht, The Netherlands: Kluwer Academic Publishers.
Bishop, A., Seah, W.T. & Chin, C. (2003). Values in mathematics teaching�—the hidden persuaders? In Bishop, et al. (Eds.), Second International Handbook of Mathematics Education Research: Part Two (pp. 593-634). Dordrecht, The Netherlands: Kluwer Academic Publishers.
Bohl, J.V. & Van Zoest, L.R. (2003). The value of Wenger�’s concepts of modes of participation and regimes of accountability in understanding teacher learning. In B.J. Dougherty & J. Zilliox (Eds.), Proceedings of the 2003 Annual Meeting of the International Group for the Psychology of Mathematics Education (PME) (pp. 4-339-4-346), Honolulu, Hawaii, USA.
Brown, T. (2003). Mathematical identity in initial teacher training. In B.J. Dougherty & J. Zilliox (Eds.), Proceedings of the 2003 Annual Meeting of the International Group for the Psychology of Mathematics Education (PME) (pp. 2-151- 2-156) , Honolulu, Hawaii, USA.
Eames, C. & Bell, B. (2005). Using socicultural views of learning to investigate the enculturation of students into the scientific community through work placements. Canadian Journal of Science, Mathematics and Technology Education, 5(1), 153-169.
Goos, M. (2005). A sociocultural analysis of the development of pre-service and beginning teachers�’ pedagogical identities as users of technology. Journal of Mathematics Teacher Education, 8, 35-59.
Jaworski, B. & Gellert, U. (2003). Educating new mathematics teachers: Integrating theory and practice, and the roles of practicing teachers. In A. Bishop, M.A. Clements, C. Keitel, J. Kilpatrick, & F. K. S. Leung (Eds.), Second International Handbook of Mathematics Education (Part Two) (pp. 829-875). Dordrecht, The Netherlands: Kluwer Academic Publishers.
Kaartinen, S. (2003). Learning to participate�—participating to learn in science and mathematics classrooms. Unpublished doctoral dissertation, University of Oulu, Oulu, Finland.
Lerman, S. (2005). Learning as developing identity in the mathematics classroom. Plenary lecture at the 27th Annual Meeting of the Canadian Mathematics Education Study Group (CMESG), Ottawa, ON, 27-31 May, 2005.
Lerman, S. (1994). Changing focus in the mathematics classroom. In S. Lerman (Ed.), Cultural perspectives on the mathematics classroom (191-213). Dordrecht, The Netherlands: Kluwer Academic Publishers.
Nolan
4 - 248 PME30 �— 2006
Nichol, C. & Crespo, S. (2003). Learning in and from practice: Pre-service teachers investigate their mathematics teaching. In B.J. Dougherty & J. Zilliox (Eds.), Proceedings of the 2003 Annual Meeting of the International Group for the Psychology of Mathematics Education (PME) (pp. 3-373-3-380), Honolulu, Hawaii, USA.
Nolan, K. (forthcoming). A socio-cultural approach to understanding pre-service mathematics teachers’ negotiated journeys through theory/practice transitions. Paper presentation at the Annual Meeting of the American Educational Research Association (AERA), San Francisco, CA, 7-11 April 2006.
Nolan, K. (2004). Deconstructing ‘alternative’ assessment: Moving beyond/within a discursive ‘other’ to link curriculum, instruction and assessment in mathematics. Poster presentation at the North American Chapter of the International Group for the Psychology of Mathematics Education (PME-NA) Annual Conference, Toronto, Ontario, 21-24 October.
Nolan, K. & Corbin Dwyer, S. (in press). The role of portfolios in healing the split between instruction and assessment in mathematics. Policy & Practice in Education.
Radford, L. (1997). On psychology, historical epistemology, and the teaching of mathematics: Towards a sociocultural history of mathematics. For the Learning of Mathematics, 17(1), 26-33.
Simmt, E. & Nolan, K (in press). Socio-cultural dimensions of mathematics learning: A working group. Proceedings of the 27th Annual Meeting of the Canadian Mathematics Education Study Group (CMESG), Ottawa, ON, 27-31 May, 2005.
Skovsmose, O. (2005). Foregrounds and politics of learning obstacles. For the Learning of Mathematics, 25(1), 4-10.
Skovsmose, O. & Borba, M. (2004). Research methodology and critical mathematics education. In P. Valero & R. Zevenbergen (Eds.), Researching the socio-political dimensions of mathematics education: Issues of power in theory and methodology (207-226). Boston, MA: Kluwer Academic Publishers.
Vithal, R. (2000). Re-searching mathematics education from a critical perspective. Paper presented at the Biennial International Conference on Mathematics Education and Society, Montechoro, Portugal, 26-31 March, 2000.
Walshaw, M. (2005). Pre-service mathematics teaching in the context of schools: An exploration into the constitution of identity. Journal of Mathematics Teacher Education, 7, 63-86.
2006. In Novotná, J., Moraová, H., Krátká, M. & Stehlíková, N. (Eds.). Proceedings 30th Conference of the International Group for the Psychology of Mathematics Education, Vol. 4, pp. 249-256. Prague: PME. 4 - 249
STRUCTURE SENSE FOR UNIVERSITY ALGEBRA Jarmila Novotná*), Na a Stehlíková*), Maureen Hoch**)
*) Charles University in Prague, Faculty of Education, **) Tel Aviv University, Israel
Building on some research on structure sense in school algebra, this contribution focuses on structure sense in university algebra, namely on students’ understanding of algebraic operations and their properties. Two basic stages of this understanding are distinguished and described in detail. Some examples are given on student teachers’ insufficient structure sense and interpreted in terms of various stages of structure sense.
INTRODUCTION Many researchers report that the transition from secondary schools to university is often a painful process for students. When learning a new idea, the old idea does not disappear. Thus in the transition to advanced mathematical thinking, there exist simultaneously in a person's mind concept images formed earlier and new ideas based on definitions and deductions. The abstract algebra course usually presents the first �“obstacle�” university students, future mathematics teachers, meet. Many researches have focused on students�’ coming to understand abstract algebra concepts such as groups (Asiala et al., 1997, Dubinsky et al, 1994, Hazzan, 1999, Zazkis et al., 1996). Simpson & Stehlikova (in press) suggest that the transition from working with an example structure to working abstractly involves an intricate sequence of shifts of attention:
1. Seeing the elements in the set as objects upon which the operations act. 2. Attending to the interrelationships between elements in the set which are consequences of the operations. 3. Seeing the signs used by the teacher in defining the abstract structure as abstractions of the objects and operations, and seeing the names of the relationships amongst signs as the names for the relationships amongst the objects and operations. 4. Seeing other sets and operations as examples of the general structure and as prototypical of the general structure. 5. Using the formal system of symbols and definitional properties to derive consequences and seeing that the properties inherent in the theorems are properties of all examples.
Obviously, students must first understand how each operation works and what the objects in the set are; this is not necessarily straightforward. In this paper we will focus on the first two stages only.
STRUCTURE SENSE Structure sense has been defined and examined in several papers describing students�’ difficulties when applying knowledge in an algebraic context. In Linchevski & Livneh (1999) structure sense is defined and used for describing students�’ difficulties when using arithmetic knowledge in the early algebra. In Hoch (2003) and Hoch &
Novotná, Stehlíková & Hoch
4 - 250 PME30 �— 2006
Dreyfus (2006) structure sense is used to analyse students�’ use of previously learned algebraic techniques. The authors (Hoch & Dreyfus, 2006) define structure sense for high school algebra as follows:
A student is said to display structure sense (SS) if s/he can: Recognise a familiar structure in its simplest form. Deal with a compound term as a single entity and through an appropriate
substitution recognise a familiar structure in a more complex form. Choose appropriate manipulations to make best use of the structure.
The above definition inspired us to attempt to define structure sense for one aspect of abstract algebra, namely binary operations and their properties.
METHODOLOGY This study is based on the first two authors�’ longitudinal observation of students, future mathematics teachers, during the course Theoretical Arithmetic and Algebra. Students enter the course with rich experience with building number sets and with linear and polynomial algebra (Novotna, 2000). Still, they often have problems with basic algebraic concepts. During the last three years, we systematically collected students�’ works, especially those which contained mistakes. There were about 40 students in each year. First, we only chose work with mistakes which we attributed to students�’ insufficient understanding of binary operations and their properties and the notion of identity and inverse. Initially, taking mistakes as developmental stages of students�’ understanding, we tried to organise them in a way to fit the scheme for the development of understanding the binary operation presented in (Dubinsky et al., 1994). Then we classified them according to our perception of how abstract students�’ understanding of an operation/an object was. For instance, whether he/she based his/her considerations on his/her concept image of the object (Tall & Vinner, 1981) or on the definition introduced in the course. Finally, we were inspired by Simpson & Stehlikova�’s scheme presented above which we combined with Hoch & Dreyfus�’s structure sense definition. As the mathematics we are dealing with is more complex than the mathematics Hoch & Dreyfus investigated, the model we propose below is more complicated and multi-levelled.
STRUCTURE SENSE FOR UNIVERSITY ALGEBRA We distinguish two main stages of the developing structure sense each of which is further subdivided. SSE: Structure sense as applied to elements of sets and the notion of binary operation A student is said to display structure sense if he/she can: (SSE-1) Recognise a binary operation in familiar structures.
Novotná, Stehlíková & Hoch
PME30 �— 2006 4 - 251
(SSE-2) See elements of the set as objects to be manipulated / understand the closure property. (SSE-3) Recognise a binary operation in �“non-familiar�” structures. (SSE-4) See similarities and differences of the forms of defining the operations (formula, table, other). SSP: Structure sense as applied to properties of binary operations A student is said to display structure sense if he/she can: (SSP-1) Understand ID in terms of its definition (abstractly). (SSP-2) See the relationship between ID and IN: ID IN. (SSP-3) Use one property for another: C ID, C IN, C A. (SSP-4) Keep the quality and order of quantifiers. (SSP-5) Apply the knowledge of ID and IN spontaneously. Abbreviations ID, IN, C, A stand for identity, inverse, commutative property, associative property. For the sake of clarity, we will explain individual aspects of structure sense on particular examples.
SSE: Elements of sets and the notion of binary operation The first stage concerns the notion of binary operation (and its recognition in a certain set) and understanding elements of sets as objects to be used in the operation. A student is said to display structure sense for elements of sets and binary operations (SSE) for algebraic structures with one binary operation if he/she can: (SSE-1) Recognise a binary operation in familiar structures By recognise, we mean that a student is able to determine whether something is a binary operation. By familiar structures, we mean structures which a student meets prior to university such as number sets with numerical operations and set functions R R with the composition of functions (see also below). Non-familiar structures will be loosely characterised as those which are not familiar to a student. Example: A student displays SSE-1 if he/she can determine whether the following are binary operations (N is the set of natural numbers, Z is the set of integers, R is the set of real numbers):
,N : yxyx ,N : yxyx ,Z : yxyx ,Z : yxyx
,Z : yxyx ,R : yxyx ,R : kyxRkyx :
(SSE-2) See elements of the set as objects to be manipulated / understands the closure property Example: A student lacks SSE-2 when given a set of congruences and asked to find the identity and he/she starts working with numbers. Later he/she answers that
Novotná, Stehlíková & Hoch
4 - 252 PME30 �— 2006
identity is 1 without taking into consideration the nature of objects in the set he/she is dealing with. (SSE-3) Recognise a binary operation in �“non-familiar�” structures Example 1: A student displays SSE-3 if he/she can determine whether the following are binary operations:
,Z : 4yxyx ,R : 2yxyx ,Z : yxyx 65
,Z : xyxyx 3 ,R : yxyx
Example 2: A student lacks SSE-3, if he/she says that the operation in the following structure is associative because + and are associative: (R, ), where R is the set of real numbers and x y = 3x + xy (the operation is not associative). As the operation is composed of + and , he/she puts together its properties to get the properties of . (SSE-4) See similarities and differences of the forms of defining the operations Example 1: A student displays SSE-4 if he/she can see that the two definitions of operation * in (Z4, ) are the same (Zp is the set of integers 0, �…, p - 1):
Definition 1: x, y Z4, x y is the remainder when dividing the sum x + y by 4. Definition 2:
0 1 2 3
0 0 1 2 3
1 1 2 3 0
2 2 3 0 1
3 3 0 1 2
Example 2: A student displays SSE-4 if he/she can see that the operations * in (Z4, ) with Definition 2 of and the operation in (M, ), where M = {e, a, b, c} and is defined by the table, are the same (isomorphic).
e a b c
e e a b c
a a b c e
b b c e a
c c e a b
Example 3: A student displays SSE-4 if he/she can see that the operations in the following structures are not isomorphic: (M, ) where M = {e, a, b, c} and is defined as above, and (K, ) where K = {X, Y, XY, N} and is defined as follows:
Novotná, Stehlíková & Hoch
PME30 �— 2006 4 - 253
N X Y XY
N N X Y XY X X N XY Y Y Y XY N X
XY XY Y X N
Note on examples 2 and 3: A student understanding examples 2 and 3 displays a higher degree of SSE-4 than is the case with the first example as he/she has to see letters and combinations of letters (not only numbers) as objects to be manipulated (SSE-2). SSP: Properties of binary operations The second stage of SS involves attending to the interrelationships between objects which are the consequences of the operations. We, as teachers, �“would like our students to attend not to the particular objects and operation, but to the fact that imposing the operation on the set of objects creates interrelationships which are important, such as associativity, inverses etc.�” (Simpson & Stehlikova, in press). The second stage can be analysed only for students who have at least partial understanding of SSE. The situation is more complicated here as we have objects of two types: properties (commutative, associative, distributive in case of 2 operations) and important objects (identities, inverses). Moreover, we can distinguish two standpoints. The first focuses on individual properties and objects, the second concerns understanding the role of quantifiers in the definition (their type and order). For the subdivision of SSP, we looked into mutual relationships among objects. A student is said to display structure sense for properties of binary operations (SSP) for algebraic structures with one binary operation if he/she can: (SSP-1) Understand ID in terms of its definition (abstractly) Example 1: A student lacks (SSP-1) if he/she answers that there is no identity in (Z99,+), where Z99={1,2,...99} and + is addition in congruence modulo 99, because there is no 0 in the set.
Example 2: Consider the following structure: (Z, ), where Z is the set of integers, x y = x + y �– 4 (correct answer for ID: n = 4). A student lacks SSP-1, if he/she answers (1) n does not exist because for n = 0 it holds x n = x + 0 �– 4 x; or (2) n = 4 because x + n �– 4 = x + 4 �– 4 = x; but later when he/she calculates the inverse element, he/she gives the answer x-1 = 4 �– x because x (4 �– x) = x + (4 �– x) �– 4 = 0. (See also the comment below.) (SSP-2) See the relationship between ID and IN (the latter does not exist without the former): ID IN
Novotná, Stehlíková & Hoch
4 - 254 PME30 �— 2006
Example: A student lacks SSP-2 if he/she makes the following mistake: Given (F, +), where F is the set of odd numbers and + is the addition of integers. The student says that the inverse to 3 is �–3 as both are odd (however, identity 0 Z is not element of F). Comment: This mistake can also be interpreted in terms of the student�’s concept image of inverse. Number �–3 could have simply been chosen because his/her concept image of inverse is a negative number. It is widely accepted that students tend to rely on their images from number theory when studying and applying group theory (e.g., Hazzan, 1999, Stehlikova, 2004). They often hold a deeply rooted image of the additive identity in numerical contexts necessarily being 0 and the additive inverse a negative number. (SSP-3) Use one property for another: C ID, C IN, C A Example 1: A student lacks SSP-3 if he/she makes the following mistake: (P(M), �–), where P(M) is the set of all subsets of the set M, �– is the difference of sets X �– Y = ={x M; x X x Y} and the student says n = because X �– = X (correct answer: n does not exist). Example 2: A student lacks SSP-3 if he/she makes the following mistake: (R+, ), where R+ is the set of positive real numbers and x y = xy and the student says that it is n = 1 because x1 = x (correct answer: except for x = 1, the inverse does not exist). Example 3: A student displays SSP-3, if he/she understands that he/she does not have to investigate all possibilities for A if the operation is C and is given by a table (e.g. at (M, ) above). (SSP-4) Keep the quality and order of quantifiers
Example: A student lacks SSP-4 if he/she makes the following mistake: Given (L, ), where L is the set of all positive rational numbers, x y = x/2 + y/2 + xy (it does not have an identity) and the student answers
xxn21
with the following justification:
We will get n by solving the equation xxnnx22
. Then n L as the denominator
does not equal 0 for x L and the quotient of two positive rational numbers is a positive rational number. As the operation is commutative, it is sufficient to check one equality from the definition: x
xxx
xxxnx
21.
21.
21
2.
The student does not understand quantifiers. Instead of �“there exists n such that for all x ...�”, he/she uses �“for all x there exists n such that ...�”. On the other hand, the student has SSP-3 (he/she uses C for IN). (SSP-5) Apply the knowledge of ID and IN spontaneously By that we mean that in a certain context, without being specifically asked to, a student is able to use the knowledge of ID and IN to find the solution to a problem. Example 1: A student displays SSP-5 if he/she applies the knowledge of ID and IN in (Zp,+, ) when dividing two polynomials with coefficients from Zp. For example, in
Novotná, Stehlíková & Hoch
PME30 �— 2006 4 - 255
(Z5,+, .), where �–0 = 0, �–1 = 4, �–2 = 3, �–3 = 2 , �–4 = 1; 1-1 = 1, 2-1 = 3, 3-1 = 2, 4-1 = 4, when dividing (3x5 + 4x4 + 2x3 + x2 + 4x + 3):(2x3 + 3x2 + 4x + 1), he/she is able to calculate 3 : 2 = 3 . 2-1 = 3 . 3 = 4. On the other hand, he/she lacks SSP-5 if the answer for 3 : 2 is 3/2. Example 2: A student displays SSP-5 if he/she is solving an equation x + 50 = 5 in structure (Z99,+) (see above) and he/she says: �“I will subtract 50 from both sides of the equation which means that I will add the additive inverse of 50, that is 49, to both sides.�” (Stehlikova, 2004)
DISCUSSION AND CONCLUSIONS The vague terms �“familiar and non-familiar structures�” can be specified to a certain extent by saying that they must be �“conceptual entities in the student�’s eyes; that is to say, the student has procedures that can take these objects as inputs�” (Harel & Tall, 1989). What will be �“familiar�” depends on individual students and the way abstract algebra was introduced to him/her. We can distinguish at least three paths (V means a property or an object, A in index means a familiar structure, B in index means a non-familiar structure, D stands for a formal definition):
VA VA D abstraction analogy construction
D VB VA, VB construction abstraction
VB D
The first two paths represent the abstraction of specific properties of one or more mathematical objects to form the basis of the definition of the new abstract mathematical object, the third is the process of construction of the abstract concept through logical deduction from definition (Harel & Tall, 1989). There is another way of interpreting some problems students have with understanding binary operations, their properties and objects (identity, inverse). Stehlikova (2004) in her research on structuring mathematical knowledge in advanced mathematics described a student coming to know a particular arithmetic structure as a process of development from dependence of the new structure on ordinary arithmetic to gradual independence.
In general, there were either students who started reasoning inside [the new structure] quite early during their work spontaneously and these were able to find the additive identity easily and on the other hand, there were students who relied more on their [ordinary arithmetic] knowledge and their attention had to be specifically drawn to number 99 in order for them to notice its properties. These students mostly said that there was no additive identity because there was no 0. (p. 140)
The image of 0 as the additive identity does not always have to function as an obstacle. For some students, it serves as a generic model of additive identity and they
Novotná, Stehlíková & Hoch
4 - 256 PME30 �— 2006
can reconstruct its properties in ordinary arithmetic and use them as a tool for finding out the identity in another structure (Stehlikova, 2004). The presented model only accounts for binary operations and their properties. A model for the student�’s understanding of, say, groups would have to be far more complex (see e.g. Dubinsky et al., 1994). If we attribute students�’ difficulties to their lack of structure sense, we can concentrate on developing their structure sense. The above model can serve as a basis for a teaching programme explicitly addressing the problematic issues. Acknowledgement: The contribution was supported by grant GAUK 500/2004/A-PP/PedF.
References Asiala, M., Dubinsky, E., Mathews, D. M., Morics, S. & Oktac, A. (1997). Development of
students�’ understanding of cosets, normality, and quotient groups. Journal of Mathematical Behavior, 16(3), 241�–309.
Dubinsky, E., Dautermann, J., Leron, U. & Zazkis, R. (1994). On Learning Fundamental Concepts of Group Theory. Educational Studies in Mathematics, 27, 267�–305.
Harel, G. & Tall, D. (1989). The General, the Abstract, and the Generic in Advanced Mathematics. For the Learning of Mathematics, 11(1), 38�–42
Hazzan, O. (1999). Reducing abstraction level when learning abstract algebra concepts. Educational Studies in Mathematics, 40(1), 71�–90.
Hoch, M. (2003). Structure sense. In M. A. Mariotti (Ed.), Proc. 3rd Conf. for European Research in Mathematics Education (compact disk). Bellaria, Italy: ERME.
Hoch, M. & Dreyfus, T. (2006). Structure sense versus manipulation skills: an unexpected result. Submitted to 30th Conf. of the Int. Group for the Psychology of Mathematics Education. Prague: PME.
Linchevski, L. & Livneh, D. (1999). Structure sense: the relationship between algebraic and numerical contexts. Educational Studies in Mathematics, 40(2), 173�–196.
Novotna, J. (2000). Teacher in the role of a student �– a component of teacher training. In J. Kohnova (Ed.), Proceedings of the International Conference Teachers and Their University Education at the Turn of the Millennium (pp. 28�–32). Praha: UK PedF.
Simpson, A. & Stehlikova, N. (In press.) Apprehending mathematical structure: a case study of coming to understand a commutative ring. Educational Studies in Mathematics.
Stehlikova, N. (2004). Structural understanding in advanced mathematical thinking. Praha: PedF UK.
Tall, D. & Vinner (1981). Concept image and concept definition m mathematics with particular reference to limits and continuity. Educational Studies in Mathematics, 12, 151�–169.
Zazkis, R., Dubinsky, E. & Dautermann, J. (1996). Coordinating visual and analytic strategies: A study of students�’ understanding of the group D4. Journal for Research in Mathematics Education , 27(4), 435�–457.
2006. In Novotná, J., Moraová, H., Krátká, M. & Stehlíková, N. (Eds.). Proceedings 30th Conference of the International Group for the Psychology of Mathematics Education, Vol. 4, pp. 257-264. Prague: PME. 4- 257
SEMIOTIC CHAINING IN AN EXPRESSION CONSTRUCTING ACTIVITY AIMED AT THE TRANSITION FROM ARITHMETIC
TO ALGEBRA Masakazu Okazaki
Joetsu University of Education, Japan
In the transition from arithmetic to algebra, it is important to create a learning environment which develops the way in which students view mathematical expressions. This paper reports how students may develop their views through an expression constructing activity. As the result of our analysis in terms of nested semiotic chaining, we identified four states of sign combinations and chaining that show how students progress in their view of mathematical expressions, and discussed the important role of the use of brackets in viewing an expression structurally.
PROBLEM OF THE TRANSITION FROM ARITHMETIC TO ALGEBRA A number of studies have revealed that students’ errors in school algebra may result from differences in viewing mathematical expressions between arithmetic and algebra (Sfard, 1991). For example, students have difficulty interpreting e.g. x + 7 as the result of a calculation, while they may recognize it as the operation of “7 added to x” (This problem is known as the gap between operational and structural conceptions). A focus of this study is to develop a learning environment that may help students to change their operational conceptions into the structural ones. Research into school algebra has tended to focus on the teaching and learning of symbolic expressions (Kieran, 1992). However, it has recently been reported that we can promote students’ algebraic ideas even in arithmetic (Carpenter et al., 2003). It may, therefore, be productive to examine how the learning of numerical expressions can be connected to symbolic expressions (Miwa, 1996) and also to examine the jump that students experience when the object of their thinking moves from numbers (quantities) to the relationships between numbers (quantities) (Koyama, 1988). In this paper, we shall investigate students’ learning of mathematical expressions in a teaching experiment designed for the unit “Four operations with positive and negative numbers”, which is taught in Japan just before the unit “Algebraic expressions using letters”. We shall examine how such learning may facilitate the students’ transition from arithmetic to algebra, beyond just acquiring the calculation procedures.
THEORETICAL FRAMEWORK Epistemological characteristics of constructing mathematical expressions We believe that constructing composite expressions might provide good opportunities to develop the way in which students look at such expressions, since an algebraic expression usually consists of one composite expression and not a number of binary
Okazaki
4 - 258 PME30 — 2006
expressions, and a linear equation needs to be formulated in terms of the equivalence between composite expressions. It is important to note that constructing composite expressions is consistent with the mathematical nature of the expression. A mathematical expression is defined as a finite sequence of symbols such that (a) the object symbols (1, 2, … , a, x, …), (b) the operation symbols (+, –, ×, ÷, …) and (c) the brackets are arranged in accordance with the following rules (Hirabayashi, 1996): (Rule 1) The object symbol is an expression in itself, (Rule 2) If both A and B are expressions, then (A) + (B), (A) – (B), (A) × (B) and (A) ÷ (B) are also expressions, and (Rule 3) All that are constructed using (Rule 1) and (Rule 2) are single expressions. According to these rules, expressions like ((((1) + (2)) × (3)) – (5)) are constructed one after another. Of course, we can omit some brackets by applying supplementary rules such as the precedence of multiplication and division, and then get the normal representation (1 + 2) × 3 – 5. We may also notice that in rule 2 the language is spoken in terms of metalanguage (Allwood et al., 1977; Jakobson, 1973; Hirabayashi, 1987). Our focus is that, in constructing the longer expression, each expression is conceived of as a unity, since the operation is carried out between two expressions rather than two numbers. Using Douady’s (1997) terms, the expressions may then be regarded not as “tools”, but as “objects”.
Semiotic chaining as the framework for analysis Presmeg (2001) proposed a model of nested semiotic chaining based on Lacan’s inversion of Saussure’s dyadic model (signifier and signified) and Peirce’s triadic model (object, representamen, and interpretant) (Fig. 1). The model emphasizes the productive role of the signifier (R) (= the representamen), the chaining by which a signifier in a previous sign combination becomes the signified (O) (= the object) in a new sign combination, and that “each new signifier in the chain stands for everything that precedes it in the chain” (p.7). We think that this gives a useful perspective for analysing the activity of constructing mathematical expressions. Namely, we expect that it may make it possible to describe the states of the sign combinations associated with the transition from the operational to the structural view of an expression.
TEACHING EXPERIMENT Participants The teaching experiment was performed with 28 seventh graders in a classroom of a public junior high school in Japan, with the collaboration of a teacher who had fifteen years experience and was interested in developing his lessons. Most students are not so willing to talk in a whole class situation but will talk with each other in small groups.
Figure 1. Presmeg’s model of nested semiotic chaining.
O2
O1 I1
R1
R2 I2
Okazaki
PME30 — 2006 4 - 259
Therefore, we needed to design lessons that would encourage them to participate in the class activities and so we chose a game as the basic format for our teaching experiment. Task We devised “The Expression Constructing Game” which is played by two groups. Each group is issued in advance with cards displaying various expressions. Suppose that group A has two cards (+3) × ( ) and ( ) ÷ ( ), and that group B has (-1) × (-2) and (-1)3. The teacher announces the initial expression (“-12 = (+4) × (-3)”), and the students must then make a longer expression by replacing either of the numbers in the expression with an appropriate card. Any suitable number may be inserted in the empty brackets. The first group that manages to incorporate all of its cards into the expression is the winner. A sample record of a game is shown in Figure 2. If group A had replaced +4 with (+8) ÷ (+2), then group B could have used their (-1) × (-2); however, group A blocked it. This is a feature of the game.
Figure 2: A record of the expression constructing game.
Even when a card is incorporated, it can happen that the value of the whole expression may be incorrect if brackets have not been used. If the value is different from the original one, then points are not given. Thus, as well as checking the correspondence between the replacement expression and the number it replaces, the students must also check the correspondence between the whole expression and the original number. In other words, in this game both the construction and the calculation of the expression are being carried out at the same time.
Teaching Experiment Our teaching experiment was conducted according to the methodologies of Confrey and Lachance and Cobb (described in Kelly and Lesh, 2000). Our conjecture was that in the act of constructing successive expressions students would upgrade their view of expressions from an operational to a structural one. We were interested in when and how this development might occur and what factors might sustain it. The experiment continued for 12 hours during which the unit “Four operations with positive and negative numbers” was covered. During the first six hours, the students learned each of multiplication, division and involution with negative numbers (Addition and subtraction had already been taught before the unit). The data in this paper were obtained from the 7th to 11th lessons, in which the expression constructing games were conducted. The lessons were recorded on video camera, field notes were made, and transcripts were also made of the video data. Two types of data analysis were conducted. First was the ongoing analysis after each lesson. Here we analysed what happened in the classroom in terms of the students’
activities and utterances. Then we modified the subsequent lesson plan by taking into account both the original plan and our analysis of each lesson. Second was the retrospective analysis that occurred after all the classroom activities had finished. We first divided the classroom episodes into the meaningful entities chronologically in terms of what situations appeared to have made the students’ conceptions change, and next analysed how they interpreted the situations based on the sign combinations. Finally, we made sense of the overall story of their learning by reviewing all the analyses in terms of semiotic chaining.
THE ACTIVITY OF THE EXPRESSION CONSTRUCTING GAME
Introducing the expression constructing game After a brief explanation of the rules, four students were chosen to represent the two groups (A: Yoshi and Asa; B: Seki and Hoshi) and played a demonstration game on the blackboard. On this occasion the number of cards was limited to four and the cards were expressions of multiplication, division and involution (Fig. 3).
Figure 3. The first situation for introducing the game.
T (teacher): Let’s decide which team goes first. The team that answers ahead is first. [He wrote “-16 = (-2) × (� )” on the board.]
Yoshi: +8 T: The game will start with team A. Please replace any one of your cards. Yoshi: No. 1. [She wrote “= (-2) × (-4) × (-2).”] (Underlining added by author.) S (a student): I agree. T: Well, now team B, please. Thirty minutes. Hoshi: [He wrote “= (-1) × (+2) × (-4) × (-2).”] Yoshi: [She wrote “= (-1) × (-2) × (-1) × (-4) × (-2).”] Seki: [He wrote “= (-1)3 × (-2) × (-1) × (-4) × (-2).”] S: It’s wonderful!
The game ended in a draw as both teams completed the expressions successfully. After this, the teacher and the students together worked out the final expression to see whether it went back to the original number (-16). When the answer turned out to be -16, the students unanimously said “great”, “wonderful” and clapped their hands. We found that they were surprised that they could make such a long expression and yet the result of the calculation coincided with the original number.
Then the teacher asked them what part of the fifth expression corresponded to -2 in the original expression, and the students confirmed that it was part of (-1)3 × (-2) × (-1). In so doing, he hoped to encourage them to think of the expression as a unity.
A. 1. (-4)×(� )
2. (� )×(� )
3. (-1/3)×(+12)
4. (-2)2
B. 1. ( )×( )
2. (-1)3
3. (-1)×(� )
4. (-12)÷(+2)
Okazaki
PME30 — 2006 4 - 261
Student’s difficulties and overcoming them using the brackets In the 8th lesson, a problem occurred in one small group. After the group activities, the teacher let three groups present their records of the games. Of course this included the group that had experienced the problem. The record of this group is shown in Figure 4.
Figure 4. The record of the game in one small group. T: Well, Fuji, please tell us about the situation in your group. Fuji: It is strange. [She pointed to the last expression] Here, 32 divided by -8 is -4. Then
divide it by 2, and the answer is 2, because the rest of the numbers are all 1s. Yoshi: Mr. Kuro, can I write on the board? It is not good from here to here. [She added the
underlining.] [ = (+32) ÷ (-4) × (-1) × (-1)
� � � = (+32) ÷ (-8) ÷ (+2) × (-1) × (-1) ] T: Please raise your hand if you can see their problem. S: [All students raised their hands.]
This group was worried because the answer was not -8 once they had changed -4 into (-8) ÷ (+2). And, although they had discovered which replacement the mistake had resulted from, they could not see how to deal with it. At this point, one student said “we can use (-2) ÷ (+2) instead of (-8) ÷ (+2)”. He made this suggestion so that the value of the whole expression would be -8. However the idea was soon rejected by the other students because it violated the rule that the number must be replaced with an equivalent expression. After a while Jo said “Is it all right to add brackets? There!” The teacher asked her to write on the board.
Jo: [She wrote the brackets “(+32) ÷ {(-8) ÷ (+2)} × (-1) × (-1)”. ] S: Oh! S: That’s right! (with great surprise) S: Yes, brackets! T: The order is changed, isn’t it? We do here, these brackets first. [He checked the
calculation with the students.] What about the next expression? S: Well, we add the brackets there. T: Don’t you think the brackets are great and powerful?
These exchanges were so influential that all the students now seemed to appreciate that brackets could make the order of the calculation change. In fact, in the next game, we could hear comments such as “The big bracket -4 plus the bracket -2 … We cannot do without using the brackets” from many of the small groups.
The development in the students’ views on the expressions
Though we could hear lots of students’ comments on the use of the brackets by the end of the 9th lesson, at the same time they sometimes used brackets unnecessarily, perhaps because they had been so strongly impressed by the use of the brackets in previous lessons. However, in checking the records reported on the board in the 10th lesson, the students began to notice that there were unnecessary brackets, as a consequence of an implicit suggestion made by the teacher (Two out of the three records included unnecessary brackets).
T: (In checking the expression in which unnecessary brackets were not included) … times, divided by, times and divided by. So, as no brackets are included, let’s calculate it from the left.
S: Oh, I see. The brackets are not necessary in our expression!
S: It makes no sense.
S: Mr. Kuro, please delete those brackets. They make no sense. [He pointed to the expression “{(-2) × (-1)} × (-9) × (-9) ÷ (-3)”.]
S: Mr. Kuro, please delete ours too. It is the top brackets. [He pointed to the expression “{(+36) ÷ (+2)} × (-3)”.]
When the teacher asked them whether the brackets could be removed in checking the values of the whole expressions, they were able to answer well. But he did not ask them under what conditions the brackets could be omitted. If he had asked the conditions for the omission of the brackets, they would have had a further opportunity to think about the structure of the expression.
In the 11th lesson, we observed another scenario where the students had not utilized brackets. One student changed “-10 = (-30) ÷ (+3)” into “= (-30) ÷ (-12) ÷ (-4)” on the board, and no one in her group remarked on the lack of brackets. However, it was soon refuted by the other group, with comments like “If we calculate it from the left, it doesn’t go well”. We concluded that they still didn’t have a clear awareness of the usage of brackets and a similar state of affairs was the case in the 12th lesson too. However, through correcting these situations again and again, it seemed that they eventually became aware of the necessity for brackets, the order of calculation and the characteristics of operations. For example, they made the following expression as a final form.
When the teacher then asked the students whether the brackets ahead of (-8) could be removed, they could in unison state that it was impossible. This recognition seemed to indicate that they were now able to adopt a structural view of a complex expression, even one they had never previously met.
Okazaki
PME30 — 2006 4 - 263
DISCUSSION We may distinguish at least four states of the students’ views of the expressions. First, when the students replaced a number with an expression A as one step in the game, the expression may be seen as equivalent to the number (Fig. 5.1). In other words, it may not be conceived as something to be calculated but as a unity. We think this an important step in starting to view the expression structurally, and the game makes it emerge in a meaningful way. Second, when we see the game as a whole, the longer expressions B’ were constructed one after another based on the old expressions B so that their values were kept constant (Fig. 5.2). Here the expressions themselves were handled as objects (Douady, 1997). Also their recognition of each expression as a unity seemed to be facilitated through the teacher’s navigation that led them to compare a certain part of the expression with the corresponding part of the other equivalent expression. We also found that successful completion of the expression constructing activity was often greeted by the students with surprise. Third, the students found that the expression with brackets C’ might regulate both the parts and the whole of expression C (Fig. 5.3). Namely, the idea of using brackets enabled them to resolve inconsistencies between the replacement of a number with a partial expression and the value of the whole expression, and again this was greeted with surprise. We think that the brackets contributed to making them see the expressions as unities. Fourth, they modified the expression with brackets D into the one without brackets D’ (Fig. 5.4), and through it were able to see whether adding or omitting brackets in the expression would change the order and structure of the whole expression. It should be noted that such recognition was gained after correcting some errors. Overall, it is clear that these four states can be structured in terms of nested semiotic chaining. That is, we can see that the signifier in a previous sign combination became the signified in a new sign combination and that each new signifier in the chain stands for everything that precedes it in the chain (Presmeg, 2001). We may understand this chaining as both the process by which the view of the expression as a unity was developed and the process by which the role of brackets were recognized. Just as Radford (2003, p.62) stated that brackets “become essential because they help the students mark the rhythm and motion of the actions”, it seemed to us that eventually the students could read the order and structure of the whole expression from the brackets. Prior to this experiment, all that the brackets had meant to the students was a command to indicate the precedence of calculation.
Figure 5.1 Figure 5.2 Figure 5.3 Figure 5.4.
Number
Expression A
IA
Expression B
Longer Expression B’
IB
Expression C
Expression with brackets C’
IC
Expression with brackets D
Expression without or with brackets D’
ID
Okazaki
4 - 264 PME30 — 2006
Namely, it seems that the brackets play a role not only in object language but also in the metalanguage for telling about it (Hirabayashi, 1987; Allwood et al. 1977). It may be similar to the way in which the plus and minus signs are used to show the meanings of adding and subtracting as well as positive and negative numbers and moreover the algebraic sum (Sfard, 1991). Thus we believe that providing students with an appropriate view of the role of brackets can be an important girder in the bridge from arithmetic to algebra, as a proper awareness of this is deeply related to the structural conception of expressions. However, we think it will be necessary to do a more detailed semiotic analysis, such as Radford (2003), in order to clarify the transition process, which is our future task. References Allwood, J., Andersson, L.-G., and Dahl, Ö. (1977). Logic in Linguistics. Cambridge
University Press. �Carpenter, T., Franke, M. and Levi, L. (2003). Thinking Mathematically: Integrating
Arithmetic and Algebra in Elementary School. Heinemann. Douady, R. (1997). Didactic engineering. T. Nunes et al. (eds.), Learning and Teaching
Mathematics: An International Perspective (pp. 373-401). Psychology Press. Hirabayashi, I. (1996). On mathematical expressions. Elementary Mathematics Teaching
Today, November, 6-9. Hirabayashi, I. (1987). The Development of Activism in Mathematics Education. Toyokan. Jakobson, R. (1973). General Linguistics. Misuzu Shobo. (trans. by Kawamoto, S. et al.). Kieran, C. (1992). The learning and teaching on school algebra. D.Grouws (Ed.), Handbook
of research on mathematics teaching and learning. Macmillan. Koyama, M. (1988). Epistemological considerations on the transition from arithmetic to
algebra. Proceedings of the 21st JSME Meeting, 52-57. Kelly, A. and Lesh, R. (eds.). Handbook of Research Design in Mathematics and Science
Education (pp. 231-265). LEA. Miwa, T. (1996). Teaching of symbolic expressions: An introduction. Tsukuba Journal of
Educational Study in Mathematics, 15, 1-14. Presmeg, N. (2001). Progressive mathematizing using semiotic chaining. Paper presented at
the Discussion Group 3: Semiotics in Mathematics Education in 25th PME Conference. Radford, L. (2003). Gestures, speech, and sprouting of signs: A semiotic-cultural approach to
students' types of generalization. Mathematical Thinking and Learning, 5, (1), 37-70. Sfard, A. (1991). On the dual nature of mathematical conceptions: Reflections on processes
and objects as different sides of the same coin. ESM, 22, 1-36.
2006. In Novotná, J., Moraová, H., Krátká, M. & Stehlíková, N. (Eds.). Proceedings 30th Conference of the International Group for the Psychology of Mathematics Education, Vol. 4, pp. 265-272. Prague: PME. 4 - 265
KIKAN-SHIDO: THROUGH THE LENS OF GUIDING STUDENT ACTIVITY
Catherine A. O’Keefe Xu Li Hua David J. Clarke The University of Melbourne
The lesson event ‘Kikan-Shido’ (Between Desks Instruction) is used to compare different forms of guidance provided by teachers in mathematics classrooms across six cities. While Kikan-Shido had a recognizable structural form in all the mathematic classrooms in the data set, there was variation in both the amount of time devoted to Kikan-Shido and in the way individual mathematics teachers’ ‘Guided Student Activity’. In this paper, examples of individual teacher guidance are examined to draw out the subtleties of practice in three ‘Asian’ and three ‘Western’ classrooms. It is posited that differences in activity are related to specific pedagogical principles that appear to underlie the teachers’ practice. The occurrence of similarities in practice across apparent cultural categories problematises simplistic East-West comparative cultural analyses.
INTRODUCTION Of all the Lesson Events that might be observed in mathematics classrooms around the world, one of the most immediately familiar is that moment when the teacher, having set the students independent or group work, moves around the classroom. This paper reports a fine-grained analysis of this Lesson Event in a selection of well-taught mathematics classrooms located in Berlin, Hong Kong, Melbourne, San Diego, Shanghai and Tokyo. The Lesson Event is conceived as a type of classroom activity sharing certain features common across the classrooms of the different countries studied. Lesson Events represent one type of pattern of participation (Clarke, 2004), co-constructed by teacher and students in mathematics classrooms around the world, each having a form sufficiently common to be identifiable within the classroom data from each of the countries studied. This paper focuses on one specific function of Kikan-Shido (Between Desks Instruction): the provision by the teacher of overt guidance of student mathematical activity.
THE DATA This paper reports results from the Learner’s Perspective Study (LPS) based on analyses of sequences of ten lessons, documented using three video cameras, and supplemented by the reconstructive accounts of classroom participants obtained in post-lesson video-stimulated interviews, and by test and questionnaire data, and copies of student written material (Clarke, 1998, 2001, 2003). In each participating country, data collection focused on the classrooms of three teachers, identified by the local mathematics education community as competent, and situated in demographically different school communities within the one major city. This gave a data set of 30 ‘well-taught’ lessons per school system and, for the purposes of the
O’Keefe, Hua & Clarke
4 - 266 PME30 — 2006
analyses reported here, a total of over 180 videotaped lessons, supplemented by over 20 teacher interviews, and almost 400 student interviews.
KIKAN-SHIDO: BETWEEN DESKS INSTRUCTION Japanese teachers possess an extensive vocabulary with which to describe their practice. Among the many terms available to them is the term ‘Kikan-Shido,’ which means ‘Between Desks Instruction’ in which the teacher walks around the classroom, predominantly monitoring or guiding student activity and may or may not speak or otherwise interact with the students. For all classrooms in the data set, the activity of Kikan-Shido appeared to have four principal functions: (i) monitoring student activity, (ii) guiding student activity, (iii) organization of on-task activity, and, sometimes, (iv) social talk. These are defined in Table 1.
Monitoring Student Activity
The process through which the teacher: observes the progress of on-task activities and homework; ascertains student understanding; or selects student work with the
intention to keep track of student progress, question student comprehension and record student achievement.
Guiding Student Activity
The process through which the teacher: provides information; elicits student response for the purpose of
promoting reflection; or facilitates engagement in classroom activity with the intention to actively scaffold
student participation and comprehension of subject matter.
Organisational
The process through which the teacher: distributes and collects materials; or organizes the physical setting in
the classroom with the intention to support interactions among students and facilitate student engagement in
learning activities.
Kikan-Shido
Between desks instruction in
which the teacher walks
around the classroom,
predominantly monitoring or
guiding student activity and may or may not speak
or otherwise interact with the
students.
Social Talk
The teacher engages with student(s) in conversations not related to the subject matter or current on-task activity.
Table 1. Definition of the Principal Functions within Kikan-Shido Each principal function is comprised of a number of mutually exclusive clustered activity codes that have recurrent form across all 180 taped lessons, and the purpose of this paper is to examine key differences in instructional practice within Guiding Student Activity. Guiding Student Activity is comprised of seven activity codes. Table 2 presents the definitions for each activity code.
O’Keefe, Hua & Clarke
PME30 — 2006 4 - 267
Encouraging Student
Activity pursued by the teacher designed to motivate, provide support and feedback to individual or groups of students.
Giving Instruction / Advice at Desk
The teacher scaffolds students’ understanding by providing information, instruction or advice, focusing on: the development of a concept that
addresses meaning; reasoning; relationships and connections among ideas or representations; or the demonstration of procedure.
Guiding Through Questioning
A series of specific teacher questions intended to guide student understanding of a procedure or concept during the on-task activity.
Re-directing Student
Activities pursued by the teacher to: regulate the behaviour of the student(s) who are perceived to be not paying attention to the current on task activity; and to support student(s) on-going engagement during the
lesson.
Answering a Question
The information given by the teacher when requested by a student.
Giving Advice at Board
Instruction or advice is given while an individual or group of students work at the board. The instruction or advice may be intended for those students working at the board or may be intended for the whole class.
Guiding Whole Class
The teacher walks around the classroom and provides information, instruction or advice intended to address the whole class.
Table 2. Guiding Student Activity Codes Defined Using the ‘StudioCode’ video analysis software, it was possible to code for Kikan-Shido, and its various functions as they occurred in the video record. Using this coding system we can map the various activity codes to a timeline of a single lesson. For the purpose of statistical analysis of each teacher’s practice, the individual lesson timelines from each class were combined to identify the frequency of occurrence of each activity code across the ten-lesson sequence.
O’Keefe, Hua & Clarke
4 - 268 PME30 — 2006
The actual functions served by Kikan-Shido help us to distinguish one classroom from another. The ways in which different mathematics teachers initiated Kikan-Shido were diverse and distinctive. This can be seen graphically in the comparison of 180 mathematics lessons across six countries in the LPS data set (see Figure 1). Note: only Guiding Student Activity and its constituent sub-codes have been recorded.
Figure 1. Comparison of Kikan-Shido, Guiding Student Activity and its sub-functions across 180 lessons from 18 classrooms in six countries.
O’Keefe, Hua & Clarke
PME30 — 2006 4 - 269
An essential point must be made here: We have analysed sequences of ten mathematics lessons taught by eighteen teachers designated as competent in six different countries. We do not presume to characterize the teaching of a country or a culture on the basis of such a selective sample. Nor do we intend to compare teaching in one country with teaching in another. Our analysis is intended to compare and contrast the practices of competent teachers and their classrooms, not cultures. Figure 1 graphically illustrates both the similarities and the significant differences in the way that 18 competent, experienced teachers enacted the lesson event that we have called “Kikan-Shido.” For example, AUS3 and USA3 both devoted nearly 45% of their class time to Kikan-Shido, but Figure 2 makes it clear that the relative weighting of Guiding Student Activity for these two classrooms was completely different. If we compare GER3 with JP2, we find similarity not only in the time devoted to Kikan-Shido, but even in the relative proportions of Guiding Student Activity. However, at the next level of analysis, we find significant differences in the manner in which the guiding activities were carried out. Similarly, if we compare HK 3 with USA 2, we find similarity in the time devoted to Guiding Student Activity, but difference in the utilization and amount of time devoted to each activity code. For example, the predominant activity of HK Teacher 3 during Guiding Student Activity was Giving Instruction and Advice at Desk (80% of the time spent on Kikan-Shido). Such explicit preference for one activity code was less apparent in the practice of USA Teacher 2 who adopted a more varied employment of each activity code. However, if we compare USA2 with JP3, we find significant similarities even to the level of the sub-codes. The fact that teachers are situated very differently and share some similarities in both the amount of time and preference for particular guidance activities suggests not only the generality of the pedagogical strategy but also its cultural transferability. It is clear from Figure 1 that there are differences between and within each school system. The occurrence of such culturally-distributed practices problematises simplistic East-West comparative analyses. Real understanding of the decisions and pedagogical principles underlying each teacher’s classroom practice is only evident from a fine-grained analysis of Guiding Student Activity as it was enacted in each mathematics classroom. The following examples illustrate individual teacher use of Guiding Student Activity. Motivational Support and Encouragement On many occasions, Australian Teacher 1 would provide verbal encouragement to individual students (see Figure 2). In fact, the practices of all three teachers in Australia and of USA Teacher 3, appeared to prioritise the development of student confidence by providing motivational support and encouragement.
AUST3 She needs that encouragement … she's not particularly independent and she's not well skilled and she relies heavily on a lot of other students … on this day she was by herself doing the task … and that was really pleasing … mmm.
O’Keefe, Hua & Clarke
4 - 270 PME30 — 2006
Such explicit encouragement was much less evident in the other mathematics classrooms studied. In fact, the teachers in the Asian data set (Shanghai, Hong Kong and Tokyo), with the exception of SH Teacher 2 (0.4%), typically did not encourage students during Kikan-Shido. The only instance of Encouraging the Student coded in Shanghai School 1 illustrates a unique strategy that was employed by the teacher intended to encourage, motivate and provide feedback to individual students, while addressing the whole class:
SHT1 Be quick – finish the other one. Eh, (to whole class) some of you drew it very well. (Points to student 4’s work) You drew it wrongly. (To student 5) You also were wrong. (To student 6) You. You speed up [moving down the row]. You did it right (pat on the back of student 8) [taking up the paper of student 9]. Eh, he did it right (to whole class). Student 9 also did it right.
In this example, the teacher draws the attention of the class to the student’s error. While the teacher’s intentions appear to be motivational, there is no example of this strategy (public announcement of student error) in the Australian, American, German or Japanese data. However, similar statements were recorded in SH1, SH2, HK1 and HK2. This suggests that encouragement and motivation in these four classrooms were predicated on a value system different from that operating in non-Chinese classrooms.
Instruction and Advice at Desk Huang (2002) has suggested that the practices of teachers in Shanghai are grounded in a different pedagogy from those of teachers in Hong Kong. Certainly, the practice of Hong Kong Teacher 3 appeared predicated on different pedagogical principles from those underlying the practice of Shanghai Teacher 2. While the dominant function of Kikan-Shido in Shanghai School 2 was to Monitor Student Activity (20.5% of total class time) (see O’Keefe, Xu & Clarke, in preparation), in Hong Kong School 3, an even larger proportion of time was devoted to Giving Direct Guidance (21.9%). The teacher would walk around the classroom in order to help students with their difficulties, and the guidance during Kikan-Shido was typically quite directive, as illustrated in this example:
S [in Chinese] Come here! Come here! Hey! Hey! Come here! I don't know how to do question four! (...)
HKT3 [in Chinese] A little bit different! This time...these two... Both twenty-one and twenty-four are multiples of three!
S [to T] [in Chinese] Yes! Just to simply it? Okay. HKT3 [in Chinese] It isn't to simplify it! It can't be simplified! This one no either
(...) this one is okay! This one can be simplified but this one cannot. S [to T] [in Chinese] Then how? HKT3 [in Chinese] So...this one is okay! This can be simplified! You have to
divide this by seven and then multiply it by eight.
O’Keefe, Hua & Clarke
PME30 — 2006 4 - 271
Orchestrating Whole Class Activity Although most of the teacher support provided during Guiding Student Activity was directed to individual students, teachers (particularly in AUS 2, GER 1 and 2, HK 1 and 2 and JP 3) also provided information, instruction or advice intended to inform the whole class. This type of activity was coded as Guiding Whole Class. The exercise of Guiding Whole Class during Kikan-Shido suggests that the teachers attached sufficient importance to the class learning as a whole group, such that they would give guidance to the whole class, when this was judged to be appropriate, while also continuing to give assistance to individual students. Guiding Whole Class was enacted differently according to the teacher’s judgment of the situation: either upon perceiving the difficulties among students to be global, the teacher would interrupt students’ work by making clarifications to the whole class; or the teacher would provide information, instruction or advice to the whole class as a way of orchestrating whole class activity. On identifying a common mistake among the students, Hong Kong Teacher 2 would give instructions to the whole class while walking around in order to remind the class of the errors they made or tended to make. Here is one sequence of teacher statements during Kikan-Shido.
HKT2 [to VANESSA] Young lady, you've copied down the question wrongly. You are really overtaken by the twins!
HKT2 [to S] What's wrong? Okay. HKT2 [to whole class] Hey, be careful with one thing. You've got one thing,
your fatal mistake is miscopying questions. Very often you copy from your book wrongly, or you've copied the first thing correctly, but you get it wrong in the second step. Is this illusion or what? Is this a kind of 'sense discoordination'?
CONCLUDING REMARKS By examining the practices of 18 competent mathematics teachers in Berlin, Hong Kong, Melbourne, San Diego, Shanghai and Tokyo, it has been possible to identify the different forms of guidance provided by teachers during Kikan-Shido. While Kikan-Shido represents a recurrent form of co-constructed classroom practice, evident across all the ‘well-taught’ mathematics classrooms studied, our analyses demonstrate that both the proportion of time spent on Guiding Student Activity and the distinctive character of each teacher’s guidance appear to be a signature characteristic of their practice. The examples provided in this paper illustrate both similarities and differences in individual teachers’ use of Guiding Student Activity. Where classroom practices are found to be similar across such culturally-disparate circumstances, the particular similarities of practice assume heightened significance. The fact that teachers are situated very differently and have developed similar solutions to a particular classroom challenge suggests not only the generality of the pedagogical strategy but also its cultural transferability. We also argue that variations in teacher guidance (with respect to form, frequency and timing) are predicated on
O’Keefe, Hua & Clarke
4 - 272 PME30 — 2006
specific pedagogical principles that appear to underlie each teacher’s practice. On the one hand, differences between the practices in classrooms in China and Japan represent a challenge to overly-inclusive culturally-based categorizations. However, the occurrence of identifiable culturally-distributed practices problematises simplistic East-West comparative cultural analyses. In fact, regularities in the practices of competent teachers across cultures may provide the basis for an international pedagogy of mathematics. References Clarke, D.J. (1998). Studying the classroom negotiation of meaning: Complementary
accounts methodology. Chapter 7 in A. Teppo (Ed.) Qualitative research methods in mathematics education. Monograph Number 9 of the Journal for Research in Mathematics Education. Reston, VA: NCTM, pp. 98-111.
Clarke, D.J. (Ed.) (2001). Perspectives on meaning in mathematics and science classrooms. Dordrecht, Netherlands: Kluwer Academic Press.
Clarke, D.J. (2003). International Comparative Studies in Mathematics Education. Chapter 5 in A.J. Bishop, M.A. Clements, C. Keitel, J. Kilpatrick, and F.K.S. Leung (eds.) Second International Handbook of Mathematics Education, Dordrecht: Kluwer Academic Publishers, 145-186.
Clarke, D.J. (2004). Patterns of Participation in the Mathematics Classroom. In M.J. Høines & A.B. Fuglestad (Eds), Proceedings of the 28th Conference of the International Group for the Psychology of Mathematics Education, Vol. 2, Bergen: Bergen University College, 231-238.
Huang R. (2002). Mathematics teaching in Hong Kong and Shanghai – A classroom analysis from the perspective of variation. Unpublished Ph.D. thesis. The University of Hong Kong.
O’Keefe, C. Xu, L., & Clarke, D. J. (in preparation). Kikan-Shido: Between Desks Instruction. To be included in D. Clarke, J. Emanuelsson, E. Jablonka, I. A. C. Mok (Eds). Making Connections: Comparing Mathematics Classrooms Around the World. Taiwan: Sense Publishers.
2006. In Novotná, J., Moraová, H., Krátká, M. & Stehlíková, N. (Eds.). Proceedings 30th Conference of the International Group for the Psychology of Mathematics Education, Vol. 4, pp. 273-280. Prague: PME. 4- 273
HIDING AND SHOWING CONSTRUCTION ELEMENTS IN A DYNAMIC GEOMETRY SOFTWARE: A FOCUSING PROCESS
Federica Olivero Graduate School of Education, University of Bristol UK
This paper draws on a study investigating the use dynamic geometry software in the context of open geometry problems requiring conjecturing and proving at secondary school level. After setting the context and main result of the study, the paper will focus in particular on the analysis of the hide/show tool available in Cabri. The way students exploit the possibility of hiding and showing the construction elements of a configuration at stake was revealed to play a fundamental role in the development of the proving process. This will be illustrated through examples from students’ work and implications for teaching will be drawn.
INTRODUCTION: PROVING AS A FOCUSING PROCESS This paper focuses on a particular aspect of a study (Olivero, 2002) investigating the use of dynamic geometry software in the context of solving open problems in geometry that require conjecturing and proving. The study showed that the proving process1 within a dynamic geometry environment can be described as a progressive focusing process, in which new empirical and theoretical elements (figures, statements and relationships among them, theoretical properties) emerge and are transformed over time by the students towards the construction of conjectures and proofs. The focusing process requires what Godfrey refers to as “developing a geometrical eye” which he defines as “the power of seeing geometrical properties detach themselves from a figure” (Godfrey, 1910, p.197). Fujita & Jones (2002) illustrate the idea of geometrical eye with an example. Consider the problem: if A and B are the midpoints of the equal sides XY and XZ of an isosceles triangle, prove that AZ=BY (Figure 1). In order to be able to prove this, one needs to ‘see’ first of all that, for example, triangles AYZ and BZY are likely to be congruent.
Figure 1. Developing a geometrical eye
1 The proving process is defined as the process of exploring a situation, formulating a conjecture and constructing a proof (Olivero, 2002, p.41).
Olivero
4 - 274 PME30 — 2006
A key element of the proving process is to develop the capacity of focusing on the appropriate objects at the appropriate time in the process and being able to change focus whenever needed, whenever new elements are discovered and whenever new theoretical elements emerge. In the previous example one needs to ‘see two triangles as congruent’, i.e. triangles AYZ and BZY need to become the object of the focusing process and the property of being congruent needs to “detach” itself from the figure. A condition that can help the focusing process is the possibility of having a field of experience which allows students to manipulate, interact, and change the objects they deal with: such an empirical experience is likely to evoke theoretical elements. The research this paper draws on, showed that open problems (Arsac et al., 1988) and the dynamic geometry environment support this process.
METHODOLOGY The study (Olivero, 2002) consisted of classroom interventions which took place in three secondary schools (15-17 years old pupils) in England and Italy. Students were asked to solve open geometry problems involving conjecturing and proving, working in pairs and using Cabri. Through an in-depth analysis of case studies of six pairs of students2, an explanatory framework, that identifies the key elements in the development of the proving process with respect to the affordances offered by the dynamic geometry environment, was developed. This paper examines in particular the role of the hide/show function in Cabri as a tool to support the focusing process.
THE HIDE/SHOW TOOL IN CABRI Most dynamic geometry software offers the possibility of hiding elements of a figure after it has been constructed, and then showing back any of those hidden elements as required. ‘Hiding’, which differs from ‘deleting’ an element completely, is a feature that is not available in paper and pencil. As we can see from Figure 2, hiding or showing elements of a configuration at stake changes the nature of the figure to explore because what is visible changes and therefore the potential elements of the focusing process change too.
Figure 2. Hiding and showing construction elements in the problem ‘Perpendicular bisectors of a quadrilateral’.
In the context of the study referred to in this paper, the research problem tackled is: how does the use of the hide/show function affect the proving process and the way 2 The six pairs were video-recorded and observed during the classroom sessions and their Cabri files collected. The results reported in this paper draw on the analysis of all pairs.
Olivero
PME30 — 2006 4 - 275
the focusing develops? The study considered in particular the hiding and showing of construction elements, i.e. the elements that link a basic figure with a figure that is dependent on it; for example, in the problem ‘Perpendicular bisectors of a quadrilateral’3 the construction elements are the perpendicular bisectors and the basic objects are the sides of the initial quadrilateral (or the quadrilateral itself). Three clearly different ways of working with construction elements appeared in the students’ proving processes:
1. a systematic use of the hide/show tool: hiding construction elements when exploring and showing them when proving;
2. leaving construction elements always visible; 3. hiding construction elements from some point of the conjecturing onwards and
not showing them again. In the following sections the way the hide/show tool shapes the development of the proving process will be illustrated through two particular examples, which show modalities 1. and 2.. The 15-year-old Italian students are solving the problem ‘The perpendicular bisectors of a quadrilateral’ in pairs.
A SYSTEMATIC USE OF THE HIDE/SHOW TOOL This example shows a very systematic way of hiding and showing construction elements (the perpendicular bisectors in this case): throughout the whole proving process, Bartolomeo and Tiziana hide the construction lines when exploring and they make them visible when proving, moving between the two configurations in Figure 2. The students hide the construction lines straight after finishing the construction before starting the exploration with dragging, leaving only the two quadrilaterals ABCD and HKLM visible.
55 Bartolomeo: delete the lines, the points are connected anyway.
While saying this, they transform ABCD from the configuration on the left to the configuration on the right in Figure 2. The perpendicular bisectors are no longer needed as “the points are connected anyway”: the perpendicular bisectors are seen as a tool to construct HKLM and once this is constructed they can be ‘deleted’4. The bisectors are always hidden when they continue with the exploration process.
198 Bartolomeo: so we need to look at the rhombus. 199 Bartolomeo hides the perpendicular bisectors and then drags A, D and B.
The perpendicular bisectors are made visible again every time the students attempt to prove something.
3 You are given a quadrilateral ABCD. Construct the perpendicular bisectors of its sides: a of AB, b of BC, c of CD, d of DA. H is the intersection point of a and b, K of a and d, L of c and d, M of c and b. Investigate how HKLM changes in relation to ABCD. Prove your conjectures. 4 Hidden.
Olivero
4 - 276 PME30 — 2006
233 Bartolomeo: here you are … so another trapezium is formed. Let’s prove it. So let’s put the perpendicular bisectors again.
The modality of using the hide/show function shown by Bartolomeo and Tiziana has an impact on the perception of the figures on the screen and the development of the proving process. Hiding the construction lines allows isolating the two quadrilaterals and therefore induces the formulation of conjectures on the relationships between the shapes of the two quadrilaterals ABCD and HKLM (for example: "If ABCD is a parallelogram then this HKLM is a parallelogram too"). The conjectures and corresponding figures are then transformed for the proof, by stating the property that will be proven (for example: "so … we must prove that those two [perpendicular bisectors] are parallel") and by restoring the construction lines.
However, it has been observed that showing the construction lines is not always sufficient to recall all the properties that were used in the construction itself, as shown by the extract below.
175 Bartolomeo: so, wait, if this is a right angle I can say that…(Figure 3) 176 Tiziana: no, but it's not a right angle, what are you talking about? So 177 Bartolomeo: … it must be, otherwise they are not parallel […] 192 Bartolomeo: … so… let's do this… but look, here there are four right
angles, otherwise they are not parallel 193 Tiziana: oh dear, look!… the perpendicular bisector, isn't it? (she
points at b) There is always a right angle!
Figure 3. Proving the conjecture "If ABCD is a parallelogram then HKLM is a parallelogram too"
While proving the case of the parallelogram, Bartolomeo and Tiziana do not pay attention to the fact that the lines they made visible again (the perpendicular bisectors), are actually perpendicular bisectors, i.e. lines perpendicular to the sides of ABCD. They spend time in constructing a proof in which something is always missing, that is a right angle (175-176), which is there but is not ‘seen’ until the very end of the proof (193).
LEAVING CONSTRUCTION LINES ALWAYS VISIBLE This example shows a case in which the students leave the construction lines visible at all times during the proving process. The extract below shows how this affects Debora and Giulia’s formulation of conjectures and attempt to prove a conjecture
Olivero
PME30 — 2006 4 - 277
which is based on empirical elements, i.e. on what they see on the screen only, and does not bring in any theoretical element.
189 Debora: this is congruent to this (Ac'Mb' and Kd'Ca'), this is congruent to this (aBbH and DcLd) this is congruent to this (Hbd'K and MLdb') this is congruent to this (c'aHM and LKa'c) [looking at Figure 4]
190 Giulia: the figures internal to the quadrilateral, excluding HKLM, are congruent in pairs respectively
191 Debora: the opposite are congruent […] 234 Debora: I’m trying to understand from which point to look at it .. if this one
…then it becomes something like that. I can’t understand which are the biggest sides …ah, it’s upside down! […]
Figure 4. Showing construction elements (a, b, c, d, a', b', c', d' are used by the students to indicate the intersection points of the perpendicular bisectors with the sides of ABCD)
The students’ exploration up to this moment in the process happens within the spatio-graphical field (Laborde, 2004) as Debora and Giulia are trying to ‘read’ the figure and the statements they produce are descriptions of facts which can be observed on the Cabri figure (189-191). We can see that the fact that the construction lines are visible has an impact on the conjecturing process: the students focus the attention on the small parts in which ABCD is divided by the perpendicular bisectors rather than on the two quadrilaterals ABCD and HKLM. Figure 4, in which all construction lines are visible, shows both how the multitude of the small quadrilaterals in which ABCD is divided and the possible congruencies amongst them may capture the attention and how difficult it is to ‘see’ the two quadrilaterals ABCD and HKLM and the relationship between them.
442 Giulia: so, proofs. We must prove it is an upside down rhombus …here is the story … the congruence stuff. Let’s start from these two big figures: this one (AaHb’) and this one (Ld’Cc). Can you see them? So, let’s prove that this one (c’aHM) equals this one (LKa’c), and that this bit (Ac’Mb’) equals this bit (Kd’Ca’).
Line 442 is the starting point of the proof for conjecture ‘If ABCD rhombus then HKLM rhombus’. As we can see, what Debora and Giulia want to prove is what they focused on in the exploration (as shown in the previous extract), that is the congruence of the quadrilaterals formed inside ABCD and external to HKLM, due to
Olivero
4 - 278 PME30 — 2006
the fact that the exploration has been led by the fact that the construction lines are visible, with no apparent theoretical control over what these lines are. This focus does not lead them anywhere, and they remain at a spatio-graphical level for a long time, without succeeding in constructing a proof.
HIDE/SHOW AS A FOCUSING TOOL The analysis of students’ protocols (Olivero, 2002) has shown that during the proving process, the tools available in Cabri (dragging, measuring, hide/show etc) become tools for focusing that can be used by the students to shape the way the focusing takes place. The hide/show function can be seen as a focusing tool in itself because the possibility of showing or hiding elements allows focusing on different objects/properties. When the construction lines are hidden, then the exploration takes place at a more visual level and theoretical elements do not always play a role or emerge in that process. In this case students do not usually pay attention to the construction and therefore to the geometrical link between the two quadrilaterals at stake. Sometimes, the construction elements may be ignored, and the geometrical properties necessary for proving may not be used because they are/were ‘hidden’, which is what happened in the case of Bartolomeo and Tiziana analysed above. When the construction lines are visible, then the geometrical link between the two quadrilaterals is explicitly visible and in general the exploration already contains some justification elements (Olivero, 2002). The links between ABCD and HKLM are seen not only globally, i.e. in terms of quadrilaterals as wholes, but also, and particularly, locally, i.e. in terms of properties of specific elements of the figure (e.g. sides or angles). For example, another pair of students formulated conjectures about the relationship between two pairs of opposite sides ("so whenever the outside lines [sides of ABCD] are parallel the inside ones [sides of HKLM] are"), rather than about ABCD and HKLM. The fact that the parallelism of the sides of ABCD implies the parallelism of the sides of HKLM is what these students prove later in the process. When the construction lines are visible, the situation seems to require a stronger theoretical control over the figure as there are more elements that need to be appropriately managed at the same time. For example, as shown in the previous section, for Debora and Giulia the fact of having the perpendicular bisectors visible has a negative effect: once they stop dragging, the students are not able to distinguish parameters and variables, and consequently hypothesis and thesis. All lines seem to have the same status, so that what they ‘see’ on the screen is a figure split into many small quadrilaterals by the perpendicular bisectors rather then two quadrilaterals linked through the perpendicular bisectors. Hölzl (2001) deals with similar issues and suggests that we need to find ways to help students focus on invariants rather then focus on details which suppress the overall. In other words, there is the need to develop a geometrical eye that sees and focuses on only what is relevant. There is a strong link between what one sees and what one uses in constructing a proof. By allowing students to decide what to leave visible and what to hide, the hide/show tool gives students control over the theoretical elements they want to use.
Olivero
PME30 — 2006 4 - 279
This raises questions related to how the theory is/can be made explicit during the proving process. As other research has shown, constructing geometric figures in Cabri fosters theoretical thinking (Mariotti, 2000). In fact, in order to construct a figure in Cabri, the geometric properties of that figure are needed for the construction itself, while this does not necessarily happen on paper5. However, the situation is different when some constructions are required on a general quadrilateral (e.g. constructing the quadrilateral formed by the intersection of the perpendicular bisectors of a given quadrilateral). In Cabri, the fact that there is a menu command that constructs the perpendicular bisector of a segment, allows the students to use it without thinking about the property of the perpendicular bisector with respect to the segment. The only thing to do is to find and use the corresponding command. On the contrary, if they were constructing perpendicular bisectors with pencil and paper they would need to think about how to draw them, i.e. they would need to know that they are perpendicular to the side and go through its midpoint. Therefore in this type of problems in Cabri the geometric properties are not needed at the beginning and potentially are not evoked. This would explain why some students seem not to pay attention to the properties of the construction (e.g. the fact that perpendicular bisectors are perpendicular to a side) while proving, as in the case of Bartolomeo and Tiziana reported above.
CONCLUSIONS AND IMPLICATIONS FOR TEACHING The possibility of hiding and showing elements in Cabri is a ‘new’ powerful tool of dynamic geometry software, because according to what is left visible the focus can shift to different elements. What students see on the screen influences the construction of conjectures and proofs and choosing what they want to see on the screen influences the proving process. In Cabri pupils are in control of what is on the screen in an interactive way and they can adjust the situation by hiding and showing elements to deal with new discoveries or ideas. The hide/show tool can be interpreted from a teaching perspective and should become object of teaching. It is important that teachers are aware of this tool (together with the other Cabri tools6) and that they make it explicit to students as well, so that they are introduced to a use of Cabri, which helps the focusing process, i.e. Cabri is transformed into an appropriate instrument that is then internalised (Mariotti, 2002). Showing construction lines, together with dragging the figure, will help the students to keep in mind the properties of the construction. Hiding some elements may be useful when wanting to focus on some particular configuration, for
5 For example, when drawing a square on paper the properties of having equal sides and right angles do not necessarily need to be evoked; while if a square is drawn in Cabri by only reproducing a mental image associated with that particular name, without using its properties, then that figure will be messed up when dragging it. 6 For the analysis of other Cabri tools, such as dragging and measures, see (Arzarello et al., 2002; Olivero, 2002; Olivero & Robutti, 2001).
Olivero
4 - 280 PME30 — 2006
example to avoid what happened to Debora and Giulia, when they had too many lines visible and could not identify which quadrilaterals they had to consider. The previous discussion leads to broaden the perspective that considers dynamic geometry environments only as add-ons, i.e. as environments that provide students with resources that experts usually possess, and as such need to be abandoned at some stage in the learning process. This paper has shown that it is necessary to take into account the potentialities of this type of software, and more generally of new technologies, to generate new problems and perspectives with respect to paper and pencil, that affect doing mathematics. References Arsac, G., Germain, G., & Mante, M. (1988). Problème ouvert et situation - problème.
Academie de Lyon: IREM. Arzarello, F., Olivero, F., Paola, D., & Robutti, O. (2002). A cognitive analysis of dragging
practises in cabri environments. Zentralblatt fur Didaktik der Mathematik, 34(3), 66-72.
Fujita, T., & Jones, K. (2002). The bridge between practical and deductive geometry: Developing the 'geometrical eye'. In A. Cockburn & E. Nardi (Eds.), Proceedings of the 26th conference of the international group for the psychology of mathematics education (Vol. 2, pp. 384-391). Norwich, UK.
Godfrey, C. (1910). The board of education circular on the teaching of geometry. Mathematical association. Mathematical Gazette, 5, 195-200.
Hölzl, R. (2001). Using dynamic geometry software to add contrast to geometric situations - a case study. International Journal of Computers for Mathematical Learning, 6, 63-86.
Laborde, C. (2004). The hidden role of diagrams in pupils' construction of meaning in geometry. In J. Kilpatrick, C. Hoyles & O. Skovsmose (Eds.), Meaning in mathematics education (pp. 1-21). Dordrecht: Kluwer Academic Publishers.
Mariotti, M. A. (2000). Introduction to proof: The mediation of a dynamic software environment. Educational Studies in Mathematics, 44(1/2), 25-54.
Mariotti, M. A. (2002). Influence of technologies advances on students' maths learning. In L. English, M. Bartolini Bussi, G. Jones, R. Lesh & D. Tirosh (Eds.), Handbook of international research in mathematics education (pp. 695-721): Lawrence Erlbaum Associates.
Olivero, F. (2002). The proving process within a dynamic geometry environment. Bristol: University of Bristol, ISBN 0-86292-535-5.
Olivero, F., & Robutti, O. (2001). Measuring in cabri as a bridge between perception and theory. In M. van den Heuvel-Panhuizen (Ed.), Proceedings of the 25th conference of the international group for the psychology of mathematics education (Vol. 4, pp. 9-16). Utrecht, The Netherlands.
2006. In Novotná, J., Moraová, H., Krátká, M. & Stehlíková, N. (Eds.). Proceedings 30th Conference of the International Group for the Psychology of Mathematics Education, Vol. 4, pp. 281-288. Prague: PME. 4 - 281
PROMPTING GROWTH FOR PROSPECTIVE TEACHERS USING COGNITIVE DISSONANCE
Jo Clay Olson Meghan Colasanti Karmin Trujillo University of Colorado at Aurora Public School Aurora Public School Denver & Health Sciences District District Centre Universities are designing new courses and licensure programs to support the enactment of reform recommendations by prospective teachers. Professional development schools provide a context in which prospective teachers collaborate with teachers and university professors to connect theory and practice. Teachers’ experiences in mathematics often do not reflect current reform recommendations and enacting new pedagogy can be problematic for them. This study sought to explore how cognitive dissonance may help prospective teachers make their implicit conceptions about teaching and learning explicit and support their reconstruction of these notions. Findings indicate that elementary teachers’ conceptions about mathematics change after experiencing and reflecting on cognitive dissonance. Despite calls for reform in school mathematics by The National Council of Teachers of Mathematics (NCTM), classroom practices in United States during the last century have shown little change (Stigler & Hieber, 1999). The University of Colorado at Denver and Health Sciences Centre created a licensure program using professional development schools (PDS) to increase the number of highly qualified teachers with the leadership skills needed to support educational reform. A PDS is a collaborative community of learning which includes prospective teachers (approximately 12), teachers, administration, and a site professor who supports educational reform through school-wide professional development. Prospective teachers work within the PDS to gain practical experiences while simultaneously developing their content and pedagogical knowledge in university courses. These beginning teachers gradually influence classroom practices at their PDS as they examine and discuss the influence of a teacher’s practices with students’ learning at weekly site seminars. Annotative stories told by faculty indicate that many prospective teachers eventually assume leadership positions in their school, school district, and the State of Colorado. Current research on the development of elementary teachers concentrates on the growth of content (e.g., Lo, 2004; Southwell & Penglase, 2005), pedagogical (e.g., Leu & Wo, 2005), or an integration of content and pedagogical knowledge (e.g., Ball & Bass, 2000; Beswick, 2005). This research suggests that prospective teachers have idiosyncratic knowledge of mathematics content and implement reform recommendation that resembles traditional practices. Beswick investigated prospective elementary teachers’ conceptions of relational and instrumental understanding. She suggested that prospective teachers need powerful evidence to
Olson, Colasanti & Trujillo
4 - 282 PME30 — 2006
create viable learning experiences that are different from the ones that they themselves experienced as a student. Beswick theorized that these new learning experiences develop a different kind understanding. These suggestions reflect Ball and Bass’s assertion that content and pedagogy must be interwoven as perspective teachers learn to teach. This study extends the work of these researchers by examining experiences that support prospective elementary teachers’ growth over a three year period of time and enable them to assume leadership roles during their early career.
THEORETICAL FRAMEWORK From the perspective of symbolic interactionism, individuals learn as they interact with other people and the environment (Blumer, 1969). Interactions between individuals are exchanges of words, tone of voice, facial expressions, and gestures that allow individuals to co-create knowledge by sharing ideas, questioning assumptions, and clarifying interpretations. Taylor (2001) suggested that the mediation of verbal and non-verbal interactions may transform the concealed implicit learning into articulated explicit ideas. He inferred that the interaction of implicit and explicit experiences is critical for learning to be transformative. From this stance, Olson, Chiado, Sala, & Kirtley (2005) theorized that (a) the transformation from implicit to explicit may promote teachers’ self-efficacy, which emerges through critical reflection of deeply held beliefs and emotions and (b) an increase in teachers’ self-efficacy enables teachers to assume leadership roles.
Olson, Chiado, Sala, & Kirtley (2005) created a model to describe the relationships between formal and informal experiences with the process of transforming implicit conceptions to explicit conceptions. Implicit conceptions are difficult for individuals to express and encompass many emotions that arise from prior learning experiences. Transforming conceptions is a complex reflective process. Formal and informal learning experiences are interwoven into conceptions about teaching and learning. Olson et al. theorize that implicit conceptions impact how an individual interprets new experiences and assimilates new beliefs. They suggest cognitive dissonance may allow individuals to make their implicit conceptions explicit and examine their implicit conceptions from a new light. When Kirtley reflected on whether her practice reflected a newly articulated belief, she experienced a moment of revelation and changed in her practice (Olson & Kirtley, 2005).
The model suggests that cognitive dissonance is one way to prompt individuals to critically examine their implicit beliefs in light of new experiences and support transformational change. Research using this model to interpret social interactions indicated that teachers began to understand and articulate their implicit learning through discussions that were punctuated by questions that prompted critical reflection. Olson et al. suggest that this critical reflection increases self-efficacy by helping teachers connect theory with practice and gain confidence. From the perspective of symbolic interactionism, when self-efficacy increases, teachers’
Olson, Colasanti & Trujillo
PME30 — 2006 4 - 283
interactions with colleagues change as they voice their ideas in new ways and may lead to new informal or formal leadership roles.
RESEARCH DESIGN AND APPROACH A multilevel research design merges the structure of the multi-tiered teaching experiment and case study to describe how collaboration develops the knowledge of the participants at different levels of learning (English & Watters, 2005). This multilevel research study used two phases. The first phase focused on the learning of prospective elementary teachers while they participated in mathematics licensure courses and field work in a PDS. The second phase began after the prospective teachers gained licensure to teach elementary school and decided to complete their Master’s Degree in mathematics education. Phase 1 At the first level of phase 1, the prospective elementary teachers solved non-routine problems and planned instructional lessons in collaborative groups. Groups consisted of four prospective teachers with similar beliefs about the nature of teaching and learning mathematics and different levels of proficiency in mathematics. Data sources at the first level included: written reflections, written solution strategies, and Olson’s field notes made while teaching mathematics education courses. These data were analysed for changes in the teachers’ justification, creation of conjectures, and spontaneous articulation of mathematical ideas. At the second level, the prospective teachers worked in PDS with a clinical teacher to plan and teach mathematics lessons to elementary students. The prospective teachers videotaped the lessons and collected student work samples for analysis. Using developmental frameworks (e.g., cognitively guided instruction), the prospective teachers analysed these data for evidence of students’ conceptual understanding and learning. Then, they reflected on how their actions influenced elementary students’ opportunities to learn. These student products and class discussions were analysed by Olson for situations that led to cognitive dissonance. Changes in what teachers noticed or analysed were interpreted as evidence of learning. Phase 2 The second phase of this study began after the prospective teachers gained licensure to teach elementary school. Colasanti and Trujillo decided to complete their Master’s Degree in mathematics education and were selected for case-study analysis. They entered the licensure program with different levels of confidence and expertise in mathematics and began to collaborate during a course on rational numbers when they were hired to teach in the same elementary school. Colasanti and Trujillo continued to collaborate throughout their first two years of teaching. At level one, Colasanti and Trujillo’s elementary students solved problems selected from a reform curriculum. The two teachers monitored their students’ learning and met with two school district math coaches to discuss the development of students’ understanding. In addition, they explored mathematical ideas during these
Olson, Colasanti & Trujillo
4 - 284 PME30 — 2006
discussions and how their actions impacted student learning. Colasanti and Trujillo wrote reflections about these coaching session, collected student work samples, and wrote field notes while teaching. These data were analysed to describe the process by which they connected theory with practice and reported in their Master’s Projects. At level two, Colasanti and Trujillo participated in graduate courses to complete their Master’s Degree and solved non-routine problems designed to help them deepen their understanding of mathematical ideas. These courses focused on rational numbers, ethnomathematics, and mathematical modelling in which content and pedagogy were intertwined. Elementary and Secondary teachers worked together while developing content knowledge and worked in grade level groups while creating lessons. Data sources included: written reflections, written solution strategies, and Olson’s field notes. Data were analysed for changes in teachers’ level of sophistication in their mathematical arguments, rationale for their lessons, and analysis of students’ work samples.
At level three, Olson, Colasanti, and Trujillo analysed the learning that occurred at level one and two in both phases for situations that led to cognitive dissonance. We examined the collected data for patterns that connected (a) graduate course work with articulated beliefs about teaching and learning, (b) experiences that led to cognitive dissonance, (c) discussions about the dissonance, with (d) the encouragement to assume new leadership roles within the school.
RESULTS AND DISCUSSION Colasanti and Trujillo both remembered experiencing elementary mathematics as a series of facts and procedures to memorize (reflections, September 07, 2003). However, Colasanti’s father enjoyed mathematics and she remembered him “emphasizing that understanding what I was doing was going to make it a lot easier as math got more complicated.” Colasanti internalized an image of herself as a “doer” of math when she understood WHY and this led to understanding. In contrast, Trujillo experienced early frustration with math. She believed that math was comprised of abstract ideas that she would never understand and recalled being ridiculed in high school for using an incorrect strategy. Through these experiences, Trujillo came to “hate” math and was “deathly afraid of teaching math” in the elementary school (reflections, August 24, 2003).
From these experiences and emotions, a notion of teaching and learning mathematics was constructed that was comprised of both implicit and explicit conceptions. Both Colasanti and Trujillo articulated similar teaching goals, “I want to teach in a way so that kids will understand math” and envisioned teaching practice as, “I will show them how to solve problems and explain each step so that they will understand what to do” (reflections, August 24, 2003). Illustrative examples will be presented to describe how cognitive dissonance helped Colasanti and Trujillo make their implicit conceptions explicit by analysing new experiences learning and teaching mathematics.
Olson, Colasanti & Trujillo
PME30 — 2006 4 - 285
Phase 1 The licensure program was designed to provide prospective teachers with experiences that explored new ideas while working with elementary students in PDS. Both Colasanti and Trujillo struggled in the introductory mathematics content course for elementary teachers, but for very different reasons. Colasanti reflected, “I never had a problem with math and loved timed tests. I didn’t know why we were learning to use manipulatives. Math was based on symbols. But, suddenly it clicked when I taught geometry. I never got geometry because I am not a visual person” (interview, November 28, 2005). Colasanti experienced cognitive dissonance as she questioned the usefulness of manipulatives in a mathematics class. Then, she discovered that her own ability to conceptualize geometric ideas may have been limited without the use of objects to construct mental images. Colasanti taught a unit on geometric shapes and then “all of a sudden I knew what a quadrilateral was. It wasn’t just a rectangle or something like that. It was a whole group of shapes that included squares and funny looking shapes with four sides, just like we talked about in class.” The experience exploring geometric ideas in a content course and then teaching geometry to third grade students led Colasanti to make her implicit conception that mathematics was symbolic manipulations explicit. She then was able to reconsider this conception and articulated the importance of using manipulatives in classrooms to help students explore characteristics of shapes and construct visual images that can be manipulated in the mind (reflection, March 2, 2004). Mathematics was no longer symbols that were used to get answers. In contrast, Trujillo avoided mathematics because she “never had a grasp of it” (interview, November 28, 2005). She struggled in the introductory mathematics course for elementary teachers because she “did not have the procedural knowledge to solve math problems.” Trujillo experienced cognitive dissonance when she entered the introductory course and confronted her belief that she would fail because of her limited understanding of mathematics. She discovered that knowing the procedures did not help her colleagues and found that she in fact “could solve problems that other couldn’t solve.” This led her to reconceptualise her self image and began to envision herself as a “math person.” With her new confidence, Trujillo decided to complete her Master’s Degree in Mathematics Education and described herself as an “elementary teachers who enjoyed math and loved to teach it” (interview, April 14, 2005). Phase 2 Secondary and elementary teachers finishing their Master’s Degree in mathematics education complete a course on the structure of rational numbers. They collaboratively investigate multiple representations of rational numbers to solve non-routine problems (Lamon, 1999), to deepen their understanding of mathematics content, and to explore pedagogy that develops conceptual understanding. During the spring 2004, Colasanti and Trujillo participated in this course on rational number. Olson assigned each teacher to a specific group that mixed the strengths of group members. Initally, Colasanti and Trujillo were in different groups but began
Olson, Colasanti & Trujillo
4 - 286 PME30 — 2006
collaborating after Trujillo accepted a mathematics position in the elementary school in which Colasanti had accepted a fifth grade teaching position. During the second week of the rational number course (field notes, June 15, 2004), Olson asked the teachers to draw a picture to represent 8 ÷ 2. Two thirds of the teachers drew a picture of eight objects circles around the two groups of four objects. Colasanti explained, “I drew eight objects and put them into two groups.” Trujillo responded, “That is really neat! I drew eight objects and put two in each group. The answers are the same, four, but what we did was really different.” The teachers in the class began to recognize that unless students are asked to show and explain their thinking, “we may make incorrect assumptions about their mathematical thinking.” This discussion prompted all the teachers in the class to reconsider their implicit conceptions that if students arrived at the same answer then their visualization were also the same. While all of the teachers recognized that different solution strategies often lead to the same correct answer, they had never considered that the way students visualize problems may also differ. Articulating this implicit conception led the teachers to consider how students’ images of mathematical ideas may differ and influence the meaning attached to symbols. Olson further challenged the teachers by asking them to represent 4 ÷ 1/3 using both interpretations and 3/8 ÷ 3. The group with Colasanti and Trujillo quickly drew four circles, partitioned each one into thirds, and then counted the number of thirds. To create the measurement model, almost all of the teachers in the class needed a problem context. One elementary teacher conceptualized division using the measurement model and posed the following problem. “Suppose you have four cups (drew four circles on the board) and this is only one third of a jug (drew an oval around the cups). How many cups would be in the jug?” Colasanti immediately responded, “There would be 12. So division is really just multiplying… oh, I see why you invert and multiply.” Colasanti and the other teachers experienced cognitive dissonance as they struggled to model division of fractions by constructing a unit from a part. They recognized that teaching students algorithms may help them get the right answer. But, unless students understood how the algorithm reflected problem solving situation, they would not be able to apply the algorithm in a problem context. The teachers’ experience of conceptualizing 4 ÷ 1/3 using only the partitive model encouraged them to reconsider their own conceptual understanding of division. The process of using cognitive dissonance to reflect on previous experiences and to articulate implicit assumptions mathematical understanding enabled Colasanti and Trujillo to reconsider their notions about teaching and learning mathematics. Colasanti and Trujillo and continued to collaborate in their elementary school through informal meetings. The focus of these meetings was to discuss “how we were going to implement [teach] specific concepts in our classrooms” (reflection, December 30, 2005). Trujillo noted that “when the students did not have a strong enough foundation to start where the book was, we examined the state standards to extract what concepts needed to be understood. From there we pulled from our own
Olson, Colasanti & Trujillo
PME30 — 2006 4 - 287
resources and discussed our plan with our math coaches.” The two district math coaches encouraged Colasanti and Trujillo to consider “why we decided to teach things a certain way” (reflections, January 2, 2006). This built Colasanti and Trujillo self-confidence to use their own knowledge, experiences, and resources to find answers to difficult questions. At times, Colasanti and Trujillo reported that their principal sat in on these meetings. During their second year teaching (2005-2006), the principal began to refer to them questions about mathematics and the staff viewed them as mathematics resources (interview, November 28, 2005). In summary, cognitive dissonance led Colasanti and Trujillo to transformative change when they reflected on their emotional responses, prior experiences, and new experiences. We suggest that this process of reflection can help teachers articulate their implicit conceptions and that this articulation is critical to support change that is transformative. We also suggest that as teachers experience transformative change their self-efficacy also changes, thus, positioning teachers to assume new leadership roles in their school.
IMPLICATIONS In conclusion, this study suggests that creating opportunities for teachers to examine their implicit conceptions about teaching and learning mathematics can be accomplished through cognitive dissonance. We describe this process as making the implicit explicit and theorize that not only does this process support reflection but it also can lead to increased self-confidence. Beswick (2005) suggested that new learning experiences can develop a different kind understanding with robust evidence. We found that cognitive dissonance may create emotional and experiential evidence that can be articulated and analysed to make implicit conceptions explicit. This process may be a mechanism that stimulates a belief-system change. Describing this process in which cognitive dissonance is used to uncover conceptions about teaching and learning mathematics may help teacher educators monitor the process of reflection and help them phase questions that promote growth. Additional research is needed to examine whether this process is effective with secondary and elementary teachers who participate in grade level professional development outside university courses. Longitudinal research is also needed to investigate experiences that support early-career teachers to assume leadership roles in their schools.
References Ball, D., & Bass, H. (2000). Interweaving content and pedagogy in teaching and learning to
teach: Know and using mathematics. In J. Boaler (Ed.), Multiple perspectives on mathematics teaching and learning (pp. 83-104). Westport, CT: Ablex.
Beswick, K. (2005) Preservice teachers’ understanding of relational and instrumental understanding. In H. L. Chick & J. L. Vincent (Eds.), Proc. 29th Conf. of the Int. Group for the Psychology of Mathematics Education (Vol. 2, pp. 161-168). Melbourne: PME.
Blumer, H. (1969). Symbolic interactionism. Englewood Cliffs, NJ: Prentice Hall.
Olson, Colasanti & Trujillo
4 - 288 PME30 — 2006
English, L. & Watters, J. (2005). Mathematical modeling with 9-year-olds. In H. L. Chick & J. L. Vincent (Eds.), Proc. 29th Conf. of the Int. Group for the Psychology of Mathematics Education (Vol. 2, pp. 297-304). Melbourne: PME.
Lamon, S. (1999). Teaching fractions and ratios for understanding. Mahaw, NJ: Lawrence Erlbaum.
Leu, Y. & Wu, C. (2005). Investigation on an elementary teacher’s mathematics pedagogical values through her approach to students’ errors. In H. L. Chick & J. L. Vincent (Eds.), Proc. 29th Conf. of the Int. Group for the Psychology of Mathematics Education (Vol. 3, pp. 249-256). Melbourne: PME.
Lo, J. (2004). Prospective elementary school teachers’ solutions strategies and reasoning for a missing value proportion task. In M. J. Høines & A. B. Fuglestad (Eds.), Proc. 28th Conf. of the Int. Group for the Psychology of Mathematics Education (Vol. 3, pp. 265-272). Bergen, Norway: PME.
National Council of Teachers of Mathematics (1991). Professional standards for teaching mathematics. Reston, VA: NCTM.
Olson, J. C., & Kirtley, K. (2005). The transformation of a secondary mathematics teacher: From a reform listener into a believer. In H. L. Chick & J. L. Vincent (Eds.), Proc. 29th Conf. of the Int. Group for the Psychology of Mathematics Education (Vol. 4, pp. 25-32). Melbourne: PME.
Olson, J. C., Chiado, W., Sala, S., & Kirtley, K. (2005). Formal, informal, and implicit experiences that support teachers to enact new beliefs. Paper presentation at the Northern Rocky Mountain Educational Research Association conference. Jackson Hole, WY.
Southwell, B. & Penglase, M. (2005). Mathematical knowledge of pre-service primary teachers. In H. L. Chick & J. L. Vincent (Eds.), Proc. 29th Conf. of the Int. Group for the Psychology of Mathematics Education (Vol. 4, pp. 209 – 216). Melbourne: PME.
Steigler, J. & Hiebert, J. (1999). The teaching gap. NY: Free Press. Taylor, E. (2001). Transformative learning theory: A neurobiological perspective of the role
of emotions and unconscious ways of knowing. International Journal of Lifelong Education, 20(3), 218-236.
2006. In Novotná, J., Moraová, H., Krátká, M. & Stehlíková, N. (Eds.). Proceedings 30th Conference of the International Group for the Psychology of Mathematics Education, Vol. 4, pp. 289-296. Prague: PME. 4 - 289
METACOGNITION AND READING – CRITERIA FOR COMPREHENSION OF MATHEMATICS TEXTS
Magnus Österholm Department of Mathematics, Linköping University, Sweden
This study uses categories of comprehension criteria to examine students’ reasons for stating that they do, or do not, understand a given mathematics text. Nine student teachers were individually interviewed, where they read a text and commented on their comprehension, in particular, why they felt they did, or did not, understand the text. The students had some difficulties commenting on their comprehension in this manner, something that can be due to that much of comprehension monitoring, when criteria for comprehension are used, might be operating at an unconscious cognitive level. Some specific aspects of mathematics texts are examined, such as the symbolic language and conceptual and procedural understanding.
INTRODUCTION Problem solving is of course a major aspect of mathematics and mathematics education research. Also when discussing reading, this seems often to be done in relation to problem solving (Hubbard, 1990), for example, by examining word problems (Hershkovitz & Nesher, 2001) or when studying symbolic expressions (Ferrari & Giraudi, 2001). However, in this paper, reading comprehension is studied in the context of reading a text for learning, using texts that describe and try to explain something to the reader, where no specific task to solve is given. Some of my previous research studies (Österholm, 2004, in press) have focused on the creation of a mental representation when reading mathematics texts, that is, on how the reader understands a text. An open question in these studies is to what extent the reader believes that the text is understood – a metacognitive aspect. My previous studies have used a specific “measure” of comprehension, which may rely on criteria for comprehension that do not need to agree with what the reader views as important when understanding (mathematics) texts. Thus, different criteria might be used to decide if a text has been understood. This is a methodological problem when trying to investigate comprehension monitoring ability (Glenberg & Epstein, 1985). This paper reports on an exploratory empirical study about what kind of criteria for comprehension university students use when reading mathematics texts.
METACOGNITION AND READING COMPREHENSION There are different parts of metacognition, for example, knowledge about cognition and self-regulation (Brown, 1985; Schoenfeld, 1987). Comprehension monitoring is included in self-regulation and consists of two parts, evaluating comprehension using some kind of criterion and “repairing” lack of comprehension using some type of strategy (Baker, 1985).
Österholm
4 - 290 PME30 — 2006
Comprehension monitoring There exist several different methods for examining comprehension monitoring, some of which do not separate the use of criteria and strategies (see Ling, 2000). But there are some results that show a general weakness in evaluating one’s own comprehension, for example, that students “seem not to gain information concerning the actual memorial consequences of their study behavior until they are tested on the material” (Pressley & Ghatala, 1990, p. 23), which is sometimes called the test effect. While there is some debate over the methods used in this type of research (Ling, 2000), some results can be explained by the domain familiarity hypothesis, according to which the evaluation of comprehension can be “based on these general beliefs [about the level of one’s knowledge in a specific domain], rather than on experience with the particular texts” (Glenberg & Epstein, 1987, p. 90). It has also been noted that much of comprehension monitoring and self-regulation seems to occur at an unconscious level (Brown, 1985; Fitzsimons & Bargh, 2004), which could explain some results showing poor monitoring, since some research methods rely on students’ awareness of their own comprehension. Criteria for comprehension Baker (1985) gives a comprehensive description of possible criteria for reading comprehension, here presented in abbreviated form, and somewhat reformulated, with a label for each criterion together with a description of what this criterion focuses on:
Lexical Individual words Syntactic Grammar Semantic criteria:
Propositional Integration of ideas in text (e.g., when one part of the text refers to another part)
Structural Thematic compatibility of ideas in text (e.g., if a part of the text fits with the main theme of the text)
External Consistency with prior knowledge Internal Consistency of ideas in text
(e.g., that two parts of the text are not contradicting each other) Clarity Necessary information to achieve a specific goal
A person’s epistemological beliefs seem to be a natural source for comprehension criteria, and for metacognitive processes in general (Hofer, 2004). However, in this paper, criteria are taken for granted as existing, how they are created and how they evolve will not be discussed.
PURPOSE The purpose of this study can be divided into three main parts. However, since this is my first study that has a metacognitive approach to reading comprehension for
Österholm
PME30 — 2006 4 - 291
mathematics texts, all three parts are of an exploratory type, where a purpose is to generate questions and hypotheses about the studied phenomena, which are planned to be studied in more detail in future studies. Firstly, due to what has previously been discussed about to what extent processes of metacognition can be unconscious, one purpose of this study is to see how much students are able to describe parts of their comprehension processes, that is, to describe why they regard themselves as understanding a text or not. Secondly, the types of criteria given by Baker (1985) will be used and tested as a tool for characterizing students’ criteria for comprehension. In particular, since Baker’s criteria are general in nature, it is of interest to see whether there is a need to describe more specific criteria for mathematics texts, for example, about symbolic expressions and algorithmic/procedural aspects. Finally, one purpose is to investigate similarities and differences between criteria used in different situations: When focusing on macro- or microstructures in the text (i.e., larger or smaller parts of the text), when reading different types of texts, and when focusing on symbolic or natural language.
METHOD Nine student teachers voluntarily participated in this study, where they individually read one or two texts and orally commented on their comprehension. The students were studying to become mathematics teachers for the Swedish upper secondary level, and had studied some mathematics courses at the university level (in algebra, geometry, and analysis). The texts, which are more thoroughly described later, describe something that was new to the students. This procedure was part of a larger data collecting session with other activities (reading other types of texts and answering questions), therefore, some students read only one text while others read two different texts. But the activities when reading the texts where the same: The student read the whole text and then commented on their comprehension, then the text was divided into sections that were shown in order one by one to the student, where their comprehension was commented on after each section (comments about macrostructure). Finally, a few single statements from the text were given one by one, and the students’ comprehension was commented on once again, after each statement (comments about microstructure). When commenting on their compre-hension, the students got to decide to what extent they had understood the text in question, and were then asked to explain and give reasons for why they felt that they had or had not understood (some part of) the text. The conversations with the students were audio recorded and transcribed. The transcripts were analysed by noting where comments were made about reasons for (lack of) comprehension, and these comments were then categorized using Baker’s (1985) types of criteria. At this moment, no testing of reliability of the coding process has been performed. Also, it should be noted that this methodology does not directly examine the criteria that actually have been used when reading the texts, but implicitly gives criteria from the way students talk about their comprehension.
Österholm
4 - 292 PME30 — 2006
The texts Two different texts were used in this study, one describing basic concepts of group theory (mathematical system and group) and the other describing Newton-Raphson’s method for numerically solving equations. Neither text takes up more than one page. The text about group theory can be said to focus on conceptual understanding, while the text about Newton-Raphson presents a sort of algorithm, and can be said to focus more on procedural understanding (at least when compared to the other text). For the text about group theory, a total of 13 occasions occurred when the reader was prompted to comment on their comprehension (for the whole text, six sections, and six statements). Twelve occasions occurred for the text about Newton-Raphson (the whole text, seven sections, and four statements). Three students read both texts (starting with the text about group theory), three read only the text about group theory, and three read only the text about Newton-Raphson.
RESULTS When asked to give motives for their judgments of their comprehension, the students sometimes simply pointed to a smaller part of the text, stating that this part was (not) understood, but did not give any motive for this statement. Also, sometimes the students seemed somewhat uncomfortable with the situation, when asked for motives for their judgments of their comprehension. Therefore, this question was not repeated as often as planned, instead the students could sometimes more freely comment about their comprehension of the text. To locate statements that refer to motives for (lack of) comprehension among students’ comments were not experienced as problematic, but to categorize a specific statement was sometimes difficult. One reason for this is that when giving comments about why they did (not) understand, these were sometimes of a much general nature, for example, that the symbols in the text made it more difficult to understand or that the text was easy to understand because they had studied mathematics courses at the university and were familiar with the type of language. Such comments could fit many different types of criteria, since they do not refer to any specific content (i.e., meaning) of the text, which makes these types of comments seem compatible with the domain familiarity hypothesis. Examples of students’ comments The following is an excerpt from the text about Newton-Raphson (originally in Swedish, but translated for this paper):
If 0)(' 1xf , then the tangent intersects the x-axis in a specific point. As the next approximation x2 we choose the x-coordinate of the intersection point. See picture: [picture omitted due to space limitations] We can determine x2 by letting x = x2 and y = 0 in the tangent’s equation. This gives the formula
)(')(
1
112 xf
xfxx .
Österholm
PME30 — 2006 4 - 293
The first part of this excerpt, up to and including the picture, is section 4 of the text, and the remaining is section 5. The first sentence of the excerpt is statement 1, used when presenting single statements from the text to the students. Table 1 shows some examples of students’ motives for (not) understanding some part of the given excerpt.
General aspects Although it was not a purpose of this study, the connection between students’ beliefs and criteria for comprehension sometimes became evident. Some students continuously claimed to in principle understand everything read, but clearly had some difficulties to grasp the contents of the texts. These students said that they regarded learning by reading as virtually impossible in mathematics, and that one needs to do some calculations in order to understand. Their beliefs thus made them use somewhat superficial criteria for reading comprehension, and they felt that they had understood the text, but in some sense not the content of the text (i.e., the mathematics described). Other students did not reject the possibility of learning mathematics by reading, but regarded it as quite difficult, often using the criterion for comprehension that one should be able to use the text (to do some calculations on what the text is about). Therefore, they often commented on the need for concrete examples of “how to do”, something that corresponds to the criterion of clarity (see example in Table 1). Student Text Criterion Student’s comment A Section 4 Clarity Difficult to see how to do the
calculations A, B Section 5 Clarity Now I understand what to do C Section 5 Propositional It was the one shown before [about
the tangent’s equation] C Section 5 External Or is this something I should know A, C, D Statement 1 Propositional [Argumentation that it is true]
Table 1: Examples of categorization of students’ comments.
Comparisons Table 2 shows that there are no clear differences between students’ comments about macro- and microstructures in the texts, but that some differences exist between comments about the two different texts, where the external criterion is more frequently used for the text about group theory and the clarity criterion is more frequently used for the text about Newton-Raphson. Since different persons have read different texts, this could be due to that different students mainly use different criteria. Only the external criterion shows the same pattern when looking at the three students who read both texts. However, the small number of comments makes it generally difficult to analyse one particular criterion for individual persons. When comparing comments about symbolic expressions and sentences expressed in natural language, some qualitative differences and similarities emerge. The following
Österholm
4 - 294 PME30 — 2006
is an excerpt from the text about group theory, and was one of the single statements given to students to comment on (originally in Swedish, but translated for this paper):
The set of all whole numbers together with addition is a group
Several students understood this statement by “accepting it”, without commenting on the including concepts and the relations between them. I would argue that this corresponds to a type of syntactic criterion, since only the statement’s grammatical structure is taken into account, that the statement “makes sense”. This can be compared with a purely symbolic statement, which was part of the text about Newton-Raphson and also given as a single statement to comment on:
))((')( 111 xxxfxfy
Most of the students wanted to know what the symbols “stand for” for comprehension (a type of lexical criterion), often that a specific function and specific points (x and x1) needed to be known in order to understand this expression. Nobody ever “accepted” this relationship; they always requested a context in order to understand, in which it was possible to do the calculations given in the formula. However, some students were satisfied with that the calculations could be done if one knew the function and the points, but all focused on the knowledge of how to do the calculations as a criterion for comprehension, which is somewhat similar to the criterion for the single statement in natural language, since it focuses on the grammar of the expression (i.e., that it “makes sense” and can be calculated).
CONCLUSIONS In general, the students seem to have difficulties in articulating their motives for feeling that they have understood a text, or not. Perhaps this difficulty makes them often comment on the meaning of individual words (which is done about one third of the time), since this could be seen as a common cause for difficulty when reading. The cause for their difficulties could be that most of the monitoring activity takes
Table 2: Distribution (in each column) of number of occasions among all students that a criterion has been used.
Österholm
PME30 — 2006 4 - 295
place at an unconscious level, that the use of some comprehension criteria has been cognitively automatized.
The major problem in this study seemed to be the collection of data, to get the students to comment on their comprehension. However, Baker’s (1985) criteria for comprehension, which were originally not created as a tool for categorizing empirical data, could be necessary to refine in order to make them more easily usable in empirical analyses, especially when using them for mathematics texts. For example, Baker (1985, p. 165) refers to the clarity criterion as a “residual, encompassing dimensions that cannot be subsumed under any of the other headings”, but this criterion seems quite useful, and commonly used, for mathematics texts, perhaps especially symbolic parts of texts and texts focusing on algorithmic and procedural understanding. Also, these criteria have not been created based on mathematics, and therefore these should be related to some specific theories about comprehension in mathematics, which in itself is a complex concept (see Sierpinska, 1994).
No clear differences were found between criteria used for macro- and microstructures in the texts, but some differences were found between the two texts. Is this showing an adaptive behaviour among readers, when using different types of criteria for different types of texts, and is this done consciously or at a more unconscious level? This should be examined in more detail. The clearest difference between the texts was that the external criterion was much used for the “conceptual text” (about group theory) but hardly ever for the “procedural text” (about Newton-Raphson). However, it is unclear whether this is due to the conceptual and procedural aspects of the texts.
When comparing criteria used for statements in natural and symbolic language, there exist both similarities (using a sort of syntactical criterion) and differences (accepting statements or not). However, since the syntactical criterion is used quite differently, in a conceptual manner for natural language and in a procedural manner for the symbolic statement, it seems necessary to refine or elucidate the categories of criteria, especially when using them for mathematics texts.
References
Baker, L. (1985). How do we know when we don’t understand? Standards for evaluating text comprehension. In D. L. Forrest-Pressley, G. E. MacKinnon, & T. G. Waller (Eds.). Metacognition, Cognition, and Human Performance (Vol. 1, pp. 155-205). Orlando, FL: Academic Press.
Brown, A. L. (1985). Metacognition: The development of selective attention strategies for learning from texts. In H. Singer & R. B. Ruddell (Eds.). Theoretical Models and Processes of Reading (3. ed, pp. 501-526). Newark: International Reading Association.
Ferrari, P. L. & Giraudi, C. (2001). Interpreting symbolic statements as texts: An exploratory study. In M. van den Heuvel-Panhuizen (Ed.). Proc. 25th Conf. of the Int. Group for the Psychology of Mathematics Education (Vol. 2, pp. 409-416). Utrecht: Freudenthal Institute.
Österholm
4 - 296 PME30 — 2006
Fitzsimons, G. M. & Bargh, J. A. (2004). Automatic self-regulation. In R. F. Baumeister & K. D. Vohs (Eds.). Handbook of Self-regulation: Research, Theory, and Applications (pp. 151-170). New York: Guilford Press.
Glenberg, A. M. & Epstein, W. (1985). Calibration of comprehension. Journal of Experimental Psychology: Learning, Memory, and Cognition, 11(4), 702-718.
Glenberg, A. M. & Epstein, W. (1987). Inexpert calibration of comprehension. Memory & Cognition, 15(1), 84-93.
Hershkovitz, S. & Nesher, P. (2001). Pathway between text and solution of word problems. In M. van den Heuvel-Panhuizen (Ed.). Proc. 25th Conf. of the Int. Group for the Psychology of Mathematics Education (Vol. 3, pp. 145-152). Utrecht: Freudenthal Institute.
Hofer, B. K. (2004). Epistemological understanding as a metacognitive process: Thinking aloud during online searching. Educational Psychologist, 39(1), 43-55.
Hubbard, R. (1990). Teaching mathematics reading and study skills. International Journal of Mathematical Education in Science and Technology, 21, 265-269.
Ling, F. (2000). Techniques for assessing comprehension monitoring. Post-Script, 1(1). Retrieved January 6, 2006, from http://www.edfac.unimelb.edu.au/student/insight/postscriptfiles/vol1/vol1_1_ling.pdf
Pressley, M. & Ghatala, E. S. (1990). Self-regulated learning: Monitoring learning from text. Educational Psychologist, 25(1), 19-33.
Schoenfeld, A. H. (1987). What’s all the fuss about metacognition? In A. H. Schoenfeld (Ed.). Cognitive Science and Mathematics Education (pp. 189-215). Hillsdale, N.J.: Erlbaum.
Sierpinska, A. (1994). Understanding in Mathematics. London: Falmer Press. Österholm, M. (2004). Reading Mathematical Texts: Cognitive Processes and Mental
Representations. Presented in Discussion Group 14 at ICME-10, Copenhagen, Denmark, 4-11 July 2004. Retrieved January 3, 2006, from http://www.mai.liu.se/~maost/forskning2.pdf
Österholm, M. (in press). Characterizing reading comprehension of mathematical texts. Educational Studies in Mathematics.
2006. In Novotná, J., Moraová, H., Krátká, M. & Stehlíková, N. (Eds.). Proceedings 30th Conference of the International Group for the Psychology of Mathematics Education, Vol. 4, pp. 297-304. Prague: PME. 4 - 297
CLASSIFICATION ACTIVITIES AND DEFINITION CONSTRUCTION AT THE ELEMENTARY LEVEL
Cécile Ouvrier-Buffet Paris 7 – Didirem – France
The French curricula strongly recommend activities involving tasks of comparison, reproduction, description, construction and representation in plane as well as three-dimensional geometry. There are now no specific guidelines concerning “classification’s activities” regarding geometry. However, those are the very activities which lead pupils to explore a concept and then to identify mathematical properties useful for the characterization of objects of a given class. My epistemological aim is to propose a new point of view on the classification activities, that of the construction of definitions. The didactical implications of this perspective concern both the identification of classification processes through definition construction and the characterization of the guidance of such activities. During an inaugural conference of “MATh.en.JEANS” (1992), the mathematician Berger talked about “convex things” as if they were human beings, in the following terms:
A “convex” is a person who is shaped in such a way that every time we take two points inside him any segment which joins them is inside.
You have here in front of you something which is clearly not convex. If you are keen on fractals, then forget it because “the convex” is definitely non-fractal. Convexity has a sort of security, control function: it guarantees that you have no hole, no hollow, and no warped line.
Let me focus on the above presentation of the concept of “convexity”. It combines several features concerning the definition of “convex”: an example and a counter-example are given in order to illustrate the mathematical definition, along with a morphological description of what is a convex figure. It is noteworthy that the “convex” concept can be grasped through four complementary and necessary ways: a definition couched in mathematical language, the illustration of the delimitation between convex figures and non-convex figures by an example and a counter-example (it will lead us to the etymological meaning of the word “definition”, that is to say “delimitation”), a geometrical representation of the purpose and, in the end, a definition in common language. In order to achieve the full understanding of the current concept, we would still have to characterize a set of situations in which the concept of “convex” appears relevant and necessary (in Vergnaud’s 1991 perspective of conceptual fields).
Ouvrier-Buffet
4 - 298 PME30 — 2006
Through this example, I would like to underline the existing link between classifying process and defining process. To establish two classes amounts actually to delimitate a concept through what it is and what it is not. In this report, I shall consider a classification situation involving the difficult concept of “convexity” and analyze it through definitions construction. The results of an experiment, conducted at elementary school level with 10 year-old pupils, will be presented.
CLASSIFICATION AND DEFINITION CONSTRUCTION PROCESSES How classification and definitions link up There are two ways in which a definition can trap us. Firstly, we can delude ourselves into thinking that what can be easily expounded can be easily assimilated. Secondly, we can put too much trust in definitions because the latter are the result of a choice and thus show only one aspect of the concept. This is precisely what happens when a definition is presently axiomatically to a student.
Considering definitions as markers of the concept formation process gone through by the learner opens up a research avenue. In my introduction, I have underlined, the strong existing link between classifying and defining. I would also like to emphasize the importance of generalization and denomination processes in classifying. According to Hacking (1993), classifications and generalisations have to be linked. To use a name for one species amounts to producing generalisations and anticipations concerning the individual belonging to that species. Thus, using a common name to classify amounts to involve it in a projection process.
The prime importance of grasping characteristics of geometrical objects, during classification tasks, has been noticed by Freudenthal (1973) and Fletcher (1964). I shall take into account this view and propose a new reading of classifications tasks through definitions construction. Let me first recall the most common conceptions of the concept of definition in mathematics.
Commonly held views about mathematical definitions Several researches have explored teachers’ conceptions relating to the concept of “definition” (Borasi 1992, Ouvrier-Buffet 2003a, Shir 2005). For instance, Zaslavsky and Shir underline that the features of a definition are commonly accepted as crucial:
The imperative features relate to the following requirements: a mathematical definition must be non-contradicting (i.e., all conditions of a definition should co-exist), and unambiguous (i.e., its meaning should be uniquely interpreted). In addition, there are some features of a mathematical definition that are imperative only when applicable: A mathematical definition must be invariant under change of representation; and it should also be hierarchical, that is, it should be based on basic or previously defined concepts, in a non-circular manner (Zaslavsky & Shir, 2005, p.319)
More generally, I notice the following features: for teachers, at elementary and secondary levels,
Ouvrier-Buffet
PME30 — 2006 4 - 299
a definition should be minimal, non redundant (this is closely linked to a classical logical aspect: a mathematical theory has to be « well-formed » and a definition consists in a necessary and sufficient characterization of a concept). This is, in fact, a well-known conception: a definition should be useful and should have a specific place in proofs;
to define is to give a name. Let me notice that the feature « denomination » is very present in teachers’ discourses. However, to study definitions construction processes implies to reduce the place of the naming process, because the characterization of the concept itself comes first (I will come back on this fact below);
a definition should state the existence (and also the essence) of a mathematical concept, in accordance to the Platonician view which maintains that a concept pre-exists to its definition;
several linguistic features appear also, such as the following criteria: a definition should be precise, short, elegant, familiar and … universal;
and, it is crystal clear that the way teachers spell out their exigencies about mathematical definitions is connected to teaching and learning: they actually underline that a definition should be based on anterior knowledge and should allow students to create their own mental image of a concept.
The question is now: how can we use these conceptions about the definition in order to design and manage classifications activities? Let me propose an exemplification.
A SITUATION ON “CONVEXITY” The situation The pupils (10 year old) have at their disposal physical objects, consisting in pieces of cardboard. It allows a manipulation of the objects. The geometrical figures are also given on a sheet (see figures below). The task is the following: “make two classes”.
Figure 1: convex and non-convex figures, given to pupils.
Ouvrier-Buffet
4 - 300 PME30 — 2006
The methodology Five groups of 3-4 pupils took part into the activity. Concerning the progress of this activity, a MO (Manager Observer) has a specific place: his aim consists in orienting pupils’ research to the construction of a definition of “convex”, starting from classes produced by pupils. It implies that the MO has to use a particular command that is: the explicit demand of definition. In this perspective, he has to be particularly aware of the conceptions of definitions I have presented above. A priori analysis The concept at stake is “convex”. According to Fletcher (1964), several definitions are conceivable, such as:
Definition 1: a figure is convex if and even if, two points P and Q being given, all the points of the segment PQ belong to the figure.
Definition 2: a figure is convex if and even if every straight line passing by any point included crosses the boundary in exactly two points.
Definition 3: a figure is convex if and even if from each point of its boundary it passes at least one line of support.
Let me notice that a dynamical definition, similar to definition 3, can be stated, in common language: roaming the boundary of the figure, the whole figure is always at the “same side” (a direction for the roam being chosen). This kind of provisional definition should be evolved if logical and linguistic arguments are mobilized for instance (see Ouvrier-Buffet, 2003b).
Definition 4: a figure is convex if and even if to each external point P to the figure corresponds one and only one point of the figure the nearest of P.
I have chosen the figures for the classification task according to the two following constraints. There is at most one figure with curve and non-curve lines in order to exclude a classification in accordance to “curve lines and non-curve lines” property from pupils’ arguments. Quadrilaterals and other geometrical figures very institutionalized were outlawed in order to bypass pre-established classifications and definitions. Steering a classification situation towards definition construction In our perspective, it is necessary for the management to focus on the definition construction process, as a transversal competence and not as a final product. An epistemological study of the concept of definition (Ouvrier-Buffet, 2003a&b, 2006) – a study which I can’t report completely here – leads me to characterize some guiding styles acting on a definition construction process. Such a process is based on four poles, in relation with the kind of the considered situations. One of these poles concerns the construction of a theory (that does not concern us at the elementary level), another deals with heuristics and problem situations (that includes a specific work on examples and counter-examples), and the two other poles concern the logical as well as the linguistic aspects.
Ouvrier-Buffet
PME30 — 2006 4 - 301
The MO can then manage pupils’ progression, bearing in mind these several guidance elements. For instance, he can act taking into account that a definition is a specific statement: the MO may then formulate demands concerning logical and linguistic aspects of the current definition. The MO can also demand explicitly to pupils to generate examples and counter-examples. The latter give the opportunity to pupils to come back on the definition they are constructing. It is worth stressing that the project on examples and counter-examples is not easy to implement at the elementary level. However, this heuristic approach is essential during a definition construction process. I underline thus the crucial dimension of working on examples and counter-examples in order to test a definition in particular, and in order to promote a scientific process in general. Moreover, to take on board a relevant remark made by a pupil is a classical didactic guidance. Such a move assumes a major importance in the definition construction process: it sustains the devolution (in Brousseau’s 1997 sense) of the definition construction process. We consider the devolution process to be active throughout the experiment thus avoiding the reduction of devolution to the terms of the problem itself and to the production of basic strategies (Brousseau, 1997 & Margolinas, 1993). If such a move is noteworthy, the one which consists in referring back the pupil to the prescribed task (writing a definition) is just as important.
PUPILS’ STATEMENTS Classes produced by pupils The experiment described below was realized by the pupils only with cardboard figures. We can group theses several classifications into three categories: morphological, mathematical and tiling. I mean by morphological every classifications involving physical descriptions of the manipulated forms. In every pupils’ group, the two following classes appear:
rounded / non-rounded: in one group, this classification leads pupils to construct orally the definition of a figure which is “more rounded than another one”, mobilizing then considerations about the length of a curve and the area of a form;
pointed / non-pointed. I call mathematical the classifications mobilizing explicit anterior geometrical knowledge. The pupils explain four different mathematical classifications:
figures having an axis of symmetry or not; polygon / non-polygon; figures having diagonals or not; figures having at most one angle and the others.
The category tiling corresponds to pupils’ manipulations when they produced some kinds of “tangram puzzles”. Pupils talked about figures which couple together or not.
Ouvrier-Buffet
4 - 302 PME30 — 2006
They consider this classification as anecdotal and the vocabulary they use them laugh (the word “accoupler” has sexual connotations in French).
A group’s progress: the definitions produced In this paragraph, I chose to focus on the way one group of pupils construct definitions. I shall underline in particular the pupils’ conceptions on the concept of definition and the guidance of the process. This group has proposed successively three classifications:
the figures having an axis of symmetry or not; the figures having at most one angle; and a classification very close to the concept of “convex” such as the
following excerpt: When one connects the corners, the edges, it is interior or exterior.
This last classification leads pupils to elaborate two other classes, two figures being still unclassed (C2 – the holed piece – and C5 – the piece mixing straight curves and non-straight line). At this moment, pupils recall the instruction:
It is not good because three columns are necessary and we have to make two classes.
The interventions of the MO felt into three distinct stages. Firstly, the MO recalls the instruction, that is to say recalls that we want to obtain two classes, then, pupils have to resolve the problem of C2 and C5. Secondly, the MO gives the name “convex”: this is connected to a philosophical view of definitions (i.e. to give a name before to characterize, in order to know what is about). Thirdly, the MO asks for a written definition of “convex”.
The pupils were quick to react, they looked up for the words in the dictionary which gave us a chance to point out that the way they relate to mathematical definitions is the same as the way they relate to lexical definitions, which does not apply to pupils in secondary schools. It becomes apparent then that the linguistic and logical levers can no longer be used. Moreover, pupils are content with one definition and the repeated questions of the MO are answered only because of the didactic contract. The MO can still use mathematical levers consisting in looking for characteristics of convexity: the explicit requests of examples and counter examples fall precisely within the latter category. The MO must be particularly alert to characteristic properties in terms of construction of definitions emerging in the pupils’ discourse.
Here are the successive definitions written by pupils: I am linking them to the MO’s interventions.
Pupils’ definition 1: “convex: figure with points which connect on the inside”.
"point" is crossed and replaced by "angles" and then by "angles and round shapes". MO: what is the signification of “to connect a round shape”? Can you explain what a
round shape is?
Ouvrier-Buffet
PME30 — 2006 4 - 303
The MO asks then for an example and a counter-example of their first definition. Pupils’ definition 2: “regular (or irregular) figures connecting together on the inside”.
" irregular " is crossed. The MO asks then another definition, excluding the idea of “lines on the inside". The pupils give a suitable reply:
Pupils’ answer: When one connects the points, it is interior. One cannot see how we can that in another way.
However, I notice that two other definitions could have emerged: definition 2 and definition 3. Following on that demand, several definitions were written:
Pupils’ definition 3: “figure of whatever form, when we connect the two points, they are inside”.
Pupils’ definition 4: “convex: when we draw diagonals, it stays inside the figure”. Pupils’ definition 5: “convex: when we link up a point with another, the straight line
does not get out of the figure”.
The MO then asks the pupils not to consider the segment but straight lines with the potentialities of definition 2 (presented in the a priori analysis) in mind. The reader won’t be surprised by the pupils’ responses:
But we are getting out of the theme! If we draw a straight line on all figures, they can all be convex!,
which, of course no longer complies with the prescribed task i.e. to set up two classes.
CONCLUDING REMARKS There is a difference in nature between experiment about the definition constructions processes conducted at the primary level than and those conducted at the secondary level. Pupils at the elementary level have not yet a “culture” of mathematical definitions. This fact implies that the MO’s freedom of action is somewhat limited. He cannot explore the whole range of guiding styles allowing a dialectic between definition construction and concept formation. However, the conceptual wealth being offered by defining situations built on classification tasks is promising. This paper illustrates the guidance possibilities of such situations, underlining in particular the guiding styles active in the defining process. Such experiments should be conducted again so as to fine-tune their impact on grasping of new concept at the elementary school. References Borasi, R. (1992) Learning mathematics through inquiry. Heinemann, New Hampshire. Brousseau, G. (1997) Theory of Didactical Situations in Mathematics. Kluwer, Dordrecht. Fletcher T.J. (1964) Some lessons in Mathematics. Cambridge University Press.
Ouvrier-Buffet
4 - 304 PME30 — 2006
Freudenthal, H. (1973) Mathematics as an educational task. Reidel, Dordrecht. Hacking, I. (1993) Le plus pur nominalisme – l’énigme de Goodman. (Trad. R.Pouivet).
Editions de l’éclat. Lakatos, I. (1961) Essays in the logic of mathematical discovery. Thesis, Cambridge
(University Library). Margolinas, C. (1993) De l'importance du vrai et le faux dans la classe de mathématiques.
La Pensée Sauvage, Grenoble. MATH.EN.JEANS (1992) Combien méchant peut être un convexe ? Ou quel est le convexe
le moins rond ? MATh.en.JEANS au Palais de la Découverte, 167-172. Ed. MATh.en.JEANS, Paris. (Web available : http://www.mjc-andre.org/pages/amej/edition/actes/actespdf/92167172.pdf)
Ouvrier-Buffet, C. (2003a) Construction de définitions / construction de concept : vers une situation fondamentale pour la construction de définitions en mathématiques. Leibniz, Grenoble. (Web available: http://tel.ccsd.cnrs.fr/)
Ouvrier-Buffet, C. (2003b) Can the Aristotelian and Lakatosian Conceptions of Definition Constitute a Tool for the Analysis of a Definition Construction Process? Mediterranean Journal for Research in Mathematics Education, Vol2, n°2, 19-36.
Ouvrier-Buffet, C. (to appear) Exploring Mathematical Definition Construction Processes. Educational Studies in Mathematics.
Vergnaud, G. (1991) La théorie des champs conceptuels. Recherches en Didactique des Mathématiques, n°10/2.3, 133-169.
Zaslavsky, O. & Shir, K. (2005) Students' Conceptions of a Mathematical Definition. Journal for Research in Mathematics Education. Vol36, Issue 4, 317-346.
2006. In Novotná, J., Moraová, H., Krátká, M. & Stehlíková, N. (Eds.). Proceedings 30th Conference of the International Group for the Psychology of Mathematics Education, Vol. 4, pp. 305-312. Prague: PME. 4 - 305
ABSTRACTION, SCAFFOLDING AND EMERGENT GOALS Mehmet Fatih Ozmantar
University of Gaziantep, Turkey John Monaghan
University of Leeds, UK
This paper reports on the relation between the construction of mathematical knowledge and scaffolded discourse. We work within an operational model of ‘abstraction in context’ which views abstraction as a vertical reorganisation of previously constructed knowledge into new knowledge. We extend this model by considering human mediation, the functions of scaffolding interventions and emergent goals. We exemplify our arguments by considering verbal data from two students engaged in tasks concerned with the graphs of the absolute value of linear functions and discuss interrelations between human mediation, scaffolding interventions and emergent goals.
INTRODUCTION The term ‘abstraction’ has been largely influenced by empiricist accounts which treat abstraction as decontextualised higher-order knowledge involving generalisations achieved through the recognition of commonalties isolated in a large number of particular instances (see Ohlsson and Lehtinen (1997) for a critique). Many, of late, have found this view wanting and proposed alternative accounts which call attention to the importance of social and contextual factors (Noss & Hoyles, 1996; van Oers, 2001; Hershkowitz, Schwarz & Dreyfus, 2001). We focus on Hershkowitz et al.’s (ibid.) account (referred to as HSD hereafter) as it offers an operational model for an empirical investigation of the abstraction process.
HSD view abstraction as a vertical reorganisation of previously constructed mathematical knowledge structures into the new ones. Such reorganisation occurs in an activity through three epistemic actions: recognising, building-with and constructing. They argue that abstractions develop through three stages: (i) the need for a new structure, (ii) the construction of new structures by means of three epistemic actions and (iii) the consolidation of the newly constructed structures. HSD provide empirical evidence regarding the stages (i) and (ii) but merely assumes the importance of stage (iii). HSD call for further investigation into the validity of their model. To this aim we designed a study to subject HSD’s account of abstraction to empirical scrutiny and our findings extended this model in several dimensions.
Monaghan & Ozmantar (in press) make a small but important refinement to the HSD model of abstraction by viewing an abstraction as a consolidated construction that can be used to create new constructions. In this paper we focus on the construction stage and consider human mediation, scaffolding interventions and emergent goals. We briefly describe the study, present student verbal data with a commentary and discuss interrelationships.
Ozmantar & Monaghan
4 - 306 PME30 — 2006
THE STUDY The main study, of which this paper reports one aspect, set out to investigate the validity of HSD’s model with a particular focus on scaffolding and social interaction. Our focus on scaffolding stemmed from a realisation that interventions, from a knowledgeable agent (e.g. interviewer) providing students with purposeful help and regulate them towards the achievement of mathematical abstraction, are important (and often uncommented on) aspects of many studies including HSD’s (e.g. van Oers, 2001). The metaphor of scaffolding, coined by Wood et al. (1976), refers to sensitive and supportive interventions given to learners to achieve a particular level of competence not readily available to the learners’ unassisted efforts. Such interventions require a tutor’s actions to be ‘contingent’ (Wood, 1991) in supporting learners through cycles of monitoring and analysing their performance in relation to task’s demands and then assisting them depending on their progress (Scott, 1998). In the main study, we employed 20 Turkish (aged 17-18) students who worked on tasks concerned with the absolute value of linear functions. Students were selected from 134 on the basis of a diagnostic test. This test was designed to identify students who had the necessary knowledge to tackle the tasks but were not acquainted with the content. Of the students, 14 worked in pairs and 6 worked individually. Four pairs and three individuals were scaffolded in their work and the rest were not. All students worked on four tasks on four successive days without time limitation. Tasks 1, 2 and 4 were designed to allow students to construct a method(s) to sketch the graphs of, respectively, |f(x)|, f(|x|) and |f(|x|)|, given the linear graph of f(x). Task 3 was designed to give students the opportunity to consolidate their constructions in task 1 and 2. We present the verbal data of two students (H&S) working with a tutor/interviewer (the first author) who aimed to scaffold H&S’s work through a range of interventions, from asking for explanations to giving feedback, explanations and directions, if needed. H&S worked on task 4 which involved five open questions. Question 1 (Q1) asked to sketch the graph of f(x)=|(|x|-4)| and report on the patterns. Students were then asked, Q2, to compare the graphs of f(x)=x–4 and f(x)=|(|x|-4)|. Q3 presented graph of f(x)=x+3 and asked to use it in sketching the graph of |f(|x|)|. In Q4 four linear functions without equations were presented and students were asked to sketch the graphs of |f(|x|)| for each of these. Q5 asked students to explain how to obtain the graph of |f(|x|)| from the graph of an arbitrary linear function f(x).
VERBAL DATA For the first two questions H&S substituted values for x to accurately draw the graphs of f(x) and |f(|x|)|. They recognised symmetries in the W-shaped graph of |f(|x|)| for Q1 and commented on similarities and differences between the graphs of f(x) and |f(|x|)|. They moved on to question 3 and again substituted values for x to accurately draw the graphs of f(x) and |f(|x|)|, which was V-shaped. H&S then compared the two absolute valued graphs obtained in Q1 and Q3 in relation to the original linear graphs of f(x) by focusing on specific line segments, rays and symmetries:
Ozmantar & Monaghan
PME30 — 2006 4 - 307
133H: Look I think the first part [of f(x) at x>0] always remains the same… oh does it? 134S: Yes 135H: But in the first question there is (…) a line segment 136S: This graph is also symmetric in the y-axis. But I don’t know how it helps us! 137H: We know that the part of f(x) over the x-axis remains the same, right? 138S: Yes (…) and also (…) they are taken symmetrically in the x-axis. 139H: But wait! (…) it [graph of |f(|x|)| for question 3] doesn’t obey this rule… 140S: Yeah I know, there was a line segment in the first graph 141H: I don’t think we can ever understand how to use f(x) to draw the graph of |f(|x|)|. 142S: The first graph was something like W-shaped… but this graph is V-shaped. 143H: They are totally different! How can we speak in a general way? Even this
question made things worse rather than helping us. 144S: We’d better stick to substituting…we can answer the next question by
substituting.
Until this point the interviewer intentionally limited his assistance in order to observe how far H&S could progress on their own. The interviewer (having monitored that H&S had tried, and had given upon, to develop a method to sketch the graphs of |f(|x|)| and believing that they were losing confidence in their abilities) intervened and suggested that they return to the first question. He brought their earlier constructions of |f(x)| and f(|x|) to their attention and suggested that they keep these in mind.
165I: if you pay a closer attention to the equation… I mean look at the expression itself, [|f(|x|)|], it is a combination of these two [|f(x)| and f(|x|)]. Do you see that?
166H: Yes, that’s right (…) 167S: Yeah, this [|f(|x|)|] is a combination of f(|x|) and |f(x)| (…) 168I: Ok, let’s think about it and consider what you know. How can we use our
knowledge to obtain this graph [of |f(|x|)|]? 169S: Look it makes sense now (…) 170H: Yeah, I think it makes sense! If |f(|x|)| is a combination of f(|x|) and |f(x)|, can we
think about it like a computation with parentheses? 171I: Computation with parentheses? 172H: I mean for example when we are doing computations with some parentheses
like… let’s say for example, (7-(4+2)), then we follow a certain order… 173S: Right, I understood what you mean… we need to first deal with the parenthesis
inside of the expression, is that what you mean? 174H: Yeah, I think it is somehow similar, I can sense it but I am unable to clarify… 175S: I know what you mean but how could we determine the parenthesis in here? 176I: You both made an excellent point. OK, let’s think about it together! In the
expression of |f(|x|)|, can we think about the absolute value sign at the outside of the whole expression as larger parenthesis, which includes another one just inside.
Ozmantar & Monaghan
4 - 308 PME30 — 2006
Following 165I intervention, H proposed an analogy with arithmetic in relation to the expression of |f(|x|)|. But H&S were unclear as to how to “determine the parenthesis” (175S), for which the interviewer (176I) gave an explanation to which H reacted:
177H: Aha, I got it… I know what we will do. 178I: Could you please tell us? 179H: We can consider f(|x|) as if it was the smaller parenthesis! 180I: Smaller parenthesis? 181H: I mean it should be the first thing that we need to deal with 182S: Yeah, I agree… I think we should begin with the graph of f(|x|) and first draw it 183H: But what next? 184S: Then we can use the absolute value at the outside… in the similar way of doing
computations. 185H: But we will be drawing graphs! Can we really do this? 186S: I am not too sure if we can… but it sounds plausible… 187I: What you are doing here is not computation (…) but you are making an analogy
(…) and I see no problem with that… let’s draw the graph by considering what we’ve just talked about and then decide if it will work or not, huh?
In the above excerpts, H&S planned how to use the structures of |f(x)| and f(|x|) in sketching the graph of |f(|x|)|. The interviewer encouraged (187I) H&S to use these ideas in sketching the target graph, which they later successfully did, in two steps, through the successive application of their earlier constructions of f(|x|) and |f(x)| to the given graph of f(x). By doing so, H&S were enriched with a new method to view the graphs of |f(|x|)|, which we call the ‘two-step method’ that H explained as follows:
244H: when drawing f(|x|), part of f(x) at the positive x remains unchanged… then this part is taken symmetry in the y-axis and err and also part of f(x) at the negative x is cancelled. After that, we apply absolute value to this graph, and for this… negative values of y are taken symmetry in the x-axis and thus we obtain the graph of |f(|x|)|.
DISCUSSION It is clear from the excerpts that H&S constructed a new method unavailable to them before and that the interviewer assisted H&S in their construction. Closer inspection of student-interviewer interaction suggested that we focus further attention on three particular issues: human mediation, functions of interviewer interventions and emergent goals. We discuss these issues below under discrete headings but point out that they are interrelated. These considerations, we believe, extend the analytic power of the HSD model of abstraction with particular regard to the construction stage. Human mediation Vygotsky (1981) proposed that higher mental processes and human actions in general are mediated by technical and psychological tools and by other humans: “it is through the mediation of others…that the child undertakes activities. Absolutely everything in the behaviour of the child is merged and rooted in social relations” (cited in Ivic,
Ozmantar & Monaghan
PME30 — 2006 4 - 309
1989, p.429). We take it as given that the interviewer’s interventions mediated H&S’s construction of the ‘two-step method’; he acted as a knowledge artefact which the students made essential use of to produce their construction. H’s act of recognition, for example, “|f(|x|)| is a combination of f(|x|) and |f(x)|” (170H) was interviewer-mediated: it followed the interviewer’s prompt (165I) after which she exclaimed “it makes sense!” (170H). Here H’s utterance is not a simple repetition of the interviewer’s utterance of 165 as she used this in connecting the expression of |f(|x|)| with computational precedence (building-with) and even gave an example (172H). Thus, in H’s utterance, not only is the act of recognising but also the resulting building-with is mediated by the interviewer’s intervention in 165 and 168.
But what effect did this mediation have on H&S’s developing construction? One could argue that the interventions ‘facilitated’ H&S’s mathematical actions. However, our analysis suggests that these interventions brought about crucial transformations in H&S’s ways of seeing, talking and acting which went far beyond ‘mere’ facilitation. When H&S failed to develop a ‘better’ method than substitution (143H&144S), the interviewer intervened and brought the structures of |f(x)| and f(|x|) to the focus of their attention. Following the interviewer’s suggestion of considering |f(|x|)| as a combination of |f(x)| and f(|x|) (165I), a transformation is apparent in the students’ seeing (seeing “precedence of operations” in the expression |f(|x|)|; see 170H-175S), talking (talking about the graphs of f(|x|) and |f(x)| in |f(|x|)|; see 177H-186S) and acting (merging the graphs of f(|x|) and |f(x)| into a single graph; see 244H). The importance of these transformations resulting from the interviewer’s mediation can be better appreciated when we compare H&S’s earlier considerations of these graphs until 144 where they merely focused on the ostensible features of the graphs such as “line segments”, “parts” and “symmetries” (133H-144S) which did not lead H&S to construct a new method and in fact they eventually declared their intention to give up developing a method other than substitution (143S-144H).
But what functions did the interventions serve in leading to these transformations? We attend to this question in next section.
Functions of the interviewer interventions We focus on three functions of interventions that appear important in explaining these transformations: reducing uncertainty, direction of attention and regulation.
In the protocol excerpts, reducing the students’ uncertainty appears to be a crucial function of the interventions. During the construction process uncertainty seems to be inevitable as construction requires not only that students recognise and use available knowledge structures but also that they reorganise them, put them together and forge new connections amongst them. Furthermore, all of these actions need to be carried out in an ‘unfamiliar situation’ which increases learner uncertainty (see Wood, 1991). Indeed construction is the process through which students become familiar with the new structure, which presupposes students’ unfamiliarity with the to-be-constructed structure before construction. Students have no clear picture of the construction to be
Ozmantar & Monaghan
4 - 310 PME30 — 2006
formed (for otherwise it would already be constructed) so they confront uncertainty, albeit at varying degrees, when striving to construct something unfamiliar to them.
We can observe the influence of the interviewer interventions in the reduction of the students’ uncertainty during their progression towards the target construction. H&S’s uncertainty about the aptness of their proposals and explanations appeared during this task. For instance, following their suggested analogy to computational precedence (170H-174H), they were uncertain as to how to “determine the parenthesis” in the expression of |f(|x|)| (175S). They also expressed their uncertainty as to the aptness of approaching the graphs of |f(|x|)| through the successive application of f(|x|) and |f(x)| (185H&186S). The interviewer played a crucial role in handling H&S’s uncertainty when he intervened, for example in 187I, to give positive feedback (“I see no problem”), specified a target (“let’s draw the graph … and then decide”) and helped H&S to continue their work, which led them to construct the two-step method.
The second function of the interventions was directing the students’ attentions and efforts. The management of attention in collaborative learning environments is critically important during new learning (Barron, 2003; van Oers, 2001). Mason & Spence (1999) attribute a pivotal role to shifts in one’s attention in doing and learning mathematics and they argue that:
… coming to know is essentially a matter of shifts in the structure of attention, in what is attended to, in what is stressed and what consequently ignored with what connections … Knowing is not a simple matter of accumulation … [but] rather a state of awareness, of preparedness to see in the moment (p.151)
However, if students are not aware of the importance and necessity of the knowledge artefacts at their disposal, they are unlikely to make use of them as they (or their attention) are ‘blocked’. This was the case at times for H&S, e.g. when they initially focused on specific “line segments”, “parts” and “symmetries” (see 133H-140S), they failed to recognise the connection between their knowledge of |f(x)| and f(|x|) and a construction of |f(|x|)|. It is with this ‘connection’ that the interviewer’s interventions to direct H&S’s attention are particularly important. In H&S’s work, the interviewer first brought |f(x)| and f(|x|) to their attention and helped them recall what they knew about these functions. Later he drew H&S’s attention to the expression of |f(|x|)| and suggested viewing this as a combination of |f(x)| and f(|x|) (165I). Only after ensuring that |f(x)| and f(|x|) were the focus of the students’ attention (166H&167S) did he invite them to work out an idea as to how to use |f(x)| and f(|x|) to obtain |f(|x|)| (168I).
The interventions also had a regulative function which often took the form of setting goals through, mainly, direct requests, inviting H&S to focus on certain aspects of the task e.g. “let’s draw the graph” (187I) and “how can we use our knowledge to obtain this graph” (168I). The goals were important in focusing the student’s attention and in reducing their uncertainty; it was, to a large extent, through their efforts to satisfy these goals that H&S moved closer to the target construction. These goals were not predetermined but ‘emerged’ in the course of interaction. We are convinced of the importance of such emergent goals in scaffolded discourse. These goals are
Ozmantar & Monaghan
PME30 — 2006 4 - 311
dialectically shaped by the interviewer’s understanding of the students’ development at certain stages in the activity and the students’ understanding of the interventions in the context of a particular task. We attend to this issue next. Emergent goals in scaffolded discourse during the construction HSD’s model of abstraction is an activity theoretic model. Leont’ev’s (1981) exposition of activity theory argues that the main goal of an activity is realised by an aggregate of actions subordinated to partial goals which can be distinguished from, yet are constitutive to, the main goal. Saxe (1991), which is activity theoretic in all but name, considers practice-linked emergent goals, little and often unconscious goals which come into being and fade away. Saxe’s goals are not static constructions but rather are “emergent phenomena shifting and taking new forms as individuals use their knowledge and skills alone and in interaction with others to organise their immediate contexts” (ibid., p.17). Our use of the term ‘emergent goals’ has similarities to Leont’ev’s partial goals and Saxe’s emergent goals: they are emergent goals for the interviewer but are partial goals for the students. Ozmantar (2004) argues that emergent goals in scaffolded discourse are contingent upon dialectically interrelated parameters: the task, the interviewer’s interventions, the students’ interpretations and prior emergent goals. Viewing emergent goals in relation to the construction of knowledge in scaffolded discourse is a complex matter. The complexity stems, to a considerable extent, from the differences in the participants’ (i.e. interviewer and students) understandings: the interviewer has a clear vision of the target construction and the possible ways to achieve this but the students do not. This affects the way in which the participants interpret the task and the main goal of the activity. For example, the main ‘goal of the task’ was for the students to construct a method to sketch the graph of |f(|x|)|, given the graph of f(x). This was the goal of the interviewer but it was not necessarily seen and interpreted in the same way by the students. When H&S encountered difficulties in developing a method at the end of Q3, they decided to “stick to substitution” which they could use to sketch the graphs in Q4 (144S). This suggests that H&S’s goal was to answer the questions and complete the task, not to develop a general method. The emergent goals we speak of in this scaffolded task arose from the motives of the interviewer, to coordinate the students’ partial goals with his interpretation of the main goal of the task. Emergent goals in scaffolded discourse belong to the agent in focus; the emergent goals of the interviewer generate emergent goals for the student(s). Consider some of the interviewer’s emergent goals: to draw H&S’s attention to |f(|x|)| as a combination of |f(x)| and f(|x|) (165I&168I) and to understand H’s analogy (171I). Corresponding student emergent goals are: to make sense of |f(|x|)| as a combination of |f(x)| and f(|x|) (166H, 167S &170H) and to explain the analogy of computational precedence. Important questions arise: How are the differences in the structure of emergent goals reconciled in the discourse? To what extent should the emergent goals of the different parties be compatible for the interventions to be fruitful? Are the differences obstacles or essential dynamics of the discourse? We do not have immediate answers
Ozmantar & Monaghan
4 - 312 PME30 — 2006
to these questions. It is clear, however, that H&S constructed new knowledge (the main goal of the activity) through the fulfilment of a series of emergent goals which are distinguishable from, yet subordinated to, the main goal itself. It is also clear from the protocol excerpts that H&S achieved the construction of the two-step method through their efforts to realise these emergent goals. References Barron, B. (2003). ‘When smart groups fail’. The Journal of the Learning Sciences, 12(3):
307-359. Hershkowitz, R., Schwarz, B.B. and Dreyfus, T. (2001). ‘Abstraction in context: epistemic
actions’. Journal For Research in Mathematics Education, 32(2): 195-222 Ivic, I. (1989). ‘Profiles of educators: Lev Vygotsky (1896-1934)’. Prospects, XIX, 3:427-36. Leont’ev, A.N. (1981)., ‘The problem of activity in psychology’. In J.V. Wertsch (ed. and
trans.) The Concept of Activity in Soviet Psychology, (pp. 37-71). M.E. Sharpe: Armonk. Mason, J. and Spence, M. (1999). ‘Beyond mere knowledge of mathematics: the importance
of knowing-to act in the moment’. Educational Studies In Mathematics, 38: 135–161. Monaghan, J. and Ozmantar, M.F. (in press). ‘Abstraction and consolidation’. Paper is
accepted for publication in Educational Studies in Mathematics. Noss, R. and Hoyles, C. (1996). Windows on Mathematical Meanings: Learning Cultures
and Computers. Kluwer, Dordrecht. Ohlsson, S. and Lehtinen, E. (1997). ‘Abstraction and the acquisition of complex ideas’.
International Journal of Educational Research, 27: 37-48. Ozmantar, M.F. (2004). ‘Scaffolding, abstraction and emergent goals’, Proceedings of the
British Society for Research into Learning Mathematics, Leeds, 24(2), 83-89. Saxe, G.B. (1991). Culture and Cognitive Development: Studies in Mathematical
Understanding. Laurence Erlbaum Associates, Hillsdale, NJ. Scott, P.H. (1998). ‘Teacher talk and meaning making in science classrooms: a Vygotskian
analysis and review’. Studies in Science Education, 32: 45-80. van Oers, B. (2001). ‘Contextualisation for abstraction’. Cognitive Science Quarterly, 1(3):
279-305 Vygotsky, L.S. (1981). ‘The instrumental method in psychology’. In J. Wertsch (ed.) The
Concept of Activity in Soviet Psychology, (pp.134-143). M.E. Sharpe Inc., Armonk, NY. Wood, D. (1991). ‘Aspects of teaching and learning’. In P. Light, S. Sheldon and M.
Woodhead (eds.), Learning to Think, (pp.97-120). Routledge, London. Wood, D. J., Bruner, J. S. and Ross, G. (1976). ‘The role of tutoring in problem solving’.
Journal of Psychology and Psychiatry, 17: 89-100.
2006. In Novotná, J., Moraová, H., Krátká, M. & Stehlíková, N. (Eds.). Proceedings 30th Conference of the International Group for the Psychology of Mathematics Education, Vol. 4, pp. 313-320. Prague: PME. 4 - 313
COGNITIVE AND METACOCOGNITIVE PERFORMANCE ON MATHEMATICS
Areti Panaoura*, Georgia Panaoura** * Departement of Pre-Primary Education, Frederick Institute of Technology, Cyprus
** Department of Education, University of Cyprus, Cyprus The emphasis of the present study is on the impact of the development of processing efficiency and working memory ability on the development of metacognitive abilities and mathematical performance. We had administered instruments measuring pupils´ metacognitive ability, mathematical performance, working memory and processing efficiency to 126 pupils (8-11 years old) three times, with breaks of 3-4 months between them. Results indicated that, processing efficiency had a coordinator role on the growth of mathematical performance, while self-image, as a specific metacognitive ability, depended mainly on the previous working memory ability.
INTRODUCTION There is an increasing consensus that intelligence is a hierarchical and multidimensional edifice that involves both general-purpose and specialized processes and abilities (Demetriou et al., 2005). Individual differences in psychometric intelligence are associated with individual differences in processing efficiency and/or working memory (Engle, 2002). According to developmental theory, developmental changes in thinking are associated with changes in processing speed or efficiency (Kail, 1991), central attentional energy or capacity (Pascual-Leone, 2000), or working memory (Case, 1985). Mathematics does involve some special mechanisms of representation and mental processing which are appropriate for the representation and processing of quantitative relations. We also believe that these mechanisms are constrained by the organization and the possibilities of the human brain. Thus, any research about the architecture and the development of mind in respect to mathematics will have to specify the domain-specific processes and functions that it involves, the general potentials and processes of the human mind that sustain and frame its functioning, and their dynamic relations in real time during problem solving. In recent years metacognition has been receiving increased attention in cognitive psychology and mathematics education (Guterman, 2003; Kramarksi & Mevarech, 2003; Pappas, Ginsburg & Jiang, 2003). The interest has focused on its role in human learning and performance. The present study uses the term �“metacognition�” referring to the awareness and monitoring of one�’s own cognitive system. There are important questions that are still debate in psychology and in mathematics education concerning the relationships among cognitive processes, such as control of processing, speed of processing and working memory with metacognitive processes, such as self-representation, self-evaluation and self-regulation. The present study purports to
Panaoura & Panaoura
4 - 314 PME30 �— 2006
contribute to the ongoing research on the impact of specific cognitive processes, on metacognitive abilities and on mathematical performance. The purpose of the study was twofold: First to explore the impact of processing efficiency and working memory on metacognitive processes in respect to mathematics and secondly to explore if the above interrelations tend to change with development. The human mind and the development of cognitive and metacognitive abilities The human mind can be described as a three level hierarchical system involving domain-general and domain-specific processes and functions (Demetriou & Kazi, 2001). Speed of processing, inhibition and control, and working memory are the basic dimensions that define the condition of this system. The processing system is defined in terms of three main parameters: speed of processing, control of processing and working memory. The first parameter is the maximum speed at which a given mental act may be efficiently executed; it refers to the time needed by the system to record and give meaning to information and execute an operation. Control of processing determines the system�’s efficiency in selecting the appropriate mental action. The more demanding a task is, the more processing resources, monitoring, and regulation it requires. Finally, working memory refers to the quantity of processes, which enable a person to hold information until the current problem is solved (Demetriou & Kazi, 2001). The neo-Piagetian perspective explains the cognitive development in terms of information processing. The limits in working memory capacity impose constraints on cognitive processes, and vary with age (Kemps, Rammelaere, & Desmet, 2000). There is evidence that processing speed changes uniformly with age, in an exponential fashion, across a wide variety of different types of information and task complexities. That is, change on speed of processing is fast at the beginning (i.e., from early to middle childhood) and it decelerates systematically (from early adolescence onwards) until it attains its maximum in early adulthood (Hale & Fry, 2000). Concerning the working memory there is general agreement that the capacity of all components of working memory (i.e., executive processes, phonological, and visual storage) do increase systematically with age. Additionally, there seems to be an inverse trade-off between the central executive and the storage buffers, so that the higher the involvement of executive processes the less is the manifest capacity of the modality-specific buffers. This is so because the executive operations themselves consume part of the available processing recourses. However, with age, executive operations and information are chunked into integrated units and with development, the person can store increasingly more complex units of information (Case, 1985). Concerning the metacognitive abilities Kail´s research (1991) indicated that even preschoolers are capable of reflecting on their own prior knowledge. By the age of about 4 years, children understand the relation between beliefs and knowing, while between the ages of 4-7 years children move to a more sophisticated understanding of the role of inferential processes in knowledge acquisition (Schneider & Sodian, 1998). Even though, children�’s early understanding of themselves has been intensively investigated in the last decades, there is a lack of studies investigated at
Panaoura & Panaoura
PME30 �— 2006 4 - 315
the same time cognitive abilities and metacognition, in respect to specific domains, such as mathematics. Research should be concentrated on the impact of cognitive factors on the development of the metacognition at the specific domain, and consequently on the respective performance. A reliable model depicting the development of those cognitive and metacognitive abilities could be useful in two ways: On the theoretical level it will contribute to deeper understanding of this important interconnection and on the practical side it may be useful in developing teaching programs for the improvement of young pupils´ metacognitive abilities on mathematics. METHOD In the present study we developed and used a self-reported inventory measuring metacognition and an inventory measuring mathematical performance. Processing efficiency and working memory were measured as well. To specify the nature of change in cognitive abilities in mathematics in relation to metacognition and the possible interrelations in the patterns of change in these aspects, a series of three repeated waves of measurements were taken, with a break of 3-4 months between successive measurements, by using the same materials. Participants Data were collected from 126 children (61 girls and 65 boys), in grades three through five (about 8 to 11 years old). Specifically, 37 were 3rd graders, 40 were 4th graders and 49 were 5th graders. Materials The inventory for the measurement of the metacognitive performance was comprised of 30 Likert type items, of five points (1=never, 2=seldom, 3=sometimes, 4=often, 5=always), reflecting pupils perceived behaviour during in-class problem solving. A specimen item is: �“when I encounter a difficulty that confuses me in my attempt to solve a problem I try again�”. The responses provide an image of pupils´ self-representation, which refers to how they perceive themselves in regard to a given mathematical problem. The individual�’s mathematical ability was measured through four numerical tasks, four analogical, four verbal and four matrices for the measurement of spatial ability taken from the Standard Progressive Matrices. The pupils�’ information processing efficiency was measured using a series of stroop-like tasks devised to measure speed and control of processing, under three different symbol systems: numerical, verbal, and imaginal. To measure, for example, verbal speed of processing, participants were asked to read at the computer a number of words, denoting a colour written in the same ink-colour (for example the word green written in green) and they had to type the letter G at the keyboard, indicating the written word or the colour of the word. To measure the two dimensions of numerical processing, several number digits were composed of small digits. This task involved the numbers 4, 7 and 9. In the compatible condition the large digit was composed of the same digits, while in the incompatible condition the large digit was composed of one of the other digits. The tasks addressed to the imaginal system were similar to
Panaoura & Panaoura
4 - 316 PME30 �— 2006
those used for the numerical system and comprised three geometrical figures: circle, triangle, square. Reaction times to all three types of the compatible conditions (verbal, numerical, imaginal) were taken to indicate speed of processing, while reaction times to the incompatible conditions were considered indicative of the person�’s efficient control of processing. The computer measured reactions times automatically.
An imaginal compatible stimuli A numerical incompatible stimuli
To measure working memory, we asked pupils to recall a number of words, sets of numbers, and images. The verbal task, for example, combined six levels of difficulty, each of which was tested by two different trials. The difficulty level was defined in terms of the number of words in the task, which ranged from two to seven concrete nouns. The numerical tasks were structurally identical to the verbal task. Specifically in the easy trial, only decade numbers were involved, while in the difficult trial the two digits of the numbers were different. Both words and numbers presented to children as verbal stimuli. In the imaginal task, the stimuli were presented visually at the computer. The participants were shown a card on which a number (2-7) of geometrical figures were shown and they were asked to choose from four choices the card, which had the same figures, at the same relative position with the first one.
RESULTS The collected data of the inventory about metacognitive abilities were first subjected to exploratory factor analysis in order to examine whether the factors that guided the construction of the inventory were presented in the participants´ responses. This analysis resulted in 10 factors with eigenvalues greater than 1, explaining 64.74% of the total variance. After a content analysis of the ten factors, there were classified in the following four groups: �“general self-image�” (two factors), �“strategies�” (four factors), �“motivation�” (two factors), and �“self-regulation�” (two factors). The means of the four groups of factors were subsequently used in order to avoid a big number of variables at the dynamic modelling (Gustafsson, 1988). The present paper concentrated on self-image and self-regulation. The items that constructed the two factors about �“self-image�” referred to the beliefs and self-efficacy that pupils had about their abilities, in general, and while encountering specific situations, in particular. �“Self-regulation�” in mathematics, the other two factors of the analysis, included clarifying problem goals, understanding concepts, applying knowledge to each goal to develop a solution strategy and monitoring progress toward a solution.
In order to specify the dynamic relations between mathematical performance and metacognition with processing efficiency and working memory, during the period of the study, dynamic modelling was used. The dynamic model explored possible
Panaoura & Panaoura
PME30 �— 2006 4 - 317
relations among three cognitive variables (processing efficiency, working memory, and cognitive performance on mathematics) and two metacognitive variables (self-image and self-regulation) across the three waves of measurement. The variables of strategies and motivation excluded from the last analysis in order to avoid testing a complicated model with too many variables and consequently many limitations with the statistical analysis. We believed that self-image and self- regulation had a strong relationship with the general self-representation. Self-image about personal strengths and limitations, in comparison to the abilities of others, is a part of the general self-representation. While self-regulation is one of the two basic dimensions of metacognitive ability and it is too important in order to overcome obstacles encountering while solving a mathematical problem.
The main hypothesis of the dynamic model was that all the variables at the second measurement were affected by the respective variables at the first measurement and the variables at the third measurement were affected by the respective variables at the first and the second measurement. Furthermore, the second hypothesis was that significant relations would connect the different variables at each wave of the measurements. Analysis was conducted using the EQS program (Bentler, 1995) and maximum likehood estimation procedures. Multiple criteria were used in the assessment of the model fit (CFI>0.9, x2/df<2, RMSEA<0.05).
The initial fit of the model tested, without any correlations among the five variables in each wave of measurement, was very poor ( 2=999.359, df=410, 2/df=2.42, p<0.001, CFI=0.581, RMSEA=0.114). It improved, however, dramatically after the above two hypotheses were tested indicating the impact of the first measurement on the respective abilities at the second and the third measurements and the connection of the different cognitive and metacognitive abilities at each wave of the measurements. After a few error variances were allowed to correlate, according to the indications of the LMTEST, the fit of the model was excellent ( 2=434.964, df=373,
2/df=1.16, p=0.01, CFI=0.956, RMSEA=0.039). The parameter estimates of this model are shown in Figure 1.
A notable finding from the specific dynamic model was the predominant role played by the processing efficiency, affecting significantly all the others cognitive and metacognitive variables even at the first measurement. The statistically significant loading of processing efficiency (PE1) on working memory (WM1) was -0.337, on mathematical performance (COG1) was -0.206, on self-image (SI1) was -0.198 and on self-regulation (SR1) was -0.262. At the same time, the predominant role of processing efficiency on the whole system was underlined by the result that the loading of processing efficiency at the first measurement on cognitive mathematical performance at the third measurement was significant (-0.397). The negative signals were explained by the fact that the high processing efficiency translated into low reaction time. The loading of working memory at the second measurement (WM2) on the mathematical performance at the third measurement (COG3) was significant as well (0.495). Consequently the mathematical performance depended mainly on the previous processing efficiency and the working memory.
Panaoura & Panaoura
4 - 318 PME30 �— 2006
PE= Processing Efficiency, WM= Working Memory, COG= Cognitive Abilities on Mathematics, SI= Self Image, SR= Self-regulation, 1= first measurement 2= second measurement 3 =third measurement * Significance at the .05 level,
Figure 1: The dynamic model of cognitive and metacognitive abilities
The model parameters indicated that there was a general pattern of individuals´ differences at the first measurement that persisted at the second and the third measurement in the case of working memory. This is evidenced from the continuing significant loadings of each variable at different measurements. Specifically, the loading of the working memory ability at the first measurement (WM1) on the working memory ability at the second measurement (WM2) was 0.814. Similarly, the loading of the working memory ability at the first measurement, and the loading of the same variable at the second measurement on the working memory ability at the third measurement (WM3) were 0.767, and 0.349, respectively.
The performance of self-image at the third measurement (SI3) was affected by the initial condition (WM1) of the working memory (0.239) and the mathematical performance (COG3) at the third measurement (0.530). This is an important indication of the factors that affect individuals´ self-image in mathematics. Actually the impact of the mathematical performance at the same measurement was expectable, because of the recent experiences. Nevertheless the impact of the initial condition of the working memory ability indicated the important impact of cognitive processes and abilities on the self-image.
PE1
WM1
COG1
PE2
WM2
COG2
PE3
WM3
COG3
SI1 SI2 SI3
SR1 SR2 SR31
.338*
.046
-.135
.177
.422*
.154 -.198*
.407*
-.262*
-.337*
-.206*
.814*
.207*
.349*
.767*
.664*
.115
.152.902*
.803*
-.267
-.128.367*
.085
.981*
.129
.279
.226*.-264*
.530*
.495*
-.397*
.239*
.735*
Panaoura & Panaoura
PME30 �— 2006 4 - 319
DISCUSSION The findings of this study lead to some potentially important conclusions about the development of cognitive and metacognitive processes. The human mind is much more complex than simply cognitive abilities and processes and their presentations (Demetriou & Kazi, 2001). Metacognition is constrained by the processing potentials of the mind. The existence of significant correlations among different cognitive abilities, especially between processing efficiency with working memory and cognitive performance on mathematics suggest that growth in each of the abilities is affected by the state of the other variables, especially the state of processing efficiency at a given point of time. From the analysis of the dynamic model, it is quite clear that the processing efficiency has a coordinator role on the cognitive system and the individual´ s metacognitive performance, even from the first measurement.
Results indicated that individuals´ self-image depended mainly on previous working memory ability and partially on the recent mathematical performance. It is very important the effect of mathematical performance on the self- image at the final measurement. It seems that mathematical performance is the only cognitive ability, for which individuals have direct consequences which are expressed by remarks, awards and most often rewards by significant others i.e., teachers and parents.
Demetriou et al. (2005) suggest that both the working memory and the processing efficiency are associated with individual development differences on thinking. A change at the metacognitive system influences the functioning of the cognitive system and vice-versa. The results of the present study indicated that changes on thinking and metacognitive performance might be associated with processing efficiency and working memory, even at the years of the primary education, at the specific domain of mathematics.
We have seen that there is a very close relation between the development of mathematical performance, the development of metacognition and the development of processing efficiency and working memory. The implication of this finding is very clear: the complexity and the constructions in mathematics at a particular age reflect to a large extend the available processing and representational resources of the human mind. In educationally relevant items, this statement implies that having accurate information about these dimensions of domain free processes would greatly help the teacher decide what is learnable, at the ages concerned, of the various concepts and skills he wants to transmit and how individual children will respond to them. Further investigation could lead to intervention programs for the improvement of metacognitive performance on mathematics. Future studies could investigate whether changes on cognitive performance, especially on cognitive processes, such as processing efficiency and working memory capacity, tend to follow changes on metacognitive knowledge, self-evaluation, self-regulation and self-representation.
Case, R. (1985). Intellectual development. Birth to adulthood. New York: Academic Press. Demetriou, A., & Kazi, S. (2001). Unity and Modulatiry in the Mind and the Self. London:
Routledge. Demetriou, A., Zhang Xiang, K., Spanoudis, G., Christou C., Kyriakides, L., & Platsidou,
M. (2005). The architecture, dynamics and development of mental processing: Greek, Chinese or Universal?. Intelligence, 33, 109-141.
Engle, R. W. (2002). Working memory capacity as executive attention. Current Directions in Psychological Science, 11, 19-23.
Gustafsson , J. E. (1988). The development of mental abilities. In R. J. Sternberg (Ed.), Advances in the psychology of intelligence (Vol. 4, pp.35-71). Hillsdale, NJ: Erlbaum.
Guterman, E. (2003). Integrating written metacognitive awareness guidance as a �‘psychological tool�’ to improve student performance. Learning and Instruction, 13,633-651.
Hale, S., & Fry, A. F. (2000). Relationships among processing speed, working memory, and fluid intelligence in children, Biological Psychology, 54, 1-34
Kail, R. (1991). The development of memory in children. New York: W.H. Freeman. Kemps, E., Rammelaere, S., & Desmet, T. (2000). The development of working
memory:exploring the complementarity of two models. Journal of Experimental Child Psychology, 77, 89-109.
Kramarski, B. & Mevarech, Z.R. (2003). Enhancing mathematical reasoning in the classroom: Effects of cooperative learning and metacognitive training. American Educational Research Journal, 40 (1), 281-310.
Pappas, S., Ginsburg, H., & Jiang, M. (2003). SES differences in young children�’s metacognition in the context of mathematical problem solving, Cognitive Development, 18, 431-450.
Pascual-Leone, J. (2000). Reflections on working memory: Are the two models complementary? Journal of Experimental Child Psychology, 77, 138-154.
Schneider, W., & Sodian, B. (1998). Memory strategy development: Lessons from longitudinal research. Developmental Review, 17, 442-461.
2006. In Novotná, J., Moraová, H., Krátká, M. & Stehlíková, N. (Eds.). Proceedings 30th Conference of the International Group for the Psychology of Mathematics Education, Vol. 4, pp. 321-328. Prague: PME. 4 - 321
MEASURING AND RELATING PRIMARY STUDENTS’ MOTIVES, GOALS AND PERFORMANCE IN MATHEMATICS
Marilena Pantziara and George Philippou Department of Education University of Cyprus
This paper presents some preliminary results of a larger study that investigates the relationship between students’ conceptual understanding of fractions, students’ motivation and their social context (teachers’ practices in the mathematics classroom and students’ socio-economic status). Data were collected from 302 sixth grade students through a questionnaire comprised three Likert-type scales measuring motives, goals and interest, and a test measuring students’ understanding of fractions. A hypothesized model connecting students’ understanding of fractions and different motivational constructs was next tested. Findings revealed that students’ understanding of fractions and their interest in mathematics were influenced by their fear of failure, their self-efficacy beliefs, and their mastery goals.
BACKGROUND AND AIM OF THE STUDY The relationship between students�’ achievement and affect has recently attracted increased interest on the part of mathematics educators (see e.g., Hannula & Pehkonen, 2004; Breen, 2004). In a sense it was a response to educational psychologists who have investigated factors that promote and undermine affective constructs like students�’ motivation and beliefs (Pintrich, 1993). Current studies on the relationship between motivation and achievement tend to highlight the multidimensional and situational nature of the construct of motivation. According to this contextual perspective, the efficacy of motivational determinants to predict the performance and achievement of individuals may vary according to culture, the contexts they are called on to act (mathematics or language), their personal characteristics etc. (Buffard & Couture, 2003). Four basic theories of social-cognitive constructs regarding student motivation have so far been identified: achievement goal orientation, self-efficacy, personal interest in the task, and task value beliefs (Pintrich, 1993). In this study we conceptualise motivation according to achievement goal theory, arguably one of the dominant theories in the field of motivation today (Zusho et al., 2005). Achievement goal theory was developed within a social-cognitive framework and focuses on students�’ purpose of task engagement and how this goal orientation influences the way students approach, engage and respond to achievement situations (Elliot & Church, 1997). Two particular goals have recently been emphasized in the literature, namely mastery goals that focus on learning and understanding, and performance goals that focus on the demonstration of competence. Recently, there has been a theoretical and empirical distinction between performance-approach goals, where students focus on how to outperform others, and performance-avoidance goals, where students aim to avoid looking inferior or incompetent in relation to others (Elliot & Church, 1997).
Pantziara & Philippou
4 - 322 PME30 �— 2006
Goal orientation research suggests that a mastery goal orientation is associated with positive achievement beliefs that lead to adaptive educational outcomes. More specifically, the limited research related to students�’ mathematics achievement revealed that the adoption of mastery goals was associated with a positive pattern of engagement that included challenge seeking and persistence in the face of difficulty (Kaplan et al., 2002). Moreover mastery goals were positively related to students�’ ability in problem solving strategies and to students�’ achievement in mathematics test (Kaplan et al., 2002). Contrary to the adaptive nature of mastery goals, performance-avoidance goals were found to be associated with test anxiety, low achievement and avoidance of help seeking in mathematics classroom (Elliot, 1999; Kaplan et al., 2002). The findings regarding performance-approach goals are mixed and show both positive and negative effects. This motivational orientation was related to self-efficacy, positive attitudes towards the task and positive relations between performance-approach goals and grades (Elliot, 1999). Other studies however found that the adoption of performance-approach goals was positively related to maladaptive outcomes such as experiencing negative affect in response to a difficulty and challenge, using low-level learning strategies, and attributing failure to low ability (Kaplan et al., 2002).
Recently there is also an increased emphasis into the antecedents of these three achievement goals. Particularly the hierarchical model of motivation developed by Elliot & Church (1997) argues that the three achievement goals appear to mediate the relation between achievement motives; in particular the success approach motive (need for success, self-efficacy) and the motive to avoid failure (fear of failure), and select achievement and motivational outcomes. More specifically, Elliot & Church (1997) found that the need for success was associated with the adoption of both mastery goals and performance-approach goals, while the fear of failure was linked to both performance-approach and performance-avoidance goals. These goals were differentially related to academic outcomes; the mastery goals predicted students´ interest, while performance-approach goals were related to actual performance (Elliot & Church, 1997).
Although there are numerous studies investigating the relationships between achievement goals and specific motivational constructs or achievement (Kaplan et al., 2002), relatively few studies have tried to test causal models that combine students�’ achievement motives, their goal orientations and actual achievement as well as their personal interest in mathematics. Most importantly, very few studies in this research area refer to primary school students in the context of mathematics teaching and learning.
In this respect the purpose of the study was: as their personal interest in the task.
To test the validity of the measures for the six factors: fear of failure, self-efficacy, mastery goals, performance-approach goals, performance-avoidance goals, and interest, in a different social context.
Pantziara & Phillipou
PME30 �— 2006 4 - 323
To examine the relationships between students�’ achievement motives (fear of failure, self-efficacy), achievement goals (mastery, performance approach and performance avoidance goals) and outcomes (students�’ interest in mathematics and mathematics achievement).
To test a causal model that examines the relationships between students�’ achievement motives, achievement goals and achievement outcomes.
METHOD Participants were 302 sixth grade students, 137 males and 165 females from 16 intact classes of an economically homogeneous school district. All participants completed a questionnaire comprised of three scales measuring: a) achievement motives (fear of failure and self-efficacy), b) achievement goals (mastery, performance-approach and performance-avoidance), and c) outcomes (interest). Specifically, the questionnaire comprised of 35 Likert-type 5-point items (1- indicating strong disagreement and 5 strong agreement). The five items measuring Self �–efficacy were adopted from the Patterns of Adaptive Learning Scales (PALS) (Midgley et al., 2000); a specimen item was �“I�’m certain I can master the skills taught in mathematics this year�”. Students�’ fear of failure was assessed using nine items adopted from the Herman�’s fear of failure measure (Elliot & Church, 1997); a specimen item was �“I often avoid a task because I am afraid that I will make mistakes�”. The five-item subscale measuring mastery goals, as well as the five-item measuring performance goals and the four-item measuring performance-avoidance were adopted from PALS; respective specimen items in each of the three subscales were, �“one of my goals in mathematics is to learn as much as I can�” (Mastery goal), �“one of my goals is to show other students that I�’m good at mathematics�” (Performance-approach goal), and �“It�’s important to me that I don�’t look stupid in mathematics class�” (Performance-avoidance goal). Finally, we used Elliot & Church (1997) seven-item scale to measure students�’ interest in achievement tasks; a specimen item was, �“I found mathematics interesting�”. These 35 items were randomly spread through out the questionnaire, to avoid the formation of possible reaction patterns.
To investigate the relationship between the above motivational and social factors and the students´ understanding of fractions a three-dimensional test was also administered, each dimension corresponding to each of the levels of conceptual understanding- interiorization, condensation and reification- proposed by Sfard (1991). The tasks comprising the test were adopted from published research and specifically concerned the measurement of students�’ understanding of fraction as part of a whole, as measurement, equivalent fractions, fraction comparison (Hannula, 2003; Lamon, 1999) and addition of fractions with common and non common denominators (Lamon, 1999). We developed tasks corresponding to each of Sfards�’ conceptual levels. In this paper, however, we report only on the relation among measures of students´ motives, goals and social factors, and achievement.
Pantziara & Philippou
4 - 324 PME30 �— 2006
FINDINGS With respect to the first aim, the students�’ responses were subjected to exploratory factor analysis, which resulted in a six-factor solution, explaining 54.80% of the total variance. All loadings were high and statistically significant, ranging from .45 to .86. The six factors corresponded to students�’ achievement motives, goals and outcomes as were described in the questionnaire, with one exemption: the fear of failure factor was split in two parts. This finding supports the construct validity of the questionnaire used to collect data on pupils�’ motives, goals and outcomes. Factor scores for each dimension were estimated by calculating the average of the items that comprised each factor. Table 1 presents the mean scores, standard deviations, and Cronbach�’s alpha coefficients for each of the six factors.
Factors Mean SD a Interest 3.85 .89 .89 Mastery goals 4.52 .46 .71 Performance approach goals 3.08 .93 .80 Performance avoidance goals 2.85 .93 .51 Fear of failure 2.20 .78 .66 Self efficacy 4.09 .62 .71
Table 1: Means, Standard Deviations and Cronbach�’s alpha coefficients of the six factors identified by exploratory factor analysis.
The Cronbach�’s alphas were found quite high (ranging from .66 to.89) for five of the factors, while alpha was low for the factor performance-avoidance goals. The latter result might be partially attributed to the fact that the factor comprised of only four items and partially to cultural difference between USA, where the scale was developed and Cypriot students. Specifically, one of the traditional trends in Cypriot schools provides that most students attend private coaching institutions, or pay for private coaching at home, particularly whenever they believe that they run the risk to fail. So, instead of avoiding a subject, they would most probably try to find ways (i.e. private mathematical lessons) in order to approach a task efficiently.
Table 2 presents the correlations between the variables. Mastery goals were positively correlated with self-efficacy (.467) and with both outcomes, strongly with interest (.470) and less strongly with achievement (.180). On the other hand it was found to be negatively associated with the fear of failure (-.358). Performance-approach goals were not related to fear of failure but they were positively related to self-efficacy (.208). The fear of failure motive was also negatively related to interest (-.440) and to students�’ achievement (-.278) while it was also negatively related to self-efficacy (-.358). Lastly, the achievement motive self-efficacy was also positively related to achievement (.208).
Table 2: Correlations for the Variables. * Correlation is significant at the 0.05 level. **Correlation is significant at the 0.01 level.
In order to examine the antecedents of achievement goals and the consequences of the adoption of achievement goals, multiple regression analysis was performed. The regression of mastery goals on the antecedents self-efficacy and fear of failure revealed significant main effect (F =49.755, p<.001) for both self efficacy, =.384 p<.001 and fear of failure, =-.197, p<001. Specifically, students who felt high fear of failure were more likely not to adopt mastery goals. Students who believed that they could master mathematics if they tried hard (high self-efficacy) were more likely to adopt mastery goals. Regressing performance goals on the antecedents (self-efficacy and fear of failure) revealed moderate effect for fear of failure =.128 and p<.05 and significant effect for self-efficacy =.262 and p<.001. Students who felt high fear of failure were more likely to adopt performance-approach goals. That is their focus was on the demonstration of competence relatively to others. Students who had high self-efficacy beliefs they were also likely to adopt performance goals. The regression of interest on achievement goals was also significant F =46.047, p<.001. Particularly the regression of interest on mastery goals revealed significant main effect, =.457, p<.001, while the regression of interest on performance-approach goals revealed modest significance ( =.123 and p<.05). The adoption of mastery goals, that is focusing on the development of competence and task mastery led to advanced interest in mathematics. The same results revealed moderate effect for performance-approach goals. Students who focused on the demonstration of competence relatively to others, showed an interest in mathematics. The regression of mathematics achievement on achievement goals revealed moderate effect on both goals (F=7.128, p=.001) with mastery goals to have more effect ( =.192 and p=.001) than performance-approach goals ( =-.115 and p<.05). Students whose focus was on the development of their competence and task mastery were more likely to achieve higher conceptual understanding of fractions than students who held low mastery goals. Students, whose focus was on the demonstration of competence relatively to others, were more likely to have lower conceptual understanding of fractions than students who held low performance goals. Structural equation modelling was also applied to test the relationships between students�’ achievement motives, achievement goals and achievement outcomes using EQS (Hu & Bentler, 1999). Particularly, the causal model suggested by theory and
Pantziara & Philippou
4 - 326 PME30 �— 2006
practice claims that the relation of motives (self-efficacy and fear of failure) to outcomes (interest and achievement) is mediated by the achievement goals. Three types of fit indices were used to assess the overall fit of the model: the chi-square statistic, the comparative fit index (CFI), and the root mean of square error of approximation (RMSEA). The chi square index provides an asymptotically valid significance test of model fit. The CFI estimates the relative fit of the target model in comparison to a baseline model where all of the variable in the model are uncorrelated (Hu & Bentler, 1999). The values of the CFI range from 0 to 1, with values greater than .95 indicating an acceptable model fit. Finally, the RMSEA is an index that takes the model complexity into account. An RMSEA of .05 or less is considered to be as acceptable fit (Hu & Bentler, 1999). As reflected by the iterative summary, the goodness of fit statistics showed that the data did not fit the model well (x2 =71.64, df= 6, p<.000; CFI=.791 and RMSEA=.19).
Figure 1: Path model
Subsequent model tests revealed that the model fit indices could be improved by adding paths joining directly students�’ fear of failure to interest and achievement and students�’ self efficacy to interest. The model that emerged after these modifications had a very good fit to the data (x2 =3.66, df= 3, p>.30; CFI=.998 and RMSEA=.027). Figure 1 shows the model that emerged, as well as the path coefficients among the six factors. The following observations arise from Figure 1. Students who felt high fear of failure had low interest in mathematics and low mathematics achievement. Students that held high self-efficacy that is, the students who believed that they could master mathematics if they tried hard enough, they had high interest in mathematics. Mastery goals were based on fear of failure (-.197) and were strongly based on self-efficacy (.384). Performance-approach goals were moderately based on fear of failure (.128) and self-efficacy (.262). Students who felt high fear of failure had high performance goals. Interest was predicted directly by mastery goals (.266), by performance-approach goals (.102), by self-efficacy (.218) and by fear of failure (-.255). The mathematics achievement was predicted directly by mastery goals (.105), by performance goals (-.102) and fear of failure (-.239). It can be claimed from the model in figure 1 that
-.255 .266
.102
.105
-.102
.218-.239.384
.262
.128
-.197 Fear of failure
Self-Efficacy Perf/nce goals
Mastery goalsInterest
Achievement
Pantziara & Phillipou
PME30 �— 2006 4 - 327
mastery and performance-approach goals served as mediators of the direct relationship between self-efficacy and mathematics achievement.
DISCUSSION The present study is within the framework of the ongoing discussion about the relationship between students�’ motivation and achievement. Factor analysis in conjunction to other studies (Elliot & Church, 1997; Zusho et. al., 2005) did not support the trichotomous: approach-avoidance-achievement goal conceptualization. Specifically, the data did not support the distinction in three different achievement goals (mastery, performance-approach and performance-avoidance goals). This may be partially due to cultural differences between environments, or to variable samples�’ age; in the present study participants were just above 11 years of age, while in other studies the samples consisted of college students. Another possible cause of this phenomenon may be the limited number of the items that measured the performance avoidance goals.
The strongest predictor of students�’ achievement and their interest in mathematics was students�’ fear of failure. The model shows that fear of failure had a direct effect on students�’ achievement and to their interest in mathematics, and indirect effect on both variables via mastery and performance goals. The negative effect that the fear of failure, or fear for mathematics had on students�’ achievement is stressed in many studies (Breen, 2004; Elliot & Church, 1997). However, unlike the results of this study, in Elliot�’s & Church�’s study (1997) fear of failure appeared in the causal model to have only an indirect effect on students�’ achievement and interest.
Consistent with previous research findings, (Elliot & Church, 1997; Zusho et al., 2005) path analysis investigating the antecedents of each of the two goal orientations revealed that mastery goals were predicted by self-efficacy and performance goals were predicted by both, fear of failure and self-efficacy.
Path analysis investigating the consequences of achievement goals adoption for the outcomes, interest in mathematics and achievement in mathematics revealed that performance-approach goals facilitated interest in mathematics but proved to have negative effect on students�’ achievement in mathematics. Elliot & Church (1997) and Zusho et. al., (2005) found in their studies that performance-approach goals had positive influence both on interest and on achievement. In addition, the data of this study revealed that mastery goals facilitated both students�’ interest and mathematics while Zusho et. al., (2005) in their study found that mastery goals facilitated only students�’ interest.
Beta values were poorer in this model than the models in the other studies (Elliot & Church, 1997; Zusho et al., 2005). One explanation is what Hannula & Pehkonen (2004) support that the casual relationship between achievement and affective constructs is problematic and varies according to students�’ age. Moreover, it may well be that other factors like teacher�’s practices and the students�’ socio-economic
Pantziara & Philippou
4 - 328 PME30 �— 2006
status have a stronger impact on the different motivation and performance outcomes that students in this age adopt, factors that this study will investigate further. References Bouffard, T., & Couture, N. (2003). Motivational Profile and Academic Achievement
Among Students Enrolled in different Schooling Tracks. Educational Studies, 29(1), 19-38.
Breen, C. (2004). In the Serpents�’ Den. Contrasting Scripts relating to Fear of Mathematics. In M. J. Høines & A. B. Fuglestad (Eds.), Proc. 28th Conf. of the Int. Group for the Psychology of Mathematics Education (Vol. 2, pp. 167-174). Bergen, Norway: PME.
Elliot, A. (1999). Approach and avoidance motivation and achievement goals. Journal of Educational Psychology, 80, 260-267.
Elliot, E & Church, M. (1997). A hierarchical model of approach and avoidance achiemevment motivation. Journal of Personality and Social Psychology, 72, 218-232.
Hannula, M., (2003). Locating fraction on a number line. In N. A. Pateman, B. J. Doherty, & J. Zilliox (Eds.), Proc. 27th Conf. of the Int. Group for the Psychology of Mathematics Education (Vol. 3, pp. 17-24). Honolulu, USA: PME.
Hannula, M., & Pehkonen, E., (2004). Development of understanding and self-confidence in mathematics grades 5-8. In M. J. Høines & A. B. Fuglestad (Eds.), Proc. 28th Conf. of the Int. Group for the Psychology of Mathematics Education (Vol. 3, pp. 17-24). Bergen, Norway: PME.
Hu, L., & Bentler, P.M. (1999). Cutoff criteria in fix indexes in covariance structure analysis: Conventional criteria versus new alternatives. Structural Equation Modelling, 6 (1), 1-55.
Kaplan, A., Middleton, M., Urdan, T., & Midgley, C. (2002). �‘Achievement Goals and Goal structures�’. in C. Midgley (Ed.), Goals, Goal structures, and Patterns of Adaptive Learning (pp 1-20). Mahwah: Lawrence Erlbaum Associates
Lamon, S. (1999). Teaching fractions and ratios for understanding. Essential content knowledge and instructional strategies for teachers. London: Lawrence Erlbaum Associates.
Midgley, C., et al., (2000). Manual for the Patterns of Adaptive Learning Scales. Retrieved November 2nd 2004, from http://www.umich.edu/~pals/manuals.html
Pintrich, P. (2003). A motivational science perspective on the role of student motivation in learning and teaching contexts. Journal of educational Psychology, 95 (4), 667�–686.
Sfard, A. (1991). Dual nature of mathematical conception. Educational Studies in Mathematics, 22 (1), 1-36.
Zusho, A., Pintrich, P., & Cortina, K. (2005). Motives, goals and adaptive patterns of performance in Asian American and Anglo American students. Learning and Individual differences, 15 (2), 141-158.
2006. In Novotná, J., Moraová, H., Krátká, M. & Stehlíková, N. (Eds.). Proceedings 30th Conference of the International Group for the Psychology of Mathematics Education, Vol. 4, pp. 329-336. Prague: PME. 4 - 329
THE INTUITIVE RULE MORE A-MORE B: THE IMPACT OF A DYNAMIC GEOMETRY SOFTWARE
Pandelitsa Papageorgiou, Annita Monoyiou, & Demetra Pitta-Pantazi Department of Education, University of Cyprus
The aim of this study was twofold: First to examine the impact of the intuitive rule “more A-more B” on Cypriot students while dealing with geometric tasks and secondly to investigate whether teaching with the use of dynamic geometry may help children overcome the effects of the rule. The study was consisted of two parts. The first one was conducted with seventy-seven 6th graders who were presented with seven tasks concerning the sum of angles in triangles and quadrilaterals. The second was conducted with two 5th grade classes which were taught with two different teaching approaches, the traditional teaching approach and the approach with the use of a Dynamic Geometry software (DGs) called Euclidraw Jr. The results indicated that the intuitive rule has great impact on students’ reasoning and that the use of DGs was more effective than traditional teaching.
INTRODUCTION Numerous pieces of research have investigated students�’ conceptions and reasoning processes in a wide range of content areas (Fischbein, 1999). Many have pointed out the persistence of students�’ misconceptions, preconceptions or alternative conceptions. Although most of this research has been content specific and aimed for detailed description of particular misconceptions, several researchers have searched for common roots and have tried to build a unifying theoretical framework. One theoretical framework is the intuitive rules theory, established and further developed by Stavy and Tirosh (2000), which offers one explanation why students make errors. In their book, Stavy and Tirosh also concentrated on identifying effective teaching methods that can facilitate students in overcoming the impact of these intuitive rules. The aim of this study is twofold: First to investigate whether students that had been taught that the sum of angles in a triangle is 180o, are affected by the intuitive rule �“more A-more B�” and secondly to investigate whether teaching with the use of dynamic geometry may help children overcome some of these errors.
THEORETICAL BACKGROUND The Intuitive Rules Theory Stavy and Tirosh (2000) have introduced the theory of the intuitive rules for analysing and predicting individuals�’ erroneous solutions to mathematical and scientific problems. They argue that students are affected by a restricted number of intuitive rules when they solve a wide variety of conceptually non-related tasks that share some common external features. These tasks differ with regard to their content area and/ or to their required reasoning.
Papageorgiou, Monoyiou & Pitta-Pantazi
4 - 330 PME30 �— 2006
One intuitive rule which has been extensively investigated, is more A-more B, and its strong explanatory and predictive power has been widely reported (Tirosh & Stavy, 1999). The intuitive rule more A-more B is reflected in students�’ responses to comparison tasks in which two objects which differ in certain, salient quantity A are described (A1>A2). The students are then asked to compare the two objects with respect to another quantity B (B1=B2 or B1<B2). In such cases, many students responded inadequately that B1>B2, according to the rule more A (the salient quantity) �– more B (the quantity in question) (Tirosh & Stavy, 1999). The intuitive rules theory has been reported to be a good explanatory framework for analysing students�’ solutions to a wide range of mathematical topics, since it accounts for many of the incorrect solutions given. In addition to this, it has been argued that it has a strong predictive power, since it enables educators to foresee students�’ reactions. According to Stavy and Tirosh (2000) the intuitive rules carry Fischbein�’s (1999) characteristics of intuitive knowledge. This means that students�’ solutions which are in line with the intuitive rules are self-evident. Students use them with great confidence and they often persist despite formal learning. Moreover the intuitive rules share the attributes of globality and coerciveness. In light of the theory of the intuitive rules, which essentially claims that students�’ responses to given tasks often rely on external, irrelevant features, the importance of encouraging critical thinking is evident. Students should be encouraged not only to rely on external features of the tasks, but to critically examine their responses. In order to achieve this, Stavy and Tirosh (2000) suggest three teaching approaches: teaching by analogy, conflict teaching and attention to relevant variables. In teaching by analogy, students are presented with a series of tasks (�‘anchoring task�’, �‘bridging tasks�’) in order to reach a �‘target task�’, known to strongly suggest the intuitive rule. In the conflict teaching, students are first given a task known to elicit an incorrect response, and then they are presented with a situation that contradicts their initial response. The contradiction may be created in several ways, by presenting students with contradictory concrete evidence or different representations, and by confronting them with an extreme case. Another teaching approach that could be used, is to draw their attention to relevant variables that they tend to disregard when solving a given problem. The teaching intervention with DGs used in this study carries mainly the characteristics of conflict teaching and attention to relevant variables approaches.
THE STUDY The study was consisted of two parts. The first one was conducted with seventy-seven 6th graders who had studied triangles in the framework of Euclidean geometry. The aim was to investigate whether these students that had been taught that the sum of the angles of a triangle is 180o, give incorrect answers to tasks related to this topic that are based on the intuitive rule more A-more B. The second part was conducted with two 5th grade classes of a primary school in Cyprus (the first one consisting of 19 students and the second of 20 students). The 5th graders had been taught about
Papageorgiou, Monoyiou & Pitta-Pantazi
PME30 �— 2006 4 - 331
different types of triangles and angles and how to measure angles with the use of a protractor. The aim was to investigate whether teaching �‘The sum of angles in a triangle�’ with the use of a DGs is more effective.
The students participated in the first part were given a questionnaire consisting of seven comparison tasks, involving the sum of angles in triangles and quadrilaterals. The students were given 60 minutes to answer it. Here we present three sample tasks.
Task 1
D A
B C E F In triangles ABC and DEF AB< DE, BC< EF and AC<DF. The statement: �“The sum of angles in triangle ABC (A+B+C) is smaller than the sum of angles in triangle DEF (D+E+F)�” is correct/ wrong. Explain your answer.
Task 2
A D B C E F
In triangle ABC all angles are smaller than 90o. In triangle DEF, the angle E is larger than 90o. �“The sum of angles in triangle ABC (A+B+C) is smaller/ bigger/ equal to the sum of angles in triangle DEF (D+E+F). Explain your answer.
Task 3 A B E F C G D H
In quadrilaterals ABCD and EFGH AB< EF, BC< FG, AD<EH and DC<HG. The statement: �“The sum of angles in ABCD (A+B+C+D) is smaller than the sum of angles in EFGH (E+F+G+H) is correct/ wrong. Explain your answer.
The students that participated in the second part of the study were first given a pre-test consisting of five comparison tasks, involving the sum of angles in triangles. The tasks were identical with those given in the first part. The sum was to again investigate whether these students are affected by the intuitive rule and fail to use measurement of angles to respond to these tasks. After the pre-test, students in the first class, called experimental group, were taught �‘The sum of angles in triangles�’ with the use of a DGs, called Euclidraw Jr. What is important about DGs is that they provide tools which make explicit the clarification and description of geometrical ideas that often remain implicit in paper and pencil environments (Gawlick, 2002). DGs provide revolutionary means for developing geometrical understanding and enhancing students�’ ability to define and identify geometrical properties and dependencies between them (Mariotti, 2001). Moreover, it is widely accepted that DGs capabilities help students develop heuristics, built meanings for a
Papageorgiou, Monoyiou & Pitta-Pantazi
4 - 332 PME30 �— 2006
variety of mathematical concepts and generally, develop their understanding (NCTM, 2000). The most important feature of DGs, including Euclidraw Jr, is the operation of dragging (Botana & Valcarce, 2002), a process in which a geometrical construct can be enlarged, diminished, shuffled and rotated while the basic characteristics and properties of the construct remain the same. This process allows the creation of a great number of examples of geometrical shapes in just a few minutes.
The experimental group worked collaboratively in the school�’s computer lab which had four computers. The tasks designed for this group were not simply replications of the paper and pencil tasks which appear in the mathematics textbooks, but they exploited the dynamic capabilities of the software. The teaching approach that was used along with the use of Euclidraw Jr combined two of the teaching approaches suggested by Stavy and Tirosh (2000), conflict teaching and attention to relevant variables. Conflict teaching, since students were first presented with a question that elicited an incorrect solution and then they were given the opportunity to explore with the software the sum of angles in different kinds of triangles (many representations and even very extreme ones, for example very thin triangles with an obtuse angle of 178°). The software gave students the possibility while changing the dimensions and angles of a triangle to observe that the sum remained stable (concrete evidence and extreme case). In addition, they drew their attention to the sum of the angles and not to each angle separately (attention to relevant variables), since they could create numerous triangles and simultaneously observe on a table that they created the size of each angle and the sum of all three angles.
Students in the second class, called traditional group, were taught in the traditional fashion, meaning that the lesson was carried out in their normal classroom using only their mathematics textbooks, pencil, paper, scissors and geometrical instruments. Although the term �‘traditional teaching�’ is used, it is important to clarify that this does not imply that students were presented with rules with no reason, but constructivist approach was implemented. Students were again presented with a cognitive conflict situation and the teacher also stressed the importance on concentrating on the sum of angles (attention to relevant variables). The teacher encouraged students to make conjectures, discuss with their classmates and discover mathematical rules. However, what was missing was the existence of the great number of examples that was presented with the DGs, the accuracy that the software offered, the possibility of creating extreme cases of triangles and also the opportunity to simultaneously see the triangle, the measurements of each angle and the sum. All these were only achieved in the experimental group with Euclidraw Jr.
Both interventions lasted 80 minutes. A week later, both groups were administrated a post-test consisting of seven tasks. The five tasks involving the sum of angles in triangles were identical with those given in pre-test, while two tasks involved the sum of angles in quadrilaterals.
Papageorgiou, Monoyiou & Pitta-Pantazi
PME30 �— 2006 4 - 333
RESULTS
Part 1
Table 1, shows that most of the students (56.2%) incorrectly responded that �‘The sum of angles in triangle ABC is smaller than the sum of angles in triangle DEF�’. Half of the students (50.1%) gave an explanation in line with the intuitive rule more A-more B. Only 6.1% of them gave no explanation. In particular, the main arguments projected were: “bigger triangle therefore bigger sum of angles”, “bigger angles therefore bigger sum”. About a third of the participants (36.4%) responded correctly that �‘The sum of angles in the two triangles is equal�’. The main explanation given by these participants was that: “The sum of angles in all triangles is 180o”. It is also noteworthy that 7.4% of the participants did not respond to this task.
Solution
Justification Task 1 (%) N=77
The statement is correct 56.2 More A-more B 50.1 No explanation 6.1
The statement is wrong* 36.4 Sum of angles in triangles 180 36.4
No explanation 0No response 7.4
* correct response Table 1: Frequencies of students�’ responses and justifications to task 1
Table 2, reveals that 70.1% of the students incorrectly responded that �‘The sum of angles in oblique triangle is smaller than the sum of angles in the triangle with an obtuse angle�’. The vast majority (48.1%) provided an explanation that was in line with the intuitive rule more A-more B. Specifically, they argued: “bigger angle (>90o) therefore bigger sum”. A substantial number of participants (11.7%) provided an inexplicit explanation, 9.1% made a restatement of the answer and only 1.2% of them gave no explanation. Yet, a few students (5.2%) also incorrectly responded that �‘The sum of angles in oblique triangle is bigger than the sum of angles in the triangle with an obtuse angle�’, although they gave inexplicit explanations. A small percentage of students (18.2%) answered correctly, arguing that �‘The sum of angles in oblique triangle is equal to the sum of angles in the triangle with the obtuse angle�’. Only half of them (9.1%) gave explicit explanations such as: “the sum of angles in all triangles is the same”. A number of students (6.5%) gave no response to this task.
Papageorgiou, Monoyiou & Pitta-Pantazi
4 - 334 PME30 �— 2006
Solution Justification Task 2 (%) =77
Smaller 70.1 More A-more B 48.1 Inexplicit explanation 11.7 Restatement 9.1 No explanation 1.2
Bigger 5.2 Inexplicit explanation 5.2 No explanation 0
Equal* 18.2 Sum of angles in triangles 180 9.1 Inexplicit explanation 9.1 No explanation 0
No response 6.5 * correct response
Table 2: Frequencies of students�’ responses and justifications to task 2 Table 3, shows that almost two thirds of the students (62.3%) incorrectly responded that �‘The sum of angles in quadrilateral ABCD is smaller than the sum of angles in quadrilateral EFGH�’. Only 37.7% of them gave an explanation in line with the intuitive rule more A-more B, arguing that: “bigger figure therefore bigger sum of angles” or “bigger sides therefore bigger sum”. A substantial number of participants (10.4%) made a restatement, 9.1% provided an inexplicit explanation of the answer and 5.1% gave no explanation. About a third of the students (35.1%) responded correctly, most of them (28.6%) claiming that �‘The sum of angles in quadrilaterals is the same�’. Lower percentages of students who answered correctly, gave either inexplicit (2.6%) or no explanation (2.3%), or made a restatement (2.6%). A small percentage (2.6%) gave no response.
Solution Justification Task 3 (%) =77
The statement is correct 62.3 More A-more B 37.7 Restatement 10.4 Inexplicit explanation 9.1 No explanation 5.1
The statement is wrong* 35.1 The sum of angles in quadrilaterals is the same 28.6 Restatement 2.6 Inexplicit explanation 2.6 No explanation 2.3
No response 2.6 * correct response
Table 3: Frequencies of students�’ responses and justifications to task 3
Papageorgiou, Monoyiou & Pitta-Pantazi
PME30 �— 2006 4 - 335
Part 2 In the case of the 5th graders, the study showed that the impact of the intuitive rule was even greater in students�’ responses. Due to space limitations we will not show all these tables for the 5th graders, but move directly to the results of the impact of teaching with dynamic geometry software. Table 4, shows that students�’ achievement in tasks 1 and 2 of the pre-test for both groups was the same. Most of the students in both groups gave incorrect answers which were in line with the intuitive rule more A-more B. In particular, they argued that: “bigger triangle therefore bigger sum of angles” and “since the second triangle has got an angle which is bigger than 90o, the sum of its angles is bigger”. It seems that the traditional teaching method had no impact on students thinking, since all of them, except one, in the post-test gave the same incorrect answers in line with the intuitive rule. In contrast, teaching with Euclidraw Jr, had great impact on students�’ thinking, since seven of them responded correctly to the post-test, while at the pre-test gave answers in line with the intuitive rule. More specifically, five of the students who changed their answer, argued that: “all triangles have the same sum of angles”. The other two claimed that: “the sum of angles in all triangles is 180o”.
Experimental group N=19 Traditional group N=20 Tasks Pre-test Post-test Pre-test Post-test Task 1 13 6 13 12 Task 2 16 9 15 15 Task 3 - 10 - 15
Table 4: Frequencies of the students�’ responses in line with the intuitive rule more A-more B for the experimental and traditional group before and after the interventions
Not surprisingly, in task 3 which involved the sum of angles of quadrilaterals, most students in the traditional group gave answers that were in line with the intuitive rule. It is also noteworthy that the seven students of the experimental group, who changed their incorrect answer in task 1 and 2, gave a correct response in this task. Five of them argued that: “all quadrilaterals have the same sum of angles”, while two of them claimed that: “the sum of angles in all quadrilaterals is 180o”.
DISCUSSION The first aim of the study was to examine the impact of the intuitive rule more A-more B on Cypriot 5th and 6th graders. Our findings strongly support that students are affected by the intuitive rule when dealing with comparison tasks involving the sum of angles in triangles and quadrilaterals. Almost half of the students in all tasks (50.1%, 48.1%, 37.7%) gave responses that were in line with the intuitive rule arguing that: “bigger triangle therefore bigger sum of angles”, “bigger sides or angles therefore bigger sum”. It is obvious that a number of participants focused on the external features, such as the size of the triangles, sides and angles. Consequently, the intuitive rule seems remarkably influential in directing students�’ reasoning.
Papageorgiou, Monoyiou & Pitta-Pantazi
4 - 336 PME30 �— 2006
The second aim of the study was to examine whether teaching with the use of dynamic geometry may help children overcome the impact of the intuitive rule. The traditional teaching method had almost no impact on students�’ reasoning, while the use of DGs had greater impact. Most of the time in the traditional group had been spent in cutting and placing the angles and measuring with the protractor. On the contrary, in the experimental group no valuable time had been spent in such time-consuming activities. This group had plenty of time to explore the data, discuss and finally reach a conclusion about the sum of angles in all triangles. Although both groups had observed that the sum of angles is always 180°, the traditional group was not convinced that this rule stands for every triangle, because they had no time or means to explore many triangles nor were their measurements always accurate. The experimental group due to the DGs tools were able to construct a great number of triangles in just a few minutes and also have accurate measurement. The dragging mode gave them the opportunity to broad the range of accessible triangles. Some of them were actually �“extreme cases of triangles�” (e.g. very thin). Students were able to drag the triangles and see that the angles and sides were changing and also have the accurate measurement of these items on a table. At the same time there was only one number on the screen that remained constant: the sum of angles=180°. We believe that this was a very strong representation. The impact on students reasoning was greater than the impact of the traditional method, since more students changed their reasoning in the post-test, but it seems that it is not easy to overcome the effects of the intuitive rule, even after an intervention. In the future, it would be interesting to consider alternative intervention or investigate with the use of delayed tests which intervention has the most long lasting effect. References Botana, F., & Valcarce, J. (2002). A dynamic-symbolic interface of geometric theorem
Discovery, Computers and Education, 38, 21- 35. Fischbein, E. (1999). Intuitions and schemata in mathematical reasoning. Educational
Studies in Mathematics, 38, 11 �– 50. Gawlick, T. (2002). Differential effects of Dynamic Geometry Software on the acquisition
of basic geometric notions. In: A.D. Cockburn & E. Nardi (Eds), Proceedings of PME26, East Aglia, UK, vol. 2, pp. 416-421.
Mariotti, M.A. (2001). Justifying and proving in the Cabri environment. International Journal of Computers for Mathematical Learning, 6(3), 257-281.
National Council of Teachers of Mathematics (2000). Principles and standards for school mathematics. Reston, VA: NCTM.
Stavy, R. & Tirosh, D. (2000). How Students (Mis-) Understand Science and Mathematics: Intuitive Rules. Teachers College Press. New York.
Tirosh, D., & Stavy, R. (1999). Intuitive rules: A way to explain and predict student�’s reasoning. Educational Studies in Mathematics, 38, 51 - 66.
2006. In Novotná, J., Moraová, H., Krátká, M. & Stehlíková, N. (Eds.). Proceedings 30th Conference of the International Group for the Psychology of Mathematics Education, Vol. 4, pp. 337-344. Prague: PME. 4 - 337
THE REFLECTIVE ABSTRACTION IN THE CONSTRUCTION OF THE CONCEPT OF THE DEFINITE INTEGRAL:
A CASE STUDY Theodorus Paschos and Vassiliki Farmaki
Department of Mathematics, Athens University In this paper we report the case study of Maria, a first year university student of Mathematics. By an activity and an interview, we try to analyze her mental operations. Employing the Piagetian theory of reflective abstraction we study the way in which she acts in order to calculate the distance covered in a time interval of a non-uniformly accelerating motion problem. This case study is a part of a research activity that aims at the intuitive approach and understanding of Calculus concepts, using motion problems. The focal analysis of the interview’s content allows for an investigation in depth of qualitative elements of the student’s mathematical thought.
INTRODUCTION The transition to formal mathematical thinking is not an obvious intellectual process for the majority of students. Research in didactics of mathematics has investigated various students�’ difficulties in order to understand definitions, concepts, propositions and their proofs, when we teach them in strict symbolic formulation. The intuitive approach via mathematical or real life situations, which are familiar to the students, may constitute a substantial step toward the emergence of new concepts. The students can develop mathematical models for manipulating the concepts images which may lead them to the need for formal mathematical argument. Many researchers apply a solving problem strategy that first develops new concepts which may be useful, before the appropriate definitions are constructed in order to form the basis for a formal theory (e.g. Poincaré, 1913; Hadamard, 1945). In this paper we report the case study of Maria, a first year student of Mathematics Department, aiming to interpret her mathematical activity on a non-uniformly accelerated motion problem. The graphical representation of the motion in a system of velocity-time axes leads her to the algebraic context aiming to description of a calculation method of the distance covered as an area of the region formed in the graph. In the interview she attempts to justify her initial intuitive answers revealing interesting sides of her mathematical thinking. We employed the theoretical framework of reflective abstraction (Piaget, 1980), as a general scheme able to describe the emergence of the concept of the definite integral as observed from Maria�’s mental operations. This case study is included in a wider research activity which concerns the introduction of the concept of the definite integral and the approach to the Fundamental Theorem of Calculus, to first year students of Mathematics Department. In our analysis of the interview�’s content we employed the focal analysis (Sfard, 2001; Kieran & Sfard, 2001), as we describe below in the section of Methodology.
Paschos & Farmaki
4 - 338 PME30 �— 2006
THEORETICAL FRAMEWORK Reflective abstraction is drawn from what Piaget (1980, pp. 89-97) called the general coordinations of actions, and as such, its source is the subject and it is completely internal. This kind of abstraction leads to a generalization which is constructive and results in �“new syntheses in midst of which particular laws acquire mew meaning�” (Piaget & Garcia, 1989, p.299). From Piaget�’s psychological viewpoint, reflective abstraction is the method that �“it alone supports and animates the immense edifice of logico-mathematical construction�” (Piaget, 1980, p. 92). Piaget distinguishes various kinds of construction in reflective abstraction: (a) The interiorization, as a construction of internal processes, as a way of making sense out of perceived phenomena; as �“translating a succession of material actions into a system of interiorized operations�” (Piaget, 1980, p. 90). Dubinsky (1991, p. 107), argues that �“interiorization permits one to be conscious of an action, to reflect on it and to combine it with other actions�”. (b) The coordination or composition of two or more processes for the construction a new one. (c) The encapsulation or the conversion of a (dynamic) process into a (static) object, in the sense that, �“�… actions or operations become thematized objects of thought or assimilation�” (Piaget, 1985, p. 49). Piaget considered that �“�…mathematical entities move from one level to another, an operation on such �‘entities�’ becomes in its turn an object of the theory�…�” (Piaget, 1972, p.70). (d) When a subject learns to apply an existing schema to a wider collection of phenomena, then we say that the schema has been generalized. Generalisation can also happen when a process is encapsulated to an object. The schema remains the same except that it now has a wider applicability. Piaget referred to all of this as a reproductive or generalizing assimilation (Piaget, 1972, p.23) and he called the generalization extensional (Piaget & Garcia, 1989, p. 299). Dubinsky (1991, p. 102) argues that the interiorization of a process, it is possible for the subject to think of it in reverse, as a means of constructing a new process which consists of reversing the original process. The case of differentiation-integration is an example.
METHODOLOGY The data that we will present is part of a qualitative action research aiming at the investigation of how the students shift from the intuitive to the formal mathematical knowledge. Initially, the aim of the experimental instructive approach was to introduce the first year students to the definite integral. In an interactive milieu the students worked in pairs (activities on work sheets) and discussed about the solution of various motion problems. A group of students participated in individual interviews which fully transcribed. We applied the focal analysis in order to analyse in depth the data from the transcripts. According to Sfard (2001), focal analysis is a methodological tool for investigation of communication effectiveness between individuals. The communication will not be regarded as effective unless, at any given moment, all the participants seem to know what they are talking about and feel confident that all the parties involved refer to the same things when using the same words. The word focus is interpreted as the
Paschos & Farmaki
PME30 �— 2006 4 - 339
expression used by an interlocutor to identify the object of her or his attention. Sfard considers two focal ingredients: pronounced and attended. The pronounced focus concerns the key-words or phrases that imply the attended object. However, there is more to communication than the pronounced and attended aspects. Whatever is pronounced or seen evokes a whole cluster of experiences, and relates the person to an assortment of statements he or she is now able to make on the entity identified by the pronounced focus. This collection of experiences and discursive potentials is called intended focus. The intended focus, which seems to be the crux of the matter, is an essentially private dynamic entity that changes from one utterance to another. In our report we employed focal analysis as a tool for research, interpretation and understanding the mental trajectory of the student interviewed. The attended focus in our analysis is presented in the form of explicit or implicit operations of the interviewee as these are presented by the pronounced focus (Famaki & Paschos, 2005).
THE CASE STUDY The aim of the activity, in which Maria worked, was: (a) to connect the distance covered during a time interval with the area of the region between the velocity graph and the time axis; and, (b) to determine a unit of measurement of area on the given graph and calculate the area of the region by approximation. In the previous activities the students worked on uniform and uniform accelerated motion problems in which they calculated the distance covered as rectilinear figures�’ area on the (u-t) graph. The worksheet of Maria (fig. 1): Consider that the following u-t graph represents the movement of a material point. Calculate by approximation the distance covered during the first second of the motion.
Figure 1: Maria wrote without reasoning that U t2. She mentioned: �“I partition the interval [0, 1] in k equal time sub-intervals in which I consider that the velocity variation is constant�”. She also wrote the formula inS = U t + (1/2) U t in order to calculate the distance covered.
Paschos & Farmaki
4 - 340 PME30 �— 2006
AN EPISODE OF THE INTERVIEW. (Interviewer : I, Maria: M)
1 : We suppose that the graph represents the movement of the point and we 2 want to calculate by approximation the distance covered during the 1st sec. 3 On the worksheet you wrote U t2. How is this derived? 4 : From the graph. It looks alike, so I write �‘roughly�’ [U t2]. 5 I: Are you trying to find the right formula? What if given a different graph? 6 M: I would search for something else. 7 I: Do you mean that you would try to find a correspondence between the 8 graph and a particular function? 9 M: May be, taking into account the parts of the graph. 10 I: Then you would find different formulas for different parts of the graph? 11 M: May be. 12 I: What would your next step be? 13 M: I partition the time interval in k equal sub-intervals and I assume that in 14 each of them the velocity�’s variation is constant, .... aha !!, �… the crucial 15 observation is that the velocity�’s variation is constant, hence the velocity 16 looks like this [U t2]. Since the variation of the velocity is constant, using 17 the knowledge concerning the derivative and that the velocity is 1 at the 18 time instant 1, I come to the conclusion that the velocity looks like this. 19 I: Here, you use the formula inS = U t + (1/2) U t . 20 M: Uin ?, aha!, I mean Uin at a time sub-interval t. I take the rectangle and 21 the triangle above it (she shows on the graph). 22 I: Do you consider the elementary arc as a line segment? 23 M: Yes, exactly. 24 I: And you do so in order to find an approximation to the area of the region? 25 M: I was trying to work with k, so that when k increases the line segment 26 approaches continuously to the curve. OK, the area which I will find will 27 be always bigger than the area of the curvilinear region, but it will 28 approach it continuously as t decreases. 29 : Which is the area that you will find? 30 M: The area which results if we add all the elementary S. 31 : How do you know this method for calculating the distance covered? 32 M: I am using previous knowledge obtained in High school.
�“From the graph. It looks alike�… [U t2]�”. �“�…taking into account the parts of the graph�”.
From the graph to the function’s formula: 1. Find a formula corresponding to graph. 2. Find the function�’s formula in every case.
The function formula
12 / 13-14 �“I partition the time interval in k equal sub-intervals,�… in each of them the velocity�’s variation is constant�”.
Focusing on the partition of the time interval and the function�’s variation in every time sub-interval.
The time interval partition in order to focus on the function
13-14 16-18
�“I assume that in each of them the velocity�’s variation is constant�”. �“Since the variation�… is constant, using the knowledge concerning the derivative�… the velocity is�… [U t2]�”.
Reasoning for choosing the formula U t2: 1. Assume that the velocity�’svariation is [approximately]constant. 2. The constancy of the [rate] of the velocity�’s variation leads to the initial function U t2.
The function formula
19 / 20-21
�“�…at a time sub-interval
t. I take the rectangle and the triangle above it�”.
Focusing on the graph The elementary distance covered is represented approximately by the rectilinear figure.
Approximation to the curvilinear figure
22-24 / 25-26 26-28 29 / 30
�“when k increases the line segment approaches continuously to the curve�” �“the area�…will be always bigger than the area of the�… region, but it will approaches it continuously as t decreases�”. �“The area which results if we add all the elementary S�”.
Area’s approximation 1. As k increases, the line segment converges to the curve. 2. The convergence of the elementary rectilinear figure area to the corresponding curvilinear region area. 3. The area of the whole figure is obtained by adding the elementary areas.
The distance covered is calculated as an area by approximation and addition
Paschos & Farmaki
4 - 342 PME30 �— 2006
INTERVIEW’S CONTENT ANALYSIS - OBSERVATIONS 1. As we observe on the worksheet, the symbols S, t, Uin, t1, t2, used by M. do not appear in the graph. It seems that S is the area of the region corresponding to t, in some of the �‘k equal time intervals [ t]�’ in which she divided [0, 1]. M. interprets intuitively the graph and decides that the formula of the velocity function is U t2. The reservation that she expresses by writing U t2 is not an obstacle for her actions. Decoding her worksheet we observe that she chooses a trapezium whose area she determines as inS = U t + (1/2) U t . The trapezium is determined by t=t2-t1, the line segments corresponding to the values U1 and U2 of the velocity on the corresponding time t1 and t2, and the chord on the curve determined by the points (t1,U1) and (t1,U1). The U corresponds to U2-U1 and Uin to U1. We believe that this mental image is guiding her actions. 2. Let us try to relate what we just mentioned with the dialogue in the episode. At first sight it seems that for M. a function is adequately defined only if given by a formula. Although she observes the graph, she is searching insistently for the formula because she obviously considers that only by knowing the formula she will be able to act (lines 1-11, 14-18). However, if we connect this attempt with what she says at line 32, it becomes clear that she relies in knowledge acquired in High school mathematics, according to which the area is the limiting value of the sum of elementary areas determined by the partition of the region formed between the graph of a continuous function and the x-axis in a closed interval of the domain of the definition of the function. Thus Maria assumes that the calculation of the area presupposes the knowledge of the formula for the velocity function. 3. Maria tries to answer the question �‘how is formula U t2 derived?�’ (lines 1-11). Initially, the image of the given graph leads her to the choice of the formula U t2. Both this choice and the a posteriori attempt of its justification (lines 13-18) reveal interesting mental operations: (a) Maria is �‘trapped�’ in the image which �‘looks like�’ something familiar to her. The mental scheme she has constructed correlating function U(t) = t2 with its graph, seems to constitute an obstacle in this case, exploiting only the information given that point (1,1) belongs to the graph (lines 17-18). According to Brousseau (1983), an obstacle manifests itself from non-random errors. These are rather errors related with a characteristic perception, an old �‘knowledge�’ which manages to dominate in a range of actions. (b) Maria attempts to interpret her initial choice by referring to differential calculus (lines 16-18). She considers that velocity is changing at a constant rate in some t, so that a good approximation results in the corresponding part of the parabola (lines 13-14). However, the choice of linear function for the velocity leads her to some initial function which she knows, from differential calculus, to be of the second degree. In attempting to interpret M.�’s mode of thinking, we might note that: (1) While she recognizes the distance covered as area of a region in the velocity graph (lines 20-21, 26-28), in order to justify her choice U t2, she does not correlate it with the initial velocity function, but with velocity itself. (2) Maria�’s reference to the derivative and the way of transition from a linear to a second degree function (lines 16-18) indicate
Paschos & Farmaki
PME30 �— 2006 4 - 343
particular mental operations on the differentiation that have been interiorized. The interiorization of the procedure of differentiation seems to guide M. to the inversion, as an action that can open the way for her mental construction of the procedure of integration. 4. In the second part of the dialogue, M. explains what she has done in order to approximate the area of the curvilinear region: (a) she �“partitions the time interval in k equal time subintervals�…�” (lines 13-14), and (b) she chooses one of the trapezia which are formed by the partition �‘taking the rectangle and the triangle above it�’ in some t (lines 20-21), whose area, being equal to S=Uin t+(1/2) U t, represents approximately the distance covered. It seems that in the particular trapezium she �‘observes�’ all the trapezia in general that are formed by the partition. The choice of the formula S=Uin t+(1/2) U t, implies the coordination of several processes and mental objects: on the one hand, the coordination of the function process with its graphical representation, where the value Uin and the variation U are represented as line segments�’ length on the graph (here Maria coordinates�–composes the geometric object (trapezium) with the velocity function graph); on the other hand, the coordination of the distance covered function with the area of the formed figure on the graph. Also, (c) she studies the generic trapezium in a dynamic manner, describing a process of approaching at the limit the curvilinear region (lines 25-28), each approximating distance covered being determined by the sum of all the elementary areas S (line 30). Maria�’s description shows that she has a scheme for the calculation of the curvilinear region area which, suitably extended, can lead to the formation of a general scheme. Her actions on several objects (function, graph, geometric figure, limit), the interiorization and the coordination of the processes on these objects, can lead to new processes and, finally, by encapsulation and generalization to the construction of the definite integral concept.
DISCUSSION In the case study presented, we aim to interpret Maria�’s mental operations employed for the construction of the definite integral concept; this construction involves necessarily the coordination of several mathematical objects, and possesses a complexity, typical of the process of learning in general, that does not allow for the observation of a continuous and smooth course of development. Our interpretation is based (a) on the general methodological tool of focal analysis, developed by Sfard (2001), applied to the communication between student and teacher, including the interviews�’ content analysis, and (b) on the theoretical framework of reflective abstraction, developed by Piaget (1980). Through the communication with students and the analysis of the data, using (a) and (b), the stages of knowledge, the concepts images, and the mental mechanism and operations of the students are gradually revealed. Understanding this mechanism will allow us to decide and distinguish whether the students come to a true understanding of the definition of the definite integral concept, as opposed to having just an empirical perception of integration, by which they can act effectively only in a limited and particular framework.
Paschos & Farmaki
4 - 344 PME30 �— 2006
The methodology developed here may have a wider applicability in guiding our actions to help students develop advanced mathematical thinking. With appropriate modifications (regarding the instruction designing and the development of activities) of the methodology employed here, we may well be able to develop learning processes, by which the student is enabled to construct mathematical concepts, in general, and not just for the concept of the definite integral. References Brousseau, G. (1983). Les obstacles epistemologiques et les problemes en mathematiques,
RDM vol. 4 no 2. Dubinsky, Ed (1991). Reflective Abstraction in Advanced Mathematical Thinking, in D.
Tall (Ed.), Advanced Mathematical Thinking, Kluwer Academic Publishers, Dordecht. Farmaki, V., & Paschos, T. (2005). The shift from intuition to formal mathematics: A case
study. Proceedings of 4th Mediterranean Conference on Mathematics Education, Palermo, Italy, Vol. II, p.p.423-434.
Hadamard, J. (1945). The Psychology of Invention in the Mathematical Field, Princeton University Press, (Dover edition, New York 1954).
Piaget, J. (1972). The Principles of Genetic Epistemology, (W. Mays trans.), London, Routledge & Kegan Paul.
Piaget, J. (1980). Adaptation and Intelligence, (S. Eames, trans.), University of Chicago Press, Chicago (original published 1974).
Piaget, J. (1985). The Equilibration of Cognitive Structures (T. Brown and K. J. Thampy, trans.), Harvard University Press, Cambridge MA (original published 1975).
Piaget, J., & Garcia, R. (1989). Psychogenesis and the history of science, (H. Feider, trans.), New York: Columbia University Press.
Poincaré, H. (1982). The Foundations of Science, (translated by Halsted, G. B.), The Science Press, New York (reissued in University Press of America edition).
Sfard A. (2001). There is more to discourse than meets the ears: looking at thinking as communicating to learn more about mathematical learning. Educational Studies in Mathematics Vol. 46, pp 13�–57.
Sfard, A. & Kieran, C. (2001). Preparing teachers for handling students�’ mathematical communication, Gathering knowledge and building tools. To appear in F.L. Lin and T. Cooney (eds.), Making Sense of Mathematics Teacher Education, Kluwer Academic Publishers, Dordrecht, The Netherlands.
2006. In Novotná, J., Moraová, H., Krátká, M. & Stehlíková, N. (Eds.). Proceedings 30th Conference of the International Group for the Psychology of Mathematics Education, Vol. 4, pp. 345-352. Prague: PME. 4 - 345
INFINITY OF NUMBERS: HOW STUDENTS UNDERSTAND IT Erkki Pehkonen1; Markku S. Hannula1, Hanna Maijala2; Riitta Soro3
1University of Helsinki, 2University of Turku, 3Secondary School Loimaa
Some results of the research project ‘Development of Understanding and Self-confidence in Mathematics’, implemented at the University of Turku (Finland) during the academic years 2001–03, are reported. The project was funded by the Academy of Finland (project #51019). It was a two-year study for grades 5-6 and 7-8. The study included a quantitative survey for approximately 150 Finnish mathematics classes out of which 10 classes were selected to a longitudinal part of the study. This paper is based on the survey results, and will focus on students’ understanding of infinity and the development of that understanding. The results show that most of the students did not have a proper view of infinity but that the share of able students grew, as the students got older. Most primary children are very interested in infinity, and they enjoy discussing the concept, if the teacher is only ready for it. On one hand they have a concrete view on the world around and mathematics, and on the other hand they are ready to play with numbers. Thus, questions on infinity may also come into light. Infinity awakes curiosity in children already before they enter school: �“preschool and young elementary school children show intuitions of infinity�” (Wheeler, 1987). However, this early interest is not often met by school mathematics curriculum, and infinity remains mysterious for most students throughout school years.
INFINITY IN MATHEMATICS Actual and potential infinity Consider the sequence of natural numbers 1, 2, 3, �… and think of continuing it on and on. There is no limit to the process of counting; it has no endpoint. Such ongoing processes without an end are usually the first examples of infinity for children; such processes are called potentially infinite. In mathematics, such unlimited processes are quite common. Consider, for example, drawing regular polygons with more and more sides inside a circle, or counting more and more decimals of . However, the interesting cases in mathematics are, when infinity is conceptualised as a realised �“thing�” �– the so-called actual infinity. The set of all natural numbers is an example of actual infinity, because it requires us to conceptualise the potentially infinite process of counting more and more numbers as if it was somehow finished. (Lakoff & Núñez 2000) The question of infinity has its roots already in the mathematics of ancient Greece, for example, the famous paradox of Zenon (cf. Boyer 1985). However, the transition from potential to actual infinity includes a transition from (an irreversible) process to a mathematical object. This step the Greek mathematicians were unable to
Pehkonen, Hannula, Maijala & Soro
4 - 346 PME30 �— 2006
accomplish (Moreno & Waldegg, 1991). In the history of mathematics, the exact definition of and dealing with infinity is something more than one hundred years old. The foundation of infinity as modern mathematics sees it was laid when Dedekind and Cantor solved the problem of potential infinity at the end of the 19. century, and Cantor developed his theory of cardinal numbers. (e.g. Boyer 1985, Moreno & Waldegg, 1991) We may distinguish different kinds of infinities in mathematical objects. For example, the set of natural numbers has infinitely many elements, and it has no upper bound. Therefore, the numbers may become bigger and bigger. But every bounded subset of natural numbers is automatically finite, whereas the same is not valid for rational numbers. For example, the set of rational numbers between zero and one has infinitely many elements, but it is bounded. Furthermore, between any two rational numbers there are infinitely many rational numbers. This property of rational numbers is called density, whereas no set of natural numbers is dense. Tsamir & Dreyfus (2002) summarise the problems mathematicians have had with actual infinity, as follows:
Actual infinity, a central concept in philosophy and mathematics, has profoundly contributed to the foundation of mathematics and to the theoretical basis of various mathematical systems. It has long history and persistently been rejected by mathematicians and philosophers alike, and was highly controversial even in the last century in spite of the comprehensive framework provided for it by Cantorian set theory.
Hence, although the concept of infinity as a potentiality is relatively easy for mathematicians, the concept of actual infinity is counterintuitive and difficult.
Students’ conceptions of infinity Infinity has been an inspiring, but difficult concept for mathematicians. It is no wonder, that also students have had difficulties with it, although they might be fascinated about it. Previous research has identified typical problems and constructive teaching approaches to cardinality of infinite sets. Students use intuitively the same methods for the comparison of infinite sets as they use for the comparison of finite sets. Although students have no special tendency to use �‘correct�’ Cantorian method of "one-to-one correspondence," they are prone to visual cues that highlight the correspondence. For example, students tend to match set {1, 2, 3�…} more easily with the set {12, 22, 32 �…} than with the set {1, 4, 9 �…}. (Tsamir & Dreyfus, 2002) Fishbein, Tirosh and Hess inquired students�’ view of infinite partitioning through using successive halvings of a number segment (Fishbein & al. 1979). They concluded that students on grades 5�–9 seem to have a finitist rather than a nonfinitist or an infinitist point of view in questions of infinity. Even at the university level, the concept of infinity of real numbers is not clear for all students (cf. Merenluoto & Pehkonen 2002). For example, Wheeler (1987) points out that university students distinguished between 0.999�… and 1, because �“the three dots tell you the first number is an infinite decimal�”.
Pehkonen, Hannula, Maijala & Soro
PME30 �— 2006 4 - 347
Focus of the paper We want to find out what is the level of students�’ understanding on infinity in Finnish comprehensive school, and how this understanding develops from grade 5 to grade 7. We will distinguish three levels of students understanding of infinity. The lowest level is when they do not understand infinity, but use only finite numbers. In the intermediate level, the students understand potential infinity, and use processes that have no end. Those students, who have reached the third level, are able to conceptualise actual infinity and the final resultant state of the infinite process.
METHODS The paper describes some partial results of the research project �“Development of Understanding and Self-confidence in Mathematics�”, implemented at the University of Turku (Finland) and financially supported by the Academy of Finland. The project was a two-year longitudinal investigation on grades 5�–8. More results of the project are to be found in the papers Hannula & al. (2004), Hannula & al. (2005), Maijala (2005) and Hannula & al. (2006). In order to measure the level of students�’ self-confidence and understanding of number concept in grades 5 and 7 of the Finnish comprehensive school, we designed a survey. The representative random sample of Finnish students consisted of 1154 fifth-graders (11 to 12 years of age) and 1902 seventh-graders (13 to 14 years of age). The response rate of schools was 72 %. The questionnaire consisted of five parts: student background information, 19 mathematics tasks, success expectation for each task, solution confidence for each task, and a mathematical belief scale. It was administered by teachers during a normal 45-minute lesson in the fall 2001. We focus here on mathematics tasks: In the 19 mathematical questions, there were three that measured students�’ understanding of infinity (tasks 5, 7 and 8). Task 5 measured understanding of infinitely large natural numbers. The two other tasks measured understanding of the density of the rational numbers.
Task 5. Write the largest number that exists. How do you know that it is the largest? Task 7. How many numbers are there between numbers 0.8 and 1.1? Task 8. Which is the largest of numbers still smaller than one? How much does it differ from one?
In this paper we will concentrate on the results of these three infinity tasks.
RESULTS Survey results of competence We categorized student responses to the infinity tasks according to how proper we deemed answers to be. In each question, we can find answers that remain on the level of finite numbers, answers that describe processes that do not end (potential infinity) as well as some answers that indicate that the student has an understanding of the final state of the infinite process (actual infinity).
Pehkonen, Hannula, Maijala & Soro
4 - 348 PME30 �— 2006
In the following, there are the answer categories and scoring for Task 5 given.
Task 5. Write the largest number that exists. How do you know that it is the largest?
Answer categories (and scoring):
- Actual infinity 2: There is no largest number (4 points)
- Actual infinity 1: Infinity, (3 points)
- Potential infinity: Unending number, e.g. 9999�… (2 points)
- Finite: A number larger than one million, e.g. 99999999999999999, centillion (1 point)
To give a general description of the development from fifth grade to seventh grade we compared the answer distributions in each item. In figures 1�–3 we can see, that tasks were demanding and most students scored only zero or one point per task (maximum being 4�–5 points). As expected, seventh graders gave better answers.
0%
10%
20%
30%
40%
50%
60%
70%
0 1 2 3 4
Grade 5Grade 7
Fig. 1. Students�’ scoring for task 5.
In task 5 (infinitely large), the development consisted mainly of the decrease of finite numbers as answers and of increase of different types of infinite answers. In the following, there are the answer categories and scoring for Task 7 given.
Task 7. How many numbers are there between numbers 0.8 and 1.1?
Answer categories (and scoring):
- Actual infinity: Infinitely many (5 points)
- Potential infinity: Unending number, e.g. 9999�… (4 points)
- Finite 3: A finite number larger than one million, e.g. 9999999999999 (3 points)
- Finite 2: Working with more than one decimal, a number between 20 and one million (2 points)
- Finite 1: Working on one decimal level (even incorrectly), 2, 3 or 4 (1 point)
Pehkonen, Hannula, Maijala & Soro
PME30 �— 2006 4 - 349
0%10%20%30%40%50%60%70%80%
0 1 2 3 4 5
Grade 5Grade 7
Fig. 2. Students�’ scoring for task 7.
In task 7 (infinitely many), the decrease was mainly in completely incorrect answers (typically 0.3) and in single decimal thinking, and the biggest increase was in correct answers (infinitely many). In the following, there are the answer categories and scoring for Task 8 given.
Task 8. Which is the largest of numbers still smaller than one? How much does it differ from one?
Answer categories (and scoring):
- Actual infinity: There is no such number (5 points)
- Potential infinity 2: Such number cannot be written (4 points)
- Potential infinity 1: 0.999�… (3 points)
- Finite 2: 0.999; three or more decimals (2 points)
- Finite 1: 0.9; 0.99 (1 point)
0%
10%
20%
30%
40%
50%
60%
0 1 2 3 4 5
Grade 5Grade 7
Fig. 3. Students�’ scoring for task 8.
Pehkonen, Hannula, Maijala & Soro
4 - 350 PME30 �— 2006
In task 8 (infinitely close), the decrease was mainly in completely incorrect answers (typically �‘zero�’ or �‘minus infinity�’), and a significant increase was in answers (0.999�…) that require understanding of potential infinity, but not actual infinity.
The chi square test revealed significant gender differences in task 5 (infinitely large) on fifth grade, and in task 7 (infinitely many) and task 8 (infinitely close) on seventh grade; in both cases boys gave significantly more frequently answers of infinite nature than girls.
Summary of competence results. In the fifth grade, 20 percent of the students have some understanding of the infinity of natural numbers, but only few have any understanding of density of rational numbers. The situation is not much better in the seventh grade. Yet, there is an obvious development from grade 5 to grade 7 in student levels of answering these questions. Infinity of natural numbers is understood earlier than infinity of subsets rational numbers, and potential infinity is understood earlier than actual infinity. Boys perform much better than girls in these tasks dealing with infinity.
Survey results of confidence According to the chi square test both the students�’ success expectation and solution confidence related to their answers (with an exception of the fifth grade boys�’ success expectation). In the tasks 5 and 8, the students�’ solution confidence increased, as their answers got better. In task 7 (infinitely many), however, the relationship between answer and confidence was more complex (Table 1). Students who gave 0- or 1-point answers were modestly uncertain, while solution confidence was much lower for 2-point answers. Confidence remained low for 3- and 4-point answers and was high for 5-point answers. Students who operate on one decimal level seem to be confident on their answers, while those more advanced students who move beyond that level have lower confidence. Only when they realize that there are infinitely many numbers within the given interval, they regain high confidence.
Table 1. The means of solution confidence for responses of task 7.
Points for task 7
N Success expect. mean
Std. deviation
N Solution confid. mean
Std. deviation
0 561 4.06 1.06 539 3.42 1.35
1 1933 4.15 0.94 1922 3.68 1.16
2 171 3.99 0.94 169 2.91 1.19
3 109 3.54 1.28 104 3.10 1.56
4 42 3.88 1.11 40 3.18 1.52
5 210 4.07 1.16 210 3.92 1.12
Total 3026 4.09 1.00 2984 3.58 1.24
Pehkonen, Hannula, Maijala & Soro
PME30 �— 2006 4 - 351
The relationship between answer and success expectation was slightly different from the relationship between answer and solution confidence presented above. For task 5 (infinitely large) those students who gave 3-point answers (�“infinity�”) had highest expectations, for task 8 (infinitely close) expectations were highest when the answer got 2 or 3 points (�“0.999�”, three or more decimals or �“0.999�…�”, respectively). This suggests that those who gave the best answers did not know the right answer beforehand, but they had to produce it during the test. Furthermore, for task 7 (infinitely many) only those students who gave 3-point answers (a large finite number) had much lower expectations than others. Especially those students who gave a 2-point answer (20 �– one million) had roughly as high expectations as others.
In all cases, the students�’ success expectation was higher than their solution confidence. In the result group 2 (Working with more than one decimal, a number between 20 and one million), the difference was the biggest one, and in the best answers (group 5) the smallest one.
Summary of confidence results. The students�’ confidence both before and after solving the task is related to the success they have. That is what we should expect to find. However, those who gave the most sophisticated answers were not the most confident in their expectations.
In the task 7 (how many numbers are there between 0.8 and 1.1), the students�’ confidence had even more complex relationship with success. Many of the students indicated strong false confidence in their one-decimal thinking of numbers. Furthermore, when their thinking begun to advance, their confidence dropped. Sometimes they even had an initial expectation of success before they begun to solve the task but this confidence fell after they had tried to solve the task. Confidence was reassured when they reached the level where they had an understanding of the density of rational numbers.
CONCLUSIONS Boys give better answers than girls in tasks dealing with infinity. This finding can be understood in the light of the general conclusion made by Fennema and Hart (1994). According to them, gender differences in mathematics still remain within the most difficult topics. The test used can be regarded as an example of a very challenging one that is likely to produce large gender differences.
In most cases students who gave better answers were also more confident of their answers. This is what we would have expected. However, findings for task 7 confront this expected tendency. Also Merenluoto (2001) has found similar results. There was a general tendency for confidence to increase as the answers got better, but also some topics where this was not the case.
In another analysis of the longitudinal development of student competence in number concept, we noticed that proper understanding of fractions as numbers is an important predictor of learning the density of rational numbers (Hannula & al. 2004). This
Pehkonen, Hannula, Maijala & Soro
4 - 352 PME30 �— 2006
suggests that learning fractions is an important opportunity for this challenging conceptual change. References Boyer, C.B. (1985). A history of mathematics. Princeton (NJ): Princeton University Press. Fennema, E. & Hart, L.E. (1994). Gender and the JRME. Journal for Research in
Mathematics Education 24 (6), 648 �– 659. Fishbein, E., Tirosh, D. & Hess, P. (1979). The intuition of infinity. Educational Studies in
Mathematics 1, 3-40. Hannula, M. S., Maijala, H., & Pehkonen, E. (2004). Development of understanding and
self-confidence in mathematics; grades 5-8. In M. J. Høines & A. B. Fuglestad (eds.) Proceedings of the 28th Conference of the International Group for the Psychology of Mathematics Education. Vol 3, 17 �– 24. Bergen University College.
Hannula, M. S., Maijala, H., Pehkonen, E. & Nurmi, A. (2005). Gender comparisons of pupils�’ self-confidence in mathematics learning. To appear in: Nordic Studies in Mathematics Education.
Hannula, M.S., Pehkonen, E., Maijala, H. & Soro, R. (2006). Levels of students�’ understanding on infinity. Sent to: Teaching mathematics and computer science.
Lakoff, G. & R. E. Núñes. (2000). Where mathematics comes from; How the embodied mind brings mathematics into being. Basic Books.
Maijala, H. 2005. How does classroom teaching in mathematics look like? A manuscript. Merenluoto, K. (2001). Lukiolaisen reaaliluku; Lukualueen laajentaminen käsitteellisenä
muutoksena matematiikassa [Students�’ real number. Enlargement of the number concept as a conceptual change in mathematics.] University of Turku. Publications C 176.
Merenluoto. K. & Pehkonen, E. (2002). Elementary teacher students�’ mathematical understanding explained via conceptual change. In: Proceedings of the PME-NA XXIV (ed. D. Mewborne, P. Sztajn, D.Y. White, H.G. Wiegel, R.L. Bryant & K. Nooney), 1936�–1939. Columbus (OH): ERIC.
Moreno, A.L.E. & Waldegg, G. (1991). The conceptual evolution of actual mathematical infinity. Educational Studies in Mathematics 22 (3), 211-231
Tsamir, P. & Dreyfus, T. (2002). Comparing infinite sets �– a process of abstraction. The case of Ben. The Journal of Mathematical Behavior 21 (1), 1-23.
Wheeler, M.M. (1987). Children�’s understanding of zero and infinity. Arithmetic teacher, Nov. 1987, 42-44.
2006. In Novotná, J., Moraová, H., Krátká, M. & Stehlíková, N. (Eds.). Proceedings 30th Conference of the International Group for the Psychology of Mathematics Education, Vol. 4, pp. 353-360. Prague: PME. 4 - 353
THE ASSESSMENT OF UNDERGRADUATE MATHEMATICIANS: RECRAFTING ASSESSMENT OF LEARNING TO PROVIDE
OPPORTUNITIES FOR ASSESSMENT AS LEARNING Hillary Povey and Corinne Angier
Sheffield Hallam University
This article considers assessment practices in the field of higher education mathematics courses. It argues that, within the potentially deleterious context of summative assessments, it is possible to re-craft the demands on students in order to incorporate some opportunities for educative assessment. Evidence, in the form of stories of students' experiences, is offered to suggest that such practices have a contribution to make to supporting students in making positive disciplinary relationships.
INTRODUCTION Recent research into students' experience of undergraduate mathematics at an English university included an account of those who fail (Macrae, Brown, Bartholomew and Rodd, 2003). The university which was the object of that study is among the elite higher education institutions for mathematics in the United Kingdom, so entrants arrived there with a history of success with the subject; yet a minority of the participating students performed so poorly in their assessments that they were unable to complete their course successfully. For example, one student, coming to the University with four top grade Advanced Level passes, failed his final year and left without obtaining a degree. Tellingly, we suggest, he was from an ethnic minority background which was untypical of the institution's intake; he had attended at an inner city comprehensive school in Birmingham, again untypically; and he was the first member of his extended family to go to university. This article reports on research data from a significantly different higher education institution, drawing on work currently taking place in the teaching of mathematics in a centre for mathematics education at the ex-polytechnic university in England where we work. It falls within an action research paradigm. We have previously reported an overview of this research project (Povey and Angier 2004). Further analysis suggested that assessment - the nature of the assessments undertaken and the students' response to them - was a key aspect of the students' experience: patterns were observed which will be reported more fully elsewhere. Here, we focus on just two of the students who participated in the study, Geoff and Anna (pseudonyms). Each had previously failed in university mathematics but they both went on to become effective mathematicians, achieving first class honours standard in their final mathematics assessments. Brief stories are told of these two students, pointing up how each of them engaged, more or less wholeheartedly and/or effectively, with the educative aspects of their assessments. We do not regard this research methodology
Povey & Angier
4 - 354 PME30 �— 2006
as unproblematic but nevertheless want to offer an alternative to 'the limited approach of method- or technique-led research' (Nixon et al 2003 p91), one which recognises 'individuals as living storied lives on storied landscapes' (Clandinin and Connelly 2000 p 24). (See Angier and Povey with Clarke, in press, for a fuller discussion.) We conclude by discussing the positive disciplinary relationships that the students were able to create during their course.
ASSESSMENT PURPOSES In recent years, there has been a great deal written about the importance of assessment in education (see Black et al, 2003, Broadfoot and Black, 2004 for recent contributions). Currently, formal assessment can come to dominate the student experience of education at many levels, including at the university. In common with most English universities, these students followed courses which are modularised. A typical pattern was comprised of six separate modules in an academic year, with a separate summative assessment required for each module. Summative assessment, in general, tends to have a negative impact on students, damaging student self-esteem and reducing the student engagement with self-assessment: both these in turn produce a deleterious effect on attainment (Black and Wiliam, 1998a; Harlen and Deakin Crick, 2003). However, regular and repeated summative assessment is a current requirement at our institution.
Given this context, we try to offer the students as wide a range of assessment experiences as possible and, in the case of almost all summative assessment, we try also to provide opportunities for formative assessment and also for what we label educative assessment as well. These three terms help us focus on three different purposes of assessment. The distinction between assessment of learning (summative assessment) and assessment for learning (formative assessment) is now a familiar one (see, for example, Black and Wiliam, 1998b). This paper also explores the notion of assessment as learning, educative assessment, where assessment practices are constructed to be part of the learning process itself. We argue that these educative aspects of assessment help create opportunities for previously lower attaining students, particularly those who come to the university with less social and cultural capital, to re-create their mathematical sense of self productively and in such a way as to support their personal epistemological authority.
Typically, summative assessment of learners has been concerned with certification, its purpose being to pass, fail, grade or rank a student; additional purposes may be to select students for future study or employment or to predict success in future study or employment (Earl, 2003). Summative assessment has also become very widely used as a policy tool (Broadfoot and Black, 2004), largely linked to quality assurance: in this case, it is still concerned with passing, failing, grading and ranking but this time of institutions (or of teachers) rather than of learners (Barton, 1999). On the other hand, formative assessment has been concerned with feedback from teachers to the learners themselves on their performance and their learning; and its
Povey & Angier
PME30 �— 2006 4 - 355
purpose has been to provide information to teachers and students for the enhancement of learning (Black and Wiliam, 1998b). In the case of educative assessment, the assessment practices are recognised as themselves being part of the learning process. Sometimes, the expression 'assessment as learning' is used to describe certain classroom practices which better support the educational development of students (Earl, 2003), emphasising the importance of classroom feedback on well designed tasks as a critical element in helping children learn. Whilst sympathetic to such an approach, and sharing a concern with the nature of tasks which are set for learners, the focus of this article is rather different: it is concerned with changing summative assessment practices to make them, at least in part, educative too.
OUR ASSESSMENT PRACTICES It will be helpful to have some sense of what assessment the students faced. In general, in our assessment practices we aim to devise tasks which are challenging learning experiences, that develop skills and lead the student into new areas of mathematics, rather than closed tasks which take the student back over prior study. Details vary from year to year but the mathematics assessments for these particular students included conventional three hour examinations; oral presentations to their fellow students of independent mathematical research; posters reporting their own mathematical work on given topics; academic essays about the history of mathematics which included working in depth with the associated mathematical topics; individual mathematical projects on topics of the students' choosing leading to individual reports; group projects on a given topic assessed by extensive written joint report and individual viva; academic essays about the nature of mathematics requiring an understanding of recent mathematical developments; and portfolios of more open and/or more closed problem-based coursework tasks. Those aspects of the assessments that we are labelling educative have a number of characteristics. First, the students have the space to explore and find out about their mathematics, space in which to try out different approaches to the subject, space to develop their own ideas. The criteria for assessment allow a wide range of skills to be acknowledged, for example, posing problems as well as solving them or communicating their mathematics visually or orally. Mathematical imagination is valued. Second, the students have the opportunity to become aware of their own progress and to find out about themselves as learners of mathematics. For example, they are sometimes asked to give an account which includes reflections on their attitudes and emotions or to elaborate the process of bringing their mathematical thinking to fruition, explaining and evaluating choices, approaches, methods. Third, many of the assessments involve negotiation, either with their tutors or with their peers or with both. In some case this challenges standard conventions of where authority lies, for example, devising the criteria by which they are to be assessed or deciding, in part, how marks are to be allocated amongst themselves at the end of group projects.
Povey & Angier
4 - 356 PME30 �— 2006
THE STUDY AND ITS CONTEXT The participants in this study were the members of a small cohort of students following one of the longer routes into secondary mathematics teaching. On their course, they studied undergraduate mathematics for two years within the context of a centre for mathematics education; (this was followed by a professional year). They studied mathematics to honours level but within a narrower range than would a single honours student. For the research project, we interviewed each of the students, sometimes alone and sometimes in pairs. The interviews, which were taped and transcribed, were fairly unstructured and were personal and informal in tone. We began working with these texts in a familiar way, each reading and re-reading the transcripts, immersing ourselves in the data and searching for themes. In addition we drew on other qualitative data: written reflections from one or two of the students and email conversations with one or two others. We had not expected the students�’ experience of assessment to be a key issue but it emerged as such from this initial data. In order to explore this theme, we decided to add to our data by looking at some of their written assessed work as well. We used narratives, extracts from two of which follow, to re-interrogate the data. (Unless otherwise stated, the data presented is from the interview transcripts. These have been subject to minor editing for clarity.)
GEOFF’S STORY When he started his current course, Geoff was 32 years old and had spent most of the previous decade working as a heavy goods vehicle driver. Before this, he had performed moderately at mathematics at school but had then, twice, failed the first year of a mathematics degree, once at a Scottish technical university and once at a London polytechnic university. Naturally, following these experiences, mathematics had felt very much like "unfinished business" for Geoff: he had made the very risky decision to return to higher education. In our interview, Geoff was asked to compare his previous experiences of mathematics with his current ones. The first thing he mentioned related to assessment.
It�’s a very different course. The others were predominately exams which makes a big difference. �… [Previously] you�’re taught, you do an exam and you either pass or fail whereas here it�’s like �“Well now you go and find out something�” or you work something out for yourself. We have done a couple of assignments where you start without looking at any reference material at all, it�’s just your own �– you�’re given a starting point and go off and work it out for yourself sort of thing. It�’s just completely different.
We asked him to consider the role of examinations on his current course, particularly the conventional examination with which the pure mathematics strand of the degree finishes at honours level.
It�’s quite bizarre really saying that I don't like exams. I've only done two on this course so far and I did really well in both of them that - having said that, I don't particularly like them. I got back a little bit into the old style which was get all the information in the sessions and then, a week before the exam or a few days before the exam, you then think
Povey & Angier
PME30 �— 2006 4 - 357
about organising your notes and seeing whether you can actually remember any of it. So it was a bit of a cramming session really. That�’s not to say that I didn't pay attention in every other session because I did and I enjoyed a lot of the work that we did but it was very much of a �“I can put this thing aside until I really need it just before the exam�” which is not necessarily the best way to do it.
He compared this with his active and personal involvement with coursework assignments.
For that [exam module], I admit that I didn't do any extra work, I didn't follow it up. I did far too much work in other units which were less credit. But that�’s because it was coursework, it was an ongoing thing, and I kept going back to it and, you know, sharpening it up and adding extra bits and so on and - that�’s probably what happens when it's an exam thing, an exam at the end, you can put things aside and not look at them again. So the coursework keeps you actively involved in the subjects.
He had found that the method of assessment significantly affected his relationship with the subject, how he worked, and his level of engagement. Whereas coursework assessment was educative, examinations not only were not educative in themselves, their influence also spilled over into less productive ways of working within the module itself. The issue of authoritative knowing (Povey, 1995) was a central one for Geoff. Being assessed on his own ideas, on work he had had to structure for himself and defend to himself, was of fundamental importance to him. He was drawn into this in such a way that his relationship with mathematics and his understanding of himself as a mathematician changed. As he neared the end of his course, Geoff was able to see himself not just as a receiver of other people�’s mathematics but also as an author and originator of mathematics as well.
ANNA’S STORY Anna was in her early twenties when she joined the course. She had previously started a degree in Systems Engineering at a Scottish technical university but left after three months. Last minute pressure from her mother had led her to enrol on the current course and she was very ambivalent about her decision. The central problem in her previous university studies had been the teaching style adopted and the concomitant model of knowledge and assessment.
We had lectures in bulk. I think it was up to 300 people in the lecture and then the tutorials were about 20 to 25. I knew that I couldn't go back to that kind of learning �… because it wasn't personal. All they were doing was they gave us good notes �… it was very directed, like one guy literally said at the beginning of term �“If you sit here and write down every single note that I make on the OHP then you will do fine�” - and that was all we had to do.
Anna claimed that, in contrast, she found the processes to which she had been introduced as part of her assessed work on her current course helpful in developing her mathematical thinking. But she also found our way of working difficult to come to terms with. For example, some assessments require the students to reflect on the mathematics they are presenting and on how they came to know it.
Povey & Angier
4 - 358 PME30 �— 2006
I find it strange that tutors care enough or find it important enough to find out what we think and get us to write these strange ramblings. It�’s even funnier that the more honest and completely blunt I am, the more excited the marker seems to get. I still find it odd when tutors are excited about a project we are going to do �– it�’s almost as if they can�’t wait for the results. It�’s great to have such a high degree of choice �… we are encouraged to take part in �‘airy fairy�’ investigations but tutors don�’t seem to be fazed by the fact that I get frustrated and take it out on everyone else, which often frustrate me even more! I remember shouting at [one tutor] about the ridiculousness of doing [a particular] assignment �… while she sat excitedly talking about all the different lines of enquiry and possible variables �… (notes sent to us)
It is clear that the educative aspect of the assessments is not universally welcomed and enjoyed by the students. Anna had some positive experiences to relate about engaging with assignments but could find the openness of the approach and the lack of overt structure frustrating in the extreme. Anna consistently produced coursework of a very high standard indeed but she always claimed to be surprised when her work was valued by other people - her peers and her tutors - and she found it hard to recognise and appreciate her own achievements. She still struggled with thinking about mathematics in a broad and creative way.
I think I liked having the choice but at the same time I find it hard especially getting started because I'm never sure what I want to do. And I think it�’s hard as well at the end because I don't necessarily feel that I have learnt anything, whereas looking at other people�’s work I think "wow�”. You know, they've done so much and they must really understand it now. And I look at what I've done and think "well, you know, this is quite good but I really don't think I've done that much" �… all the time I'm understanding that my definition of maths is too narrow and so you know people say "oh that�’s good�” when I think I haven't actually done any maths. So it�’s confusing that they think that what I've done is so amazing when actually I don't think I had a lot to do with anything. So it�’s kind of like how I perceive maths.
Anna seemed to us to revel in her mathematical studies but she leaves us challenged by our ineffectiveness in engaging her fully in educative assessment. Nevertheless, despite her difficulties, she asserted strongly that her relationship with mathematics had changed significantly, that she had learnt to appreciate mathematics more and that she had had �‘the privilege to be involved in some �“wow�” moments�’ as a result of her creative engagement with the subject.
DISCUSSION We have used student stories to try to capture something of the experience of what we have termed educative assessment. Our students struggle and we expect them to do so. They struggle with the mathematics, they struggle with our definitions of mathematics and they struggle with the forms of assessment that we practise. They may not necessarily agree with our stance �– indeed the evidence suggests they often do not �– but they are consciously engaging in the debate about what is of value. We recognise the description given by a teacher supervisor of students in Denmark for
Povey & Angier
PME30 �— 2006 4 - 359
whom the learning of mathematics in higher education was entirely structured around their assessed project work. In the early stages of their learning,
the students feel �‘overloaded�’ and experience a mild form of hopelessness. They have to work a lot on their own without the usual, small, reassuring problems. This is fully intended because it, to some extent, stimulates the researcher�’s state of mind. (Vithal et al, 1995: 204)
We believe that that �‘researcher�’s state of mind�’ is developed by educative assessment practices, where the students have to engage in doing mathematics, in creating the mathematics for themselves, rather than simply meeting the results of the mathematical activity of others. In many countries, few people choose to study mathematics in post-compulsory education and, of those who do, many are reported failing and/or disliking the subject (Mann, 2003; Macrae et al, 2003; Boaler and Greeno, 2000). Jo Boaler found students were unwilling to pursue mathematics because
they did not want to be positioned as received knowers, engaging in practices that left no room for their own interpretation and agency. (Boaler, 2002:115)
Many undergraduates find current practices which emphasise �‘a �“performance�” route�’ (Mann, 2003:20) to success, with mathematics being �‘ �“a kind of competition you train for�” �‘(Mann, 2003:19), alienating and oppressive. We suggest that conventional assessment practices in mathematics in higher education, currently almost exclusively individual timed examination performance (Rodd, 2002), contribute in no small measure to this. The two narratives indicate that students' assessed work is an important site for the building of their relationships with the discipline of mathematics and for their work on their developing identities as mathematicians. They give evidence that re-crafting assessment practices to allow frequent opportunities for educative as well as formative and summative assessment impacts on ways of knowing and contributes to allowing the development of both epistemological authority and agency in learners of mathematics; and that these things happen in ways which open up the subject to wider participation and make successful engagement with mathematics not just the prerogative of the few. References Angier, C. and Povey, H. with Michelle, C. (in press). 'Storying Joanne, an undergraduate
mathematician', Gender and Education. Barton, P. (1999). Too Much Testing of the Wrong Kind, Too Little of the Right Kind in K-
12 Education, Princeton, New Jersey, Educational Testing Service. Black, P., Harrison, C., Lee, C., Marshall, B. and Wiliam, D. (2003). Assessment for
Learning: Putting it into Practice, Maidenhead, Open University Press. Black, P. and Wiliam, D. (1998a). Inside the Black Box: Raising Standards through
Classroom Assessment, http://www.pdkintl.org/kppan/kbla9810.htm, January, 2001 Black, P. and Wiliam, D. (1998b). Assessment and classroom learning, Assessment in
Education, 5 (1) 7-74.
Povey & Angier
4 - 360 PME30 �— 2006
Boaler, J. (2002). �‘The development of disciplinary relationships: knowledge, practice, and identity in mathematics classrooms�’, Proceedings of the 26th PME conference, Norwich, 2002, (2) 113-120.
Boaler, J. and Greeno, J. (2000). �‘Identity, agency and knowing in mathematical worlds�’ in Boaler, Jo (ed) Multiple Perspectives on Mathematics Teaching and Learning, Westport, CT, Ablex Publishing.
Broadfoot, P. and Black, P. (2004). 'Redefining assessment? The first ten years of Assessment in Education' Assessment in Education, 11 (1) 7-27.
Clandinin, D J and Connelly, F M (2000). Narrative Inquiry: Experience and Story in Qualitative Research, San Francisco, Jossey Bass.
Earl, L. (2003). Assessment as Learning: Using Classroom Assessment to Maximise Student Learning, Thousand Oaks, California, Corwin Press.
Harlen, W. and Deakin, C. (2003). 'Testing and motivation for learning'. Assessment in Education, 10 (2) 169-207.
Macrae, S., Brown, M., Bartholomew, H. and Rodd, M. (2003). 'The tale of the tail: an investigation of failing single honours mathematics students in one university', Proceedings of the BSRLM Day Conference, Oxford, June 2003, pp. 55- 60.
Mann, C. (2003). Indicators of Academic Performance, http://www.admin.cam.ac.uk/reporter/2003-03/weekly/5913/6.html, December 2003.
Nixon, J., Walker, M. and Clough, P. (2003). �‘Research as thoughtful practice�’ in Sikes, P., Nixon, J. and Carr, W. (Eds) The Moral Foundations of Educational Research Knowledge, Inquiry and Values, Maidenhead, Open University Press.
Povey, H. (1995). ‘Ways of knowing of student and beginning mathematics teachers and their relevance to becoming a teacher working for change’, unpublished PhD thesis, University of Birmingham.
Povey, H. and Angier, C. (2004). 'Some undergraduates�’ experiences of learning mathematics', the Proceedings of the 28th PME Conference, Bergen, 2004.
Rodd, M. (2002). �‘Hot and abstract: emotion and learning mathematics�’, International Conference on the Teaching of Mathematics at Undergraduate Level, Crete, John Wiley.
Vithal, R., Christiansen, I. and Skovsmose, O. (1995). 'Project work in university education: a Danish experience: Aalborg University ' in Educational Studies in Mathematics 29 (2) 119-223.
2006. In Novotná, J., Moraová, H., Krátká, M. & Stehlíková, N. (Eds.). Proceedings 30th Conference of the International Group for the Psychology of Mathematics Education, Vol. 4, pp. 361-368. Prague: PME. 4 - 361
SOCIAL COGNITION EMERGING FROM STUDENT-TO-STUDENT DISCURSIVE INTERACTIONS DURING
MATHEMATICAL PROBLEM SOLVING Arthur B. Powell
Rutgers University This paper presents empirical evidence for the theoretical construct of social cognition—the cognitive by-product of the discursive interactions among small groups of individuals collaborating in mathematical problem solving that is not attributable to any one individual. The example is of four high school students, working independently solving a combinatorial problem set in a non-Euclidean context.
INTRODUCTION In mathematics education, discourse and its cognitive influence in mathematics classrooms have been the subject of numerous studies. The importance of communication and discussion for learning are processes about which mathematics educators agree. As Cobb, Boufi, McClain, and Whitenack (1997) note, consensus on this point within the mathematics education community transcends theoretical differences and include researchers who draw primarily on mathematics as a discipline, on constructivist theory, and on sociocultural perspectives. This consensus notwithstanding, two broad lines of research can be distinguished. On the one hand, the nature of communications and how teachers can encourage and support communicative acts among students that are both productive and mathematical have been the subject of empirical research and theoretical reflection (for example, see Alrø & Skovsmose, 1998; Fernandez, 1994; Maher, 1998; O'Connor & Michaels, 1996; Seeger, 2002; Sfard, 2000, 2002). In these studies, teachers’ are seen as instrumental in triggering on the part of students either reflective discourse or otherwise productive discussions. However, a question that arises is whether and under what condition can such discussions occur among students themselves, particularly when teachers’ play a minimal role in triggering reflective discourse. Furthermore, do such social collaborations enable students to go beyond exchanging information to developing discursively ideas and reasoning that go beyond those of any individual student but that are later reflective of individual student’s understanding? That is, is social cognition possible in these settings?
THEORETICAL PERSPECTIVE In this study, key terms include discourse, student-to-student or peer mathematical discussion, and social cognition. Discourse here refers to language (natural or symbolic) used to carry out tasks—for example, social or intellectual—of a community. In agreement with Pirie and Schwarzenberger (1988), peer conversations are mathematical discussions when they possess the following four
Powell
4 - 362 PME30 — 2006
features: purposeful, focus on a mathematical topic, involve genuine student contributions, and are interactive. The term social cognition refers to a process through which ideas and reasoning emerge from discursive interactions of interlocutors that go beyond those of any individual interlocutor but are later reflective of individual interlocutor’s understanding. The product of social cognition is not attributable to any one individual but rather is a negotiated entity, constituted from discursive interactions, and eventually a shared part of the awareness of each interlocutor. This notion surfaced from analysis of features and functions of conversational exchanges among four students engaged collaboratively, without assigned roles, to understand and resolve an open-ended, combinatorial problem, which is presented in the next section. The analysis of conversational exchanges is informed by the work of Davis (1997), who inquires into teacher listening and its consequent impact on the growth of student understanding. This study builds on his inquiry. It also applies and extends Davis’s categories to analyze discursive interactions of students engaged in discourse. This theoretical construct contains has four category—evaluative, informative, interpretative, and negotiatory—described below, and guides the inquiry into how learners’ discursive exchanges contribute to the mathematical ideas and reasoning that they evidence.
Evaluative: an interlocutor maintains a non-participatory and an evaluative stance, judging statements of his or her conversational partner as either right or wrong, good or bad, useful or not. Informative: an interlocutor requests or announces factual data to satisfy a doubt, a question, or a curiosity (without evidence of judgment). Interpretive: an interlocutor endeavors to tease out what his or her conversational partner is thinking, wanting to say, expressing, and meaning; an interlocutor engages an interlocutor to think aloud as if to discover his or her own thinking. Negotiatory: an interlocutor engages and negotiates with his or her conversational partner; the interlocutors are involved in a shared project; each participates in the formation and the transformation of experience through an ongoing questioning of the state of affairs that frames their perception and actions.
These are not mutually exclusive categories; a unit of meaningful conversation may have more than one interlocutory feature. Based on the theoretical perspective of this study and analysis of the data, social cognition arises from negotiatory interlocution in a collaborative problem-solving setting. It presupposes that interlocutors are engaged in a student-to-student, mathematical discussion with minimal teacher intervention.
METHOD The participants are four students in their senior year of high school, who are studying advanced high school mathematics and who, from their entry into first grade have participated in mathematical activities of a longitudinal study on the
Powell
PME30 — 2006 4 - 363
development of mathematical ideas.1 For twelve years, these students have engaged tasks from several strands of mathematics, including algebra, combinatorics, probability, and calculus both in the context of classroom investigations as well as in after school settings (Maher, 2005). In high school, they worked on mathematical problem solving typically found in elementary undergraduate classes. In this study, during an after-school problem-solving session, the students collaborate on a culminating task—The Taxicab Problem—of the research strand on combinatorics:
A taxi driver is given a specific territory of a town, shown below. All trips originate at the taxi stand. One very slow night, the driver is dispatched only three times; each time, she picks up passengers at one of the intersections indicated on the map. To pass the time, she considers all the possible routes she could have taken to each pick-up point and wonders if she could have chosen a shorter route. What is the shortest route from a taxi stand to each of three different destination points? How do you know it is the shortest? Is there more than one shortest route to each point? If not, why not? If so, how many? Justify your answer.
Accompanying this problem statement, the participants have a map, actually, a 6 x 6 rectangular grid on which the left, uppermost intersection point represents the taxi stand. The three passengers are positioned at different intersections as blue, red, and green dots, respectively, while their respective distances from the taxi stand are one unit east and four units south, four units east and three units south, and five units east and five units south. The data sources consist of the problem task; a video record of about 100 minutes of the activity of the four participants from the perspective of two video cameras; a transcript of the videotapes combined to produce a fuller, more accurate verbatim record of the research session; the participants’ inscriptions; and researcher field notes. The transcript is a textual rendering of verbal interactions, specifically, turn exchanges among the participants and between them and researchers, which in all consists of 1,619 turns at talk. Our analytic method employs a sequence of phases, informed by grounded theory (Charmaz & Mitchell, 2001), ethnography and microanalysis (Erickson, 1992), and an approach for analyzing video data (for an elaboration and examples of these phases, see Powell, Francisco, & Maher, 2003). Besides the non-Euclidean geometric setting, the Taxicab Problem has an underlying mathematical structure and encompasses concepts that resonate with those of other problems the participants have worked on in the longitudinal study (for details, see Maher, 2005). Their implicit task was to formulate and test conjectures. Researchers explicitly announced that they were to explain and justify conclusions. After they 1 This work was supported by grant MDR-9053597 (directed by R. B. Davis and C. A. Maher) and REC-9814846 (directed by C. A. Maher) from the National Science Foundation. Any opinions, findings, and conclusions or recommendations expressed in this paper are those of the authors and do not necessarily reflect the views of the National Science Foundation.
Powell
4 - 364 PME30 — 2006
worked on the problem for about an hour and a half, researchers listened as they presented their resolution and asked questions to follow movements in their discourse toward further justification of their solution. Their resolution goes beyond the problem task: They generalize it and propose isomorphic propositions. It is in both of these actions that the students evidence of social cognition.
RESULTS In an earlier analysis of these data from the analytic lens of the four categories of interlocution, Powell and Maher (2002) have illustrated that the conversational interactions among learners can advance their subsequent individual and collective actions. They showed how among the four interlocutory categories,
(1) interpretive and hermeneutic [negotiatory] interlocution have the potential for advancing the mathematical understanding of individual learners working in a small group, (2) the personal or individual understanding of a learner is intermeshed with the understanding of his or her interlocutors, and (3) the mathematical ideas and understanding of an individual and his or her group emerge in a parallel fashion. (p. 328).
The purpose of this paper is to provide evidence of social cognition. As will be shown, social cognition is possible when interlocutors are engaged in negotiatory interlocution. It is during this type of conversational exchange that it is possible for ideas and reasoning to emerge that goes beyond those of any individual interlocutor and that are later reflected in individual interlocutor’s understanding. In the research sessions, the students work independent of the intervention from researchers and engage in student-to-student, mathematical discussions. Clockwise from the left, seated on three sides of a trapezoidal-shaped table are the four participants, Michael, Romina, Jeff, and Brian. At the start of the session, Researcher 1 pulls up a chair, sits on the right side of the table between Jeff and Brian, thanks the four students for coming, distributes the Taxicab Problem, and asks them to read and see whether they understand the task. Afterward, the researcher stands up and, backing away from the table, removes her chair. In the first four minutes of the research session, the researcher spends little time at the table with the students and responds only to student questions in a tailored yet sparse manner. From then until 64 minutes later, the students engage with themselves. They rather quickly organize themselves by requesting colored markers and assigning subtasks to each other. Jeff inquires about why the routes to the blue destination point have the same length, Michael explains. Romina requests help in devising an area, Jeff and Michael respond and inform her that the applicable notion is perimeter, not that of area. In general, the students carefully and respectfully listen and respond to each other’s questions, statements, and ideas. The first example of social cognition occurs after 14 minutes into the problem solving session. After almost 14 minutes into the research session, there is an interesting and pivotal interaction among Romina, Brian, and Jeff:
ROMINA: I think we’re going to have to break it apart and draw as many as possible.
Powell
PME30 — 2006 4 - 365
BRIAN: Yeah, //that’s what I’m going to do. JEFF: //And then have that lead us to something? What if we do- why don’t we
do easier ones? You know what I’m saying? What if the- the thing- Do you have another one of these papers?
In Episode 1, an agenda for action emerges from the students’ interlocution. Brian and Jeff accept the task implied in Romina’s statement and act on her heuristic. Furthermore, Jeff refines her suggestion in his interrogative: “why don’t we do easier ones?” Romina’s statement and Jeff’s interrogative establish a new agenda for the group’s actions. Importantly, this action agenda represents a watershed in their mathematical investigation. From this point onward, they no longer work on the combinatorial problem as given but instead pose and work on simpler situations to glean relevant information and extract insights from those situations so as to inform their understanding and resolution of the given problem. This agenda emerges results from the students’ negotiatory interlocution. It was not posed fully formed by any one student. However, after its emergence from the social cognition of the group forms part of the students’ understanding of how they will proceed to resolve the given problem. Another instance of social cognition transpires over many turns of speech, spanning from about turn 159 to turn 1320. Space does not permit a full illustration of the development of the ideas and reasoning that comprise the students’ social cognition. They have continual discursive interactions with the aim of building an isomorphism between a rule for generating the entries of Pascal’s triangle and the number of shortest routes to points on the taxicab grid. Early in their work, the students manifest embryonic thinking about an isomorphism. Romina wonders aloud: “can’t we do towers2 on this” (turn 159).3 Her public query catalyzes a negotiatory interlocution among Michael, Jeff, and her. Jeff, responding immediately to Romina, says, “that’s what I’m saying,” (turn 160) and invites her to think with him about the dyadic choice (“there or there” turn 162) that one has at intersections of the taxicab grid. Furthermore, he wonders whether one can find the number of shortest routes to a pick-up point by adding up the different choices one encounters in route to the point (turn 162). Romina proposes that since the length of a shortest route to the red pick-up point is 10, then “ten could be like the number of blocks we have in the tower” (turn 169). Romina’s query concerning the application of towers to the present problem task prompts Michael’s engagement with the idea, as well. As if advising his colleagues and himself, he reacts in part by saying, “think of the possibilities of doing this and then doing that” (turn 180). While uttering these words, he points at 2 The Towers Problem is to build towers (for example, with Unifix cubes) of particular heights when selecting from a certain number of colors. From grades 3 to 10, the participants have worked on versions of this problem with varied conditions. 3 For Romina and other participants in the longitudinal study, this comment is pregnant with mathematical and heuristic meaning derived from their constructed, shared experiences with tasks and inscriptions in the combinatorial and probability strands of the study.
Powell
4 - 366 PME30 — 2006
an intersection; from that intersection gestures first downward (“doing this”), returns the to point, and then motions rightward (“doing that”). Similar to Jeff’s words and gestures, Michael’s actions also acknowledge cognitively and corporally the binomial aspect of the problem task. Through their negotiatory interactions, Michael, Jeff, and Romina raised the prospect of as well as provided insights for building an isomorphism between the Taxicab and Towers Problems. The prospect and work of building such an isomorphism reemerges several more times in the participants’ interlocution, and each time, they further elaborate their insights and advance more isomorphic propositions. Eventually, the building of isomorphisms dominates their conversational exchanges. Approximately thirty-five minutes after Romina first broached the possibility of relating attributes of the Towers Problem to the problem at hand, the participants reengage with the idea. Romina speculates that between the two problems one can relate “like lines over” to “like the color” and then “the lines down” to the “number of blocks”(turn 738). What is essential here is Romina’s apparent awareness that each of the two different directions of travel in the Taxicab Problem needs to be associated with different objects in the Towers Problem. Romina uses this insight later in the session. She transfers the data that she and her colleagues have generated from a transparency of a 1-centimeter grid to plain paper. Their data are equivalent to binomial coefficients. She identifies one unit of horizontal distance with one Unifix cube of color A and one unit of vertical distance with one Unifix cube of color B:
Like doesn’t the two- there’s- that I mean, that’s one- that means it’s one of A color, one of B color [pointing to the 2 in Pascal’s triangle]. Here’s one- it’s either one- either way you go. It’s one of across and one down [pointing to a number on the transparency grid and motions with her pen to go across and down]. And for three that means there’s two A color and one B color [pointing to a 3 in Pascal’s triangle], so here it’s two across, one down or the other way [tracing across and down on the transparency grid] you can get three is two down [pointing to the grid]. (turn 1210)
Furthering the building of their isomorphism, Michael offers another propositional foundation. Pointing at their data on the transparency grid and referring to its diagonals as rows, he notes that each row of the data refers to the number of shortest routes to particular points of a particular length. For instance, pointing the array—1 4 6 4 1—of their transparency, he observes that each number refers to an intersection point whose “shortest route is four” (turn 1203). Moreover, he remarks that one could name a diagonal by, for example, “six” since “everything [each intersection point] in the row [diagonal] has shortest route of six”(turn 1205). In terms of an isomorphism, Michael’s observation points in two different directions: (1) it relates diagonals of information in their data to rows of numbers in Pascal’s triangle and (2) it notes that intersection points whose shortest routes have the same length can have different numbers of shortest routes. Later in responding to a researcher’s question, the participants develop a proposition that relates how they know that a particular intersection in the taxicab grid
Powell
PME30 — 2006 4 - 367
corresponds to a number in Pascal’s triangle. They focus their attention on their inscriptions, A and B, in Figure 1. Michael and Romina discuss correspondences between the two inscriptions. Referring to a point on their grid that is five units east and two units south, Romina associates the length of its shortest route, which is seven, to a row of her Pascal’s triangle by counting down seven rows and saying, “five of one thing and two of another thing”(turn 1313). Michael inquires about her meaning for “five and two” (turn 1314). Both Romina and Brian respond, “five across and two down”(turns 1317 and 1318). She then associates the combinatorial numbers in the seventh row of her Pascal’s triangle to the idea of “five of one thing and two of another thing,” specifying that, left to right from her perspective, the first 21 represents two of one color, while the second 21 “is five of one color” (turn 1320), presuming the same color. Using this special case, Romina hints at a general proposition for an isomorphism between the Taxicab and Towers Problems.
DISCUSSION The above presents evidence that through negotiatory interlocution students build an isomorphism during the course of the problem-solving session. The isomorphism results from social cognition since not one student presents the isomorphism fully formed but rather their discursive interactions constitute a co-construction of the isomorphism. It can be observed that early in the problem-solving session the three participants—Romina, Jeff, and Michael—articulate awareness of object and relational connections between their current problem task and a former one, the Towers Problem. Later, upon noticing that their array of data resembles Pascal’s triangle and conjecturing so, the participants embark on building an isomorphism between the Towers Problem and the Taxicab Problem as an approach to justifying their conjecture since from previous experience they know that Pascal’s triangle underlies the mathematical structure of the Towers Problem. In this sense, their strategy can be interpreted as justifying their conjecture by transitivity: (a) Pascal’s triangle is equivalent to Towers and (b) Towers is equivalent to Taxicab; therefore implying that (c) Pascal’s triangle is equivalent to Taxicab. They know (a) is true and embark on demonstrating (b) to justify and conclude (c).
References Alrø, H., & Skovsmose, O. (1998). That was not the intention! Communication in
mathematics education. For the Learning of Mathematics, 18(2), 41-51. Charmaz, K., & Mitchell, R. G. (2001). Grounded theory in ethnography. In P. Atkinson, A.
Coffey & S. Delamont (Eds.), Handbook of ethnography (pp. 160-174). London: Sage.
Cobb, P., Boufi, A., McClain, K., & Whitenack, J. (1997). Reflective discourse and collective reflection. Journal for Research in Mathematics Education, 28(3), 258-277.
Davis, B. (1997). Listening for differences: An evolving conception of mathematics teaching. Journal for Research in Mathematics Education, 28(3), 355-376.
Powell
4 - 368 PME30 — 2006
Erickson, F. (1992). The Interface between ethnography and microanalysis. In M. D. LeCompte, W. L. Millroy & J. Preissle (Eds.), The handbook of qualitative research in education (pp. 201-225). San Diego: Academic Press.
Fernandez, E. (1994). A kinder, gentler Socrates: Conveying new images of mathematics dialogue. For the Learning of Mathematics, 14(3), 43-46.
Maher, C. A. (1998). Kommunikation och konstruktivistisk undervisning [Communication and constructivist teaching]. In A. Engrstom (Ed.), Matematik och reflektion: En introduktion till konstruktivismen inom matematikdidaktiken (pp. 124-143). Lund, Sweden: Studenlitteratur.
Maher, C. A. (2005). How students structure their investigations and learn mathematics: Insights from a long-term study. The Journal of Mathematical Behavior, 24(1), 1-14.
O'Connor, M. C., & Michaels, S. (1996). Shifting participant frameworks: Orchestrating thinking practices in group discussion. In D. Hicks (Ed.), Discourse, learning, and schooling (pp. 63-103). New York: Cambridge University.
Pirie, S., & Schwarzenberger, R. (1988). Mathematical discussion and mathematical understanding. Educational Studies in Mathematics, 19(4), 459-470.
Powell, A. B., Francisco, J. M., & Maher, C. A. (2003). An analytical model for studying the development of mathematical ideas and reasoning using videotape data. The Journal of Mathematical Behavior, 22(4), 405-435.
Powell, A. B., & Maher, C. A. (2002). Inquiry into the interlocution of students engaged with mathematics: Appreciating links between research and practice. In D. S. Mewborn, P. Sztajn, D. Y. White, H. G. Wiegel, R. L. Bryant & K. Nooney (Eds.), Proceedings of the twenty-fourth annual meeting of the North American Chapter of the International Group for the Psychology of Mathematics Education (Athens, Georgia) (Vol. 1, pp. 317-329). Columbus, OH: ERIC Clearinghouse for Science, Mathematics, and Environmental Education.
Seeger, F. (2002). Research on discourse in the mathematics classroom: A commentary. Educational Studies in Mathematics, 49(1-3), 287-297.
Sfard, A. (2000). On reform movement and the limits of mathematical discourse. Mathematical Thinking and Learning, 2(3), 157-189.
Sfard, A. (2002). There is more to discourse than meets the ears: Looking at thinking as communicating to learn more about mathematical learning. Educational Studies in Mathematics, 46(13-57).
2006. In Novotná, J., Moraová, H., Krátká, M. & Stehlíková, N. (Eds.). Proceedings 30th Conference of the International Group for the Psychology of Mathematics Education, Vol. 4, pp. 369-376. Prague: PME. 4 - 369
UNDERSTANDING TEACHERS’ MATHEMATICAL KNOWLEDGE FOR TEACHING: A THEORETICAL AND
METHODOLOGICAL APPROACH* Arthur B. Powell and Evelyn Hanna
Rutgers University We explore an emergent approach for understanding the development of teachers’ mathematical knowledge for teaching that is rooted in the discursive interaction of practice and emerges from an ongoing investigation of learning and teaching. We offer a theoretical foundation for the methodological approach and examine the interplay of knowledge that is pedagogical, mathematical, and epistemological.
INTRODUCTION The mathematical knowledge and pedagogical competence of teachers are intertwined, and improving both is key to upgrading students’ mathematical achievement. High quality standards, curriculum, instructional materials, and assessments are important but not enough to improve students’ learning of mathematics. As Ball, Hill and Bass (2005) argue, “little improvement is possible without direct attention to the practice of teaching … [h]ow well teachers know mathematics is central” (p. 14). Conceivably, this explains why recently there has been considerable discussion and research on teachers’ subject-matter knowledge, pedagogical content knowledge, and mathematical knowledge for teaching (for example, Ball, 2000; Fennema et al., 1996; Hill, Rowan, & Ball, 2005; Maher & Alston, 1990; Shulman, 1986; Tirosh, 2000). A pressing area of inquiry concerns the nature and development of mathematical knowledge that facilitates effective teaching and, in turn, promotes successful mathematics learning. Educators and researchers of mathematical education agree that teachers benefit from having a disposition toward self-sustaining and generative change as well as a robust knowledge of mathematics that is primarily conceptual and specialized to the insights and particularities appropriate for teaching (Ball, Hill, & Bass, 2005; Franke, Carpenter, Fennema, Ansell, & Behrend, 1998; Sowder, in press). This consensus notwithstanding, a critical question that arises is by what means can teacher educators and researchers understand the development of teachers’ mathematical knowledge for teaching. How might educators and researchers investigate and understand the development of teachers’ mathematical knowledge for teaching? One approach is exemplified by
* This work was partially supported by a grant from the National Science Foundation, REC-0309062 (directed by Carolyn A. Maher, Arthur B. Powell, and Keith Weber). Any opinions, findings, and conclusions or recommendations expressed in this paper are those of the authors and do not necessarily reflect the views of the National Science Foundation.
Powell & Hanna
4 - 370 PME30 — 2006
recent efforts to develop large-scale, multiple-choice measures of the content knowledge for teaching held by teachers and to evaluate the extent to which professional development programs contribute to this knowledge (Hill & Ball, 2004; Hill, Schilling, & Ball, 2004). Another perspective seeks descriptions of how teachers develop their mathematics knowledge for teaching in the complex, discursive interaction of actual practice as students evidence their mathematical ideas and reasoning. To reply to the methodological question of how to understand the development of specialized content knowledge needed for effective practice requires both theoretical and empirical responses. In this paper, we explore an emergent approach for understanding the development of teachers’ mathematical knowledge for teaching rooted in the discursive interaction of practice. In so doing, we also offer a theoretical foundation for the methodological approach.
THEORETICAL PERSPECTIVE The theoretical perspective for our methodological approach has several sources. It is based on the assumption that effective teaching requires teachers to attend to and endeavor to understand the mathematical ideas and reasoning of their students (Maher, 1998; Sowder, in press). In agreement with Shulman (1986) and Ball et al. (2005), our perspective recognizes that to teach a school subject like mathematics effectively necessitates knowledge of mathematics that “goes beyond the knowledge of subject matter per se to the dimension of subject matter knowledge for teaching” (Shulman, 1986, p. 9). However, our view of mathematical knowledge for teaching transcends an epistemological stance that it entails “ways of representing and formulating the subject that make it comprehensible to others” (Shulman, 1986, p. 9). In contrast, we embrace the idea that strictly speaking teachers cannot convey or communicate knowledge to students. Instead, teachers can invite students to engage with a mathematical task and discursively connect with students to understand their emergent mathematical ideas and reasoning, as they build their knowledge. Researchers can infer teachers’ mathematical knowledge for teaching by analyzing their practice in action, including interactions with students, questions they ask, issues they make salient to students, student artifacts they use, as well as post-session analyses they perform of their actions, plans, and students’ work. Interaction also provides a lens through which to view mathematical knowledge for teaching and pedagogical knowledge. These two kinds of knowledge though conceptually different do at times, as we have observed, interact and even intersect. When they do intersect, they are essentially indistinguishable one from the other. This is analogous to two non-parallel planes intersecting and forming a line. It is not useful to say whether the line belongs strictly to one plane or the other. It belongs to both planes simultaneously. Like the line, teachers’ mathematical knowledge for teaching can be observed through their pedagogical moves; that is, by way of their pedagogical knowledge revealed in their moment-to-moment discursive interaction with students. In this paper, based on our methodological approach, we provide
Powell & Hanna
PME30 — 2006 4 - 371
empirical evidence to substantiate the theoretical claim that pedagogical and mathematical knowledge for teaching are in some instances mutually constitutive. Our notion of pedagogical knowledge also addresses teachers’ inferred knowledge of the status of students’ knowledge. A component of teachers’ practice is their ever-evolving, inferential awareness of students’ emerging mathematical knowledge. As Steinbring (1998) notes, a teacher “has to become aware of the specific epistemological status of the students’ mathematical knowledge. … to diagnose and analyze students’ constructions of mathematical knowledge and … to compare those constructions to what was intended to be learned in order to vary the learning offers accordingly” (p. 159). Teachers’ epistemological awareness of students’ mathematical knowledge while teaching enables teachers to pose new challenges for students to advance their building of mathematical ideas and reasoning. We see our work contributing a theoretical perspective and a methodological approach. Theoretically, we view as inextricably linked mathematical knowledge for teaching and pedagogical knowledge. Methodically, to understand the nature and the development of teachers’ knowledge for teaching mathematics, we consider it to be observable through an analysis of teachers’ moment-to-moment pedagogical interactions with students under particular conditions. The conditions include students working in collaborative groups to solve open-ended, well-defined problems and teachers attending to students’ mathematical ideas and reasoning. We believe that teachers can best understand students’ emerging and evolving mathematics when teachers observe and discursively interact with students engaging in mathematical tasks, endeavoring to understand students’ mathematical behavior from their perspective (e.g., Fennema et al., 1996; Noddings, 1992; Tirosh, 2000). In this professional activity, teachers reveal to themselves and to others their mathematical knowledge for teaching as they respond to students’ discursive and inscriptive productions. METHOD This study is an adjunct of larger, ongoing analyses that emerge from a multi-prong, three-year research endeavor, “Informal Mathematics Learning Project” (IML). Two primary goals of the IML project involve investigating (1) how middle-school students (11 to 13 years old) develop mathematical ideas and reasoning over time in an informal, after-school environment and exploring the relationship between agency and students’ learning as well as (2) how teachers facilitate IML sessions and attend to students’ ideas and reasoning. The IML sessions occur in a middle school, after-school program in Plainfield, New Jersey, an economically depressed, urban area, whose school population is 98 percent African American and Latino students. For an academic year and a half, including the intervening summer, three pairs of teachers facilitated 20 sessions, 90-minute each, with a cohort of approximately 20 sixth grade students, while graduate students from Rutgers University observed as ethnographers. This cohort explored similar mathematical tasks that had engaged an earlier cohort of students with whom researchers from Rutgers University worked,
Powell & Hanna
4 - 372 PME30 — 2006
while the teachers participated as observers, taking field notes, and as co-investigators in post-session debriefings. Nonetheless, the teachers were not given a script; rather, they developed their own by selecting tasks and planning their own sessions. For about 50 minutes after each research sessions, the teachers and graduate students with a researcher discussed their observations and reflections on the tasks and the ideas and reasoning of students. Research and debriefing sessions were videotaped, and student and teacher inscriptions were stored electronically. The mathematical tasks on which students were invited to work range across strands of mathematics that include rational numbers, combinatorics, probability and data analysis, and algebra. By design, the tasks are open-ended and well-defined, in that students were invited to determine what to investigate and how to proceed, identify patterns and search for relationships, make and investigate mathematical conjectures, develop mathematical arguments to convince themselves and others of their conjectures, and evaluate their own arguments and those of others. To understand the nature and development of mathematical knowledge for teaching, we analyzed data from the planning, implementation, debriefing sessions, and written reflections on the first two IML sessions that two teachers, Lou and Gilberto, facilitated as well as student work. These teachers have respectively six and two years experience teaching middle school students and the second is a bilingual teacher. For each session, there were between three and five video cameras, each with a boom microphone, capturing images from different student work groups and whole class discussions. Our videodata analysis follows methodological suggestions outlined by Powell, Francisco, and Maher (2003), coding all data inductively and deductively. Our initial coding scheme intended to flag instances of teachers’ using, commenting, and questioning about mathematics and pedagogy. Analyzing the data to understand teachers’ mathematical knowledge for teaching, we noticed several instances of an intersection among pedagogical, mathematical, and epistemological knowledge, some of which present in the following section. RESULTS The purpose of this paper is to theorize and explore an emergent approach for understanding the nature and development of teachers’ mathematical knowledge for teaching. Above, we described a method for flagging critical events from data that provide investigators with insight on teachers’ content and pedagogical knowledge as well as their epistemological awareness of students’ mathematical knowledge. This section describes how we applied our methodology to video and document data. Space limitations only permit us to present three critical events, occurring in two consecutive sessions. The first concerns teachers grappling with how to orchestrate the next session based on events that transpired in that day’s session. In the session, students worked on the following task with Cuisenaire rods: If the light green rod has the number name two, what is the number name for the dark green rod? Three individual students each presented a different solution at an overhead projector.
Powell & Hanna
PME30 — 2006 4 - 373
Tiffany stated that since the light green rod has the number name two, then the white, the red, the purple, the yellow, and the dark green rods have respectively the number names zero, one, three, four, and five. Devon asserted that the white, the red, the light green, the purple, the yellow, and the dark green rods have the number names one, two, three, four, five, and six, respectively. Finally, Sameerah reasoned that since light green has the number name two, then the dark green has the number name four because two light green rods have the same length of one dark green rod and therefore, two plus two is four. With different results, both Tiffany and Devon lined-up their rods according to their heights and used their ordinal position to reason what number names to assign the rods. Applying a different strategy, Sameerah reasoned based on the additive property of length (two light green rods placed end-to-end are equivalent in length to a dark green rod) to name the dark green rod four. The session concluded with Lou and Gilberto asking the students to think about the three different solutions and announcing that the following day they will revisit them. During the debriefing session, Lou and Gilberto discuss with the research team (one Rutgers researcher and other district teachers) a possible intervention to assist the first two students and others students who agreed with them reconsider their ordinal reasoning to additive reasoning. In designing an intervention, Gilberto sets up a scenario that evidences his awareness of the students’ existing knowledge, the reasoning that they are applying, and possible trajectories that they might follow if the intervention is implemented. Gilberto comments as follows:
The only reasoning that is based on length is // the other two are based on order. They [students] organize them from least to greatest and they are saying this is the first, this is the second, // use ordinal numbers … [Lou and Gilberto decide to ask the students which rod has the number name one given that light green has the number name two.] They are going to say this one [pointing to a red rod] and then we can say well then what is true about // one and one. [Video CD 076E, Time: 42:54, Date: 11/17/05]
Gilberto’s point is that students will arrive at a contradiction because the length of two red rods is greater than the length of one light green rod. In this critical event, Gilberto displays three types of knowledge. The event is an intersection among content and pedagogical knowledge and epistemological awareness of the status of his students’ mathematical ideas and reasoning. Our second critical event is four non-sequential but related events. It begins a few minutes before students arrive for the second session with Lou and Gilberto finalizing their plan. Lou states that an issue with the previous day’s task is that there is no available rod to represent the unit. In the previous session, Lou interacted with a student, Sonia, who wanted to find a rod that had the number name one given that light green is called two. She continues to work on this task throughout the second session. Occasionally, a teacher whose role was that of an observer asks her questions about her work. When Sonia correctly draws on centimeter-graph paper a “rod” to represent the length of a unit, the observing teacher asks her to explain her reasoning to Lou. For approximately two minutes, he asks her exploratory questions to understand her representation and reasoning. While the teacher insists to Lou that
Powell & Hanna
4 - 374 PME30 — 2006
Sonia present her findings to the entire group, Lou reveals a pedagogical belief that it is important that she share her findings in the form of a claim so that the other students are invited to explore and either verify or disprove Sonia’s claim. This critical event evidences Lou’s mathematical knowledge for teaching as he judges the soundness of Sonia’s findings. This event also indicates Lou’s pedagogical knowledge. He values having students verify results rather than accept assertions as unexamined facts. Our third critical event combines Gilberto’s interaction with Sonia and his reflective comments during the second session’s debriefing. Sonia has difficulty wording her claim when she presents it to the class at the overhead projector. Gilberto endeavors to understand her representation and reasoning by asking her several exploratory questions. In the debriefing session, Gilberto offers the following reflection:
[T]his experience … [facilitating the after-school sessions] // made me see how important communication is // when you are talking about math and how important it is to understand the thinking of the students // what they mean what they want to say // sometimes what they tell us is something // we understand something different // and // it’s really important // you know deepening in the way the students think and come out with, with ideas we also have to look for strategies to be able to // question them in order to get what they are saying and helping them uh see if something is wrong or if something is right [Video CD 078E, Time: 11:20, Date: 11/18/05]
When Gilberto mentions, “deepening in the way the students think,” he is referring to deepening teachers’ understanding of students’ mathematical ideas and reasoning. Gilberto evidences his desire to understand each student’s reasoning as he questioned the three students who presented their different solutions to this first task and when he posed questions to Sonia about her work. We interpret his statement, “helping them see if something is wrong or if something is right” in light of his practice. In the sessions, he refrains from telling students whether they correct; rather, he poses exploratory questions to provide them with opportunities to articulate and develop further their mathematical ideas and reasoning and so that he can to understand them. This third critical event signals his development of content and pedagogical knowledge. From his facilitating experience, he is aware that he needs to have knowledge of mathematics for teaching and pedagogical knowledge to assist students to develop their understanding of underlying mathematical concepts.
DISCUSSION In our study of teachers’ knowledge for teaching mathematics, we note three categories of knowledge from which teachers interact with students. The first is their knowledge of mathematics. Teachers entered the research setting with an existing body of mathematical knowledge that enabled them to judge the mathematical soundness of students’ arguments. The second category is the epistemological, inferential awareness of the students’ existing and evolving knowledge, which we call teachers’ epistemological knowledge. It embodies a teacher’s ability to make sense of students’ representations, ideas, and arguments as indications of the
Powell & Hanna
PME30 — 2006 4 - 375
emergent and evolving status of students’ knowledge. The third category is teachers’ mathematical knowledge for teaching and is applied in specific contexts to assist students develop their mathematical ideas and reasoning. In the context reported in this paper, teachers use this knowledge to provide opportunities for students to explore and develop their understanding of the mathematical concepts at hand. By analyzing teachers’ practices in action, we notice that their knowledge of mathematics, epistemological knowledge, and knowledge of mathematics for teaching intertwine, interact, and intersect. For example, Gilberto’s awareness that Tiffany and Devon are using ordinal reasoning to give solutions of five and six, respectively, for the dark green rod is an example of his mathematical and epistemological knowledge. He was able to deduce that the students were applying ordinal reasoning, but that they needed to move towards additive reasoning to understand an underlying mathematical concept of operating with rational numbers. From this knowledge, Gilberto designed an intervention comprised of pedagogical moves informed by his understanding of possible student trajectories. These pedagogical moves included his epistemological awareness of students’ current knowledge as well as his content knowledge. From his pedagogical moves, we are able to infer his mathematical knowledge for teaching. His mathematical knowledge and his pedagogical knowledge interact, one influencing the other, and his pedagogical moves provided a lens into his mathematical knowledge for teaching. From a methodological perspective, we have coded data that gave insight into teachers’ knowledge for teaching mathematics. For example, at the end of the first session, teachers grappled with what to do the following day based on the activities from the first session. Throughout their fifty-minute “grappling” session, teachers reflected on students’ work, designed interventions, and discussed possible outcomes. Teachers’ pedagogical practice in action shed light on their mathematical knowledge for teaching. For instance, Lou’s ability to understand Sonia’s findings and his strong desire to have her present a claim for the other students to explore indicate his mathematical knowledge for teaching. In sum, instances of teachers grappling with what to do next and analysis of pedagogical moves provide researchers with insight into teachers’ mathematical knowledge, epistemological awareness of students’ existing and evolving knowledge, and mathematical knowledge for teaching.
References Ball, D. L. (2000). Bridging practices: Intertwining content and pedagogy in teaching and
learning to tech. Journal of Teacher Education, 51(3), 241-247. Ball, D. L., Hill, H. C., & Bass, H. (2005). Knowing mathematics for teaching: Who knows
mathematics well enough to teach third grade, and how can we decide? American Educator, 29(3), 14-17, 20-22, 43-46.
Fennema, E., Carpenter, T. P., Franke, M. L., Levi, L., Jacobs, V. R., & Empson, S. B. (1996). A longitudinal study of learning to use children's thinking in mathematics. Journal for Research in Mathematics Education, 27(4), 403-434.
Powell & Hanna
4 - 376 PME30 — 2006
Franke, M. L., Carpenter, T., Fennema, E., Ansell, E., & Behrend, J. (1998). Understanding teachers' self-sustaining generative change in the context of professional development. Teaching and Teacher Education, 14(1), 67-80.
Hill, H. C., & Ball, D. L. (2004). Learning mathematics for teaching: Results from California's mathematics professional development institutes. Journal for Research in Mathematics Education, 35(5), 330-351.
Hill, H. C., Rowan, B., & Ball, D. L. (2005). Effects of teachers' mathematical knowledge for teaching on student achievement. American Educational Research Journal, 42(2), 371-406.
Hill, H. C., Schilling, S. G., & Ball, D. L. (2004). Developing measures of teachers' mathematical knowledge for teaching. Elementary School Journal, 105(1), 11-30.
Maher, C. A. (1998). Constructivism and constructivist teaching—Can they co-exist? In O. Bjorkqvist (Ed.), Mathematics teaching from a constructivist point of view (pp. 29-42). Abo Akademi, Findland: Pedagogiska fakulteten.
Maher, C. A., & Alston, A. (1990). Teacher development in mathematics in a constructivist framework. In R. B. Davis, C. A. Maher & N. Noddings (Eds.), Constructivist views of the teaching and learning of mathematics (Vol. Monograph No. 4, pp. 147-165). Reston, VA: National Council of Teachers of Mathematics.
Powell, A. B., Francisco, J. M., & Maher, C. A. (2003). An analytical model for studying the development of mathematical ideas and reasoning using videotape data. Journal of Mathematical Behavior, 22(4), 405-435.
Noddings, N. (1992). Professionalization and mathematics teaching. In D. A. Grouws (Ed.), Handbook of research on mathematics teaching and learning (pp. 29-42). New York: Macmillan.
Shulman, L. S. (1986). Those who understand knowledge growth in teaching. Educational Researcher, 15(2), 4-14.
Sowder, J. T. (in press). The mathematical education and development of teachers. In F. K. Lester (Ed.), The second handbook of research in mathematics education. Reston, VA: New Age and National Council of Teachers of Mathematics.
Steinbring, H. (1998). Elements of epistemological knowledge for mathematics teachers. Journal of Mathematics Teacher Education, 1(2), 157-189.
Tirosh, D. (2000). Enhancing prospective teachers' knowledge of children's conceptions: The case of division of fractions. Journal for Research in Mathematics Education, 31(1), 5-25.
2006. In Novotná, J., Moraová, H., Krátká, M. & Stehlíková, N. (Eds.). Proceedings 30th Conference of the International Group for the Psychology of Mathematics Education, Vol. 4, pp. 377-384. Prague: PME. 4 - 377
CONTINUITIES AND DISCONTINUITIES FOR FRACTIONS A PROPOSAL FOR ANALYSING IN DIFFERENT LEVELS
Susanne Prediger Bremen University, Germany
Students’ difficulties with fractional numbers have been treated in many empirical studies with different theoretical frameworks for explaining them. Among them, the theory of conceptual change has met an increasing interest, focussing on necessary discontinuities in the learning process. This article proposes an integrating model with different levels in which continuities and discontinuities between natural and fractional numbers can be found, including the often neglected level of meaning. The model proves to be useful for explaining phenomena found in the presented empirical study and for structuring the current state of research. DIFFICULTIES WITH FRACTIONS AS AN ISSUE OF RESEARCH In many different countries, empirical studies on students’ competencies and conceptions in the domain of fractions have shown enormous difficulties. Whereas algorithmic competencies are usually fairly developed, understanding is usually weaker, as well as the competencies to solve word or realistic problems including fractions (e.g. Hasemann 1981, Barash/Klein 1996, Aksu 1997). One common aspect of several approaches for explaining the difficulties is the emphasis on discontinuities between natural and fractional numbers; Streefland (1984) for example spoke of “N-distractors”, Hartnett / Gelman (1998) described early understandings of natural numbers as barriers to the construction of new understanding and pointed out that students see continuities where discontinuities in the dealing with numbers should appear. Brousseau (1980) classified these hidden discontinuities as epistemological obstacles. The discontinuities have been systematized by different authors, e.g. Stafylidou/Vosniadou (2004), their lists comprise for example the fact that the uniqueness in the symbolic representation of natural numbers does not hold for fractions (since several fractions can represent the same fractional number). Other famous discontinuities are the density of numbers and the order-property of multiplication: Whereas multiplication always makes bigger for natural numbers (apart from 0 and 1), this cannot be applied to fractions. Among different theoretical approaches to explain students’ difficulties with these discontinuities, the conceptual change approach (Posner et al. 1982) has gained a growing influence in mathematics education research (e.g. Lehtinen/ Merenluoto/ Kasanen 1997, Stafylidou/Vosniadou 2004, Lehtinen 2006). On the basis of a constructivist theory of learning and inspired by Piaget’s notion of accommodation, the conceptual change approach has emphasized that learning is rarely cumulative in the sense that new knowledge is only added to the prior (as a process of enrichment). Instead, learning often necessitates the discontinuous reconstruction of prior
Prediger
4 - 378 PME30 — 2006
knowledge when confronted with new experiences and challenges. Problems of conceptual change can appear, when the learners’ prior knowledge is incompatible with the new necessary conceptualisations. The key point in the conceptual change approach adopted here is that discrepancies between the intended mathematical conceptions and the real individual conceptions are not seen as individual deficits but as necessary stages of transition in the process of reconstructing knowledge. Other authors have emphasized the importance of underlying mental models (Fischbein et al. 1985, Greer 1994) or ‘Grundvorstellungen’ (GVs, see vom Hofe et al. 2005) for explaining students’ difficulties. This paper goes beyond the current state of research by integrating the so far competing approaches for explaining students difficulties.
PROPOSAL FOR AN INTEGRATING LEVEL MODEL The purpose of the here presented integrating model (see Fig. 1) is to provide a conceptual tool for describing the precise locations of students’ difficulties with discontinuities, i.e. the quality of the obstacles hindering students to master the necessary changes in the process of conceptual change. Following Fischbein et al. (1985), the model differentiates between algorithmic, intuitive and formal understanding. The formal level includes the definitions of concepts and of operations, structures, and theorems relevant to a specific content
domain. This type of knowledge is formally represented by axioms, definitions, theorems and their proofs. It is not within the main scope of this paper. The algorithmic level of knowledge is basically procedural in nature and involves students’ capability to explain the successive steps included in various, standard procedural operations. Although solving of word problems also has procedural
Algorithmic Level
Intuitive LevelProcedural Skills
Competence of translating word problems into terms
Intuitive rules, e.g. re order-properties of multiplication
Individual models for operations
Individual models for fractions
meanings
Deep
enin
gth
eana
lysis
laws and attributes
Formal Level
application
Explicit Knowledge on Definitios and theorems
Figure 1: Obstacles can lie deeper – Different layers of students’ difficulties
Prediger
PME30 — 2006 4 - 379
aspects, it is assigned to the intuitive level since, as will be shown in the next sections, it is directly connected with other aspects of the intuitive level.
Intuitive understanding is characterized as the type of mostly implicit knowledge that we tend to accept directly and confidently as being obvious. On the intuitive level, we distinguish between conceptions about mathematical laws or properties called intuitive rules (like “multiplication makes bigger”) from those about the meanings of concepts (like the interpretation “multiplication means repeated addition”).
Nearly all studies dealing with conceptual change in the field of fractions have treated intuitive knowledge, but they have mainly focused on the level of intuitive rules. In contrast, they have neglected the level of meanings (modelled by the constructs of ‘Grundvorstellungen’ by vom Hofe et al. 2005 and mental models by Fischbein et al. 1985). The following sections will show why both levels must be considered integratively for understanding processes of conceptual change adequately. The next section sketches how this model can help to structure the current state of research. Furthermore, the presented empirical study about the multiplication of fractions gives evidence for the fact that the difficulties on different levels are highly connected, each level giving reasons for obstacles on the level above.
RESEARCH QUESTION FOR THE EMPIRICAL STUDY This paper presents results of an empirical study dealing with students’ competencies, content knowledge and conceptions of fractions and their operations as well as the connections between different conceptions (Prediger 2004). The report is here restric-ted to the specific part of the study which is related to multiplication.
This part of the study started from a phenomenon which has been shown by many empirical studies (cf. e.g. Brousseau 1980, Streefland 1984, Fischbein et al. 1985, Barash/Klein 1996): Although most students’ show relatively good algorithmic skills in multiplying fractions, many of them work with the intuitive rule that ‘multiplication makes bigger’, which is mostly inherited from dealing with natural numbers. This phenomenon is also often cited within the framework of conceptual change and was hence an interesting case for being elaborated.
The survey of existing literature showed that the conception “multiplication makes bigger” and its generalization from natural to fractional numbers offers an obstacle for activating the multiplicative operation when mathematizing word problems from which they know that the result must be smaller than the factors (cf. Bell et al. 1981, vom Hofe et al. 2005). This is a first example for the fact that the problems on one level (translating word problems) can be influenced by a problem on the level underneath (the intuitive rule concerning the order property).
Fischbein et al (1985) gave empirical evidence for the thesis that the pertinacity of the intuitive rule “multiplication makes bigger” is often connected with the continuing maintenance of the interpretation of multiplication in the repeated addition model (which does not work for fractions). Whereas the influence of the
Prediger
4 - 380 PME30 — 2006
repeated addition model is well studied, the great variety of other individual models for the multiplication of fractions and naturals must be explored more systematically.
That is why our study was guided by the following research questions: Which individual models for the multiplication do our students activate, and how do these models influence the intuitive rules about the order property and the use of multiplication? Where are the most crucial obstacles?
DESIGN OF THE STUDY Our study was designed in a two step format, in which the written test of the first step was complemented by a qualitative clinical interview study. For the second step, 38 students in grade 7 to 10 (age 11 to 16) of different German schools have been asked in semi-structured pair interviews. 12 of the 19 interviews have been transcribed and analysed with respect to the interviewees’ conceptions about multiplication of fractions and their connections on the different levels. The interviews have been videotaped or tape-recorded and transcribed. In a qualitative data analysis, the transcripts were interpreted on the basis of the individual conceptions derived from the written test and by careful comparison of cases (cf. Flick 1999).
The first step consisted of a 80 minutes paper and pencil test, written in all four Grade 7 classes of a German grammar school. 81 tests could be analysed, in total 44 boys and 37 girls (about 12 years old). The students’ answers have been evaluated quantitatively in a points rationing scheme. Where appropriate, the answers have also been analysed qualitatively by categorizing the manifested conceptions about fractions and their operations in a data-driven, not theory-driven way (cf. Flick 1999).
Among the 11 test items, four concerned the multiplication on the different levels (see Fig. 1). Item 1 requested algorithmic knowledge, namely the skill to conduct the basic operations like 5 2
6 3 . Item 3 posed a word problem that could be treated with multiplication when students knew the part-of-interpretation for the multiplication ( 3
4 60of as 34 60 ). Item 2 operated on the level of intuitive rules,
asking in a multiple choice format whether multiplication of fractions makes bigger or smaller or sometimes bigger, sometimes smaller. Item 6 (“Find a word problem that can be solved by means of the following equation: 3 1 1
4 43 ”) operated exploratively on the level of meaning. It was given in an open item format in order not to impose a presupposed mental model but to gain a wide choice of impressions of the really existing individual mental models.
MOST IMPORTANT RESULTS
68 of 81 students, i.e. 84%, could calculate the multiplication item 1b correctly. The item’s result 5/9 (which is bigger than both factors) could not prevent most of the students from approving the property “multiplication makes bigger” in Item 2. 29 of
Prediger
PME30 — 2006 4 - 381
the 68 students with correct results in Item 1b chose an intuitive rule about the multiplication of fractions which is only true for natural numbers, hence, the known findings (see above) about this intuitive rule could be replicated in our sample.
Compared to the results given by Fischbein et al. (1985), the explorative item format for Item 6 facilitated a more detailed and multi-faceted impression of the students’ individual models. The individual models for multiplication expressed by the probands were very heterogeneous and quite distant from the mathematically sustainable models. By coding and categorizing, the following individual models could be specified:
No answers concerning meaning: 38 of 81 students could not show any individual interpretation of multiplication in Item 6. 12 students did not give any answer. 26 answers were only related to calculations (e.g. by explaining the way of calculation).
Adequate individual models: Only 12 students formulated interpretations being coherent with the mathematical perspectives. 4 students formulated a story of a diminution lens and showed their individual model of scaling up and down. Two students used multiplicative comparison. Six students made explicit their part-of-interpretation for the multiplication (cf. Figure 3 for the different models).
Traces of sustainable models: 14 students disposed of interesting traces of sustainable individual models. Two students translated the multiplication with 1
3 by a division by 3 and formulate a word problem of sharing. Twelve other students worked with the part-of-interpretation but formulated them in an incomplete way, e.g. “Peter has 3
4 of a cake. He gives away 1
3 of it. How much does he keep?”
Non-sustainable models: 17 students expressed non-sustainable individual models of the multiplication of fractions, the most dominant being additive (e.g. “ 3
4 cake and then 1
3 .”)
Although the sample size does not allow statistical significance for the dependencies between the order conceptions and the quality of manifested individual models, the results show a distinct tendency. Whereas 75% of those students who could not express a sustainable individual model have expressed an order conception which is only fruitful for natural numbers, there were only 50% among those with traces of a sustainable model and only around a third of those who expressed a sustainable individual model for the multiplication. That means that the formation of adequate individual models proves to be the major obstacle for overcoming the over-generalized intuitive rule “multiplication makes bigger”. Not yet stable individual models like an incomplete part-of-interpretation can only partially suffice for the formation of adequate order conceptions.
These quantitative results could be strengthened by the interview study in the second step. This can be illustrated by this prototypical passage:
Prediger
4 - 382 PME30 — 2006
Tim: That is clear, multiplication makes it bigger [...] Interviewer: What does that mean when you multiply two numbers? Tim: Well, this and this times plus itself! Interviewer: Okay, but what does 5/6 times 2/3
plus itself mean, then? Tim: How? [hesitates 3 sec] no idea! Interviewer: Could you think about it in another
way? Tim: (draws a picture) 5/6 pizza and 2/3
pizza, how can I multiply them?
When in situations like this one, the interviewer headed for a part-of-interpretation by giving hints, an interesting new obstacle appeared. As Tim in this passage, many interviewees clang to the interpretation of a fraction as a part of a whole. This basic model for fractions is extensively taught in Germany. Tim’s problem is represented in a pointed way by the individual representation in Figure 2, drawn similarly by several other interviewees. The inseparable link between fractions and their circle (“pizza”)-representations makes it impossible for some interviewees to interpret the second factors in another way, for example like proportion or part of the first. DISCUSSION: STRUCTURING EMPIRICAL FINDINGS The findings of our and previous empirical studies about multiplication of fractions can be resumed to four connected findings that describe the learners’ thinking in deeper and deeper levels in the model of Figure 1. Formal knowledge was not within the scope of the study, hence, it does not appear. 1. Finding: Algorithmic competencies for the multiplication of fractions alone do not
qualify students to utilize their competencies in reality-oriented situations or word problems (Barash/Klein 1996, p. 35f.). In general, students’ competencies to solve real problems or word problems are low (Hasemann 1981, Aksu 1997).
2. Finding: One important (but not the only) reason for the first finding is the intuitive rule “multiplication makes bigger”. This intuitive rule incapacitates lear-ners from choosing the multiplication for translating problems from which they know that the result must be smaller than the factors (cf. Bell et al. 1981, vom Hofe et al. 2005). This finding could be reproduced within the current study.
3. Finding: The pertinacity of the intuitive rule “multiplication makes bigger” (second finding) is linked to non-sustainable individual models for multiplication of fractions (the finding is supported by Greer 1994 and Fischbein et al. 1985). Our written test and even more the interviews have shown the strong connection between both levels.
4. Finding: One possible reason for the incomplete formation of sustainable individual models of multiplication of fractions (third finding) could be found by
Figure 2: Individual represen- tation of the multiplication
Prediger
PME30 — 2006 4 - 383
the interviews in the limited conceptions of fractions, being only interpreted as parts of a whole.
In total, these findings give evidence for the thesis that the difficulties on the different levels are highly connected, each level giving reasons for obstacles in the upper level. Additionally, the level model helps us to re-locate the exact place of the epistemological obstacles in the process of conceptual change from natural to fractional numbers. As sketched in the first section, most researchers in conceptual change locate the problem on the level of laws and rules. In this level, the transfer of rules from natural numbers to fractions simply appears to be a problem of hasty generalization. In contrast, our study could elaborate Fischbein et al.’s (1985) emphasis on the importance of the underlying level of meaning, namely the mental models. Whereas Fischbein et al. focused on the most important model ‘repeated addition’, our study could explore the factual variety of individual models for multiplication by using explorative data collection strategies (open item format and semi-structured interviews). By these means, we can enlarge Fischbein’s findings considering all possible models of multiplication. We can now complement the list of discontinuities on the level of laws about properties of fractions and their operations (given by Stafylidou/Vosniadou 2004) by another table: Figure 3 amends the list of discontinuities in the deeper level of mental models, i.e. in the level of meaning (cf. Greer 1994).
Natural numbers Fractions
repeated addition (3x5 means 5+5+5, i.e. 3 wands of 5m length in a row)
???
area of a rectangle (3x5 is the area of a 3cmx5cm rectangle)
area of a rectangle (2/3 x5/4 is the area of a 2/3 cm x 5/4 cm rectangle)
???? part-of-interpretation (2/3 x 5/2 means 2/3 of 5/2)
multiplicative comparison (twice as much)
multiplicative comparison (half as much)
scaling up (3x5 means 5cm is stretched three times as much)
scaling up and down (2/3 x 5/2 means 5/2 cm compressed on 2/3 of it)
combinatorial interpretation (3x5 as number of combining 3 shirts + 5 trousers)
????
Figure 3: (Dis-)Continuities of mental models for multiplication in the transition from natural to fractional numbers
This compilation makes clear that not all mental models have to be changed, e.g. the interpretations as an area of a rectangle or as scaling up can be continued for fractions as well as the multiplicative comparison. In contrast, the basic model ‘repeated addition’ is not sustainable for fractions, neither the combinatorial interpretation. Vice versa, the basic model of multiplication, the part-of-interpretation, has no direct
Prediger
4 - 384 PME30 — 2006
correspondence for the natural numbers. By this analysis of the mathematical structures behind, we can now specify the exact location of obstacles: Not the intuitive rules are the problem, but the necessary changes of mental models. Metaphorically speaking, the obstacles can be located in the flashes of Figure 3. References Aksu, M. (1997). ‘Student performance in dealing with fractions’, Journal of Educational
Research 90(6), 375-380. Barash, A. and Klein, R. (1996). ‘Seventh Grades Students algorithmic, intuitive and formal
knowledge of multiplication and division of non negative rational numbers’, in Puig, L. and Gutiérrez, A. (eds.) Proceedings 20th PME, Vol. 2, 35-42.
Bell, A., Swan, M., and Taylor, G. M. (1981). ‘Choice of operation in verbal problems with decimal numbers’, Educational Studies in Mathematics 12, 399-420.
Brousseau, G. (1980). ‘Problèmes de l’enseignement des décimaux’, Recherche en Didactiques des Mathématiques 1, 11-59.
Fischbein, E. et al. (1985). ‘The role of implicit models in solving problems in multiplication and division’, Journal of Research in Mathematics Education 16 (1), 3-17.
Flick, U. (1999). Qualitative Forschung. Theorie, Methoden, Anwendung in Psychologie und Sozialwissenschaften [Qualitative research. Theory, methods, application in psychology and social sciences], Frankfurt, Rowohlt.
Greer, B. (1994). ‘Extending the meaning of multiplication and division’, in Harel, G. and Confrey, J. (eds.) The development of multiplicative reasoning in the learning of mathematics, Albany NY, SUNY Press, 61–85.
Hartnett, P. and Gelman, R. (1998). ‘Early Understandings of Number: Paths or Barriers to the Construction of new Understandings?’ Learning and instruction 8(4), 341-374.
Hasemann, K. (1981). ‘On difficulties with fractions’, Educational studies in mathematics 12(1), 71-87.
Lehtinen, E., Merenluoto, K. and Kasanen, E. (1997). ‘Conceptual change in mathematics: From rational to (un)real numbers’, Europ. Journal of Psych. of Educ. 12 (2), 131-145.
Lehtinen, E. (2006, in prep.). Mathematics education and learning sciences, to appear in: Proceedings of ICME-10, Kopenhagen 2004.
Posner, G., Strike, K., Hewson, P., & Gertzog, W. (1982). ‘Accommodation of a scientific conception: Toward a theory of conceptual change’, Science Education 66 (2), 211-227.
Prediger, S. (2004). ‘Kompetenzen und Vorstellungen zu Brüchen von Gymnasiastinnen und Gymnasiasten. Bericht über eine empirische Untersuchung’ [Students’ competencies and conceptions of fractions. Report on an empirical study], Preprint, Bremen University.
Stafylidou, S. and Vosniadou, S. (2004). ‘The development of students’ understanding of the numerical value of fractions’, Learning and Instruction 14 (5), 503-518.
Streefland, L. (1984). ‘Unmasking N-distractors as a source of failures in learning fractions’, in Southwell, B. et al. (eds.) Proceedings of 8th PME, Sydney, 142-152.
vom Hofe, R., Kleine, M., Blum, W., Pekrun, R. (2005). ‘On the Role of ‘Grundvorstellun-gen’ for the Development of Mathematical Literacy - First Results of the Longitudinal Study PALMA’, to appear in Bosch, M. (ed.) Proceedings 4th Congress of ERME, Spain 2005, here cited from the pre-conference paper, http://cerme4.crm.es/
2006. In Novotná, J., Moraová, H., Krátká, M. & Stehlíková, N. (Eds.). Proceedings 30th Conference of the International Group for the Psychology of Mathematics Education, Vol. 4, pp. 385-392. Prague: PME. 4 - 385
DYNAMIC MANIPULATION SCHEMES OF GEOMETRICAL CONSTRUCTIONS: INSTRUMENTAL GENESIS AS AN
ABSTRACTION PROCESS Giorgos Psycharis
Educational Technology Lab, School of Philosophy, University of Athens Dynamic manipulation of geometrical constructions enabled by a specially designed computational tool, called variation tool, is studied during the implementation of proportional geometric tasks in the classroom. The analysis combined the use of two theoretical frameworks: instrumental genesis and situated abstraction. The Dynamic Manipulation Schemes (DMS) developed by 13-year-old students based on the use of the variation tool are reported in the paper. It is indicated that situated abstraction may complement instrumental genesis in analysing the links between student’s behaviors and expressions of mathematical ideas within particular computational settings.
INTRODUCTION This paper is reporting doctoral research aiming to explore 13 year-olds�’ dynamic manipulation of geometrical figures during activity involving ratio and proportion tasks in their classroom. The students worked in collaborative groups of two using �‘Turtleworlds�’, a piece of geometrical construction software which combines symbolic notation, through a programming language (Logo), with dynamic manipulation of variable procedure values (Kynigos, 2004). In �‘Turtleworlds�’, the elements of a geometrical construction can be expressed with variables (or functional relationships including variables) and dynamically manipulated by dragging on the �‘number line�’-like representation of these variables using a specially designed computational tool. Manipulation of geometrical objects in mathematics education has mainly been concerned with Dynamic Geometry Software (DGS) environments. In these environments manipulation can be characterised as dynamic since it is realised through dragging actions offering the ability to change constructed figures by interacting with particular features of them, while preserving specific mathematical rules (Hegedus, 2005). Some researchers have considered dragging as an instrument of mediation between the perceptual level of figures on the screen and the conceptual control on them (Hölzl, 1996, Arzarello et al., 1998), while others have confirmed its crucial role in supporting students to develop deductive explanations when encounter unexpected graphical results (Hadas, Hershkowitz & Schwarz, 2000). The present research aims to offer a different perspective on the process of instrumental genesis (Verillon & Rabardel, 1995) based on the kinesthetic control of figures in a computer environment combining two kinds of representation: dynamic manipulation and algebraic notation. The students were engaged in a project to build enlarging-shrinking figural models of capital letters of varying sizes in proportion by using only one variable to express the relationships within each geometrical figure. Thus,
Psycharis
4 - 386 PME30 �— 2006
proportional reasoning in this study is considered as a system of two variables with a linear functional relationship Y=mX (Karplus et al., 1983) which very often is perceived by students as additive rather than multiplicative (Hart, 1984) especially within geometrical enlargement settings (Kuchemann, 1989). The analysis elaborates the role of student�’s exploration with the �‘dragging�’ modality of the computer environment in the process of instrumental genesis and describes how the notion of situated abstraction (Noss & Hoyles, 1996) could be used to make sense of pupil�’s evolving mathematical knowledge interrelated with the use of this specific computational tool.
INSTRUMENTAL GENESIS AND SITUATED ABSTRACTION The analytical frame of instrumental genesis is based on the distinction between artefact and instrument with the latter having a psychological component (scheme), indicating the dialectic relationship between activity and implicit mathematical knowledge, that a subject operationalises when using the artefact to carry out some task (Guin & Trouche, 1999). The activity that employs and is shaped by the use of instruments (instrumented activity) is directed towards the artefact, eventually transforming it for specific uses (instrumentalisation), as well as towards the subject leading to the development or appropriation of schemes (of instrumented action) in which the subject is shaped by actions with the artefact (instrumentation) (Artigue, 2002). The academic discussion on the above terms appears to admit as a key challenge for the integration of technology into classrooms and curricula to understand and to devise ways to foster the process of instrumental genesis (Trouche, 2003). However, it is has been recently highlighted (Hoyles, Noss & Kent, 2004, p. 314) that �“although schemes of instrumented action recognise the crucial shaping of the learner by interaction with tools, their very generality makes it all the more important to take account of the specific way mathematical knowledge might be developed.�” (my emphasis). This is what the notion of situated abstraction (Noss & Hoyles, 1996) seeks to address, i.e. to describe how learners construct mathematical ideas drawn on the linguistic and conceptual resources available for expressing them in a particular computational setting as well as the ways in which learners exploit the available tools to move the focus of their attention onto new objects and relationships (which may be divergent from standard mathematics). In this paper instrumental genesis is considered as a process complementary to situated abstraction for effectively describing student�’s instrumented mathematical knowledge in terms of situated abstractions of mathematical ideas that are being developed and expressed during their interaction with a specially designed computational tool for dynamic manipulation of geometrical objects through dragging.
RESEARCH SETTING AND TASK In Turtleworlds, what is manipulated is not the figure itself but the value of the variable of a procedure by dragging on the dynamic manipulation feature of the computer environment called �‘variation tool�’. After a variable procedure is defined
Psycharis
PME30 �— 2006 4- 387
and executed with a specific value, clicking the mouse on the turtle trace activates the variation tool, which provides a slider for each variable (see at the bottom of Fig.°1).
Dragging a slider has the effect of the figure dynamically changing as the value of the variable changes sequentially. In the procedure of Figure 1 for letter �“A�” the first variable (:x) changes the length of the �“slanty�” sides, the second (:y) the length on the �“slanty�” sides from the base to the edges of the horizontal side and the third (:z) the horizontal side. The graphics, the variation tool and the Logo editor are all available on the
screen at all times. The user can change in each slider the initial value, the end value as well as the step of the variation (these numbers are shown in Figure 1 in the small boxes beside the sliders). The procedure for drawing a model of a letter with one variable can be derived through the functional relation of the only variable to the ratios of the sides of a fixed model of the letter. The research took place in a secondary school with two classes (A1 and A2) of 26 pupils aged 13 years old and two mathematics teachers. During the classroom activity, the students were engaged in building models of capital letters of variable sizes, having initially been told that the aim was for each letter procedure to have one variable corresponding to the height of the respective letter. According to the task, each group of pupils was assigned to construct two letters (for a more detailed description of the task see Psycharis & Kynigos, 2004). Having already had experience with traditional Logo constructions including variables, the students were introduced to the use of the variation tool at the beginning of the study by constructing basic geometrical figures (e.g. squares, rectangles) with variables.
METHOD During the activity, which lasted four months, each of the two classes had two 45-minute project work sessions per week with the participant teachers. In the classroom a team of two researchers took the role of participant observers and focused on one group of students in each class (focus groups), recording their talk and actions and on the classroom as a whole recording the classroom activity. In each data collection session the researchers used two cameras: a first one was on the focus groups and a second one was occasionally moving to capture the overall classroom activity as well as other significant details in student�’s work as they occurred. Verbatim transcriptions of all recordings were made. We adopted an analytic stance integrating conditions (why) with interactions (how) (Strauss and Corbin, 1998) accompanying the use of the variation tool and the subsequent actions taken by pupils. The
Figure 1: A model of �“A�” with three variables.
Psycharis
4 - 388 PME30 �— 2006
researcher �“read�” each dragging on the variation tool as an incident directly linked to �“before�” (cause) and �“after�” (result). The unit of analysis was the episode, defined as an extract of actions and interactions developed in a continuous period of time around a particular issue. The extraction of the episodes was based on the following criteria: (a) the �“initial motive�” of the dragging, which mostly concerned distortions to the figural representations, (b) the children�’s �“focal point�” while dragging, recognized among what they said and did and (c) the �“chain of proportional meanings�”, which accompanied the children�’s actions while or after dragging.
RESULTS Early in their work most of the pupils constructed a model of their letter - which we refer to as the original pattern �– without using any variables (Phase A). On the next phases of their exploration, pupils experimented to change it proportionally by choosing different variables for its segments (Phase B) until they built their final one with one variable (Phase C). Since none of the students had used the variation tool before, they were all at the genesis of instrumentation of this particular tool, beginning to form the partnership necessary to integrate its use into their experimentation so as to complete the requested tasks. Dragging on the variation tool was thus considered as an inevitable part of pupil�’s instrumented actions characterizing a number of qualitatively different Dynamic Manipulation Schemes (DMS) that our data analysis revealed. Along with Trouche (2003), I distinguish between �‘dragging as a gesture�’ and scheme, considering the former as an observable part of the latter. Each scheme is considered below through representative examples.
Reconnaissance DMS. In a number of pupils the initial draggings of the variation tool were associated with the changes on the figure when moving the existing sliders. In a construction of �“A�” (focus group-A2) with three variables (Figure 1) such a moving of a slider oriented students to recognize the interdependence of the lengths of the figure. The three sliders were set in the values of the original pattern as displayed at the bottom of the screen:
x=75, y=30 and z=37. The �‘distortion�’ of the figure (Figure 2) when moving the slider of (:x) for the first time lead students to move all the other sliders of the variation tool to higher values so as to �‘close�’ the shape. In this phase pupils seemed to give priority to complete the figure instructed by the visual outcome on the screen and not paying attention to some kind of relationship between the selected values. However, we may observe that pupils apparently connected at an intuitive level the articulation of the figure and the interdependence of the involved magnitudes. The emergent reconnaissance DMS can be seen as a usage scheme (Trouche, 2003),
Figure 2: The �‘distortion�’ of �“A�”.
Psycharis
PME30 �— 2006 4- 389
oriented towards the management of the variation tool (i.e. recognition of its functionalities) as well as an instrumented action scheme, implemented by the students to construct a bigger model of �“A�”.
Correlation DMS. Another scheme of the use of variation tool at first seemed to be another reconnaissance DMS emerging during student�’s transition from the construction of the original pattern to the dynamically changing constructions with the use of variables. However, further consideration showed that students were not simply using the variation tool to complete the shape of a letter instructed by the visual feedback, as seen above, but there was a partnership evolving with the variation tool assigned a defined role in their attempts to distinguish the relations underlying the interdependence of the involved values.
In a �“P�” construction (Group 9�– 2), the correlation dragging of the two sliders took its meaning via the equivalence of the ratios of the two variables involved in the construction. In the original pattern (x=400, y=2) students considered that the semicircle coincided with the middle point of the vertical segment. Experimenting to construct similar �“P�” models of different sizes, S1 had the idea to set as end value for each slider the correspondent values in the original pattern. He then constructed a (similar)
figure of �“P�” so as to preserve the property �“intersection in the middle�” by dragging the two sliders at half of the values in the original pattern (x=200, y=1) that corresponded to their middle points (see the current position of the two sliders in Figure 3).
S1: When set at 200 [i.e. slider x] it means that it [i.e. the semicircle] is in the middle. R: And how do you know that the semicircle is in the middle? S1: We �‘ll also set this in the middle [e.g. the slider y]. It starts from 0 to 2. Therefore,
we will set it exactly in 1.
The interrelation of the geometrical property with the arithmetic changes made by S1 is shown by the different meanings of the word �“middle�”: at the beginning of the excerpt S1 uses it to refer to the figure, while in the end to the middle point of the slider y. Here, S1�’s specific draggings indicate the evolution of instrumental genesis: at the technical level he transformed the variation tool by moving both sliders on specific points (instrumentalisation) while -at the conceptual level- gained control of the similarity ratio (between the original and the new pattern of �“P�”) by taking into account the preservation of a particular geometrical property.
Figure 3: �“P�” with two variables.
Psycharis
4 - 390 PME30 �— 2006
Testing DMS. The testing DMS emerged as an indication of student�’s familiarization with the use of computational tools and it was characterized by qualitative differentiations in expressing both the geometric and algebraic properties of the requested geometrical constructions. Dragging within this scheme was mainly associated with testing student�’s conjectures based on indications or conclusions of preceded DMS. In an �“N�” construction with one variable, students (focus group�–A1) integrated the variation tool into their approach and used it to test the situated abstraction of the relation between the two construction lengths (r and 1.5*r).
Dragging the only slider r, students realized that the side length did not exactly coincided with the horizontal line that they had drawn at the letter base (Figure 4). S2: It is exactly the same, or even worse [i.e. the distortion]. R: Therefore, this is probably not 1.5 times�… S2: Yes, it may be 1.45. [S2 replaces in the procedure 1.5 by 1.45 and moves the only slider so as to test the new value].
What is particularly noticeable in the above excerpt is that the suggested value
for the functional operator by S2 precedes the new moving of the only slider indicating a shift in the use of the variation tool for validating the relationships described in the symbolic expression: students triggered by an abnormality on the graphical outcome formed a utility in which dragging in conjunction with the symbolic notation helped them to extend the elaboration of the proportional relation between the covariant magnitudes so as to prevent the distortion of the shape. At the same time the evolving DMS indicates the dynamic nature of the experimentation with the variation tool providing a basis for the development of subsequent correlations likely to follow. Verification DMS. Verification DMS emerged as part of the evolution of the students�’ familiarization with the control of the mathematical concepts concerning the construction of enlarging-shrinking geometrical figures. The functional expression of one variable in relation to another was the most difficult type of correlation, especially in cases involving arithmetic values not resulting in integer quotients. In several cases forming such kind of relationships was facilitated by preceding correlations of values leading to integer quotients. For the construction of an enlarging-shrinking model of �“B�”, the students (focus group-A2) chose to employ an already developed multiplicative strategy including integer quotients, that they had applied successfully in the construction of another letter. The original pattern was constructed for the values x=100 and y=0.44 (when replaced in the procedure shown in Table 1). In the final enlarging-shrinking model with one variable, variable y was
Figure 4: �“N�” with one variable.
Psycharis
PME30 �— 2006 4- 391
substituted by the expression x/227.3 since the result of the division 100:0.44 = 227.272727272 was rounded off by the students.
[S1 drags the only slider x for enlarging and shrinking the letter.]
S1: [To the researcher] You see?
S2: We divided 100 by 0.44 and got 227.3.
By dragging the only slider, S1 verifies the successful outcome of the multiplicative construction strategy, implying that it can also be followed in cases including non-integer correlations. In that sense, this specific dragging signals the use of the variation tool as an
instrument mediating strategies based on properties and relations rather than on arithmetic values of a particular type. As far as the nature of the developed instrumented actions, we observe a complete shift of student�’s attention from the graphical to the symbolic representation of the computer environment.
CONCLUSIONS In this paper we have considered the different DMS generated as students begin to use the variation tool in constructing enlarging-shrinking geometrical figures by means of relations abstracted, i.e. constructed and expressed, within this particular computational setting. Under the situated abstraction perspective these DMS illustrate the dialectic relationship between the evolution of instrumental genesis and student�’s progressive focusing on relations and dependencies underlying the current geometrical constructions and its representations. According to the results, the key difference amongst the described DMS is that in the evolution of instrumental genesis the appreciation of the computer feedback was much more closely bound into correlations rooted in action (within the same or a new DMS) and inextricably linked with the use of the variation tool. As soon as the variation tool became part of student�’s activity, student�’s instrumented actions progressively evolved from the visual level (Reconnaissance DMS) to the conceptual level indicated by the development of mathematical practices involving the appreciation of the (scalar) relation between the lengths of similar figures (Correlation DMS), the testing of conjectures (Testing DMS) as well as the verification of employed multiplicative strategies (Verification DMS). In future papers, further elaboration of the interconnections between the above DMS and their evolution within specific groups of students is expected to enrich the analysis. However, the above results indicate that dynamic manipulation of figures in a kinesthetic way can be considered as a context in which the different instruments built by the students, based on the use of the variation tool, may reflect how the implicit emergence of proportionality as a concept-in-action (Trouche, 2003) might be explicitly operationalised and articulated in mathematical terms of situated abstractions as part of the instrumental genesis.
To letterB :x :y fd :x rt 90
repeat 180 [fd :y rt 1] lt 180
repeat 180 [fd :y rt 1] End
Table 1: The procedure of �“B�”.
Psycharis
4 - 392 PME30 �— 2006
References Artigue, M. (2002). Learning Mathematics in a CAS environment: The genesis of a
reflection about instrumentation and the dialectics between technical and conceptual work, International Journal of Computers for Mathematical Learning, 7 (3): 245-274.
Arzarello, F., Micheletti, C., Olivero, F., Robutti, O., Paola, D. & Gallino, G. (1998). Dragging in Cabri and modalities of transition from conjectures to proofs in geometry, Proceedings of the 22nd PME Conference, Stellenbosch, South Africa, Vol. 2., 32-39.
Guin, D. & Trouche, L. (1999). The complex process of converting tools into mathematical instruments: The case of calculators, International Journal of Computers for Mathematical Learning, 3 (3), 195-227.
Hadas, N., Hershkowitz, R. & Schwarz, B. B. (2000). The role of contradiction and uncertainty in promoting the need to prove in dynamic geometry environments, Educational Studies in Mathematics, 44: 127�–150.
Hart, K. M. (1984). Ratio: Children's Strategies and Errors. Windsor: NFER-Nelson. Hegedus, S. (2005). Dynamic representations: A new perspective on instrumental genesis,
Proceedings of the 4th Congress of the European Research in Mathematics Education, Spain.
Hölzl, R. (1996). How does �‘dragging�’ affect the learning of geometry, International Journal of Computers for Mathematical Learning, 1.2, 169-187.
Hoyles, C., Noss, R. & Kent, P. (2004). On the integration of digital technologies into mathematics classrooms, International Journal of Computers for Mathematical Learning, 9: 309-326.
Karplus, R., Pulos, S. & Stage, E. K. (1983). Proportional reasoning of early adolescents, in R. Lesh, & M. Landau (Eds.) Acquisition of Mathematical Concepts and Processes, Academic Press, N.Y.
Kuchemann, D. (1989). The effect of setting and numerical content on the difficulty of ratio tasks, Proceedings of the 15th PME Conference, Paris, Vol. II, 180-186.
Kynigos C. (2004) A �“black-and-white-box�” approach to user empowerment with component computing, Interactive Learning Environments, Vol. 12, Nos. 1-2, 27-71.
Noss, R. & Hoyles, C. (1996). Windows on Mathematical Meanings, Kluwer. Psycharis, G. & Kynigos, C. (2004) Normalising geometrical constructions: A context for
the generation of meanings for ratio and proportion, Proceedings of the 28th PME Conference, Bergen, Norway, Vol. 4, 65-72.
Strauss, A. & Corbin, J. (1998). Basics of Qualitative Research, Sage Publications. Trouche, L. (2003). Managing the complexity of human/machine interaction in a computer
based learning environment: Guiding student process command through instrumental orchestrations, Plenary presentation at the 3rd Computer Algebra in Maths Education Symposium, Reims, France.
Verillon, P. & Rabardel, P. (1995). Cognition and artefacts: a contribution to the study of thought in relation to instrumented activity, European Journal of Psychology of Education, 10 (1), 77-101.
2006. In Novotná, J., Moraová, H., Krátká, M. & Stehlíková, N. (Eds.). Proceedings 30th Conference of the International Group for the Psychology of Mathematics Education, Vol. 4, pp. 393-400. Prague: PME. 4 - 393
RHYTHM AND THE GRASPING OF THE GENERAL
Luis Radford(1), Caroline Bardini(2), Cristina Sabena(3) (1)Université Laurentienne, Canada, (2)Université Paris 7, France,
(3)Università di Torino, Italy.
In this paper we deal with the genesis of students’ algebraic generalization of patterns. Our aim is to better understand the way students attend to the perceptually given (e.g. the three first elements of a geometric or numeric sequence) and start moving beyond it in their attempt to grasp a possible general mathematical structure. We provide a multi-semiotic microanalysis of the work done by one Grade 9 student and her small-group mates and show how rhythm accounts for a subtle semiotic device which helps the students project at the aural, kinesthetic and visual levels a regularity which proved to be crucial in conveying a sensuous meaning of mathematical generality.
INTRODUCTION AND THEORETICAL FRAMEWORK To account for the progressive manner in which the perceptually given is transcended in generalizing tasks, Kieran et al. (1996), Love (1986), Mason (1996), and Mason et al. (1985) talk about “seeing” or “noticing” the general in/through the particular. Following this line of enquiry and drawing from Husserl’s phenomenology and Vygotsky’s psychology, in what follows, we investigate the students’ production of algebraic generalizations as a process of objectification.
Our theoretical construct of objectification refers to an active, creative, imaginative and interpretative social process of gradually becoming aware of something (Radford, 2003). Within this context, the objectification of a general mathematical structure in a generalization task amounts to noticing or becoming aware of general mathematical properties that are not directly visible as such in the realm of the concrete and the particular. In the overcoming of the particular, the visual stimuli (numbers, shapes, etc.) are continuously being transformed by an interpretative and intentional contextual process anchored in our own personal biography and cultural history. It would be misleading, however, to think that the continuous modification of the perception of the objects in front of us is accomplished through the organ of vision alone. Vision does not merely transform brute perception into conceptual objects. Human perception, as well as all higher psychological functions, are indeed characterized by a sophisticated collaboration between our historically evolved senses (e.g. vision, touch and audition) and also between our senses and the complex cultural artifacts and semiotic systems that we use. Thus, language, Mikhailov suggested, “constantly participates in converting the perception and understanding of the external object into self-awareness and self-consciousness.” (Mikhailov, 1980, p. 236).
Radford, Bardini & Sabena
4 - 394 PME30 — 2006
As a result of the distinctive historically and culturally mediated nature of human cognition, in the objectification of mathematical knowledge recourse is made to body (e.g. kinesthetic actions, gestures), signs (e.g. mathematical symbols, graphs, written and spoken words), and artifacts of different sorts (rulers, calculators and so on). All these signs and artifacts used to objectify knowledge we call semiotic means of objectification (Radford, 2003).
To understand the students’ grasping of mathematical generality, some of our previous works dealt with the phenomenological import of language and gestures and their various mechanisms to ground generalization. We put into evidence two important linguistic functions to which students resort in order to take notice of a mathematical structure: a deictic function (based on an intensive use of deictic terms such as “this”, “that”) and a generative action function (based on adverbs of repeated action like “always”; see Radford 2000, 2002). In subsequent articles we dealt with the role of gestures (Radford et al., 2003, 2004) and studied the generalizing function of what we termed ‘objectifying iconic gestures’, i.e. hand motions that depict a new referent by stressing some of its essential features (Sabena et al. 2005). In terms of the sketched theoretical framework, the research question that we want to tackle in this paper can be rephrased as follows: How do students coordinate the different semiotic means of objectification in generalizing tasks? By deepening our previous analyses, we want to better understand the collaboration between eye, word and gesture, and also explore an underlying element that proves important in ensuring the coordination between them: rhythm. As we shall see, entangled in words and gestures, rhythm is a crucial semiotic device through which the students make apparent the perception of an order that goes beyond the particular figures. Before going into more details, let us first summarize some aspects of our methodology.
METHODOLOGY: A MULTI-SEMIOTIC DATA ANALYSIS
Data Collection: Our data, which comes from a 5-year longitudinal research program, was collected during classroom lessons that are part of the regular school mathematics program in a French-Language school in Ontario. In these lessons, designed by the teacher and our research team, the students spend substantial periods of time working together in small groups of 3 or 4. At some points, the teacher (who interacts continuously with the different groups during the small group-work phase) conducts general discussions allowing the students to expose, compare and contest their different solutions. To collect data we use three or four video cameras, each filming one small group of students.
Data Analysis: To investigate the students’ processes of knowledge objectification we conduct a multi-semiotic data analysis. Once the videotapes are fully transcribed, we identify salient episodes of the activities. Focusing on the selected episodes, we refine the video analysis with the support of both the transcripts and the students’ written material. In particular, we carry out a low motion and a frame-by-frame fine-grained video microanalysis to study the role of gestures and words. Such a
Radford, Bardini & Sabena
PME30 — 2006 4 - 395
microanalysis is completed with a voice analysis using dedicated software (further details are provided below). We will focus here on a classical pattern problem that Grade 9 students had to investigate in a math lesson (see Figure A). In the first part of the problem, the students were required to continue the sequence, drawing Figure 4 and Figure 5 and then had to find out the number of circles for Figure 10 and Figure 100. In the second part, the students were asked to write a message explaining how to calculate the number of circles in any figure (figure quelconque, in French) and, in the third part, to write an algebraic formula. In this paper, we provide a microanalysis of the work done on the second part of the pattern problem by one of the students: Mimi. Two other students were in her small-group: Jay and Rita. In the first part of the pattern problem, the students perceived the figures as divided into two rows and formulated a factual generalization (Radford, 2003), i.e. a generalization of actions in the form of an operational schema that can be applied to any concrete figure, regardless of its position in the sequence. For instance, talking about Figure 100, Jay said: “[Figure] 100 would have 101 [referring to the circles in the bottom row] and 102 [referring to the top row]”. (See details in Sabena et al. 2005). This factual generalization led the students to answer that there were 23 and 203 circles in Figure 10 and 100, respectively.
RESULTS AND DISCUSSION The coordination of word and gesture in the overcoming of the particular The second part of the pattern problem starts with Mimi reading the question:
1. Mimi: (reading aloud) We have to explain clearly … how to find out the number of circles in any figure of the sequence (she reflects for a while and says) Add… Add three to the number of the figure! (pointing to the results “23” and “203” already written on the paper).
2. Jay: No! 101, 100 and (pointing to the answer) you got that, 203.
Although the students were satisfied with the way they answered the questions about Figure 10 and Figure 100, Mimi was intrigued by the fact that digit ‘3’ appeared at the end of the previous answers (line 1). She hence tried to formulate a new generalizing schema that would include the digit ‘3’ and the number of the figure. As Jay quickly noticed, the schema is faulty (line 2). Jay’s utterance was followed by a long pause (5.2 seconds) during which the students silently looked at the figures. Jay became interested in Mimi’s idea but, like Mimi, still did not see the link in a clear way.
Table 1 (Picture 1): Jay (in the
middle) and Mimi (on the right)pointing at Figure1.
fig. 1 fig. 2 fig. 3
Figure A: The first terms of the pattern as given to the students.
Radford, Bardini & Sabena
4 - 396 PME30 — 2006
Trying to come up with something, while putting his pen on Figure 1 and echoing Mimi’s utterance, Jay pensively said: “Add 3”. At the same time, Mimi moved her finger to Figure 1 (close to Jay’s pencil) and said: “I mean like … I mean like …” (see Picture 1 in Table 1). While Jay left the pencil on Figure 1, Mimi retrieved her hand. Then she intervened again and said:
3a. Mimi: You know what I mean? Like… for Figure 1 (making a gesture; see Table 2, Picture 2) you will add like (making another gesture; see Table 2, Picture 3) …
To explore the role that digit 3 may play, in line 3a Mimi makes two gestures, each one coordinated with word-expressions of differing values. The first couple gesture/word has an indexical-associative meaning: it indicates the first circle on the top of the first row and associates it to Figure 1 (see Table 2, left column). The second couple achieves a meaningful link between digit 3 and three “remarkable” circles in the figure. The resulting geometric-numeric link is linguistically specified in additive terms (“you will add”) (see Table 2, right column). Although Mimi has not mentioned or pointed to the first circle on the bottom row, the circle has been noticed, i.e., although the first circle of the bottom has remained outside the realms of word and gesture, it has fallen into the realm of vision. Indeed, right after finishing her previous utterance, Mimi starts with a decisive “OK!” that announces the recapitulation of what has been said and the opening up towards a deeper level of objectification, a level where all the circles of the figures will become objects of discourse, gesture and vision. She says:
3b. Mimi: OK! It would’be like one (indexical gesture on Figure 1; see Picture 4), one (indexical gesture on Figure 1; see Picture 5), plus three (grouping gesture; see Picture 6); this (making the same set of gestures but now on Figure 2) would’be two, two, plus three; this (making the same set of gestures but now on Figure 3) would be three, three, plus three.
Table 3 (Pictures 4 to 6): In Pictures 4 and 5 Mimi makes an indexical gesture to indicate the first circle on the top row and the first circle on the bottom row of Figure 1; in Picture 6, she makes a “grouping gesture” to put together the last three circles of Figure 1.
for Figure 1 you will add
Table 2 (Pictures 2 and 3): Perceptual
objectifying effects of word and gestureon Figure 1.
Radford, Bardini & Sabena
PME30 — 2006 4 - 397
Making two indexical gestures and one “grouping gesture” that surrounds the three last circles on Figure 1, Mimi renders a specific configuration apparent to herself and to her group-mates. This set of three gestures is repeated as she moves to Figure 2 and Figure 3. The gestures are accompanied by the same sentence structure (see Figure B). Through a coordination of gestures and words, Mimi thereby objectifies a general structure in a dynamic way and moves from the particular to the general.
« one, one, plus three »
« two, two, plus three »
« three, three, plus three »
Figure B: On the left, Mimi making the (first) indexical gesture on Figure 1. On the right, the new apprehension of the figures as a result of the process of knowledge
objectification.
Rhythm and the projection of the general The genesis of algebraic generalizations entails the awareness that something stays the same and that something else changes. In order to perceive the general, the students have to make choices: they have to bring to the fore some aspects of the figures (emphasis) and leave some other aspects behind (de-emphasis). Closer attention to the previous passage suggests that the objectification of the general schema is much more than a matter of coordinating word and gesture. There is another important element: rhythm. Rhythm creates the expectation of a forthcoming event (You, 1994) and constitutes a crucial semiotic device in making apparent the perception of an order that continues beyond the first figures of the sequence.
To get a better idea of the manner in which the students emphasize and deemphasize the various features of the figures through rhythm, we conducted a prosodic analysis of Mimi’s key utterance in line 3b (“one plus one plus three” etc.). Prosody refers to all those vocal features to which speakers resort in order to mark, in a distinctive way, the ideas conveyed in conversation. Typical prosodic elements include intonation, prominence (as indicated by the duration of words) and perceived pitch. Our prosodic investigation was carried out using Praat (www.praat.org) a software devoted to voice analysis. Our prosodic analysis focused on the temporal distribution of words and word intensity. In the top part of Figure C, the waveform shows a visual distribution of words in time; the curve at the bottom shows the intensity of uttered words (measured in dB).
Radford, Bardini & Sabena
4 - 398 PME30 — 2006
Figure C: Prosodic analysis of Mimi’s utterance conducted with Praat. The waveform allows us to neatly differentiate two kinds of rhythms: within and between figures. The first type of rhythm, generated through word intensity and pauses between words, helps the students to make apparent a structure within each figure. In conjunction with words and gestures (the hand performing the same kind of gesture on each figure), this rhythm organizes the way of counting. The other type of rhythm appears as a result of generated “transitions” between the counting processes carried out by Mimi when she goes from one figure to the next. To generate these transitions, at the lexical level, Mimi uses the same expression, namely “this would be”, the semantic value of which indicates the hypothetical nature of the emerging counting schema. At the temporal level, this expression allows Mimi to accomplish a separation between the counted figures. At the kinesthetic level, the transition corresponds to the shifting of the hand from one figure to the next. Table 3 provides us with a precise idea of the within and between figures rhythm.
Table 3: Intensity and time data of Mimi’s utterance, as derived from Praat prosodic analysis. Rows 1 and 2 show the intensity (dB) and time position of words (s), both measured at the middle of the duration of the word. Row 3 gives the elapsed time between consecutive words. Row 4 gives the total time of the speech segments.
un one
Un One
plus plus
trois three
this would’be
Deux two
deux two
plus plus
trois three
this would’be
trois three
Trois three
plus plus
Trios three
1. Intensity
(dB)
76.58
77.52
80.04
81.93
78.72
78.61
77.44
80.66
81.73
81.24
77.94
80.38
2. Time (s)
0.157
0.665
1.025
1.348
0.813
2.161
2.798
3.158
3.463
4.793
5.116
5.347
5.633
3. Time (s)
between consecutive words
0.508
0.36
0.323
0.637
0.36
0.305
0.323
0.231
0.286
4. Total time (s)
1.191 0.511
1.302
1.035
0.840
Radford, Bardini & Sabena
PME30 — 2006 4 - 399
The data in row 3 indicate that 12313373832333 ,, aaaaaa , i.e. the data show that the time elapsed between the additive preposition “plus” and the uttered number prior to it is consistently shorter than the elapsed time between the two uttered numbers before “plus”. Thus, while the elapsed time between the second “one” and “plus” is 0.360 s ( 33a ), the elapsed time between “one” and “one” is 0.508 s ( 23a ). It is also interesting to note that, in the case of figures 1 and 2, the elapsed time between “plus” and the following word is shorter than the time between “plus” and the uttered number before it (i.e. 83933343 , aaaa ). The rhythmic distribution of words hence suggests that the preposition “plus” does not merely play the role of an arithmetic operation. By emphasizing and deemphasizing aspects of the figures, it plays a key prosodic role in the constitution of the counting schema. Note that the temporal distribution of words of the two first speech segments ( )463.3161.2;348.1157.0 tt is quite similar to that of the third speech segment ( )633.5793.4 t ). However, the data indicate that the duration of the latter (0.840 s) is shorter than the duration of the former (i.e. 1.191 and 1.302; see row 5). Since the students did not need to go beyond Figure 3 to objectify the counting schema, one of the reasons for this may be that an adequate objectification of the generalization was achieved during the investigation of the two first figures and the third figure hence played the role of verification. This particular status of Figure 3 is also suggested by the following facts. Firstly, 54104 aa . Secondly, the intensity of the words uttered here is generally higher than the intensity displayed in talking about the first two figures (see Row 1). Thirdly, while Mimi touches the circles of the first two figures in her indexical gestures, she does not touch the circles of Figure 3. Word intensity, time duration and distant physical contact with Figure 3 seem to indicate an achieved level of awareness of the objectified mathematical structure.
CONCLUDING REMARKS Because mathematical generality is composed of different layers of depth, the grasping of the general is a gradual process of becoming aware of something, a process that we have termed, in accordance with its etymological roots, objectification. An essential part of this process is the projection of an order into the perceptual realm. Without such a projected order, we all would be overwhelmed by the tremendous sources of stimuli in our surroundings and the richness of detail and nuances of the things in front of us (Fraisse, 1974, pp. 111-112). Three semiotic means of objectification played a distinctive role in creating such an order in Mimi’s objectification of the general. These were word, gesture and rhythm. Through them, some aspects of the figures were brought to the fore; others were left in the back, giving rise to a progressive apprehension of the historically and culturally constituted mathematical general structures that were the goal of the classroom activity. Indeed, though indexical and grouping gestures, Mimi emphasized some circles in the visual realm; through words, she endowed them with theoretical content. Rhythm accounted for a subtle coordinating mechanism that produced at the aural, kinesthetic and
Radford, Bardini & Sabena
4 - 400 PME30 — 2006
visual levels a regularity that proved to be crucial for conveying a sensuous meaning of generality. The prosodic analysis showed how words were distributed in the temporal dimension of discourse to emphasize and deemphasize features of the figures. The ensuing aural meaning of words was synchronized with the kinesthetic and visual meanings encompassing the pointed circles and the successive position of gestures in the space. In addition to shedding some light on the genesis of the students’ production of generalizations, our results speak in favor of the cognitive importance of some aspects of the students’ mathematical activity such as gesture and rhythm that as yet are not a part of main stream studies in mathematical thinking and learning. As our analysis implies, gesture and rhythm are not only merely part of the pragmatic dimension of language and communication but of mathematical cognition as well. Acknowledgment: This paper is a result of a research program funded by the Social Sciences and Humanities Research Council of Canada (SSHRC/CRSH). References Fraisse, P. (1974). Psychologie du rythme. Paris: Presses Universitaires de France. Kieran, C., Boileau, A., & Garançon, M. (1996). Introducing algebra by means of a
technology-supported, functional approach. In N. Bednarz, C. Kieran & L. Lee (Eds.), Approaches to Algebra (pp. 257-293). Dordrecht/Boston/London: Kluwer.
Love, E. (1986). What is algebra? Mathematics Teaching, 117, 48-50. Mason, J. (1996). Expressing generality and roots of algebra. In N. Bednarz, C. Kieran & L.
Lee (Eds.), Approaches to Algebra (pp. 65-86). Dordrecht/Boston/London: Kluwer. Mason, J., Graham, A., Pimm, D., & Gowar, N. (1985). Routes to/ roots of algebra. Milton
Keynes, UK: Open University Press. Mikhailov, F. T. (1980). The Riddle of the Self. Moscow: Progress Publishers. Radford, L. (2000). Signs and Meanings in Students’ Emergent Algebraic Thinking: A
Semiotic Analysis. Educational Studies in Mathematics, 42(3), 237-268. Radford, L. (2002). The Seen, the Spoken and the Written. For the Learning of
Mathematics, 22(2), 14-23. Radford, L. (2003). Gestures, Speech, and the Sprouting of Signs: A Semiotic-Cultural
Approach to Students’ Types of Generalization. Mathematical Thinking and Learning, 5(1), 37-70.
Radford, L., Demers, S., Guzmán, J., & Cerulli, M. (2003). Calculators, graphs, gestures and the production of meaning. Proceedings of the 27 PME Conference (Vol 4, pp. 55-62). Honolulu, USA.
Radford, L., Cerulli, M, Demers, S., & Guzmán, J. (2004). The sensual and the conceptual: artifact-mediated kinesthetic actions and semiotic activity. Proceedings of the 28 PME Conference (Vol. 4, pp. 73-80). Bergen, Norway.
Sabena, C., Radford, L., & Bardini, C. (2005). Synchronizing gestures, words and actions in pattern generalizations. Proceedings of the 29 PME Conference (Vol. 4, pp. 129-136). Melbourne, Australia: University of Melbourne.
You, H. (1994). Defining Rhythm: Aspects of an Anthropology of Rhythm. Culture, Medicine and Psychiatry, 18, 361-384.
2006. In Novotná, J., Moraová, H., Krátká, M. & Stehlíková, N. (Eds.). Proceedings 30th Conference of the International Group for the Psychology of Mathematics Education, Vol. 4, pp. 401-408. Prague: PME. 4 - 401
DEVELOPING MATHEMATICAL INITIATIVE IN MINORITY STUDENTS
Iuliana Radu Barbara Tozzi Keith Weber Rutgers University Rutgers University Rutgers University
To participate in some aspects of reform-oriented instruction, students need to take mathematical initiative. However, existing research suggests that low-income African-American and Latino students are less likely to take mathematical initiative than middle-class, white students. This may prevent minority students from fully participating in reform-oriented instruction. In this paper, we will present techniques that we have developed in an urban, after school program in mathematics, that encourage African American and Latino middle school students to take mathematical initiative.
INTRODUCTION In the United States, achieving equity and diversity in the mathematics classrooms is a significant social and educational issue. Numerous studies demonstrate that African American and Latino students do not attain the same level of achievement as their white counterparts (e.g., NCES, 2000). As minority students�’ mathematical achievement is pivotal to their democratic enfranchisement and economic well-being (Moses & Cobb, 2001), their continued struggles with mathematics represent a serious problem. In recent years, there has been a shift in the nature of diversity research in mathematics education. Diversity research had traditionally been strongly influenced by paradigms from cognitive psychology and had taken a deficit-approach to minority students�’ mathematical achievement (Nasir & Cobb, 2002). That is, researchers have sought to understand what knowledge and cognitive skills students form various ethnic groups tended to lack. More recently, diversity research has focused on increasing the opportunities for different groups of students to participate in classroom mathematical activities (e.g., Nasir & Cobb, 2002; Lubienski, 2002). Recently, influential organizations such as the National Council of Teachers of Mathematics have emphasized that achieving equity should be a goal of reform-oriented instruction (e.g., NCTM, 2000). Although this type of instruction may have the potential to benefit all students and perhaps even close the achievement gap between white and minority students (Boaler, 2001), Lubienski (2002) cautions that white upper-middle class students may be better prepared to participate in some aspects of reform-oriented instruction than other groups of students, citing her own experiences as a reform-oriented teacher as support for this concern (Lubienski, 2000). In this paper, we will discuss mathematical initiative and its importance in enabling students to participate in the activities of reform-oriented mathematics classrooms. Following Powell (2004), we define mathematical initiative as the mathematical
Radu, Tozzi & Weber
4 - 402 PME30 �— 2006
action taken by a student in the context of a mathematical task that does not specifically indicate or suggest that action. Taking mathematical initiative enables students to go beyond simply doing what they are told or implementing procedures that they had memorized. Such initiative appears to be necessary to participate in many aspects of reform-oriented instruction. For instance, the NCTM (2000) recommends that students participate in mathematical discussions, represent mathematical situations in novel ways, challenge and critique each other�’s explanations, and reflect upon their reasoning processes. Participating in each of these activities requires students to take mathematical initiative and move beyond doing what they are told or recalling procedures. Martin (2000) suggests that African American students may take less mathematical initiative than middle class white students; in particular, by the time they reach high school, many African American students will only engage in mathematical activity when they perceive it to be necessary, and they tend to hold strong procedural views of mathematics. This lack of mathematical initiative may prevent them from participating in reform-oriented instruction. However, encouraging students of color to take more mathematical initiative may allow them more opportunities to participate in mathematical activity and improve their mathematical achievement (Powell, 2004). The purpose of this paper is to describe techniques that we have developed in an urban, middle-school1 after-school program that have led African American and Latino students to take mathematical initiative.
RESEARCH CONTEXT
Research setting. The research reported in this paper occurred in the context of the �“Informal Mathematical Learning�” research project2. In this project, an innovative after school program was implemented at Hubbard Middle School in Plainfield, New Jersey. Plainfield is an economically depressed urban area; 98 percent of the students at Hubbard are African American or Latino. Twenty-four sixth grade students, all African American or Latino, volunteered to participate in the Informal Mathematical Learning program. In the after school sessions, students were videotaped as they completed open-ended, well-defined mathematical problems. The researchers encouraged collaboration among students, always asking them to work together on tasks and frequently encouraging them to explain their solutions to their peers; at the same time, the students were never told whether their reasoning or solutions to problems were correct. The goals of this research study were to understand how students�’ mathematical reasoning developed over time and to investigate the relationship between mathematical initiative and mathematical reasoning.
1 In the United States, middle school students are in grades six through eight. 2 The �“Informal Mathematical Learning�” Project is supported by the National Science Foundation ROLE Grant REC0309062. The views expressed in this paper are those of the authors and not necessarily those of the National Science Foundation.
Radu, Tozzi & Weber
PME30 �— 2006 4 - 403
Data collection. The study was a longitudinal one, spanning three years. This paper will present the initial stages of analysis, focusing on students�’ use of mathematical initiative in the first first four weeks of the study. The participants met with the researchers twice a week, where each meeting lasted between one hour and 90 minutes. There were a total of eight meetings during the four-week period, totalling approximately ten hours. During these meetings, students were engaged in problems about fractions using Cuisinaire rods. A typical question that students were asked to solve was, �“If I gave the light green rod the number name one, what number name would I give to the yellow rod?�” Each of these lessons was videotaped, yielding ten hours of video to be analysed. Analytical method. The first two authors first decided on a working definition of mathematical initiative, then independently identified and transcribed all instances in the data where students displayed such initiative. Meetings to compare findings were held after the analysis of every two sessions. There was a high level of agreement on the identified instances, and any disagreement was discussed and used for further refinement of the authors�’ understanding of the mathematical initiative construct. Then, for each instance of mathematical initiative, the authors identified the aspects of the environment that encouraged students to take initiative in a mathematically meaningful manner. These aspects, followed by examples of student initiative, are discussed in detail in the next section.
RESULTS Aspects of the learning environment that encouraged initiative Non-judgmental responses to student comments or answers. Throughout the study, researchers consistently displayed a non-judgmental approach in responding to student comments or answers. In other words, students were never told if their responses were correct or incorrect and participation was always received positively. The following excerpt exemplifies this type of researcher behavior (R stands for �“Researcher�”):
Researcher: What did I call the number name for orange? Class: 1 R: One�…ok, so I�’m going to write that down. And, I�’m asking you what the number name is for yellow, and I�’d like to hear from Chris. Chris: Point five. R: You�’re going to call the yellow rod .5�…how many picked .5? Only a couple of people�…why, Chris?
In this excerpt, the researcher did not indicate whether Chris�’ response was correct. Instead, she invited Chris to explain his reasoning to the class and allowed the class to be the arbiter if Chris�’ reasoning was valid. Lubienski (2000) found that students of low socio-economic status were less likely to participate in mathematical discussions because they believed the purpose of these discussions was to allow the
Radu, Tozzi & Weber
4 - 404 PME30 �— 2006
teacher to judge their mathematical understanding; therefore, they would not participate out of fear of being incorrect. We believe that the non-judgmental stance of the researchers in this study encouraged students to explore novel ideas without fear of a negative response by the researchers. Appropriation of initiative. At times, students would take initiative by extending a problem stated by the researcher. In some cases, students generalized the problem that was being solved. In others, students posed a new question that built upon the previous question that they had just answered. In these cases, the researcher would call all the students�’ attention to the comment that the student made or the question that they raised and build upon it. We suggest that such a pedagogical move is an instance of appropriation (in the sense of Cobb, Yackel, and Wood, 1992, p. 20), in that the researcher is implicitly letting students know that taking initiative is desirable behavior. In the following instance, the students were debating whether the light green rod would have the number name 0.3 or one-third if blue had the number name one. Dante asks what number name the white rod would have if the light green rod had the number name 0.3:
Dante: Since 3 white cubes go into a light green rod, what are we gonna call �…if we call the light green 0.3, what are we going to call the white rod? Researcher: Let�’s follow this here, what Dante says. [�…] He said if 3 white rods are the same length as light green�…Do you all agree with that? Class: Yeah. R: So, the question is what are we going to call the white rod. [�…] I want you all at your tables to figure that out.
This type of response by the researcher implicitly endorses new questions brought up by the students, and encourages the students to think beyond the task currently under discussion. The nature of the tasks. All tasks used in this project were such that the students were unlikely to have encountered them previously; therefore, students could not take a procedural approach to them. Further, two specific types of tasks were found to be especially encouraging of mathematical initiative. The first consists of extremely open-ended tasks, such as �“explore the rods in front of you and then tell me what you learned about them�”, an activity given to the students in the first session. Using such widely open questions encouraged students�’ creativity and often led students to form mathematical connections that would form the basis for future mathematical work. The second type of task fostering mathematical initiative subtly invites the students to formulate generalizations. Such tasks are either a sequence of tasks with the same structure (e.g., a series of questions of the form �“If I call the white rod <number>, what should I call the <color> rod?�”), or a single problem (e.g., �“If blue is 1, find the number name of each rod in the set.�”). Notice that both tasks can be solved without any generalizations, but developing a general rule for situations of a given type leads to a more time-efficient solution. In the study, many students naturally sought these generalizations without prompting.
Radu, Tozzi & Weber
PME30 �— 2006 4 - 405
Collaboration among students. The design of the Informal Mathematical Learning project placed great importance on free student interaction. Students were seated around tables of four or five, and the manipulatives (Cuisenaire rods in this case) were placed in the middle of each table to be shared by all. Researchers continually encouraged students to discuss the tasks with their tablemates. Also, researchers sometimes explicitly prompted to discuss their ideas with their tablemates before presenting them to a researcher or sharing them with the whole class. An overhead projector enabled students to share their ideas with all the participants in the session. We believe that collaboration among students encouraged initiative in at least two important ways. First, observing the different reasoning processes and alternative solutions of others often led students to engage in the problem that they had solved in a different way. For instance, students presented a variety of solutions to the task, �“Create a train [a sequence of rods] to be given the number name one such that the yellow rod will be called one half�”. When students saw different trains that would satisfy this constraint, this challenged them to find new ways of creating the required train and wondering how many such trains could be found.
Instances of students’ mathematical initiative. In the later video sessions that we analysed, we found many instances of students taking mathematical initiative. We present several examples below, discussing how the aspects of the learning environment that we have just described may have contributed to students taking this initiative and highlighting how these instances of initiative led students to participate in the mathematical activities and reason in sophisticated ways. Student as facilitator. In the following instance, students were grappling with the following question: �“If the blue rod had the number name one, what do you call the white rod?�” After initially struggling with this problem, Chanel assisted Dante in the following manner:
Chanel [addressing Dante]: If we take this one [pointing to the blue rod], that�’s a whole�…and you take one of these [taking a white rod and placing it along the blue one], it�’s 1.9�…so if you take some more of these, that�’s 1.9+1.9+1.9+�…+1.9 [9 times]. Take the white ones away�…[places light green rods along the blue]. Now, what is this called now? [referring to light green]
Dante: 1.3 Chanel: Why? Dante: It�’s 1.3 because 3 light green rods make up the blue. Chanel: Alright�…so what�’s 1.5?
Although the students use the wrong terminology (i.e., they confused 1.3 with 1/3 and 1.9 with 1/9), their reasoning is otherwise valid. Here, the initiative consists in Chanel�’s decision to act as a facilitator for Dante, and also in Chanel�’s formulation of a new problem for Dante (�“what�’s 1.5?�”). We believe that Chanel�’s behavior is at least in part due to the behavior modeled by the researchers. Their continual
Radu, Tozzi & Weber
4 - 406 PME30 �— 2006
rencouragement of the students to share and explore their ideas in collaboration with their peers is also likely to be one of the factors that made this instance happen. Devising strategies for counting. The problem that provided the context for this instance of mathematical initiative is �“How many different trains can you form with two purples and two whites?�” The students, together with the researcher, had already decided that �“the order matters�” in differentiating between trains (i.e., trains should be �“read�” from left to right). Students displayed mathematical initiative in the strategies they employed for arguing that there were only 6 trains of the type defined by the problem. Kori and Wayne categorized the trains into �“whites together�” (trains where the two white rods were adjacent), and �“whites apart�”, and then counted the trains in each category. Another strategy displayed by the students was labeled �“the reverse�”: for each created train, create the one obtained by replacing each purple with a white, and vice-versa. Finally, a third strategy employed by students was called �“backwards�”: for each created train, create the one obtained by rotating the first one 180 , thus obtaining the �“backwards�” version of the original train. The invention of strategies allowed students to make progress in a combinatorics task that was novel to them, and to establish an efficient method for checking that they had formed all possible trains in each category. These instances of mathematical initiative are likely to have been fostered by the nature of the task given to the students, the researchers�’ constant focus on student thinking, and the researchers�’ demand for justification for every student answer. Creation and use of notation. The students received a follow-up task to the one mentioned in the previous example: �“How many trains that equal in length to the purple rod can you create?�” One instance of mathematical initiative in this context comes from Lorrin. She built a few trains that were equal in length to the purple rod, then decided to use strings of letters in keeping track of the trains built so far (e.g., WWR represented a white-white-red train). In doing so she not only created a new representation for the trains already found, but also devised a way of obtaining new trains from existing ones by directly manipulating strings of letters. We hypothesize that this instance of mathematical initiative was fostered both by the researchers�’ focus on mathematical reasons for answers and the fact that the task was a follow-up to a previous problem, so the students already had counting strategies to build on.
DISCUSSION The preceding examples illustrate African American and Latino students taking mathematical initiative and participating in mathematical activities. These students were exhibiting this behavior with relatively little exposure to our research environment. Each of the instances in this paper occurred within the first eight sessions of our study. This paper also reports aspects of the study that we believed were instrumental in inviting students to take this mathematical initiative. We hope that teachers and researchers can use this work to develop initiative in their own students so that these students can fully participate in the activities of reform-oriented classrooms.
Radu, Tozzi & Weber
PME30 �— 2006 4 - 407
We propose two directions for future research. First, we recognize that the conditions under which our project operated differ in many ways from those of a regular classroom. We realize that teachers, under the constraints of traditional classrooms, may not always be able to implement the techniques that we describe. This does not mean that the study has no implications regarding instruction in public schools, but that further research is needed in order to determine which of the aspects of the learning environment identified in this paper are replicable under the restrictions of a public school system. To illustrate one difficulty that a teacher might have, consider a student who poses a challenge question that is not germane to the topic that the teacher intends to teach. Does the teacher spend valuable class time allowing students to consider this question? Or does the teacher not follow up on the student�’s question, which may discourage this student from taking mathematical initiative in the future? These are difficult issues that practicing teachers must contend with that are not addressed in our study. Another suggested direction for future research concerns the study of the relationship between mathematical initiative and success as a problem solver and mathematics learner. In other words, in what ways, and to what extent, does mathematical initiative contribute to students�’ understanding of mathematics, and consequently achievement? We are currently investigating this issue by analysing further data collected from our study. In conclusion, there are still important questions regarding student mathematical initiative to be addressed. However, considering the findings outlined in this paper, we have reasons to believe that encouraging mathematical initiative in urban students can lead to fuller participation in mathematical activity. References Boaler, J. (2002). Learning from teaching: Exploring the relationship between reform
curriculum and equity. Journal for Research in Mathematics Education, 33, 239-258. Cobb, P., Yackel, E. , & Wood, T. (1992). A constructivist alternative to the
representational view of mind in mathematics education. Journal for Research in Mathematics Education, 23, 2-33.
Lubienski, S.T. (2000). Problem solving as a means towards �“mathematics for all�”: An exploratory look through a class lens. Journal for Research in Mathematics Education, 31, 454-482.
Lubienski, S.T. (2002). Research, reform, and equity in U.S. mathematics education. Mathematical Thinking and Learning, 4, 103-125.
Martin, D. B. (2000). Mathematics success and failure among African-American youth: The roles of sociohistorical context, community forces, school influence, and individual agency. Mahwah, New Jersey: Lawrence Erlbaum.
Nasir, N.S. & Cobb, P. (2002). Diversity, equity, and mathematical learning. Mathematical Thinking and Learning, 4, 91-102.
Radu, Tozzi & Weber
4 - 408 PME30 �— 2006
National Center for Education Statistics. (2000). NAEP 1999 trends in academic progress. Washington, DC: U.S. Department of Education.
National Council of Teachers of Mathematics (2000). Principles and standards for school mathematics. Reston, VA.: NCTM.
Powell, A. (2004). The diversity backlash and the mathematical agency of students of color. In M.J. Hoines & A.B. Fuglestad (Eds.) Proceedings of the 28th Conference for the International Group of the Psychology of Mathematics Education, 1, 37-54. Bergen, Norway.
2006. In Novotná, J., Moraová, H., Krátká, M. & Stehlíková, N. (Eds.). Proceedings 30th Conference of the International Group for the Psychology of Mathematics Education, Vol. 4, pp. 409-416. Prague: PME. 4 - 409
A MODEL OF TEXTBOOK USE Sebastian Rezat
Institut für Didaktik der Mathematik, Justus-Liebig-Universität Giessen, Germany The aim of this paper is twofold. On the one hand it is intended to develop a model of the activity ‘textbook use’ that is of particular interest for research in mathematics education. On the other hand it is supposed to make a contribution to activity theory striving for “transcending the boundary between theory and practice” (Engeström, 1990) by applying activity theory to a particular activity. It appears that in the case of textbook use the triad ‘subject – mediating artefact – object’ as the nucleus of the human activity system does not entirely represent the activity ‘textbook use’. This will raise issues according to the model of the human activity system as suggested by Engeström (1999b).
INTRODUCTION As Even and Schwarz (2002) point out, �“the focus of research in mathematics education has extended from the individual student's cognition and knowledge to contextual, socio-cultural and situated aspects of mathematics learning and knowing. From a socio-cultural perspective not merely the �“practices and culture of the classroom community�” (Even & Schwarz, 2002) are of particular interest, but the study of artefacts of the mathematics classroom and their use. Howson (1995), who states that �„despite the obvious powers of the new technology it must be accepted that its role in the vast majority of the world�’s classrooms pales into insignificance when compared with that of textbooks and other written materials�” underpins the particular interest in the textbook and its use for research in mathematics education. In fact the textbook is associated with most of the activities related to teaching and learning mathematics. While textbooks and the comprehension of mathematical text (cf e.g. Österholm, 2004) have received some attention in research on mathematics education, several authors point out a dearth of research into the use of texts (Gilbert, 1989; Love & Pimm, 1996). One reason may be the difficulty of obtaining data on the use of textbooks (cf Love & Pimm, 1996). Another reason may be the lack of a theoretical framework for textbook use. An appropriate theoretical framework might in fact be regarded as a prerequisite to collect data on the use of textbooks. Therefore, the first aim of this paper is to develop a model of the activity �‘textbook use in teaching and learning mathematics�’. From an activity-theoretical perspective this activity is striking because it is connected to a particular artefact by definition. If activity theory aims at being �“a pathbreaker in studies that help humans gain control over their own artefacts�” (Engeström, 1999a) it should be capable to provide a model for the activity �‘textbook
Rezat
4 - 410 PME30 �— 2006
use�’. It appears that in the case of textbook use the triad �‘subject �– mediating artefact �– object�’ as the nucleus of the human activity system does not entirely represent the activity �‘textbook use�’. This will raise issues according to the model of the human activity system as suggested by Engeström (1999b).
RATIONALE FOR A MODEL OF TEXTBOOK USE BASED ON ACTIVITY THEORY Activity theory analyses �“object-oriented, collective, and culturally mediated human activity�” (Engeström et al., 1999). The use of a textbook is an activity that is situated in the context of institutional teaching and learning. Within that context the use of textbooks is object-oriented and collective. The educational system itself is a historically and culturally formed system. The emphasis of activity theory is placed on �“mediation of human action by cultural artefacts�” (Engeström et al., 1999). As well as the educational system the textbook is a historically and culturally formed mediating artefact. The textbook is influenced by the educational system and by traditional concepts of teaching and learning. Both, the historical development and the literature on textbooks are characterized by controversies. It seems that the textbook and its use are best described as a set of dichotomies. The following questions may give an impression of some important dichotomies:
Is the textbook a pedagogical means or a marketed product? Mathematics textbooks as well as textbooks in general are developed to serve a pedagogical purpose. Nevertheless, �“publishing is a business and must please its primary customers �– teachers �– to remain viable�” (Chambliss & Calfee, 1998). Therefore the textbook is not merely a pedagogical means but also a marketed product. �“The economics of publishing also imposes constraints�” (Love & Pimm, 1996) on the development of textbooks as a pedagogical means.
Is the textbook an instrument for learning or the object of learning? The textbook mediates knowledge. In this respect it is designed to be an instrument for teaching and learning. However, Engeström (1999b) argues, that the main aim of teaching has been to reproduce the text in the textbook. Therefore he concludes that the text must be regarded as the object of learning. Then again, some authors even call for considering textbooks as the object of learning in order to develop a critical attitude towards mass-media (cf Keitel et al., 1980; Stein, 1995).
Is the textbook addressing the teacher or the student? On the one hand mathematics textbooks pretend to be addressed to the student. Consequently, teacher�’s guides are offered in addition to textbooks (Keitel et al., 1980). On the other hand, most authors agree that mathematics textbooks are addressing both, the teacher and the learner (Griesel & Postel, 1983; Keitel et al., 1980; Love & Pimm, 1996; Stein, 1995). This dichotomy is associated to the issue of the nature of the knowledge that represented in
Rezat
PME30 �— 2006 4 - 411
textbooks, i.e. the dichotomy between a mathematical and a didactical nature of the knowledge.
Is the textbook supposed to be mediated by the teacher or is its intention to substitute the teacher? Most authors agree that the textbook are not in general conceived to replace a teacher, but are written to be mediated by the teacher (cf e.g. Griesel & Postel, 1983; Love & Pimm, 1996; Newton, 1990). But nevertheless there is a tendency to create teacher-proof textbooks (cf Keitel et al., 1980).
These dichotomies already demonstrate that a model of textbook use must be capable of incorporating dichotomies. According to Engeström (1990) �“activity systems are characterized by inner contradictions�”. Therefore, activity theory appears to be especially suited to be a basis for a model of textbook use.
TEXTBOOK USE FROM AN ACTIVITY-THEORETICAL PERSPECTIVE The fundamental interacting components of the activity system are the subject, the object and the mediating artefact. Vygotsky (1978) was the first to introduce the triangle with these components as vertices as a simplified model of mediated action.
Fig. 1: Vygotsky�’s simplified model of mediated action A first approach to describe the use of mathematics textbooks by students according to this model might be the following triangular representation:
Fig. 2: 2-d-representation of the use of textbook by students (1) The activity described in this model is part of the learning activity as a whole. Within this activity the textbook serves as an instrument to acquire mathematical knowledge. However, this model disregards the widespread agreement that textbook use is usually mediated by the teacher (cf Griesel & Postel, 1983; Love & Pimm, 1996; Pepin & Haggarty, 2001). Newton (1990) claims that �“text use is usually perceived as a relationship between the teacher, the student and the text�”. Keeping in mind that the teacher is regarded as
mathematical knowledge student
textbook
object subject
mediating artefact
Rezat
4 - 412 PME30 �— 2006
the mediator of the text, Newton suggests a different model of textbook use that is displayed in Fig. 3.
Fig. 3: 2-d-representation of textbook use with the teacher as mediator of the text From an activity-theoretical perspective this model of textbook use has two remarkable implications:
(1) In this model the role of the textbook has changed. It is no longer an instrument but the object of the activity.
(2) From an activity-theoretical perspective the teacher adopts the position of the mediating artefact. This means, that either this model is no representation of an instrument mediated activity in the activity-theoretical sense of the term or that the idea of mediation can not be reduced to artefacts. These two alternatives try to explain the position of the teacher within the triangular structure of the activity system. Another way of dealing with the mediating role of the teacher is to expand the triangle in Fig. 2 to a quadrilateral. The new vertex stands for the mediation of the use of the artefact by a person or another artefact.
In the case of textbook use the triangular nucleus of the activity system will expand to the following quadrilateral:
Fig. 4: 2-d-representation of the use of textbook by students (2) From the student�’s perspective this seems to be an appropriate model for textbook use. In this quadrilateral structure the student is the user of the textbook and the teacher is mediating the use of the textbook. But in this model it is not yet taken into consideration that the teacher himself is a user of the textbook. In fact, it was inherent in one of the major dichotomies, that the textbooks are even addressing teachers. Compared to the student the teacher uses the textbook in a different way. For him it is not merely an instrument to acquire knowledge. Different studies substantiate that mathematics teachers use textbooks as a means to prepare their lessons (cf Bromme & Hömberg, 1981; Hopf, 1980; Stodolsky, 1989; Valverde et al., 2002; Woodward &
mathematical knowledge student
teacher textbook
textbook student
teacher
Rezat
PME30 �— 2006 4 - 413
Elliott, 1990). Hence, for the teacher the textbook mediates didactical aspects of the presented knowledge. The use of the textbook by the teacher may be either modelled as a separate activity system or it may be included in the model of textbook use depicted in Fig. 4. As a result, the complexity of the model of the activity �‘textbooks use�’ will increase in a way that is best represented in the three dimensional shape of a tetrahedron.
Fig. 5: 3-d-representation of the model of textbook use This model includes another major dichotomy of the textbook, namely the dichotomy with regard to the nature of the knowledge represented in textbooks. But this time it appears at one of the vertices. This conforms with Engeström (1999b) who describes dichotomies to be characteristic for all vertices of the activity model. With regard to the two major subjects that are using textbooks �– the teacher and the student �– Fig. 5 in fact represents a more comprehensive model of textbook use. The tetrahedron represents the use of textbooks in class. Each of the triangular faces of the tetrahedron reveals another aspect of textbook use.
(1) student �– teacher �– textbook The student is the acting subject in this triangle and the textbook is the object of his activity. The teacher mediates the use of the textbook.
(2) student �– textbook �– mathematical knowledge The student in this triangle uses the textbook on his own initiative without mediation by the teacher. The object of his activity is mathematical knowledge in general. The textbook is regarded as the instrument to access the mathematical knowledge. It mediates between the mathematical knowledge and the student.
(3) teacher �– textbook �– mathematical knowledge (didactical aspects) This triangle describes the teacher�’s use of the textbook. While the teacher acts as a mediator of textbook use in the whole activity system he is the subject of
teacher student
textbook
mathematical knowledge/ didactical aspects of the mathematical knowledge
Rezat
4 - 414 PME30 �— 2006
the activity in this subsystem. The object of his activity are the didactical aspects of the knowledge represented in the textbook.
(4) student �– teacher �– mathematical knowledge
The traditional didactical triangle or as Chevallard calls it �‘the didactical system in the narrow sense�’ (cf Chevallard, 1991), that also appears in the tetrahedron-model of textbook use does not even include the textbook, but still must be considered as a subsystem of the activity �‘textbook use�’. It can be seen as the complement of triangle (3). The teacher implements the knowledge that is represented in the textbook without using the textbook overtly in the lesson. He acts as a mediator of the knowledge. Several studies substantiate this way of using textbooks (cf Hopf, 1980; Stodolsky, 1989; Valverde et al., 2002; Woodward & Elliott, 1990).
CONCLUSION
Two conclusions of the preceding section may be drawn. On the one hand it was shown, that activity theory can be applied to create a suitable model for the activity �‘textbook use�’. The suggested model includes all the major aspects of textbook use with regard to the two primary users. But as presented above it just focuses on the nucleus of the activity system, i.e. the triad subject �– mediating artefact �– object. This must be integrated into the whole activity system (cf Engeström, 1999b). Furthermore, the fundamental dichotomies in connection with the textbook need to be incorporated.
On the other hand the triad �‘subject �– mediating artefact �– object�’ turned out to be unsatisfactory to describe the activity �‘textbook use�’ entirely. This was due to the fact, that the use of the artefact itself was mediated by another subject. In addition, this mediating subject plays a double role, because it is not merely a mediator, but also a user of the artefact. This lead to an extension of the nucleus of the activity system at best modelled and represented as a tetrahedron. This modification is accompanied by a change of the focus of the nucleus of the activity system. Originally, the main focus of the triangular nucleus of the activity system is the subject (cf Engeström et al., 1999). Likewise, the tetrahedron was created coming from the subject. But the final model is not a description of the use of the artefact by merely one subject, it rather represents the use of an artefact by two subjects. Consequently the tetrahedron-model can be interpreted as the activity that surrounds a particular artefact. In this way the artefact is put in the centre of the activity system. Put differently, an activity-theoretical model of an activity that is linked to a particular artefact automatically situates the artefact in the centre of the activity system. If activity theory is intended �“to be a pathbreaker in studies that help humans gain control over their own artefacts�” (Engeström, 1999a) this might be a new worthwhile perspective. Further implications for activity theory of this change of focus need to be discussed.
Rezat
PME30 �— 2006 4 - 415
References Bromme, R., & Hömberg, E. (1981). Die andere Hälfte des Arbeitstages - Interviews mit
Mathematiklehrern über alltägliche Unterrichtsvorbereitung. Bielefeld: Institut für Didaktik der Mathematik der Universität Bielefeld.
Chambliss, M. J., & Calfee, R. C. (1998). Textbooks for learning - nurturing children's minds. Malden: Blackwell.
Chevallard, Y. (1991). La transposition didactique. Grenoble: Pensées sauvages. Engeström, Y. (1990). Learning, working and imagining. Twelwe studies in activity theory.
Helsinki: Orienta-Konsultit Oy. Engeström, Y. (1999a). Activity theory and individual and social transformation. In Y.
Engeström, R. Miettinen & R.-L. Punamäki (Eds.), Perspectives on activity theory (pp. 19-38). New York: Cambridge University Press.
Engeström, Y. (1999b). Lernen durch Expansion. Marburg: BdWi-Verlag. Engeström, Y., Miettinen, R., & Punamäki, R.-L. (Eds.). (1999). Perspectives on activity
theory. New York: Cambridge University Press. Even, R., & Schwarz, B. B. (2002). Implications of competing interpretations of practice to
research and theory in mathematics education. In A. D. Cockburn & E. Nardi (Eds.), Proc. 26th Conf. of the Int. Group for the Psychology of Mathematics Education (Vol. 2, pp. 337-344). Norwich: PME
Gilbert, R. (1989). Text analysis and ideology critique of curricular content. In S. de Castell, A. Luke & C. Luke (Eds.), Language, authority and criticism. Readings on the school textbook (pp. 61-73). London: The Falmer Press.
Griesel, H., & Postel, H. (1983). Zur Theorie des Lehrbuchs - Aspekte der Lehrbuchkonzeption. Zentralblatt für Didaktik der Mathematik, 83(6), 287-293.
Hopf, D. (1980). Mathematikunterricht. Eine empirische Untersuchung zur Didaktik und Unterrichtsmethode in der 7. Klasse des Gymnasiums. Stuttgart: Klett-Cotta.
Howson, G. (1995). Mathematics textbooks: A comparative study of grade 8 texts. Vancouver: Pacific Educational Press.
Keitel, C., Otte, M., & Seeger, F. (1980). Text Wissen Tätigkeit. Königstein: Scriptor. Love, E., & Pimm, D. (1996). 'this is so': A text on texts. In A. J. Bishop, K. Clements, C.
Keitel, J. Kilpatrick & C. Laborde (Eds.), International handbook of mathematics education (Vol. 1, pp. 371-409). Dordrecht: Kluwer.
Newton, D. P. (1990). Teaching with text. Choosing, preparing and using textual materials for instruction. London: Kogan Page.
Österholm, M. (2004). Läsa matematiska texter: Förståelse och lärande i läsprocessen. Linköping: University Electronic Press.
Pepin, B., & Haggarty, L. (2001). Mathematics textbooks and their use in english, french and german classrooms: A way to understand teaching and learning cultures. Zentralblatt für Didaktik der Mathematik, 33(5), 158-175.
Rezat
4 - 416 PME30 �— 2006
Stein, G. (1995). Schulbuch. In G. Otto & W. Schulz (Eds.), Enzyklopädie Erziehungswissenschaft (Vol. 4, pp. 581-589). Stuttgart: Klett.
Stodolsky, S. S. (1989). Is teaching really by the book? In P. W. Jackson & Haroutunian, Gordon (Eds.), From socrates to software: The teacher as text and the text as teacher (pp. 159-184). Chicago: University of Chicago Press.
Valverde, G. A., Bianchi, L. J., Wolfe, R. G., Schmidt, W. H., & Houang, R. T. (2002). According to the book - using timss to investigate the translation of policy into practice through the world of textbooks. Dordrecht: Kluwer.
Vygotsky, L. (1978). Mind in society: The development of higher psychological process. Cambridge: Harvard University Press.
Woodward, A., & Elliott, D. L. (1990). Textbook use and teacher professionalism. In D. L. Elliott & A. Woodward (Eds.), Textbooks and schooling in the united states (89 ed., Vol. 1, pp. 178-193). Chicago: The University of Chicago Press.
2006. In Novotná, J., Moraová, H., Krátká, M. & Stehlíková, N. (Eds.). Proceedings 30th Conference of the International Group for the Psychology of Mathematics Education, Vol. 4, pp. 417-424. Prague: PME. 4 - 417
IDENTICAL TWINS’ PERCEPTIONS OF TWO DIFFERENT INSTRUCTIONAL APPROACHES TO LEARNING
MATHEMATICS Candice L. Ridlon
Brigham Young University
This case study reports on two sets of identical twins (one male pair and one female pair) who experienced two different approaches to learning the same mathematical content. The twins were separated for the first time in 6th grade. Prior to that time the educational experiences of both sets were almost indistinguishable. During the 9-week study one child from each pair studied mathematics via a traditional explain-practice approach that focused on facts and procedures, whereas the other twin participated in an inquiry-based approach that focused on problem solving. From the perspective of the twins, the problem centered approach appeared to significantly enhance their achievement and attitude towards mathematics.
THE FOCUS OF THE STUDY For several decades educators have debated the effectiveness of different instructional approaches to teaching mathematics. Advocates of the traditional explain-practice approach are at odds with reformists who propose an inquiry-based approach. This study seeks to deepen understanding of the psychological aspects of teaching and learning mathematics by looking at individual differences from the perspective of two sets of identical twins who learned the same mathematical content using these two contrasting philosophies. To understand the experience of identical twins and to explore the efficacy of these approaches, we must examine three topics in detail. First, we must comprehend the underlying belief systems that resulted in this debate about approaches. Second, we must become familiar with the characteristics of each approach. Finally, we need to look at identical twins research in order to understand the importance and to interpret the experience of the twins.
THE DEBATE: EXPLAIN-PRACTICE VS. INQUIRY-BASED Explain-practice advocates believe that the focus of instruction should be basic facts and procedures, such as quick recall of multiplication tables or doing long division (Mathews, 2005). They point an accusing finger at inquiry-based approaches as being �“fuzzy math�”, which they claim is responsible for forcing children to �“discover�” mathematical principles beyond their understanding. Traditionalists contend that this approach is too time-consuming and does not insure that students end up learning the right concepts (Matthews, 2005). Furthermore, they assert that �“the starting point for the development of children�’s creativity and skills should be established concepts and
Ridlon
4 - 418 PME30 �— 2006
algorithms success in mathematics needs to be grounded in well-learned algorithms�” (Carson, 2005). They believe that skill mastery leads to understanding. Inquiry-based advocates, on the other hand, believe that teachers must develop �“each student�’s mathematical power by respecting and valuing their ideas, ways of thinking, and mathematical dispositions�” (NCTM, 1991, p. 57). They propose that mathematics is more than just knowing basic facts and procedures. Summing up the �“reform�” position, mathematician Roger Howe states that, �“It is the ideas in math that count [reform] standards are about ideas �– problem solving, reasoning and proof, communication, and connections�” (Addington, Clemens, Howe, & Saul, 2000, p. 1075). Advocates of inquiry-based approaches believe that instruction must foster students�’ ability to reason, solve problems, and build connections both within and outside of the field of mathematics. Debates aside, research has highlighted the deficiencies of the traditional explain-practice approach. Michael Battista states:
Despite research denoting that learning with understanding produces better �“transfer�” than learning by memorization, traditional instruction places more emphasis on memorization and imitation than on understanding, thinking, and reasoning. Furthermore, even when traditional instruction attempts to promote understanding, it does so using derivations and justifications that are too formal and abstract for most students to make personal sense of (2001, p. 49-50).
The [US] National Research Council added:
Research on learning shows that most students cannot learn mathematics effectively by only listening and imitating; yet most teachers teach mathematics just that way�… Much of the failure in school mathematics is due to a tradition of teaching that is inappropriate to the way most students learn (1989, p. 6).
Many studies comparing explain-practice approaches to inquiry-based problem centered approaches have shown that the latter increases students�’ achievement and positive attitude towards mathematics (Chung, 2004; Cobb et al., 1991; Ridlon, 2004; Silver & Lane, 1995).
CHARACTERISTICS OF THE TWO APPROACHES In explain-practice classrooms, children learn mathematics via a teacher-centered approach that focuses on basic fact mastery and fluency with algorithms. In this instructional model, the teacher demonstrates or explains a procedure and then students individually practice that procedure. Students are introduced to new concepts incrementally and assessments generally occur weekly. Such approaches are supported by curriculum materials that contain �“example�” procedures followed by rows of practice �“problems.�” Inquiry-based instructional approaches are generally student-centered. The particular model used in this study was called Problem Centered Learning (PCL), as described by Wheatley (1999) in the following scenario:
Ridlon
PME30 �— 2006 4 - 419
The class begins with a problem posed by the teacher, or perhaps by a student. The class is then organized into small groups and the students work collectively in groups on the tasks posed. After about 25 minutes, the students are assembled for class discussion in which students present to the class their solutions for consideration by the group which then serves as a community of validators. During the class discussion the teacher is non-judgemental and the viability of solution methods is determined by the class, not the teacher (p. 61).
PCL is not dependent on a particular curriculum; indeed we used a traditional textbook as our primary instructional resource for both classes. More important to the approach are its distinct characteristics supported by theory and research. For instance, Bauersfeld (1988) proposed that an interactive classroom culture of acceptance and support is critical to constructing knowledge. Students need to view making mistakes as an inevitable and positive component of the learning experience. Thus a non-judgmental environment is an inherent to PCL. Furthermore, the kind of collaboration used in PCL is supported by more than 900 studies citing the positive effect of group learning on student achievement and interpersonal relations. Not only have students learned more when they communicated in groups, but this strategy appeared to enhance retention of skills and content learned (Johnson et al., 2000). Regardless of approach, the child�’s perspective is important because children�’s beliefs and attitudes have a profound effect on their performance in mathematics (Tsao, 2004). Hackett and Betz�’s (1989) research also shows that performance was significantly and positively correlated with attitude towards mathematics.
RESEARCH ON IDENTICAL TWINS Monozygotic (identical) twins research impacts this case study in potentially meaningful ways. First, identical twins have all their genes in common, and that homogeneity results in indistinguishable IQs. Genetic influence also manifests itself as a bias toward certain preferences (Skovholt, 1990). Genes tend to specify the major dimensions of personality, and research shows that monozygotic twins exhibit not only common academic abilities but similar personality factors (Loehlin, 1987). A large study by the National Organization of Mothers of Twins Clubs (NOMOTC) found that �“among identical twins, autonomy, extroversion, independence, and sociotrophy (or need for others) were highly correlated. So, if one twin was very independent, then her co-twin was likely to be very independent also. Female identical twins were even more alike than male identical twins�” (1999, p. 9-10). Secondly, twins reared together have a common family background molding their beliefs, personality, and actions. Loehlin states that �“plenty of evidence exists to show that both genes and environment contribute to the variation of individuals�” (1987, p. 137) because identical twins raised in the same home express little diversity, whereas those raised apart are somewhat dissimilar. Monozygotic twins raised in the same home form their identity very differently than singletons because the twins are frequently thought of as a unit, as in �“the twins�” (NOMOTC, 1999).
Ridlon
4 - 420 PME30 �— 2006
Thus the circumstances of their birth and a common background contribute to a similar belief structure beyond simple genetic influence for such children.
RESEARCH GOAL The purpose of this instrumental, heuristic case study is to explore the effect of two contrasting approaches to teaching and learning mathematics (the traditional explain-practice and the inquiry-based problem centered) on the achievement and attitude of children. Due to their monozygotic genetic make-up, common family background, and similar prior knowledge from shared educational environment, the identical twins in this study are in a unique position to inform the mathematics education community of the consequences of these instructional approaches from a child�’s perspective.
METHODS Merriam states that unlike typical experiments, surveys, or historical research, �“case study does not claim any particular methods for data collection or data analysis�” (1998, p. 28). As this case study was framed as a phenomenon within a larger quasi-experiment, its interpretation within that context may explain the variables that occur. The Participants: Two Sets of Identical Twins The boy twins, �“Eric�” and �“Pete�”, had lived in a stable home with their natural parents since birth. From grades K to 5, they attended a public elementary school that used the same explain-practice approach that was now carried forward in the study. They had always been in the same class, and neither of them particularly cared for mathematics. But in spite of their identical genetic make-up and similar classroom experience, the boys were not completely alike. Eric reported that �“math was easy but boring�” and he had consistently better grades than his sibling. He often helped his brother Pete with math, although they felt they were equally matched in other areas. The boys�’ mother said that she spent a great deal of time helping the less motivated Pete with his homework because his poor attitude led to relatively poor grades. This situation caused a great deal of familial strain. According to Mascazine (2000), this slight diversity in monozygotic twins�’ learning style strengths is not uncommon. Although the girl twins, �“Elise�” and �“Pat�”, lived with their natural parents since birth, they had a different educational background. Prior to 6th-grade, the girls�’ mother had home-schooled them. She was a certified elementary teacher and familiar with many mathematics resources. The girls related inquiry-based experience with manipulatives and multiple solution strategies like drawing pictures or diagrams. They were evenly matched as far as attitude and achievement were concerned, although Elise said that �“math was her best subject�” and the family agreed that she was more self-confident than her sister �“Pat�” was when it came to doing mathematics. Teachers of the Two Approaches A 20-year veteran teacher at the school collaborated with the researcher, also an experienced certified teacher. Two of the regular teacher�’s class hours were chosen for the study. By random assignment, one twin from each pair was assigned to the
Ridlon
PME30 �— 2006 4 - 421
explain-practice approach while their sibling was in the inquiry-based approach. Both teachers were present at all times, but the veteran teacher took charge of instruction during the explain-practice lessons and the researcher taught the PCL class.
Mathematics Content Both sets of twins studied the same mathematics content. The topics were identified by examining the first nine weeks of the school�’s explain-practice textbook. Such alignment was necessary because at the end of the study the PCL group returned to this text, the regular teacher, and the explain-practice approach with little modification. The researcher adapted problems from the text for the PCL class so that the procedurally-oriented tasks were presented in potentially meaningful settings.
The Treatment: A Typical Day in the Two Instructional Approaches Eric and Elise, who were thought initially to be the more capable students, were in the explain-practice classroom. Their lessons were planned using the scope and sequence in the Teacher�’s Manual of the explain-practice textbook. Daily lessons consisted of a warm-up, introduction to the new concept, practice focusing on new concept, and mixed practice focusing on new and previously learned concepts. Pete and Pat learned mathematics via the PCL approach. Their lessons began with the launch of a problem that they worked on with a partner of similar capabilities. The teacher circulated to select groups for presentation based on the strategies observed. In a whole class discussion, the community of children judged the merit of solutions.
Data Collection and Analysis Along with the other children participating in the study, each twin took a quantitative pre-test and post-test. Parents and students completed an anonymous survey that dealt with attitudes and opinions. Persistent observations were made by several individuals. PCL students, including Pete and Pat, kept a reflective journal. The twins and their parents were interviewed two weeks after the completion of the study. Transcripts of interviews were edited by these stakeholders to ensure data was accurate. The quantitative data for the entire class was analyzed using descriptive statistics and ANOVA (Ridlon, 2004). A second researcher developed an inductive approach to encode qualitative data for the study, which was categorized into meta-codes and sub-codes. The number of responses in each cluster was counted in order to determine predominant clusters. Certain patterns and themes emerged. In the case of the twins, the same themes emerged and triangulated the analysis. Defining the Case Study A study that concentrates on the twins�’ perspectives as vehicles to illuminate understanding of the larger issue of teaching mathematics by contrasting approaches would be characterized as an individualized, heuristic case study (Merriam, 1998). Stake (1994) defines an �“instrumental case study�” as one where �“the case is of secondary interest; it plays a supportive role, facilitating our understanding of something else�” (p. 237). For the purposes of this case, that other interest is insight
Ridlon
4 - 422 PME30 �— 2006
into the effect of different kinds of instructional approaches on the achievement and attitude of students.
RESULTS Emergent Theme 1: The Inquiry-based Approach Enhanced Achievement In spite of nearly identical pre-test scores, both Pete and Pat scored nearly 20% higher on the post-test than Eric and Elise. To explain this achievement difference, the boy twins described their experiences in their interview.
Interviewer: What would you need to do to be a good mathematician? Pete: Solve problems. Eric: I watch what the teacher does, and do the same thing to get answers. It
takes too long�…one problem takes up the whole board�…we just sit there. Mother: Are you supposed to do it exactly like he showed you to do it? Eric: Yes ma�’am. Or he�’ll mark it wrong. Mother: Do you think the teacher�’s way is the only way? Eric: There are other ways. But you have to do it the way the teacher says to do
it. Or he�’ll mark it wrong and you�’ll get a bad grade. You have to put all the steps exactly like he does or it�’s wrong.
Pete: [Note: Pete has returned to the regular class now.] I usually do it my way first. Then I go back and do it the long way he says to do it with all the steps and put that on my paper so he won�’t mark it wrong. But I know I got it right because I check the answer I got his way with my own answer.
Father: So how did you learn to think like that? Pete: Because in our class the problems were on the board and then we got to
go up to the board to do them. We worked all together in groups and did them. It was fun getting answers by ourselves. It was easy. Because you had to understand it using your own ideas.
The girl twins reiterated a similar perspective on the kind of behavior that translated into higher achievement. Elise argued that her classroom experience was more difficult, for they had to �“copy methods or get a bad grade.�” She lamented that, �“Pat understood it better�…It�’s the same stuff but our class doesn�’t know how to do it.�” Pat agreed, saying that she tried a variety of strategies in PCL, while Elise could only use �“one way like in the book. They just had rows of problems for homework.�” The twins�’ journal entries echoed the same theme on achievement. Pat wrote, �“Now I even have a better grade! I am climbing an extra step a day!�” and Pete said, �“I always learn new stuff. I feel I have learned so much more than the other way.�” Emergent Theme 2: The Inquiry-based Approach Improved Attitude During their interview, the boys�’ family agreed that things had definitely reversed in the time span of nine weeks. Eric still felt math was boring, but watching his brother �“do fun problems�” in PCL added dissatisfaction to his complaints. He began to resent
Ridlon
PME30 �— 2006 4 - 423
the explain-practice approach where he perceived that his �“opinion didn�’t count.�” His parents said he had �“developed an attitude problem.�” On the other hand, previously reluctant Pete came to greatly enjoy mathematics for the first time in his life. He reported that he �“liked to figure things out�” and �“knew�” for himself when he understood concepts without the validation of authority figures. The girls had a different rationale shaping their attitudes towards the two instructional approaches. They were accustomed to trying a variety of alternative strategies in their home-school environment. Hence, they complained bitterly about Elise�’s loss of autonomy in the traditional classroom. The family was united in the belief that she �“could not ask questions that helped her understand things.�” Elise stated, �“We don�’t talk about the problem�…that doesn�’t make any sense to me. You just have to do it with the steps the teacher says.�” Her mother had to tutor her in math and it was no longer her favorite subject, whereas Pat liked math more than in the past. Journal entries, survey responses, and observation notes triangulated the twins�’ perspective. All data showed a significantly better attitude towards mathematics for Pete and Pat as compared to Eric and Elise.
CONCLUSIONS In this case study, identical twins compared their personal experiences in learning mathematics via different approaches and concluded that the inquiry-based problem centered approach significantly enhanced their achievement and attitude. These findings are significant for researchers because the learners�’ voices supported what more sophisticated research studies have shown us. Teachers who resist a change in practice could also benefit; the perspective of the twins might cause them to question the effectiveness of their instructional approach. While the opportunity to explore the experience of identical twins might not occur again, future research should explore the insight we gain about approaches to teaching math from a student�’s perspective.
References Addington, S. Clemens, H., Howe, R., & Saul, M. (2001). Four reactions to Principles and
Standards for School Mathematics. Notices of the American Mathematical Society, 47(9), 1070-9.
Battista, M. (2001). Research and reform in mathematics education. In T. Loveless (Ed.) The Great Curriculum Debate: How Should We Be Teaching Reading and Math? Washington D.C.: Brookings Institution, 42-84.
Bauersfeld, H. (1988). Interaction, construction, and knowledge: Alternative perspectives for mathematics education. In D.A. Grouws, T. Cooney and D. Jones (Eds.) Effective Mathematics Teaching 1. Reston, VA: National Council of Teachers of Mathematics.
Carson, E. (2005). Ten myths about math education and why you shouldn�’t believe them. November 2005: [email protected]
Chung, I. (2004). A comparative assessment of constructivist & traditionalist approaches to establishing mathematical connections in learning multiplication. Education, 125, 271-8.
Ridlon
4 - 424 PME30 �— 2006
Cobb, P., Wood, T., Yackel, E., Nicholls, J., Wheatley, G., Trigatti, B., & Perlwitz, M. (1991). Assessment of a problem centered second grade mathematics project. Journal for Research in Mathematics Education, 22(2), 3-29.
Hackett, G. & Betz, N. (1989). An exploration of mathematics self efficacy/mathematics performance correspondence. Journal for Research in Mathematics Education, 20, 261-73.
Johnson, D., Johnson, R., & Stanne, M. (2000). Cooperative learning methods: A meta-analysis. Minneapolis, MN: University of Minnesota. July 2005: www.clcrc.com/pages/cl-methods.html.2000
Loehlin, J. C. (1987). Heredity, environment, and the structure of the California Psychological Inventory. Mutlivariate Behavioral Research, 22, 137-148.
Mascazine, J. R. (2000). Gleanings from identical twins studying science. Paper presented at the Association for the Education of Teachers in Science Annual meeting, Akron OH, January 6-9, 2000.
Matthews, J. (May 31, 2005). 10 Myths (maybe) about learning math. Washington Post. Washington D.C.
Merriam, S. (1998). Qualitative Research and Case Study Applications in Education. San Francisco, CA: Jossey-Bass.
National Council of Teachers of Mathematics (NCTM) (1991). Professional Standards for Teaching Mathematics. Reston, VA: Author.
National Organization of Mothers of Twins Club. (1999). Considering multiples: Competition and cooperation, A collection of articles from MOTC�’s �“Notebook.�” ERIC Document No. ED431547.
National Research Council. (1989). Everybody Counts. Washington D.C.: National Academy Press.
Ridlon, C. (2004). The effect of a problem centered approach to mathematics on low-achieving 6th-graders. Focus on Learning Problems in Mathematics, 26(2), 18-48.
Skovholt, T. M. (1990). Counseling implications of genetic research: A dialogue with Thomas Bouchard. Journal of Counseling & Development, 68, 633-6.
Silver, E. A. & Lane, S. (1995). Can instructional reform in urban middle schools help students narrow the mathematics performance gap? Some evidence from the QUASAR Project. Research in Middle Level Education Quarterly, 18(2), 49-70.
Stake, R. E. (1994). Case studies. In N. K. Denzin & Y. S. Lincoln (Eds.) Handbook of Qualitative Research. Thousand Oaks, CA: Sage Publications.
Tsao, Y. (2004). A comparison of American and Taiwanese students: Their math perception. Journal for Instructional Psychology, 31(3), 206-13.
Wheatley, G. (1999). Negotiating effective learning environments for promising students. In L. Sheffield (Ed.). Developing Mathematically Promising Students. Reston, VA: National Council of Teachers of Mathematics, 58-67.
2006. In Novotná, J., Moraová, H., Krátká, M. & Stehlíková, N. (Eds.). Proceedings 30th Conference of the International Group for the Psychology of Mathematics Education, Vol. 4, pp. 425-432. Prague: PME. 4 - 425
WHEN SUCCESSFUL COMPARISON OF DECIMALS DOESN’T TELL THE FULL STORY
Anne Roche Doug M. Clarke Australian Catholic University Australian Catholic University
Forty-eight students across Grades 3 to 6 were interviewed individually using a range of tasks, where the mathematical focus was decimal knowledge and understanding. Students who may be categorised as “apparent experts” on a decimal comparison test were found to differ considerably in their ability to perform ordering and benchmarking tasks. Those students whose explanations when comparing decimals reflected a greater place value knowledge and who were not following a rule which ultimately treats decimals as whole numbers, appeared to have a more conceptual understanding of the decimal numeration system and were able to apply this understanding to more difficult (or novel) tasks. Additional data from 321 Grade 6 students are outlined and reinforce these findings.
THEORETICAL BACKGROUND A connected understanding of decimals, while always a key component of the school mathematics curriculum, has increased in importance since the introduction of the metric system of measurement and the wider use of calculators and computers. Results from major studies (e.g., Brown, 1981; Wearne & Kouba, 2000) indicated that decimals create great confusion for many students and studies indicated that much of this difficulty arose because students were treating decimals as whole numbers. It has also been documented that many students rely on procedures to the detriment of number sense or meaning when computing with decimals (Hiebert & Wearne, 1985). Over the last twenty years there has been considerable documentation of erroneous rules or misconceptions that students appear to use when asked to compare or order decimal numbers. Naming, defining and fine tuning these rules or codes have been the focus of much research (Moloney & Stacey, 1996; Resnick, Nesher, Leonard, Magone, Omanson & Peled, 1989; Sackur-Grisvard & Leonard, 1985; Stacey, Helme & Steinle, 2001; Stacey & Steinle, 1998, 1999; Steinle & Stacey, 2001, 2002). The terms have changed, the definitions varied and where there were once three rules (Sackur-Grisvard & Leonard, 1985) there are now eleven (Stacey, 2005). A considerable body of research exists on students�’ understanding of decimals and the prevalence and persistence of misconceptions (Steinle & Stacey, 2003). Much of this knowledge has been inferred from responses to pencil and paper decimal comparison tests. When students are asked to choose the larger of two decimals and do so incorrectly, they are commonly categorised as using one of three erroneous rules. Sackur-Grisvard and Leonard (1985) defined three systematic but incorrect
Roche & Clarke
4 - 426 PME30 �— 2006
rules that fourth- and fifth-grade French students used to decide which decimal number was greater:
Rule One: The number with the more decimal places is the larger; e.g., 3.214 is greater than 3.8 because 214 > 8. This rule was fairly common; around 40% of fourth graders and 10% of seventh graders used this rule.
Rule Two: The number with the fewer decimal places is the larger; e.g., 1.2 is larger than 1.35 because they believe tenths are always larger than hundredths. This rule was the least common, with less than 6% using the rule in all grades.
Rule Three: A correct judgement is given if there is a zero immediately to the right of the decimal point in one of the decimals being compared, but otherwise choose as for rule one. This rule remained reasonably constant, being used by between 7% and 13% across the four grades.
Resnick, et al. (1989) renamed these rules, calling Rule One the �“whole number rule�”, Rule Two the �“fraction rule�”, and Rule Three the �“zero rule�”, and developed a decimal comparison test of eight pairs of decimal numbers (including two fractions). Moloney and Stacey (1996) developed a pencil and paper test of 15 pairs of decimals items. These items were largely taken from Resnick et al. (1989), except that the fraction tasks were replaced with decimals. Stacey and Steinle (1998) developed a new test, extending that of Moloney and Stacey (1996) with 14 core items and 11 supplementary items. This test took the categories of �“Longer is Larger�” (previously whole number rule), �“Shorter is Larger�” (previously fraction rule), �“Zero Rule�” and �“Expert Rule�” and classified these in a more refined way. By 1999, Stacey and Steinle renamed the �“expert�” category as the �“apparent experts�” or �“task expert�”, claiming these students �“may possess excellent understanding or may apply correct rules not understood or may have one identified incorrect pattern of thinking�” (p. 446). While the use of a decimal comparison test has been found useful for determining which students hold specific misconceptions so that these may be addressed during classroom instruction (Peled & Shahbari, 2003), this paper�’s focus is following the students who have success on these tests. In particular, this paper considers the implications for students who are categorised as �“apparent experts�” on a decimal comparison test but who achieve this status by using a rule by which zeros are added to equalise the length of the shorter decimal and then compare the two numbers as whole numbers. Resnick et al. (1989) suggested that students who are taught to add zeros may remain at the conceptual level attributed to whole-number-rule students, and that �“such syntactic teaching would serve to suppress errors in performance without improving children�’s conceptual understanding�” (p. 26). Little has been written about the reasoning behind students who have been classified as apparent experts and the consequences of this reasoning in working on more difficult (or novel) tasks. This aspect formed the basis of part of the present study, and is the focus of this paper.
Roche & Clarke
PME30 �— 2006 4 - 427
THE PRESENT STUDY The purpose of the study was to investigate students�’ understandings (and misunderstandings) about decimals, using a one-to-one, task-based interview. This paper focuses on those particular tasks which uncover a range of understandings or strategies of students who perform accurately on a decimal comparison test, and the consequences of this understanding on more difficult (or novel) tasks. Many writers have commented on the power of the one-to-one assessment interview as providing powerful insights into student thinking (Schorr, 2001). Bobis, Clarke, Clarke, Gould, Thomas, Wright, and Young-Loveridge (2005) reported on the major role of the interview in key numeracy projects in Australia and New Zealand. The participants were 48 children from a middle-class, co-educational Catholic primary school in suburban Melbourne. The students included 8 from Grade 3, 12 from Grade 4, 19 from Grade 5 and 9 from Grade 6. Information letters and consent forms were sent home to around 300 students, and then a sample of those students whose parents responded positively was interviewed. General achievement in mathematics was not a criterion, although there was clearly a considerable range of levels of mathematical understanding across the 48 children. Each child was interviewed for around 30 minutes on an assortment of tasks. No child was asked all questions in the set. The three tasks that will be outlined are taken from a much larger set of questions within the original interview. These tasks are assessing student understanding of the relative size of decimals.
Tasks Assessing Relative Size of Decimals Task 1. A decimal comparison test was constructed (see Fig. 1) to attempt to unearth common misconceptions already identified in the literature. In this task the student was asked to compare two decimal numbers and say which was larger and why.
1.973 19.73 1.45 1.46 0 0.6 0.376 0.217
0.567 0.3 0.087 0.87 0.7 0.70 0.4 0.3 Figure 1: Task 1. Decimal comparison test. Task 2. In the next task (see Fig. 2) twelve number cards are arranged randomly in front of the student who is asked to order them from smallest to largest. 0 0.01 0.10 .356 0.9 1 1.2 1.7 2 1.70 1.05 .10
Figure 2: Task 2. Ordering a set of twelve decimal numbers. According to Steinle and Stacey (2001), �“it has been established that comparisons of pairs is simpler for students, reducing the information processing demands, yet can reveal as much�” (p. 434). This may be referring to pairs as compared to triples of decimals as first used by Sackur-Grisvard and Leonard (1985). It might however be
Roche & Clarke
4 - 428 PME30 �— 2006
that the more demanding task of a much larger set may unearth latent erroneous thinking. The third task (see Fig. 3) was designed to elicit a response that most likely requires benchmarking. McIntosh, Reys and Reys (1997) believe that �“the variety and complexity of the benchmarks in making decisions about numbers and numerical contexts, is a valuable indicator of number sense�” (p. 6). Markovits and Sowder (1994) conducted an intervention program with seventh grade students for the purpose of developing number sense. Results from a test following the program showed that such students were less likely to use memorised procedures, such as adding enough zeros to compare uneven decimals, or converting fractions to common denominators, and were more likely to use benchmarks when comparing decimals with fractions. Task 3. In this task the student is presented with two cards and is asked which of these numbers (pointing to the string of numbers) is closest to this (pointing to 0.18). 0.18 0.1 0.2 17 0.15 2
Figure 3: Task 3. Benchmarking the size of decimals.
RESULTS AND DISCUSSION In relation to the responses to the tasks in the present study, we have suggested that students who have no more than one error in the comparison test (Task 1), are possibly �“apparent experts�” or �“task experts�” as defined by Stacey and Steinle (1998, 1999). As the set of decimal pairs was not the same as those used by Steinle and Stacey, this assumption may be incorrect for some students. Different ways of thinking were categorised for those students who achieved no more than one error on the decimal comparison set and who were assigned the status of �“apparent expert�”. This thinking generally fell into two groups: Justification that we have termed Place Value Judgement (PVJ) are those who used fractional language (apart from those explanations that could be categorised as shorter is larger thinking) and benchmarking. Justification that we have termed Whole Number Judgement (WNJ) predominantly used whole number language including those who used the rule for extending decimals of uneven length by adding zeros. Examples of Place Value Judgement are:
1.46 is greater than 1.45 because 1.46 is one hundredth more 0.567 is greater than 0.3 because five tenths is greater than three tenths, or
0.567 is more than one half but 0.3 is less than a half 0.87 is greater than 0.087 because 87 hundredths is greater than 87
thousandths
Roche & Clarke
PME30 �— 2006 4 - 429
0.7 is the same as 0.70 because 7 tenths equals 7 tenths (or 70 hundredths) Examples of Whole Number Judgement are:
0.4 > 0.3 because four is greater than three 0.567 > 0.3 because 567 > 300
In Task 1, each pair was selected to uncover a pattern of behaviour or pattern of thinking identified in the literature. Asking the students to justify their choice provided a window into their thinking for each pair. Some students were found to use a particular pattern or rule consistently, while others changed from pair to pair. The most common misconceptions uncovered through this interview were:
WNT: Whole Number Thinking; e.g., 0.217 > 0.37 because two hundred and seventeen is greater than thirty-seven
LILT: Longer is Larger Thinking; e.g., 0.217 > 0.37 because 0.217 has more numbers
SILT: Shorter is Larger Thinking; e.g., 0.3 > 0.567 because tenths are larger than thousandths
RT: Reciprocal Thinking; e.g., 0.3 > 0.4 because > ¼ DLZ: Decimals are less than zero; e.g., 0 > 0.6
Two patterns of thinking that consistently provided correct responses were Place Value Judgement (PVJ) and Whole Number Judgement (WNJ). Students who made no more than one error in the set of nine pairs of decimals were grouped as �“apparent experts�” and then subdivided into those that used predominantly PVJ or WNJ. Twenty-four students were asked to order the set of twelve decimals in Task 2 and four of these ordered the set correctly. Only two fourth graders (Paula and David) were asked this question. They both would be classified as �“apparent experts�” due to their number of correct responses in Task 1. Paula would add zeros and then compare decimals as whole numbers (and had no errors in Task 1), while David would use a Place Value Judgement (with some benchmarking, e.g., 0.37 is closer to four tenths than 0.217) (with one error in Task 1). Their results for Task 2 were:
Paula: 0 0.01 1.05 0.9 .10 0.10 .356 1 1.2 1.7 1.70 2 David: 0 0.01 0.10 .356 0.9 1 1.05 1.2 1.7 2 .10 1.70 Figure 4: Results from Task 2: Ordering a set of twelve decimal numbers. The boxed sets indicate David placed one above the other and said that they were �“the same.�” David appeared to be able use his conceptual understanding of decimals to correctly complete this task. Paula on the other hand did not appear to notice the equivalent decimals, and appeared to be ordering the numbers using a whole number rule such that �“point nine comes before point ten.�” Maybe the integer in 1.05 was ignored and the ordering from zero, in her mind, was 1, 5, 9, 10, 10, 356.
Roche & Clarke
4 - 430 PME30 �— 2006
These two examples suggest that Paula�’s ability to compare pairs of decimals with perfect accuracy was not an indication of a stable understanding of the relative size of decimals. On the other hand, David�’s use of place value and fraction knowledge meant that he was not distracted by the number of digits and did not misinterpret them as whole numbers. For Task 3, only four out of 17 students correctly answered �“0.2 is two hundredths away from 0.18�”. All of these were apparent experts from Task 1 and were further categorised as predominantly using PVJ in their explanations. Common errors were �“0.15 because point fifteen is closest to point eighteen�” and �“17, because seventeen is closest to eighteen,�” indicating that students were predominantly treating decimals as whole numbers. Following the Early Numeracy Research Project (Clarke, Sullivan, & McDonough, 2002), research continued to the Grade 6 level, during which the focus included tasks on fractions and decimals. Included in the interview were a decimal comparison test and a set of ten decimals which the students were asked to order form smallest to largest. While exactly one third of the 321 Grade 6 students could compare the ten pairs of decimals with perfect accuracy, only 10% of students could order the set of ten decimals correctly. This indicates that the longer ordering task may provide more insight into the understanding of the �“apparent experts�” from the decimal comparison test.
SUMMARY AND IMPLICATIONS The present study was designed to assess student understanding of decimals through a task-based interview. In this paper the performance of students on a range of tasks designed to assess students�’ understanding of the relative size of decimals was discussed. These tasks follow the progress of students who may be termed �“apparent experts�” on a decimal comparison task. It was found that students who obtained the status of apparent expert by using a rule where zeros are added to equalise the length of two decimals and then compared as whole numbers, were not able to demonstrate a stable understanding of the relative size of decimals on more difficult (or novel) tasks. Implications for both teaching and research that emerge from this study include the following:
decimal comparison tasks involving pairs provide information about students who hold misconceptions about the relative size of decimals but do not confirm the status of �“apparent experts�”;
teaching students to annexe zeros before comparing decimals may be to the detriment of their conceptual understanding;
ordering more than two decimals is likely to prove a more searching task and a greater indicator of a stable understanding of the relative size of decimals than looking at a comparison of pairs;
Roche & Clarke
PME30 �— 2006 4 - 431
using fractional language to describe decimals more often may contribute to a clearer conception of the decimal numeration system (i.e., encouraging students to describe 2.75 as �“2 and 75 hundredths�” rather than �“2 point 75�”);
These results add further weight to the calls by many researchers (e.g., Skemp, 1976; Wearne & Hiebert, 1986) for teaching which focuses on conceptual understanding to a far greater extent than procedural understanding, and emphasise the importance of place value in such teaching. The challenge for researchers remains to communicate these findings in a form that is accessible to a teaching population, many of whom lack confidence in their own knowledge of this important area. References Bobis, J., Clarke, B. A., Clarke, D. M., Gould, P., Thomas, G., Wright, R., Young-
Loveridge, J., & Gould, P. (2005). Supporting teachers in the development of young children�’s mathematical thinking: Three large scale cases. Mathematics Education Research Journal, 16(3), 27-57.
Brown, M. (1981). Place value and decimals. In K. M. Hart (Ed.), Children’s understanding of mathematics: 11-16. London, Great Britain: Alden Press.
Clarke, B. A., Sullivan, P., & McDonough, A. (2002). Measuring and describing learning: The Early Numeracy Research Project. In A. Cockburn & E. Nardi (Eds.), PME 26: Proceedings of the 26th annual conference (vol. 1, pp. 181-185). Norwich, UK: PME.
Hiebert, J., & Wearne, D. (1985). A model of students�’ decimal computation procedures. Cognition and Instruction, 2(3 & 4), 175-205. Hiebert, J., & Wearne, D. (1986). Procedures over concepts: The acquisition of decimal
number knowledge. In J. Hiebert (Ed.), Conceptual and procedural knowledge: The case of mathematics (pp. 199-223). Hillsdale, NJ: Lawrence Erlbaum Associates.
Markovits, Z., & Sowder, J. (1994). Developing number sense: An intervention study in grade 7. Journal for Research in Mathematics Education, 25(1), 4-29.
McIntosh, A., Reys, B. J., & Reys, R. E. (1992). A proposed framework for examining basic number sense. For the Learning of Mathematics, 12(3), 2-8.
Moloney, K., & Stacey, K. (1996). Understanding decimals. Australian Mathematics Teacher, 52(1), 4-8.
Peled, I., & Shahbari, J. A. (2003). Improving decimal number conception by transfer from fractions to decimals.In N. A. Pateman, B. J. Doherty, & J. Zilliox (Eds.), Proceedings of the 27th Conference of the International Group for the Psychology of Mathematics Education (Vol. 3, pp. 1-6). Honolulu, USA: PME.
Resnick, L. B., Nesher, P., Leonard, F., Magone, M., Omanson, S., & Peled, I. (1989). Conceptual bases of arithmetic errors: The case of decimal fractions. Journal for Research in Mathematics Education, 20(1), 8-27.
Sackur-Grisvard, C., & Leonard, F. (1985). Intermediate cognitive organizations in the process of learning a mathematical concept: The order of positive decimal numbers. Cognition and Instruction, 2(2), 157-174.
Skemp, R. R. (1976). Relational understanding and instrumental understanding. Mathematics Teaching, 77, 20-26.
Roche & Clarke
4 - 432 PME30 �— 2006
Stacey, K. (2005). Travelling the road to expertise: A longitudinal study of learning. In H. L. Chick & J. L. Vincent. (Eds.), Proceedings of the 29th Conference of the International Group for the Psychology of Mathematics Education, (Vol. 1, pp. 19-36). Melbourne: Psychology of Mathematics Education.
Stacey, K., & Helme, S., & Steinle, V. (2001). Confusions between decimals, fractions and negative numbers: A consequence of the mirror as a conceptual metaphor in three different ways. In M. van den Heuvel-Panhuizzen (Ed.), Proceedings of the 25th annual conference of the International Group for the Psychology of Mathematics Education, (Vol. 4, pp. 217-224). Netherlands: Psychology of Mathematics Education.
Stacey, K., & Steinle, V. (1998). Refining the classification of students�’ interpretations of decimal notation. Hiroshima Journal of Mathematics Education, 6, 49-69.
Stacey, K., & Steinle, V. (1999). Understanding decimals: The path to expertise. In J. Truran & K. Truran (Eds.), Making the difference: Proceedings of the 22nd annual conference of the Mathematics Education Research Group of Australasia Incorporated (pp. 446-453). Adelaide: MERGA.
Steinle, V., & Stacey, K. (2001). Visible and invisible zeros: Sources of confusion in decimal notation. In J. Bobis, B. Perry, & M. Mitchelmore (Eds.), Numeracy and beyond: Proceedings of the 24th Annual Conference of the Mathematics Education Research Group of Australasia (pp. 434-441). Sydney: MERGA.
Steinle, V., & Stacey, K. (2002). Further evidence of conceptual difficulties with decimal notation. In B. Barton, K. C. Irwin, M. Pfannkuch, & M. O. J. Thomas (Eds.), Mathematics education in the South Pacific: Proceedings of the 25th Annual Conference of the Mathematics Education Research Group of Australasia (pp. 633-640). Sydney: MERGA.
Steinle, V., & Stacey, K. (2003). Grade-related trends in the prevalence and persistence of decimal misconceptions. In N. Pateman, B. Dougherty, & J. Zilliox (Eds.), Proceedings of the 2003 Joint Meeting of PME and PMENA (Vol. 4, pp. 259-266). Honolulu: International Group for the Psychology of Mathematics Education.
Wearne, D., & Kouba, V. L. (2000). Rational numbers. In E. A. Silver & P. A. Kenny (Eds.), Results from the Seventh Mathematics Assessment of the National Assessment of Educational Progress (pp. 163-191). Reston VA: National Council of Teachers of Mathematics.
2006. In Novotná, J., Moraová, H., Krátká, M. & Stehlíková, N. (Eds.). Proceedings 30th Conference of the International Group for the Psychology of Mathematics Education, Vol. 4, pp. 433-440. Prague: PME. 4 - 433
ANALYSIS OF PROOFS PRODUCED BY UNIVERSITY MATHEMATICS STUDENTS, AND THE INFLUENCE OF USING
CABRI SOFTWARE Félix Rodríguez and Angel Gutiérrez
Dpto. de Didáctica de la Matemática; Universidad de Valencia (Valencia, Spain) We present a research experiment designed to analyze the ways undergraduate mathematics university students solve geometry proof problems. On the one side, we aimed to identify the types of formal proofs produced by these students. The results of this experiment inform on previous categorizations of deductive proofs. On the other side, we aimed to observe the ways these students use dynamic geometry software to solve proof problems and to determine whether using the software influenced in some way their proofs or their processes of solving the problems.
INTRODUCTION A very active research agenda in Mathematics Education is the one focusing on mathematical proof. Some research in it described different styles of proofs produced by students (either empirical or deductive) (Balacheff, 1988; Antonini, 2003; Harel & Sowder, 1998; Zack, 1997). Other research described the mental processes followed by students when they move from producing empirical to deductive proofs or the ways students progress from producing less to more elaborated kinds of proofs (Arzarello, Micheletti, Olivero, Robutti, & Paola, 1998; Kakihana, Shimizu & Nohda, 1996; Raman, 2003). Furthermore, many of these research paid attention to the claimed advantages of teaching based on dynamic geometry software (DGS) to help students in learning deductive proof (Jones, Gutiérrez, & Mariotti, 2000); The results from research are not conclusive in confirming such claim: A majoritary conclusion is that DGS environments help students to find the way to solve geometry proof problems, but some researchers prevent from possible obstacles in making students feel the need of making deductive proofs, due to the power of conviction of dragging explorations with DGS (Chazan, 1993, and Healy, 2000). Most research in this agenda focused on primary and, mainly, secondary school students, with only a few research projects focusing on university students (Blanton, Stylianou, & David, 2003, and Weber, 2004, are two of the very few examples), so research based on these students is insufficient (Marrades & Gutiérrez, 2000, p. 121). A key difference among secondary and mathematics university students is that the first ones still have to learn to use deductive reasoning, while the second ones usually already have learned to do formal proofs. In this context, an unanswered research question is to identify ways the mathematics university students would use DGS to produce deductive proofs as solutions of geometry proof problems. The research presented in this paper is based on a teaching experiment with undergraduate mathematics university students who had showed expertise in writing deductive
Rodríguez & Gutiérrez
4 - 434 PME30 �— 2006
proofs. The students were asked to solve several geometry proof problems, in a paper-and-pencil environment in some cases, and in a Cabri environment in other cases. The main objective of our research was to look for differences in the solutions of the problems solved in each environment, like producing different types of proofs or managing in different ways the difficulties found while solving the problems. More specifically, the objectives of the research were:
1. To identify the types of proofs produced to solve geometry proof problems in a paper-and-pencil environment and a DGS environment, and to look for differences among the types of proofs produced in each environment.
2. To explore the influence of a DGS (Cabri) environment, respect to a traditional paper-and-pencil environment, in the students�’ solutions (management of the process of solving, and proofs produced).
THEORETICAL FRAMEWORK The theoretical framework for this research has two components: Classification of proofs produced by students, and analysis of students�’ use of DGS. Bell (1976) asked secondary school students to solve combinatorial proof problems so, not surprisingly, the proof types he described are based on the completeness of checking specific examples or making deductive arguments for specific sets of cases. A category particularly relevant to our study are the complete empirical proofs, consisting in checking a conjecture in the whole finite set of possible cases. Balacheff (1988), based on experiments where secondary school students had to solve several proof problems, mainly paid attention to the different ways the students selected the examples used to write proofs. Relevant to our study are Balacheff�’s categories of naive empiricism, crucial experiment and generic example pragmatic (empirical) proofs, and thought experiment conceptual (deductive) proof. Harel and Sowder (1998) complemented Balacheff�’s categories, since they worked with mathematics undergraduate university students, and they obtained detailed data for types of deductive proofs. Relevant to our study are the categories of inductive and perceptual empirical proof schemes and the categories of transformational and axiomatic analytical (deductive) proof schemes. Harel and Sowder coined the term proof scheme to refer to �“what constitutes ascertaining and persuading�” for a person (p. 244). To maintain a unique terminology in this paper, in what follows we use the term �“proof�” instead of �“proof scheme�” to refer to Harel and Sowder�’s categories. Recently, several researchers have applied the above mentioned sets of categories of proofs to their own data, and they have found necessary to introduce some modifications for better matching to the data. For instance, Marrades and Gutiérrez, (1998, 2000) completed Balacheff�’s empirical categories by considering the ways students used the examples in their proofs and defining several subcategories. Similarly, Ibañes (2001) introduced several pairs of subcategories in Harel and Sowder�’s (1988) proof schemes to classify some types of proofs that didn�’t mach any of their categories: Static/dynamic perceptual proofs; Authentic/false, a case/several
Rodríguez & Gutiérrez
PME30 �— 2006 4 - 435
cases, and systematic/non systematic inductive empirical proofs; Static/dynamic, particular/ general, and complete/incomplete transformational analytic proofs. The framework used in our research to classify the proofs produced in the experiment (synthesized in Figure 1) is an integration of elements taken from the proviously mentioned sets of categories that we considered would be useful to classify our students�’ outcomes, plus some original subcategories. Due to space limitations, and because the cases analyzed in this paper are formal proofs, we only explain here in detail the classification of deductive proofs in the theoretical framework.
Empirical Deductive
Perceptual Inductive Thought experiment
Formal
Naive empiricism
Crucial experiment
Generic example
Exhaustive
Pure With inference
Transformative Axiomatic
Table 1: Categories of proofs.
A empirical proof is pure when it only includes empirical verifications, and it is with inference when, apart from the empirical verifications, it includes some kind of reference to known definition, property, etc. To analyze deductive proofs, we consider two aspects of the proofs, the presence (or not) of examples in the proof, and the explicit use (or not) of elements of an axiomatic system: We differentiate, first, among thought experiments, when students use examples as sources of information and hints to write several steps in the proofs (Balacheff, 1988), and formal proofs, when students write the proofs without any support from the examples apart from, maybe, using a figure to visualize the elements involved in the problem; in this case, an example might provide the students with an initial idea of how to solve the problem, but then the example is not used any more to write the proof.
We differentiate two subclasses of deductive proofs: Transformative proofs, when they are based on mental operations involving goal oriented operations on objects and anticipation of the operations�’ results (Harel & Sowder, 1998, p. 258), and axiomatic proofs, when the proofs are based on elements of an axiomatic system (p. 273).
Respect to the use of Cabri by our students, the literature offers several elements that are pertinent to this research: The ascending and descending phases (Arzarello et al., 1998) and the cognitive unity of theorems (Boero, Garuti, Lemut, & Mariotti, 1996) may help to explain the relationships among empirical experimentations with Cabri and the production of a formal proof. The modalities of dragging (Arzarello, Olivero, Paola, & Robutti, 2002) may help to identify the aims of the students when they observe or transform a drawing on the screen.
Rodríguez & Gutiérrez
4 - 436 PME30 �— 2006
THE EXPERIMENT The sample was a class group of undergraduate students in their 4th or 5th year at the Faculty of Mathematics of the Univ. de les Illes Balears (Spain) studying a course on Euclidean Geometry. The 8 students in this class participated in the experiment. The students worked in 4 pairs, and they were asked to present only a joint answer to each problem. The experiment took place during the ordinary classes (October to January); There were two classes per week, about 100 minutes per class. The first classes were devoted to remind students�’ previous knowledge on Euclidean Geometry, to teach them some new concepts necessary for next classes, and to teach them to use Cabri II+. The rest of the course was organized as a problem solving setting jointly conducted by the teacher of the subject and the first author of this paper. During the teaching experiment, the students solved 16 geometry proof problems. The statements of these problems didn�’t include any drawing. First the students solved 9 problems in their usual paper-and-pencil environment. Then they solved 7 problems in the Cabri environment. Each pair of students used a computer. During all the experiment, both the teacher and the first author were present in the classes. Their role was to state the problems, to help students or answer their questions, and to manage the time of the classes. For each problem, there was a time for the pairs to work on the solution followed by a time to discuss the solutions obtained by the students and to institutionalize the new knowledge.
METHODOLOGY The research was organized as a quasi-experiment, with one of the researchers acting as a participant observer. Different sources of data were used: In both environments we collected i) Researcher�’s field notes; ii) Students�’ written solutions; iii) Students�’ self-protocol �– this is an innovative tool where, emulating the �“think aloud�” technique for oral problem solving, students were asked to write, during the process of solving each problem, notes commenting their way of solving the problem, the ideas discussed either accepted or rejected, their decisions, etc. �– Furthermore, in the Cabri environment, we collected: iv) The files saved by students with the figures constructed; and v) The record of session files. To analyze the information gathered, we have put together the written solutions, the self-protocols, and the record of session (for the Cabri problems); The other data (researcher�’s notes and Cabri files) were used when convenient. This gave us a detailed picture of the way each pair of students had worked to solve every problem.
DATA AND ANALYSIS OF RESULTS We are presenting here, as representatives of the 16 problems solved by the 4 pairs of students, abridged versions of a pair of students�’ self-protocols and solutions to the paper-and-pencil problem 7 and the Cabri problem 13. Note that these students consistently use the verb �“see�” to mean �“prove�”.
Rodríguez & Gutiérrez
PME30 �— 2006 4 - 437
Problem 7. Let H be the orthocenter of triangle ABC. Let A�’ be the intersection of height AH and side BC. Let A�’�’ be the intersection of height AH and the circle circumscribed to ABC, with centre O. Let r be the straight line parallel to BC through O. Prove that H is the image of A by the product of symmetries with axes r and BC, respectively. 1. We begin to draw Figure 1. 2. We see that r AA�’�’ because r is parallel to BC
which is AA�’�’ (the height). 3. We want to see [prove] that HA�’ = A�’A�’�’. The students draw point M�’ as intersection of r and AA�’�’. 5. We also have to see that AM�’ = M�’A�’�’. 6. To see it [conjecture 5] we draw Figure 2. We can see
that B1M1 and M1A1 are congruent because [in triangles B1OM1 and A1OM1] two sides and the angle opposite to the longest side are congruent.
7. Therefore AM�’ = M�’A�’�’ perpendicular to r. 8. Now let�’s see that HA�’ = A�’A�’�’ in Figure 1. 10. A�’B is a side common to both triangles [A�’BA�’�’ and
A�’BH] and HA�’B = A�’�’A�’B = 90°. Now we have to find another equal [congruent pair
of] angle[s] to prove that the triangles are congruent and that HA�’ = A�’A�’�’.
The students drew another figure similar to Figure 1, and they labelled as B�’ the intersection of height BH and side AC. 11. We see that B�’HA ACA�’ because both have a right angle and a common angle. Also CA�’A CB�’B because both have a right angle and HA�’B = A�’�’A�’B the
common angle [ C]. CBB�’ = C A�’�’ = . Now, A�’�’BC = CAA�’�’ = because both angles contain the arch
CA�’�’. 12. Then, A�’A�’�’B = A�’HB because they have two equal angles and an equal side.
A�’A�’�’ = HA�’. The students have produced a correct transformative though experiment proof, since several drawings have guided them to write the proof in different key moments. Problem 13. Let ABC be a triangle. Let r and s be two non-parallel straight lines. For each side of ABC, draw a parallelogram having its sides parallel to r and s and having the given side of the triangle as a diagonal. Prove that the other diagonals of the three parallelograms are concurrent. The students draw Figure 3 and drag the vertices of the triangle to check the truth of the statement. They also use the command member? to verify that the three diagonals
Figure 1.
Figure 2.
Rodríguez & Gutiérrez
4 - 438 PME30 �— 2006
meet at a single point. Now they try to prove the conjecture ad absurdum: 2. We draw another straight line. Let�’s suppose that this line is the diagonal and it
intersects the two other diagonals in different points A, B. [Figure 4] 5. Let M1 be the midpoint of the diagonals of parallelogram PQRS. Then it is the midpoint
of side PR of the given triangle [ABC]. 7. John suggests to change to the dual, three concurrent straight lines are three points of
the same straight line in the dual. But we don�’t follow this way.
Figure 3. Figure 4. 8. We made a drawing on paper trying to do it wrongly
to see the problem [Figure 5]. 10. John suggests that we can see that the area of triangle
ABE is zero, but it seems difficult, and we don�’t follow this way.
The students used the Trace in Cabri to see that point E moves along the diagonal when they dragged vertex R. 12. We are looking at A and B, but we don�’t see any
property characterizing them. 15. We look for similarities. (we don�’t pursue) 16. We should see that the diagonals are known cevians of
some triangle.
A cevian of a triangle is a segment from a vertex to any point of the opposite side. 17. We create the parallel to a side through the opposite vertex [they do it for the three
vertices of ABC] We check on the drawing that the diagonals don�’t have any relationship to these lines. [they delete the parallels]
18. We try a triangle whose vertices are intersections of the diagonals with the sides of ABC. 19. We check if they [the diagonals] are bisectors [they measure several angles], but they
aren�’t.
The students remind the Ceva�’s theorem, they write the theorem�’s statement, and look for a way to prove it, but they don�’t know how to do it. Finally, they make another unsuccessful trial on the Cabri figure, and they stop working.
Figure 5.
Rodríguez & Gutiérrez
PME30 �— 2006 4 - 439
As a summary, the students made a sequence of transformative thought experiment trials, since they have permanently handled figures looking for valid conjectures, that they were not able to prove.
CONCLUSIONS The comparison of the answers to the two problems by this pair of students lets us get some conclusions related to different aspects of the experiment: - Classifying the proofs according to the categories mentioned in the Theoretical Framework section gives little information about high level mathematics university students�’ behaviour, since all the proofs produced by them were deductive, and most proofs will be transformative thought experiments, since the geometry problems are prone to induce such kind of proofs. Therefore, other directions of analysis are necessary to have a deeper picture of the students. - The relationship among drawings (either in paper or DGS) and the production of proofs, that is the role of the figures/examples when the students are writing a proof, is quite subtle, and has to be observed carefully:
- In a thought experiment proof, the examples guide the students�’ steps to write the proof. This has been evident in the protocols of the two problems analyzed here. - In a formal proof, the steps in the proof guide the drawing of examples. Their role is not to suggest ideas to the students, but to help the reader understand the proof. - In any deductive proof, an example may be the a source of ideas for students but, in a formal proof, the example is, at most, the source of the initial idea, and the subsequent process of writing the proof doesn�’t rest on the example any more.
- The DGS helps students to empirically identify and check conjectures (by dragging) but, when students are reasoning deductively, some times the DGS doesn�’t help them to find the way to a deductive proof. In these cases, using DGS doesn�’t mean any advantage over the traditional paper-and-pencil environment. - The self-protocol has proved to be a useful methodological tool to get information on students�’ activity, since it has let us to track their actions, both successful and unsuccessful, and decisions. References Antonini, S. (2003). Non-examples and proof by contradiction. In N. A. Pateman, B. J.
Dougherty, & J. Zilliox (Eds.), Proceedings of the 27th PME International Conference (Vol. 2, pp. 49-56).
Arzarello, F., Micheletti, C., Olivero, F., Robutti, O., & Paola, D. (1998). A model for analysing the transition to formal proofs in geometry. In A. Olivier & K. Newstead (Eds.), Proceedings of the 22nd PME International Conference (Vol. 2, pp. 24-31).
Arzarello, F., Olivero, F., Paola, D., & Robutti, O. (2002). A cognitive analysis of dragging practises in Cabri environments. Zentralblatt für Didaktik der Mathematik, 34(3), 66-72.
Balacheff, N. (1988). Aspects of proof in pupils�’ practice of school mathematics. In D. Pimm (Ed.), Mathematics, teachers and children (pp. 216-235). London: Hodder & St.
Rodríguez & Gutiérrez
4 - 440 PME30 �— 2006
Bell, A. W. (1976). A study of pupil's proof-explanations in mathematical situations. Educational Studies in Mathematics, 7(1), 23-40.
Blanton, M., Stylianou, D. A., & David, M. (2003). The nature of scaffolding in undergraduate students�’ transition to mathematical proof. In N. A. Pateman, B. J. Dougherty, & J. Zilliox (Eds.), Proceedings of the 27th PME International Conference (Vol. 2, pp. 113-120).
Boero, P., Garuti, R., Lemut, E., & Mariotti, M. A. (1996). Challenging the traditional school approach to theorems: A hypothesis about the cognitive unity of theorems. In L. Puig & A. Gutiérrez (Eds.), Proceedings of the 20th PME International Conference (Vol. 2, pp. 113-120).
Chazan, D. (1993). High school geometry students�’ justification for their views of empirical evidence and mathematical proof. Educational Studies in Mathematics, 24(4), 359-387.
Harel, G., & Sowder, L. (1998). Students' proof schemes: Results from exploratory studies. In A. H. Schoenfeld, J. Kaput, & E. Dubinsky (Eds.), Research in collegiate mathematics education (Vol. III, pp. 234-283). Providence, USA: American Mathematical Society.
Healy, L. (2000). Identifying and explaining geometrical relationships: Students interactions with robust and soft Cabri constructions. In T. Nakahara & M. Koyama (Eds.), Proceedings of the 24th PME International Conference (Vol. 1, pp. 103-117).
Ibáñes, M. (2001). Aspectos cognitivos del aprendizaje de la demostración matemática en alumnos de primer curso de bachillerato. PhD dissertation. Valladolid, Spain: Universidad de Valladolid.
Jones, K., Gutiérrez, A., & Mariotti, M. A. (Eds.) (2000). Proof in dynamic geometry environments. Educational Studies in Mathematics, 44(1/2).
Kakihana, K., Shimizu, K., & Nohda, N. (1996). From measurement to conjecture and proof in geometry problems. In L. Puig & A. Gutiérrez (Eds.), Proceedings of the 20th PME International Conference (Vol. 3, pp. 161-168).
Marrades, R., & Gutiérrez, A. (1998). Organizing the learning in a Cabri environment for a journey into the world of proofs. In A. Olivier & K. Newstead (Eds.), Proceedings of the 22th PME International Conference (Vol. 4, p. 276).
Marrades, R., & Gutiérrez, A. (2000). Proofs produced by secondary school students learning geometry in a dynamic computer environment. Educational Studies in Mathematics, 44(1/2), 87-125.
Raman, M. (2003). Key ideas: What are they and how can they help us understand how people view proof? Educational Studies in Mathematics, 52(3), 319-325.
Weber, K. (2004). A framework for describing the processes that undergraduates use to construct proofs. In M. J. Høines & A. B. Fuglestad (Eds.), Proceedings of the 28th PME International Conference (Vol. 4, pp. 425-432).
Zack, V. (1997). �“You have to prove as wrong�”: Proof at the elementary school level. In E. Pehkonen (Ed.), Proceedings of the 21st PME International Conference (Vol. 4, pp. 291-298).
2006. In Novotná, J., Moraová, H., Krátká, M. & Stehlíková, N. (Eds.). Proceedings 30th Conference of the International Group for the Psychology of Mathematics Education, Vol. 4, pp. 441-448. Prague: PME. 4 - 441
CHALLENGING THE MATHEMATICAL BELIEFS OF PRESERVICE ELEMENTARY SCHOOL TEACHERS
Katrin Rolka Bettina Rösken Peter Liljedahl University of Duisburg-Essen, Germany Simon Fraser University, Canada The role of beliefs is largely discussed as an important variable in the learning and teaching of mathematics. In this paper we present the results of a study that examines the effectiveness of a methods course designed around problem solving. One aim of this course was to challenge the mathematical beliefs of a group of preservice teachers as a first step to initiate change in their beliefs. The evolving beliefs are documented in reflective journals. The journal entries were analyzed according to established categories describing mathematical beliefs.
INTRODUCTION The importance of mathematical beliefs is nowadays widely acknowledged (Leder, Pehkonen & Törner, 2002). According to Schoenfeld (1998, p. 19), beliefs can be interpreted as "mental constructs that represent the codification of people’s experiences and understandings". In particular, prospective teachers have developed a wide range of beliefs about the mathematical content and the nature of mathematics as well as about teaching and learning mathematics before undertaking their first education course (Ball, 1988; Feiman-Nemser et al., 1987). These beliefs are often based on their own experiences as students of mathematics and, for better or for worse, often form the foundation for their own practice as teachers of mathematics (Fosnot, 1989; Skott, 2001). As such, it is one of the roles of the teacher education programs to reshape these beliefs and correct misconceptions that could impede effective teaching in mathematics (Green, 1971). This study uses reflective journals to examine how the beliefs of a group of preservice elementary school teachers evolve as a result of being enrolled in a mathematics method course that was designed and taught with the implicit goal of changing their beliefs.
MATHEMATICAL BELIEFS Dionne (1984) suggests that beliefs are composed of three basic components called the traditional perspective, the formalist perspective and the constructivist perspective. Similarly, Ernest (1991) describes three philosophies of mathematics called instrumentalist, Platonist and problem solving, while Törner and Grigutsch (1994) name the three components as toolbox aspect, system aspect and process aspect. All these different notions correspond more or less with each other. In this work we employ the three components defined by Törner and Grigutsch (1994). In the "toolbox aspect", mathematics is seen as a set of rules, formulae, skills and procedures, while mathematical activity means calculating as well as using rules,
Rolka, Rösken & Liljedahl
4 - 442 PME30 — 2006
procedures and formulae. In the "system aspect", mathematics is characterized by logic, rigorous proofs, exact definitions and a precise mathematical language, and doing mathematics consists of accurate proofs as well as of the use of a precise and rigorous language. In the "process aspect", mathematics is considered as a constructive process where relations between different notions and sentences play an important role. Here the mathematical activity involves creative steps, such as generating rules and formulae, thereby inventing or re-inventing the mathematics. Besides these standard perspectives on mathematical beliefs, a further important component is the usefulness, or utility, of mathematics (Grigutsch, Raatz & Törner, 1997).
CHANGING MATHEMATICAL BELIEFS Robust beliefs are difficult to change. However, an abundance of research purports to produce changes in preservice teachers of mathematics. Prominent in this research is an approach by which preservice teachers' beliefs are challenged (Feiman-Nemser et al., 1987). Another prominent method for producing change in preservice teachers is by involving them as learners of mathematics (and mathematics pedagogy), usually submersed in a constructivist environment (Ball, 1988; Feiman-Nemser & Featherstone, 1992). A third method for producing changes in belief structures has emerged out of the work of one of the authors in which it has been shown that preservice teachers' experiences with mathematical discovery has a profound, and immediate, transformative effect on the beliefs regarding the nature of mathematics, as well as their beliefs regarding the teaching and learning of mathematics (Liljedahl, 2005). All three of these approaches are combined in the design and teaching of the aforementioned mathematics methods course.
REFLECTIVE JOURNALING Journal writing in mathematics education has a long and diverse history of use. Journaling helps students reflect on and learn mathematical concepts (Chapman, 1996; Ciochine & Polivka, 1997; Dougherty, 1996). It has been shown to be an effective tool for facilitating reflection among students (Mewborn, 1999) as well as an effective communicative tool between students and teachers (Burns & Silbey, 2001). More relevant to this study, journaling has become an accepted method for qualitative researchers to gain insights into their participants' thinking (Mewborn, 1999; Miller, 1992). In particular, reflective journals have been shown to be a very good method for soliciting responses pertaining to beliefs, even when such responses are not explicitly asked for (Koirala, 2002; Liljedahl, 2005).
METHODOLOGY
The Participants Participants in this study are preservice elementary school teachers enrolled in a Designs for Learning Elementary Mathematics course for which the third author was the instructor. This particular offering of the course enrolled 39 students, the vast
Rolka, Rösken & Liljedahl
PME30 — 2006 4- 443
majority of these students are extremely fearful of having to take mathematics and even more so of having to teach mathematics. This fear resides, most often, within their negative beliefs and attitudes about their ability to learn and do mathematics. At the same time, however, as apprehensive and fearful of mathematics as these students are, they are extremely open to, and appreciative of, any ideas that may help them to become better mathematics teachers. The Course During the course the participants were immersed into a problem solving environment. That is, problems were used as a way to introduce concepts in mathematics, mathematics teaching, and mathematics learning. There were problems that were assigned to be worked on in class, as homework, and as a project. Each participant worked on these problems within the context of a group, but these groups were not rigid, and as the weeks passed the class became a very fluid and cohesive entity that tended to work on problems as a collective whole. Communication and interaction between participants was frequent and whole class discussions with the instructor were open and frank. Throughout the course the participants kept a reflective journal in which they responded to assigned prompts. These prompts varied from invitations to think about assessment to instructions to comment on curriculum. One set of prompts, in particular, were used to assess each participant's beliefs about mathematics, and teaching and learning mathematics (What is mathematics? What does it mean to learn mathematics? What does it mean to teach mathematics?). These prompts were assigned in the first and final week of the course. The Analysis The three authors independently coded the data according to each of the four aforementioned aspects of beliefs: toolbox, utility, system, and process. The results of these independent codings were compared, discrepancies were discussed, and pertinent entries were recoded. This process (Huberman & Miles, 1994) led to a more elaborate understanding of the framework, as well as a more consistent coding of the data. In what follows we use excerpts from the participants' journals to exemplify our shared understanding of each aspect of beliefs with respect to mathematics as well as the teaching and learning of mathematics.
Beliefs about Mathematics
Toolbox Aspect "My first impression is that math is numbers, quantities, units. In math there is always one right answer. […] Math is about [...] memorizing formulas that yield the right answer." (Stephanie) "When first pondering the question "What is mathematics?" I initially thought that mathematics is about numbers and rules. It is something that you just do and will do well
Rolka, Rösken & Liljedahl
4 - 444 PME30 — 2006
as long as you follow the rules or principles that were created by some magical man thousands of years ago." (David)
System Aspect "Mathematics is the science of pattern and structure. It uses number sense and mathematical concepts to develop a flexible understanding of the world around us." (Nora) "Mathematics is a universal language. It is the study of numbers, proportions, relationships, patterns and sequences. Becoming literate in this language is important in order to understand space and time; to develop logical thinking and reasoning; […]." (Rachel)
Utility Aspect "Math is all around us. We live in a quantitative society. On any given day, we may be required to use math to tell us how far over the speed limit we are driving, how much money we have left in our bank account to pay our loans, how many more university credits we need to graduate, how much prozac we need to take to get through the day or simply how many people in this world matter to us." (Sandee)
Process Aspect "For me, math has truly transformed from being a skill or procedure that can be used merely for efficiency to being imbedded within a process of meaning-making that goes on inside the individual, a construction of understanding that we make up." (Becky)
Beliefs about Learning and Teaching Mathematics
Toolbox Aspect "For me math is a puzzle to figure out. All of the questions or problems we were given in school had a solution that I just needed to apply a formula or rule to and the answer would be clear." (Chealsy)
System Aspect "To learn mathematics is to learn how numbers are used to represent concepts and matter, as well as show relationships and solve problems." (Diana) "Learning math means understanding patterns, quantities, shapes, […]. To teach mathematics is to teach fundamental number concepts […]." (Lorena)
Utility Aspect "We also teach mathematics that is related to everyday life, for example our system of currency and how to measure how tall we are." (Jacqueline) "[We teach mathematics] to enable students to function successfully in our world. It is such an integral part of everything in and of our world, the more they know, the more choices in life they'll have." (Diana)
Rolka, Rösken & Liljedahl
PME30 — 2006 4- 445
Process Aspect "The other thing that stands out is the difference between formally teaching students, and actually facilitating learning. By being a facilitator of the learning process, we are able to choose situations, activities and problems for the students to work on either individually or in groups, and through this approach, students are able to […] try different ideas, and develop strategies." (Robyn) "I think to teach mathematics you need to let the thinking be put in your students’ hands. You need to give them ownership of ideas and let them feel safe and free within the classroom." (Michelle)
The above mentioned quotations represent only a small portion of all the student journals. A wide range of statements supporting each category can be found in the data. It should be noted, however, that not all excerpts are as easily categorized. We are following Dionne's (1984) suggestion that mathematical beliefs constitute a mixture of the above mentioned aspects, and as such, clear classification cannot always be made. As a result, many journal entries were coded for more than one aspect. For example, in the following journal entry, the system aspect is intertwined with the utility aspect in beliefs about mathematics.
"It think it [mathematics] has to do with the complex relationships between numbers and the symbols we use to make sense of the world among us. More and more I see maths as a system put in place to help us better […] make sense of the world around us. Maths allows us to group things, to calculate, to categorize. It's a great way to bring order from chaos." (Heng-Zi)
In addition, the data was checked for comments that were indicative of rhetoric. That is, comments that are hollow echoes of conventional beliefs about mathematics and the teaching and learning of mathematics. Examples of journal entries that were flagged as rhetoric are the following very succinct responses to What is Mathematics?
"Math is the study of numbers and patterns and the relationship between them." (Leslie)
"Mathematics is the study of numbers." (Reine)
Amber gives a similar response, but then follows it up with comments that indicate that she has internalized these beliefs and made them her own. As a result, Amber's comments are not flagged as rhetoric.
"Math is a language that helps individuals reason, problem solve, and distinguish relationships. In order to do these activities, we need an understanding of the basics of the language, such as symbol meaning, number values, number relationships, and basic skill counting." (Amber)
In all, there were five participants whose data was deemed to be rhetoric, and as such excluded from the aggregation.
Rolka, Rösken & Liljedahl
4 - 446 PME30 — 2006
RESULTS AND DISCUSSION
The coded data was aggregated to produce a holistic picture of the evolving beliefs of the class as a whole. The results of this aggregation are displayed in Table 1.
Mathematics Before
Mathematics After
Teaching Before
Teaching After
Toolbox 13 2 7 3 System 22 19 18 8 Utility 10 9 26 1 Process 0 12 6 30
Table 1: Aggregation of coded data
The following charts (Figure 1 and 2) show the distribution of beliefs about mathematics at the beginning and at the end of the course.
Beliefs about mathematics at the beginning of the course
Toolbox
System
Utility
Process
Beliefs about mathematics at
the end of the course
Toolbox
System
Utility
Process
Figure 1 Figure 2
The most obvious change is the degree to which a process aspect of mathematics has been introduced into the collective beliefs of the class. In referring to Table 1 it appears that the process aspect displaced the toolbox aspect of beliefs about mathematics. However, careful analysis of the disaggregated data reveals a more complex view of changing beliefs. For some participants changes involved the addition of a belief aspect, for others it involved the dismissal of an aspect, and for others it involved the replacement of one aspect with another. The net effect, however, remains a shift within the class away from the toolbox belief of mathematics and towards the process belief of mathematics.
Figure 3 and 4 show the distribution of beliefs about teaching and learning mathematics at the beginning and at the end of the course.
Rolka, Rösken & Liljedahl
PME30 — 2006 4- 447
Beliefs about learning and teaching
mathematics at the beginning of the course
Toolbox
System
Utility
Process
Beliefs about learning and teaching
mathematics at the end of the course
Toolbox
System
Utility
Process
Figure 3 Figure 4 These figures show a significant shift in beliefs about the teaching and learning of mathematics towards a process aspect. Here, however, the figures are very representative of the changes that occur at the individual level. Most of the change in the participants' beliefs about the teaching and learning of mathematics can be encapsulated as a change from a system aspect and/or a utility aspect into a process aspect.
CONCLUSION A very powerful conclusion from this study is the impact that the problem solving environment within the class had on the recasting of these preservice teachers' beliefs about what mathematics is, and what it means to teach and learn mathematics. Through their own experiences with mathematics in a non-traditional setting most of the students come to see, and furthermore to believe, in the value of teaching and learning mathematics in the sense of the process aspect. Further research is required in order to more closely examine the continuous nature of this change.
References Ball, D. (1988). Unlearning to teach mathematics. For the Learning of Mathematics, 8(1),
40-48. Burns, M. & Silbey, R. (2001). Math journals boost real learning. Instructor, 110(7), 18-20. Chapman, K. (1996). Journals: Pathways to thinking in second-year algebra. The
Mathematics Teacher, 89(7), 588-590. Ciochine, J., & Polivka, G. (1997). The missing link? Writing in mathematics class!
Mathematics Teaching in the Middle School, 2(5), 316-320. Dionne, J. J. (1984). The perception of mathematics among elementary school teachers. In
J. M. Moser (Ed.), Proceedings of 6thConference of the North American Chapter of the International Group for the Psychology of Mathematics Education (pp. 223-228). Madison (WI): University of Wisconsin: PME-NA.
Dougherty, B. (1996). The write way: A look at journal writing in first-year algebra. The Mathematics Teacher, 89(7), 556-560.
Rolka, Rösken & Liljedahl
4 - 448 PME30 — 2006
Ernest, P. (1991). The philosophy of mathematics education. Hampshire, UK: The Falmer Press.
Feiman-Nemser, S., & Featherstone, H. (1992). The student, the teacher, and the moon. In S. Feiman-Nemser & H. Featherstone (Eds.), Exploring teaching: Reinventing an introductory course. New York, NY: Teacher College Press.
Feiman-Nemser, S., McDiarmid, G., Melnick, S., & Parker, M. (1987). Changing beginning teachers' conceptions: A description of an introductory teacher education course. Paper presented at American Educational Research Association, Washington, DC.
Fosnot, C. (1989). Enquiring teachers, enquiring learners: A constructivist approach for teaching. New York, NY: Teachers College Press.
Green, T. (1971). The activities of teaching. New York, NY: McGraw-Hill. Grigutsch, S., Raatz, U., & Törner, G. (1997). Einstellungen gegenüber Mathematik bei
Mathematiklehrern. Journal für Mathematikdidaktik, 19(1), 3-45. Huberman, A. & Miles, M. (1994). Data management and analysis methods. In N. Denzion
& Y. Lincoln (Eds.), Handbook of Qualitative Research (pp. 428-444). Thousand Oaks, CA: Sage.
Koirala, H. (2002). Facilitating student learning through math journals. In A. D. Cockburn & E. Nardi (eds.) Proceedings of the 26th International Conference for Psychology of Mathematics Education, (Vol. 3, pp. 217-224). Norwich, United Kingdom.
Leder, G. C., Pehkonen, E., & Törner, G. (Eds.) (2002). Beliefs: A hidden variable in mathematics education? Dordrecht, The Netherlands: Kluwer Academic Publishers.
Liljedahl, P. (2005). AHA!: The effect and affect of mathematical discovery on undergraduate mathematics students. International Journal of Mathematical Education in Science and Technology, 36(2-3), 219-236.
Mewborn, D. (1999). Reflective thingking among preservice elementary mathematics teachers. Journal for Research in Mathematics Education, 30(3), 316-341.
Miller, L. (1992). Teacher benefit from using impromptu writing in algebra classes. Journal of Mathematics Teacher Education, 23(4), 329-340.
Schoenfeld, A. H. (1998). Toward a theory of teaching-in-context. Issues in Education, 4(1), 1-94.
Skott, J. (2001). The emerging practices of novice teachers: The roles of his school mathematics images. Journal of Mathematics Teacher Education, 4(1), 3-28.
Törner, G., & Grigutsch, S. (1994). Mathematische Weltbilder bei Studienanfängern – eine Erhebung. Journal für Mathematikdidaktik, 15(3/4), 211-252.
2006. In Novotná, J., Moraová, H., Krátká, M. & Stehlíková, N. (Eds.). Proceedings 30th Conference of the International Group for the Psychology of Mathematics Education, Vol. 4, pp. 449-456. Prague: PME. 4 - 449
PARTIAL KNOWLEDGE CONSTRUCTS FOR THE PROBABILITY AREA MODEL
Gila Ron and Tommy Dreyfus Rina Hershkowitz Tel Aviv University, Israel The Weizmann Institute, Israel We present the learning process of a pair of grade 8 students, who learn a topic in elementary probability. The students successfully accomplish a sequence of several tasks without apparent difficulty. When working on a further task, which seems to require only actions they have previously carried out well, they run into difficulty. In order to explain this difficulty, we analyze their learning process during the task sequence, and identify some partial knowledge.
SOME THEORETICAL ASPECTS Students' incorrect answers sometimes overshadow meaningful knowledge they have constructed. On the other hand, correct answers often hide knowledge gaps. In both cases, we can speak of partial knowledge. Partial knowledge constructs are the main focus of this paper. The RBC model (Hershkowitz, Schwarz, & Dreyfus, 2001) will be used as the main methodological tool. Processes of knowledge construction are expressed in the model by means of three observable and identifiable epistemic actions, Recognizing, Building-with, and Constructing (whence RBC). Constructing of new knowledge is largely based on vertical re-organizing of existing knowledge constructs in order to create a new knowledge construct. Recognizing takes place when the learner recognizes that a specific knowledge construct is relevant to the problem she is dealing with. Building-with, is an action comprising the combination of recognized knowledge elements, in order to achieve a localized goal, such as the actualization of a strategy or a justification or the solution of a problem. Students' knowledge constructs are individual even if they may be shared (Hershkowitz, Hadas & Dreyfus, 2006). Ideally, a student's constructs match suitable mathematical principles. In other cases, the fit between the mathematical principle and the student's construct is partial. Constructs that partially fit a mathematical principle will be called partial knowledge constructs. DiSessa and Wagner (2005) indicate that when many elements and relations are involved, some may be missing or malformed. We stress that we consider the partiality of knowledge with respect to the mathematical principles that underlie a specific learning context.
THE STUDY Contents In the long-term research project, of which the present report presents one aspect, we observed five grade 8 classes, and six additional pairs of 8th grade students, working
Ron, Dreyfus & Hershkowitz
4 - 450 PME30 — 2006
on a sequence of tasks in their probability curriculum. Their processes of knowledge construction were supported by a learning unit with three stages: (i) calculating probabilities in 1-dimensional sample space (1d SS) and representing them on a chance bar; (ii) calculating probabilities in 2-dimensional sample space (2d SS) for cases where the possible simple events in each dimension are equi-probable; in such cases, the 2d simple events can be counted and organized in a table; (iii) calculating probabilities in 2d SS for cases, where each dimension has only two possible simple events (binomial sample space), which need, however, not be equi-probable; the area model was the main tool for this stage.
The data for this paper stem from the work of one pair of students on a stage iii task in a classroom setting. Stage iii consisted of a sequence of tasks for which the amount of instructions and clues for the learners were gradually reduced (see Figure 1 for an example of one such task).
Figure 1: The Smog City task
b. Calculate the probability to meet a tall smoker. Explain your calculations. c. What is the probability to meet a person who is neither tall nor a smoker? d. The probability to meet a tall smoker 0.06 (See b). Jonathan claimed that we can find
Smog City The probability to meet a smoker in Smog City is 0.3. The probability to meet a tall person is 0.2. (People above 180 cm are considered as tall people). We shall assume that the percentage of the smokers among the tall people is the same as among the whole population. Supose that we are going to meet one person in Smog City. Our goal is to calculate probabilities of various events. For our calculations we shall use an "Area Square". We shall assume that the square represents all the possible probabilities and therefore its area equals 1. a. Here is a division of the square according to the probability to meet a tall person (the vertical line). Please continue the division of the
Not tall
0 8
Tall
Smoker
0 3
Not smoker
Ron, Dreyfus & Hershkowitz
PME30 — 2006 4 - 451
Principles
We now list some of the mathematical principles that underlie stage iii of the learning unit. The first three principles relate to the 2d SS and the organization of its events in the area square. The remaining principles relate to probability calculation in 2d SS and its justification. (1) (Four Simple Events) A binomial 2d SS consists of two binomial 1d SSs, and therefore has four simple events. (2) (Side) Every side of the square represents one of the 1d SSs, and is divided into two parts according to its probabilities. The division of each side determines a division of the square into two rectangles. (3) (Matrix) The divisions of the two sides create a division of the square into four rectangles representing the four simple events. The event A B is represented by the rectangle whose sides represent the events A and B, respectively.
(4) (Cells Ratio) In an area model that is divided into 10 10 cells, probabilities can be calculated as ratios: the number of relevant cells/100. (5) (Multiplication) The probability of a 2d simple event can be calculated as the product of the respective 1d probabilities. (6) (Rectangle Area) The justification for the multiplication principle is the representation of the event by a rectangle. The area of a rectangle is calculated as the product of its side lengths. (7) (Part) Alternatively, multiplication is appropriate because we calculate a part of a part.
Data collection and analysis
All the lessons were videotaped and transcribed. A video camera was focused on the pair of students, Roni and Yam. A researcher was present in every lesson and took field notes. Milestones of the students’ knowledge construction were listed in a development table. When we identified partial knowledge constructs, we traced the knowledge construction by means of the RBC model, and compared the students’ constructs with the corresponding mathematical principles. In the next sections, we shall describe and analyse the learning process during the Roni and Yam's work on the task sequence, and then try to explain their later actions in the light of their earlier constructions. The focus of our analysis will be Roni's constructions. We shall consider Yam's contribution to the learning process as part of the context for Roni's knowledge constructing. Similar analyses of learning processes of student pairs using the RBC-model have been presented by Dreyfus, Hershkowitz and Schwarz (2001). These authors considered the emergence of shared knowledge in the context of the pair of students.
Ron, Dreyfus & Hershkowitz
4 - 452 PME30 — 2006
CONSTRUCTING THE AREA MODEL Roni and Yam met the area model for the first time in the "Smog City" task (Fig. 1). They were working as a pair in the classroom. They correctly answered all the questions of the task. They completed the division of the square into four rectangles by drawing a segment separating the three upper rows from the seven lower rows. They wrote into every rectangle what its area represents, and upon the teacher’s prodding, Roni explained:
210 R: [The probability to meet a tall person who is also a smoker] is zero point zero six. [The probability to meet a person who is a smoker but not tall] is 3 times 8: 0.24.
222 R: The probability is 56 squares out of 100.
When discussing question d, Roni and Yam rejected Jonathan’s suggestion and accepted Alma’s. Their written answer, dictated by Roni, described in detail the four events of the 2d SS and justified the multiplication using principle 7 (Part):
"…0.94 are all the other kinds: tall people that do not smoke, smokers who are not tall and not tall people that don't smoke. [Alma's] probability is correct because among 0.7 non-smokers there are 0.56 not tall, and among 0.8 not tall there are 0.56 not smoking. (0.14 of the non smokers are tall and 0.24 of the not tall smoke)".
Yam asked for an explanation and Roni supplied it: 269 R: Because 0.24 plus 0.56 is 0.8.
We may say that in the process of carrying out the first task, Roni constructed most of the 2d SS principles, at least in the context of the Smog City task. The only principle for which there is no evidence is principle 6 (rectangle area as justification). In R 269 we can see evidence for an additional construct (Complement): Each 1d simple event is represented by a rectangle composed of two adjoining rectangles, each of which represents a 2d simple event. The probability of such a 2d simple event is equal to the probability of the 1d simple event minus the probability of the other 2d simple event. We shall see that the Complement construct plays a central role in Roni's thinking. The second task, "Arrows", deals with two girls who throw arrows on a target. The probability that Ofra will hit the target is 0.3 and the probability that Ayelet will hit the target is 0.5. The students are given an empty area square with the name Ofra marked on the horizontal axis and Ayelet on the vertical one, and are asked to divide it according to the givens and to calculate various probabilities. Roni leads the division of the square into four rectangles, which fit the Side principle but not the Matrix principle: All four events are represented in the square; one side is divided according to the probability of Ofra to hit, and the other side is divided according to the probability of Ayelet to hit; but the axis marked Ofra is divided according to Ayelet's probabilities and vice versa (Figure 2). Nevertheless, the students’ probability calculations are correct.
Ofra
Aye
let
Figure 2
Ron, Dreyfus & Hershkowitz
PME30 — 2006 4 - 453
We identified a similar lack of adherence to the Matrix principle in the answer to another task that we shall not present here. As in the present case, in spite of the wrong organization of the area square, the students answered all questions of that task correctly. "Book Bazaar" is the first task presented with an area square that is not divided into 100 cells. According to this task 0.2 of the books to be sold in the bazaar was marked by an invisible code that entitles to a price reduction. In addition, 0.1 of the people who bought books win a cookbook. As in the earlier tasks, the students were asked to divide the square according to the givens, to write into every rectangle what its area represents, and to calculate some probabilities. Without measuring, Roni sketches freehand drawings of two segments that divide the square into four rectangles and states that the probability to both, win a cookbook and get a price reduction is 0.02. Upon Yam’s question, Roni explains:
61 R: You divide everything into 10, right? 62 Y: Just a minute. 63 R: You divide here into 10 columns. Just one column you paint. Here you
also divide into 10 rows. Two of them you paint. So you have here two cells that you paint together; and eight cells only in this color.
65 R: Eighteen cells only in that color.
Roni thus used the Cells Ratio principle even though he worked with a square that was not divided into cells. When ending his explanation, Roni starts painting the square and writes the events in the proper rectangles. His organization of the events in the area square expresses the Four Simple Events principle and the Side principle. Since he does not mark the axes in his drawing, there is no expression of the Matrix principle. Next, Roni and Yam successfully deal with a task that was presented without any drawing. Like in the first task they were asked to relate to an imaginary student who calculates a probability of a 2-d event as the product of the respective 1-d events. Again Roni accepts the calculation and justifies it using the Part principle.
A difficulty On the basis of their performance up to this point, Roni and Yam might have been expected to do well on the "Safety Systems" task: In order to ensure the functioning of a machine, two safety systems have been installed. The first system works properly in 0.99 of the cases, and the second system works properly in 0.98 of the cases. What is the probability that the machine will misfunction, because neither safety system will work? Describe and explain your calculations. Here, for the first time, Roni and Yam are confronted by a task that can't be represented by 10 10 area square. After drawing a schematic area square that represents the given probabilities, they hesitate which event to write in each rectangle. Several times they write events, erase them and write again. They end up having the axes marked "Device A" and "Device B", and having all the 2d events
Ron, Dreyfus & Hershkowitz
4 - 454 PME30 — 2006
written in the proper rectangles (Figure 3). They did not specify the 1d events nor their probabilities on the axes. Yam multiplies the probability that device A will work by the probability that device B will work and gets the probability that both devices will work (0.9702). Roni accepts the calculation and points to the corresponding rectangle. Next, Roni points to the rectangle that represents the event "neither system will work" and says: "Look, it is two, right? Two multiplied by one". Roni writes 0.002 in the rectangle "None [will work]". This wrong probability might be the consequence of building with the Cells Ratio principle while considering 1000 cells instead of 10000. Moreover, Roni does not recognize that he has calculated the required probability that the machine will misfunction. Roni and Yam try to calculate the other probabilities; they make some calculations, doubt and erase them, and turn to another task. After a few minutes, they return to the Safety Systems task, now building-with the Complement construct: In order to calculate the probability that only system A will work, they subtract the (wrong) probability that neither system will work (0.002) from the probability that the system B will not work (0.02) and obtain 0.018. Similarly, they obtain 0.008 for the probability that only system B will work. Now they calculate the probability that neither system will work by subtracting the sum of the three other probabilities from 1: 1-(0.9702+0.018+0.008)=1-0.9962=0.0038. In this instance, the Complement construct serves as indication that the result is wrong: Yam notes that the probabilities in the rectangle that represents the event "System B will not work” should add up to 0.98. Roni is also bothered with the results: "Leave me alone, Yam. It's 0.0038. Can't be, but never mind." They again leave the question, and soon return to check their answers, but they do not advance. The further attempt at the question did not bring about enlightenment that the desired probability was already in their hands at an early stage of the calculation (up to the computational error). The contrary is true: Now Roni declares that the final value, 0.038 seems reasonable to him. However, Roni states that he has no idea whether their calculation is correct.
Partial knowledge constructs The Cells Ratio principle and the Complement construct are both correct, and if our interest were to assess the correctness of the students' solution we might say that it
Onl
y A
001
8
Only B 0.08 None 0.0038
Dev
ice
A
Device B
Figure 3: Roni and Yam's final area square for the Safety Systems task
Both devices will work
0 9702
Ron, Dreyfus & Hershkowitz
PME30 — 2006 4 - 455
was correct up to a computational error. However, since our interest is in knowledge construction, the students’ actions raise some troubling questions. We shall now return to Roni's knowledge construction prior to the struggle with the Safety Systems task, in order to identify partial knowledge constructs – constructs that partially fit the corresponding mathematical principles. The organization of the events in area square model: Roni, together with Yam, correctly organized the events in area squares from the very moment that he was first introduced to this model. Several times he divided every side of the square according to the probabilities of a 1d SS and got an adequate division of the square into 4 rectangles. He constructed the Side principle and later recognized and built-with it in various contexts. We may say that it became an active strategy. We claim that the Matrix principle, on the other hand, remained a partial knowledge construct. It was constructed in the context of the Smog City task. In this introductory task the given 1d events and their probabilities were presented on the axes of an area square. In other tasks, when the students had to determine themselves what is represented by each axis, their answers contradicted the Matrix principle at least twice (see Fig. 2). We did not find expressions of recognition of the Matrix principle in their answers to the other tasks. Probability calculations: Roni constructed the Cells Ratio principle in the context of the Smog City task and then recognized it and built-with it in various contexts, including when he did not see an area square divided into cells. Roni also constructed and then recognized and built-with Complement, which had not been intended in the design of the unit. In contrast, the Multiplication principle remained a partial knowledge construct. Roni explained why it is a good idea to multiply probabilities, when the principle was used by imaginary students, but he never used this strategy. We are witnesses to the construction of this principle and to its recognition, but never to building-with it. It did not become an active strategy. Roni justified the multiplication as a calculation of a part of a part (the Part principle). The principle that justifies the multiplication as a rectangle area calculation was not constructed at all.
Roni's struggle to solve the Safety Systems task in light of his partial knowledge constructs
The absence of the Matrix principle, which had been constructed only for a very limited context in which the 1d events and their probabilities were written along the sides of the square, can explain Roni's difficulty to arrange the 2d events in the area square. In previous tasks he could enter every event in its correct rectangle due to the 10 10 cells that he saw or imagined. In the Safety Systems task, however, even when his organization fit the Matrix principle, possibly after erasing and correcting his drawing several times, Roni did not mark the 1d events and their probabilities on the axes. Since the given probabilities can't be represented as fraction of denominator 10, and therefore the 2d events can't be represented in a 10 10 area square, the most efficient strategy to solve this task is by means of the Multiplication principle. But this principle had not become an active strategy for Roni. In the absence of the
Ron, Dreyfus & Hershkowitz
4 - 456 PME30 — 2006
Matrix principle, Roni calculated the probability of the rectangle that represents the event "neither system will work" by means of the Cells Ratio principle (and with a mistake), fails to recognize that he calculated the desired probability, and tries to find it by means of the Complement construct.
CONCLUDING REMARKS Analysis of Roni's constructions reveals that some of his constructs matched the mathematical principles that underlie the learning unit only partially. Existing knowledge plays a central role in the construction of further knowledge (e.g. Smith, diSessa and Roschelle (1993)). Roni's partial knowledge constructs explain his difficulties to solve the Safety Systems task and enable us to understand his later actions in the light of his former constructions. Roni's partial knowledge constructs were constructed when he carried out the first few tasks in the sequence. In these tasks, all his probability calculations were correct, even when the context did not include any clue for the use of the area model. From this point of view we can claim that Roni's work exemplifies a situation in which correct answers hide knowledge gaps. The gaps were hidden, not only to an external observer, but also to Roni who did not experience any need for further constructing. Roni's success to accomplish the first few tasks is largely due to his construction of the Complement construct, which serves him as an alternative principle. The combination of the Cells Ratio principle and the Complement construct was efficient as long as the given probabilities could be represented in a 10 10 area square, and actually delayed the need for further construction. References diSessa, A. A., & Wagner, J. F. (2005). What coordination has to say about transfer. In J.
Mestre (ed.), Transfer of learning from a modern multi-disciplinary perspective (pp. 121-154). Greenwich, CT: information Age Publishing.
Dreyfus, T., Hershkowitz R., & Schwarz B. B. (2001). Abstraction in context II: The case of peer interaction. Cognitive Science Quarterly 1 (3/4), 307-368.
Hershkowitz, R., Schwarz, B. B., & Dreyfus, T. (2001). Abstraction in context: Epistemic actions. Journal for Research in Mathematics Education 32, 195-222.
Hershkowitz, R., Hadas, N., and Dreyfus, T. (2006). Diversity in the Construction of a Group's Shared Knowledge. Submitted to PME 30.
Smith, J. P., diSessa, A.A. & Roschelle, J. (1993). Misconceptions reconceived: A constructivist analysis of knowledge in transition. The Journal of the Learning Sciences 3(2), 115-163.
2006. In Novotná, J., Moraová, H., Krátká, M. & Stehlíková, N. (Eds.). Proceedings 30th Conference of the International Group for the Psychology of Mathematics Education, Vol. 4, pp. 457-464. Prague: PME. 4 - 457
A PICTURE IS WORTH A 1000 WORDS – THE ROLE OF VISUALIZATION IN MATHEMATICS LEARNING
Bettina Rösken Katrin Rolka University of Duisburg-Essen, Germany
This paper describes some important aspects concerning the role of visualization in mathematics learning. We consider an example from integral calculus which focuses on visual interpretations. The empirical study is based on four problems related to the integral concept that highlight various facets of visualization. In particular, we are interested in the visual images that students use for working on specific problems and how they deal with given visualizations. The findings show the importance as well as the difficulties of visualization for the students.
INTRODUCTION The first part of the title is borrowed from a common proverb which highlights the importance of visualization in general. Likewise, visualization has a long tradition in mathematics and the list of famous mathematicians using or explicitly advocating visualization is large. One prominent example is certainly the blind Euler whose restriction did not have an effect on his creative power. During the years of his blindness he was able to produce more than 355 papers – due to his visual imagination as well as his phenomenal memory (Draaisma, 2000). Hadamard (1954) pointed out the importance of visualization by referring to Einstein and Poincaré. They both emphasized using visual intuition. In Pólya’s (1973) list of heuristic strategies for successful problem solving, one prominent suggestion is ”draw-a-figure” which has become a classic pedagogical advice. However, in this paper we discuss some findings which focus on the role of visualization ranging from being useful to being an impediment.
VISUALIZATION IN MATHEMATICS LEARNING The role of visualization in mathematics learning has been the subject of much research (e.g. Arcavi, 2003; Bishop, 1989; Eisenberg & Dreyfus, 1986; English, 1997; Kadunz & Straesser, 2004; Presmeg, 1992; Stylianou & Silver, 2004). In accordance to Zimmermann and Cunningham (1991) as well as Hershkowitz et al. (1989), Arcavi (2003, p. 217) defines visualization as follows:
Visualization is the ability, the process and the product of creation, interpretation, use of and reflection upon pictures, images, diagrams, in our minds, on paper or with technological tools, with the purpose of depicting and communicating information, thinking about and developing previously unknown ideas and advancing understandings.
Rösken & Rolka
4 - 458 PME30 — 2006
This definition emphasizes that, in mathematics learning, visualization can be a powerful tool to explore mathematical problems and to give meaning to mathematical concepts and the relationship between them. Visualization allows for reducing complexity when dealing with a multitude of information. However, the limitations and difficulties around visualization and even the reluctance to visualize have also been largely discussed (Arcavi, 2003; Eisenberg, 1994; Stylianou & Silver, 2004). Visual techniques which rely on “not always procedurally ‘safe’ routines” (Arcavi, 2003, p. 235) are considered to be cognitively more demanding than analytical techniques. In a different context, visualization is discussed as an important part of so-called “concept images” (Tall & Vinner, 1981). The concept image includes visual images, properties and experiences concerning a particular mathematical concept. To understand a formal mathematical concept requires of the learner to generate a concept image for it. Nevertheless, Vinner (1997, p. 67) points out that “in some cases the intuitive mode of thinking just misleads us.” In this paper, we focus only on the visual aspects of the concept image.
TREATMENT OF INTEGRAL CALCULUS IN SCHOOL Many topics in mathematics have visual interpretations and the integral calculus is certainly one of those. This paper is not the place to go into detail on teaching and learning integral calculus in Germany; for this general discussion we refer to Blum and Törner (1983) and Kirsch (1976). For the sake of brevity we limit ourselves in the following to the presentation of the major aspect relevant to our study. A classical approach to the integral in school is the area calculation problem. This problem allows for using the geometric reference for visualization. Thus, the most basic way of introducing integrals is using the close connection between the idea of an integral and the idea of an area, initially for functions with positive areas in the first quadrant. Later on, this idea is expanded by identifying the integral as sum of the oriented areas.
RESEARCH QUESTIONS Much of the research into mathematics students’ knowledge of the integral has been oriented by assumptions about what students should know. Instead, we report on some ongoing research into what students do know with a special focus on visual aspects of the integral. This paper presents some results gained within the scope of a larger study to investigate students’ mental representations concerning the integral (Rösken, 2004). Our research questions in this study were:
What visual images do students have concerning the integral? How do students deal with a given visualization? To what extent are visual images used by the students?
Rösken & Rolka
PME30 — 2006 4 - 459
Figure 1 Figure 2
METHODOLOGY The study employed qualitative methods to capture the importance of visualization in the learning of integral calculus. The observation of the lessons in question and the analysis of the teaching material led to constructing a questionnaire containing several problems related to the integral. The students worked on this questionnaire in the classroom under supervision and were allowed to use a calculator. For the purposes of this paper we focused on four problems revealing diverse aspects of the integral. The subjects in this study were students in grade 12 of two German high-schools. The first class consisted of 24 students, 14 female and 10 male students. The second class consisted of 28 students, 6 female and 22 male students. The two classes together form a total of 52 students. For the analysis, we do not distinguish between these two classes.
EMPIRICAL RESULTS This is not the place to give a detailed analysis of the observed lessons. The main approach to the integral discussed above emerged in both classes. In this section, we restrict ourselves to the presentation of the problems, the underlying mathematical aspects and the students’ answers.
Problem 1: Draw a figure to illustrate the geometric definition of the integral. The geometric definition refers to the area concept as already mentioned. We were interested in the visual representations that students associate with this aspect of the integral. The following table shows the distribution of the students’ solutions:
Table 1: Students’ answers to problem 1
90% of the students were able to illustrate the geometric definition of the integral. However, it is remarkable that 77% of the students disposed of an image that is limited to a positive area. Figure 1 shows an example of such visualization which represents merely one aspect of the integral concept. This restricted visualization will turn out to be an obstacle for working on the other problems. Figure 2 shows an example for a more adequate visualization which was only used by 13% of the students.
Positive area Positive and negative areas No answer
77% 13% 10%
Rösken & Rolka
4 - 460 PME30 — 2006
Problem 2: Find a formula for the area by using integration. a) b) In contrast to problem 1, the students were given a concrete visualization and were asked to find the integrand as well as the limits of integration. In problem 2b, the students additionally had to consider the orientation of the area. Table 2 shows the distribution of the students’ answers to problem 2a:
Table 2: Students’ answers to problem 2a
Correct answer Incorrect answer No answer
50% 40% 10%
It is notable that the given visualization of this problem differed only slightly from the visualization the students chose in problem 1. However, half of the students were not able to give a correct answer. Among the incorrect answers, the following terms can be found:
b
a
kdx b
a
adx b
a
dxxa )( b
a
ada b
a
dxaf )(
One difficulty for the students was to name the limits of integration. It is evident that
finding the integral for the given image conflicts with the standard notation: b
a
dxxf )(
Furthermore, the students had major problems to recognize the given constant function as a possible integrand. Obviously, they were missing an x-term. One student gave the correct answer but stated the following:
: Not possible, because this is a constant function and there is no x in it and that’s why it is not possible to put in the limits.
b
a
1 2 3
1
-1
b
dxxf0
)(
Rösken & Rolka
PME30 — 2006 4 - 461
Figure 3
Two students solved this conflict by drawing a supporting straight line as shown in figure 3. They obtained the answer to this problem in a creative though complicated way.
Table 3 shows the distribution of the students’ answers to problem 2b: Table 3: Students’ answers to problem 2b
Correct answer Incorrect answer No answer
40% 54% 6%
While the difficulties to find the integrand remained, the problem to name the limits of integration minimized due to the concrete numbers provided in the illustration. However, a new obstacle emerged because of the orientation of the area. Instead of the area, the students calculated the integral. This was found in more than half of the incorrect answers. Some students solved this conflict by shifting the square above the x-axis.
Problem 3: a) Find the area bounded between the function f(x)=sinx and x-axis over [ ,2 ].
b) Calculate the integral: 2
sin xdx
For the answer to problem 3a the students had to calculate an area of negative orientation while in problem 3b the same function was given but this time they were asked to calculate the integral. Even though the limits of integration changed, the answer to problem 3b could be immediately given by visualizing the graph of the function and considering problem 3a. This problem demanded that students distinguish clearly between the area and the integral concept. Table 4 shows the distribution of the students’ answers to problem 3a:
Table 4: Students’ answers to problem 3a
Correct answer Incorrect answer No answer
27% 67% 6%
Some of the students had difficulties to put in the limits or to give the correct antiderivative. More interestingly, 77% of the incorrect answers resulted in giving a negative value as area of the function. On the one hand, these students did not use
Rösken & Rolka
4 - 462 PME30 — 2006
visualization to approach the problem. On the other hand, they did not scrutinize the negative value of their result. Only 8% of all students sketched the graph. Table 5 shows the distribution of the students’ answers to problem 3b:
Table 5: Students’ answers to problem 3b
Correct answer Incorrect answer No answer
23% 73% 4%
The distribution of the answers to problem 3b is similar to 3a and the same mistakes emerged. Remarkably, in 47% of the incorrect answers a positive value was given. The students continued calculating the area as required in 3a instead of the integral, some of them even mentioned explicitly “A=2”. Only 8% of all students visualized the graph, 6% referred to their solution of problem 3a.
Problem 4
How would you proceed to calculate 1
1
3 )2sin( dxx ?
This problem can be easily solved by visualization. The function is odd so that on the given interval [-1,1] the integral equals zero. Only 4% of all students took into account these considerations. 8% of the students did not answer at all while the other students proposed to work out the integral by substitution (42%), by finding the antiderivative (29%) or by integration by parts (17%). To summarize, the solutions to this task showed an explicit bias towards an algorithmic approach even though the visual one would have been significantly easier.
DISCUSSION AND CONCLUSIONS The selected problems emphasize convincingly some important aspects inherent to visualization. On the one hand, visualization proves to be a useful tool for working on the problems and the common proverb mentioned in the title seems to be appropriate. For example, some students use visualization in a creative way by modifying the given task (problem 2; figure 3). This approach enables them to avoid the difficulties with the given visualization and thereby sheds light on the underlying obstacles concerning this task. Another interesting point is that even students that do not show visualization on their paper were able to solve problem 3 correctly. This highlights once again the importance of pictures in the mind (Presmeg, 1986). On the other hand, visualization raises some difficulties which lead us to modify the common proverb mentioned in the title. A picture is worth a 1000 words – only if one is aware of its scope: The students in this study largely demonstrated their ability in visualizing the geometric definition of the integral (problem 1; figure 1). Nevertheless, their chosen visualization only reflects one particular aspect of the integral concept. This entails some important consequences for working on the other
Rösken & Rolka
PME30 — 2006 4 - 463
problems. For example, the restricted visualization proves to be a hindrance for the solution of problem 3. The connection of the integral with the area misleads the students not to distinguish clearly between the two concepts. Basically, both concepts are different from each other, but at the same time, they have a certain though marginal intersection which predominates the students’ thinking. Another interesting aspect leads us to change the proverb as follows. A picture is worth a 1000 words – only if one is able to use it flexibly: First, even if students use visualization to solve the problems 2 and 3, this does not mean that they are able to solve the problems correctly. They do not dispose of the cognitive flexibility to use both visual and algorithmic techniques (Arcavi, 2003). Second, the students usually did not choose to visualize in problem 4 but proposed an algorithmic approach instead. They are cognitively fixed on algorithms and procedures instead of recognizing the advantages of visualizing this problem – a phenomenon which Eisenberg (1994) describes as reluctance to visualize. Third, the visualization given in problem 2 differs only slightly from the visualizations the students gave in problem 1. However, most of the students were not able to deal with this given visualization and to adequately interpret the information given in this problem. These aspects highlight the ambivalence of visualization as Tall (1994, p. 37) points out: “It is this quality of using images without being enslaved by them which gives the professional mathematician an advantage but can cause so much difficulty for the learner.” Hence, the importance of visualization for mathematics learning and teaching is constituted in being aware of the fact that visualization never represents an isomorphism of mathematical concepts and their relationships. Therefore, visualization should be accompanied by reflective thinking to avoid being enslaved by it. References Arcavi, A. (2003). The role of visual representations in the learning of mathematics.
Educational Studies in Mathematics, 52, 215-241. Bishop, A. (1989). Review of research in visualization in mathematics education. Focus on
Learning Problems in Mathematics, 11(1), 7-16. Blum, W., & Törner, G. (1983). Didaktik der Analysis. Göttingen: Vandenhoeck &
Ruprecht. Draaisma, D. (2000). Metaphors of memory - A history of ideas about the mind. Cambridge:
University Press. Eisenberg, T. (1994). On understanding the reluctance to visualize. Zentralblatt für Didaktik
der Mathematik, 26(4), 109-113. Eisenberg, T., & Dreyfus, T. (1986). On visual versus analytical thinking in mathematics. In
L. Burton & C. Hoyles (Eds.), Proceedings of the 10th International Conference of the International Group for the Psychology of Mathematics Education. (pp. 153-158). London, United Kingdom.
English, L. (Ed.) (1997). Mathematical Reasoning. Analogies, Metaphors and Images. Mahwah, NJ: Lawrence Earlbaum Associates.
Rösken & Rolka
4 - 464 PME30 — 2006
Hadamard, J. (1954). The psychology of invention in the mathematical field. New York: Dover Publication.
Hershkowitz, R., Ben-Chaim, D., Hoyles, C., Lappan, G., Mitchelmore, M., & Vinner, S. (1989). Psychological aspects of learning geometry. In P. Nesher & J. Kilpatrick (Eds.), Mathematics and Cognition, (pp. 70-95). Cambridge: University Press.
Kadunz, G., & Straesser, R. (2004). In M. J. HØines & A. B. Fuglestad (Eds.), Proceedings of the 28th Conference of the International Group for the Psychology of Mathematics Education Bergen (Vol. 4, pp. 241-248). Bergen, Norway:PME.
Kirsch, A. (1976). Eine ”intellektuell ehrliche” Einführung des Integralbegriffs in Grundkursen. Didaktik der Mathematik 4, 97-105.
Pólya, G. (1973). How to solve it. Princeton, NJ: University Press. Presmeg. N.C. (1986). Visualisation in high school mathematics. For the Learning of
Mathematics, 6(3), 42-46. Presmeg, N.C. (1992). Prototypes, metaphors, metonymies and imaginative rationality in
high school mathematics. Educational Studies in Mathematics ,23, 595-610. Rösken, B. (2004). Empirische Erhebung zur Analyse der mentalen Repräsentation des
Integralbegriffes unter besonderer Berücksichtigung von ,Concept Image�’ und ,Concept Definition�’. (Staatsarbeit, nicht veröffentlicht).
Stylianou, D.A., & Silver, E.A. (2004). The role of visual representations in advanced mathematical problem solving: An examination of expert-novice similarities and differences. Mathematical Thinking and Learning, 6(4), 353-387.
Tall, D. (1994). The psychology of advanced mathematical thinking: Biological brain and mathematical mind. In J. P. Ponte & J. F. Matos (Eds.), Proceedings of the 18th Conference of the International Group for the Psychology of Mathematics Education (Vol. 1). (pp. 33-39). Lisbon, Portugal: PME.
Tall, D., & Vinner, S. (1981). Concept image and concept definition in mathematics with particular reference to limits and continuity. Educational Studies in Mathematics, 12(2), 151-169.
Vinner, S. (1997). From intuition to inhibition – Mathematics, education and other endangered species. In E. Pehkonen (Ed.), Proceedings of the 21st Conference of the International Group for the Psychology of Mathematics Education (Vol. 1, pp. 63-78). Helsinki, Finland: PME.
Zimmermann, W., & Cunningham, S. (1991): Editor’s introduction: What is mathematical visualization. In W. Zimmermann & S. Cunningham (Eds.). Visualization in Teaching and Learning Mathematics, (pp. 1-8). Mathematical Association of America, Washington, DC.
2006. In Novotná, J., Moraová, H., Krátká, M. & Stehlíková, N. (Eds.). Proceedings 30th Conference of the International Group for the Psychology of Mathematics Education, Vol. 4, pp. 465-472. Prague: PME. 4 - 465
ESTABLISHING AND JUSTIFYING ALGEBRAIC GENERALIZATION AT THE SIXTH GRADE LEVEL
Joanne Rossi Becker and Ferdinand Rivera San José State University
This is a case study of two sixth graders performing a generalization involving a linear pattern that was presented in a pre-and post-interview. The basic research question was: How do sixth graders acquire the ability to establish and justify generalizations in algebra? We discuss characteristics of students who are predominantly figural in their strategies and claim that figural ability and fluency in representations and variable use are essential for success.
INTRODUCTION This study builds on previous studies we have conducted in relation to patterns and the formation of generalization in algebra. Based on our work with pre-service elementary teachers (Rivera & Becker, 2005, 2003) and ninth graders in a beginning algebra course (Becker & Rivera, 2005, 2004), we claim that individuals tend to exhibit at least two modes for expressing generality on tasks involving linear patterns: numerical and figural. In this study, our sample is a group of twenty-nine sixth graders who were in the beginning stage of learning algebra and with minimal experience in establishing and justifying generalizations from patterns. This study marks the beginning of several years of funded research that seeks to document the generalization abilities of middle school students starting at the sixth grade. The classroom teaching experiments that have been used and developed in this study emphasize a multiple representational view of generalization in both form and approach (Rivera & Becker, 2005), with the ultimate aim that students are able to move from one representation to the other with flexibility. In this study, we undertake the following research problems: How do sixth graders acquire the ability to establish and justify generalizations in algebra? To what extent are sixth graders capable of generalizing formulas figurally and/or numerically? How does representational and variable fluency enable them to establish and justify generalizations, including their ability to assess the equivalence of several different formulas for the same pattern? How does their current or prevailing competence in symbol and variable use affect the manner in which they perform generalization?
THEORETICAL FRAMEWORK The genesis of our initial theoretical framework in earlier investigations has been drawn from similarity studies on induction in developmental psychology (see Rivera & Becker, 2003). Similarity is a natural mechanism for comparing entities in everyday life. With respect to everyday objects, individuals perform similarity and develop generalizations from available concrete objects. In the case of mathematical objects, patterns in school algebra oftentimes are represented in both numerical and
Rossi Becker & Rivera
4 - 466 PME30 — 2006
figural modes which explains the two modes for expressing generality, namely: figural and numerical. Individuals who are predominantly numerical generalizers establish their formulas from the available numerical cues. They do not seem to be consistently capable of justifying their generalizations non-inductively or in some other valid way. They frequently employ trial and error as a numerical strategy with no sense of what the parameters in particular formulas represent. Further, some of their numerical methods contain fallacies and contradictions, and they seem to be object-oriented in the sense that the formulas they develop tend to be justified solely in terms of how well the formulas fit the limited information they have examined. Individuals who are predominantly figural generalizers are capable of justifying their generalizations non-inductively and in other valid ways due, in part, to the manner in which they are able to connect their symbols and variables to the patterns that generate the figures. They seem to be relation-oriented in the sense that they see sequences of figural cues as possessing invariant structures and thus, are necessarily constructed in particular ways. We also note that, while students who are predominantly figural generalizers do not see the need to set up a table of values in order to establish a general formula, those who are predominantly numerical generalizers are predisposed to initially set up a table in order to perform a numerical strategy with little regard to how the dependent values may be perceived otherwise (for example, figurally). We observe that quite a number of numerical generalizers tend to view variables as mere placeholders with no meaning except as a generator for certain sequences of numbers. With figural generalizers, variables are seen as not only placeholders but within the context of a functional relationship. Finally, figural generalizers are more likely to be able to generalize to an explicit, closed formula. Note the terms “predominantly numerical” and “predominantly figural” imply the possibility that some learners manifest pragmatic modes for expressing generality (Becker and Rivera, 2005); that is, their generalization abilities reflect a capacity for employing both numerical and figural strategies.
METHODS Twenty-nine sixth grade students (11 boys, 18 girls, mean age of 11) in an urban school in Northern California participated in two clinical interviews. The study involved two sequences of teaching experiments of the Mathematics in Context (MiC) curriculum. The students were given five tasks involving algebraic patterns; analogous tasks were given in a pre-interview and post-interview, separated by three months of instruction involving three MiC units on “Operations,” “Building Formulas,” and “Expressions and Formulas.” We first conducted independent readings of transcripts to identify patterns in strategies used for each of the five questions on the interview. Then several follow-up discussions and crosschecking ensued. In this study, we report on the results of two individuals, Dung (Vietnamese American) and Marlisha (African American) based on their work on one item from the interviews, the Square Tiles problem (see Figures 1 and 2). Note that Figure 1 was the pre-interview task, while Figures 1 and 2 comprised the post-interview task.
Rossi Becker & Rivera
PME30 — 2006 4 - 467
Because, in the pre-interview, the students did not know how to write general formulas, the interviewer (first author) instead adjusted the prompt to ask students to find the 10th and 100th term in the sequence. In the post-interview, the first part of the prompt was followed by questions shown in Figure 2 below. Tiles are arranged to form pictures like the ones below.
Picture 1 Picture 2 Picture 3 Picture 4
Find a formula that enables you to calculate the number of square tiles in Picture “n.” How did you obtain your formula?
Figure 1: Square Tiles Prompt
A. If the solution has been obtained numerically, respond to the following question: Is there a way to explain your formula from the figures?
B. How many square tiles will there be in Picture 75? Explain.
C. Can you think of another way of finding a direct formula?
D. Two sixth graders came up with the following two formulas:
Kevin’s direct formula is: T = (n x 2) + (n x 2) + 1, where n means Picture number and T means total number of squares. Is his formula correct? Why or why not?
Melanie’s direct formula is: T = (n x 2) + 1 + (n x 2) + 1 - 1, where n and T mean the same thing as in (D) above. Is her formula correct? Why or why not?
Which formula is correct: Kevin’s formula, Melanie’s formula, or your formula? Explain.
Figure 2: Square Tiles Prompt Part 2
RESULTS The Case of Dung. At the beginning of the school year, Dung was closest in the group to having a concept of variable as a varying quantity representing a relationship. His predominant mode of generalizing was figural, that is, he saw the sequence of figures as being related by the following property: “[For Figure] 1, there’s one square around it, [for figure] 2 there are two squares around it, and so 3 and so on.” When asked to find the number of square tiles for figures 6 and 7, he stated in clear terms the following process: multiply the figure number by 4 and add 1. When asked to come up with a possible formula, his written work is shown in Figure 3.
Rossi Becker & Rivera
4 - 468 PME30 — 2006
Figure 3: Dung’s Formula for the Square Tiles, Pre-Interview
During the post-interview, Dung has retained his predominantly figural mode for expressing generality. Dung quickly saw the one square in the middle as “plus 1” and the sides as representing the picture number. He wrote S for number of squares and n for picture number and the direct formula, S = n x 4 + 1. When asked to find the direct formula in another way (part C), Dung made a table, found a constant difference of 4, checked it for three values, and derived the same formula. In part D, Dung checked each of Kevin and Melanie’s formulas for two different values of n, concluding that both were correct. However, while he was able to explain Kevin’s formula from the figures, he was not able to make visual sense of Melanie’s formula, using a structural explanation instead: “+1 –1 = 0 so you don’t really need it.” The Case of Marlisha. In the pre-interview Marlisha’s predominant mode of generalizing was figural. Initially, she saw the figural sequence to be involving the invariant property of “adding four.” She saw the preceding figure as being embedded in the succeeding figure and that the succeeding figure grows by 1 on each side. When she was asked to determine the number of square tiles for the tenth picture, her figural strategy changed from an additive relation to a multiplicative relation. So for example, when asked for Picture 10, she changed how she was visualizing the figure; she first found Picture 6 by taking 6 for each “arm” times 4 and adding 1. Then for Picture 10 she multiplied 10 x 4 and added 1 to get 41. When asked for Picture 100 she quickly answered 401. However, Marlisha was unable to develop a direct formula. Also, while she was able to obtain the correct values for the number of square tiles, her written work shows an incorrect use of the equality sign (see Figure 4). In the post-interview, Marlisha’s predominant mode of generalizing was numerical. She had facility with variable quantities and knew the role of the independent and dependent variables.
Figure 4: Marlisha’s Use of Equal Sign During Pre-Interview
Rossi Becker & Rivera
PME30 — 2006 4 - 469
She started this problem by counting the tiles, making a table, looking for a finite difference, and getting the formula, S = n x 4 + 1, where S = number of squares and n = picture number. When asked to make sense of her formula from the figures, as all her work was numerical, she said “the n represented the picture number and you had four corners in the picture, so you multiply 4 times the picture number and plus one in the middle.” Marlisha was unable to find another way to get a direct formula. She checked Kevin and Melanie’s formulas for two values of the independent variable and declared them both correct (Figure 5). While she was able to interpret Kevin’s formula from the figure as “two bottom columns and two upper columns plus the one in the middle,” she was unable to understand exactly what Melanie had done to get her formula.
Figure 5: Marlisha’s Check of Melanie’s Formula, Post-Interview
DISCUSSION How did Dung and Marlisha acquire the ability to establish and justify generalizations in algebra? To what extent were they capable of generalizing formulas figurally and/or numerically? Noticing Invariant Relationships Figurally. In the pre-interview, Dung and Marlisha initially saw the sequence of figural cues to have an invariant property. Working within a predominantly figural mode of generalizing, they both perceived and established the general pattern “multiply picture number by 4 and add 1” and justified the statement on the basis that the figural cues had “arms” or “sides” that constantly grew with a fixed center square tile. Thus, it was easy for them to find specific terms, such as the tenth term. Finding a closed form for the nth term was more problematic, as discussed below. The Significance of Algebraically Useful Figural Strategies. We find Marlisha’s pre-interview results to be interesting. Her initial figural strategy was additive (that is, “adding 4”) with the addition of 1 square tile on each side as a result of seeing a preceding figure embedded within a succeeding figure. However, she later abandoned the additive relation in favor of a multiplicative relation that then enabled her to determine both near and far generalization items successfully (the tenth and 100th terms). Thus, while having a figural strategy is useful in establishing a general formula, it really has to be algebraically useful. That is, Marlisha’s choice to abandon one figural strategy in favor of another was motivated by her need to obtain the number of square tiles for Picture 10 and Picture 100 conveniently. Further, it has
Rossi Becker & Rivera
4 - 470 PME30 — 2006
been claimed that some learners are capable of dealing with near generalization tasks (such as finding the seventh term) with ease, but not so in the case of far generalization tasks (such as finding the 100th term). Marlisha’s figural strategy of having seen four arms that grew based on their picture number and a fixed center square made it easy for her to tackle both near and far generalization tasks. Additive Versus Multiplicative Relationships in Pattern Formation. We think that if Marlisha pursued the “adding of 4” strategy, it might have led to a recursive formula (that is, an = an-1 + 4) which we have found to be a common type of response (Becker & Rivera, 2005; Rivera & Becker, 2003). In fact, none of the remaining thirty-one students in the pre-interview were able to state a possible direct formula (in an almost multiplicative form) from the additive relation “adding 4,” that is, an = 5 + 4(n – 1), where n is picture number and an is the number of square tiles. Interestingly enough, this equivalent general formula was never suggested in the post-interview with the chosen ten students. The preferred general formula was S = n x 4 + 1 which the predominantly figural students saw as being transparent from the available figural cues. Thus, in establishing a direct (closed) formula for linear patterns in the form an + b, students’ thinking will necessarily have to transition from an additive to a multiplicative process as exemplified by Dung and Marlisha. Constructive Versus Deconstructive Generalizations. Dung and Marlisha were both adept at what we term “constructive generalizations.” For example, in the Square Tiles task, they easily developed a general formula because they saw each figural cue as consisting of four sides with a center square. Thus, it was easy for them to make sense of Kevin’s direct formula (see Figure 2, item D) because the constant and the two coefficients could be explained as the sum of the top two columns plus the bottom two columns plus the middle square. However, they were unsuccessful in making visual sense of Melanie’s direct formula (see Figure 2, item D). Melanie’s formula provides an illustration of what we refer to as “deconstructive generalization.” In justifying Melanie’s formula, the students had to deconstruct a figural cue into, for example, two odd-numbered diagonals of square tiles minus an extra middle tile (since it has been counted twice). In fact, the students in the post-interview who were predominantly figural generalizers performed similarly. How does representational fluency enable Dung and Marlisha to establish and to justify generalizations, including their ability to assess the equivalence of several different formulas for the same pattern? Dung’s preferred strategy was figural throughout both interviews. His alternative, secondary representation of the Square Tiles task involved a numerical method of setting up a table and performing a finite difference method in order to obtain a formula. Marlisha started out to be predominantly figural in the pre-interview. However, by the post-interview, she had become predominantly numerical, exhibiting some of the characteristics of numerical generalizers stated in the Theoretical Framework. She employed a systematic trial and error method as a way to verify that the formula matched each dependent value tested. But Marlisha’s ability to engage in a figural strategy assisted her later in the stage of justifying the
Rossi Becker & Rivera
PME30 — 2006 4 - 471
formula. She knew what the coefficient and the constant meant within the context of the task. Both the methods of Dung and Marlisha exhibit what we characterize as representational fluency in the sense that both were capable of working through different types of representations that made the task of generalizing more meaningful for them. In a separate research report (Rivera & Becker, 2006, see volume 1), we claim that, while several of the predominantly numerical generalizers in the post-interviews were successful in arriving at a general formula, however, they were not representationally fluent in the sense that they could not justify the formula in ways other than a mere appearance match. On the other hand, we note that predominantly figural generalizers are representationally fluent since they were capable of developing alternative representations to justify their general formulas. How does the current or prevailing competence in symbol and variable use of Dung and Marlisha affect the manner in which they perform generalization? We make a strong claim that success in developing and justifying generalizations involving patterns in middle school algebra involves having facility in both figural ability and variable fluency. That is, they go together in the sense that the lack of competence in one aspect undermines the other in salient ways. In the pre-interview, while it was evident that both Dung and Marlisha had a figural ability to see an invariant relationship among the sequence of figural cues, they were both not fully competent in using variables to express the relationship in symbolic terms following conventional practices. In fact, the two were working at different levels of variable use, namely, absence and situated. Marlisha was unfamiliar with how variables were employed to express a generality; this prevented her from stating a direct formula. She exhibited the lowest level of variable use, that is, the absence of knowledge in using a variable or variables to state a functional relationship. Dung’s level of variable use can be characterized as situated in the sense that his use of variables reflected numerical actions and operations that remain bounded to the context of generalization. In Figure 3, Dung’s use of the variable n has taken several meanings: from n in reference to picture n, to n as a result of multiplying by 4, and then to a third use of n as pertaining to number of tiles in picture n. In the post-interview, it was evident that both Dung and Marlisha were working at the symbolic level of variable use, far beyond the earlier levels. Variables were now understood within a functional relationship. The general formula has now become even more compact and de-contextualized in the sense that they saw the variables as representing two different quantities that vary, that of picture number (n) and number of square tiles (S). Further, they were well aware of the importance of a correct direct formula. In fact, both were initially motivated to find a correct generalization as a first step that would then enable them to compute for near and far generalization tasks (see Figure 2, item B). In summary, these two students demonstrate the growth both in ability to generalize linear algebraic patterns and in fluency with variables and multiple representations that can be accomplished through instruction that accentuates figural, numerical and verbal representations of patterns, and connections among them. Future work will
Rossi Becker & Rivera
4 - 472 PME30 — 2006
focus on more complex patterns in which invariant properties are not easily perceived, patterns that are not linear, and ways to foster deconstructive generalization. As the students move on to seventh and eighth grades, graphical representations will also be introduced to add further to students’ understanding of functional relationships. Acknowledgment: Support for this research was funded by the National Science Foundation under grant No. REC-0448649 awarded to F. D. Rivera. The opinions expressed do not necessarily reflect the views of the foundation.
References Becker, J.R. & Rivera, F. (2005). Generalization strategies of beginning high school algebra
students. In H. Chick & J.L. Vincent (Eds.), Proceedings of the 2ninth Conference of the International Group for the Psychology of Mathematics Education (pp. 4-121 through 4-128). Melbourne, Australia: University of Melbourne.
Becker, J.R. & Rivera, F. (2004). An investigation of beginning algebra students’ ability to generalize linear patterns. In M.J. Høines and A.B. Fuglestad (Eds.), Proceedings of the 28th Conference of the International Group for the Psychology of Mathematics Education (pp. I-128). Bergen, Norway: Bergen University College.
Bednarz, N., Kieran, C. & Lee, L. (Eds.) (1996). Approaches to Algebra: Perspectives for Research and Teaching (pp. 87-106). Dordrecht: Kluwer.
Rivera, F. & Becker, J.R. (2005). Figural and numerical modes of generalizing in algebra. Mathematics Teaching in the Middle School 11(4), 198-2-3.
Rivera, F. & Becker, J.R. (2003). The effects of figural and numerical cues on the induction processes of preservice elementary teachers. In N. Pateman, B. Dougherty, and J. Zilliox (Eds.), Proceedings of the Joint Meeting PME and PMENA (pp. 4-63 through 4-70). Honolulu, HA: University of Hawaii.

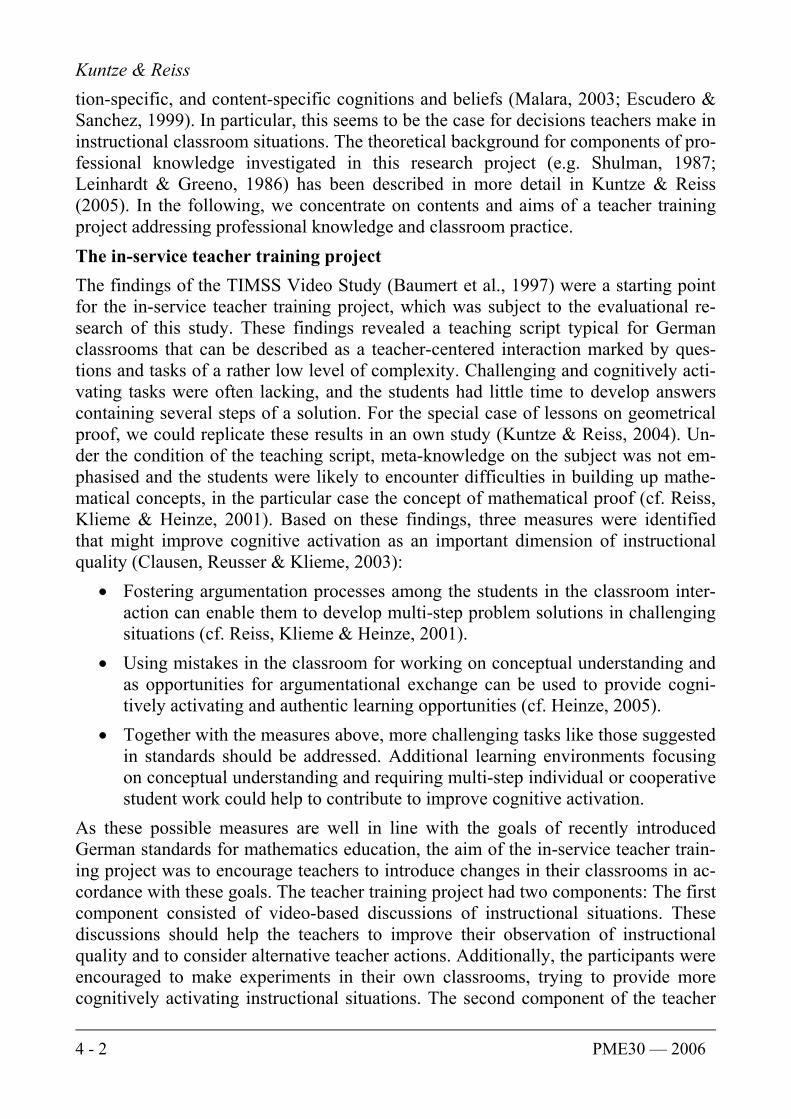
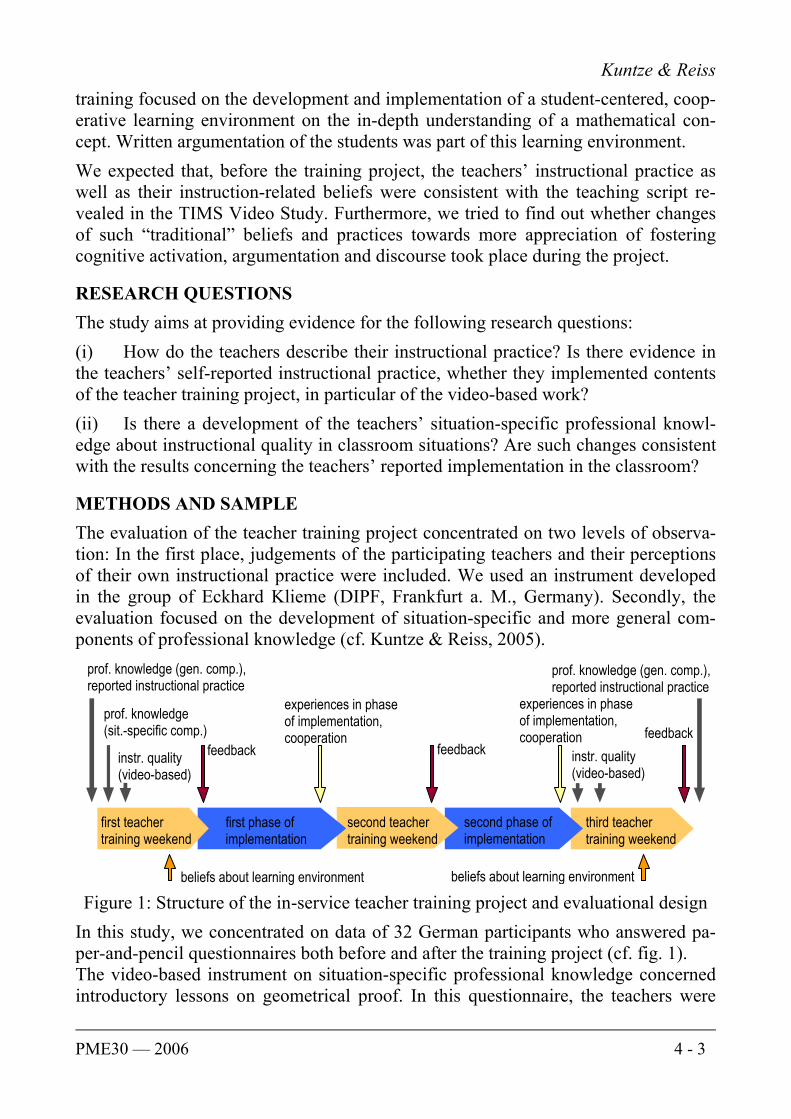
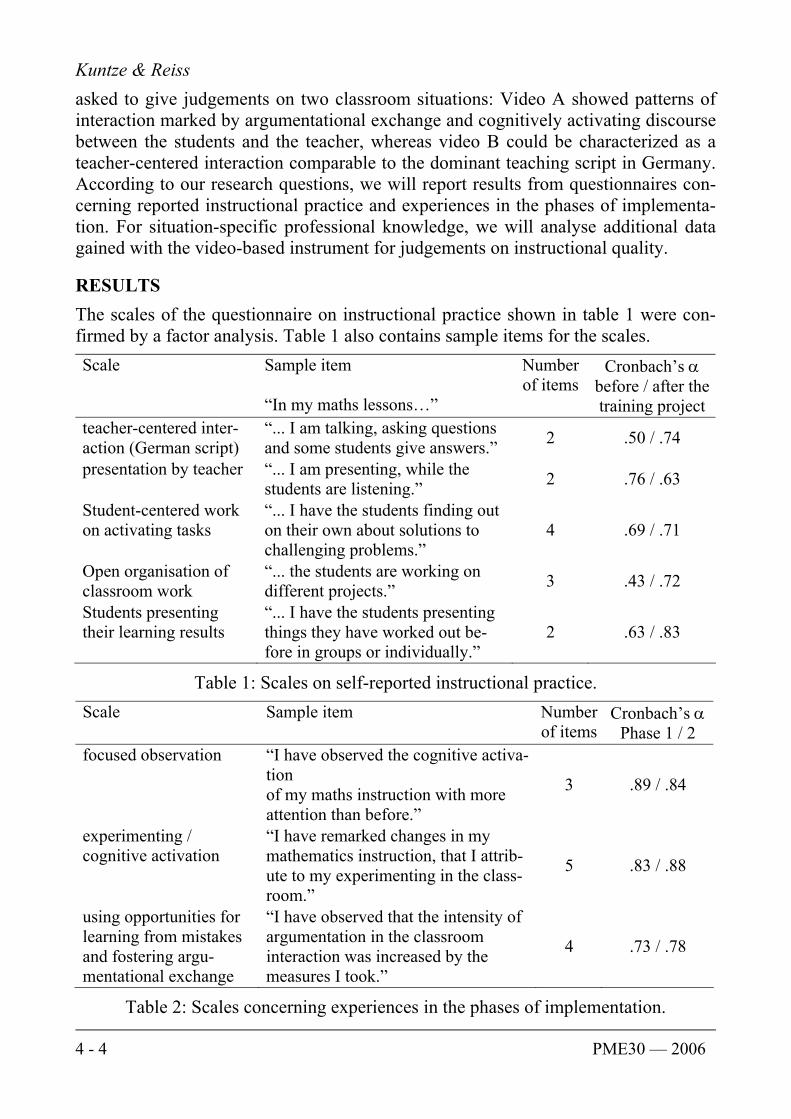
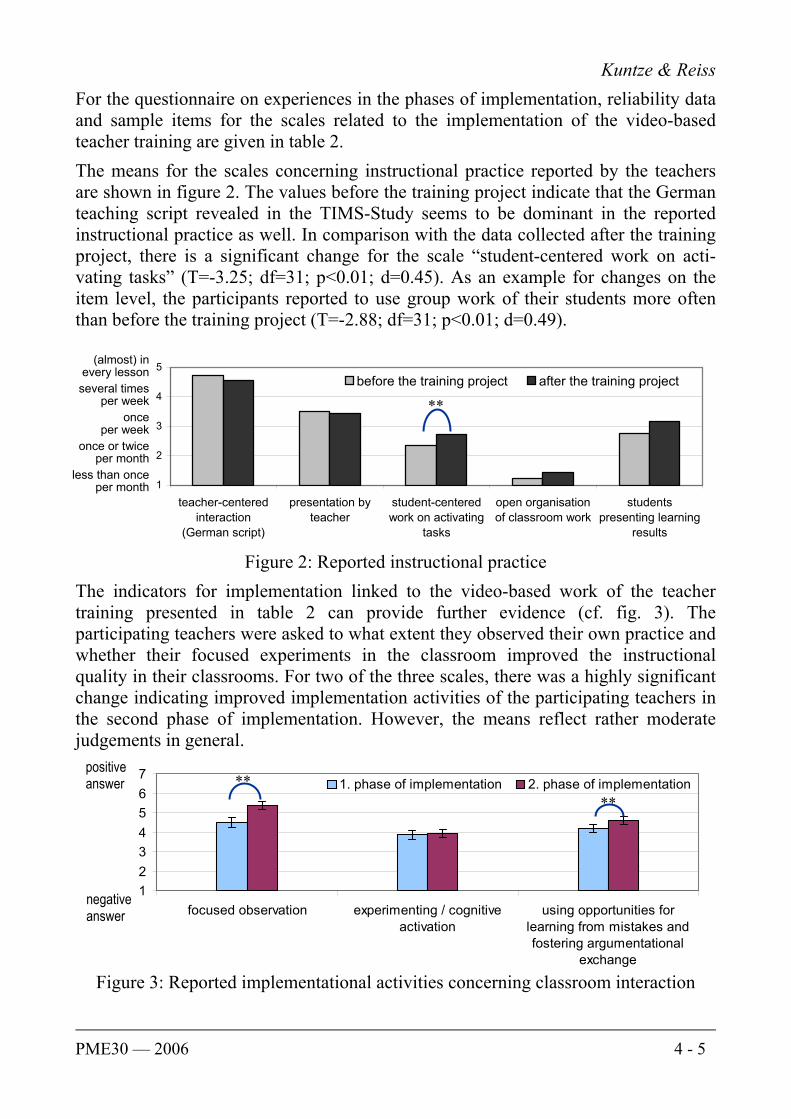
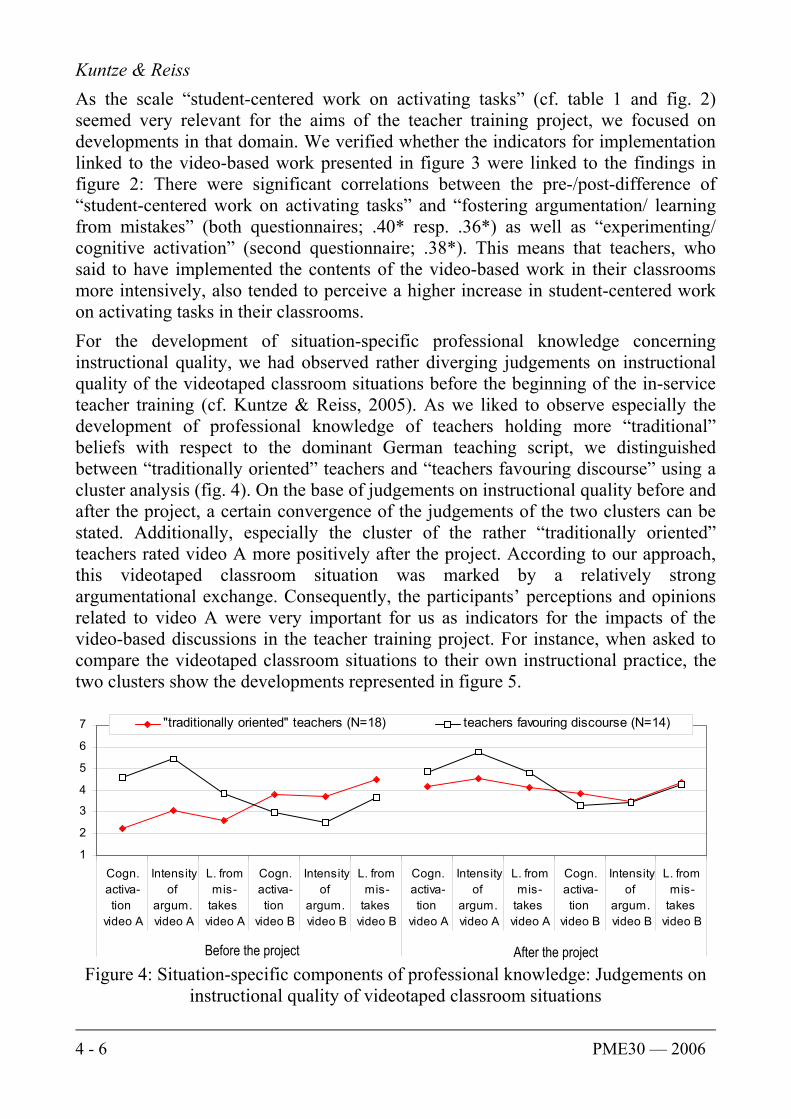
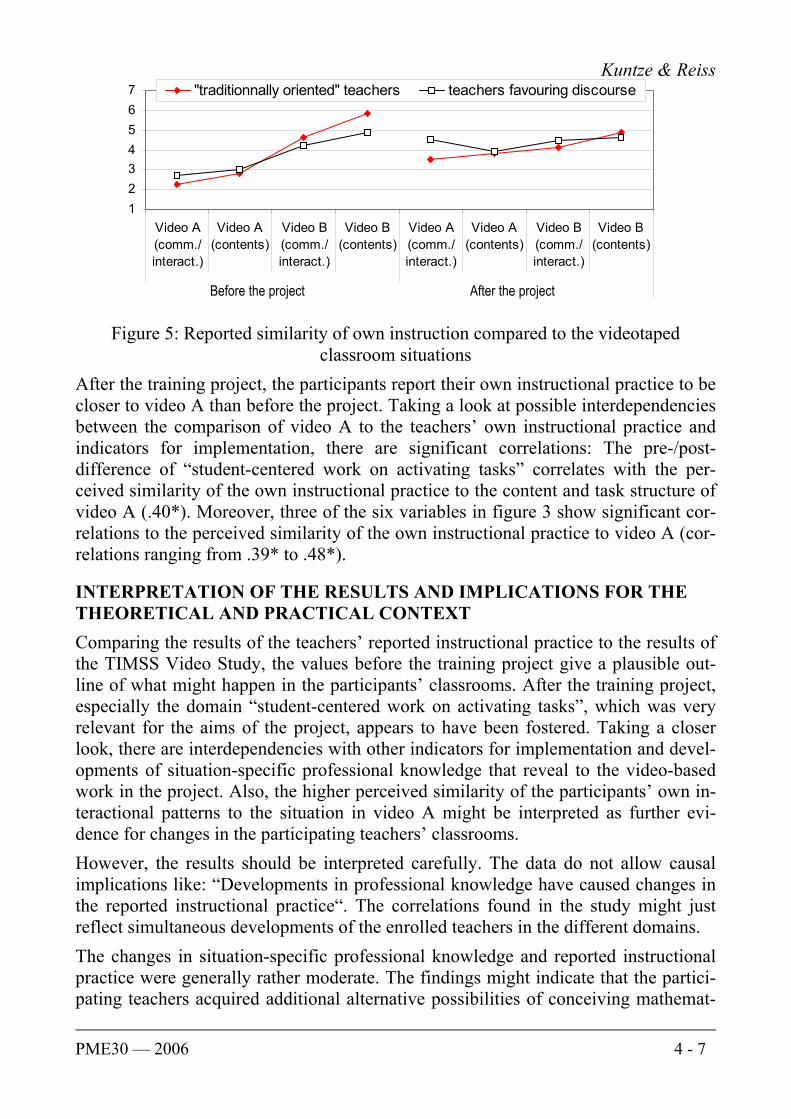
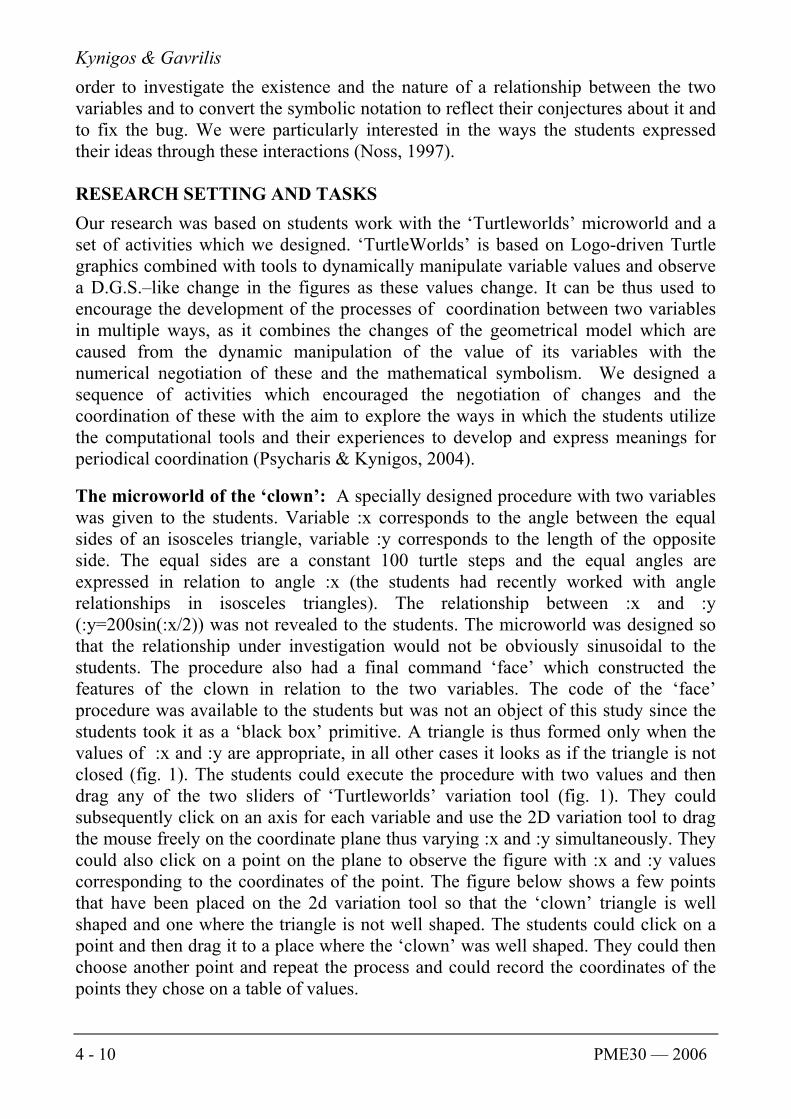
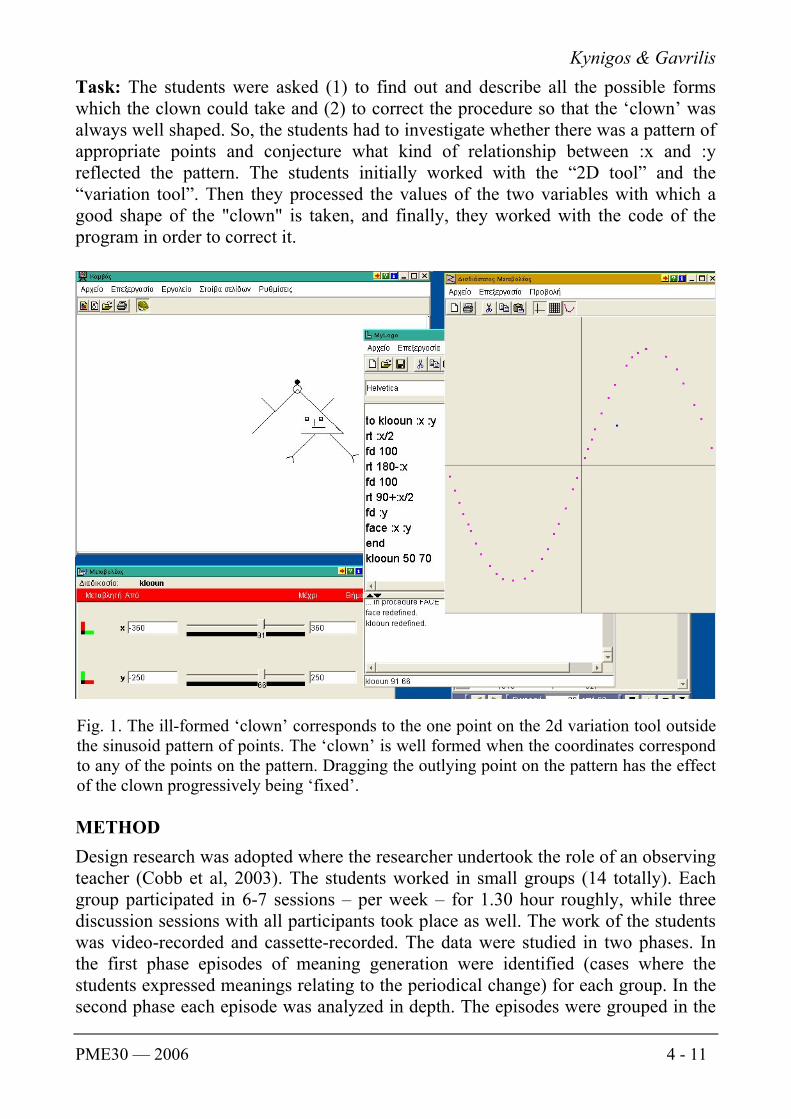
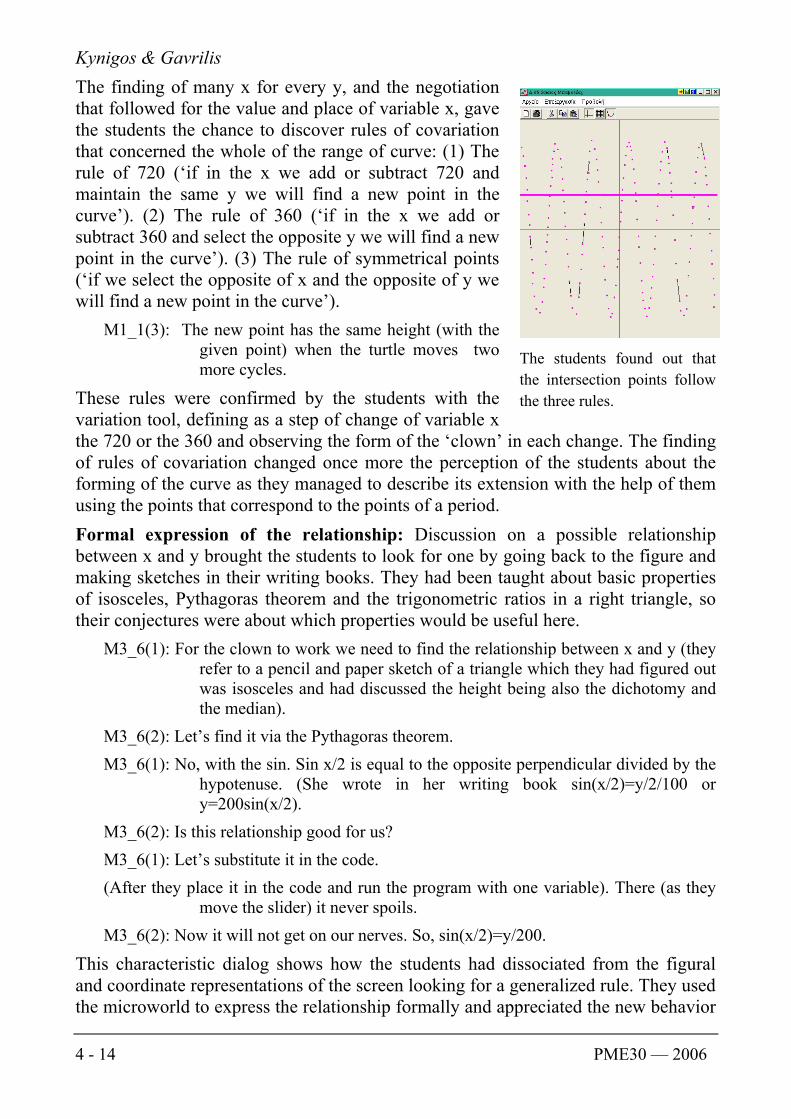
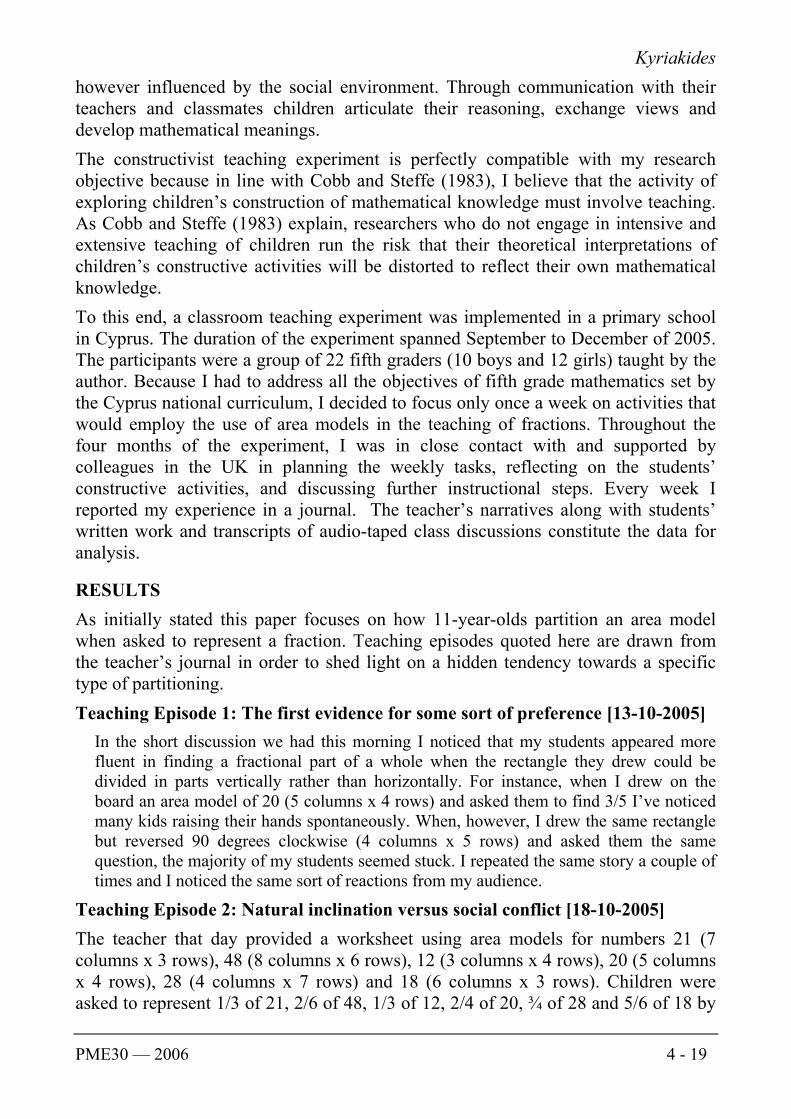
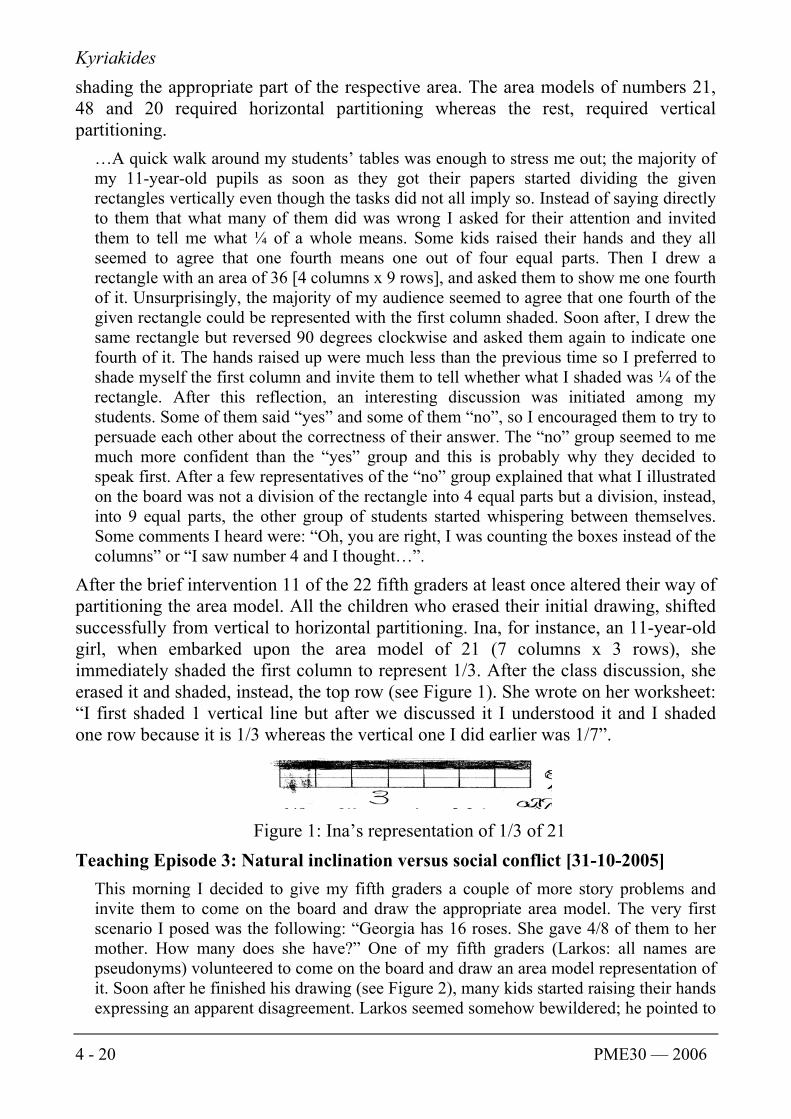
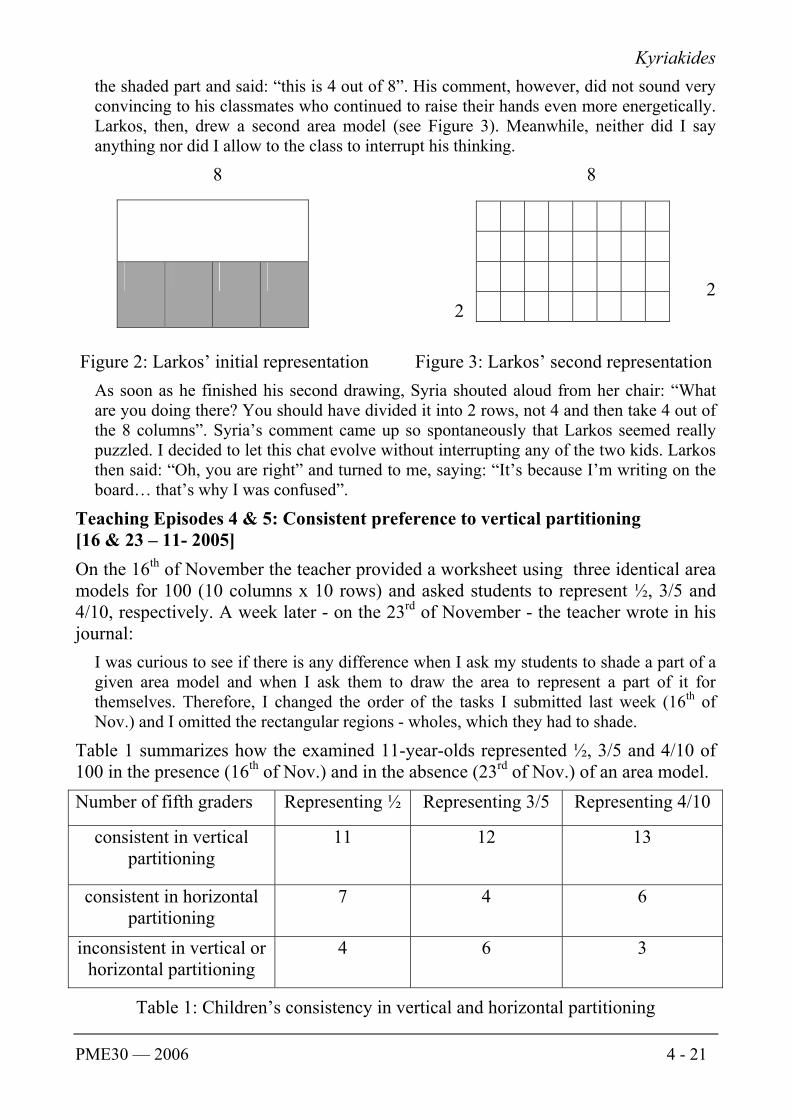
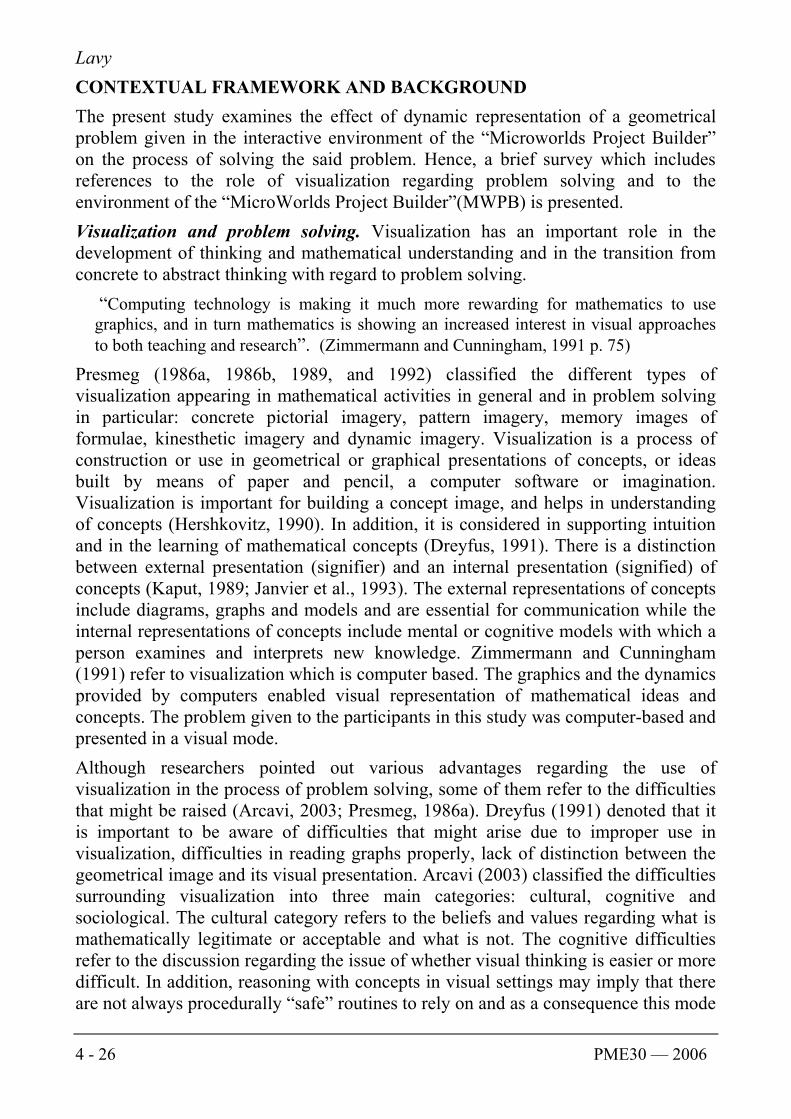
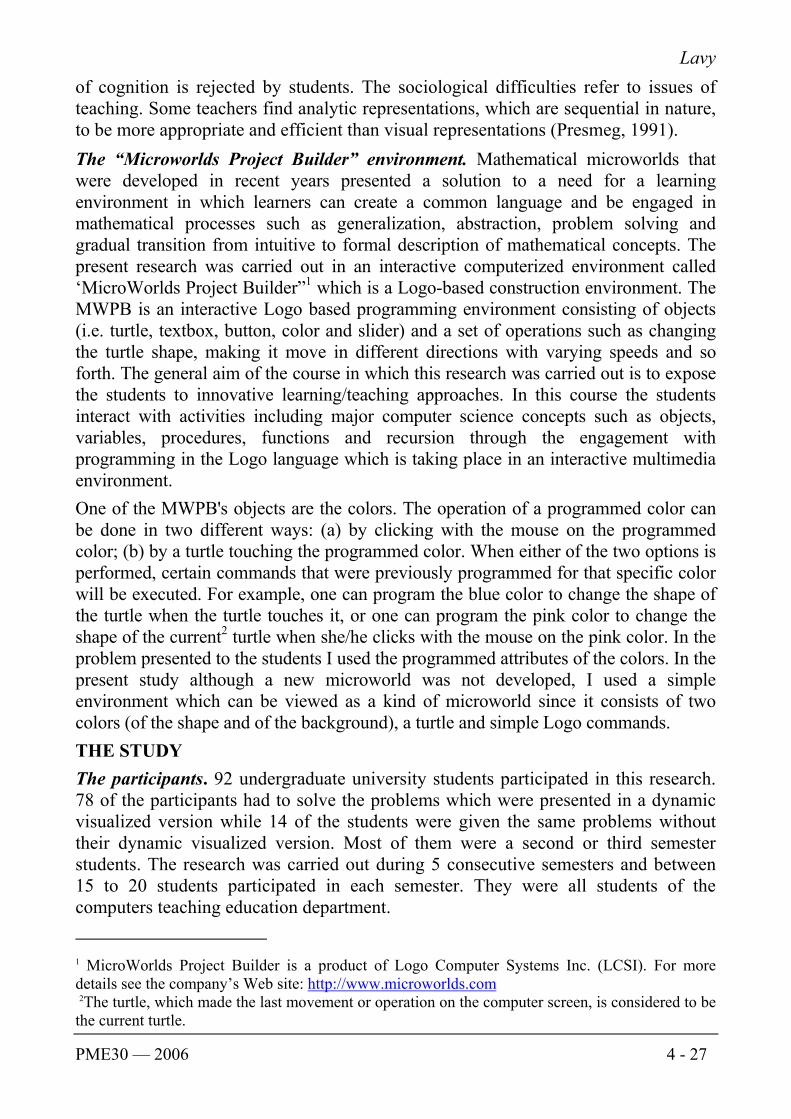
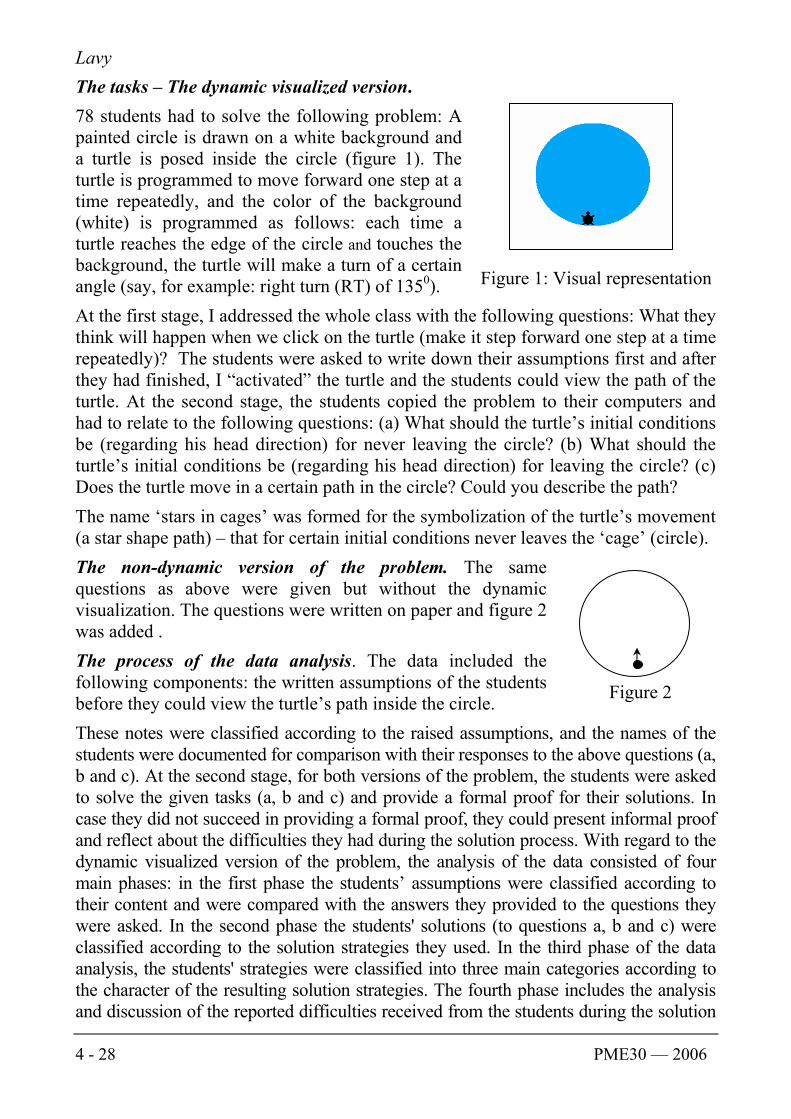
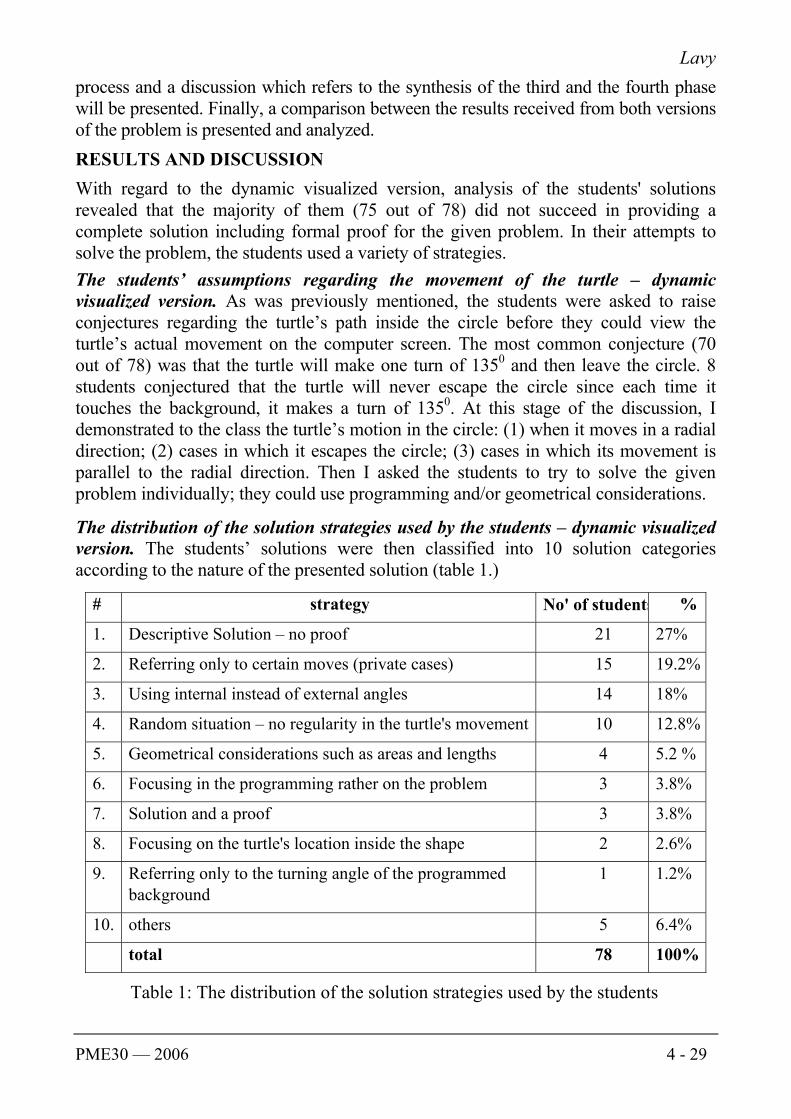
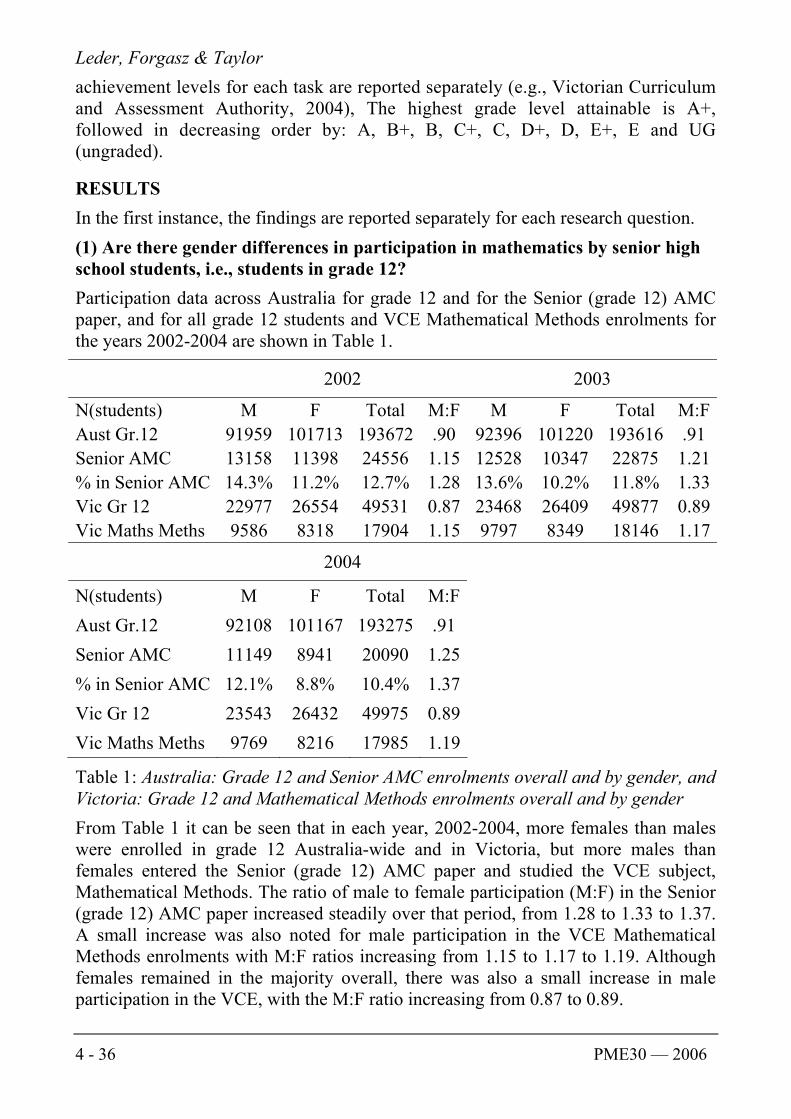
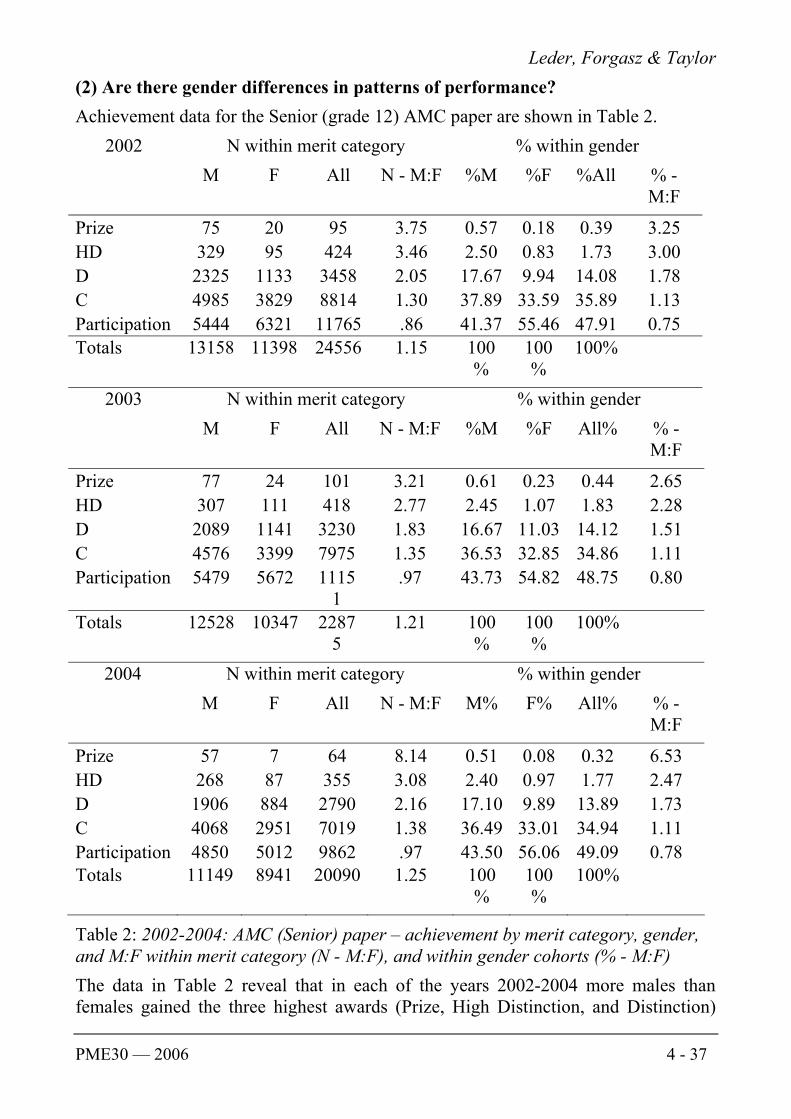
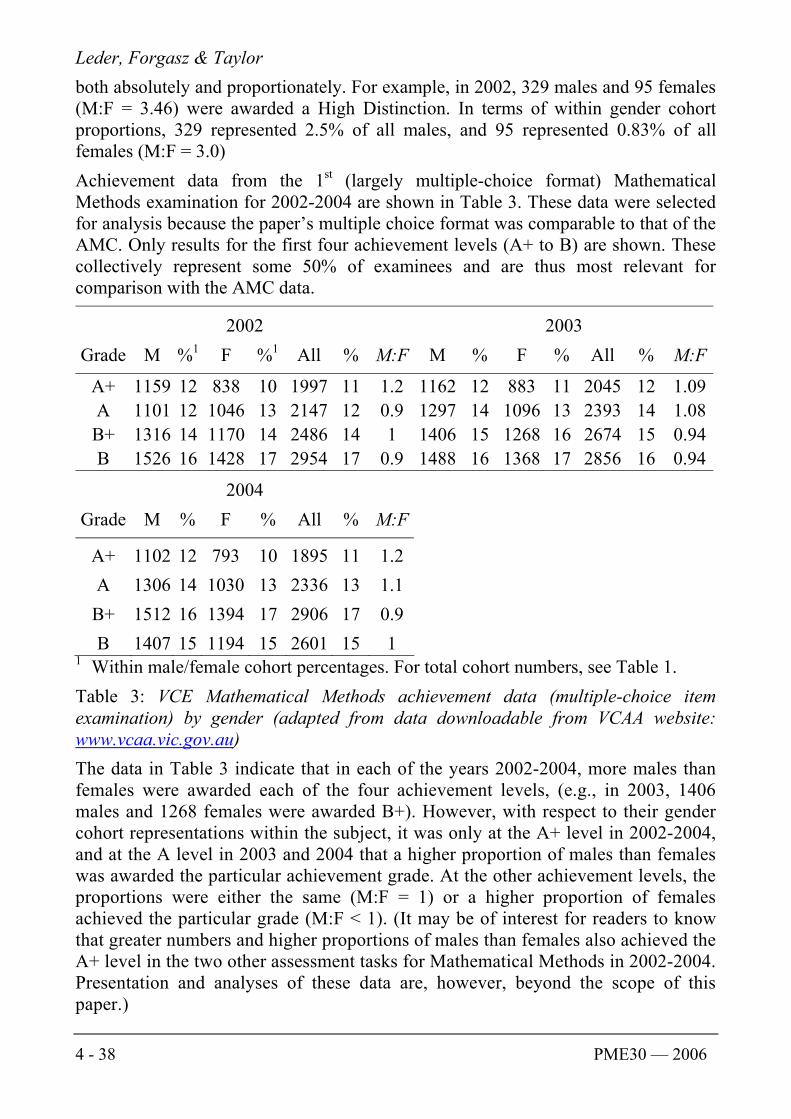
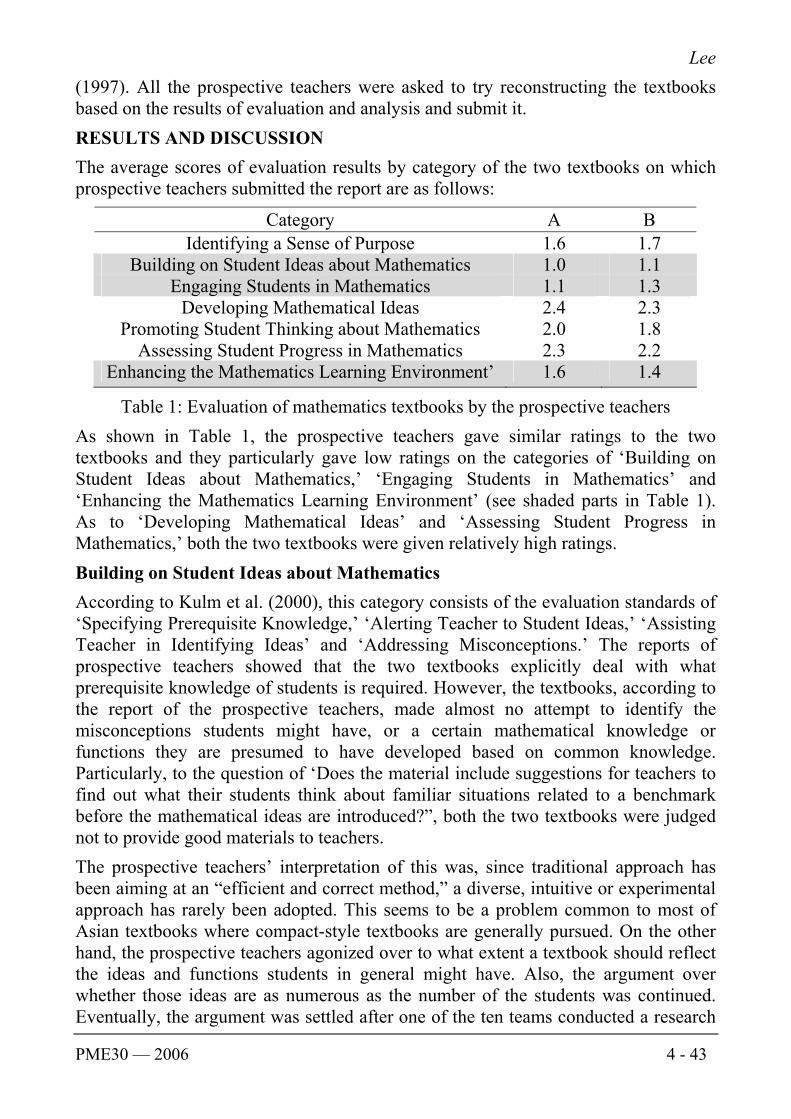

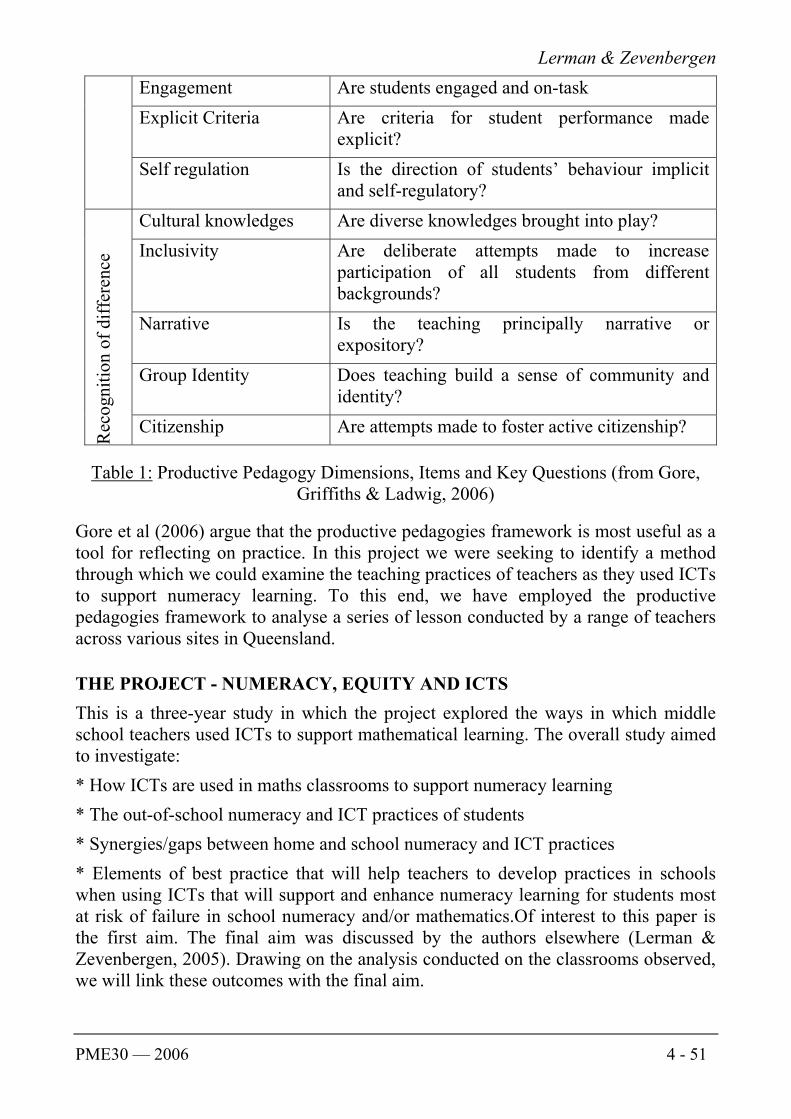
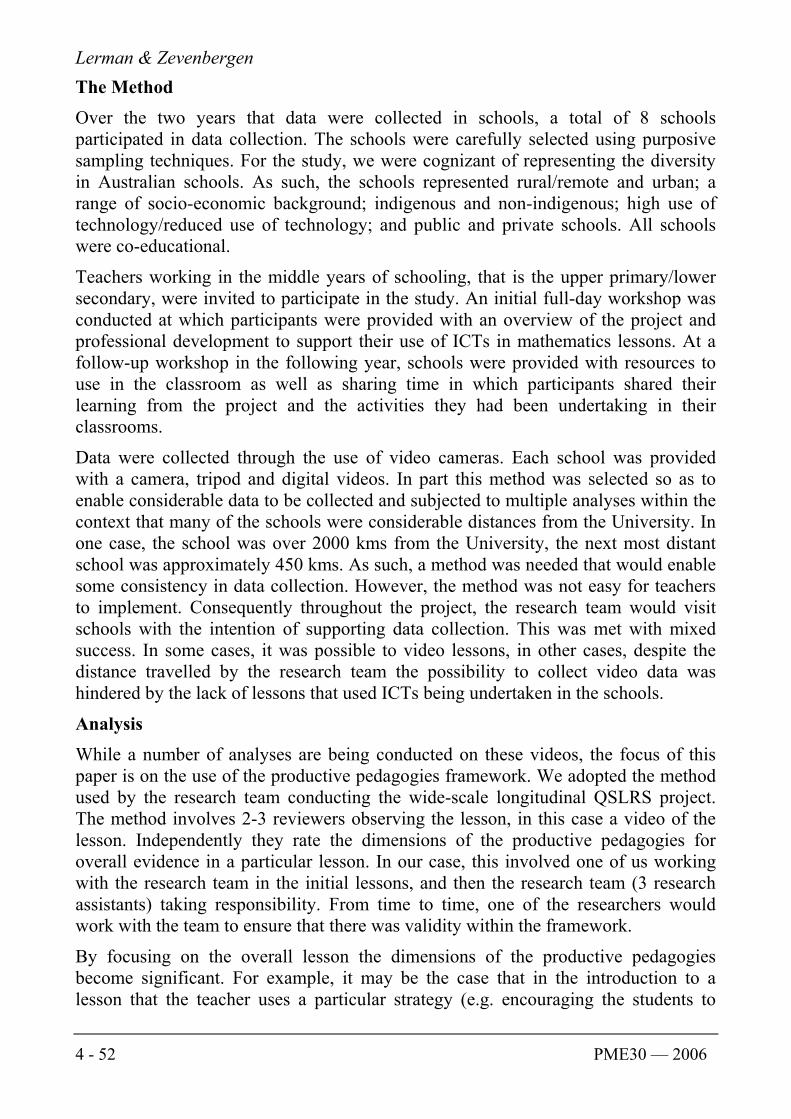
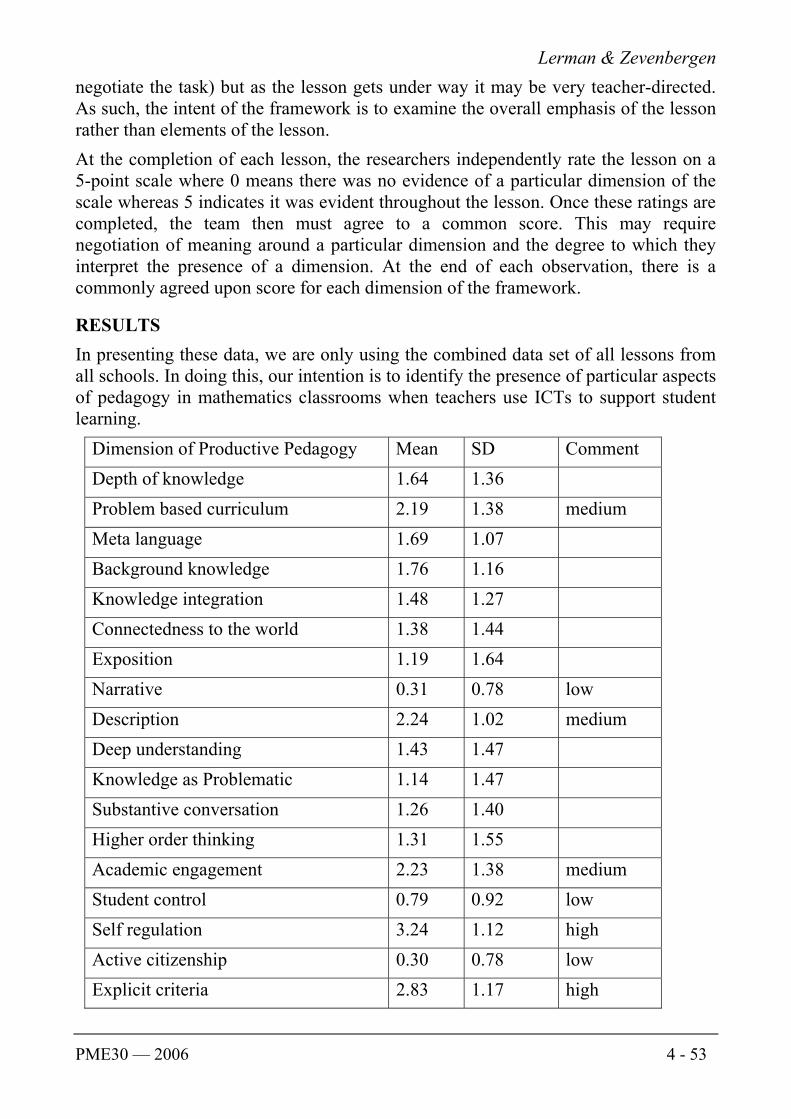
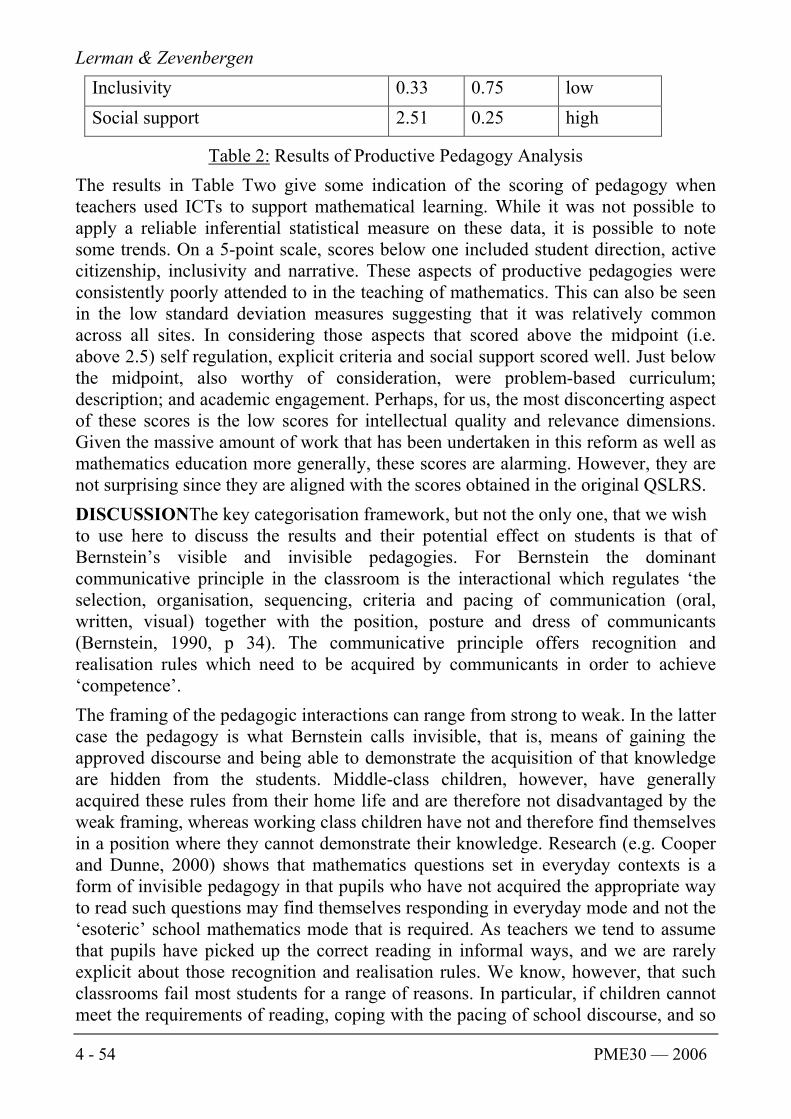
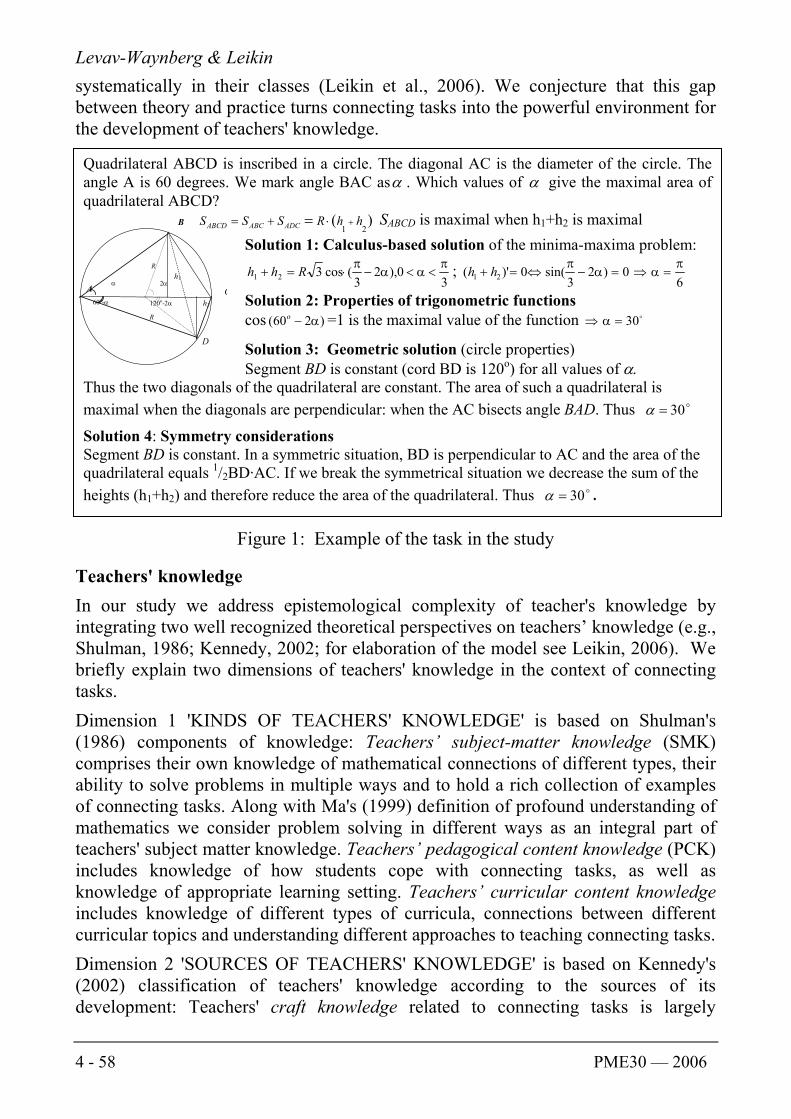
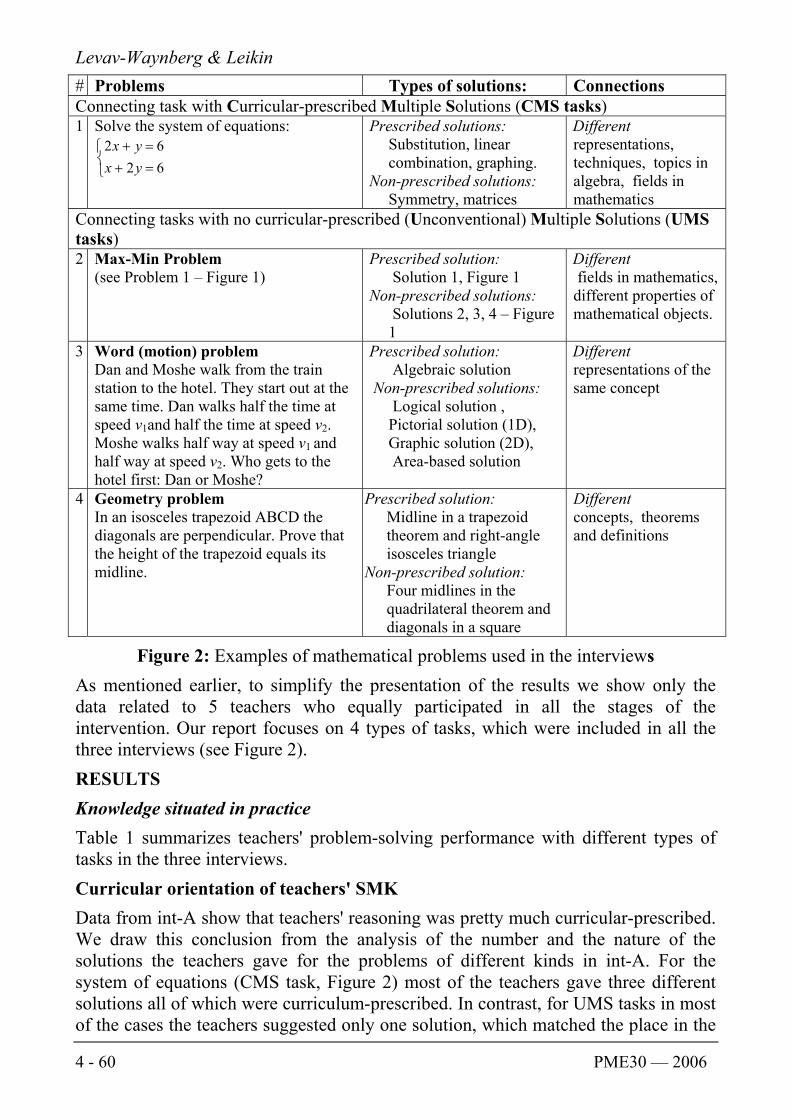
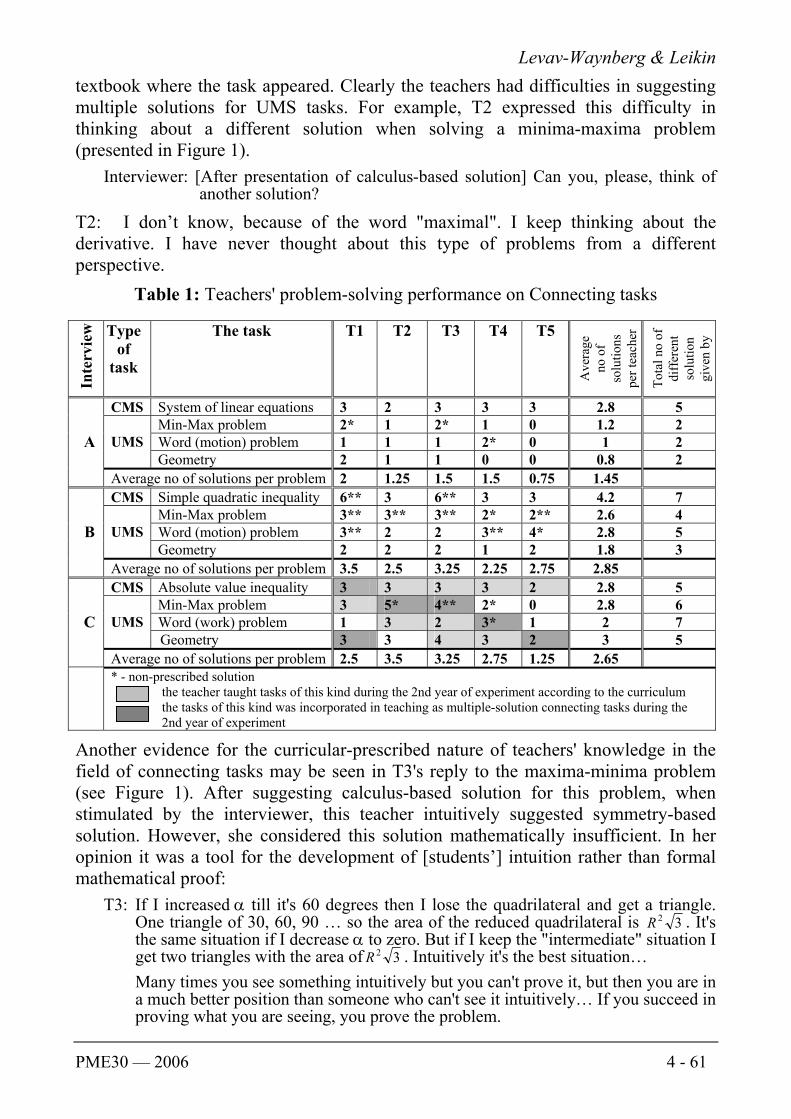
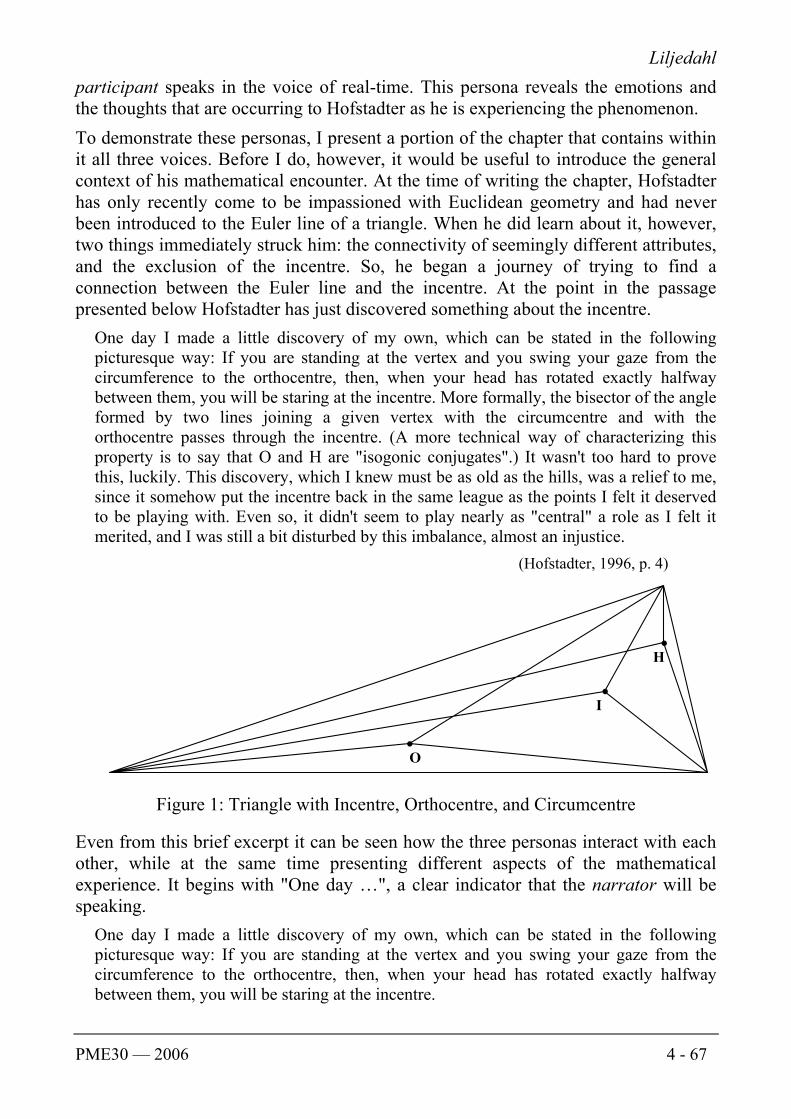
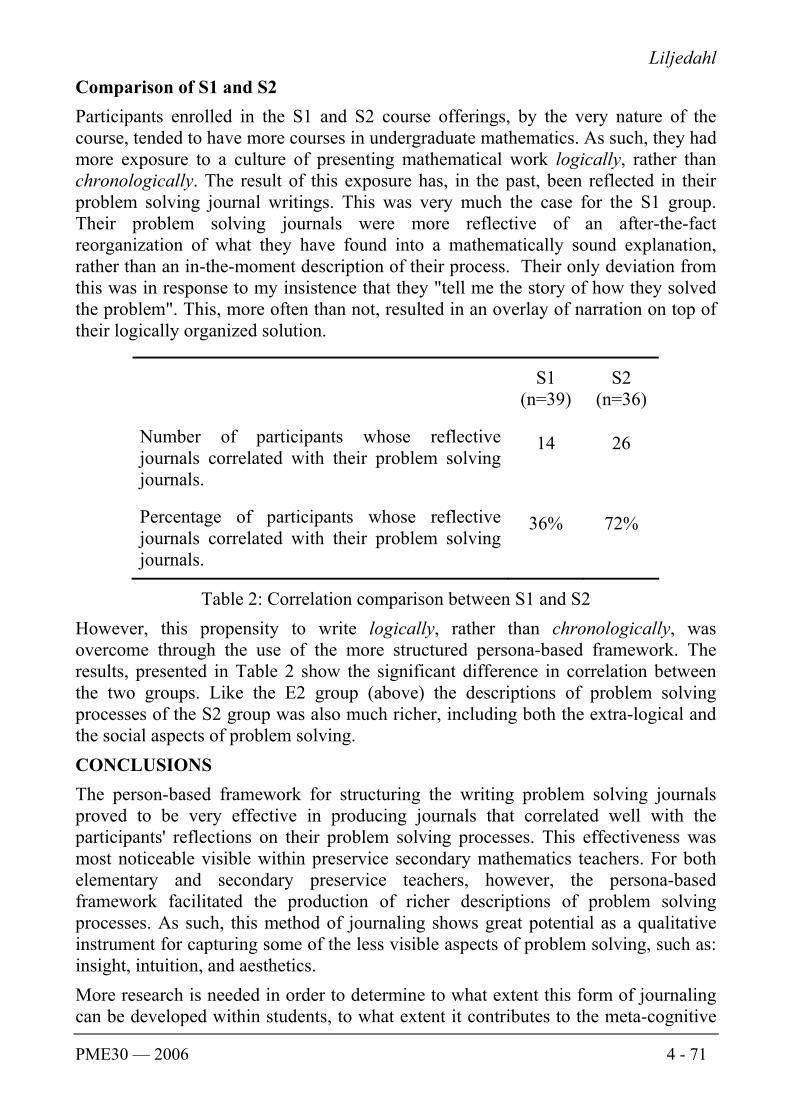
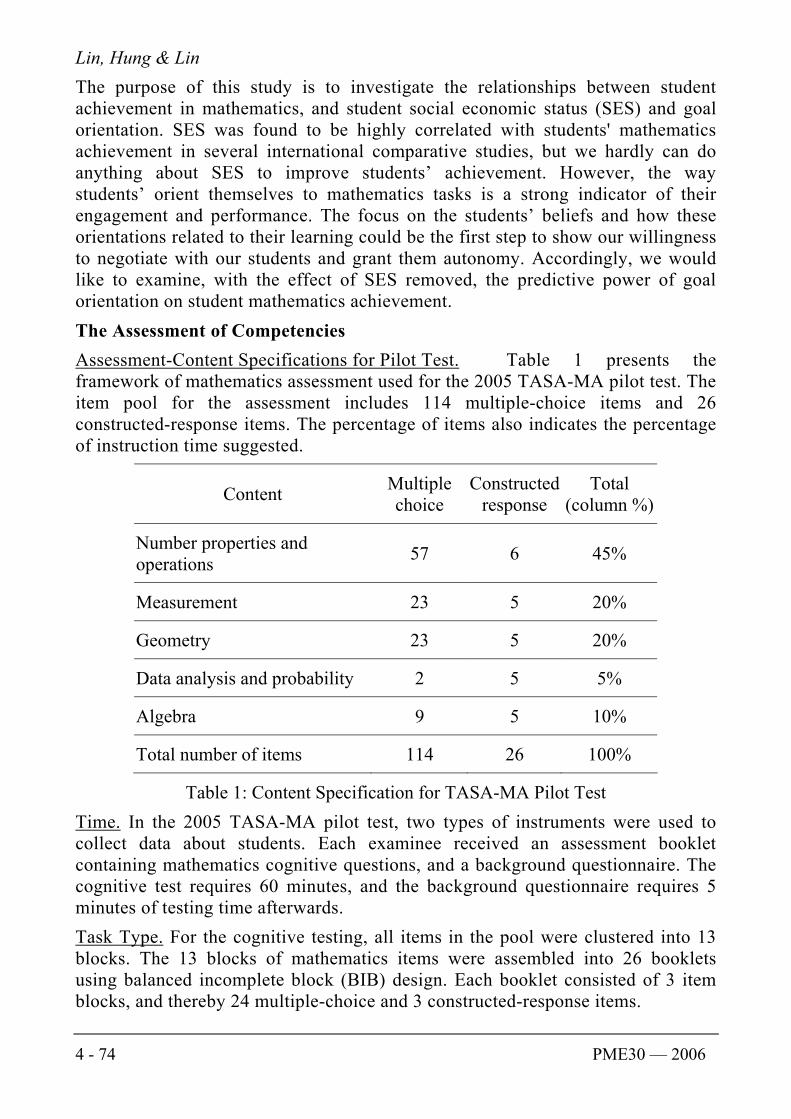
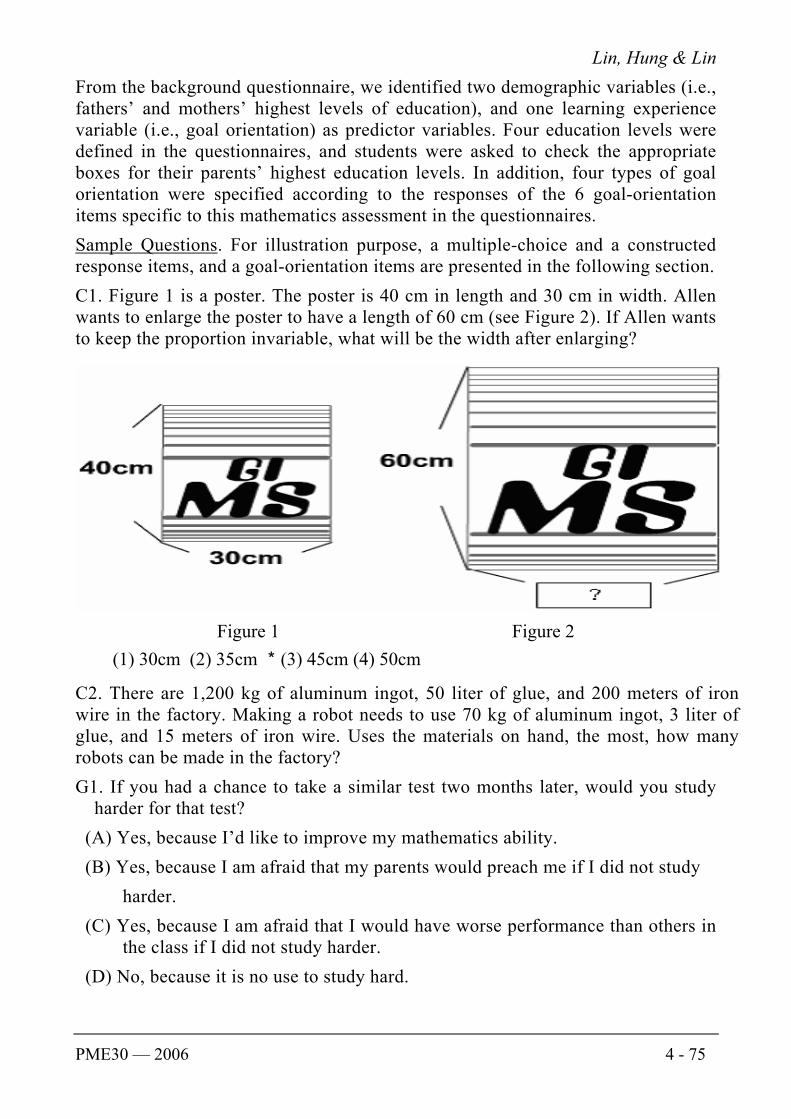
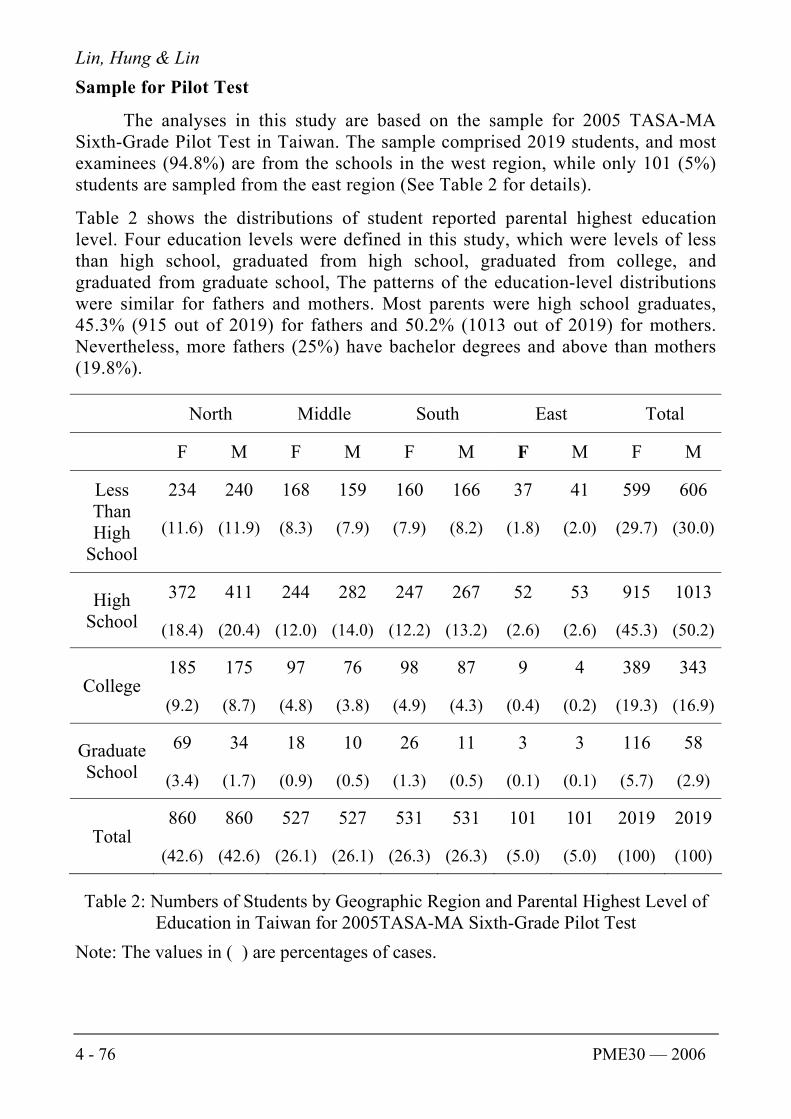
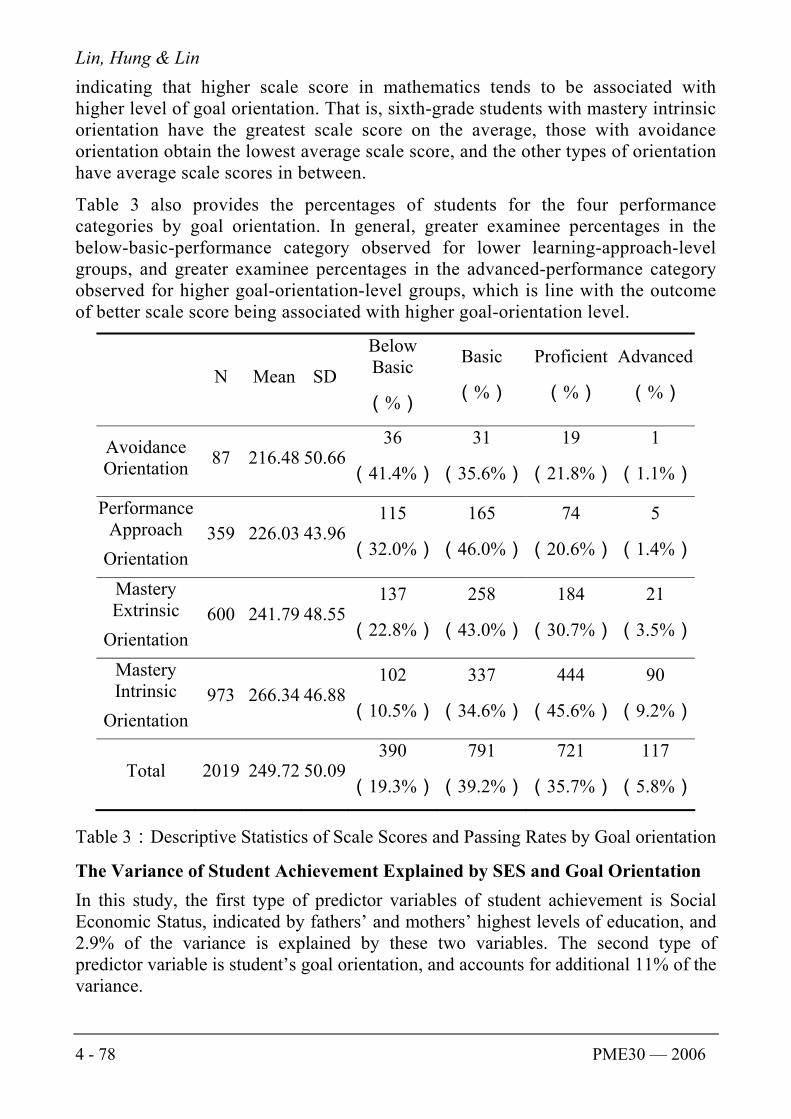
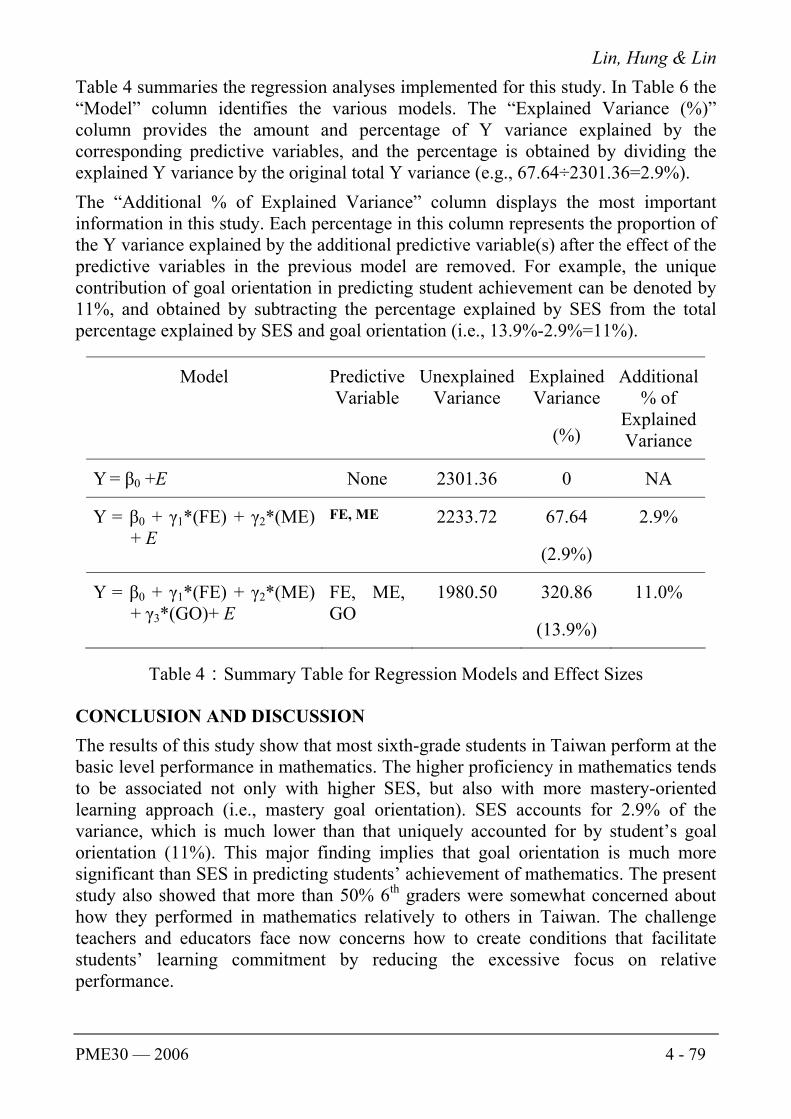
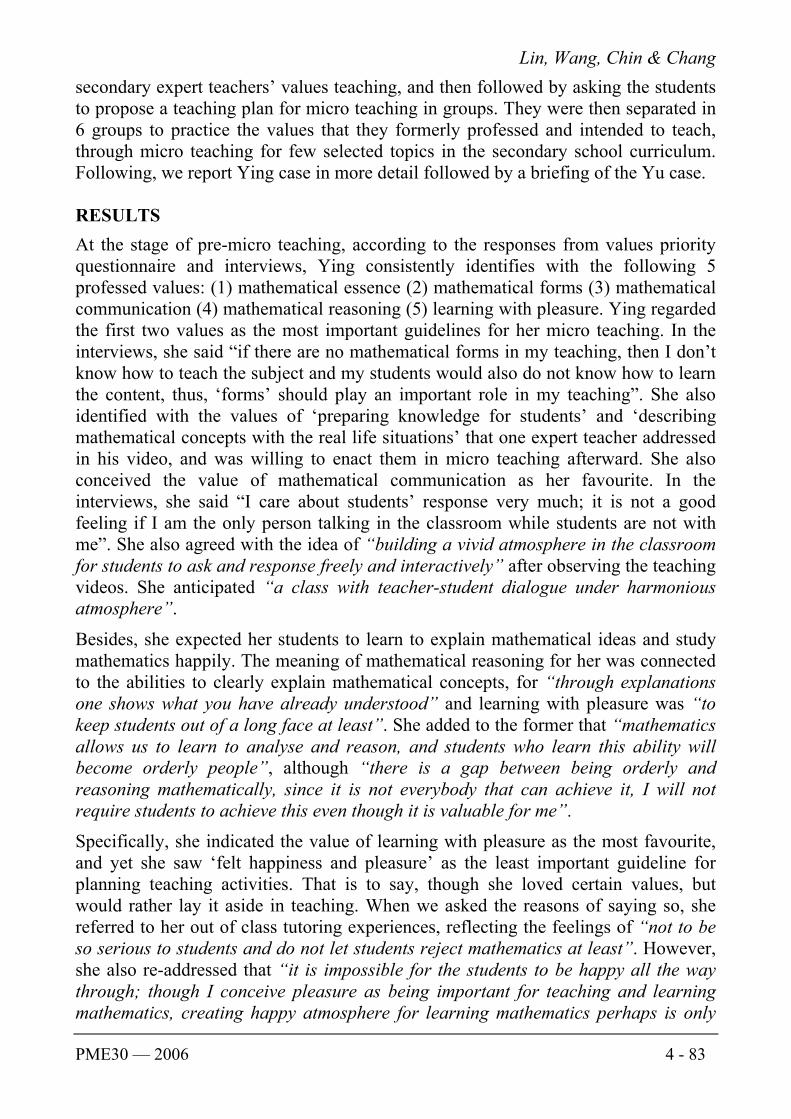
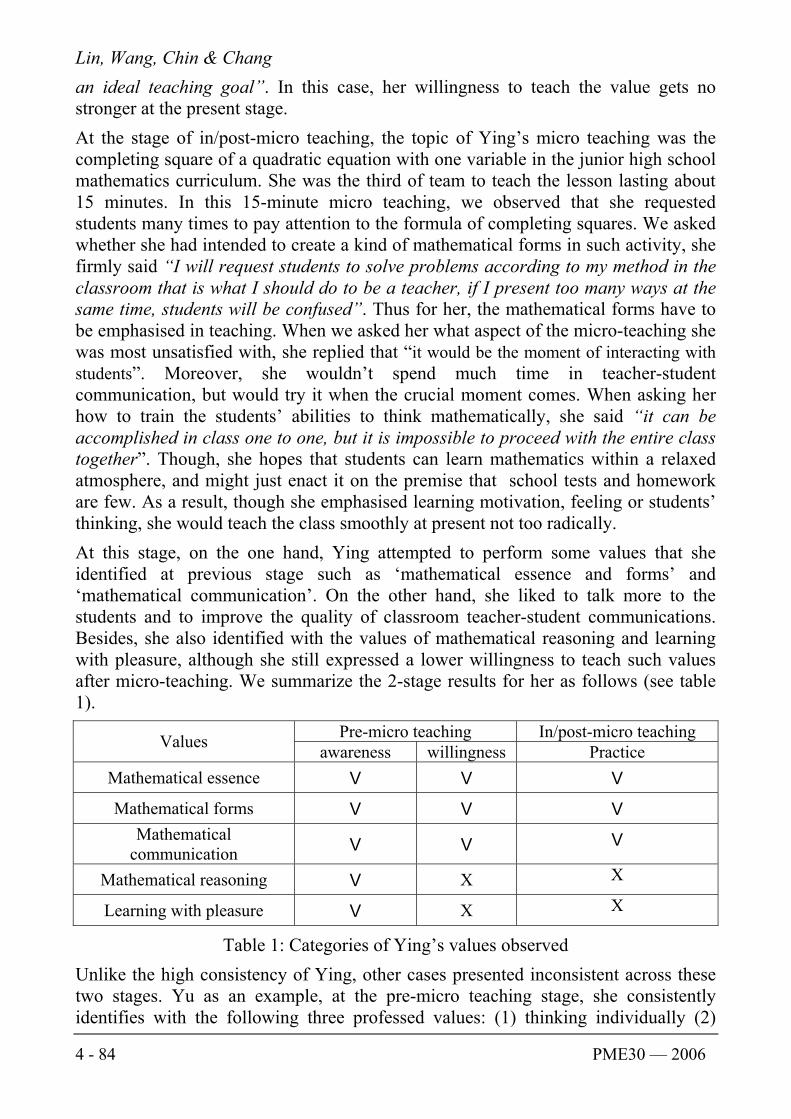
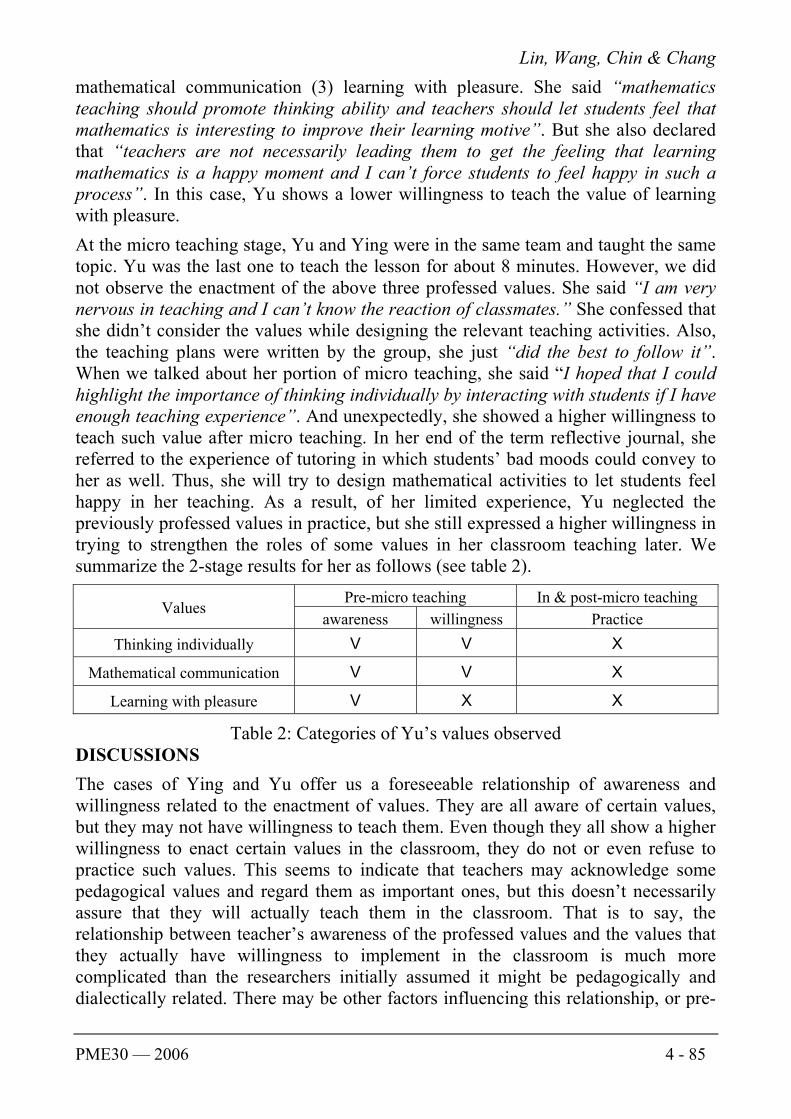
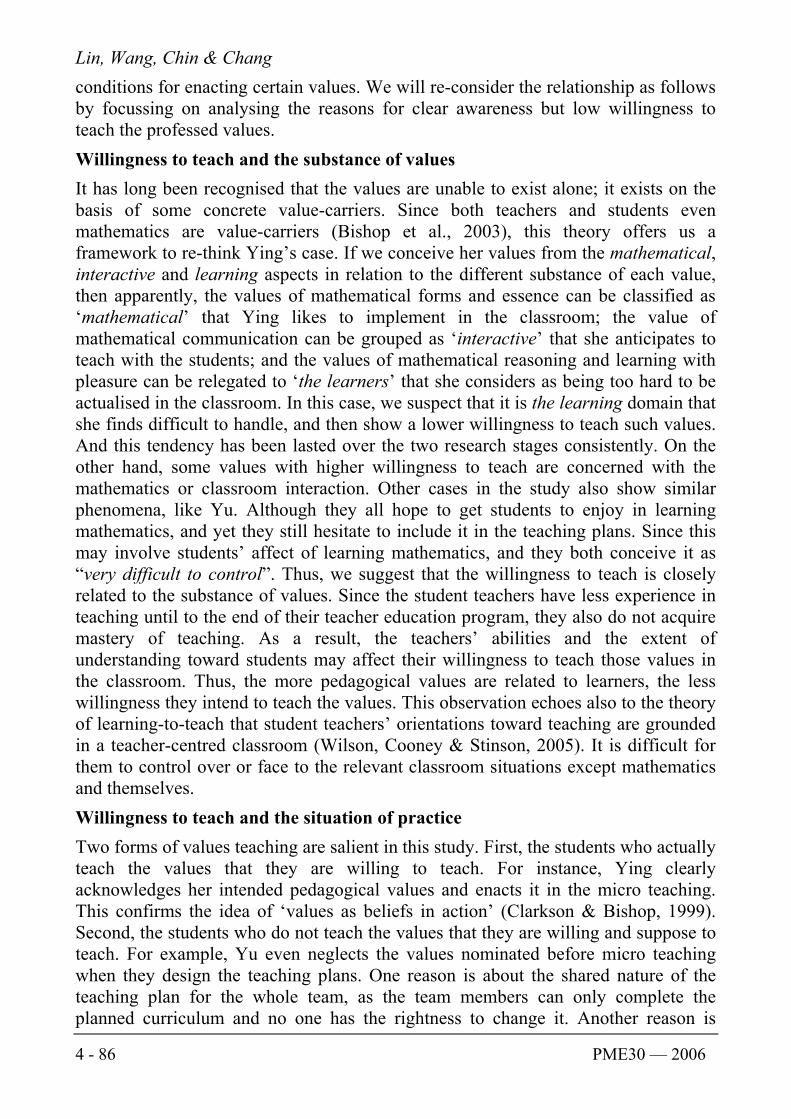
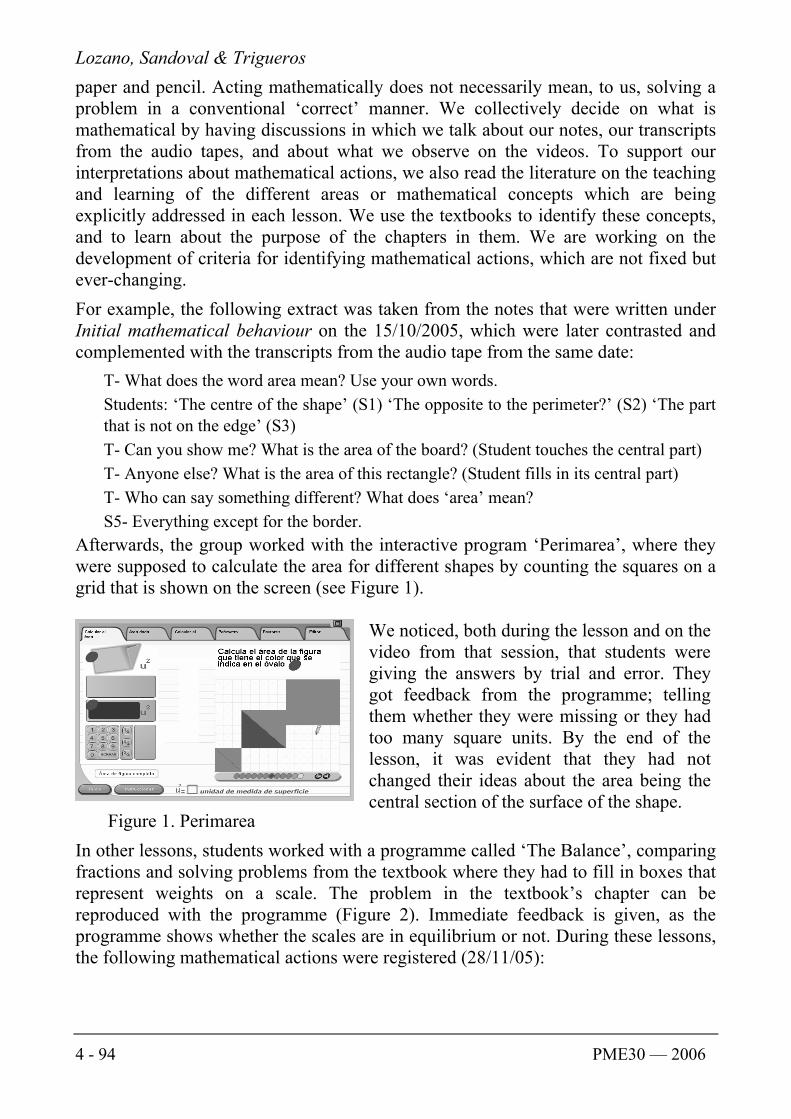
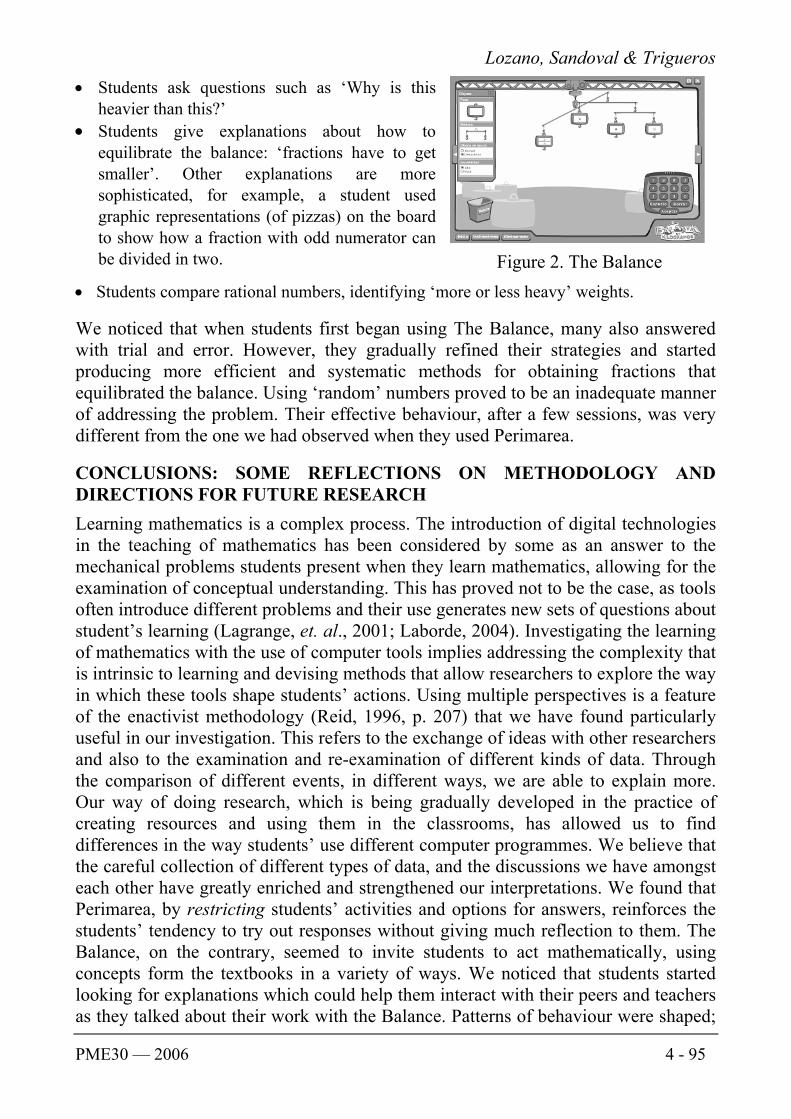
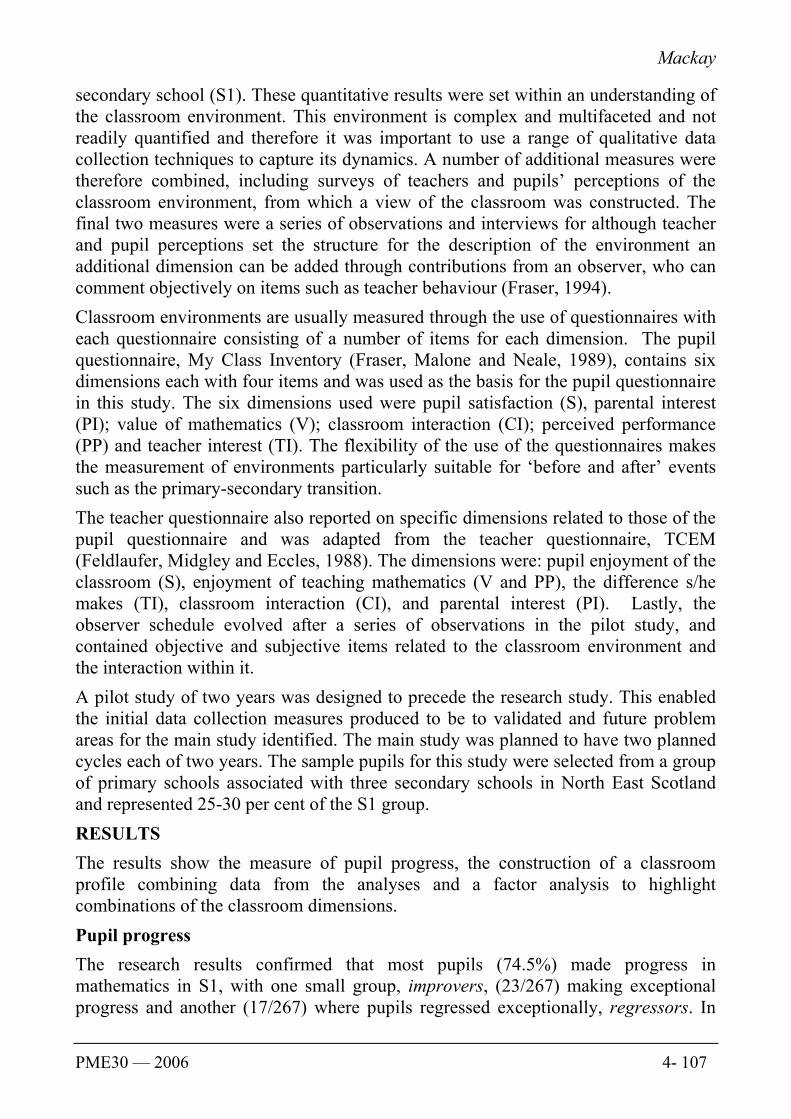
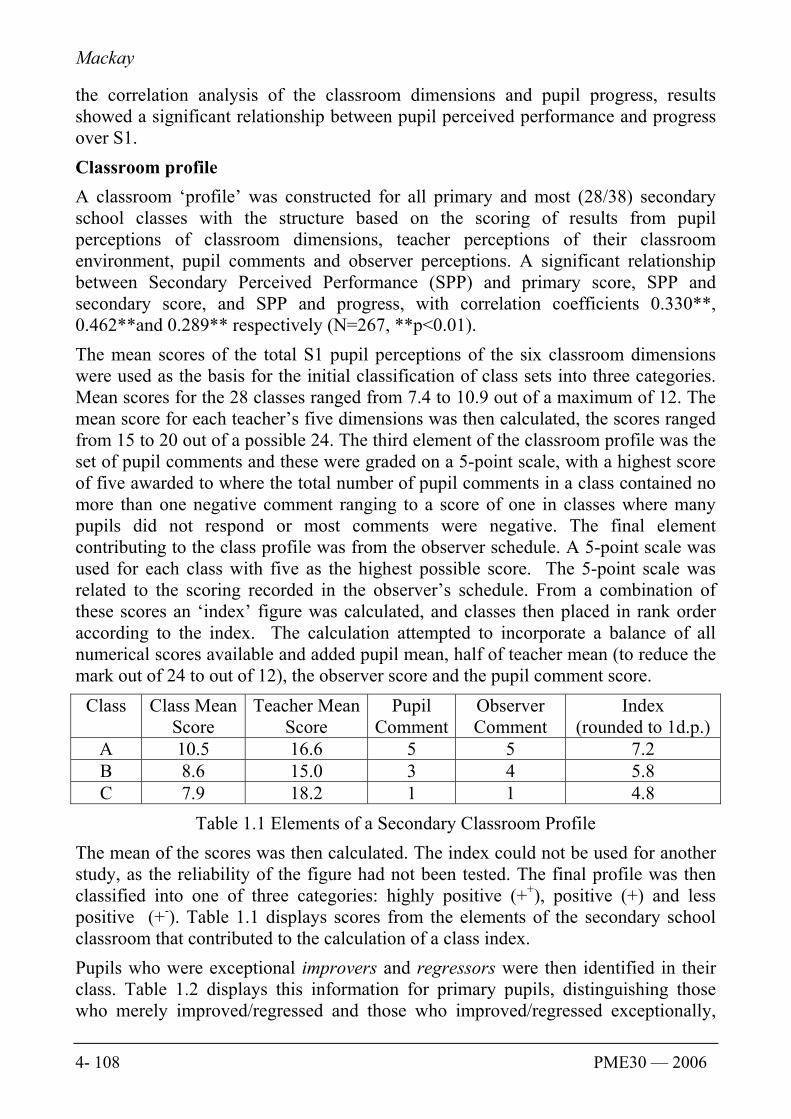
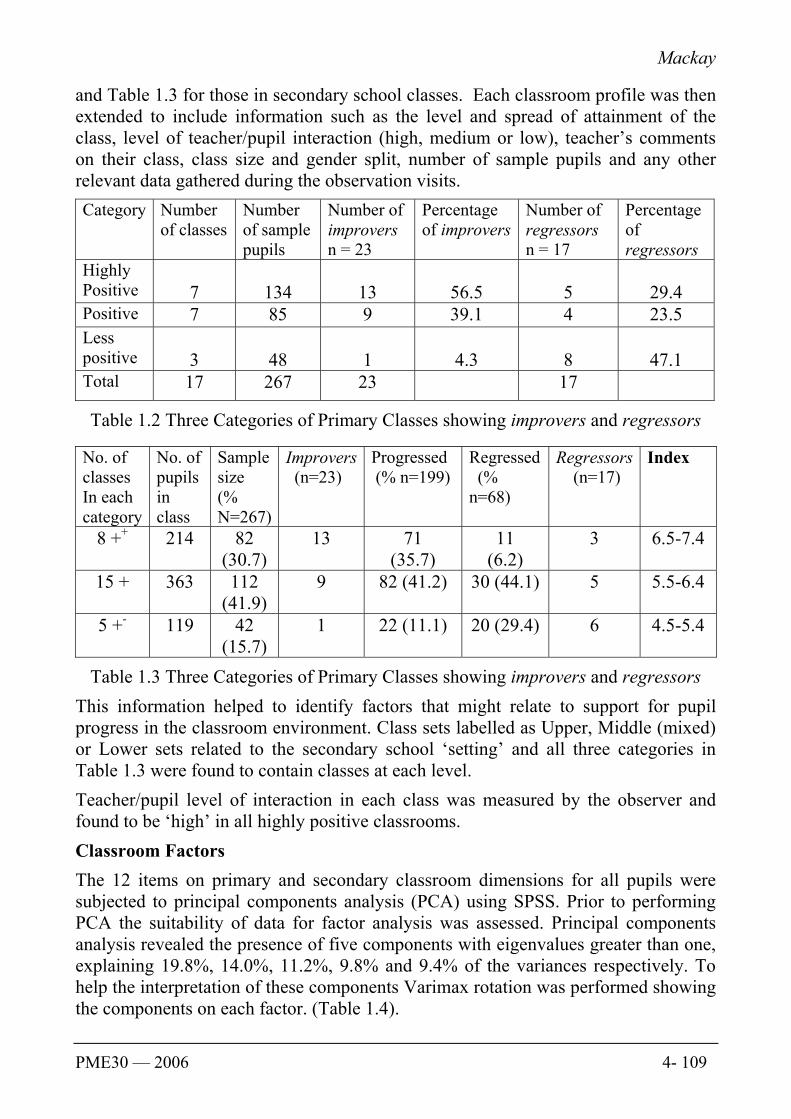
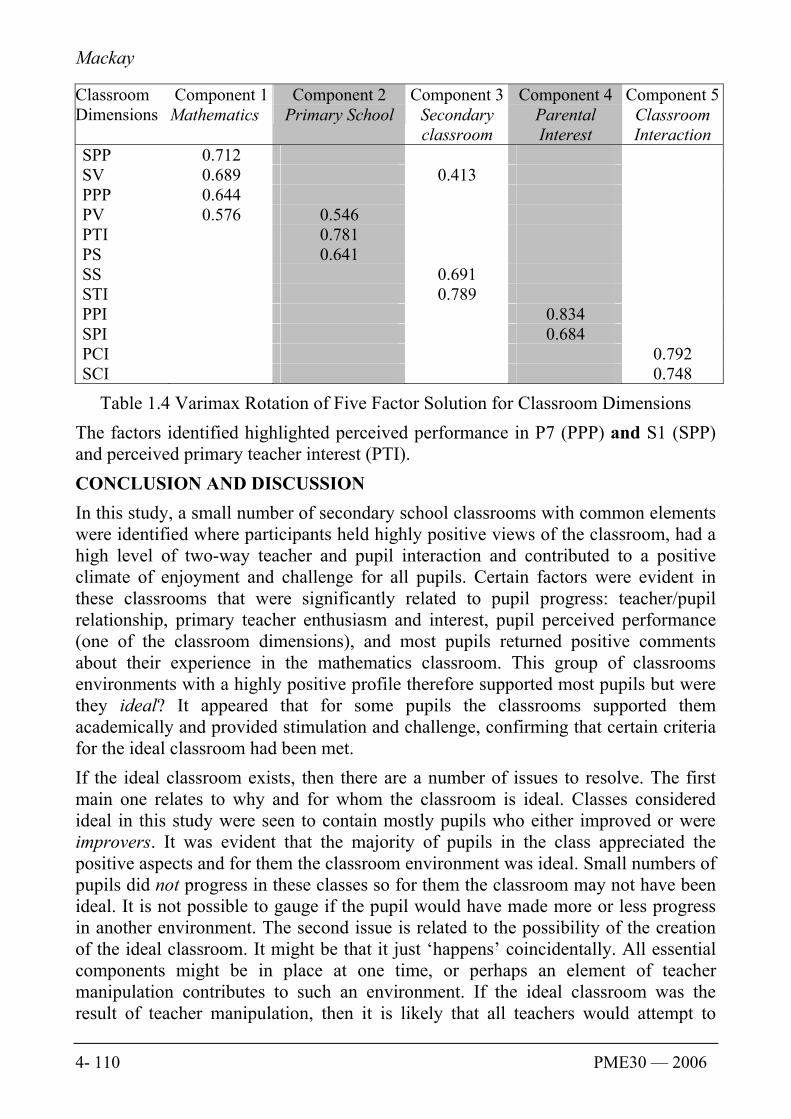
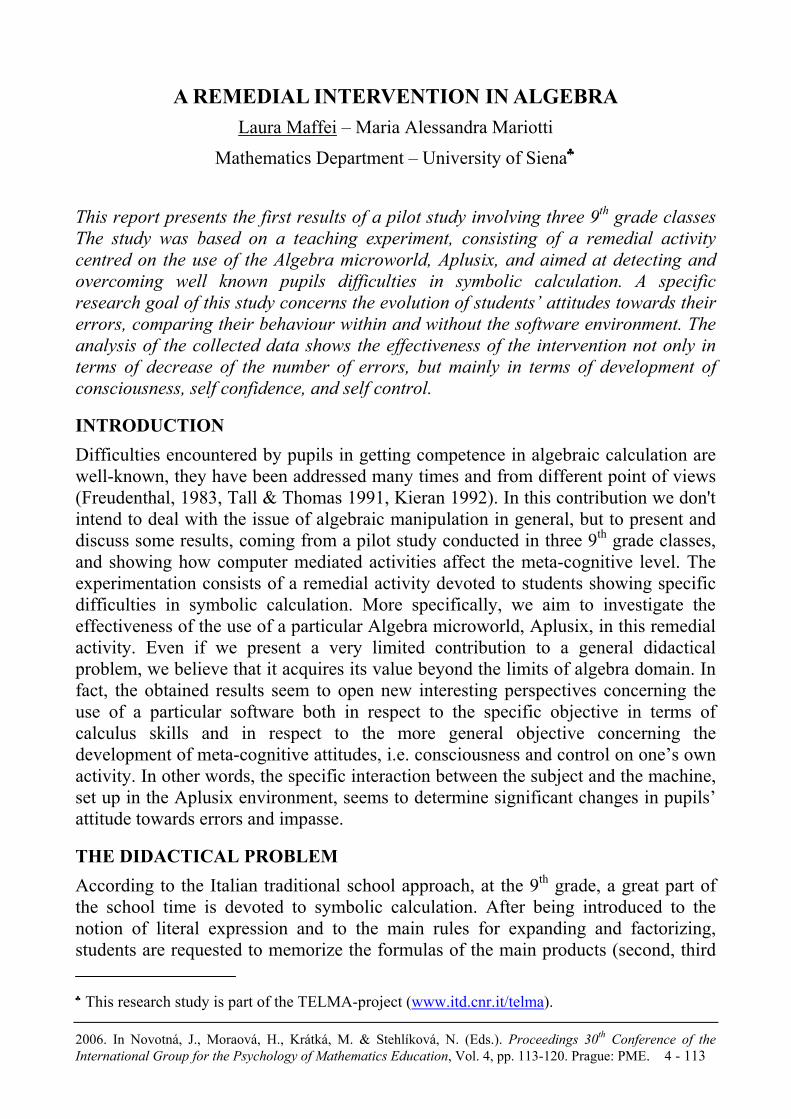
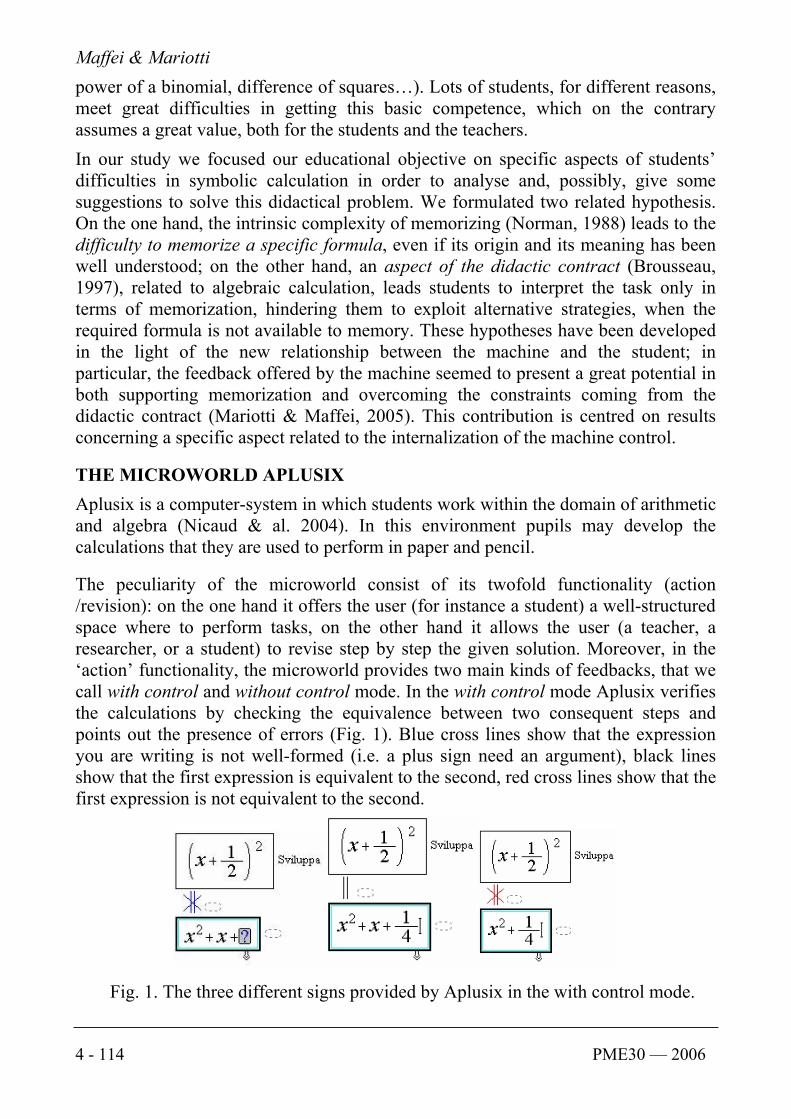
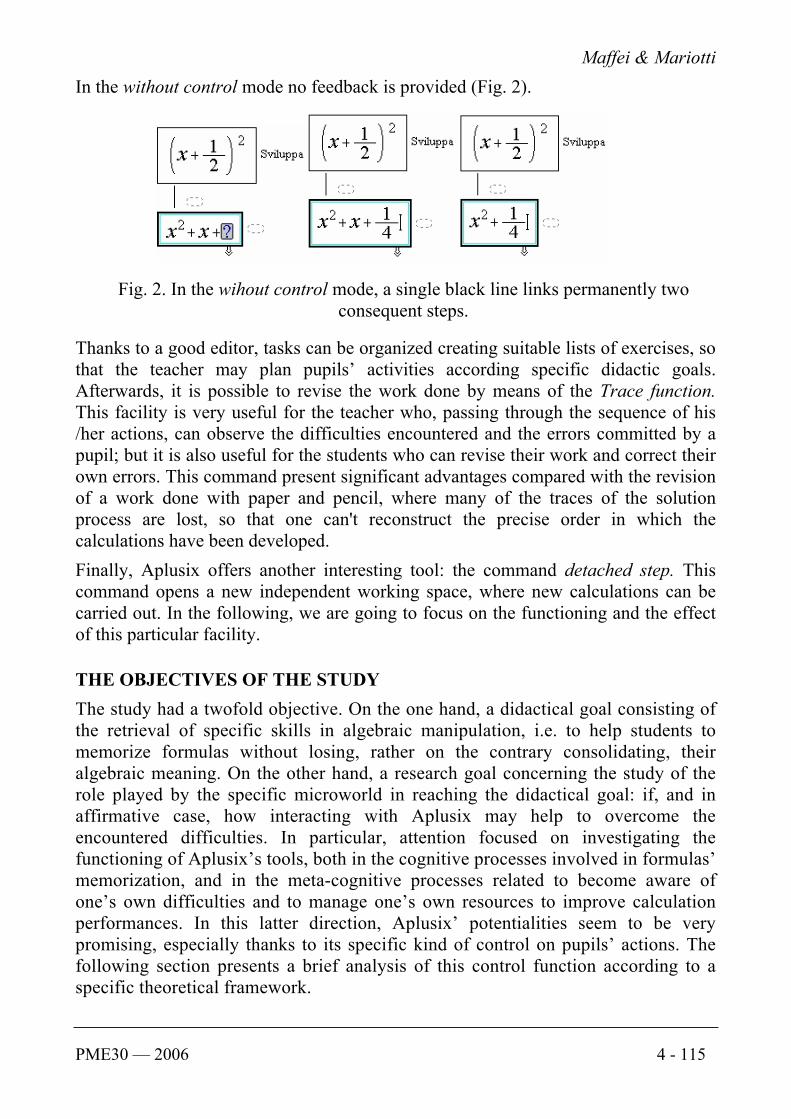
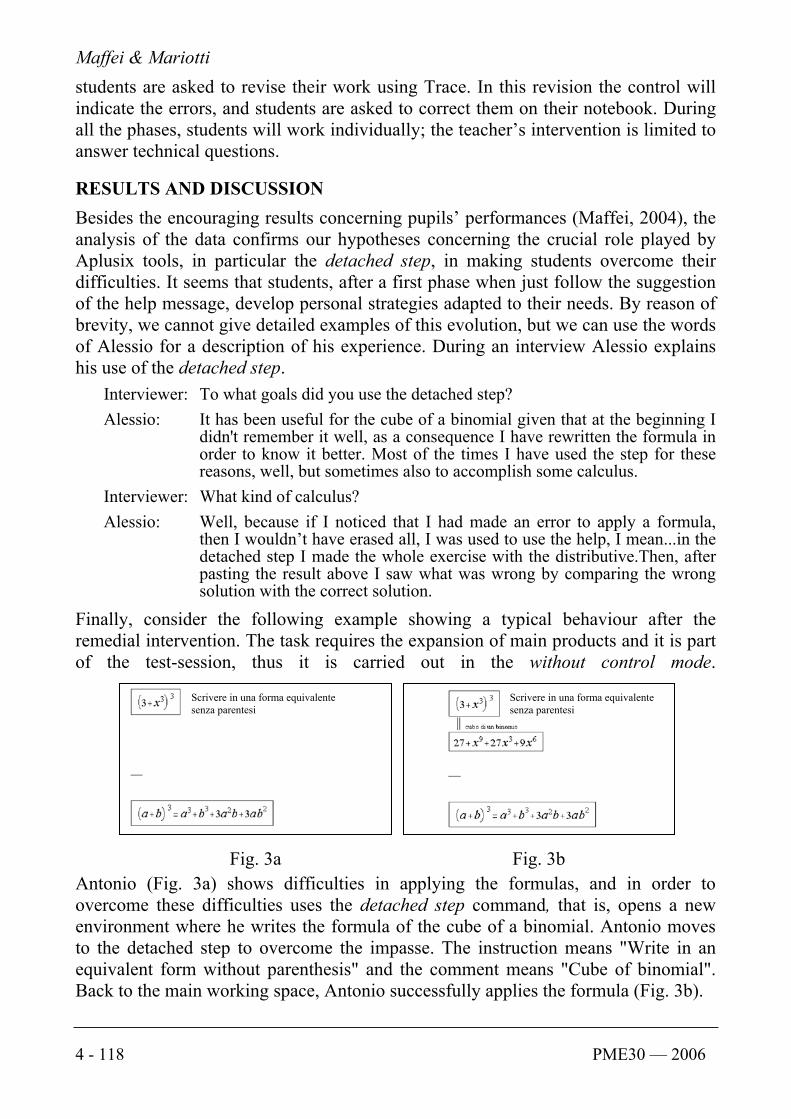
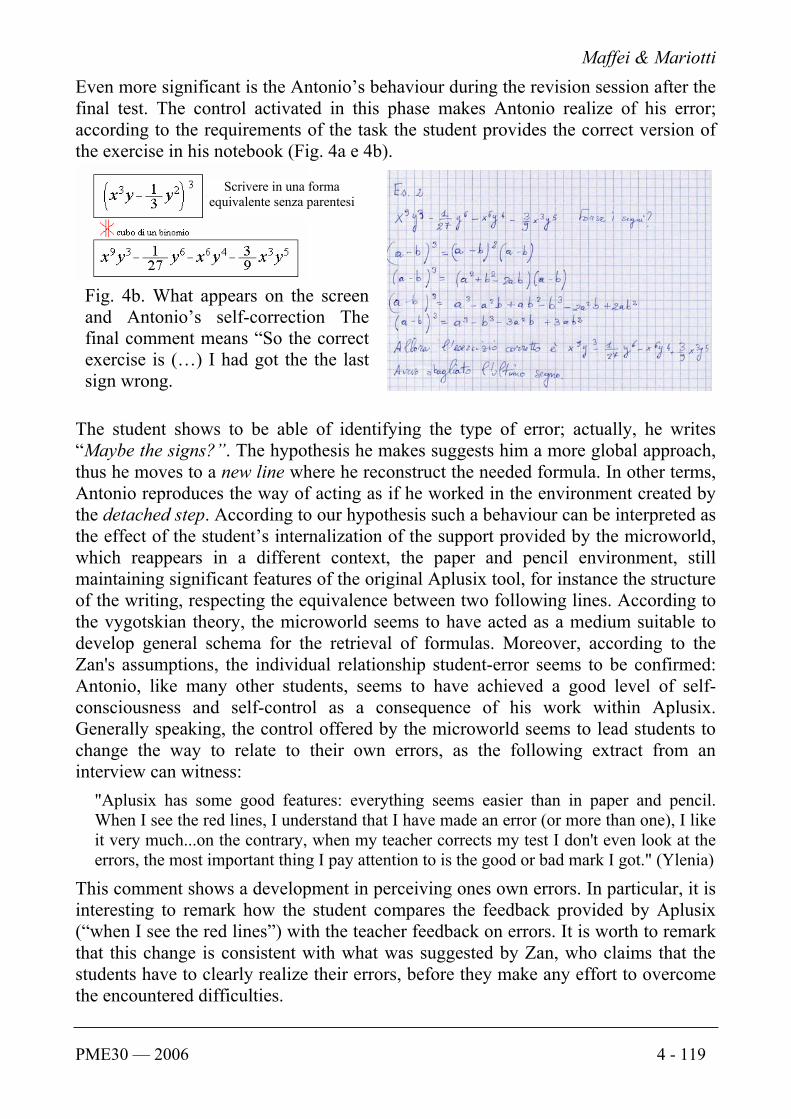
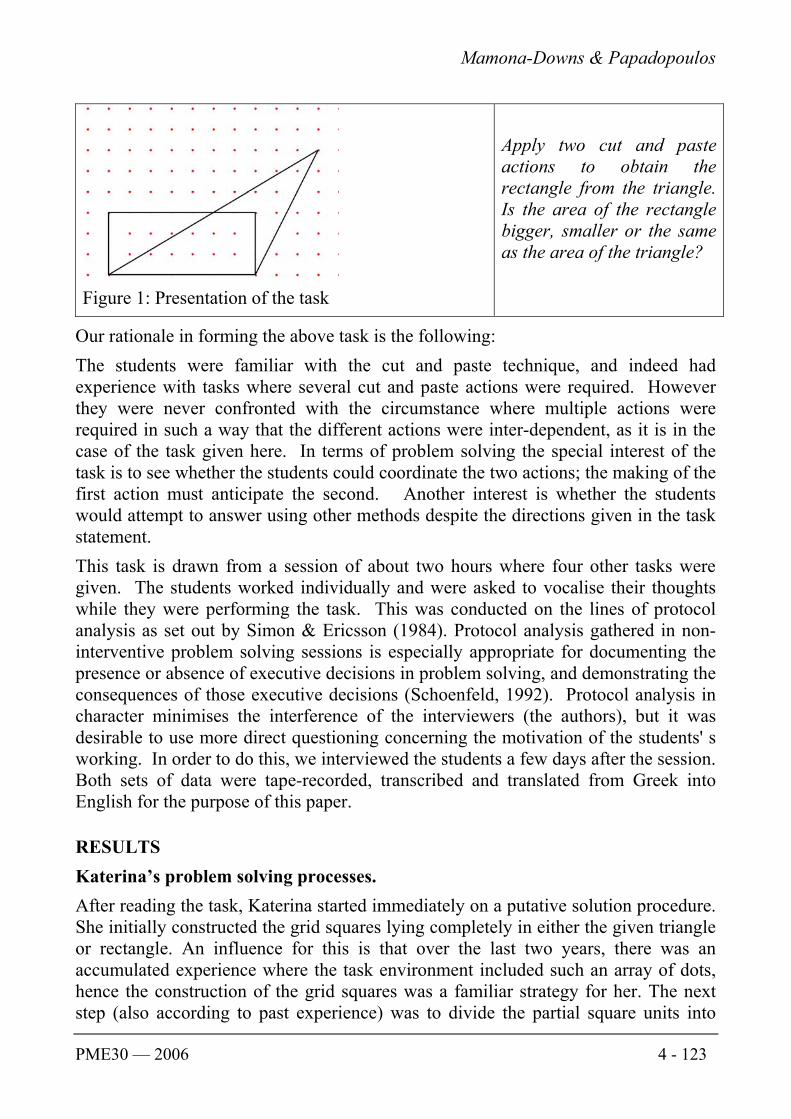
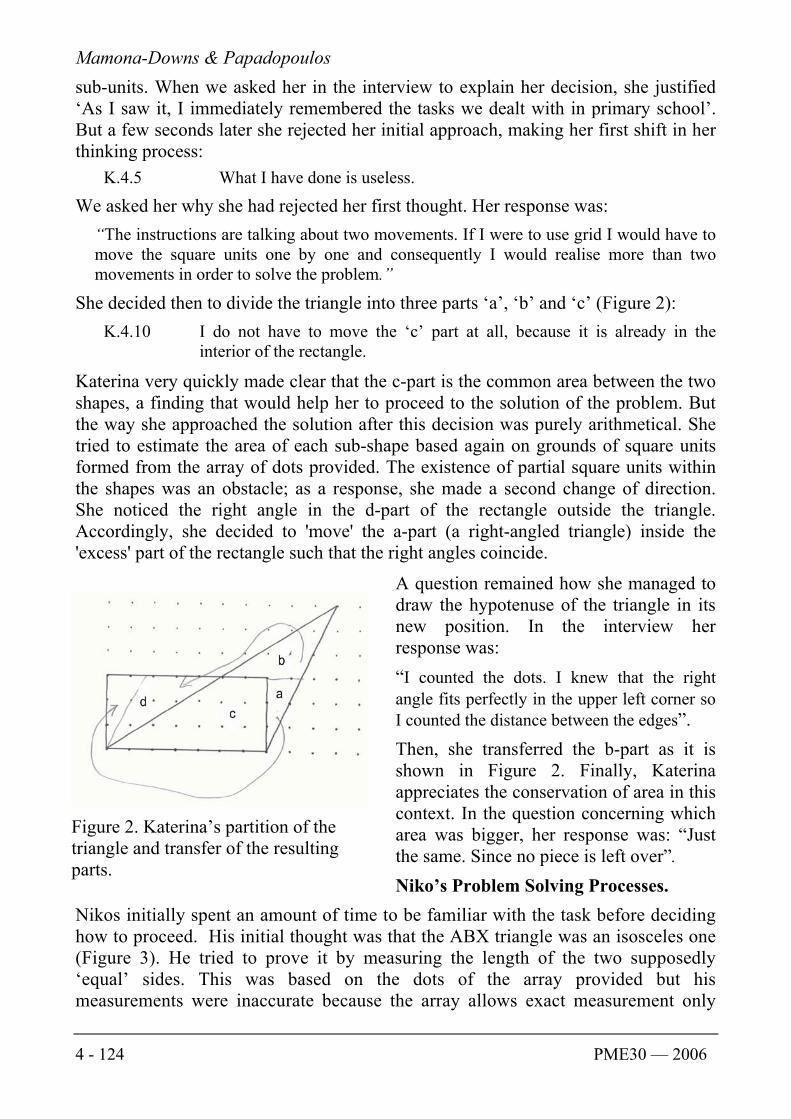
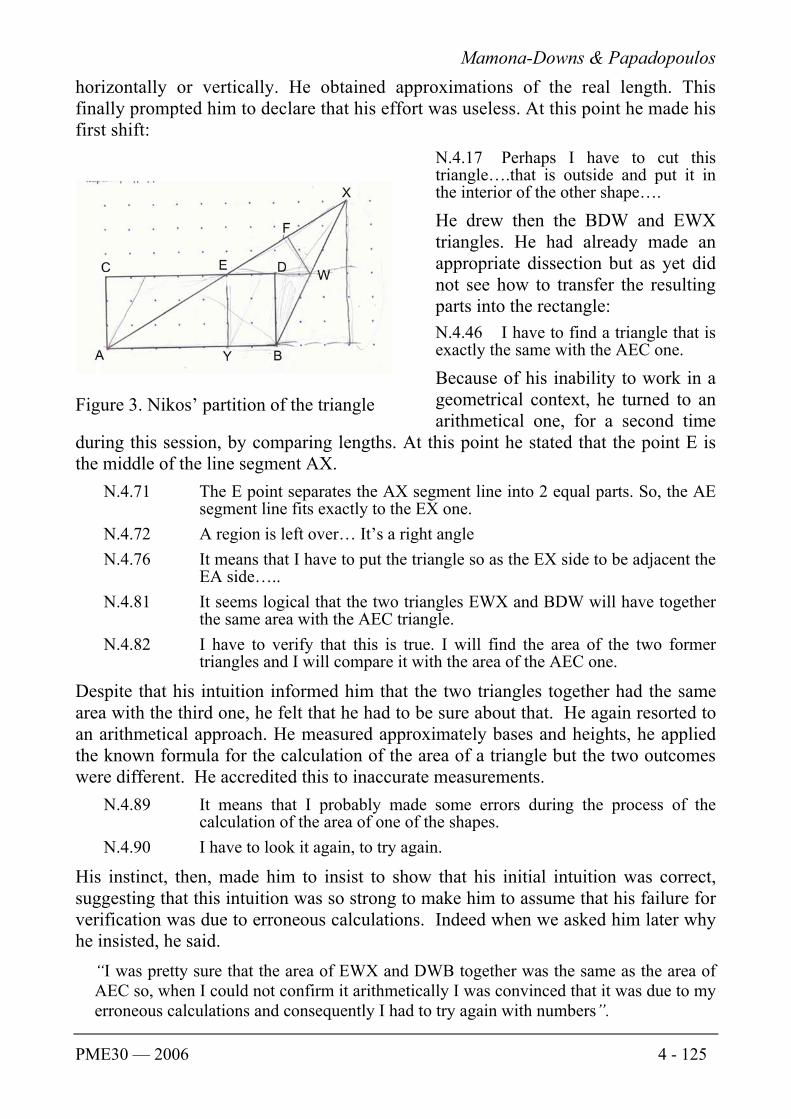
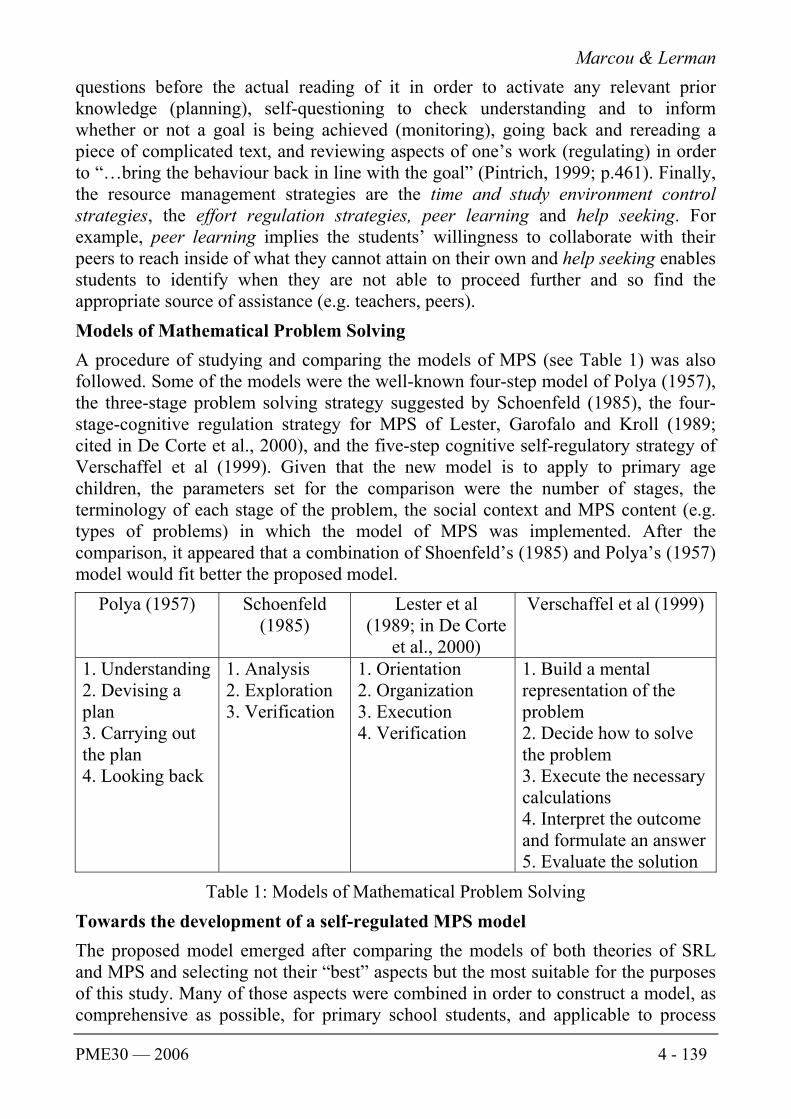
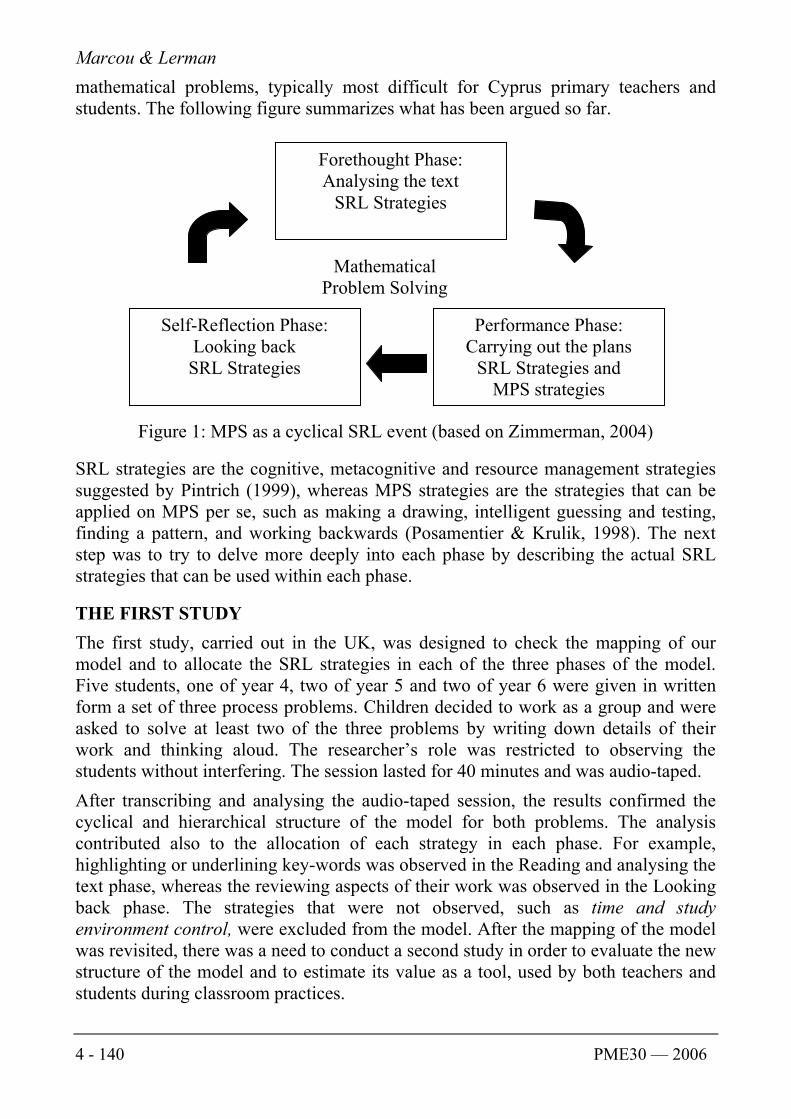
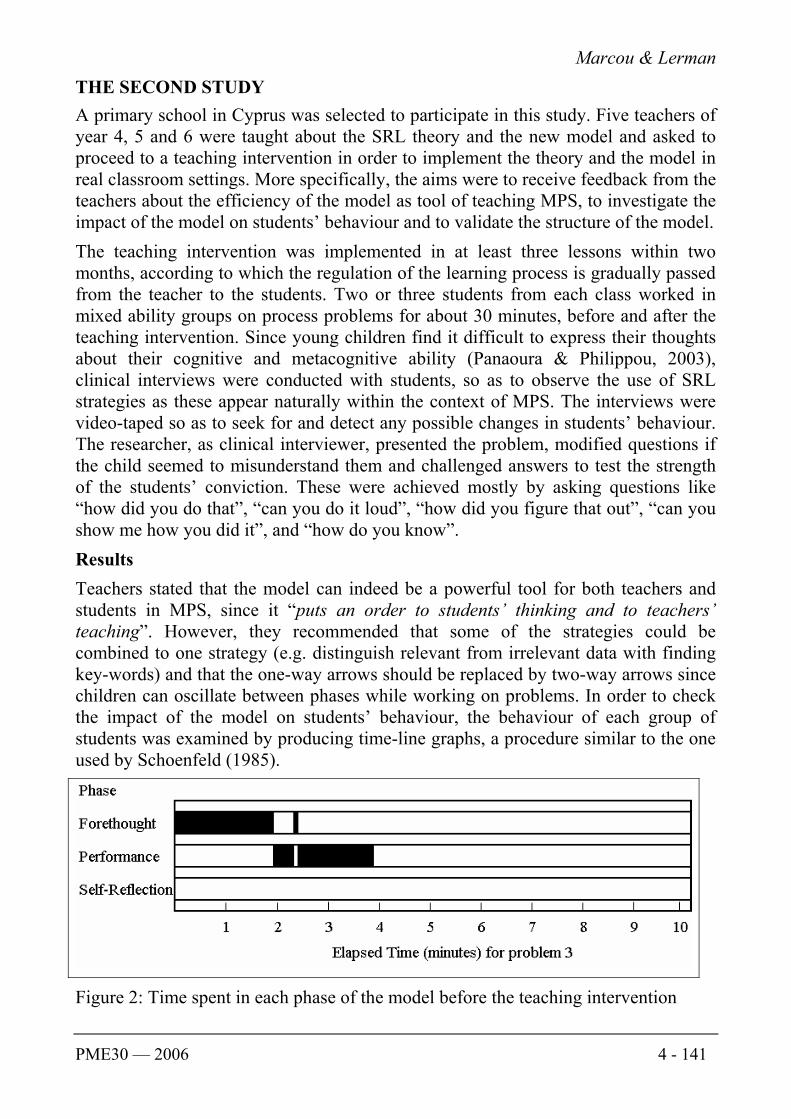
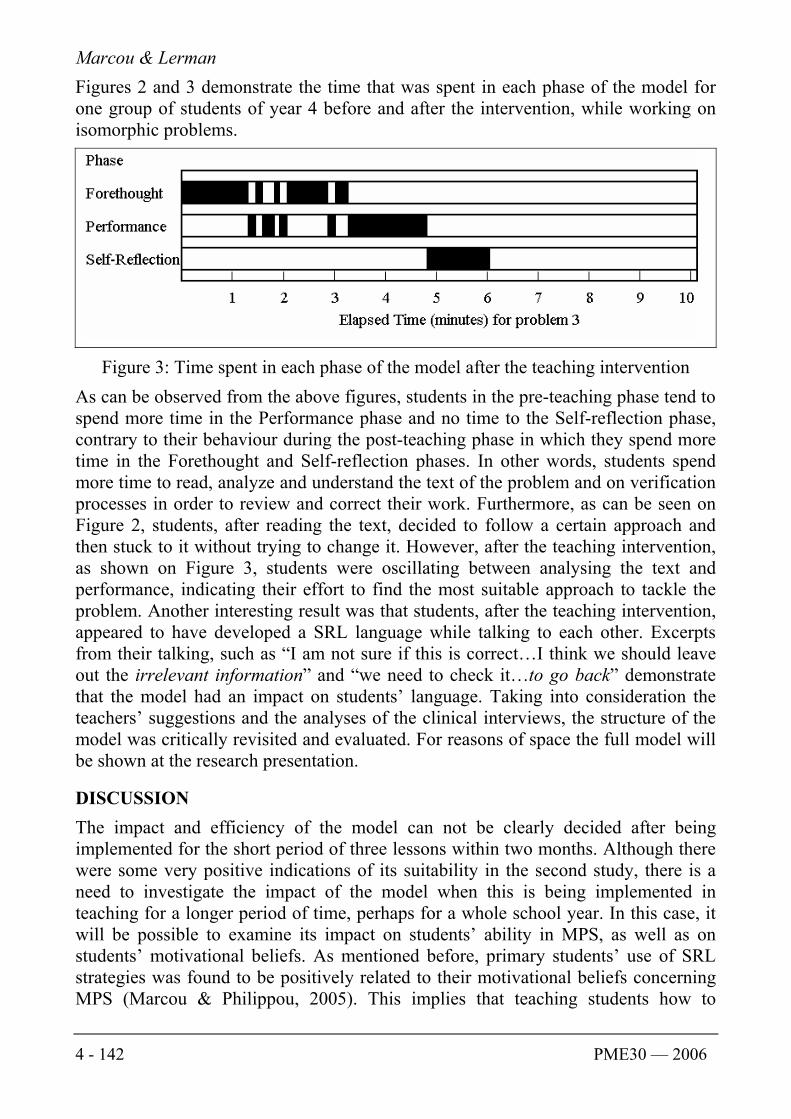
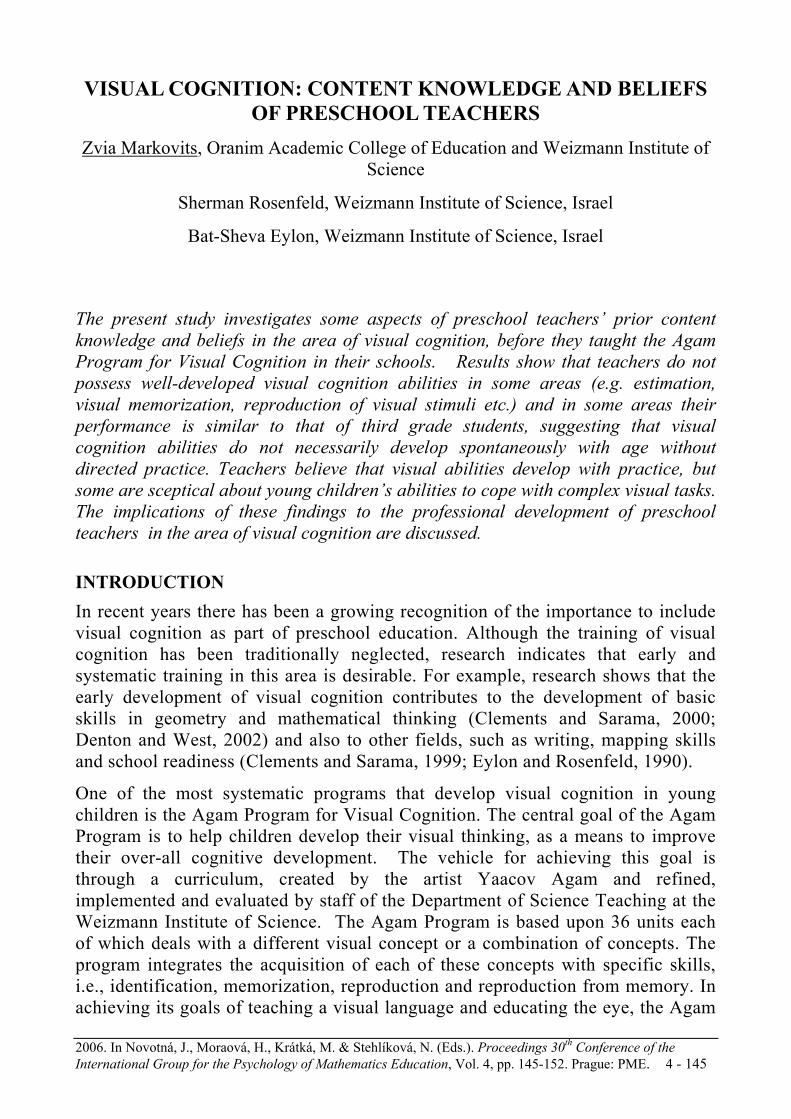
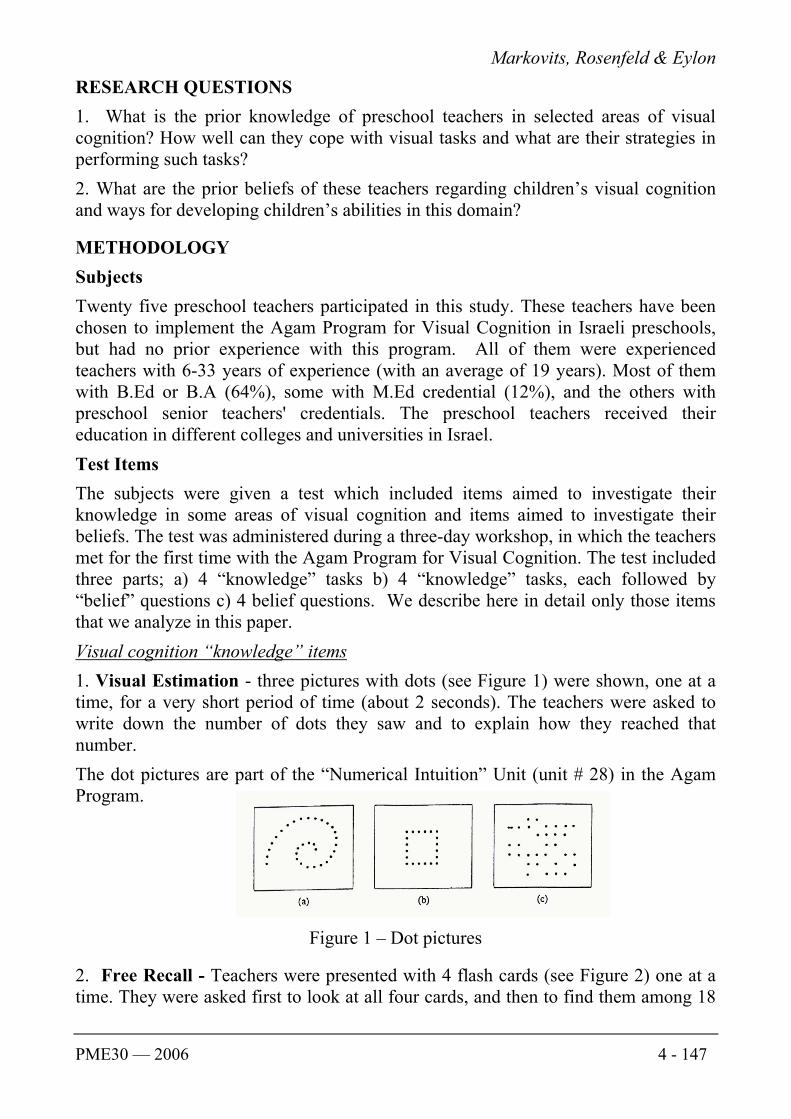
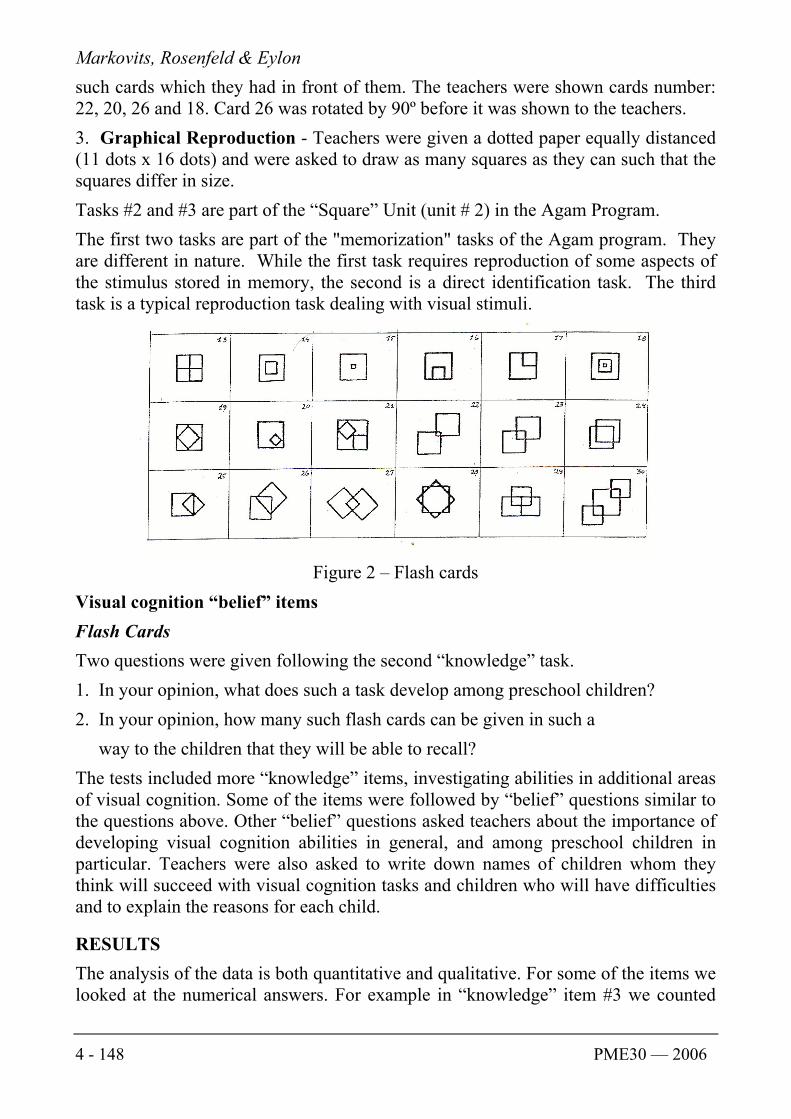
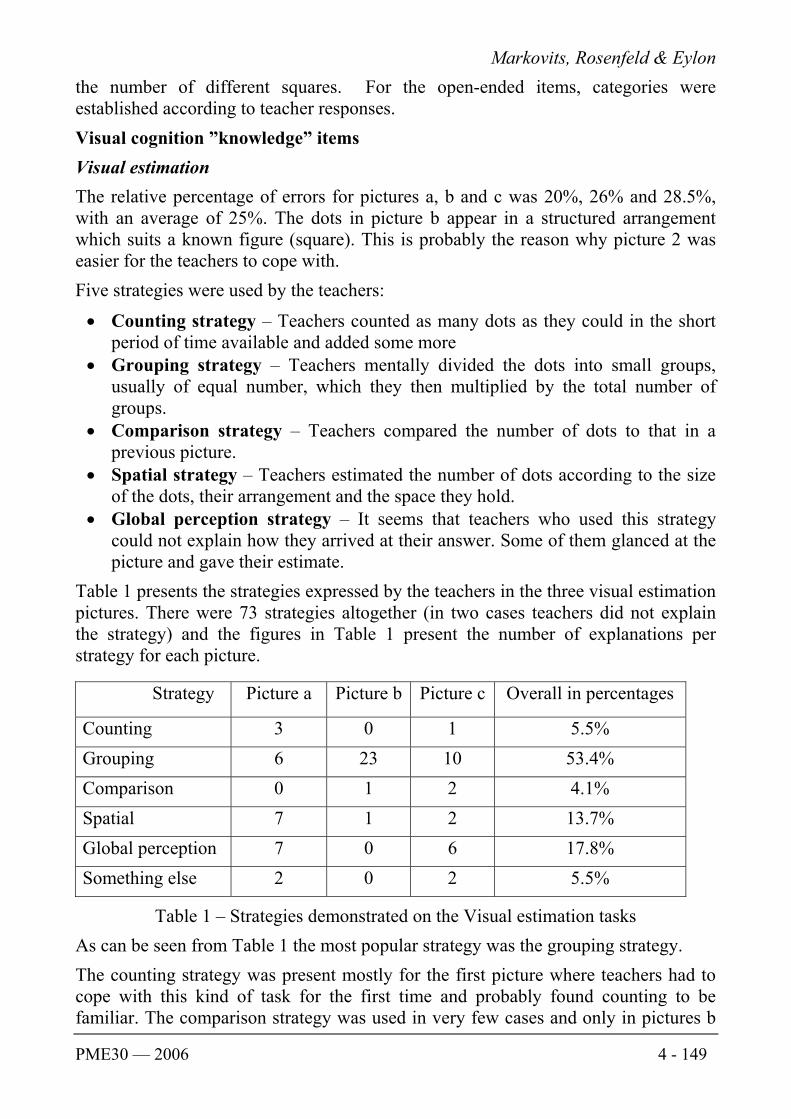
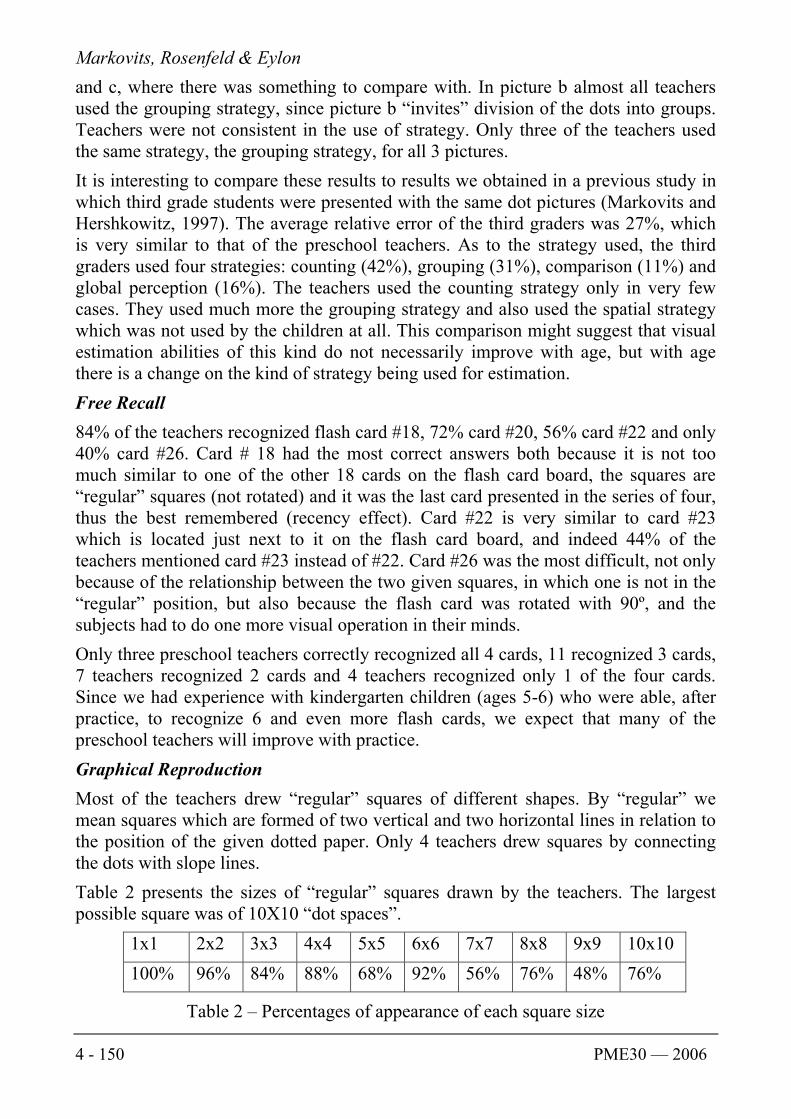
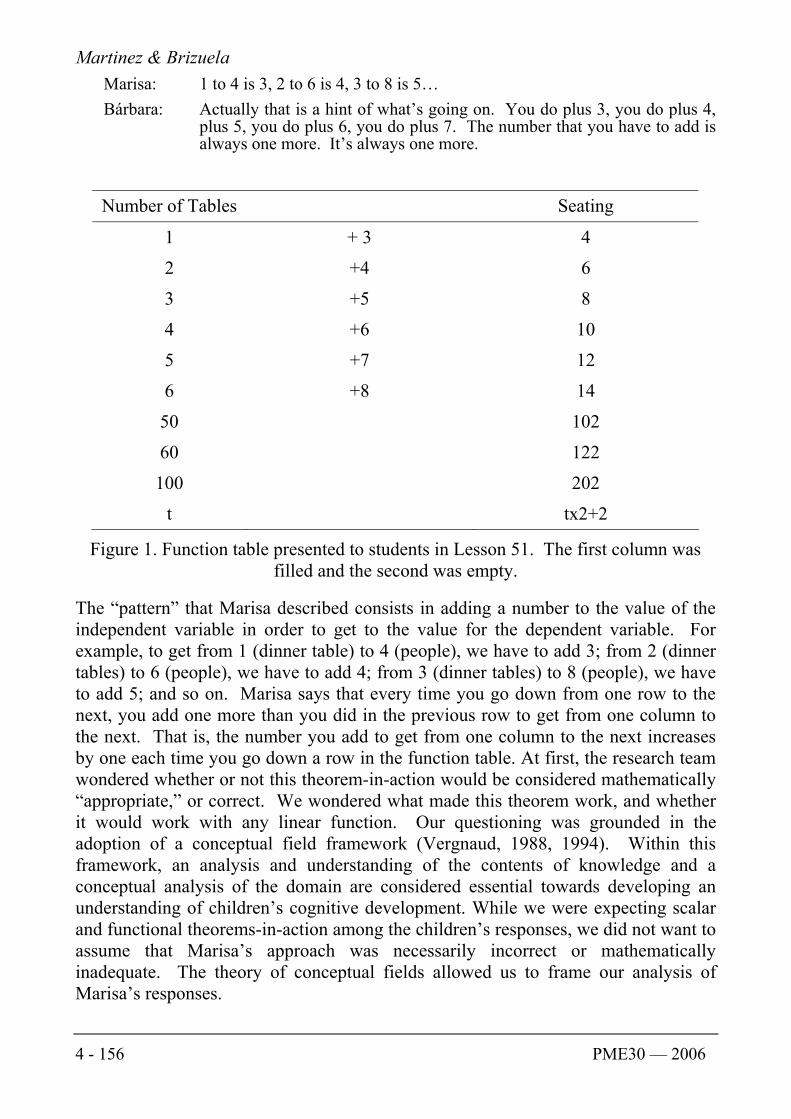
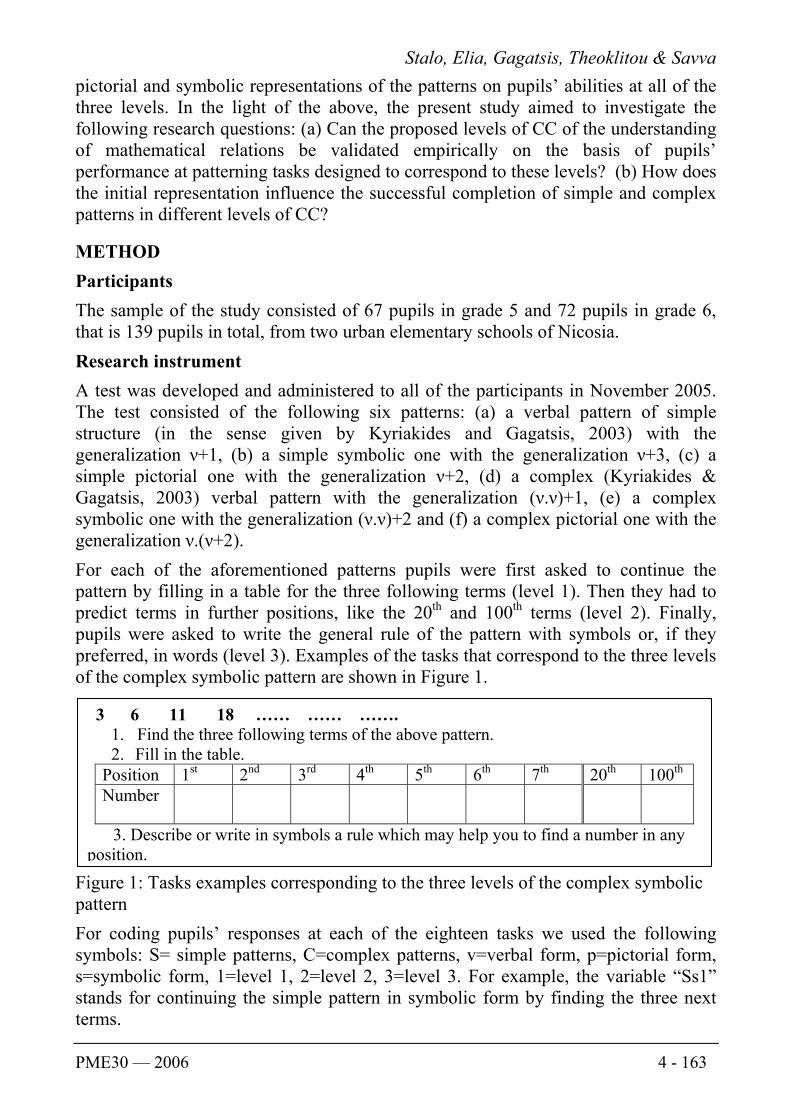
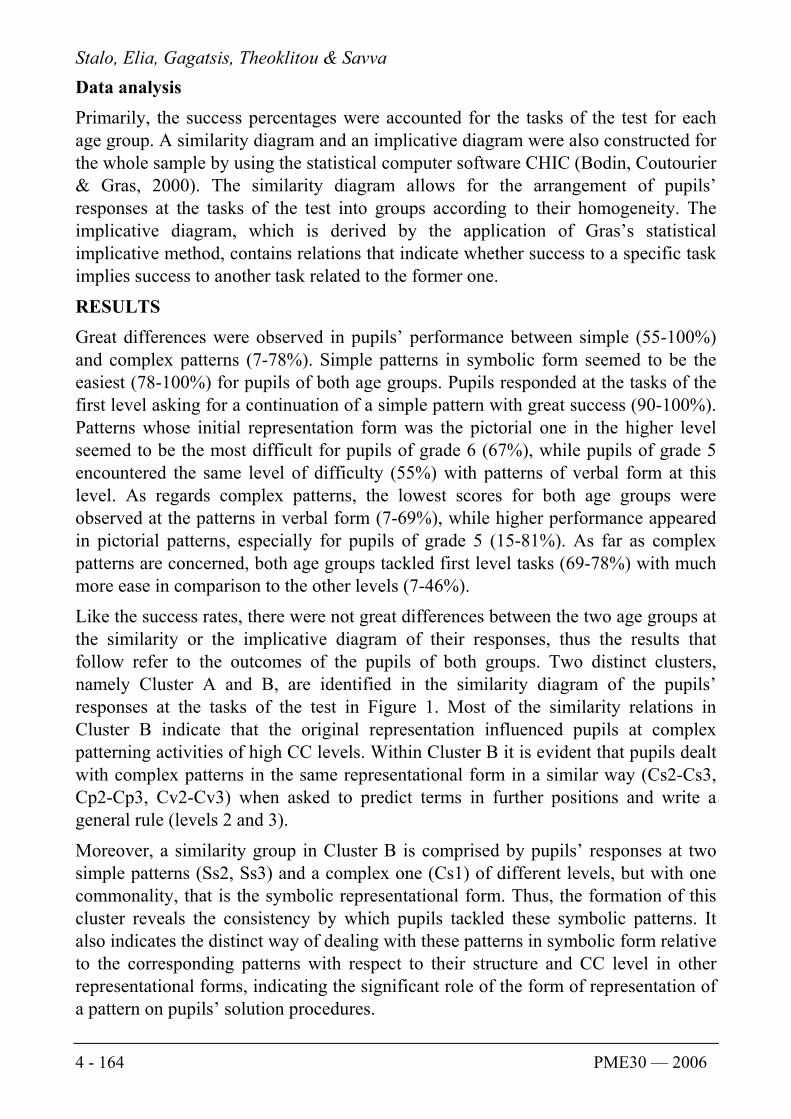
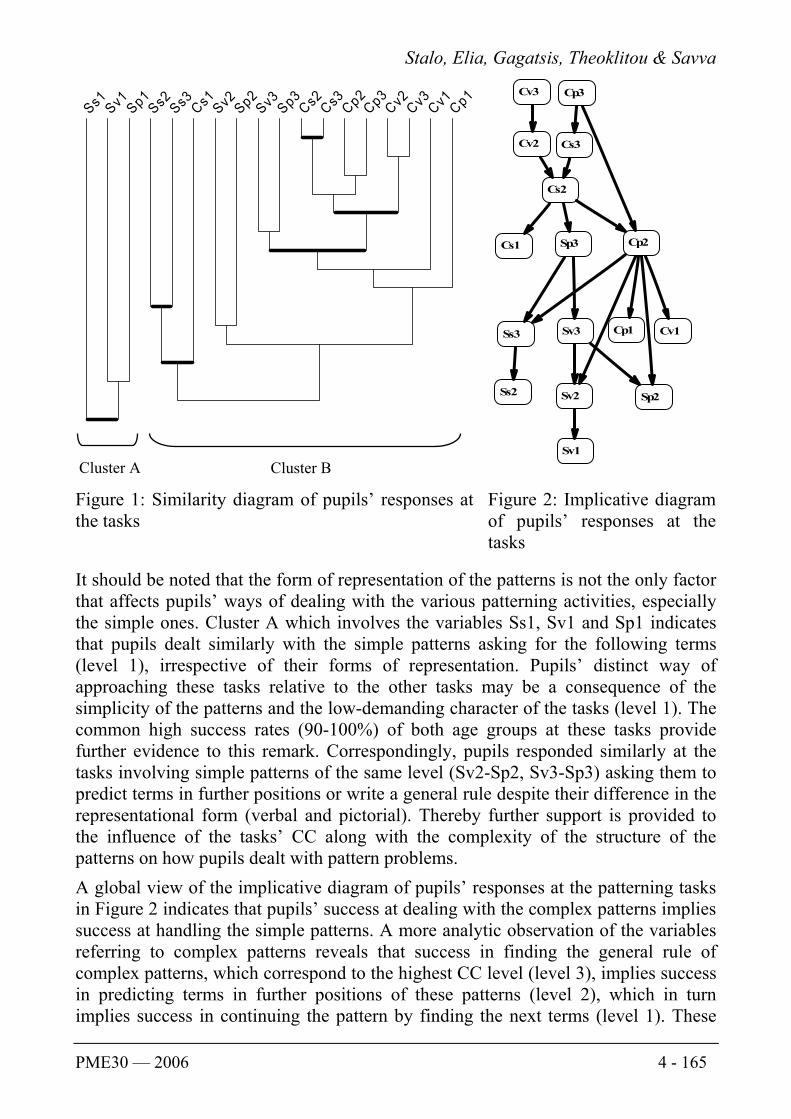
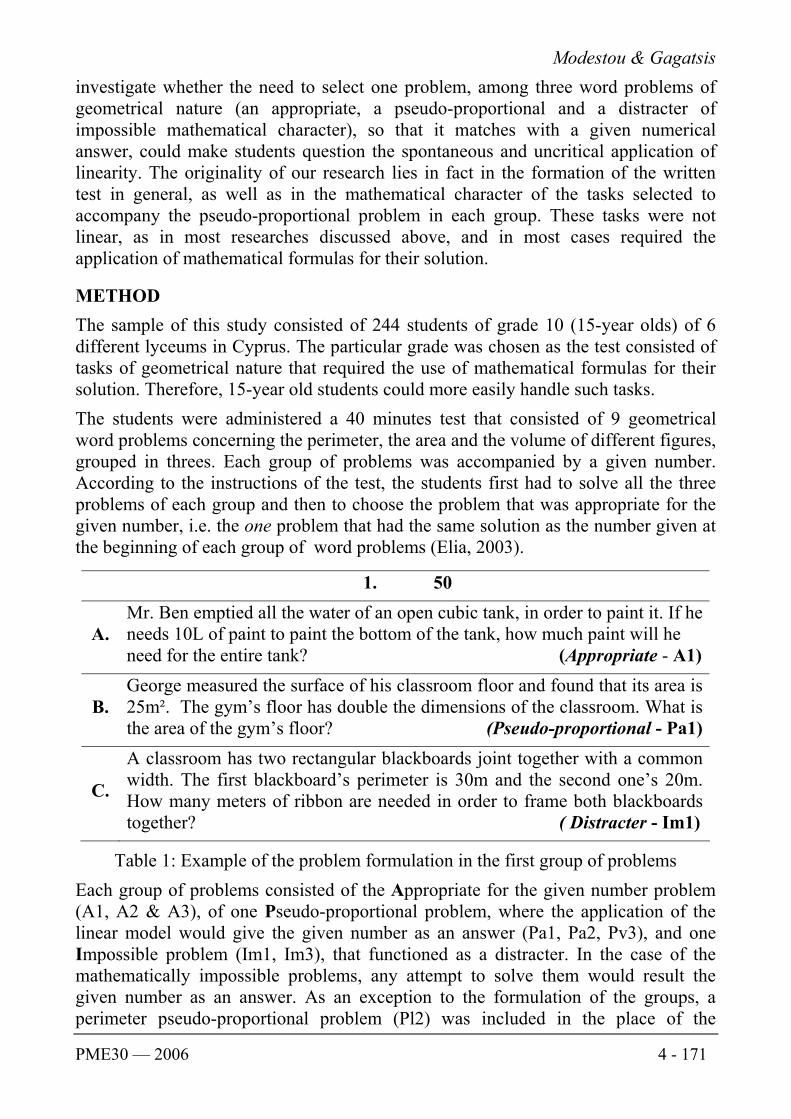
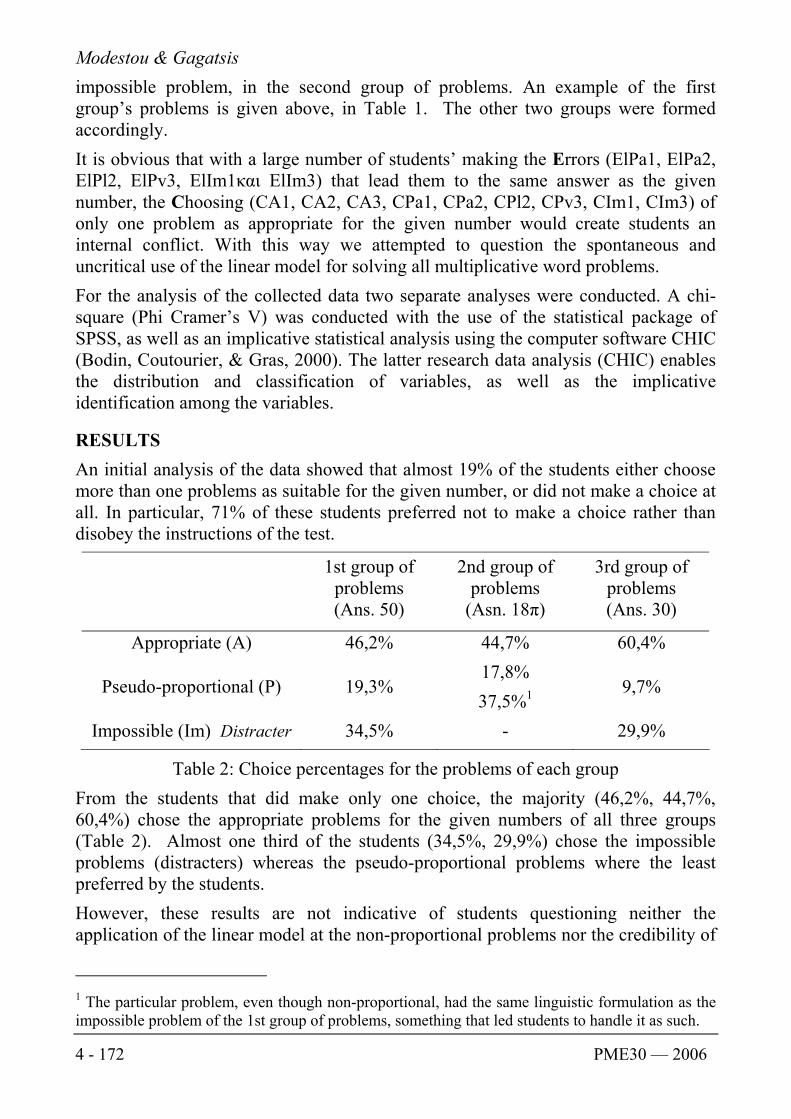
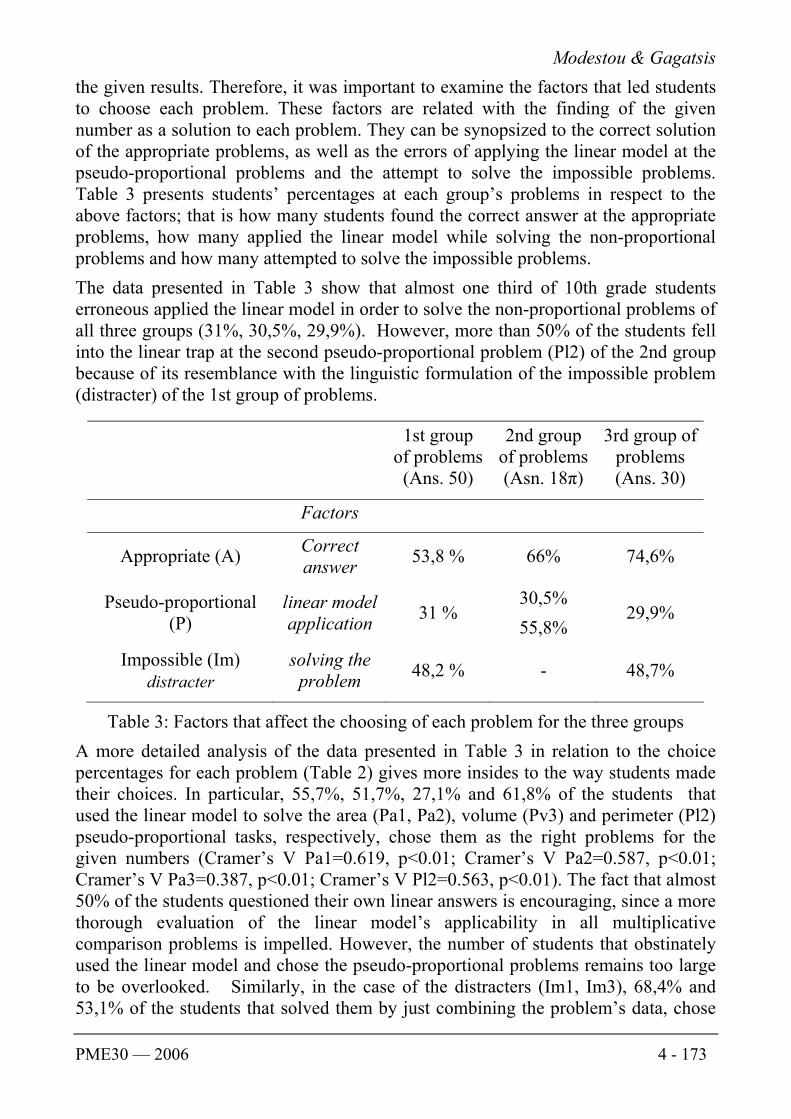
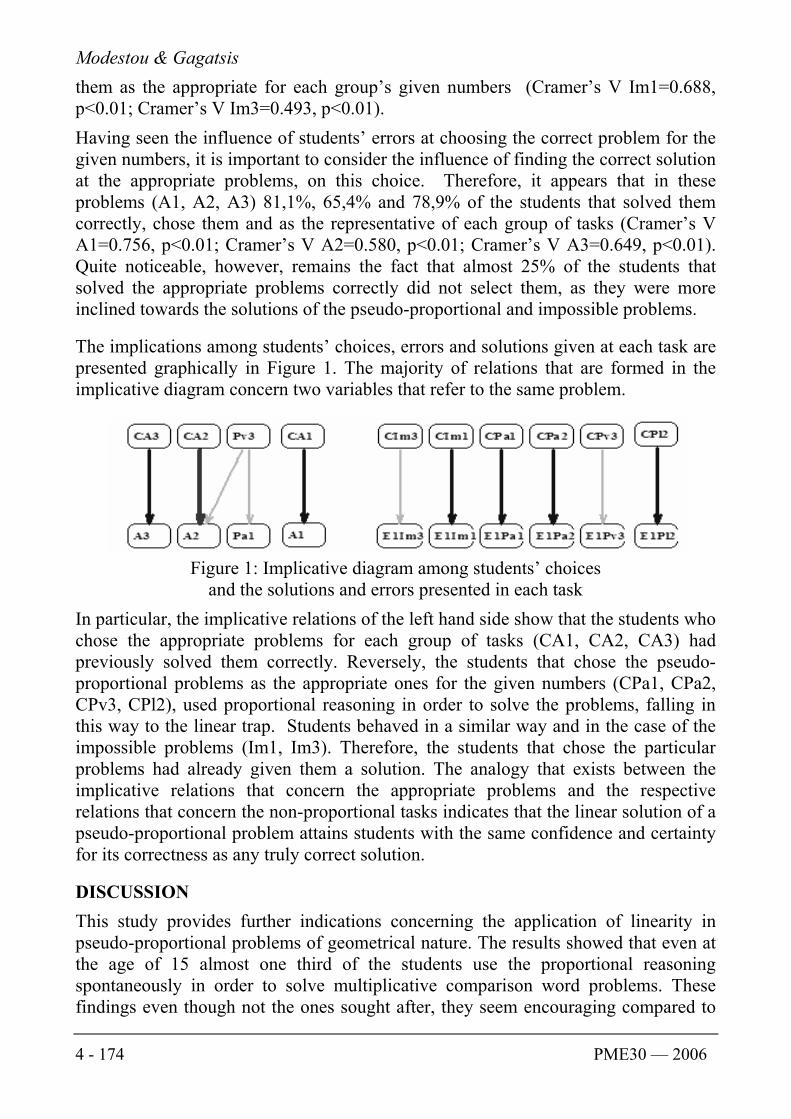
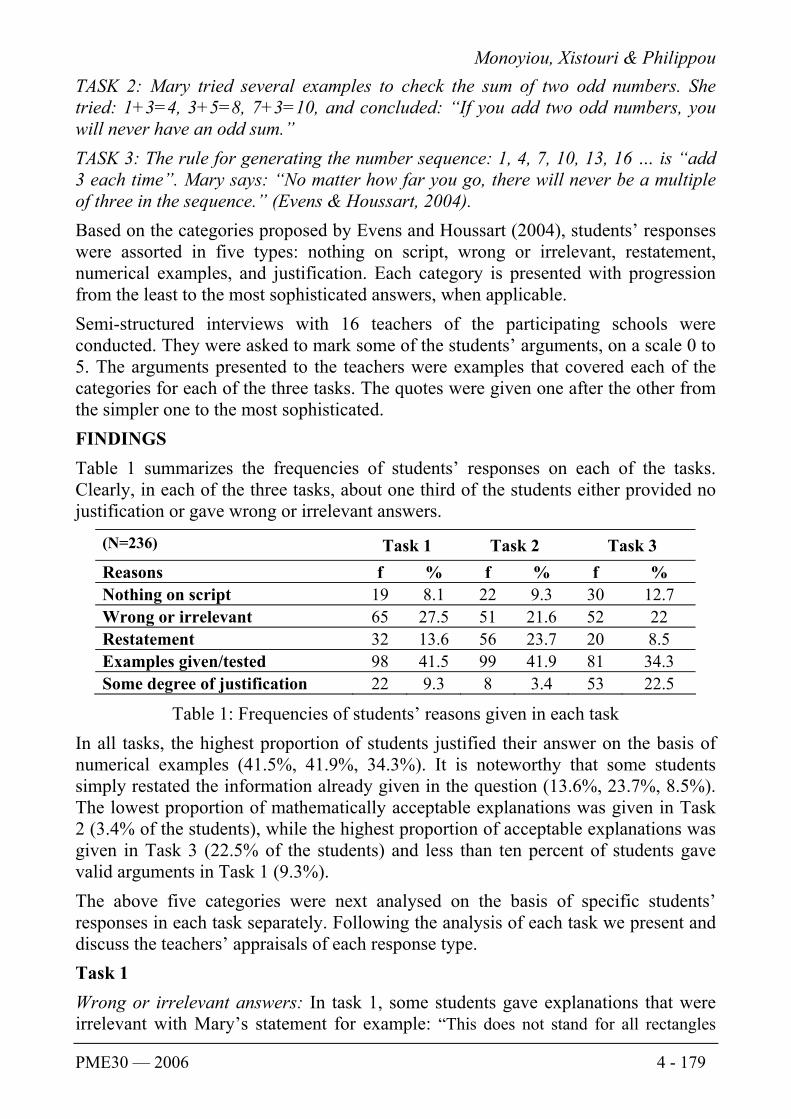
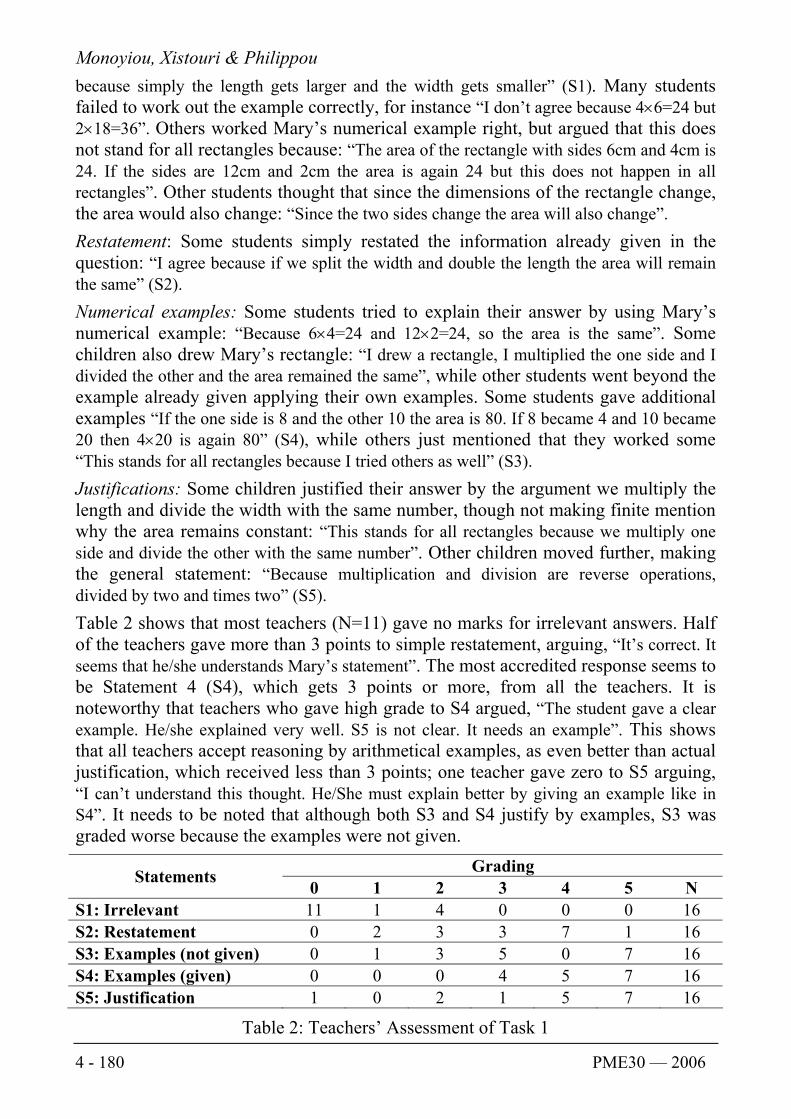
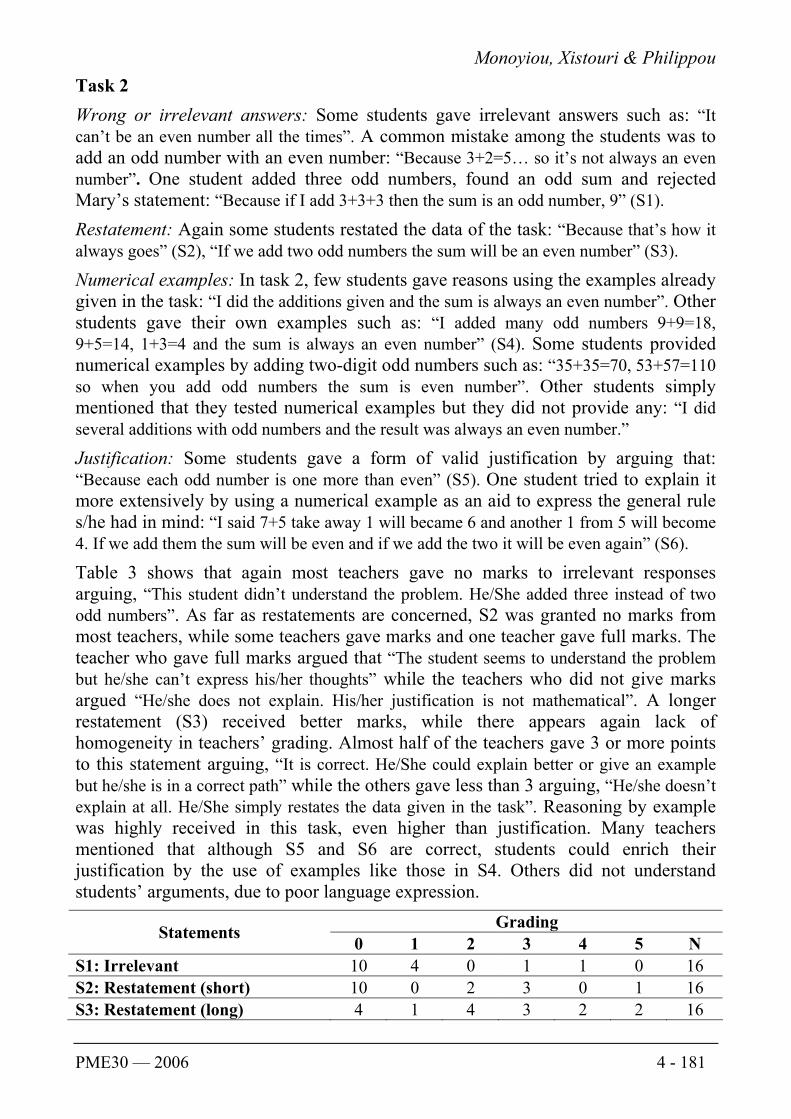
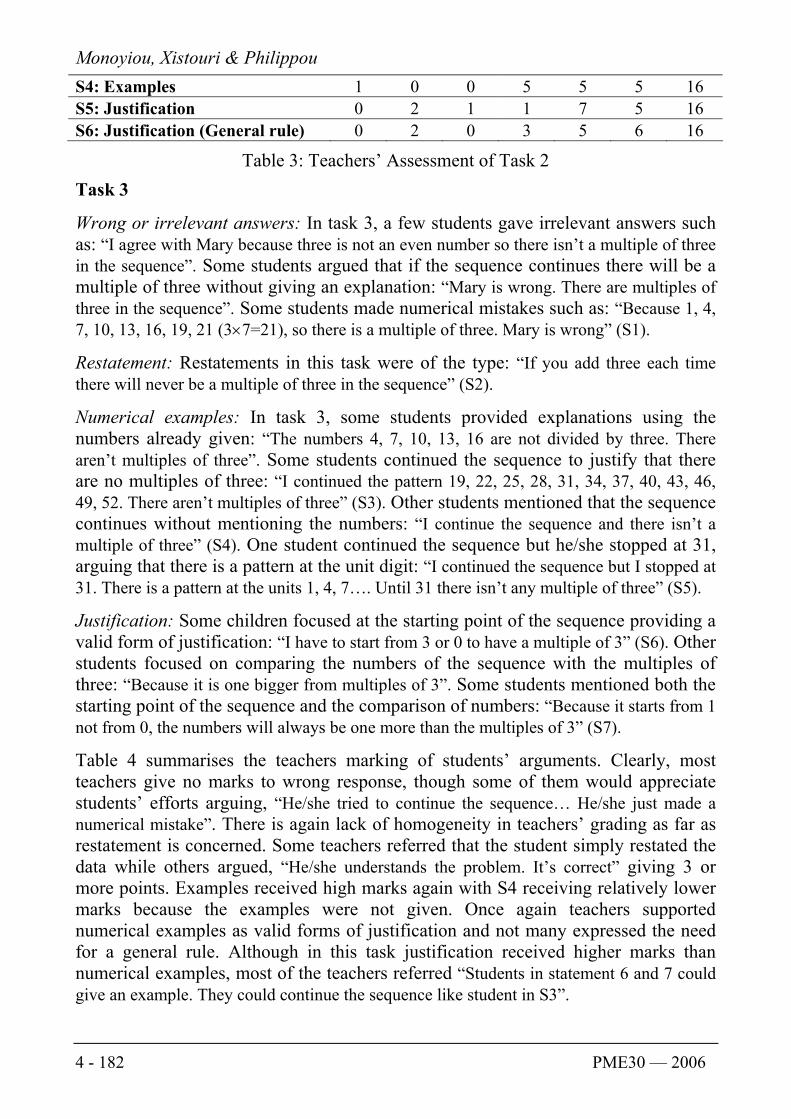
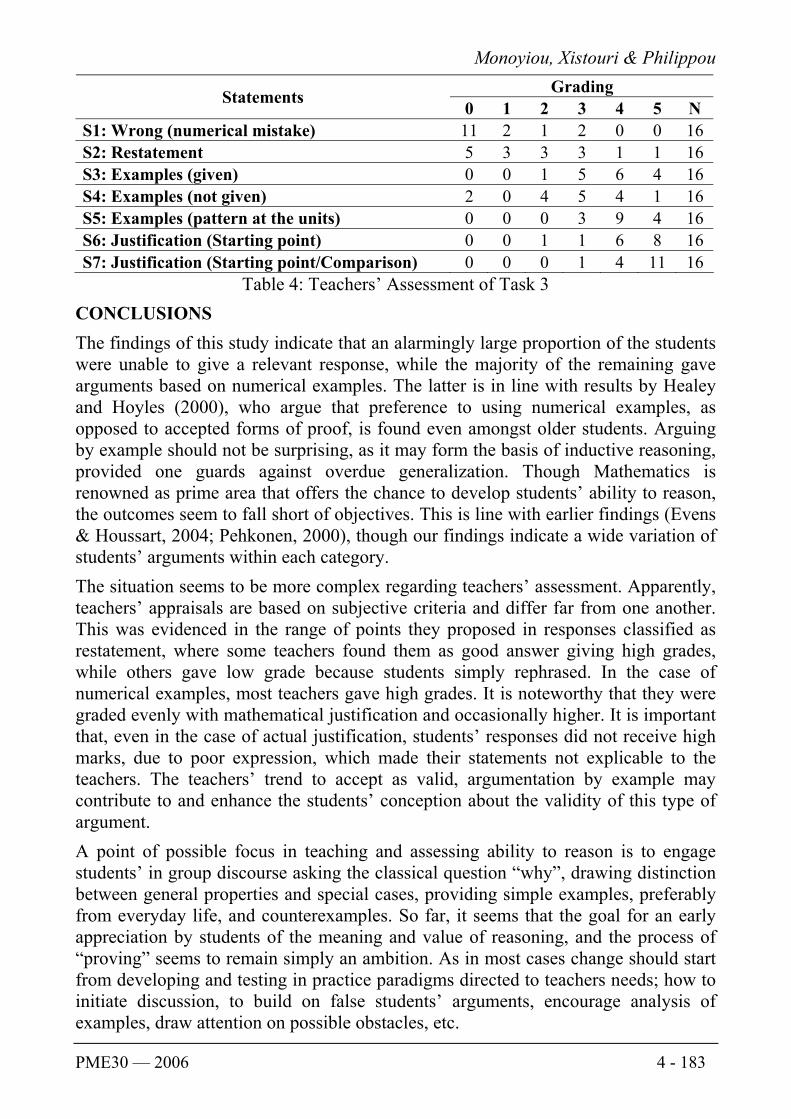

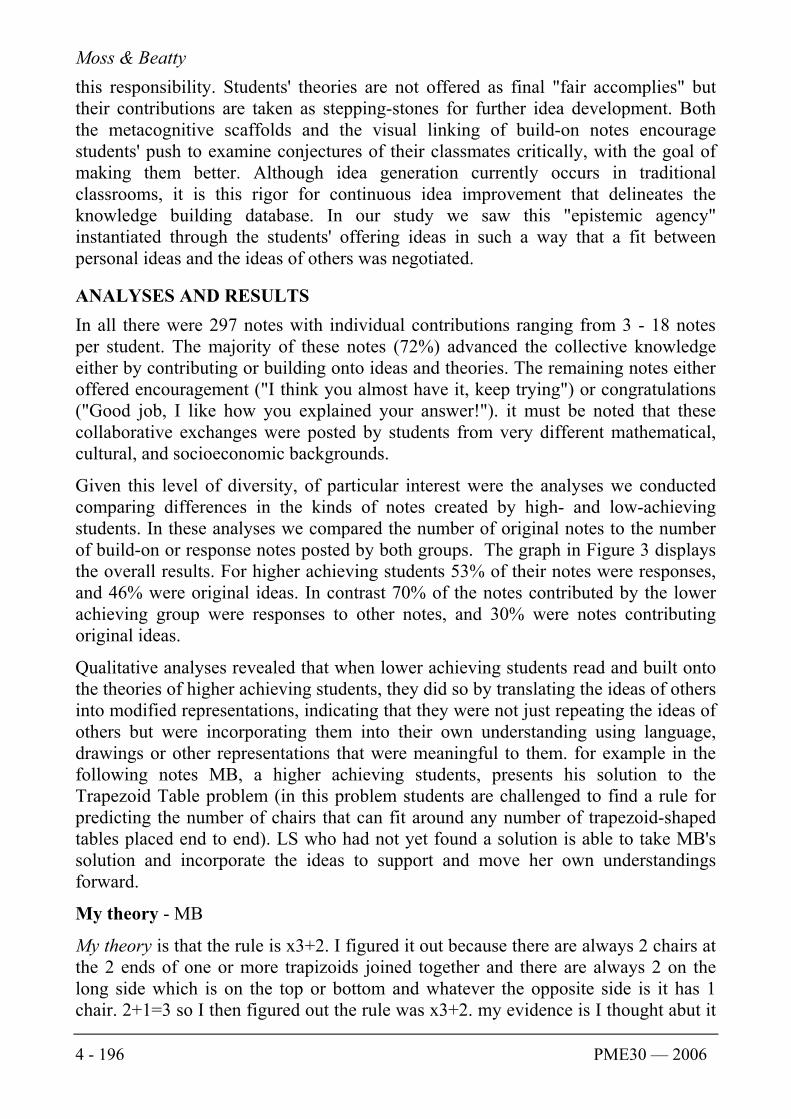

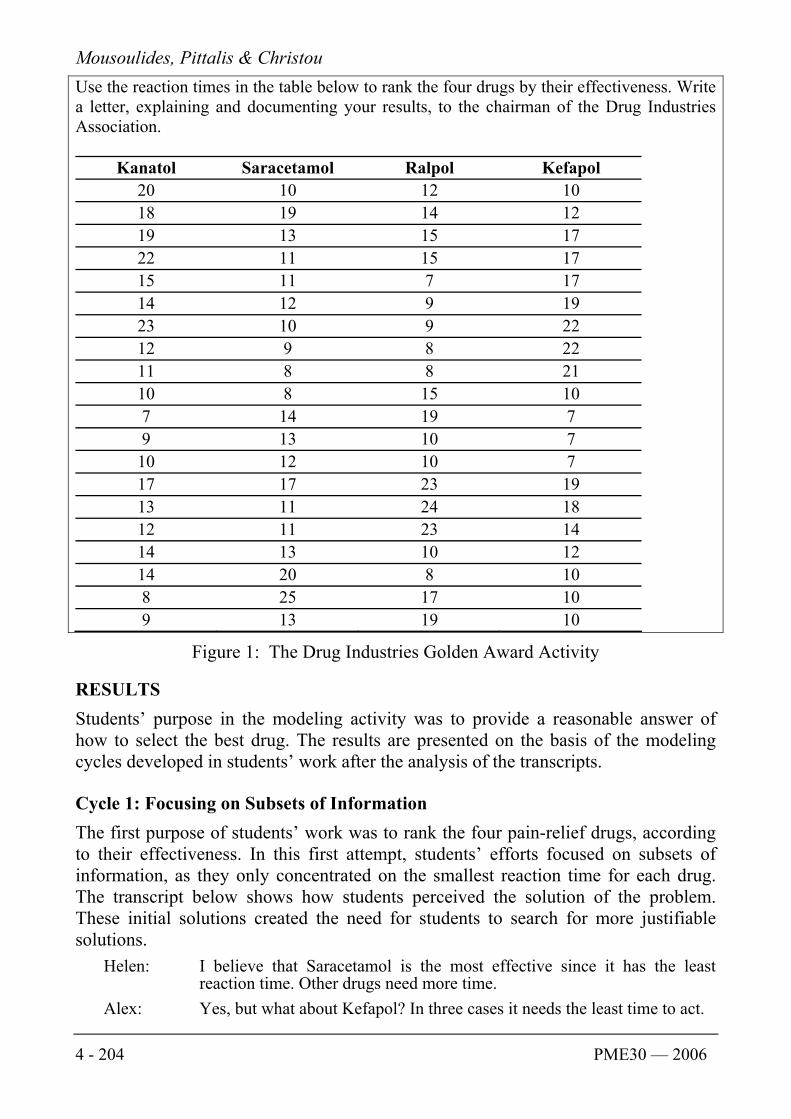
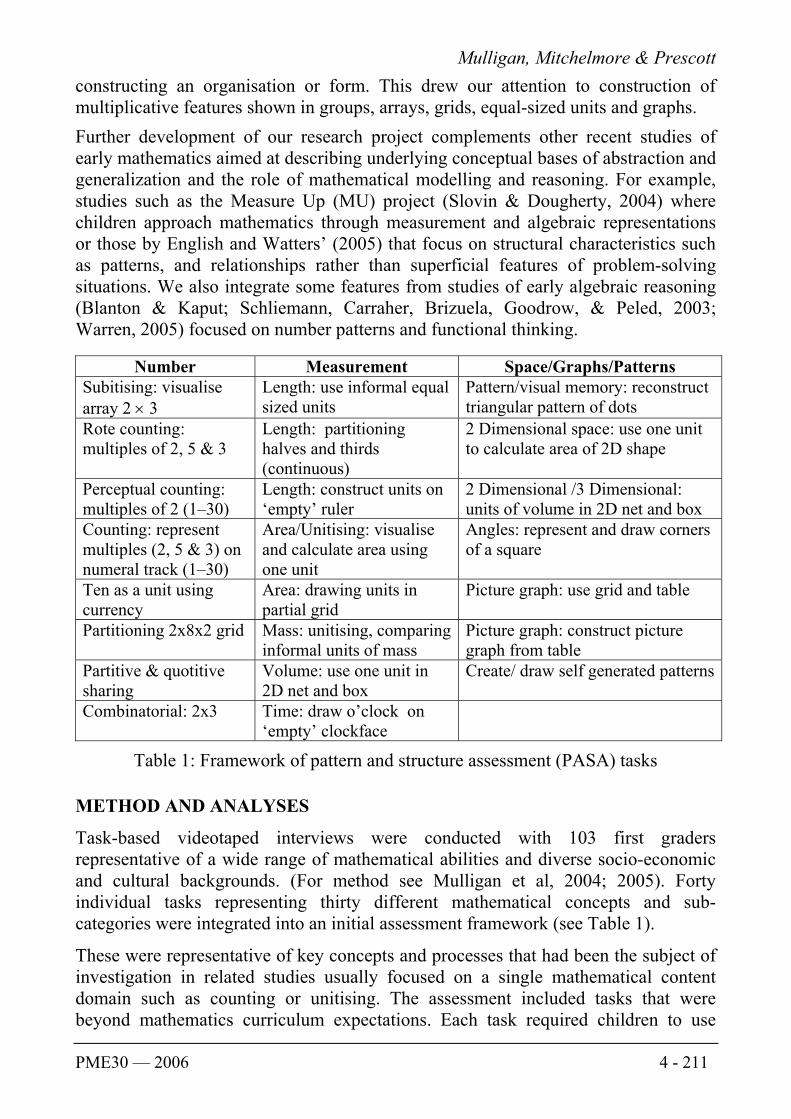
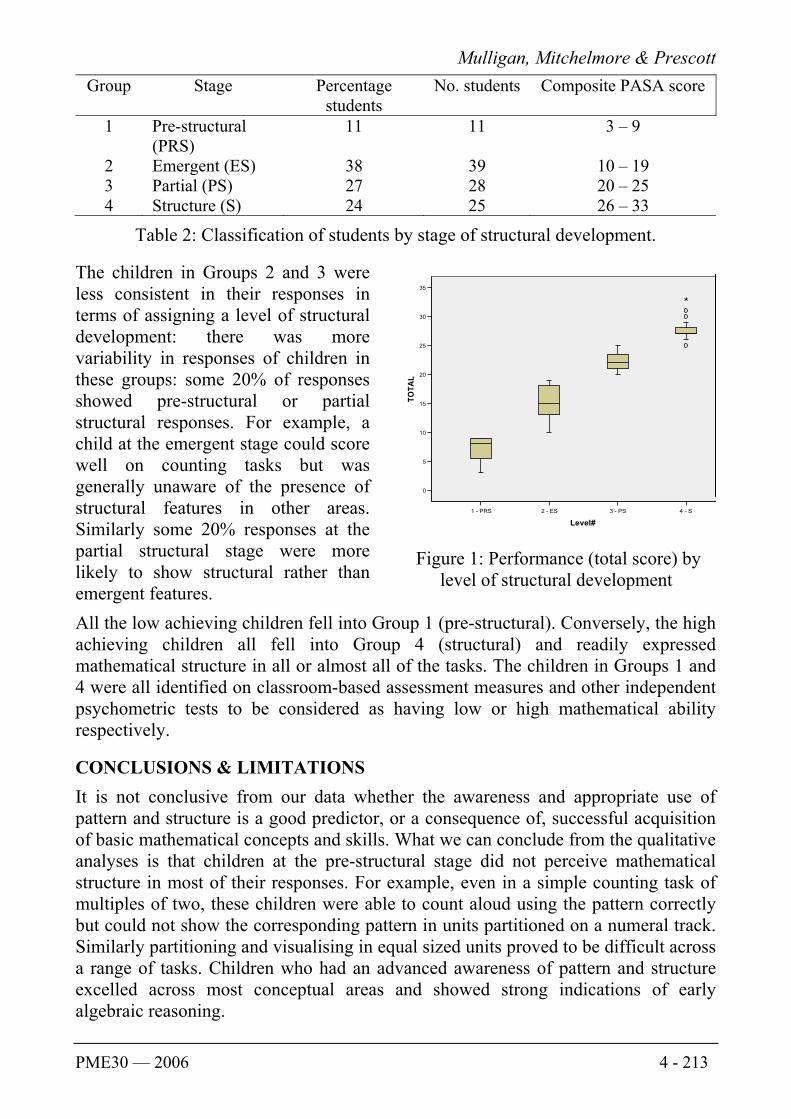

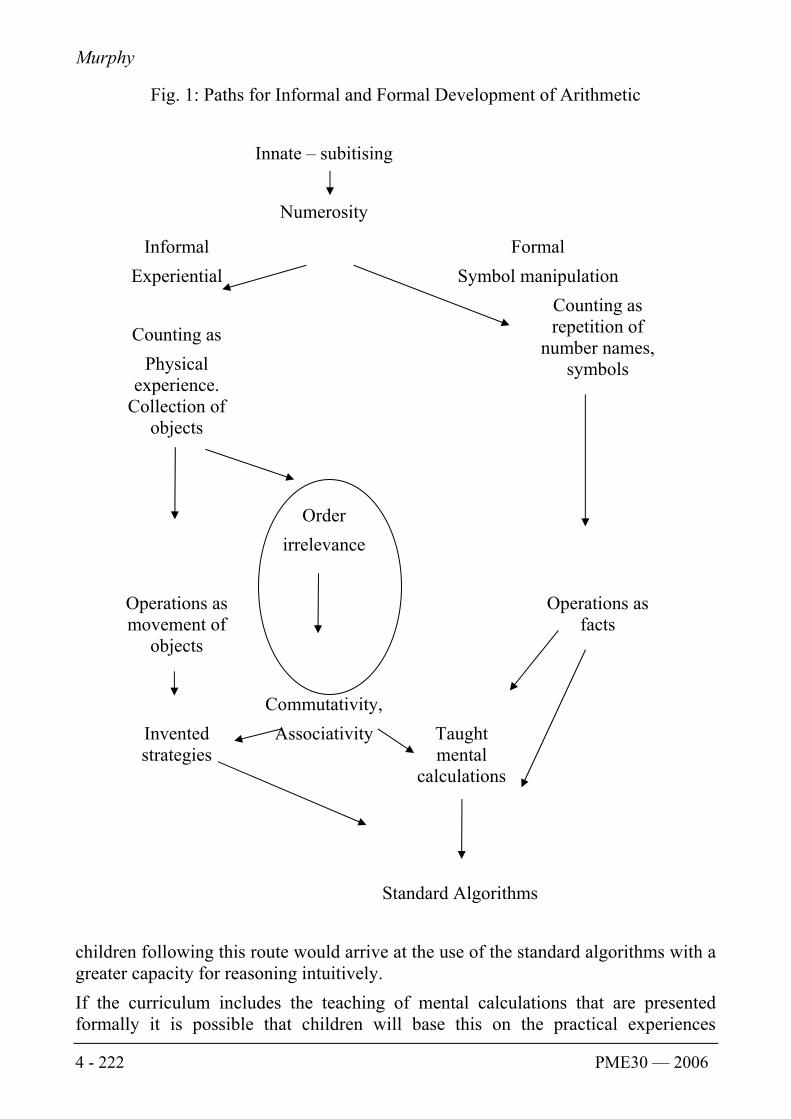
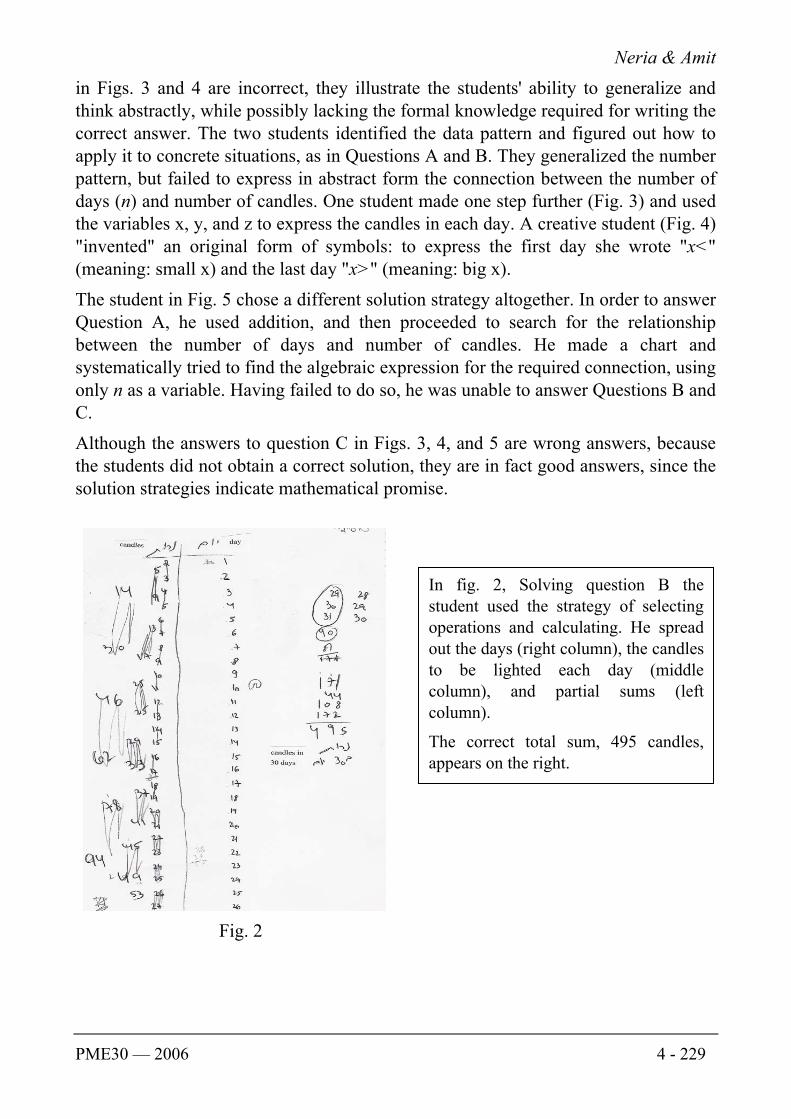
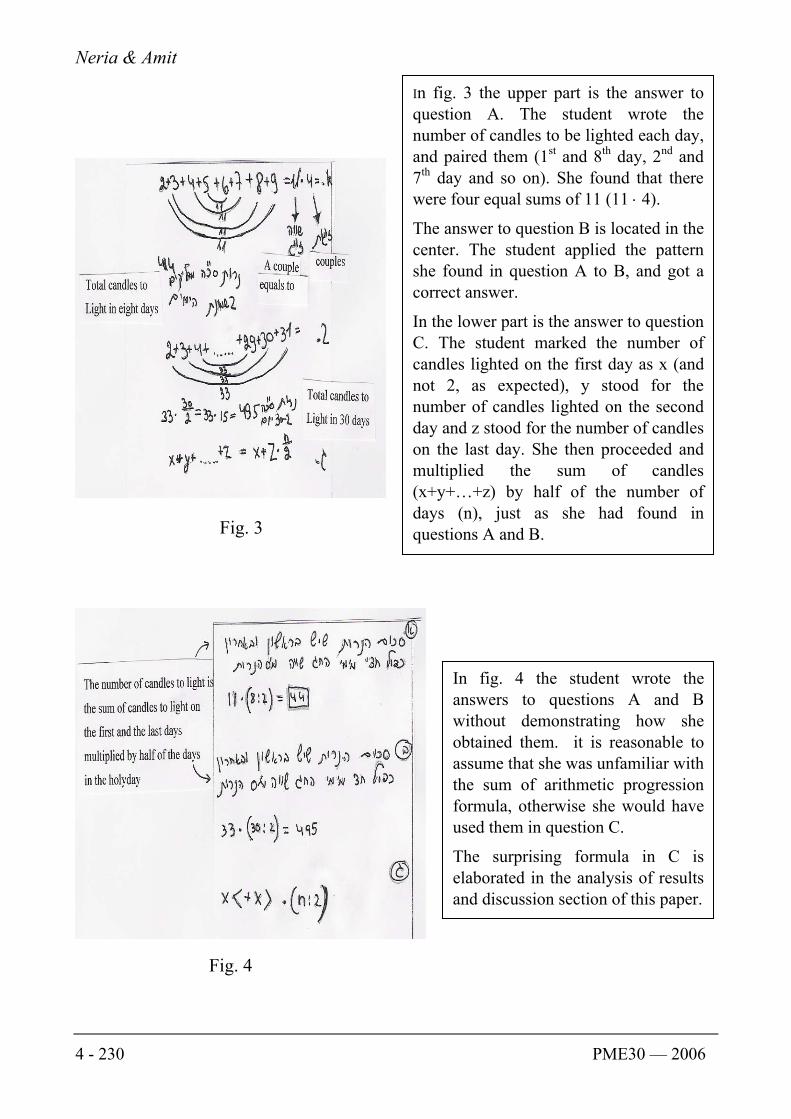
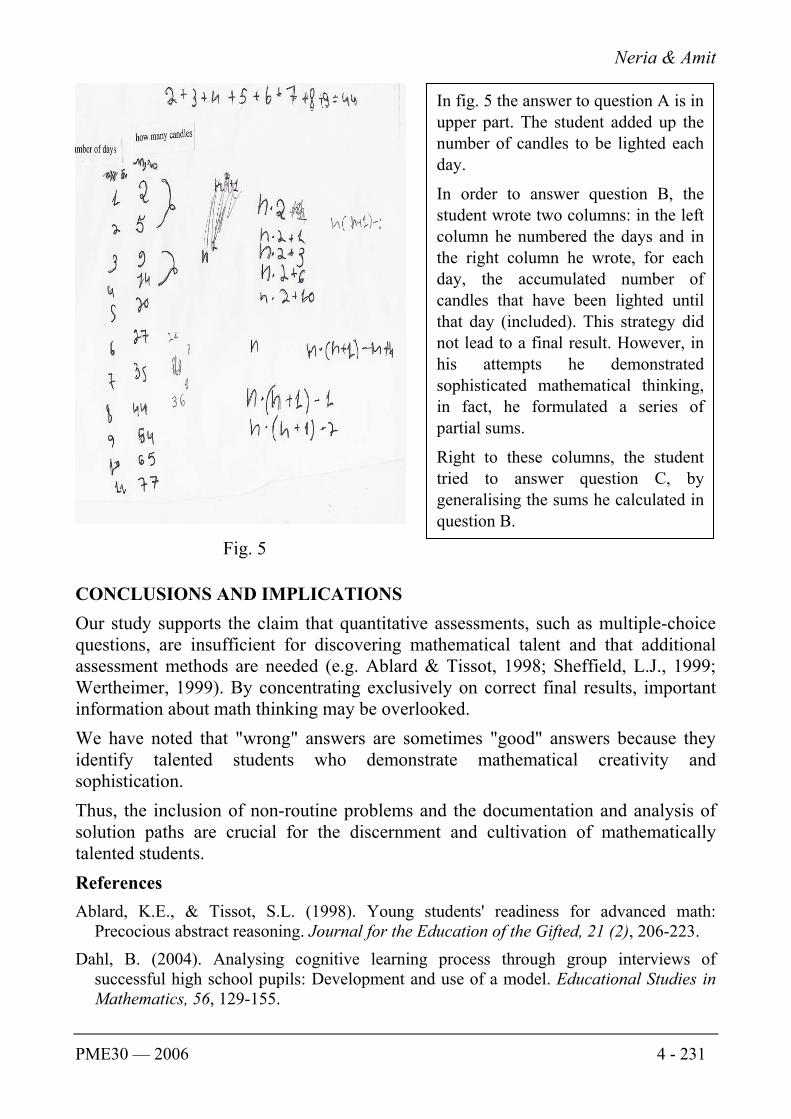

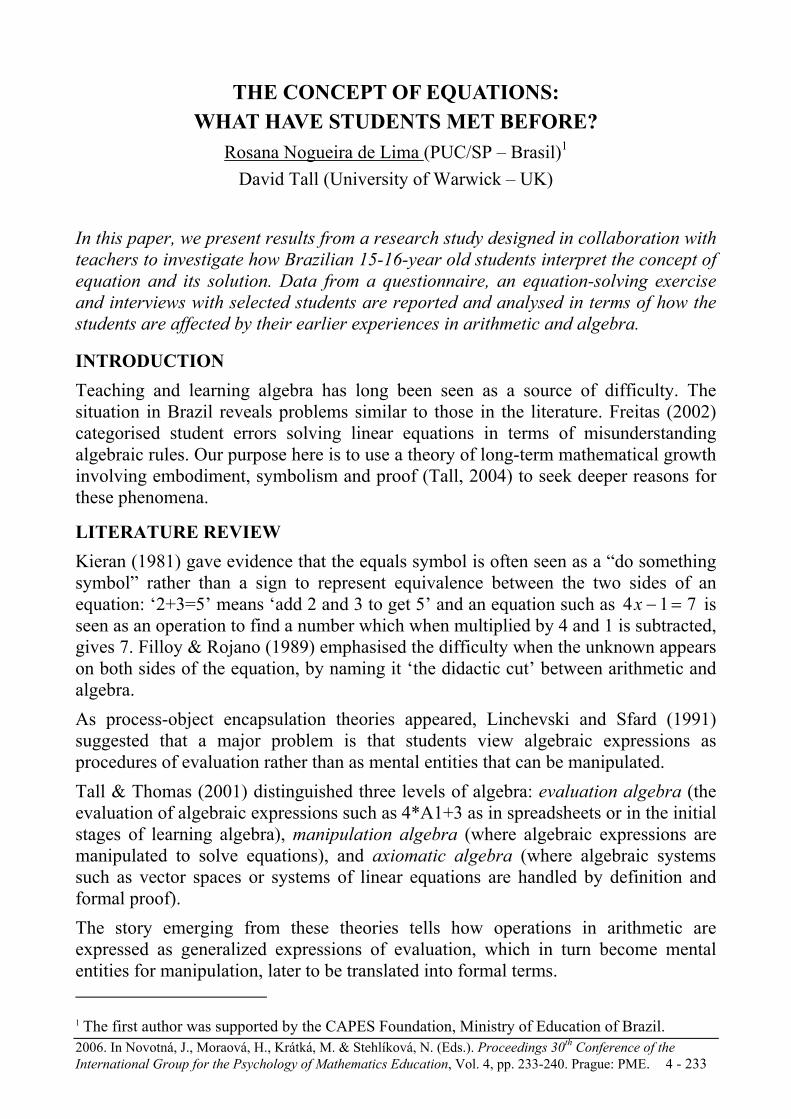
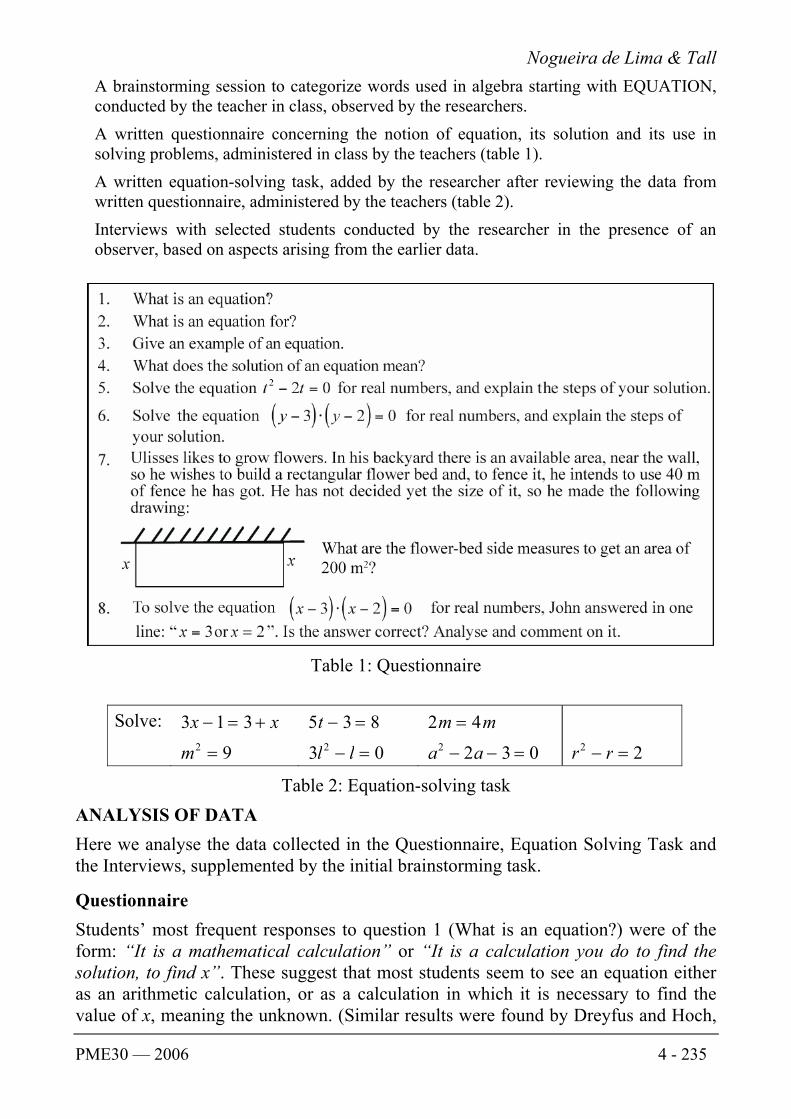
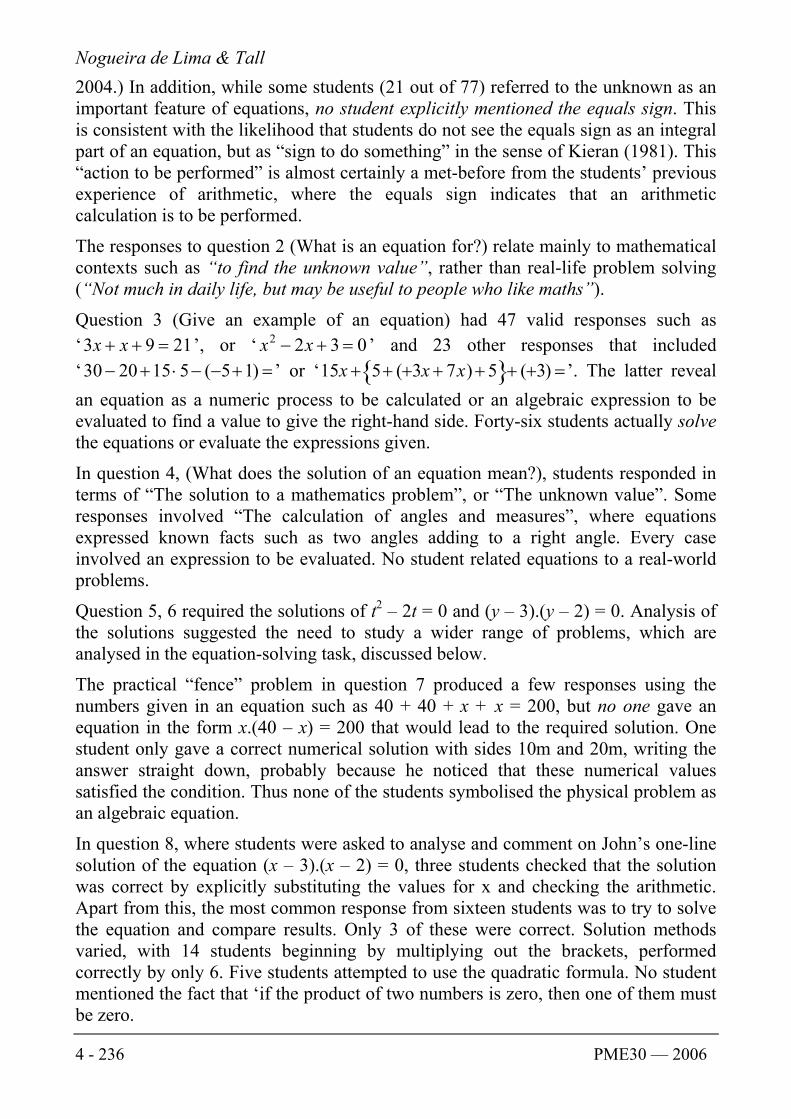
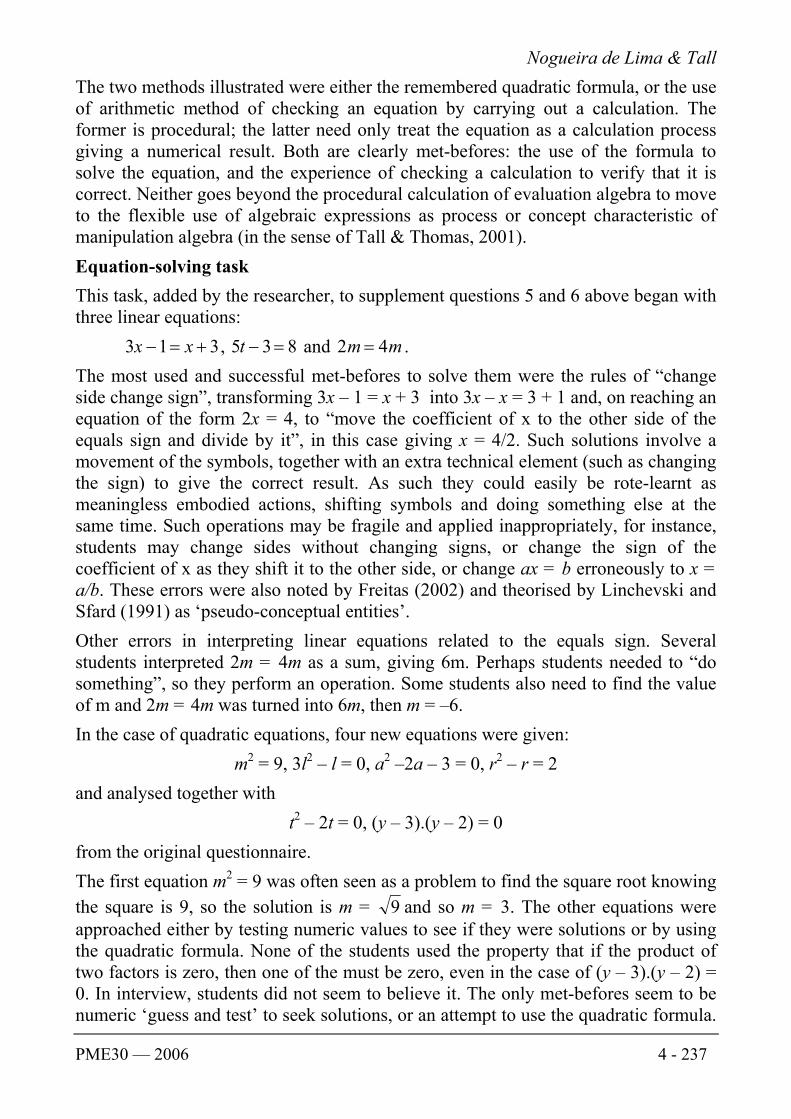
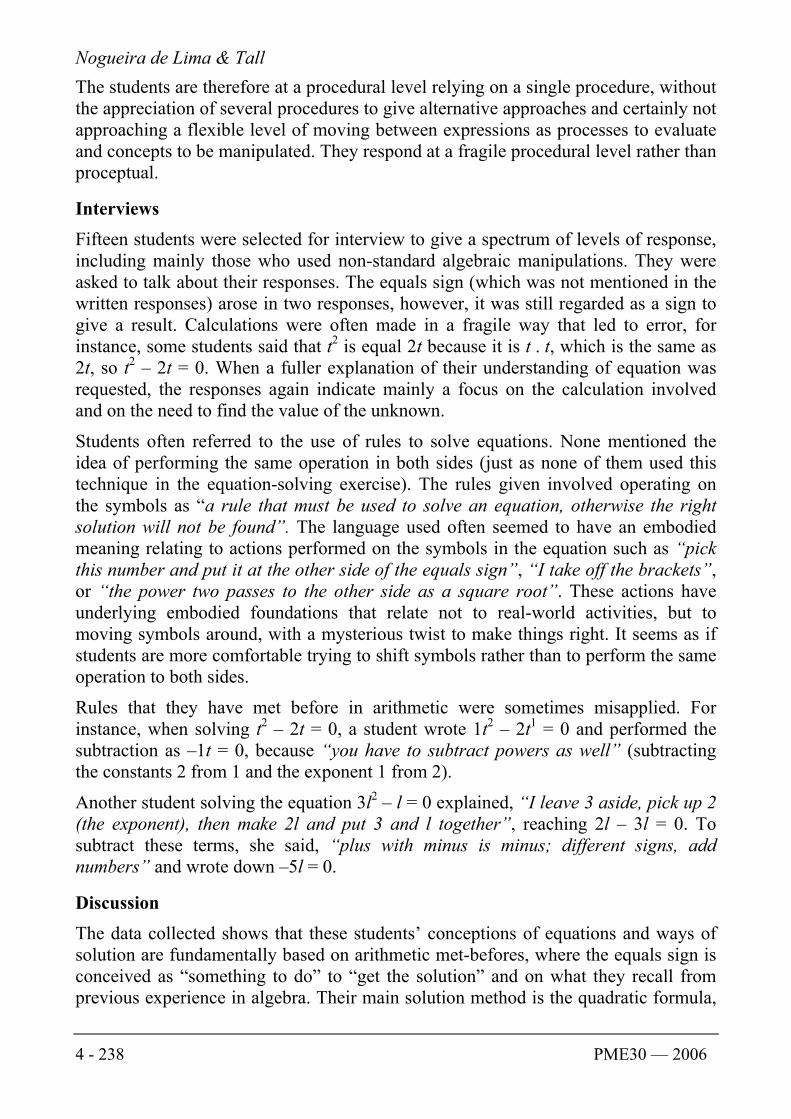
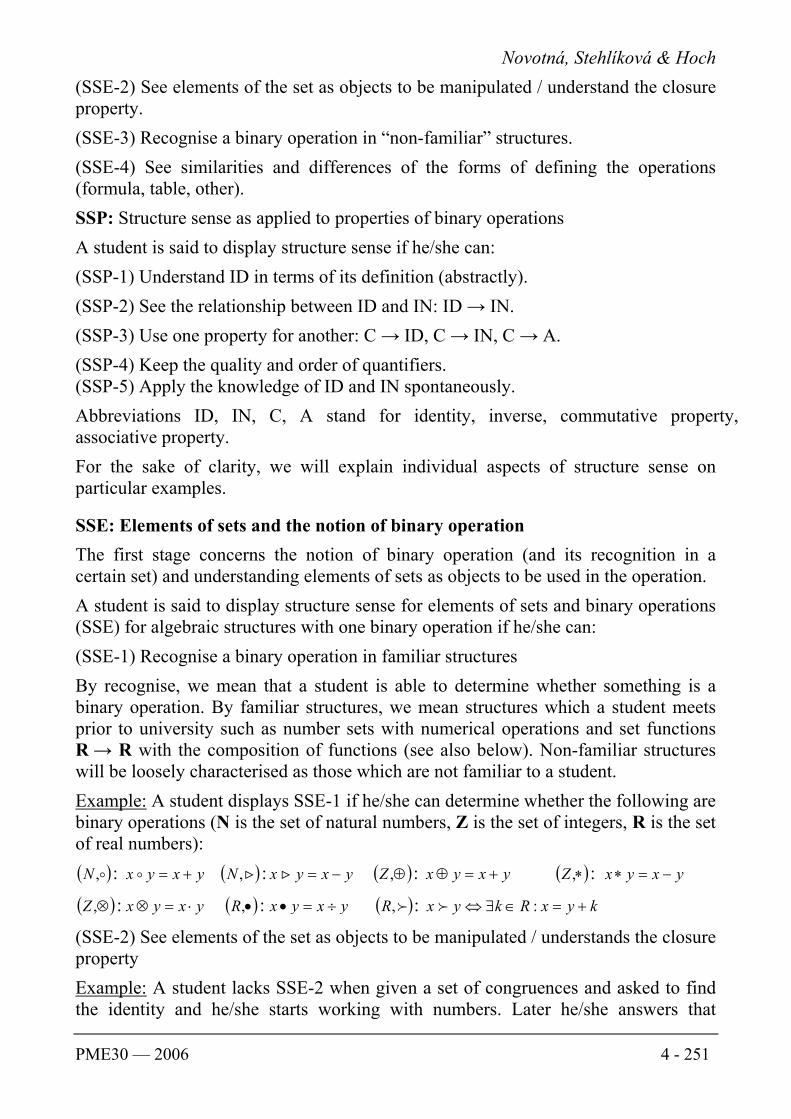
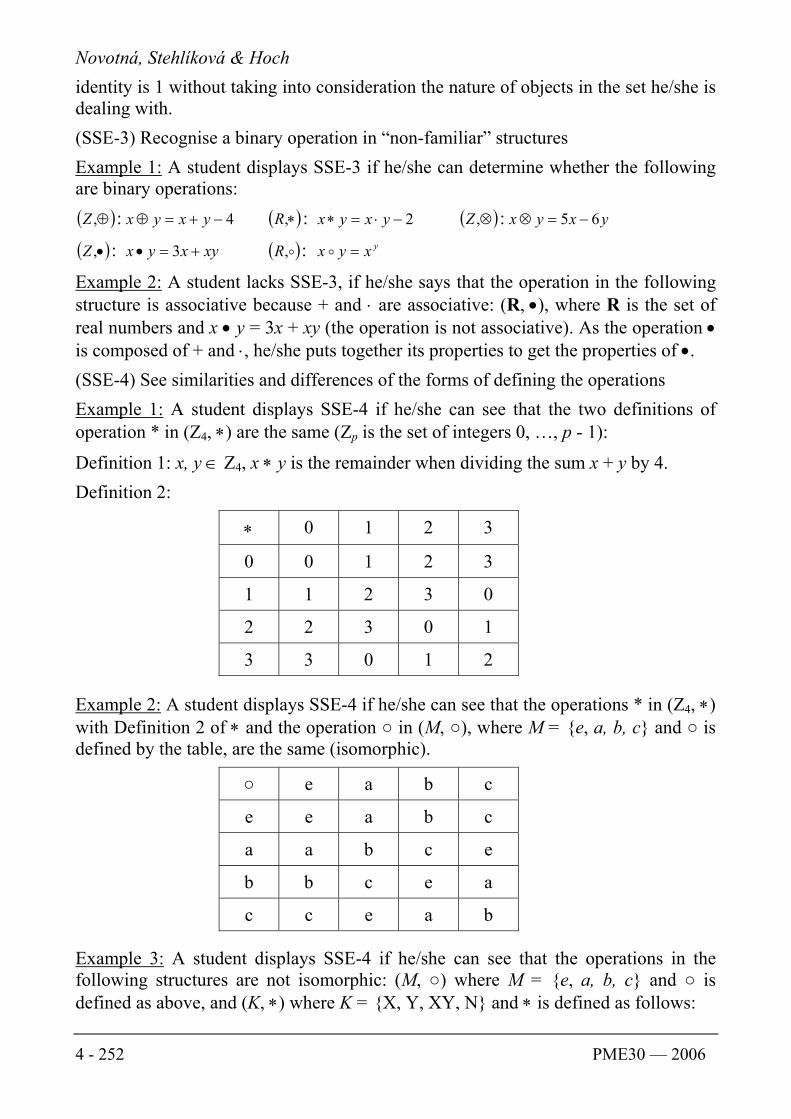
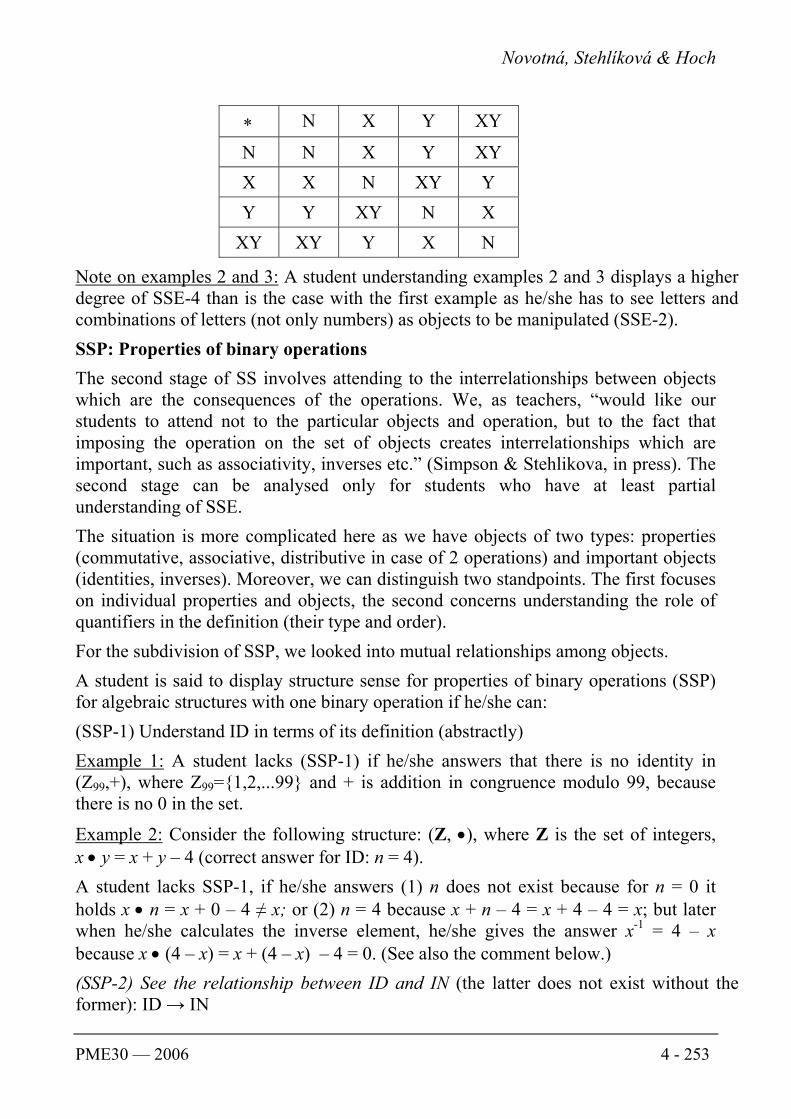
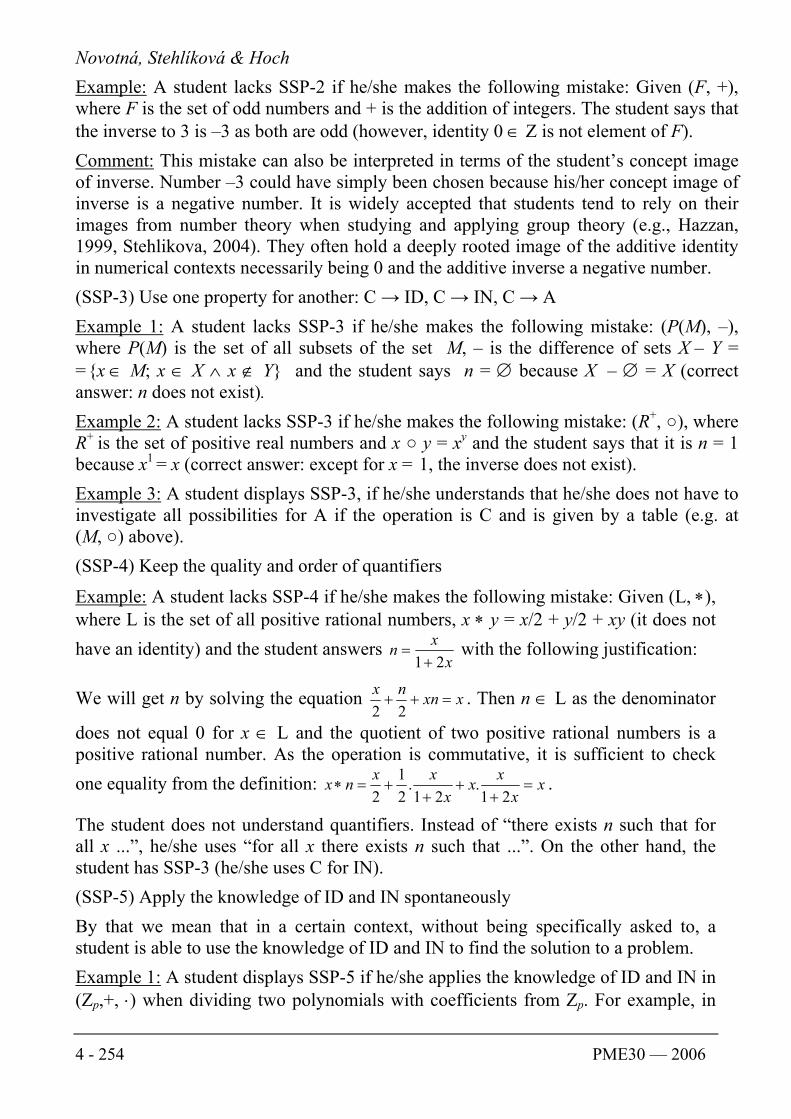
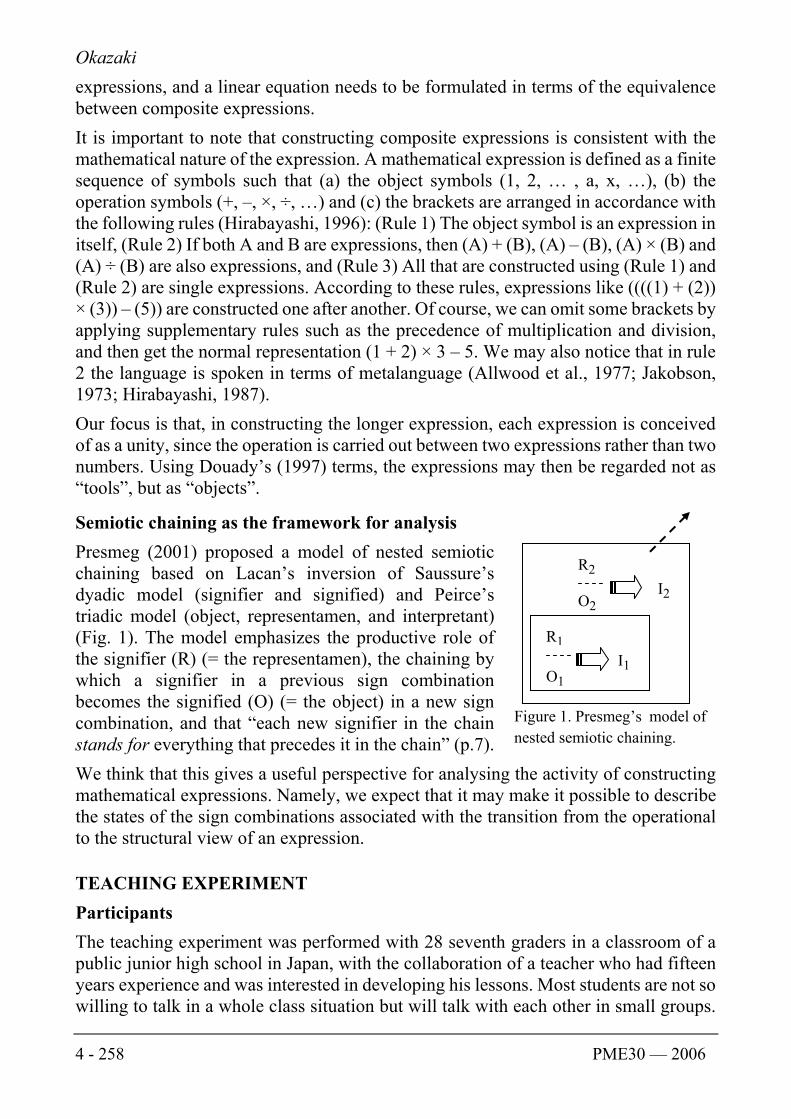
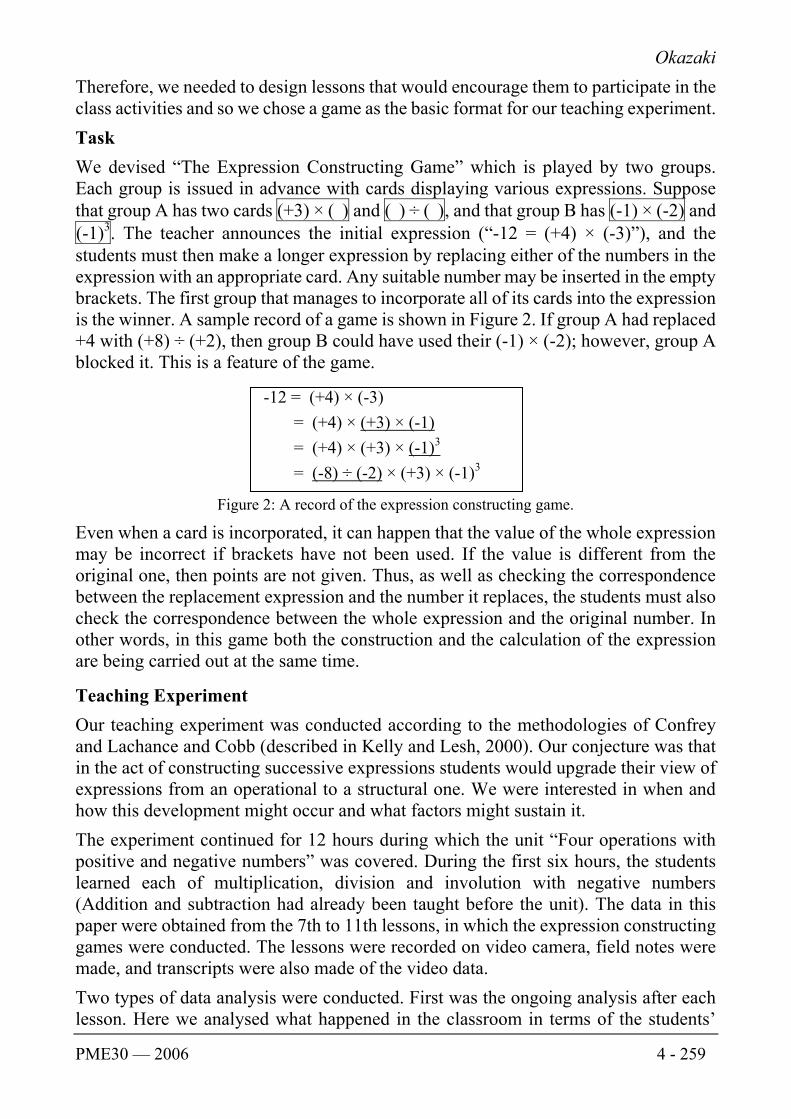
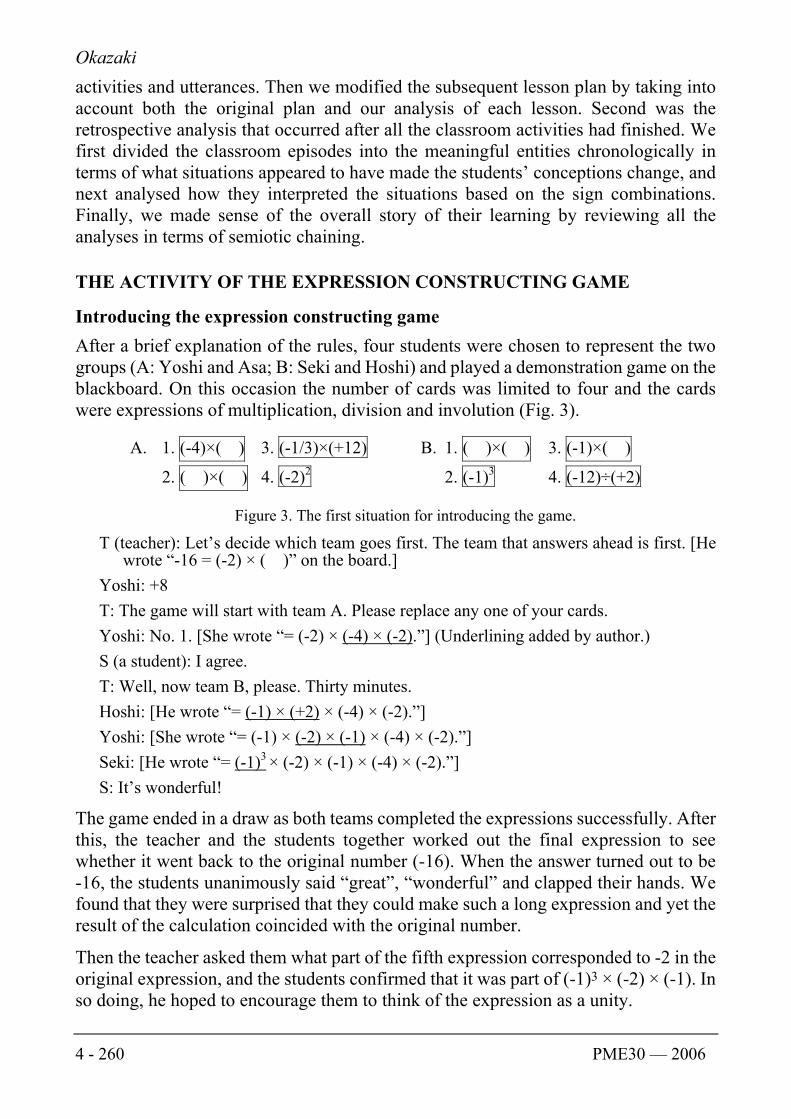
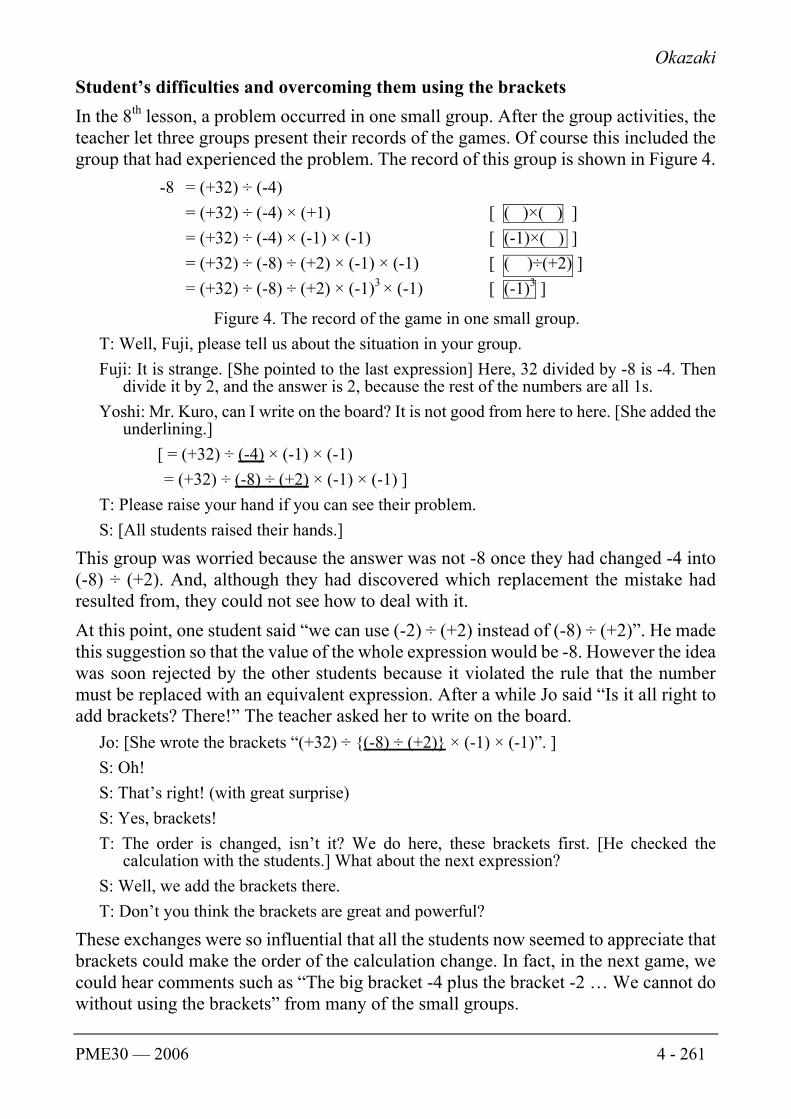
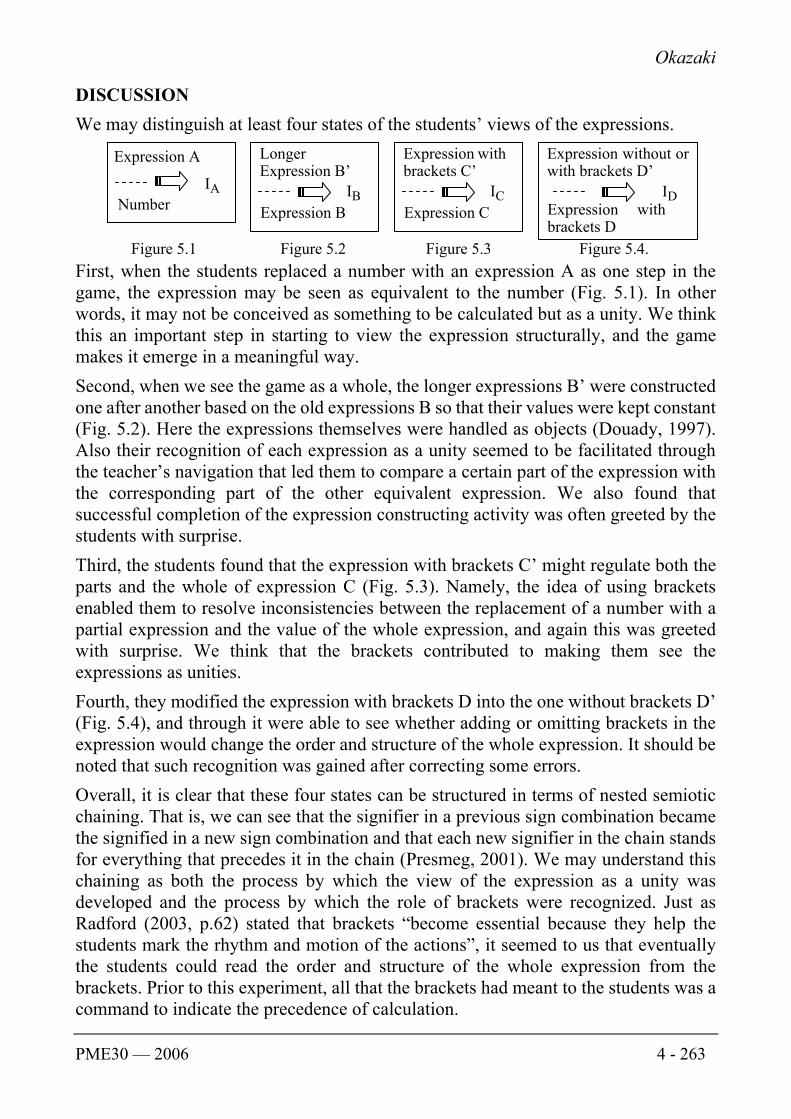
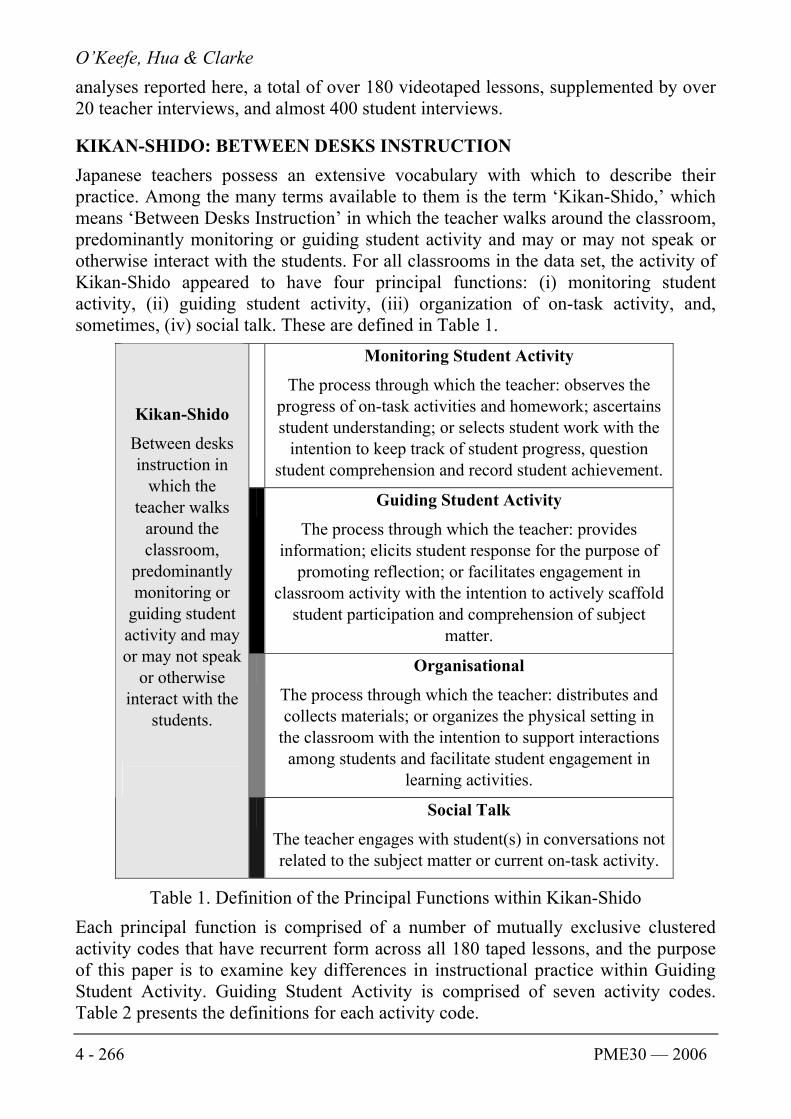
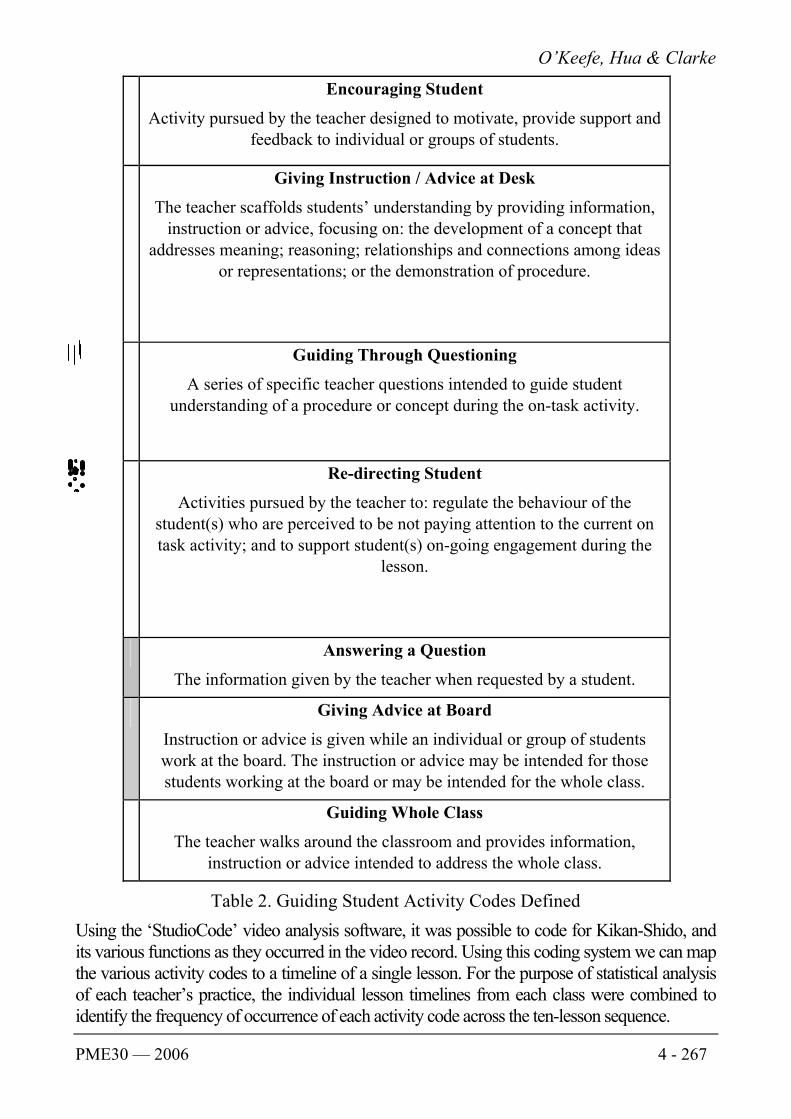
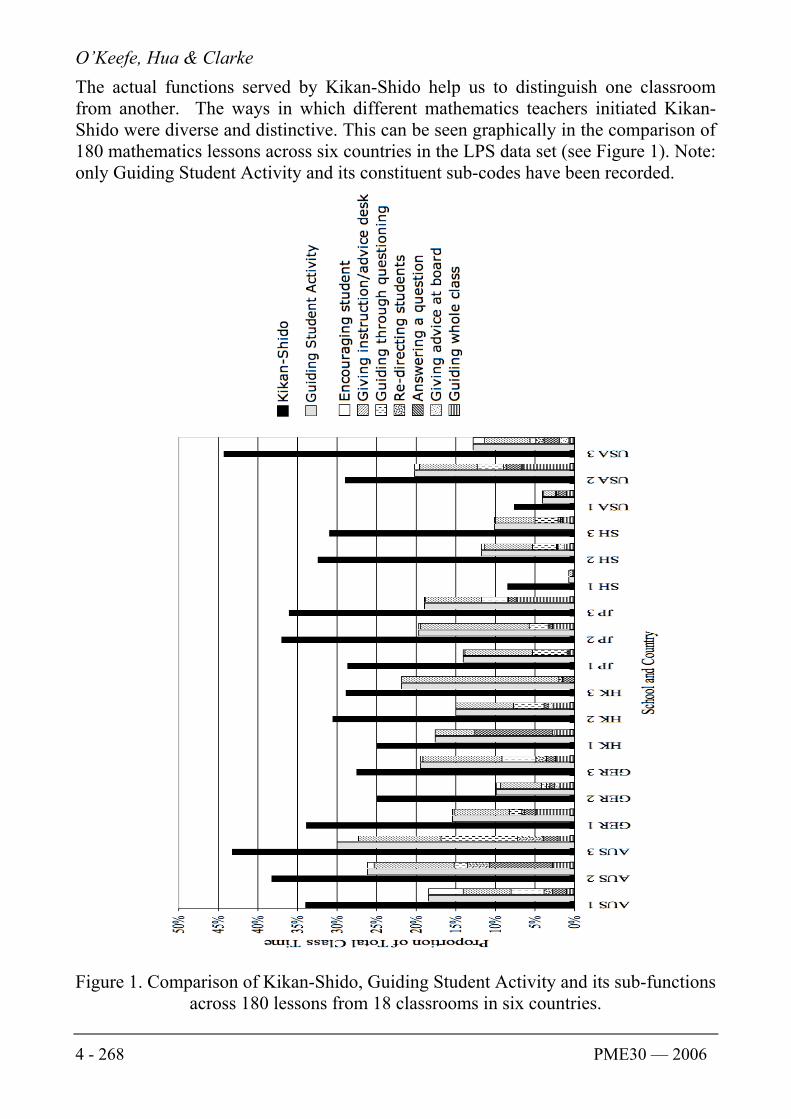
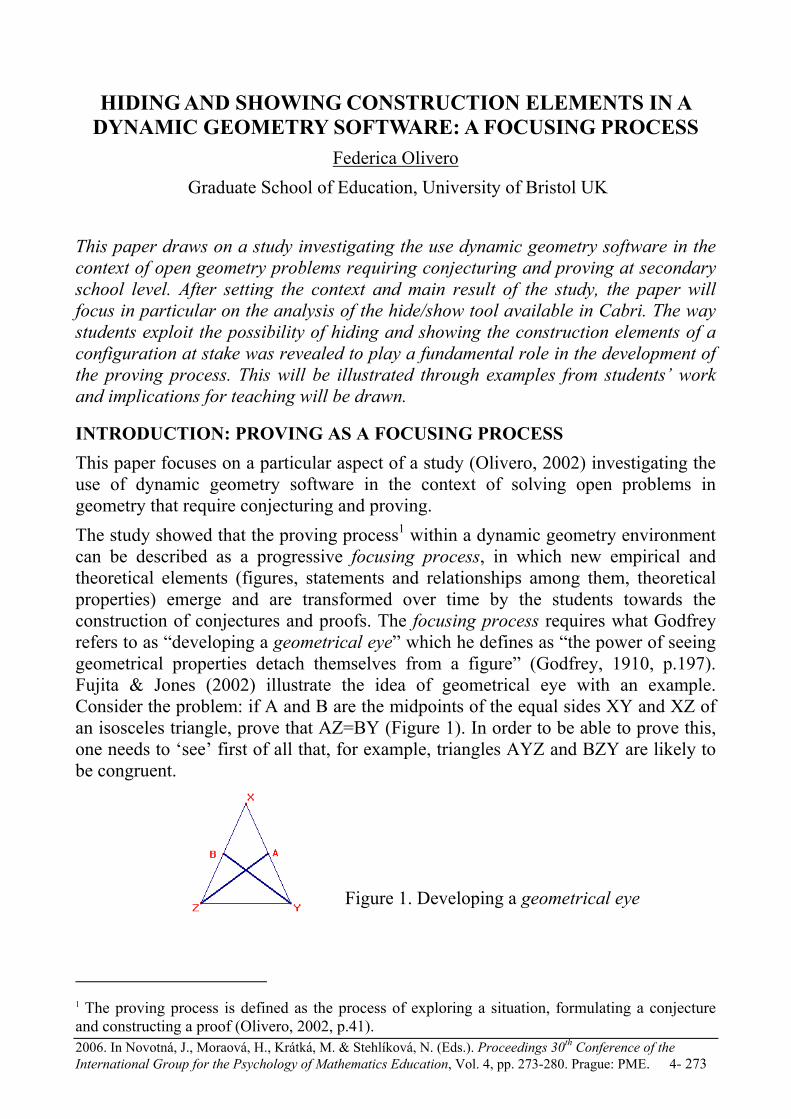
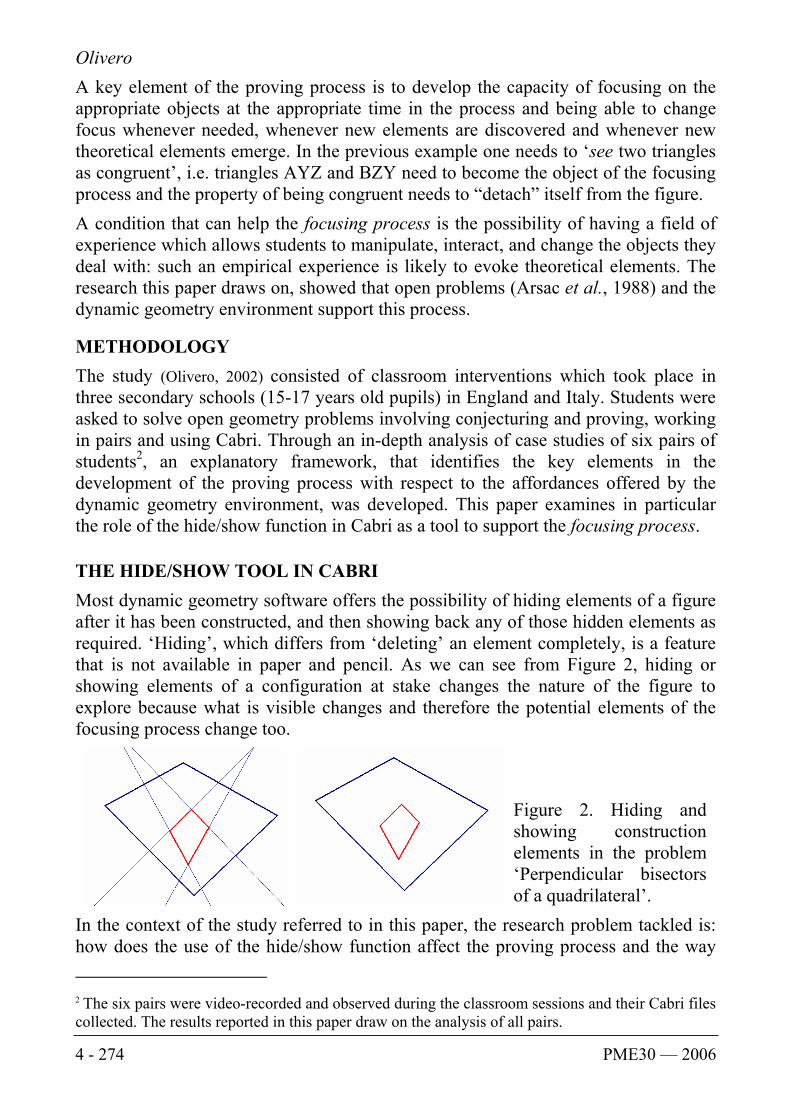
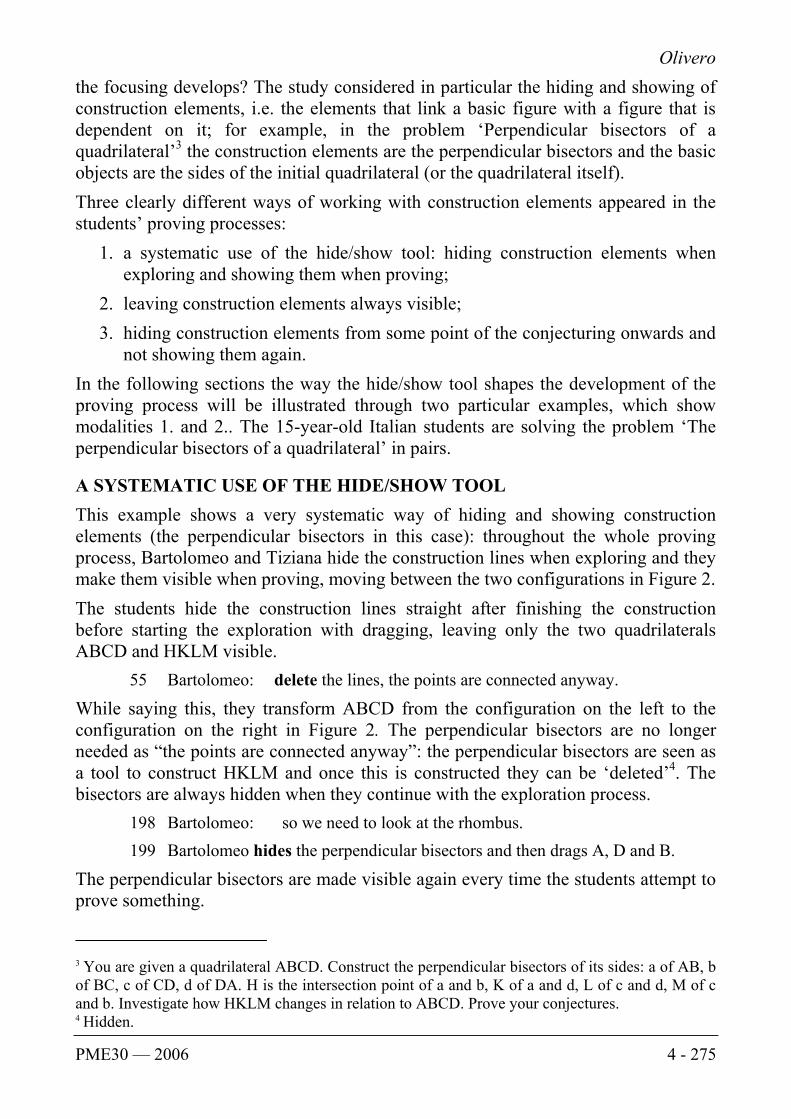
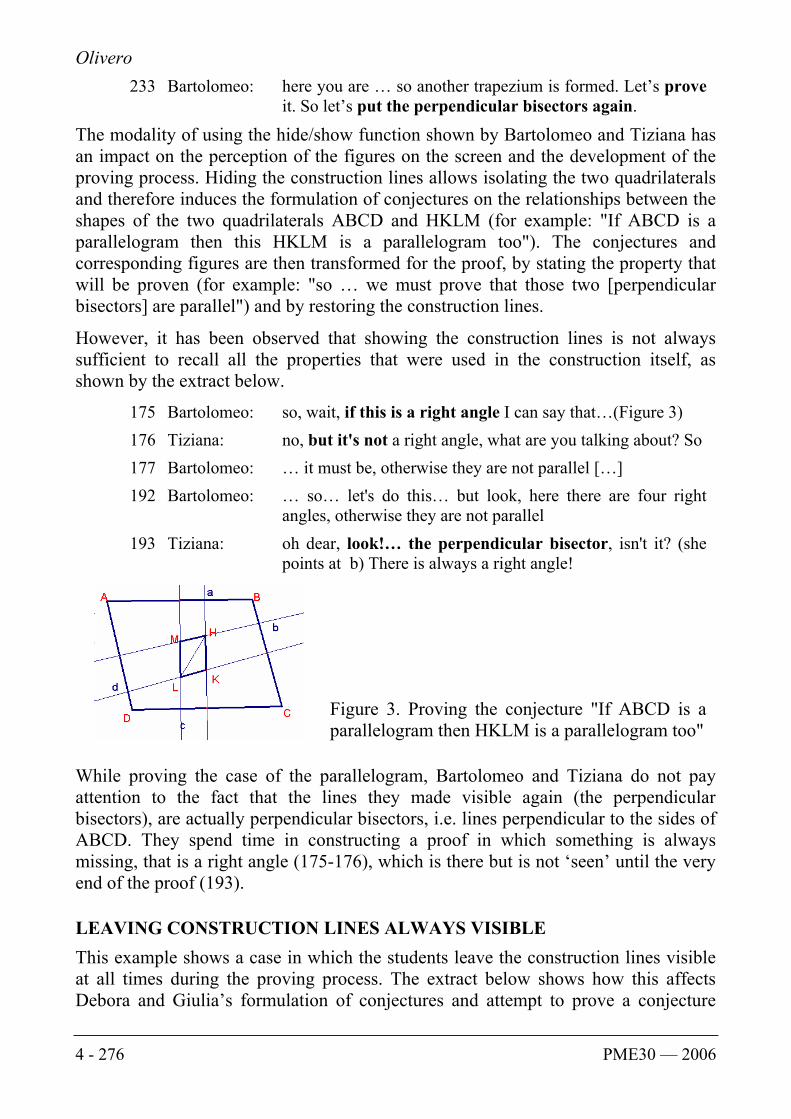
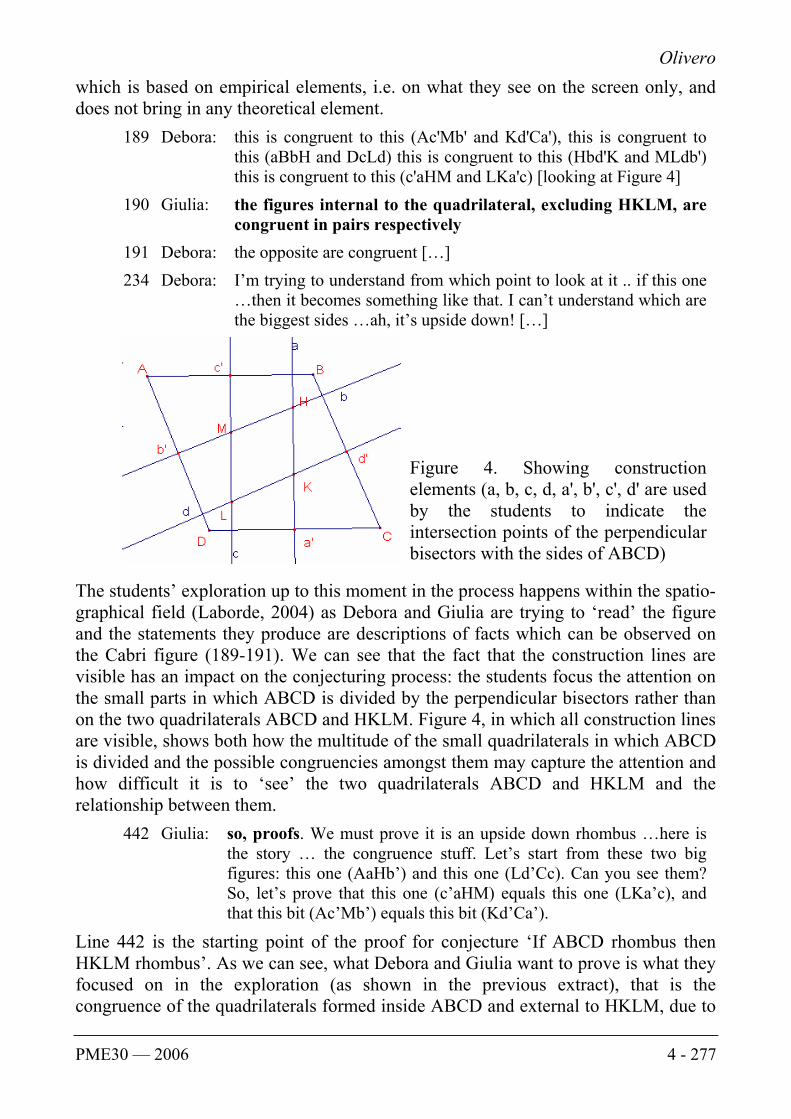
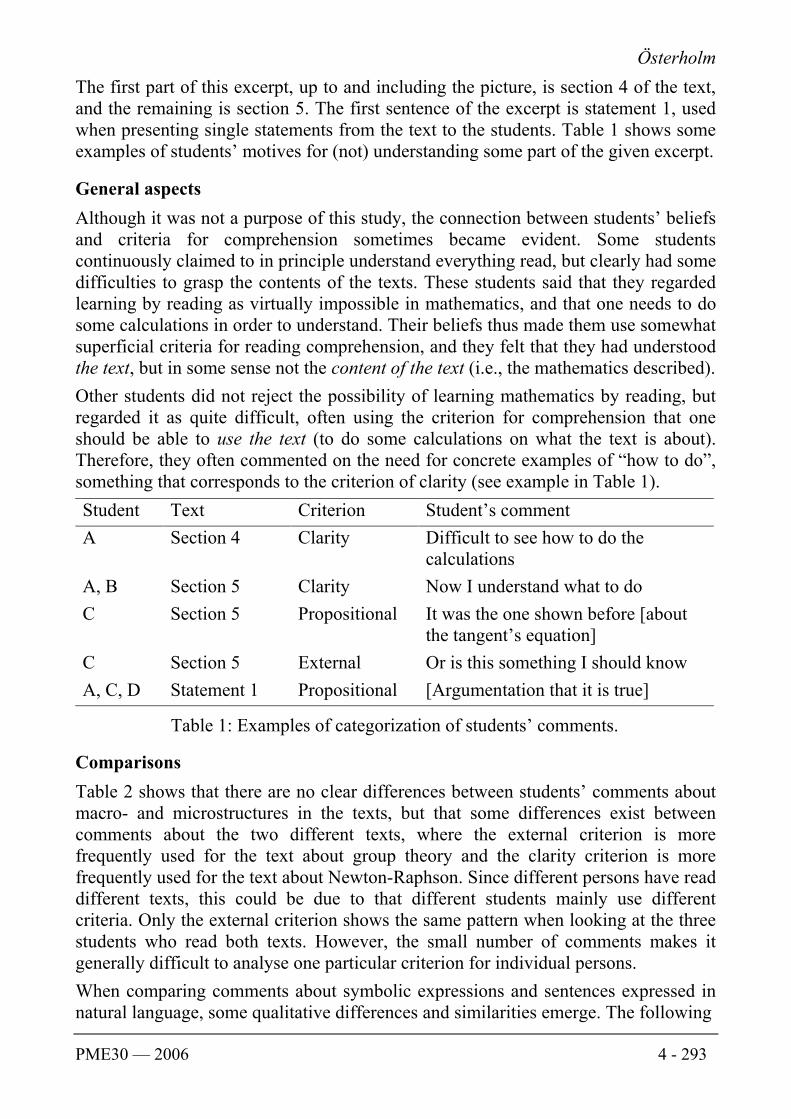
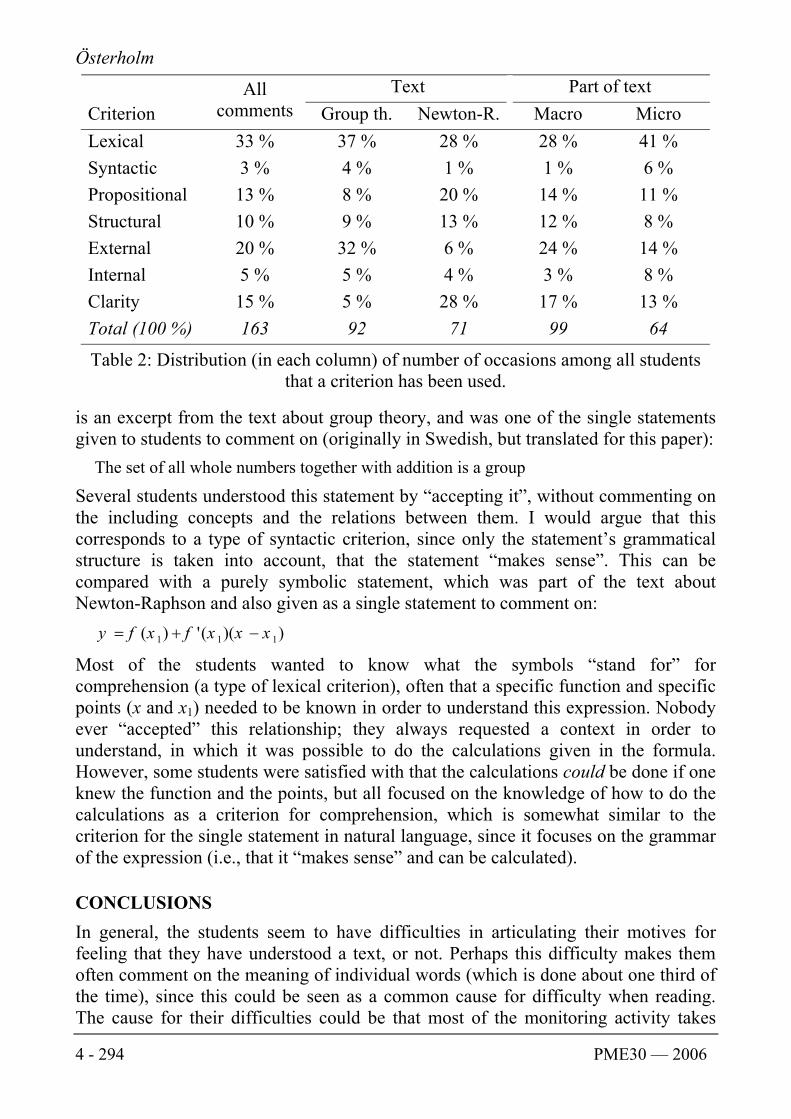
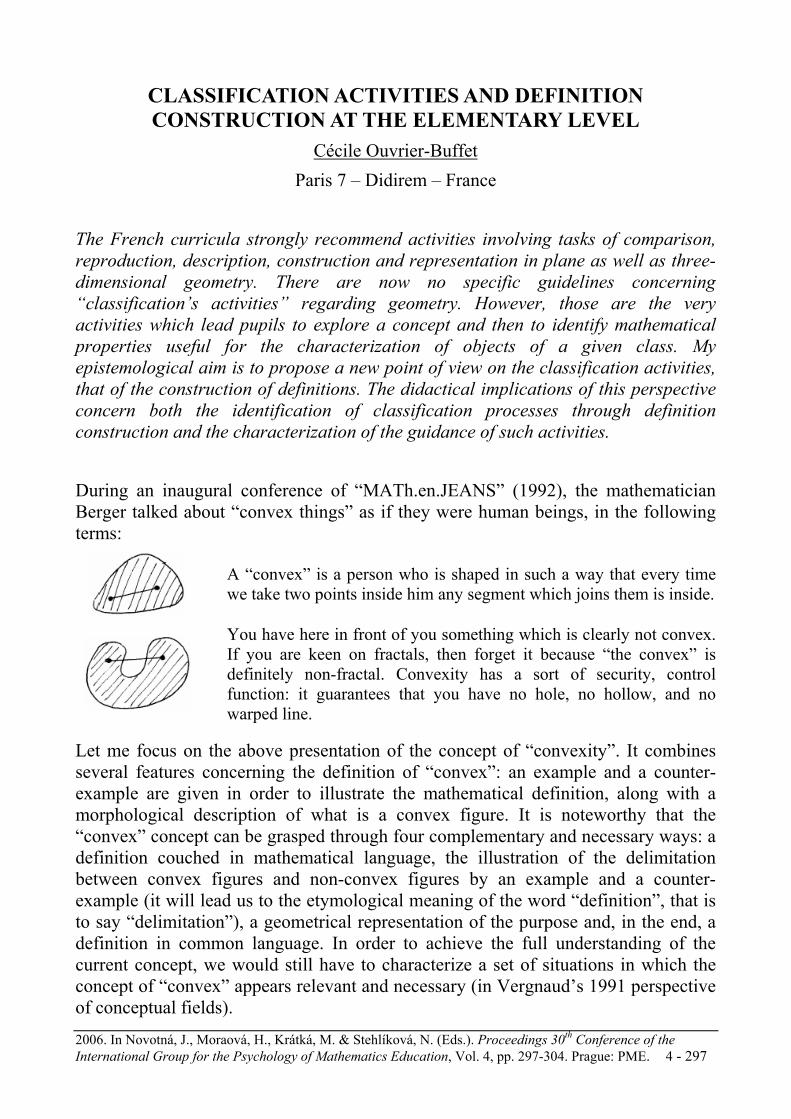
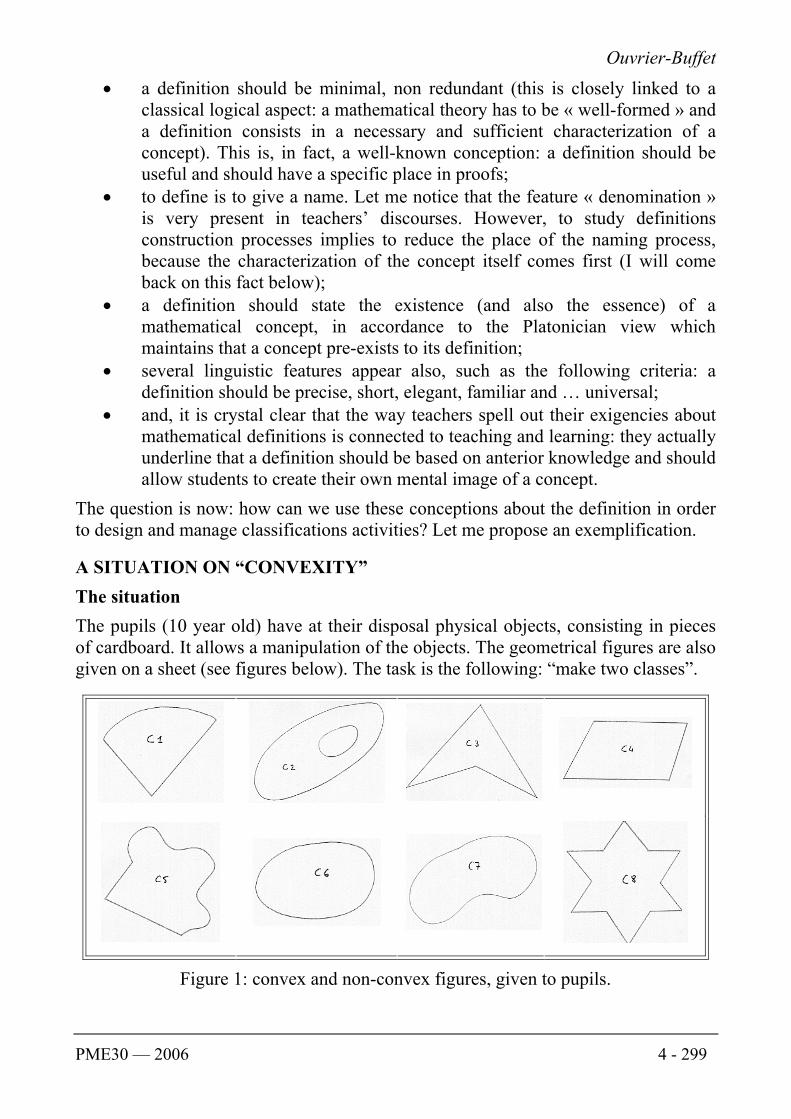
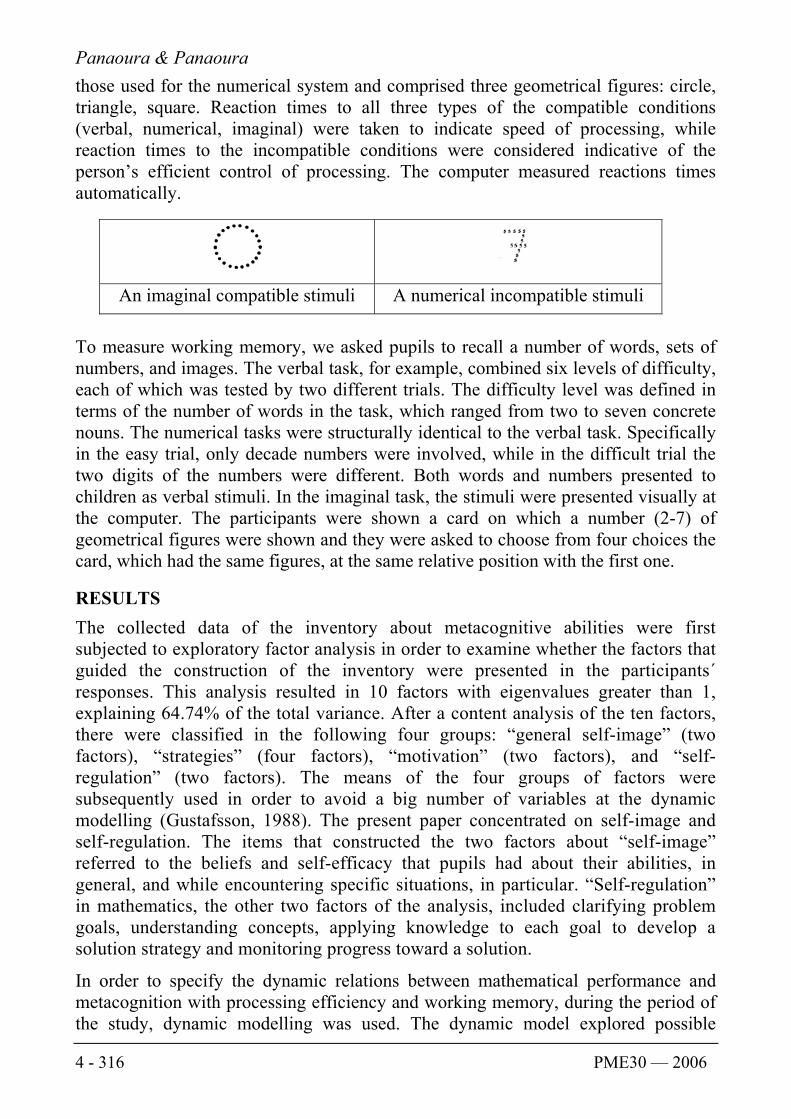
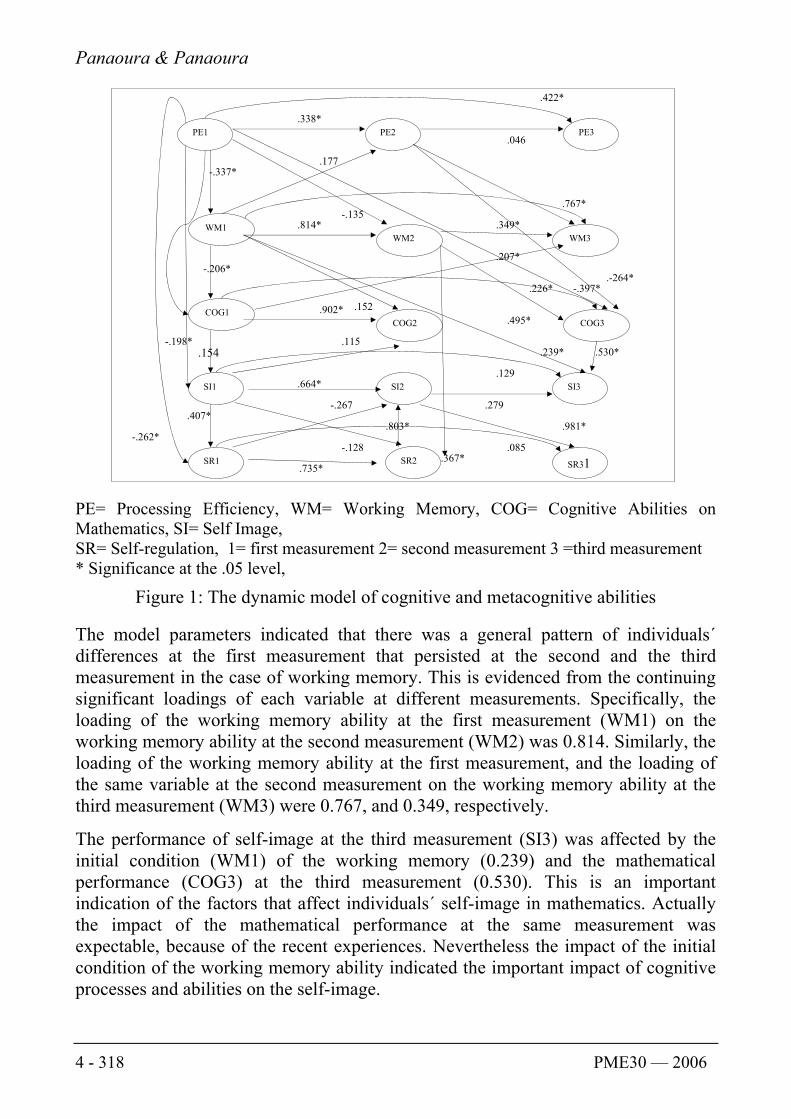
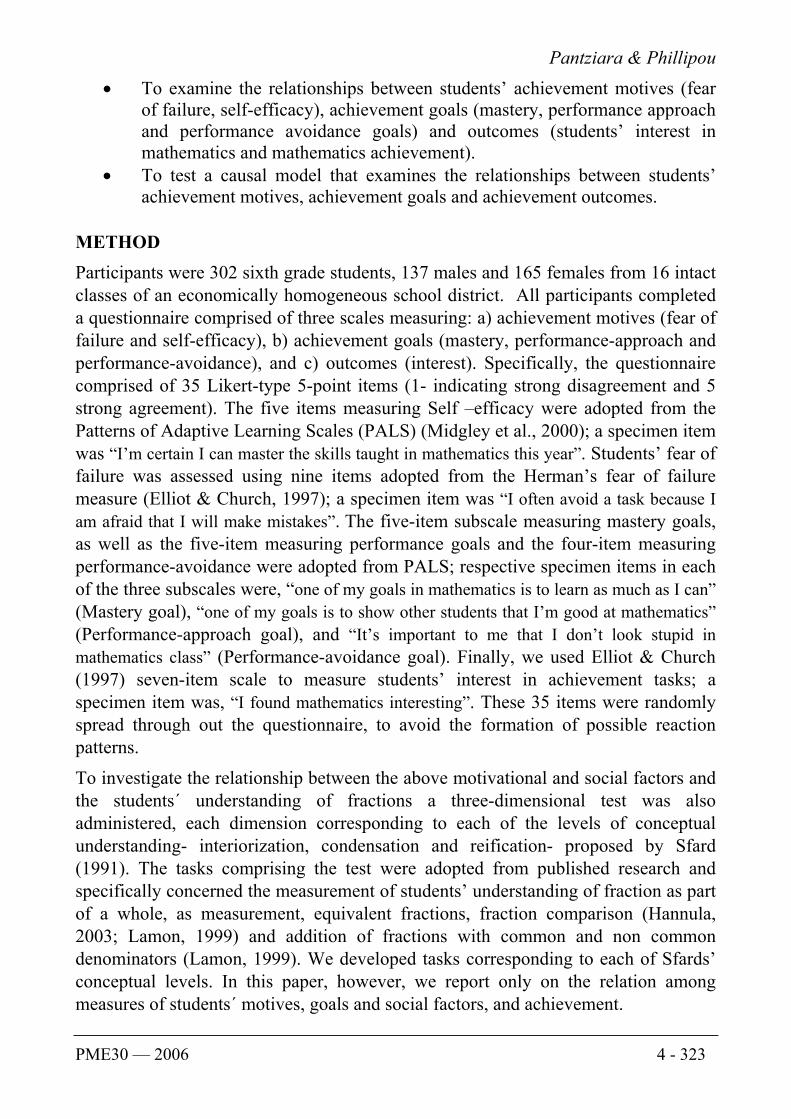
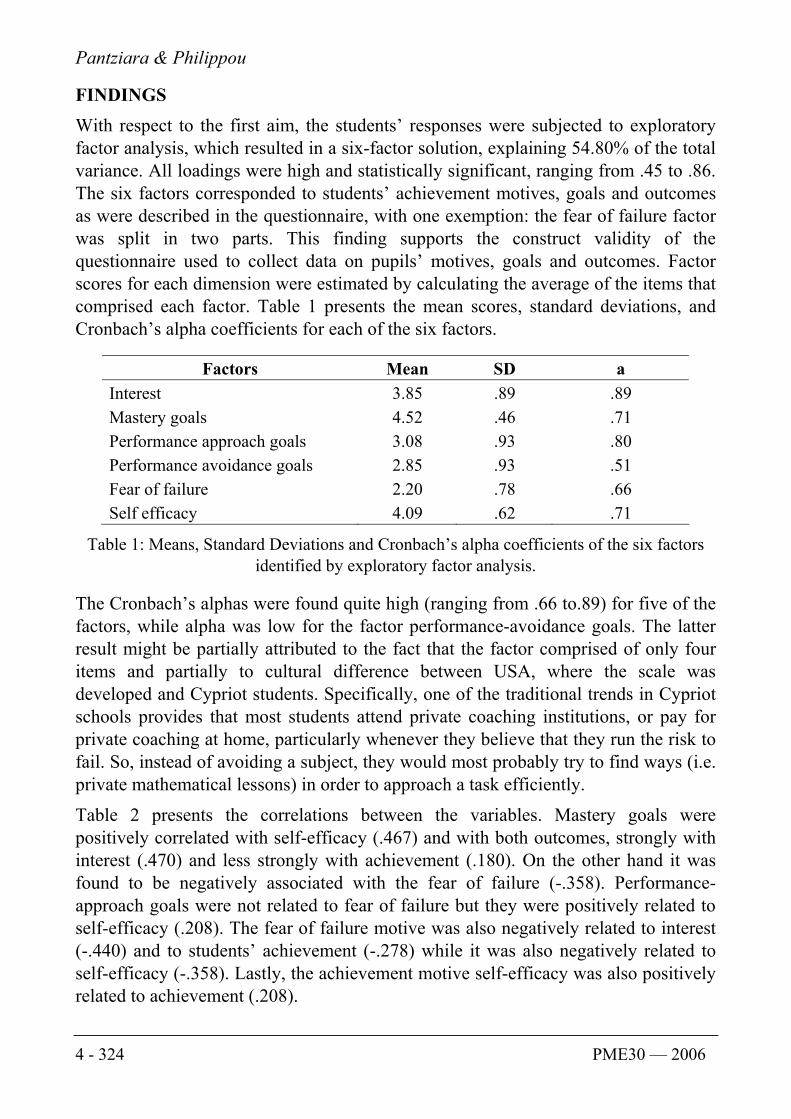
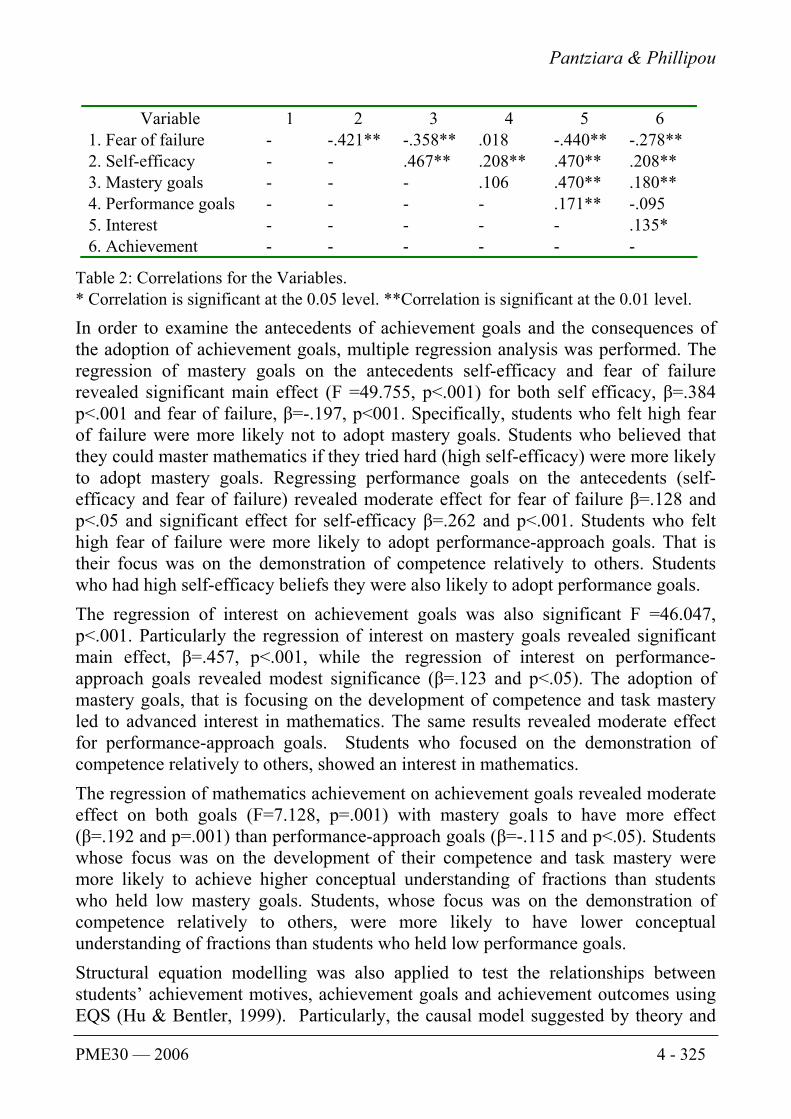
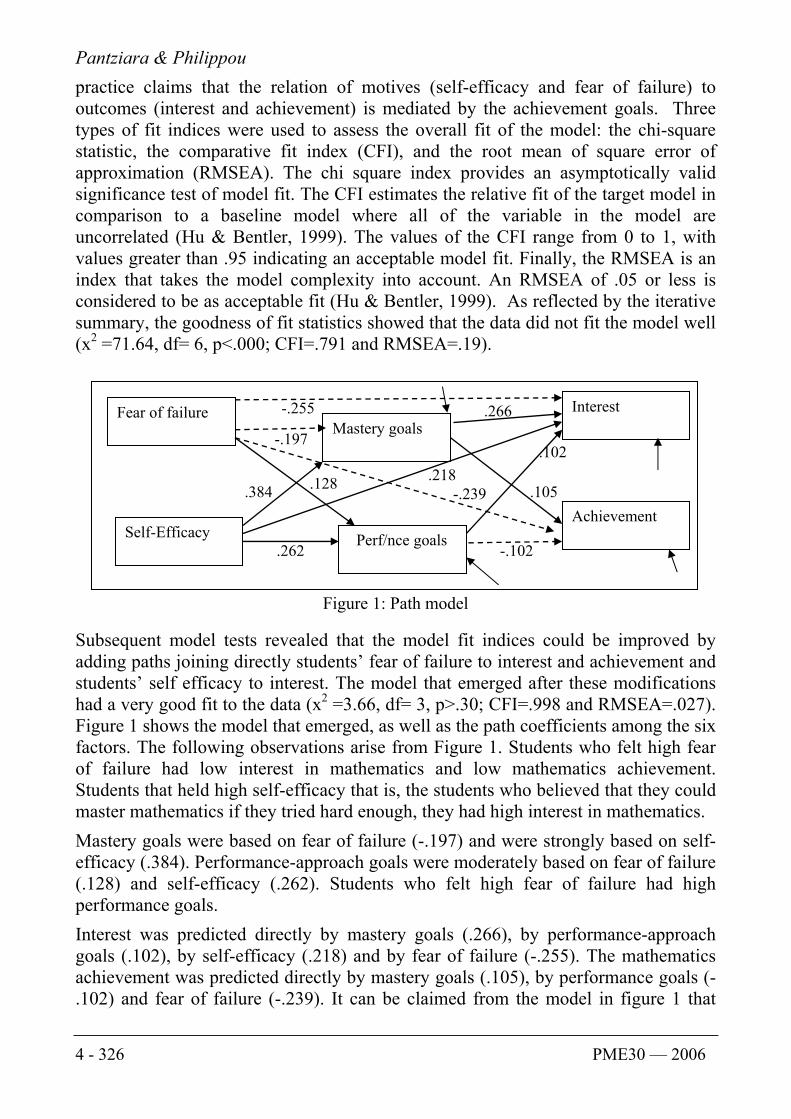
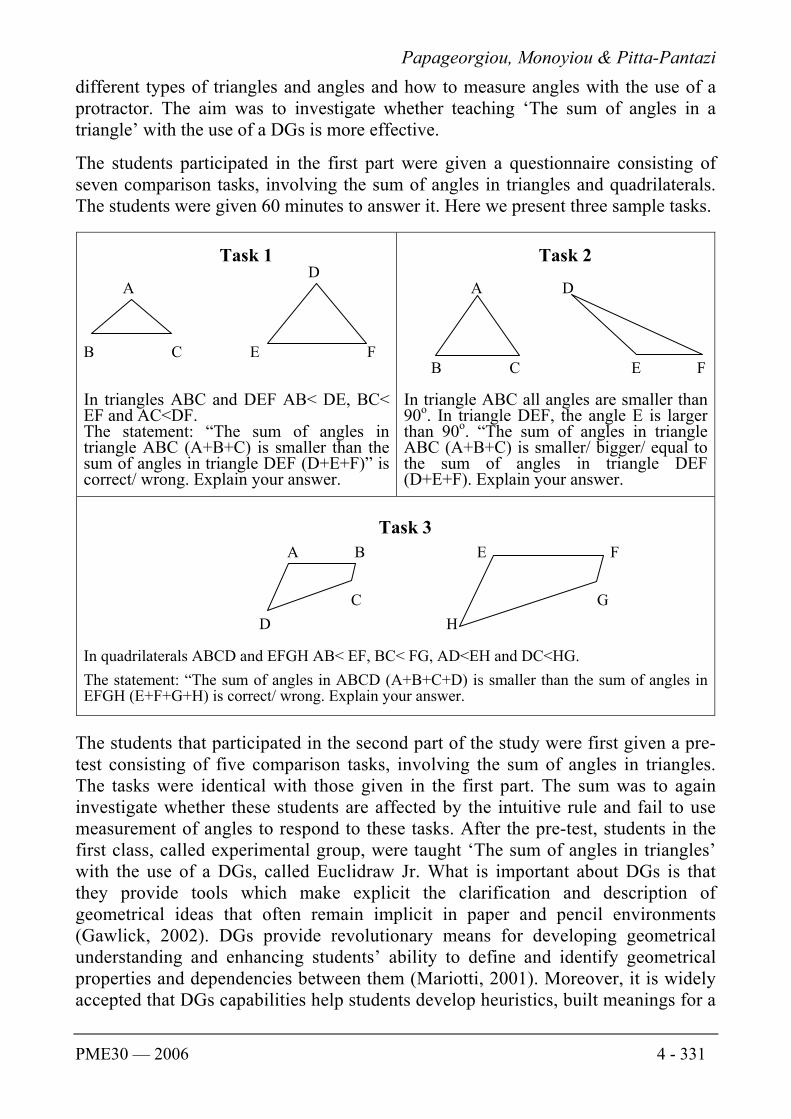
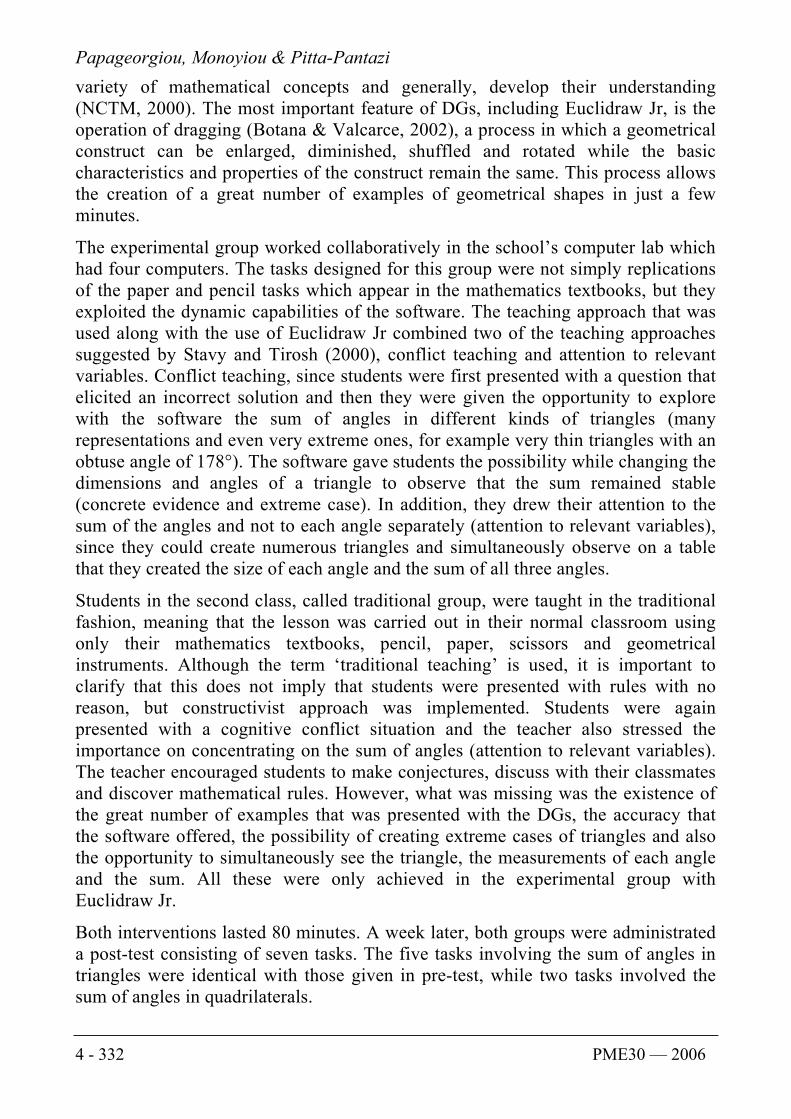
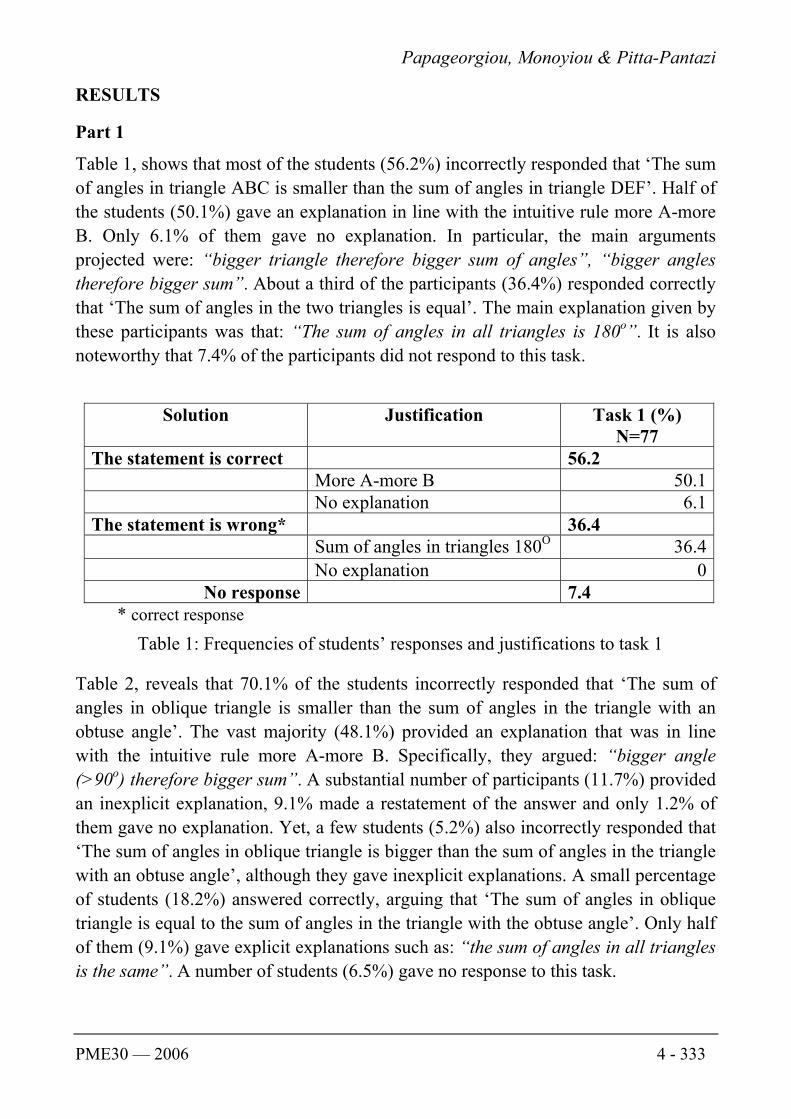
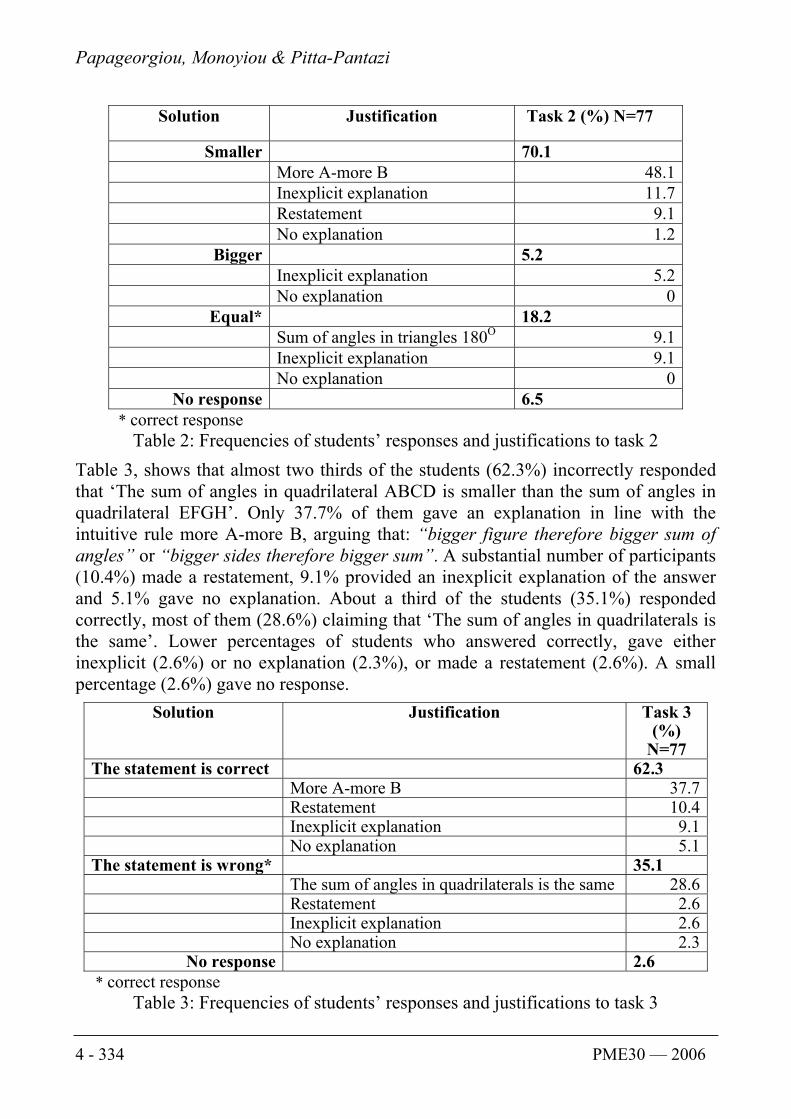
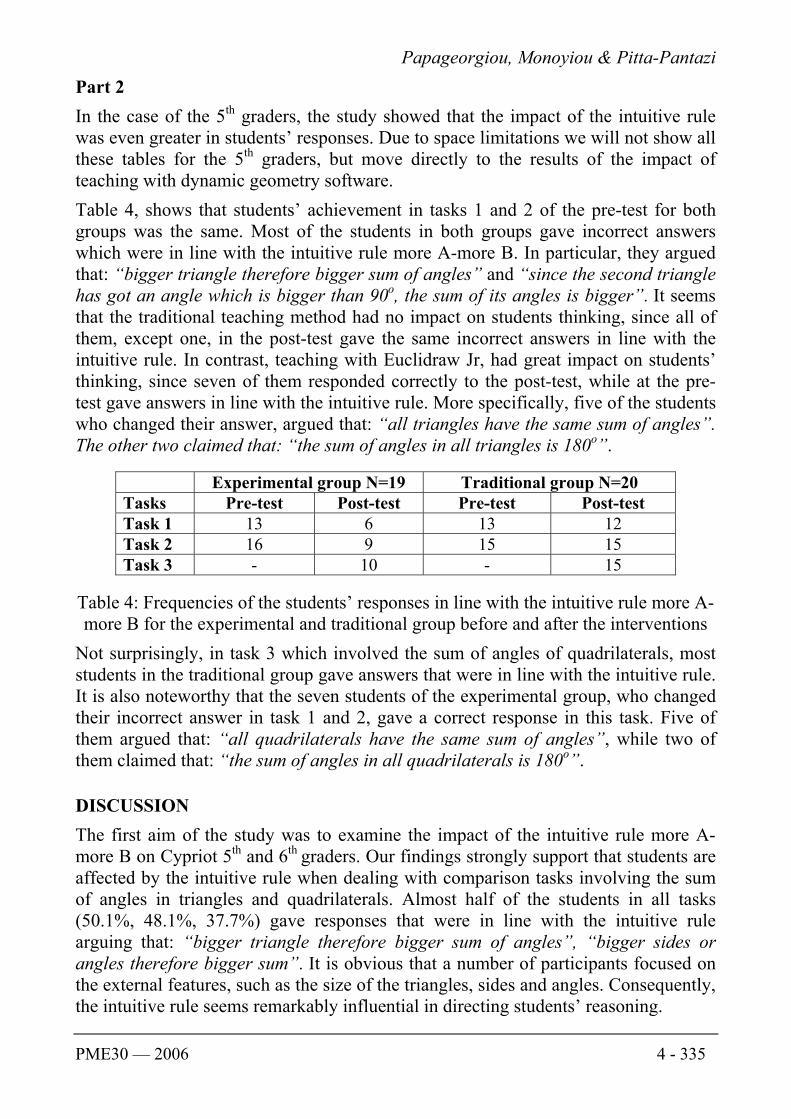
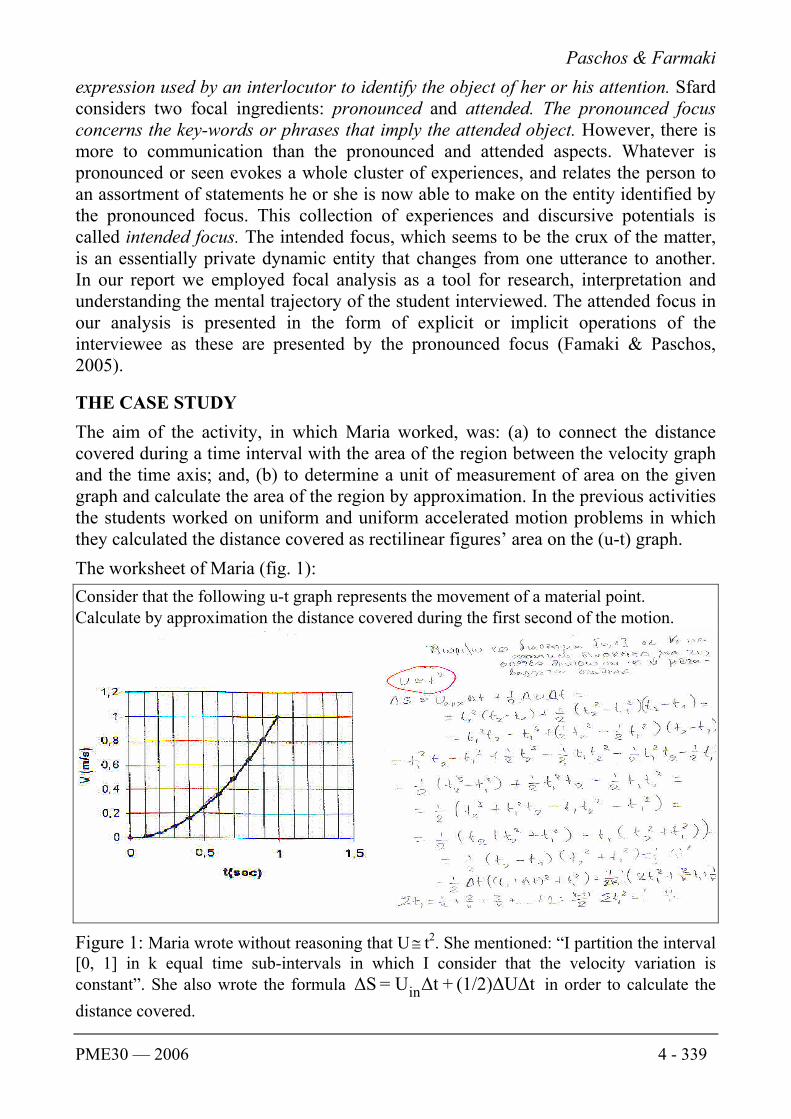
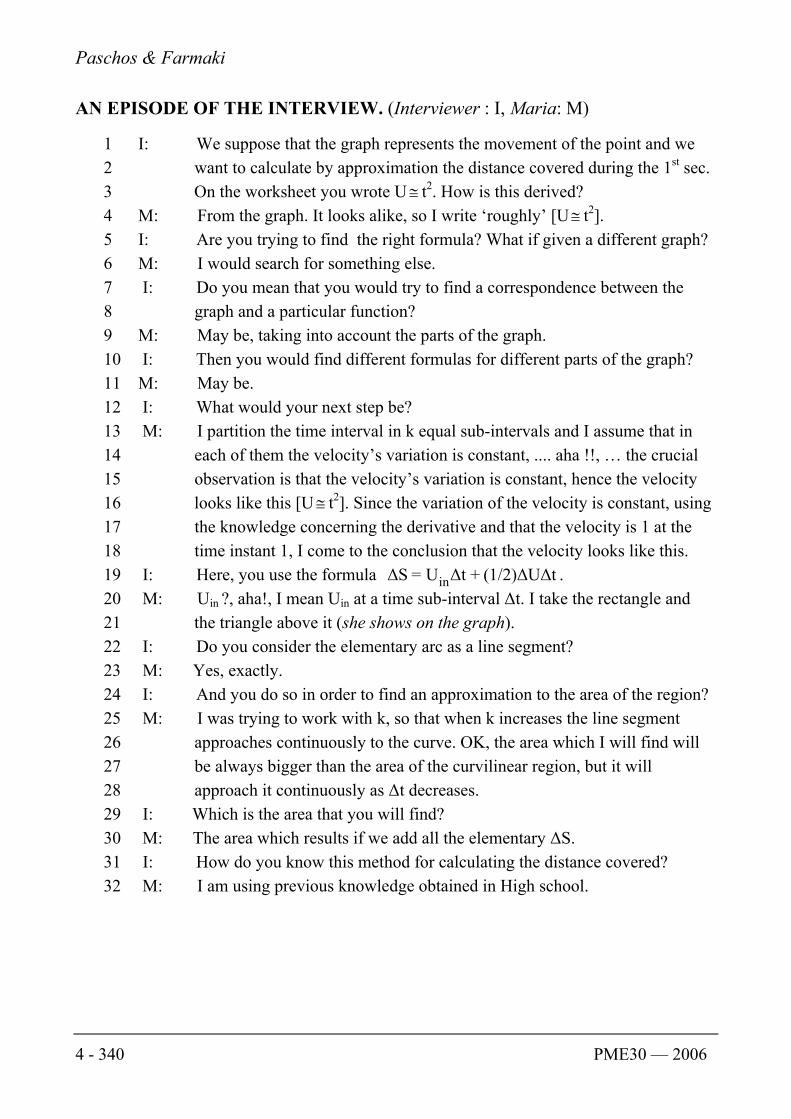
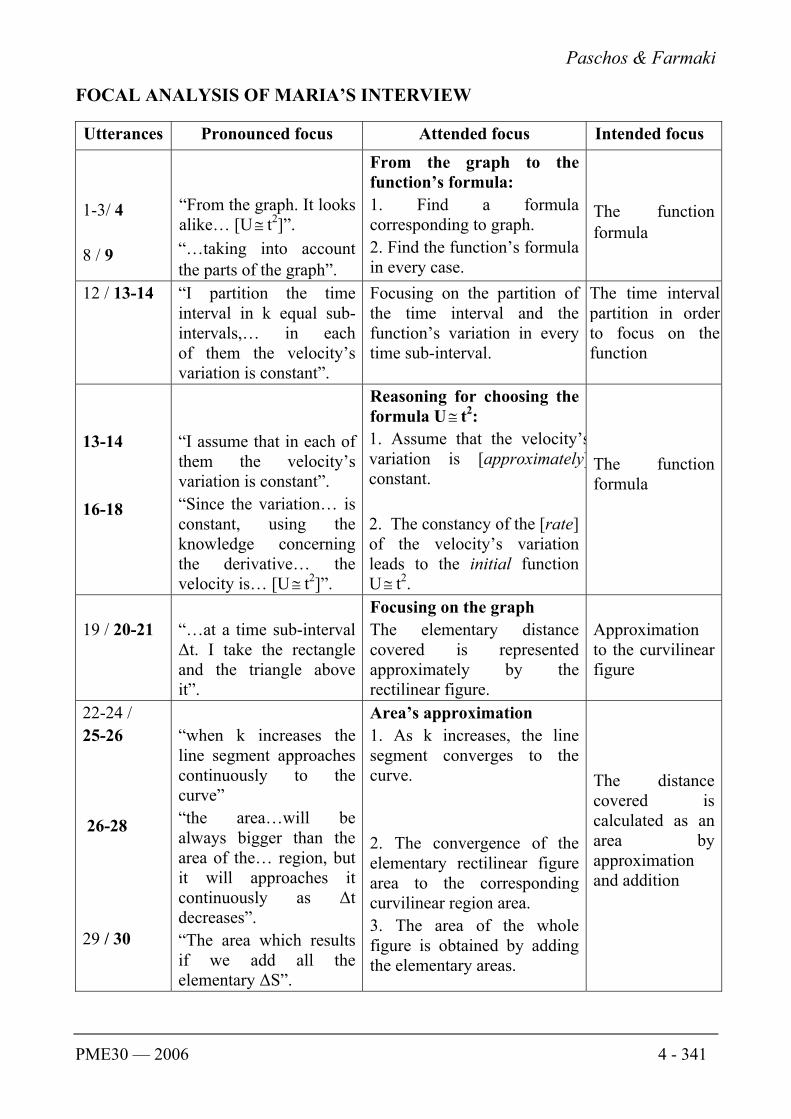
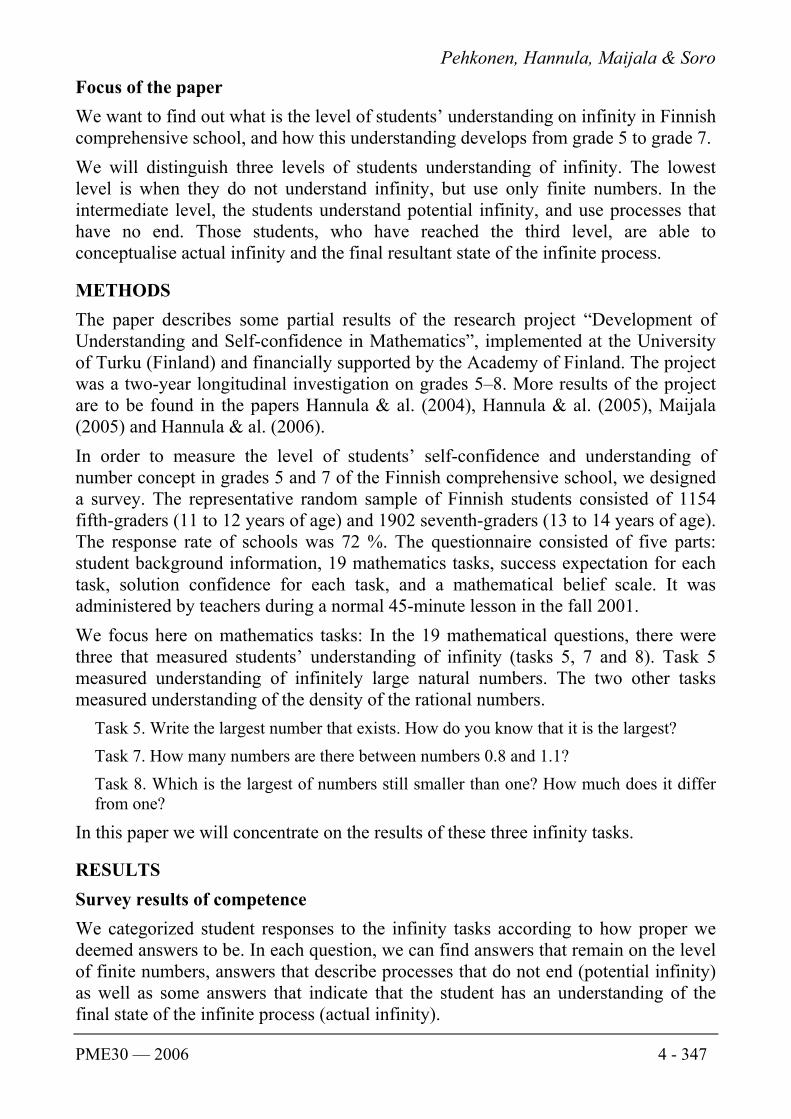
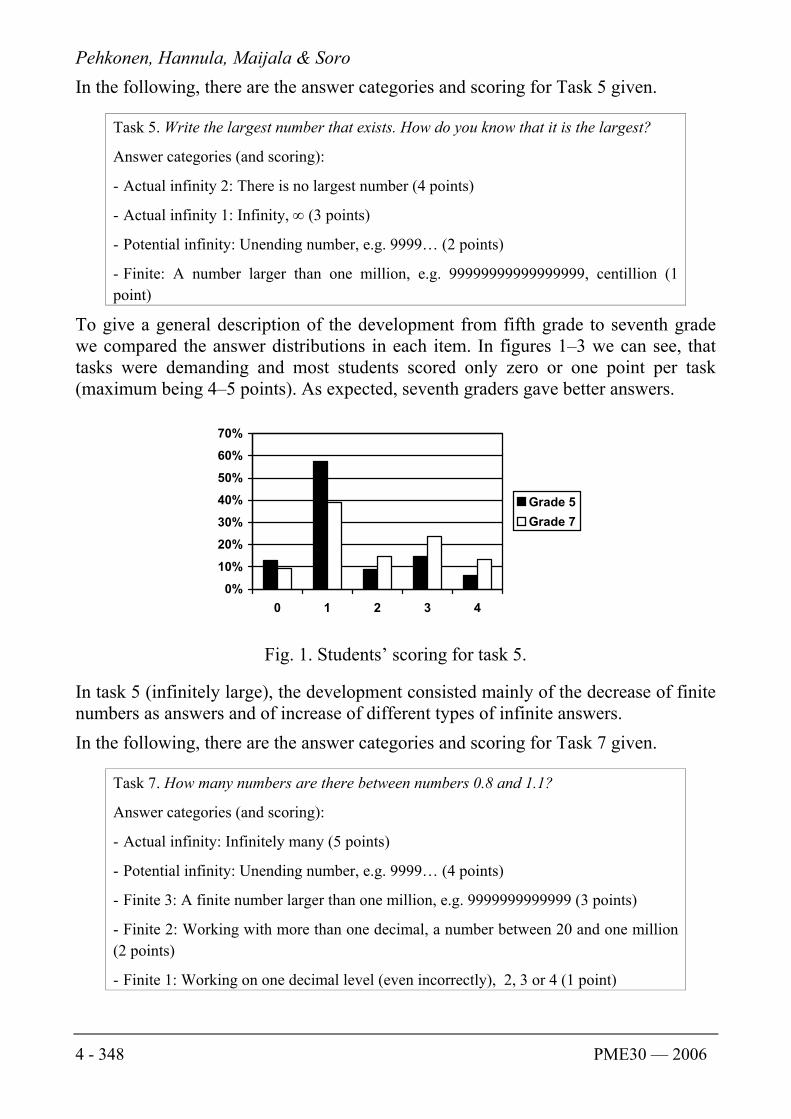
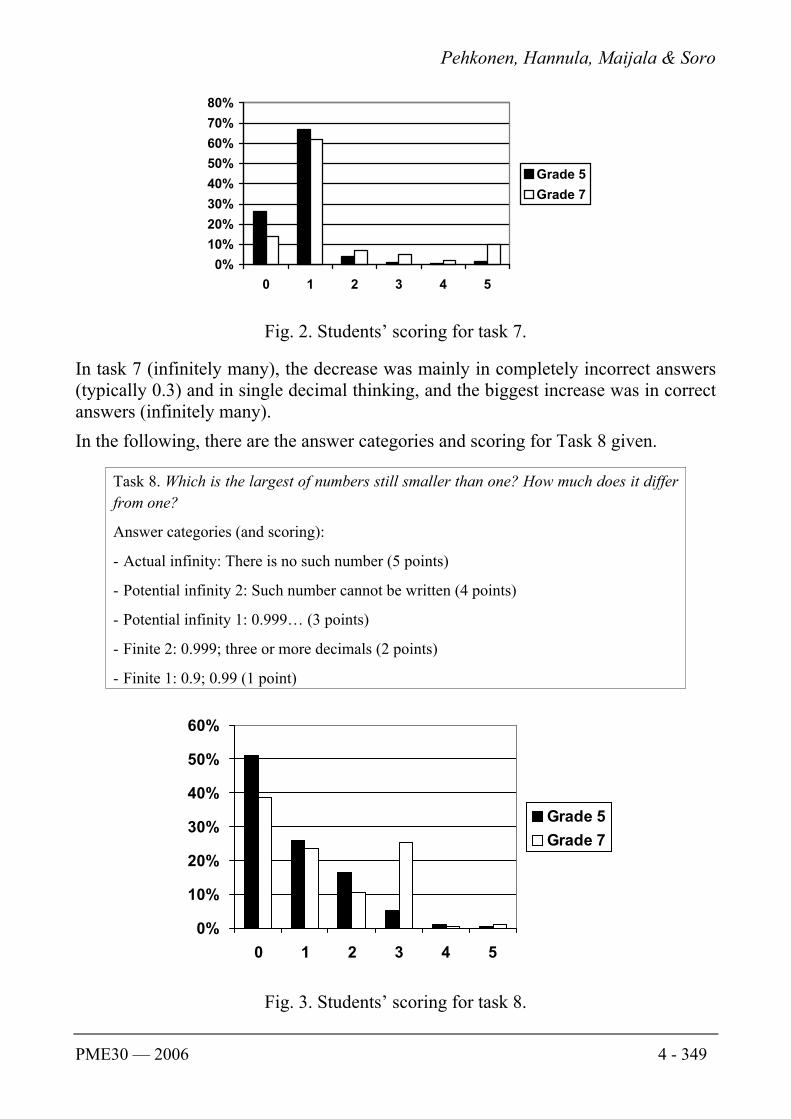
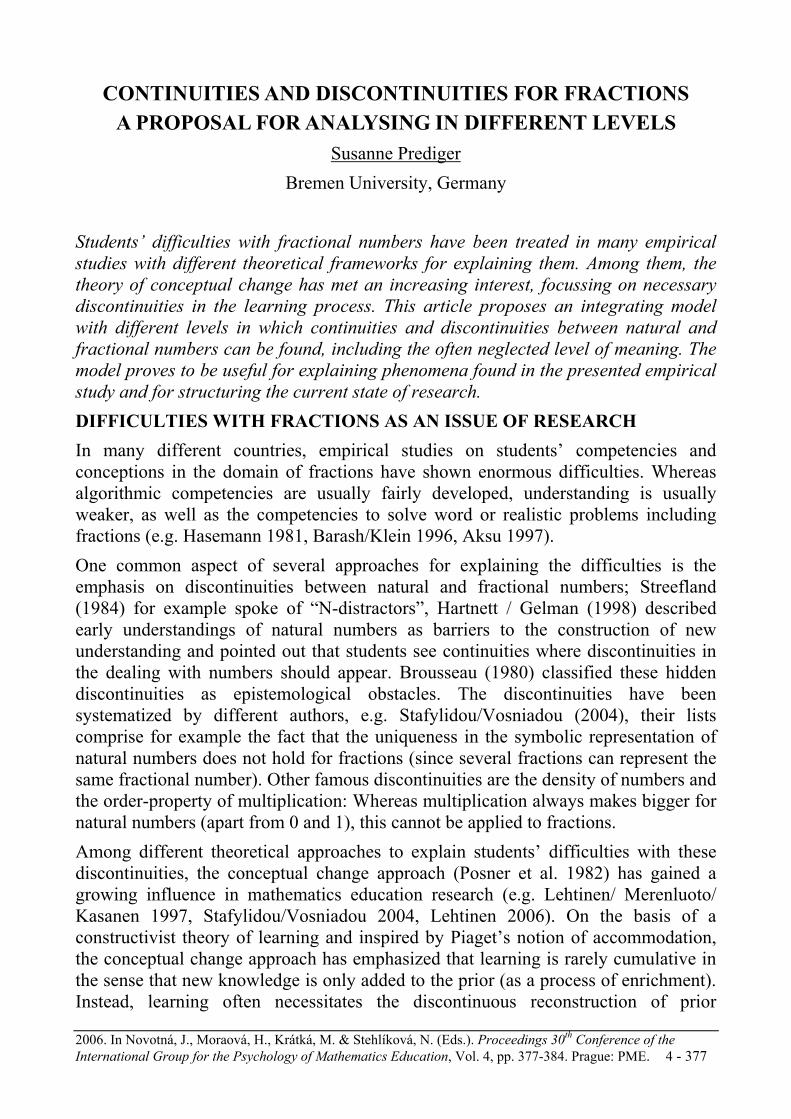
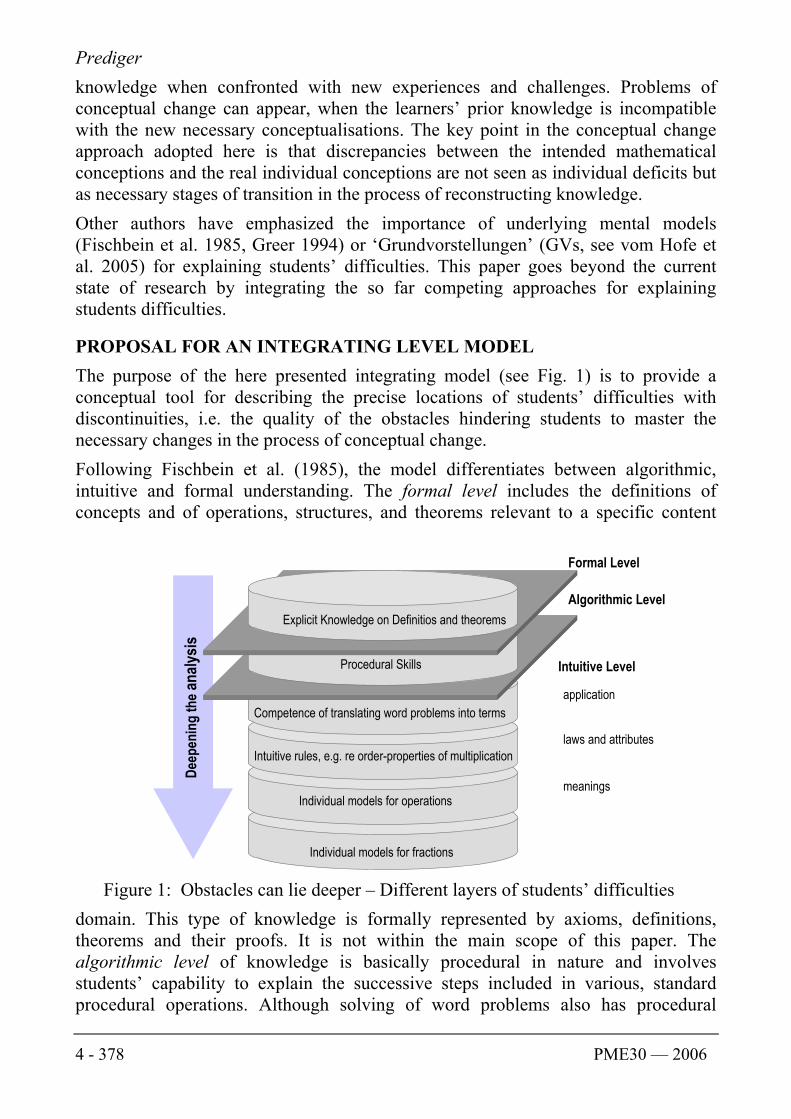
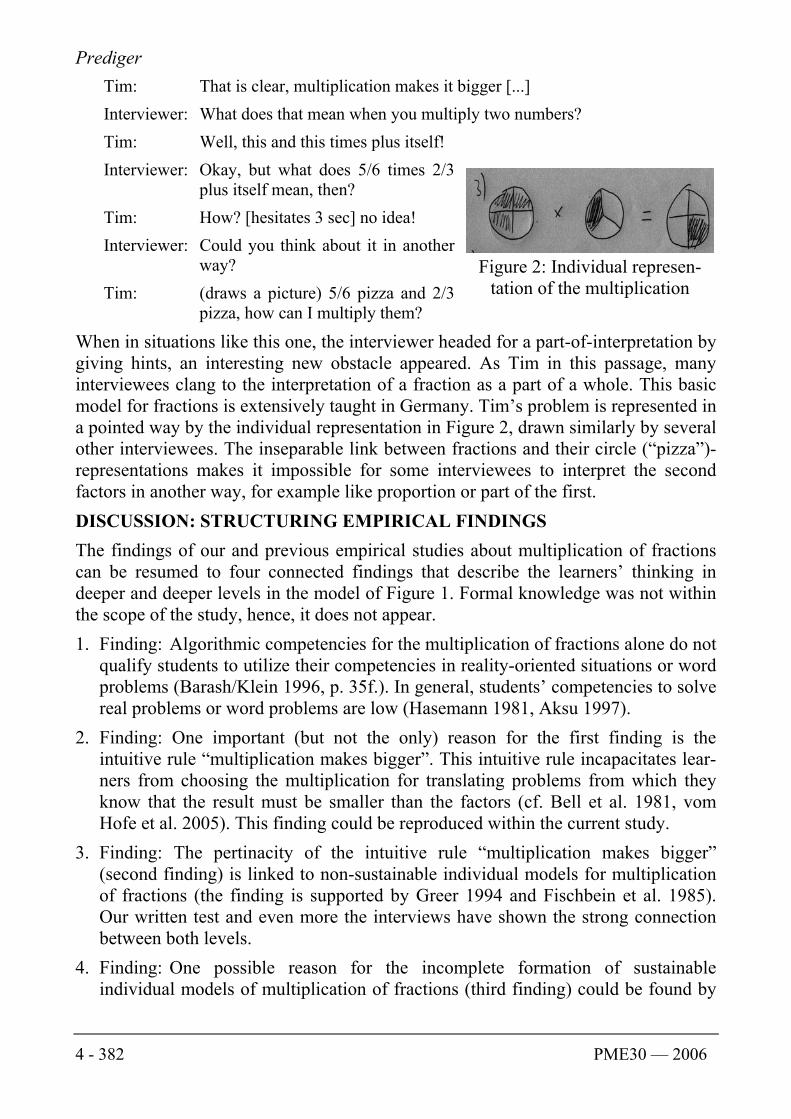
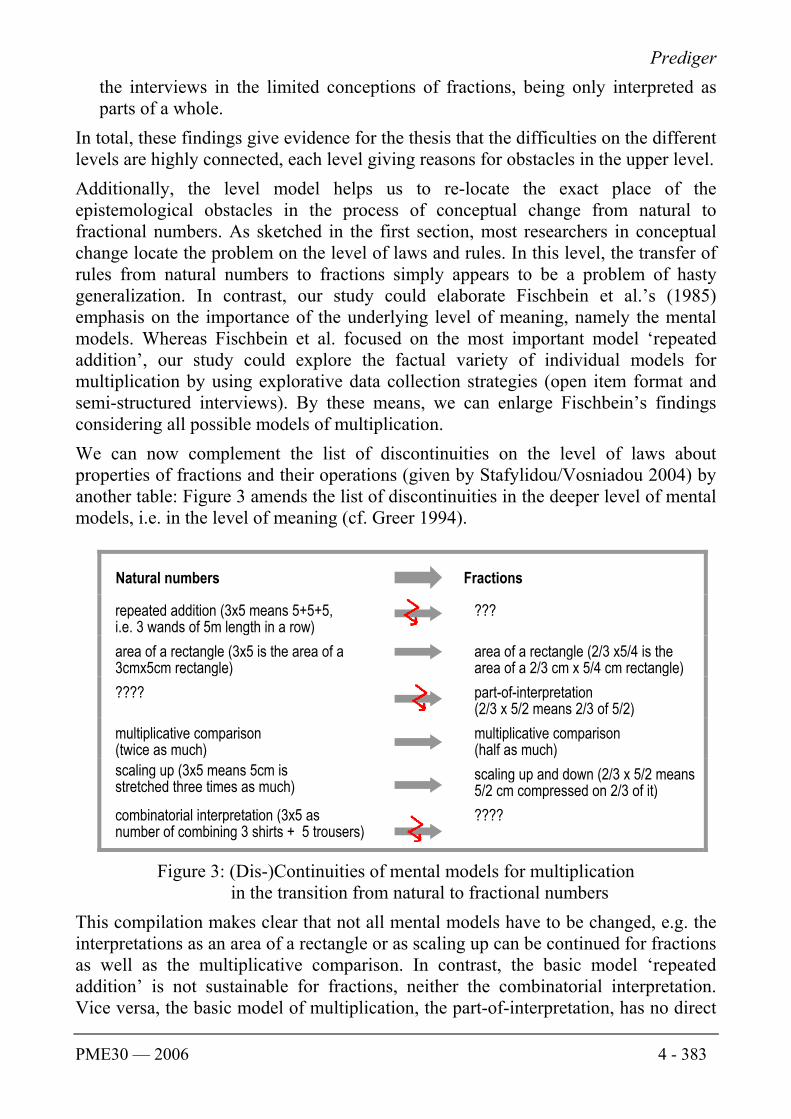
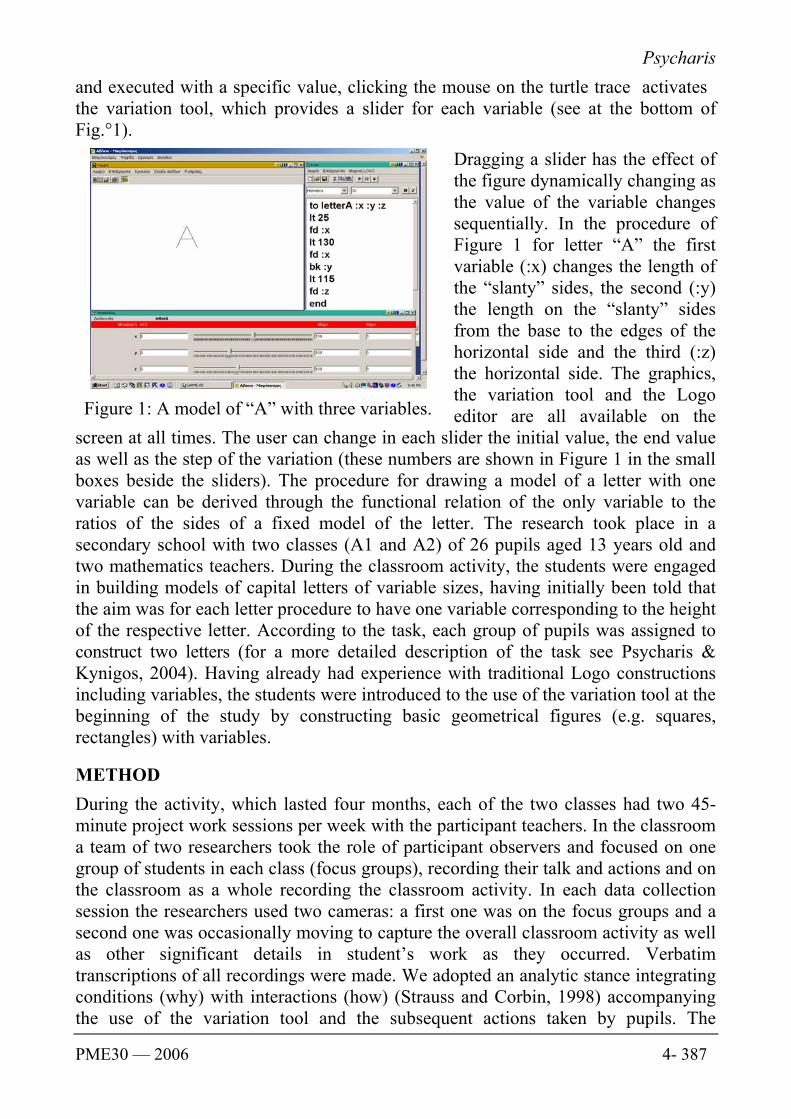
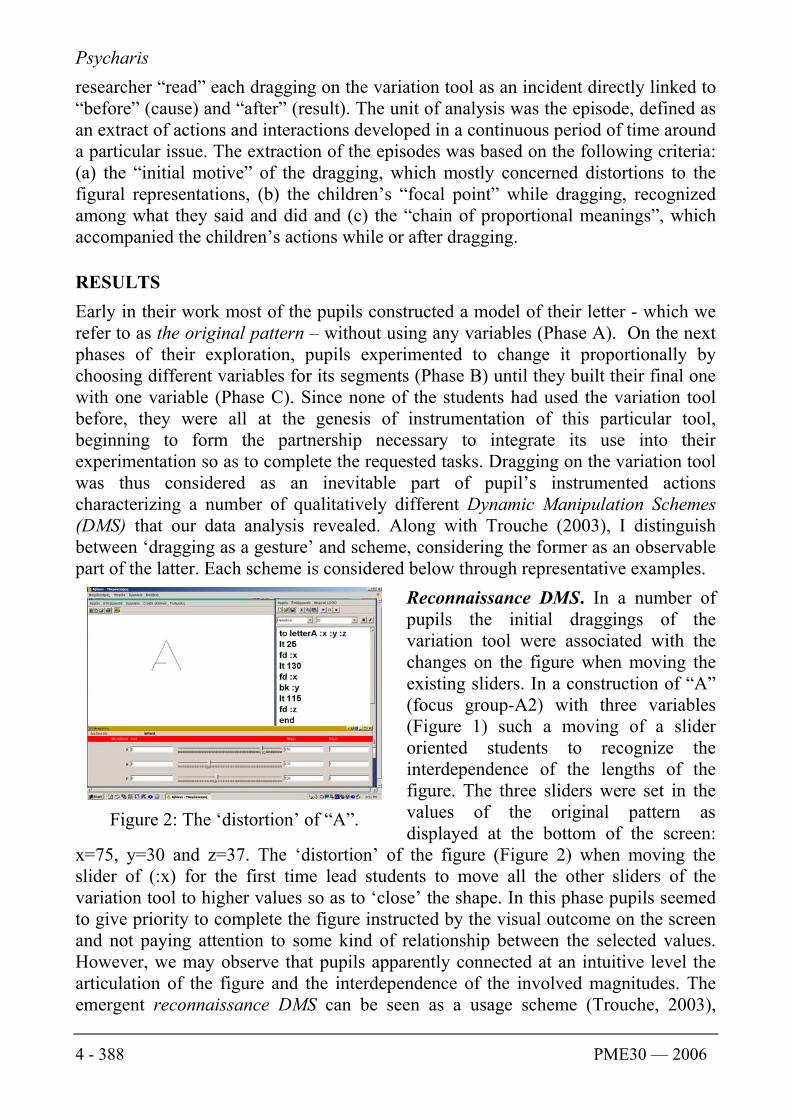
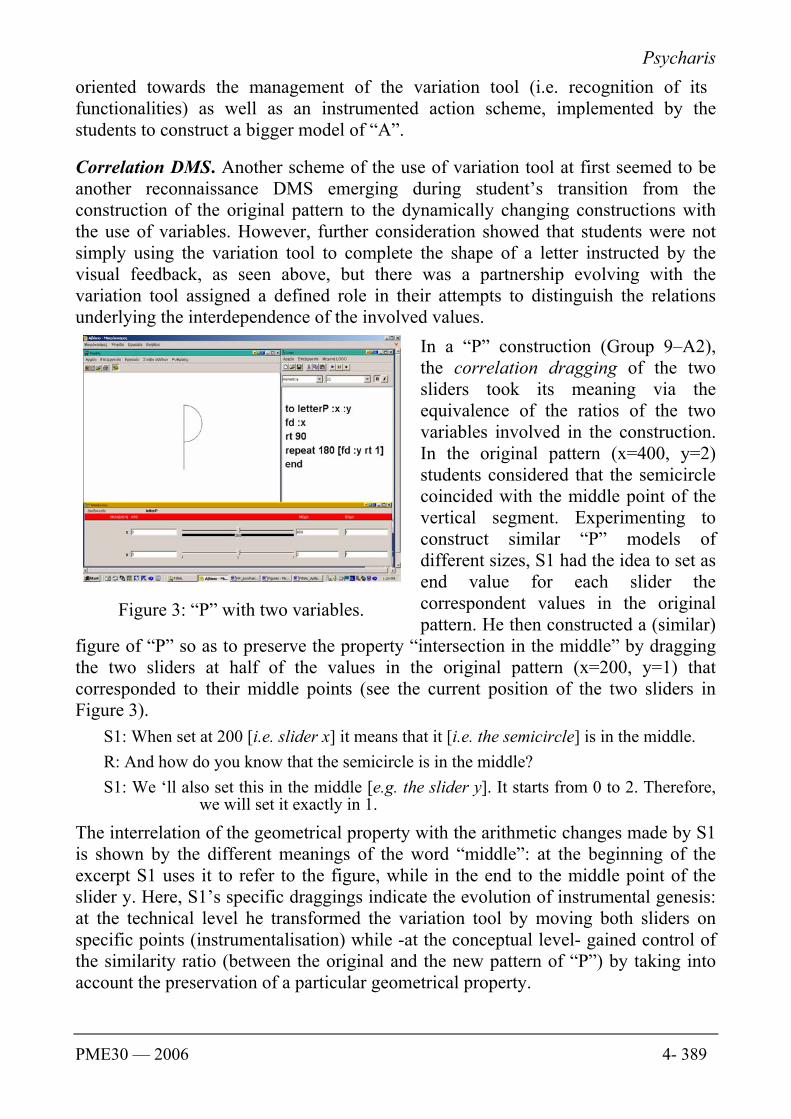

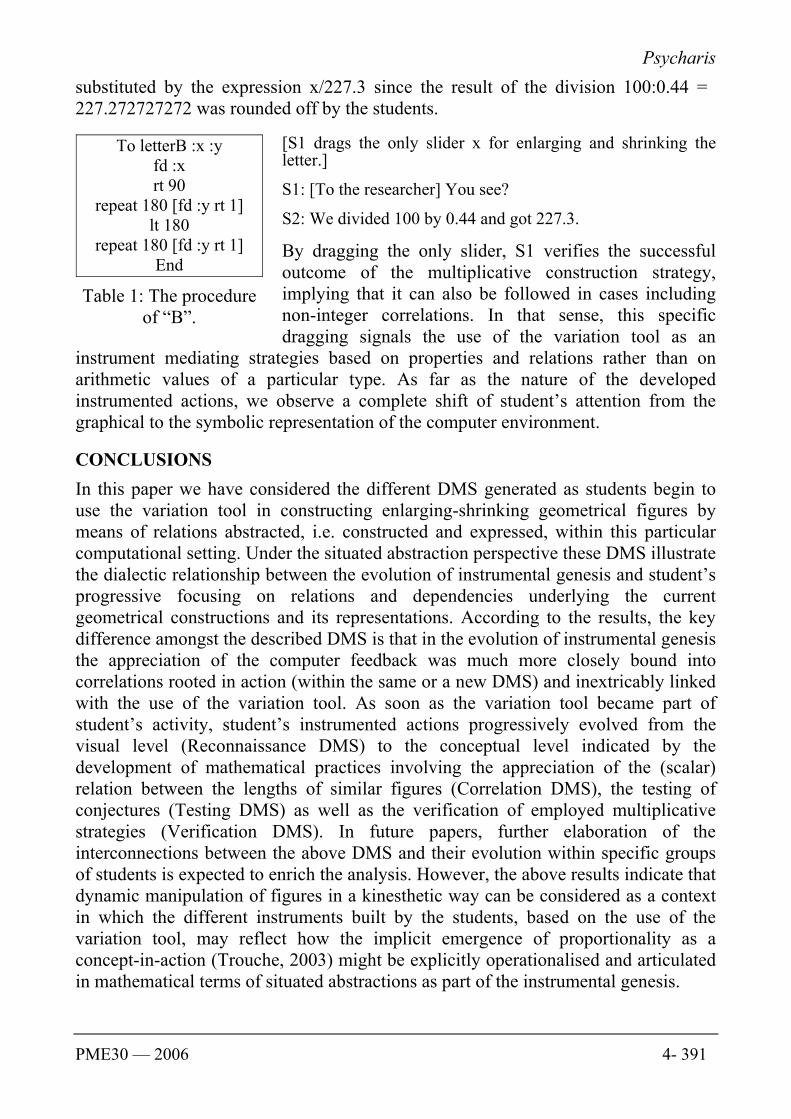
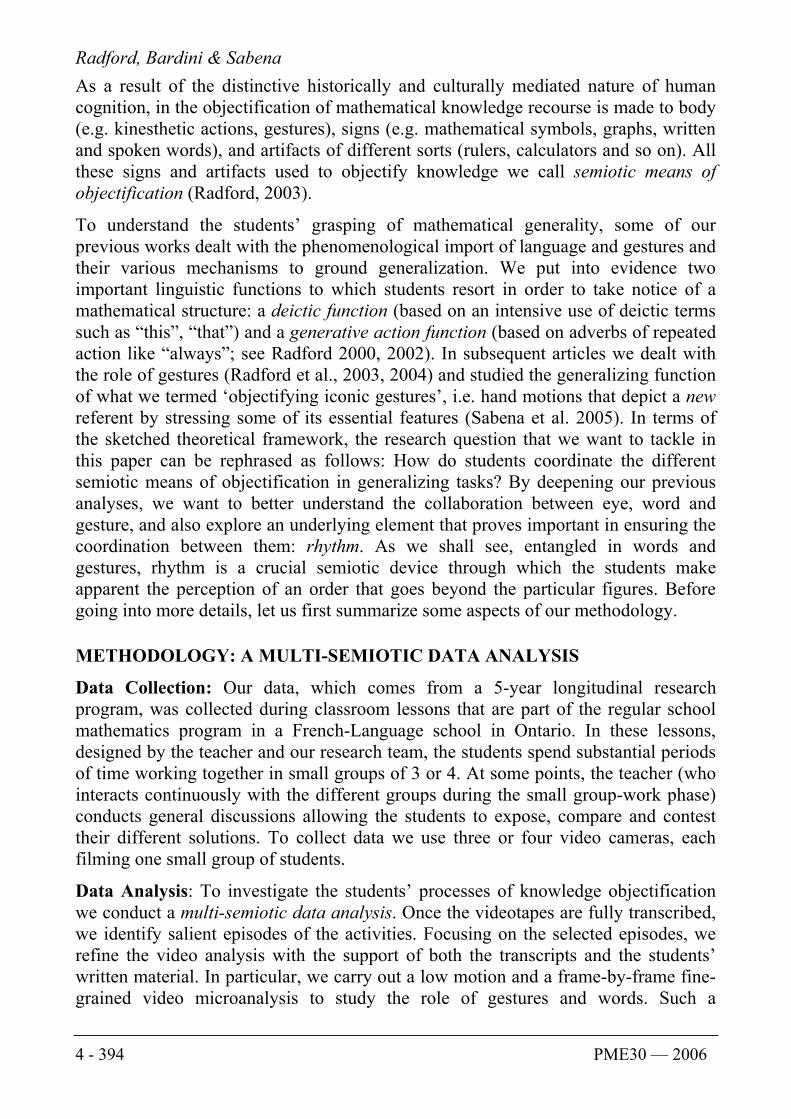
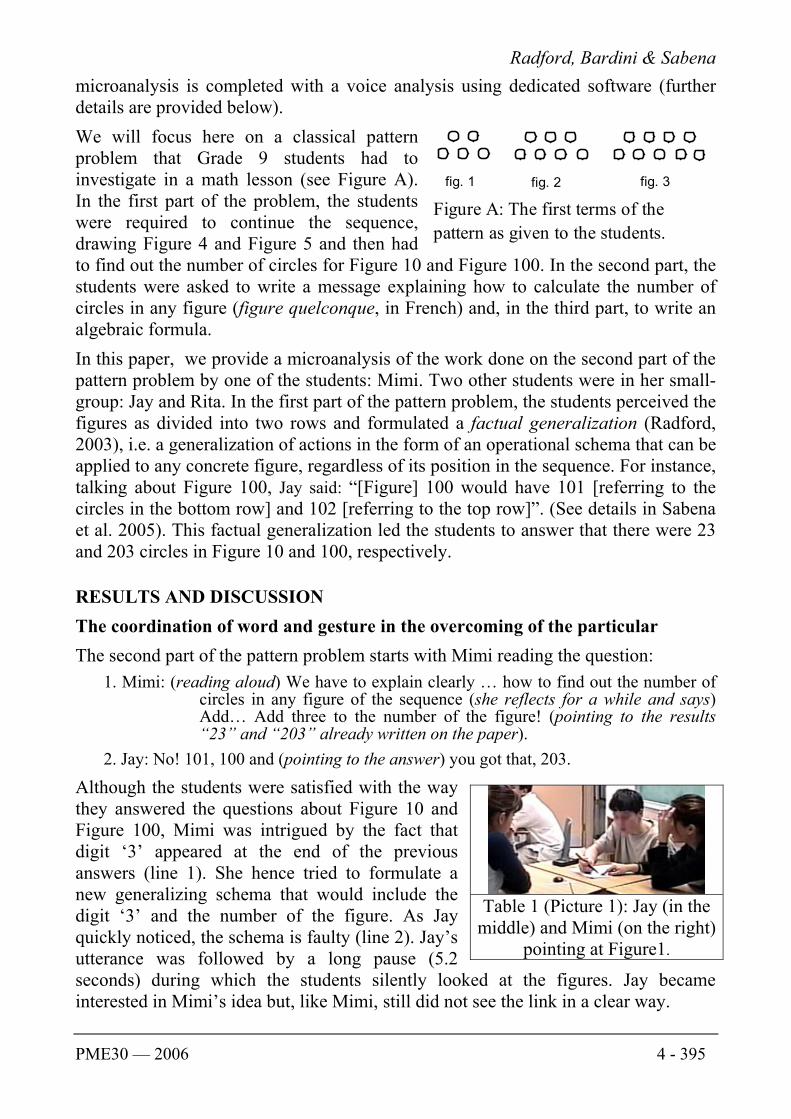
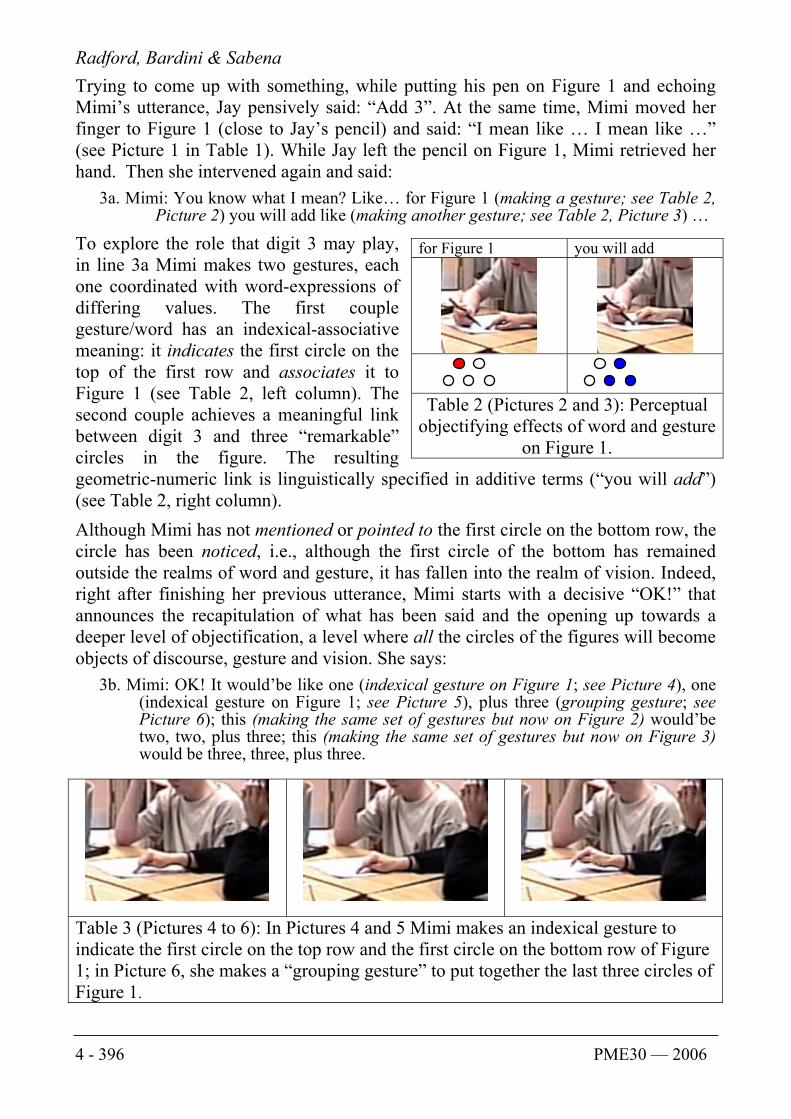
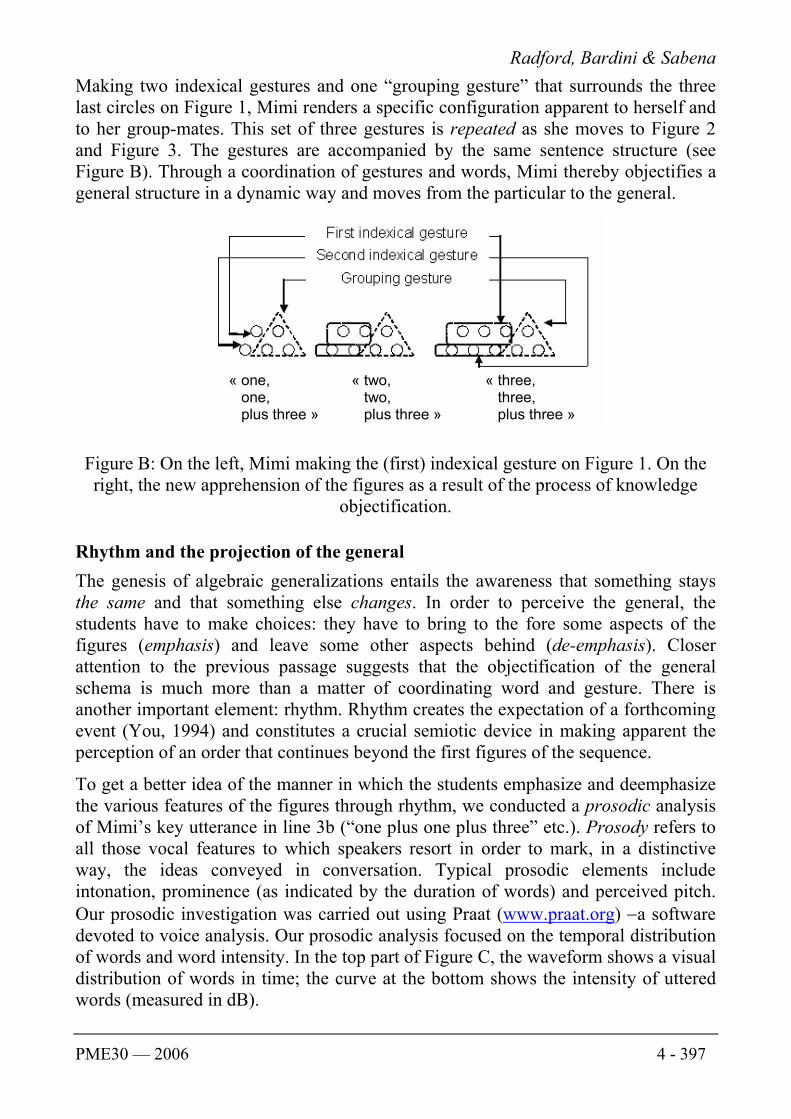
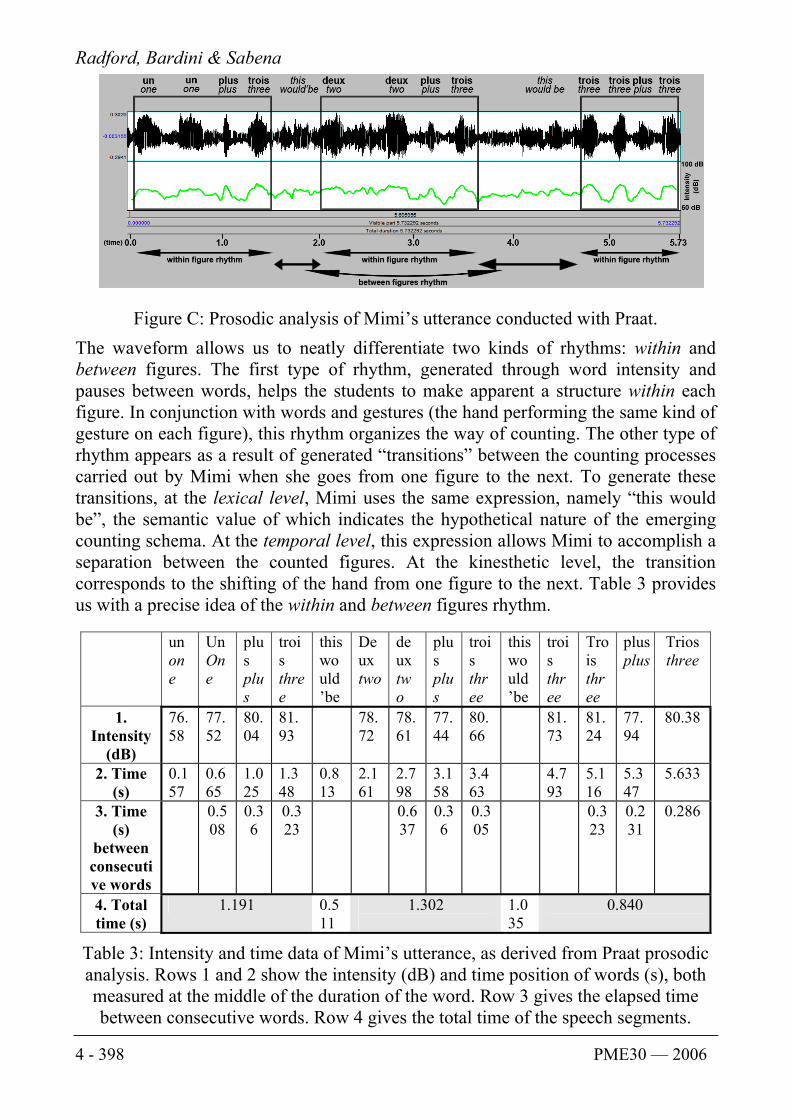
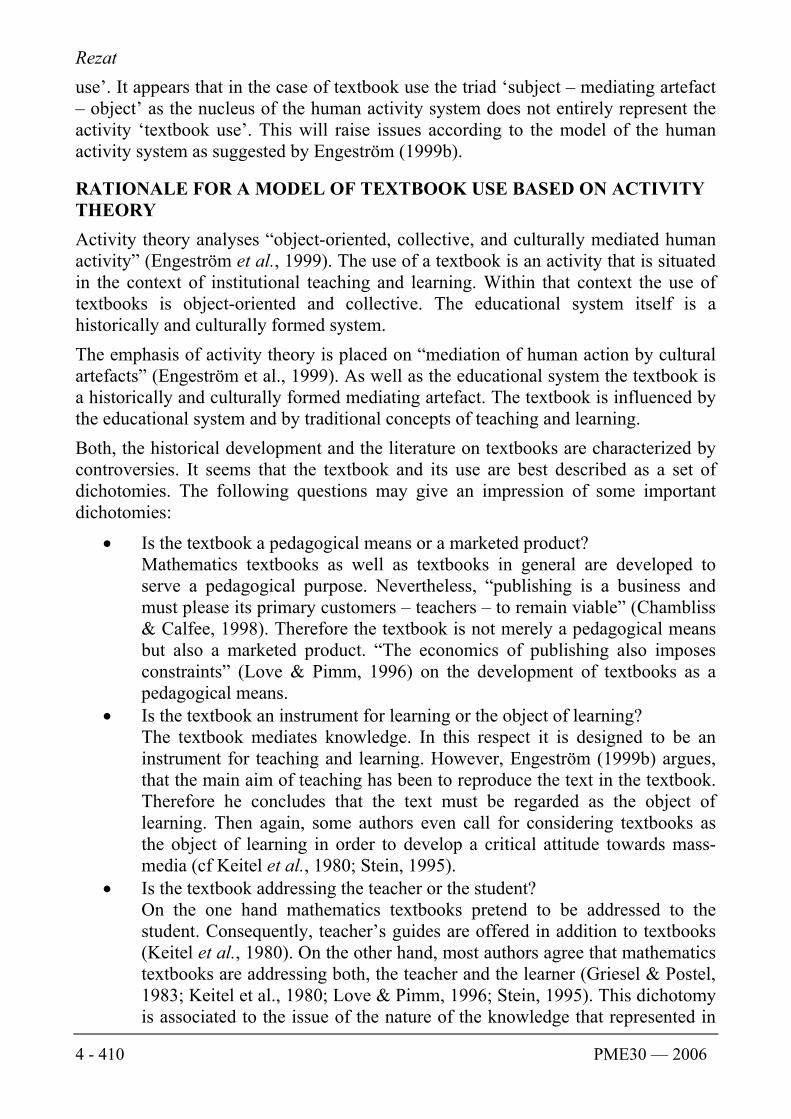
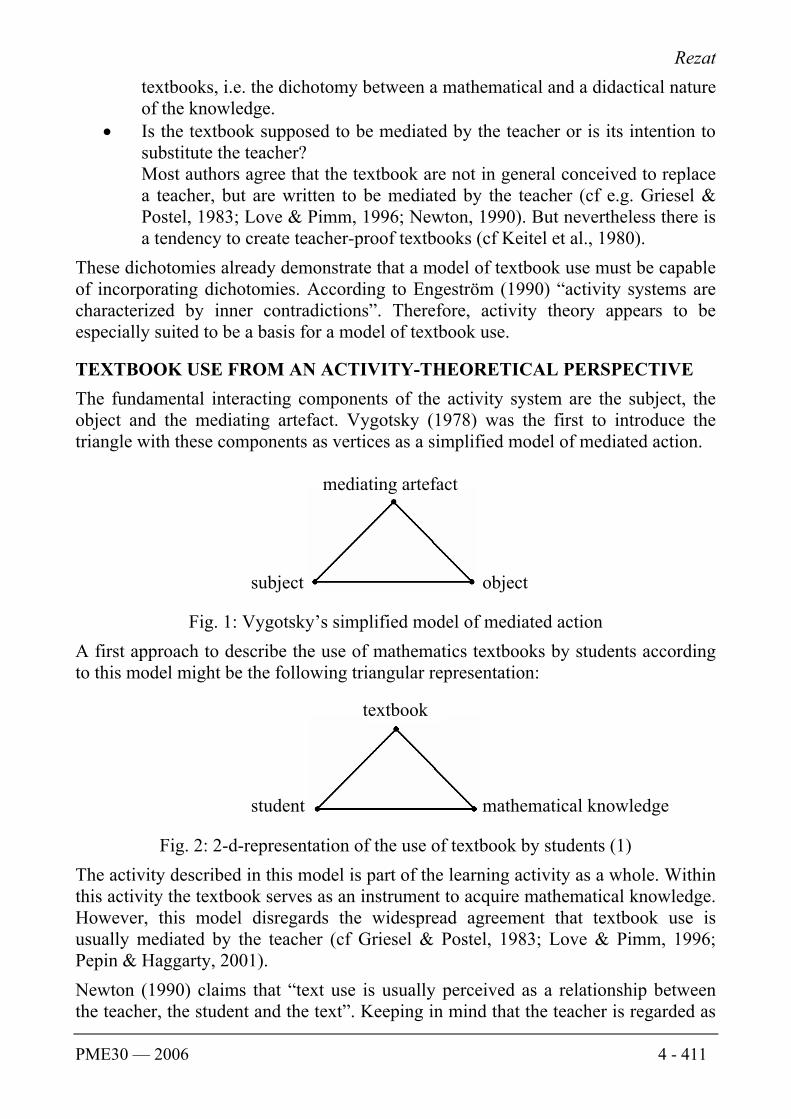
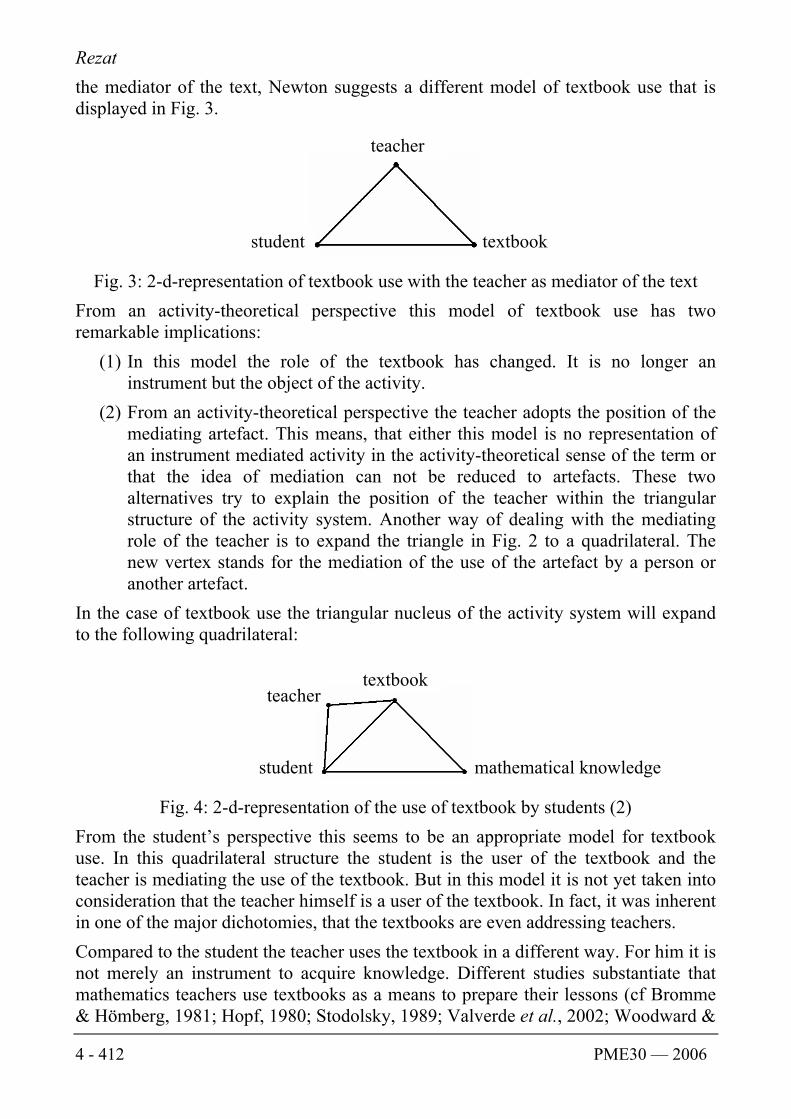
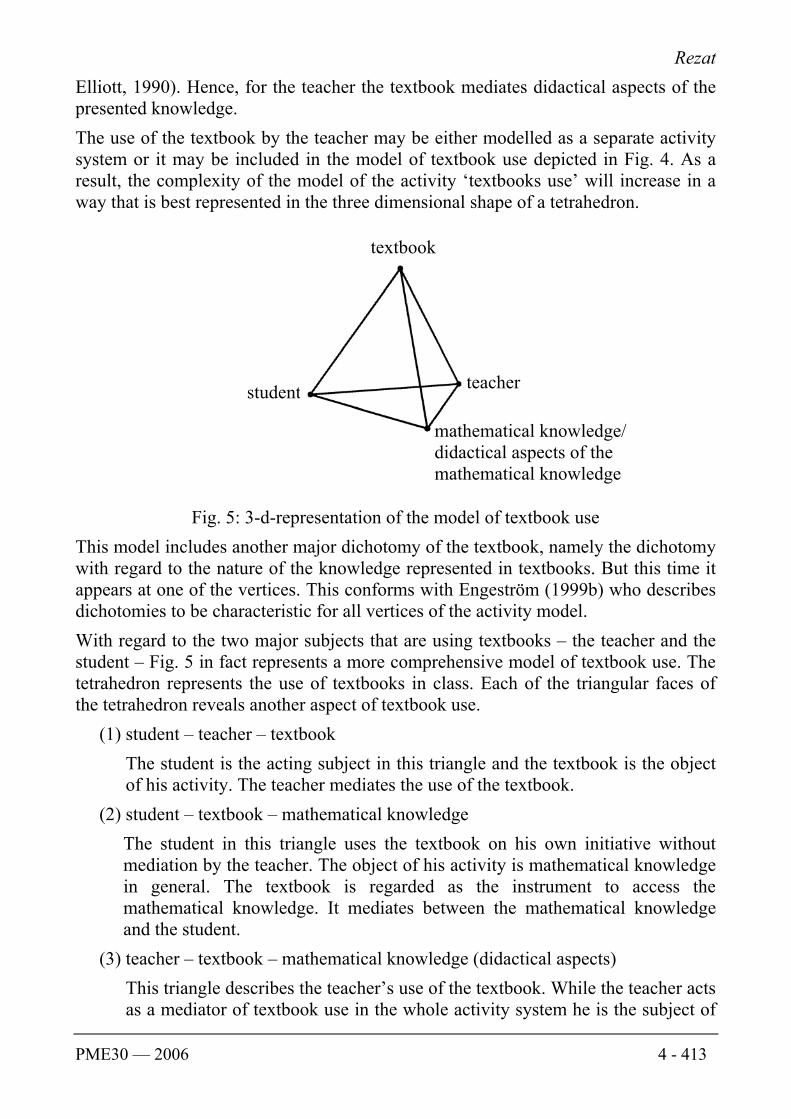
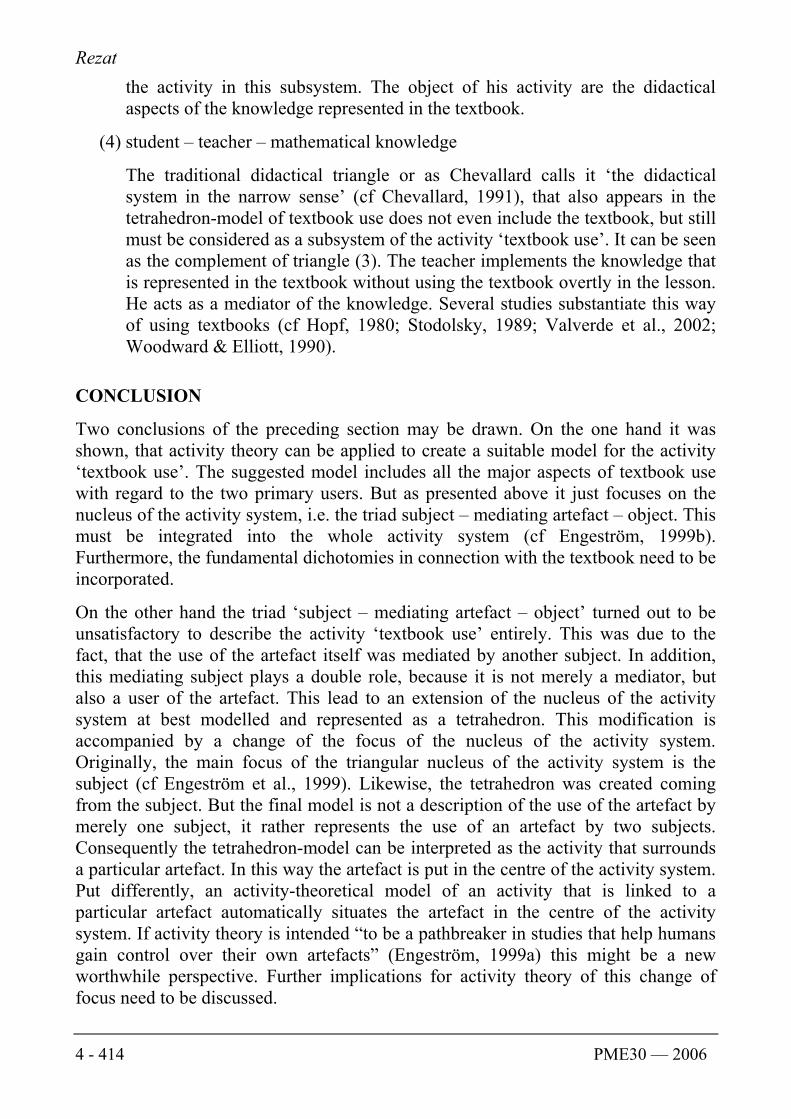
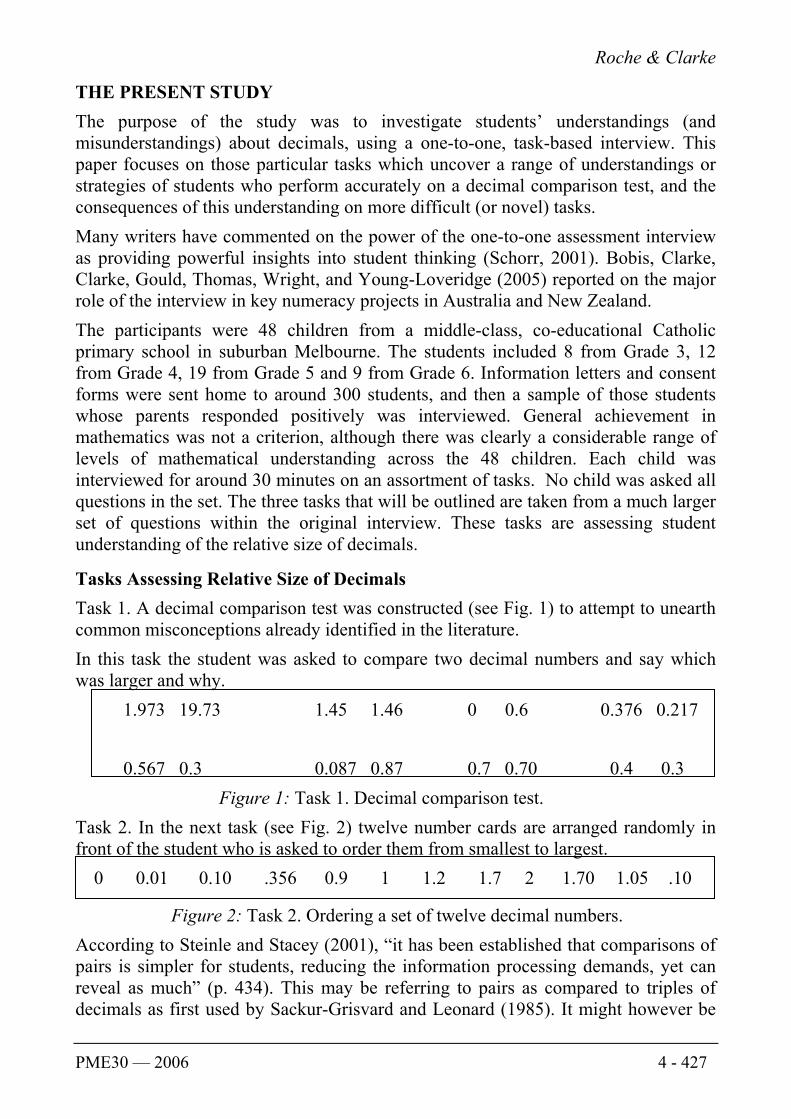
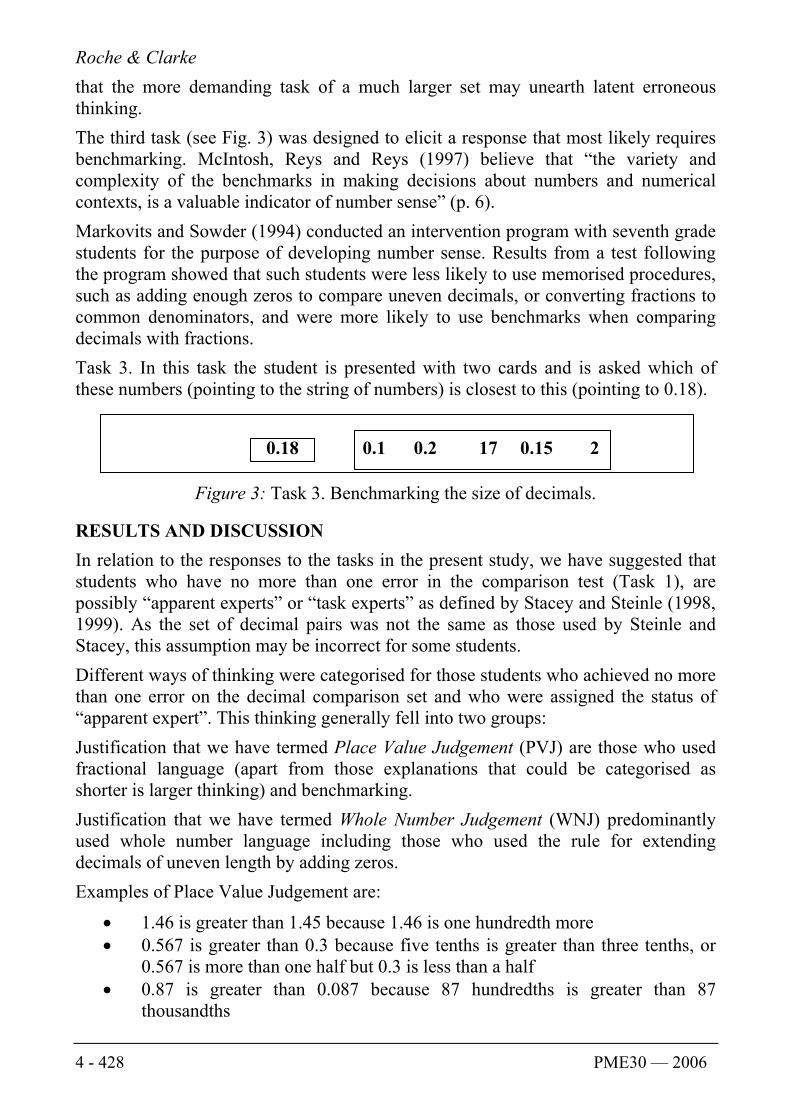
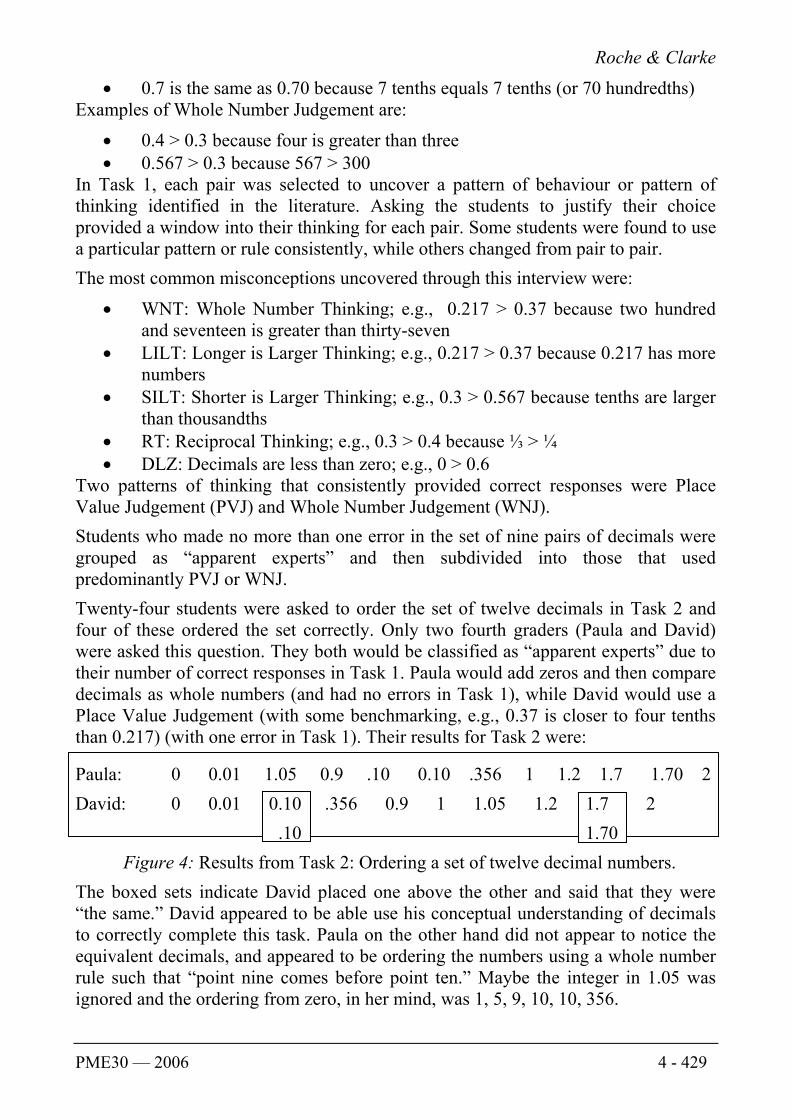
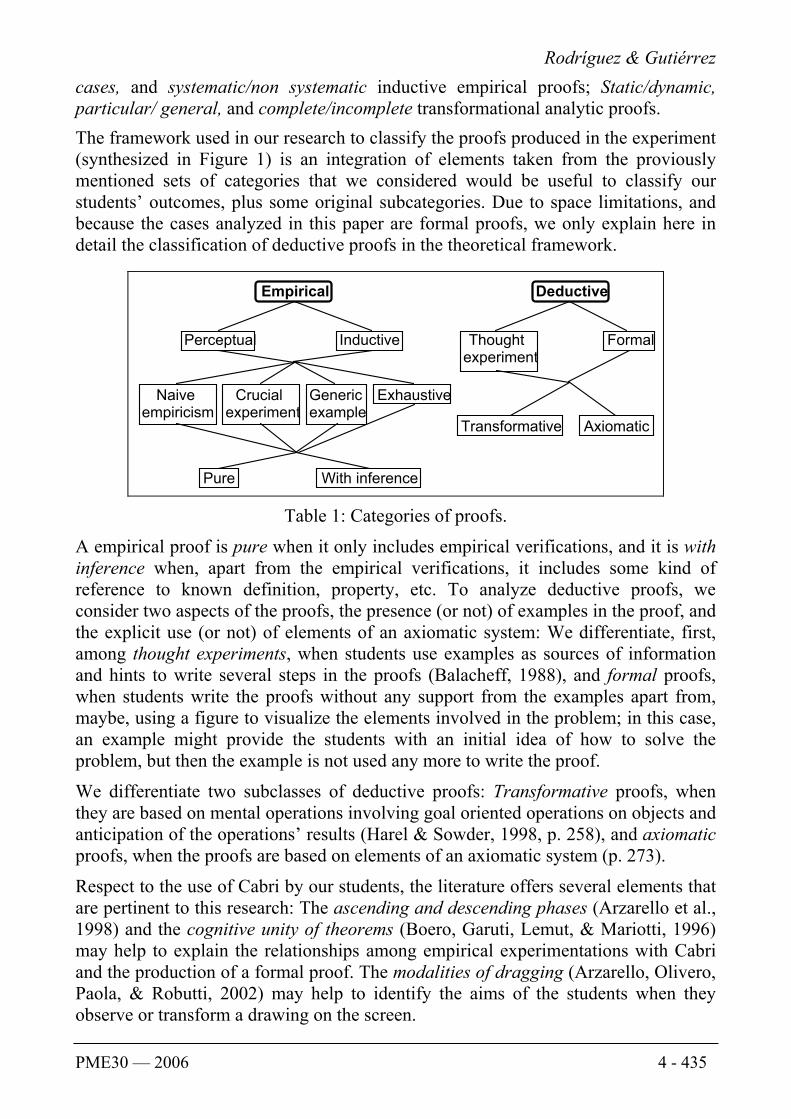
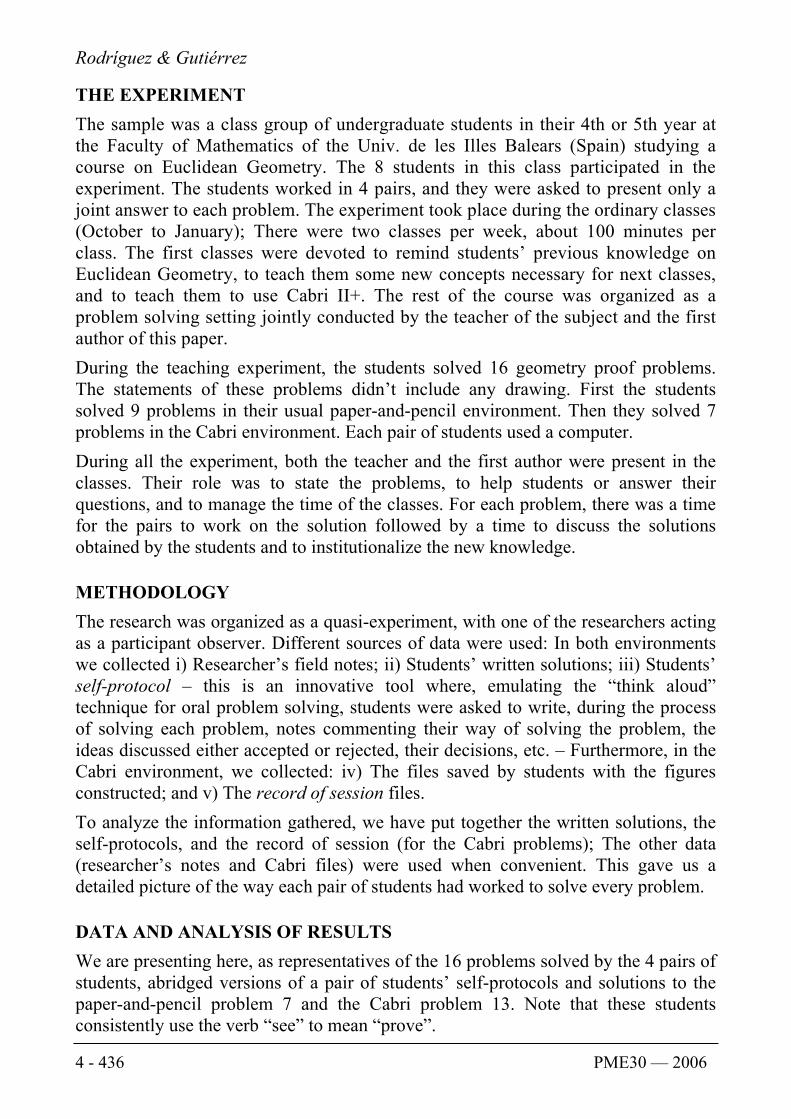
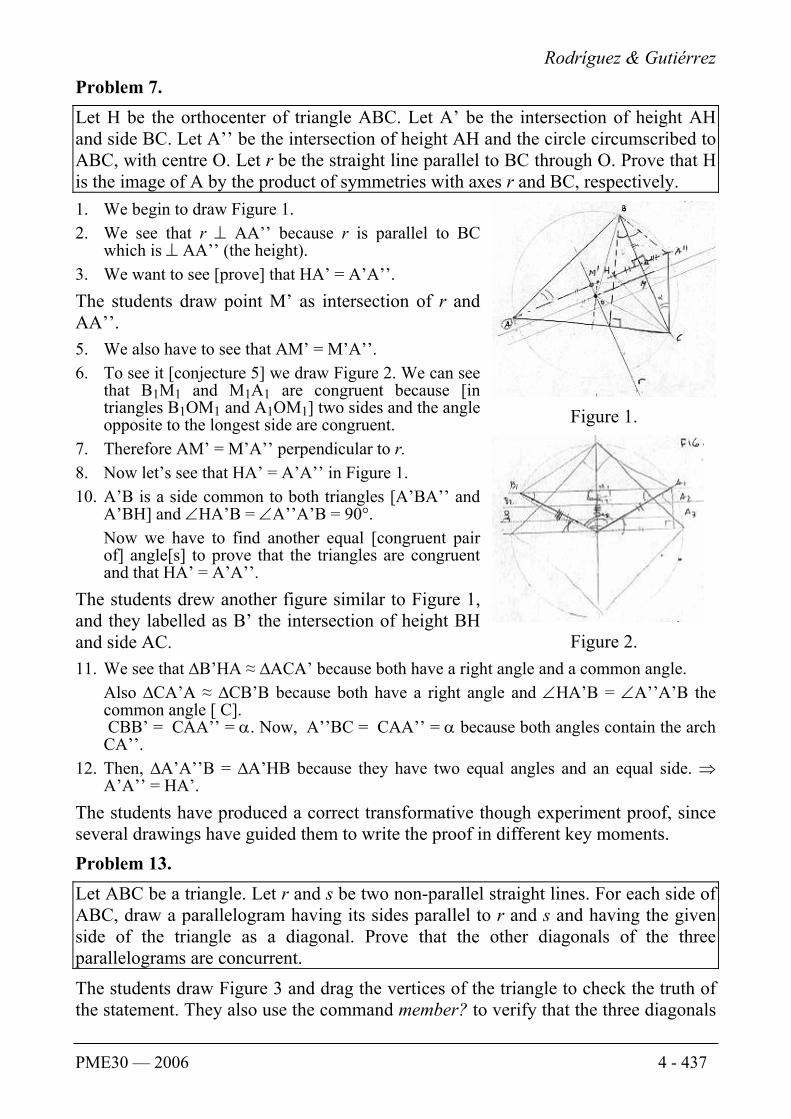
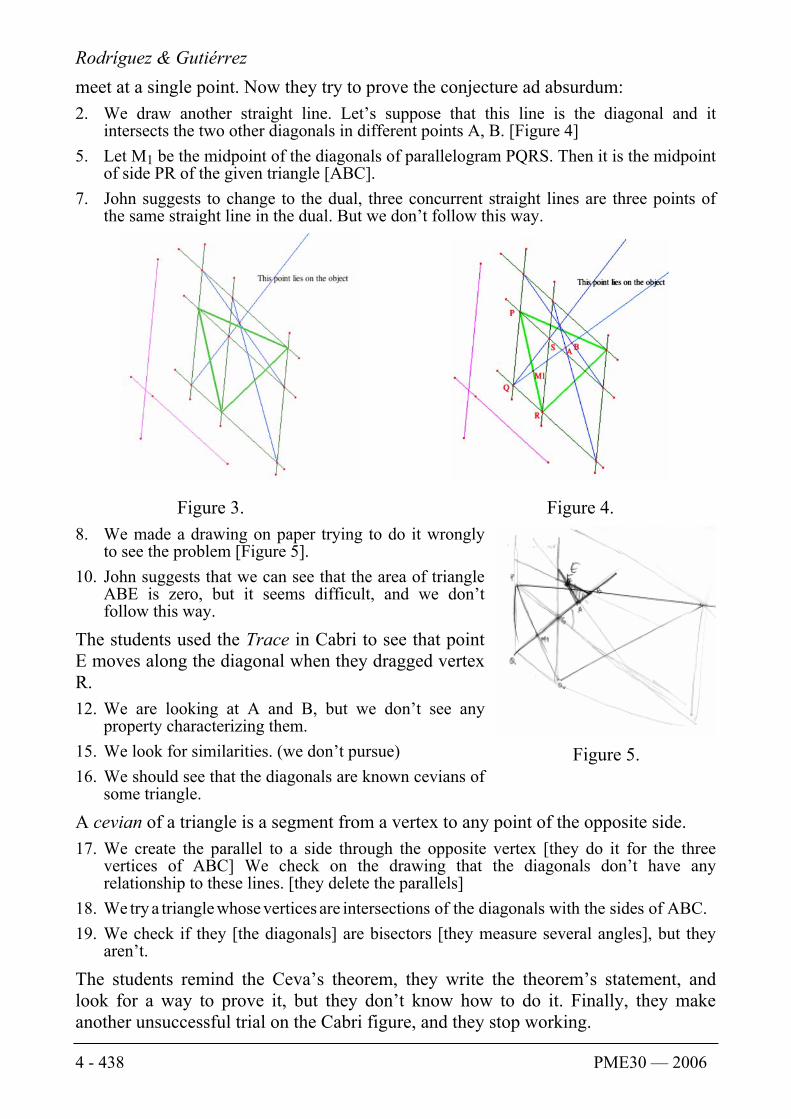
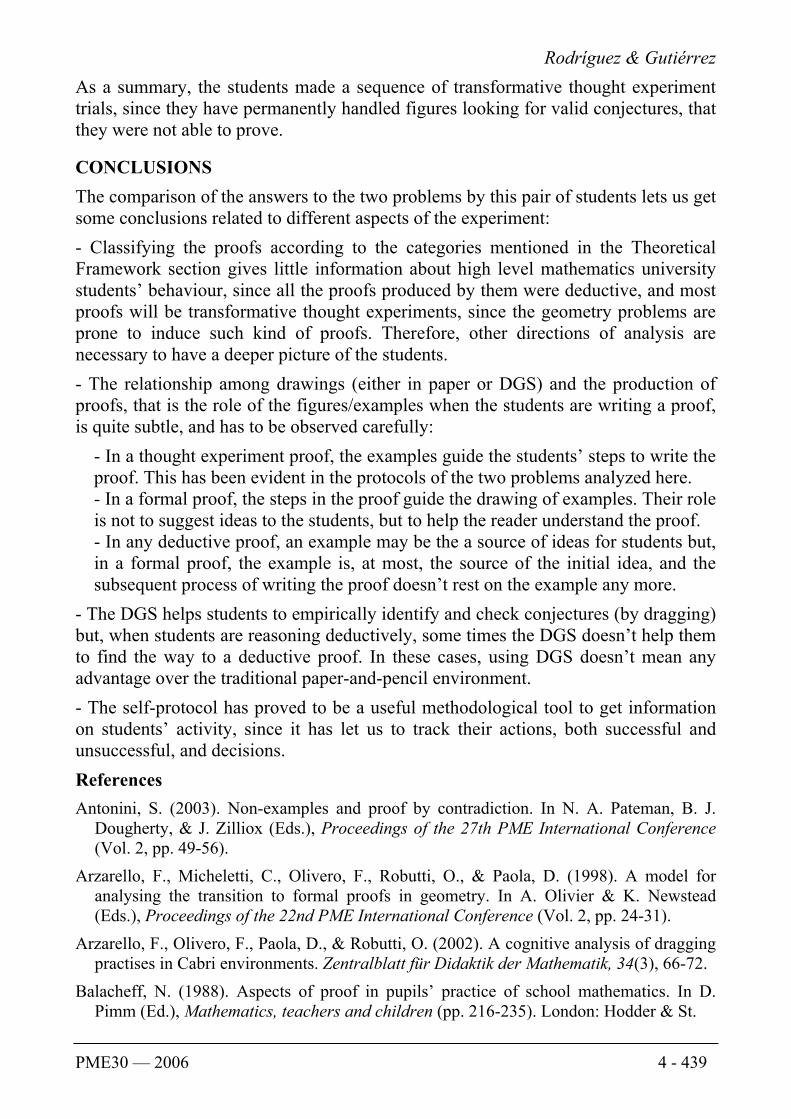
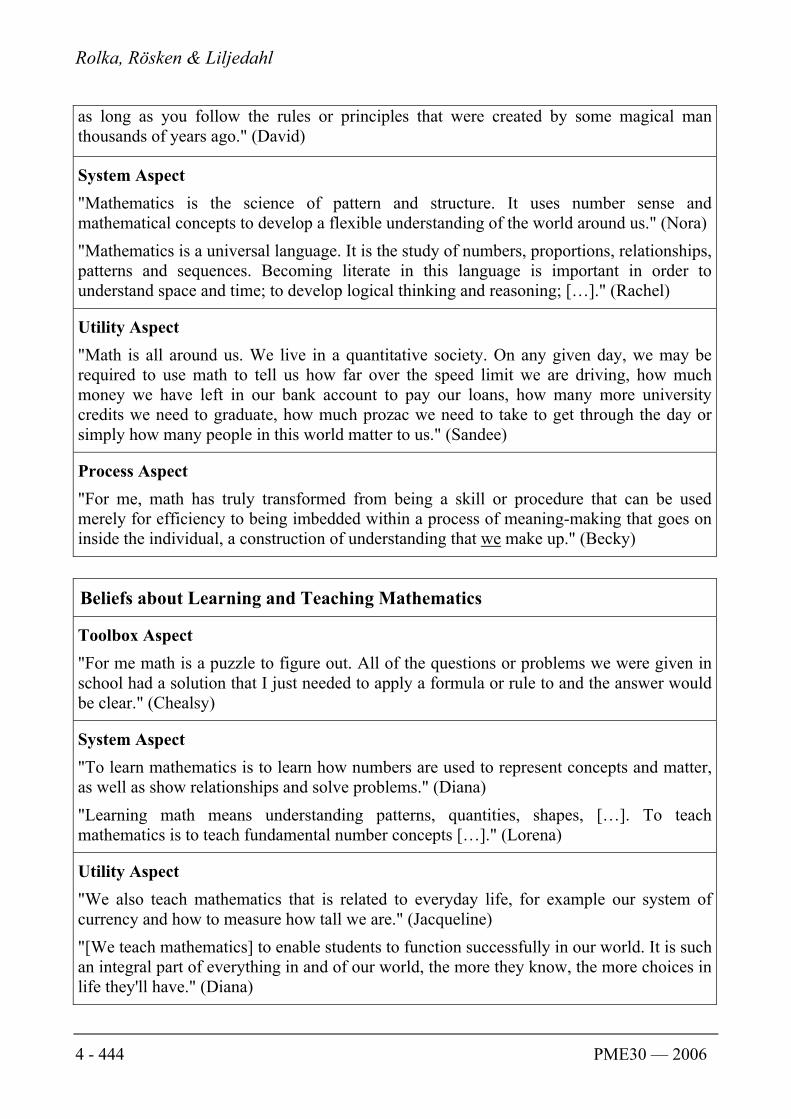
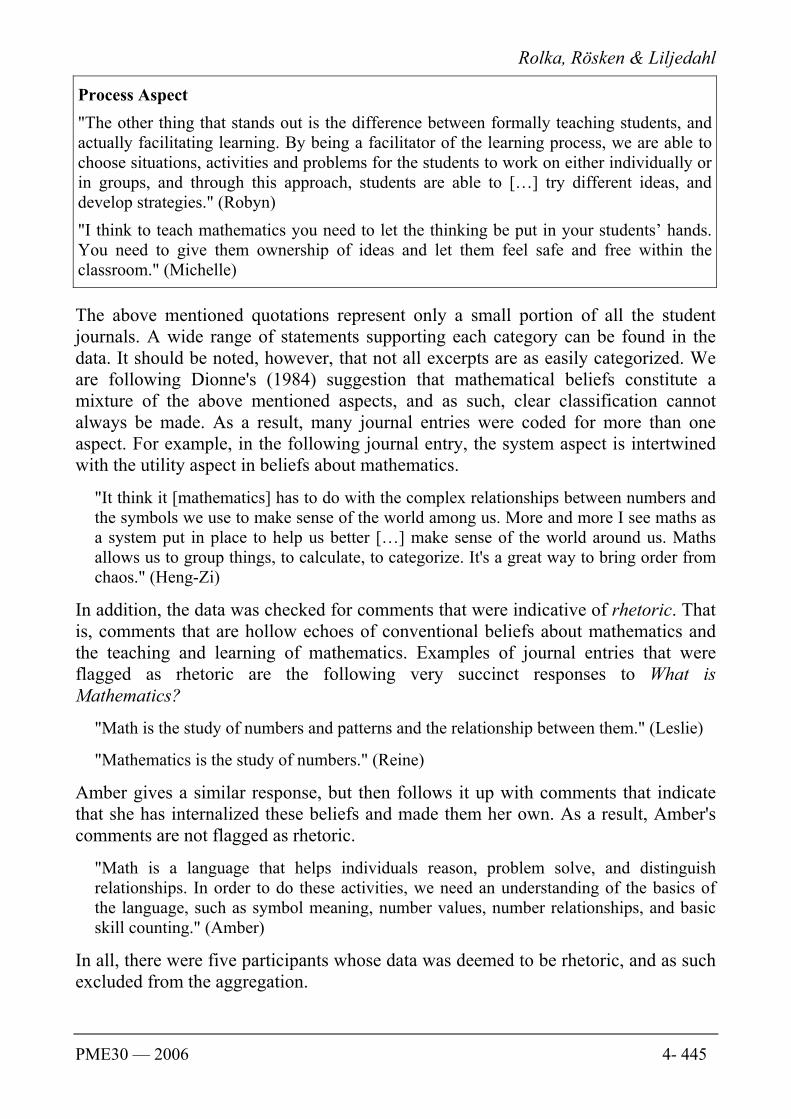
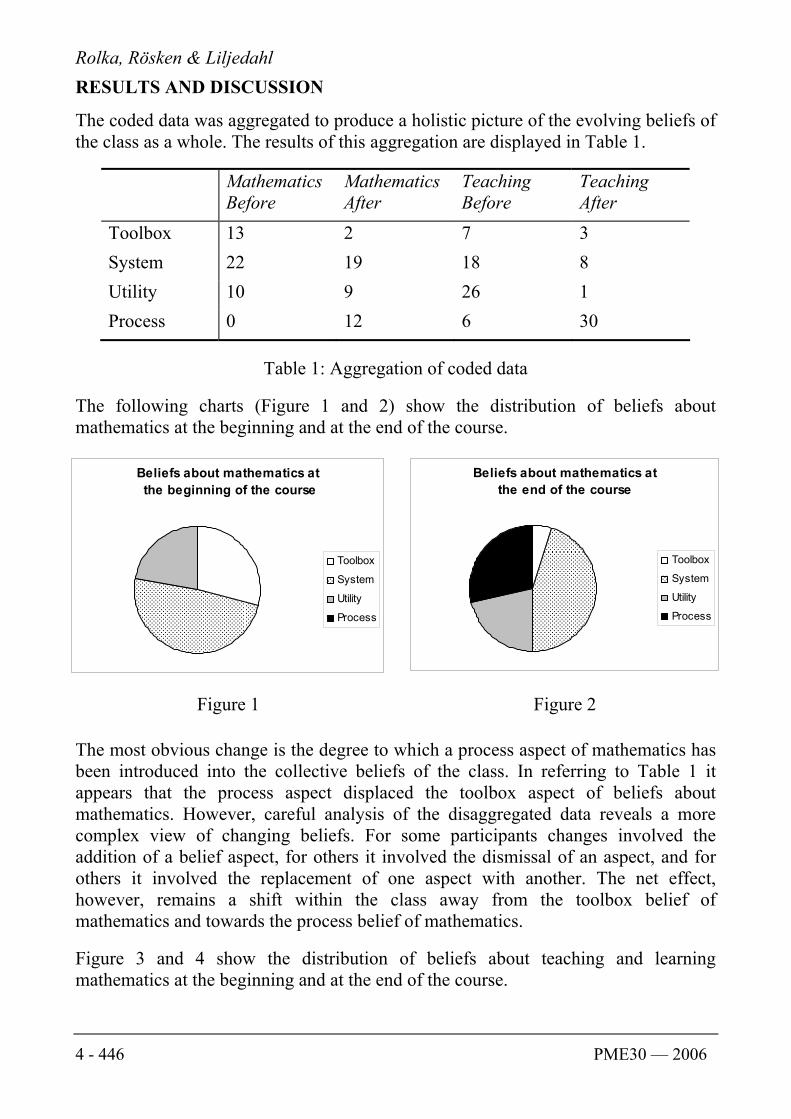
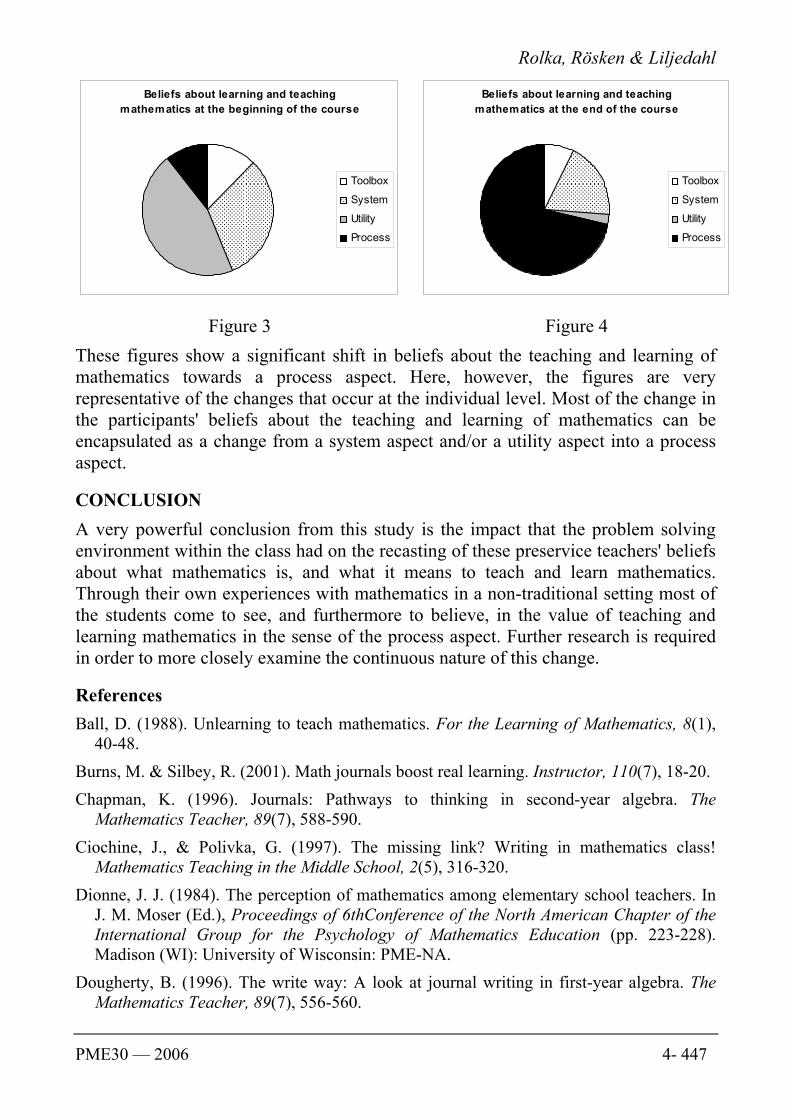
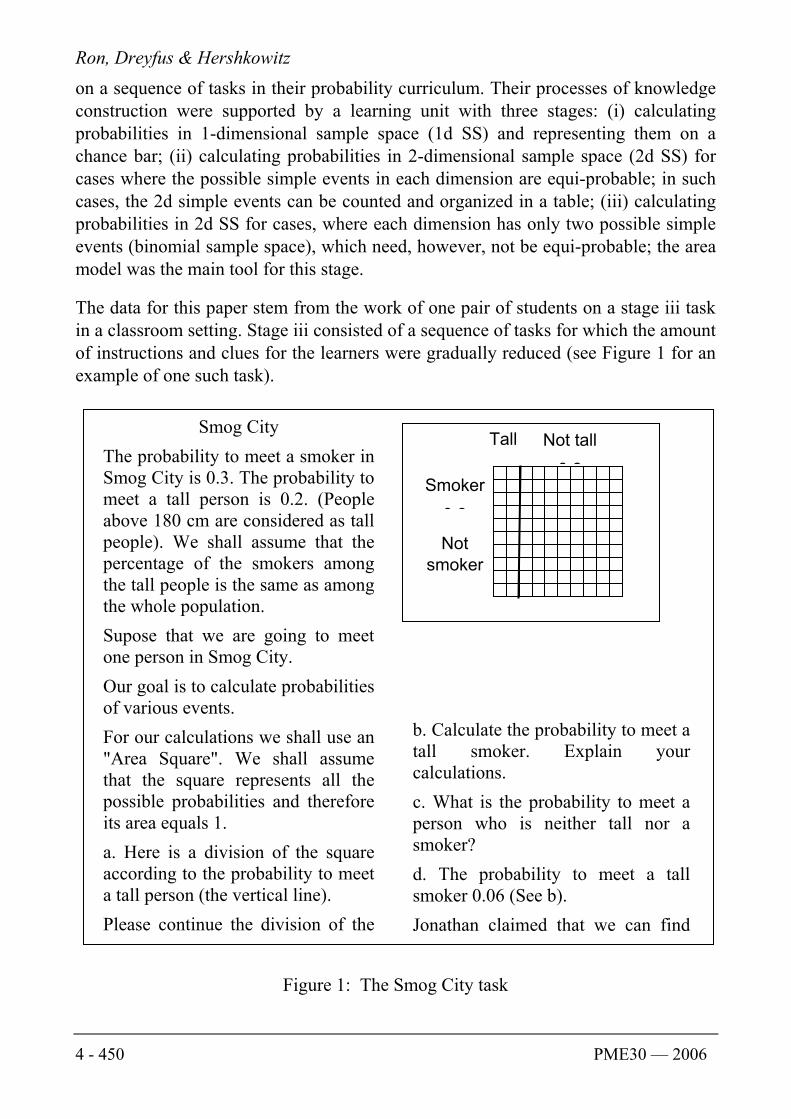
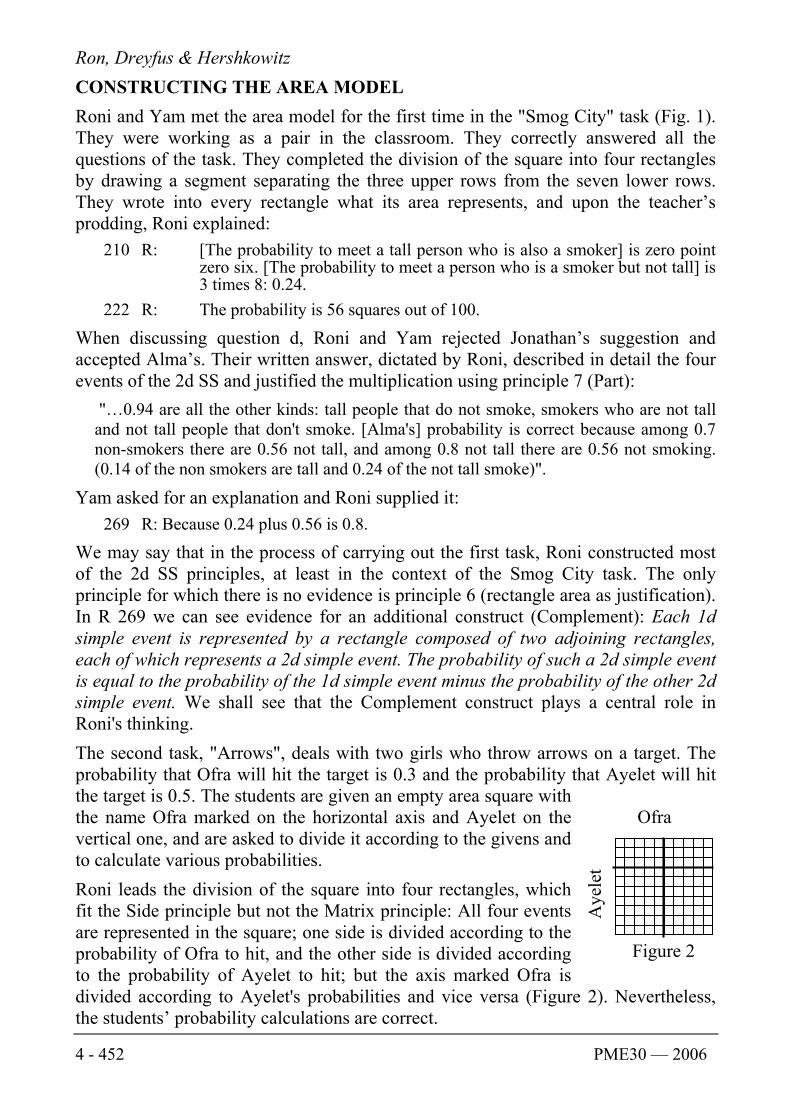
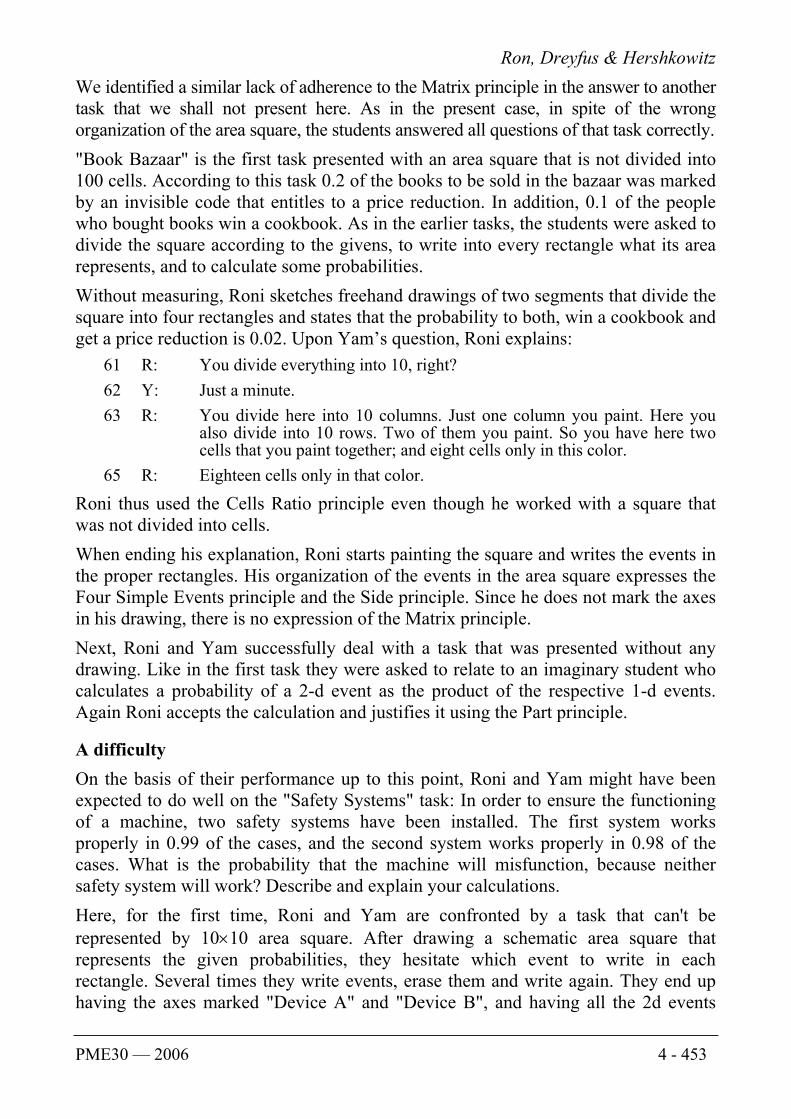
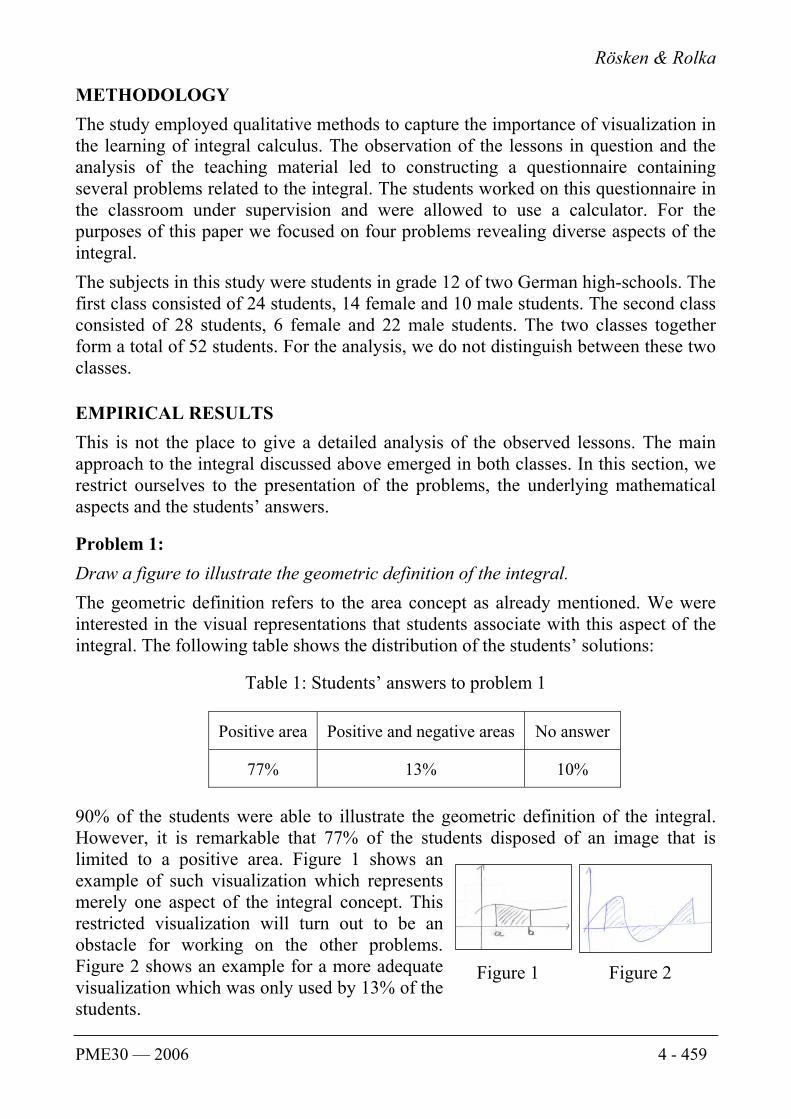
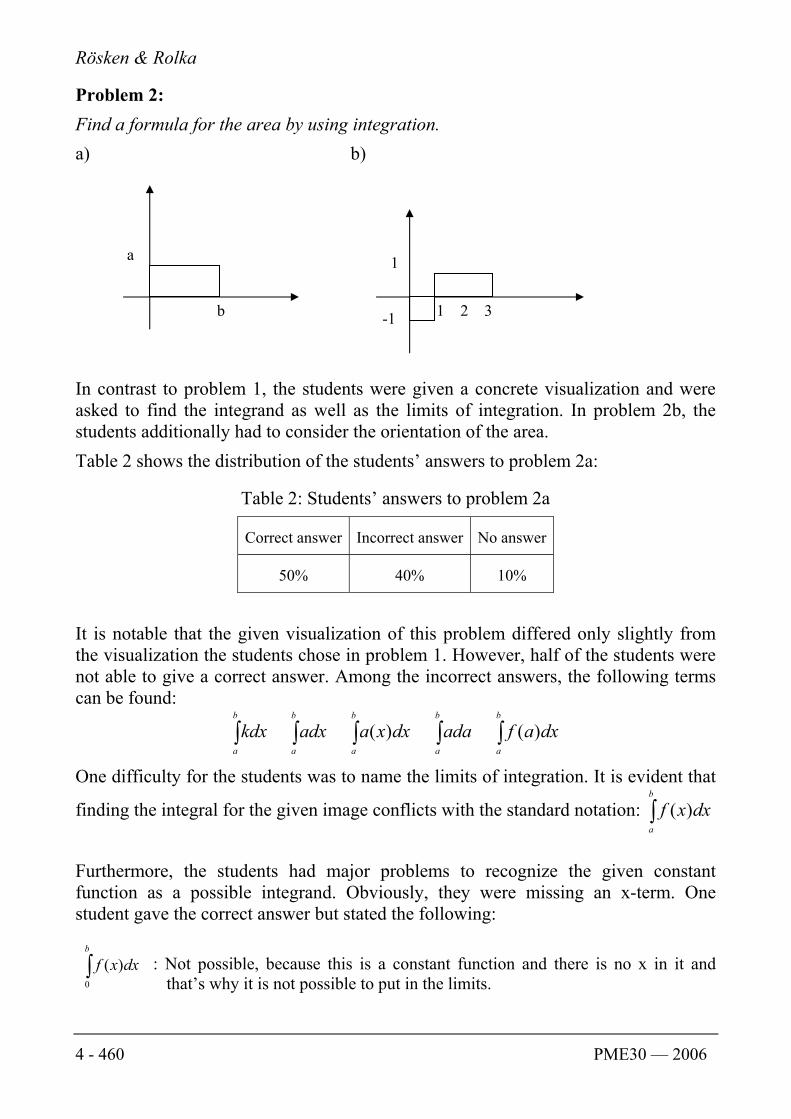
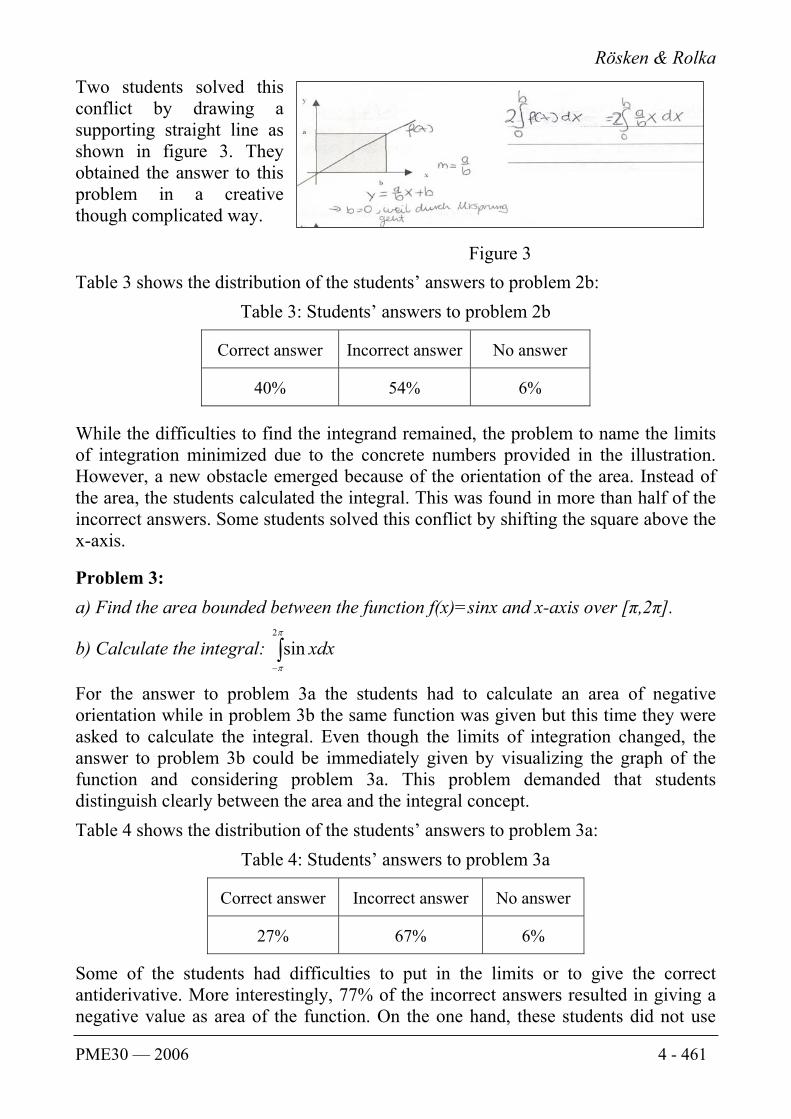
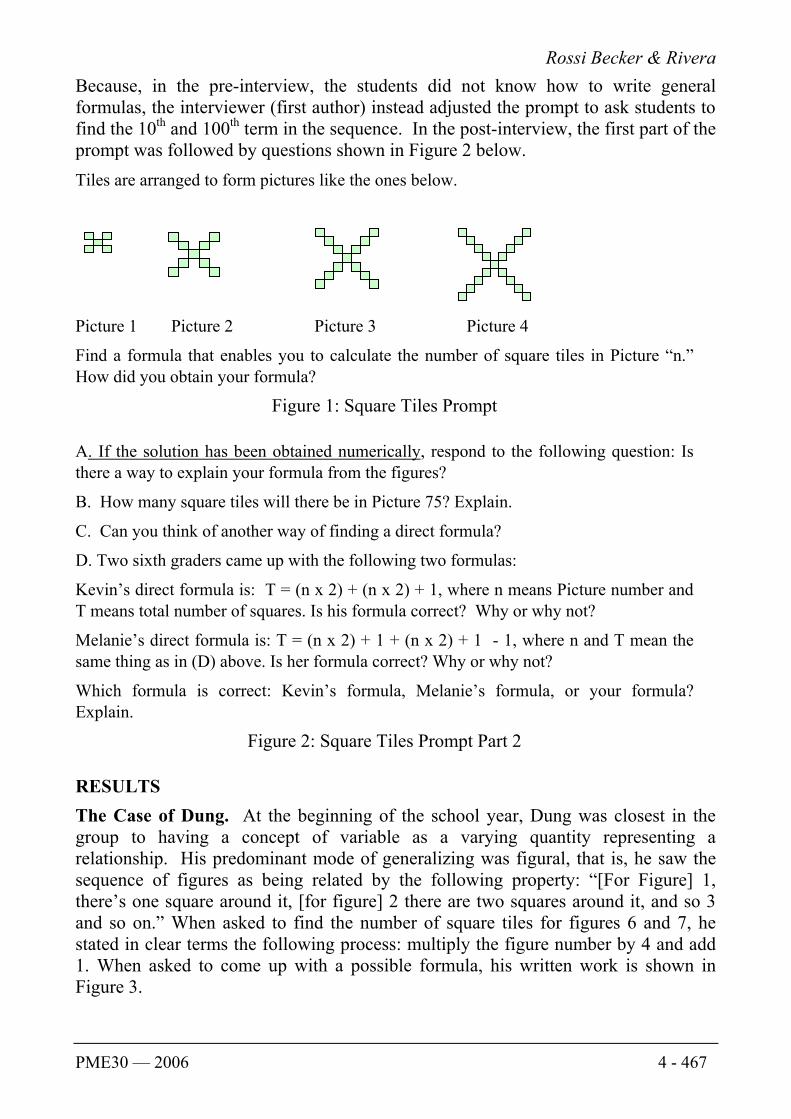
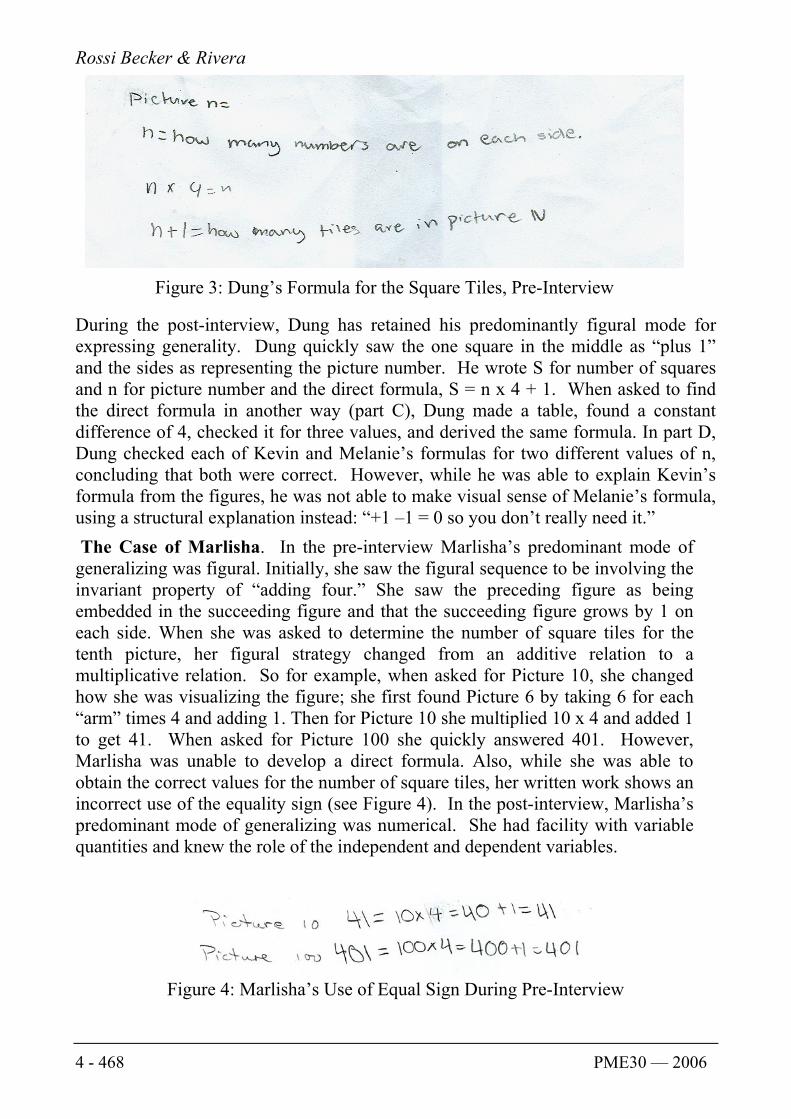
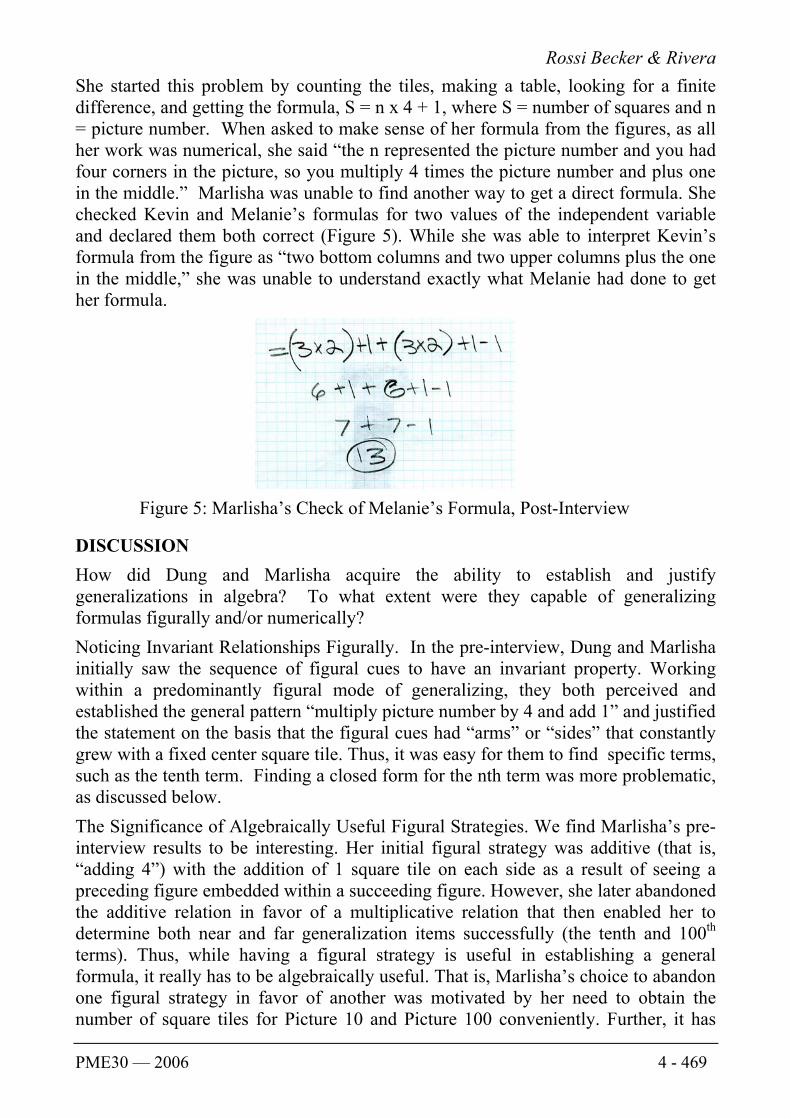
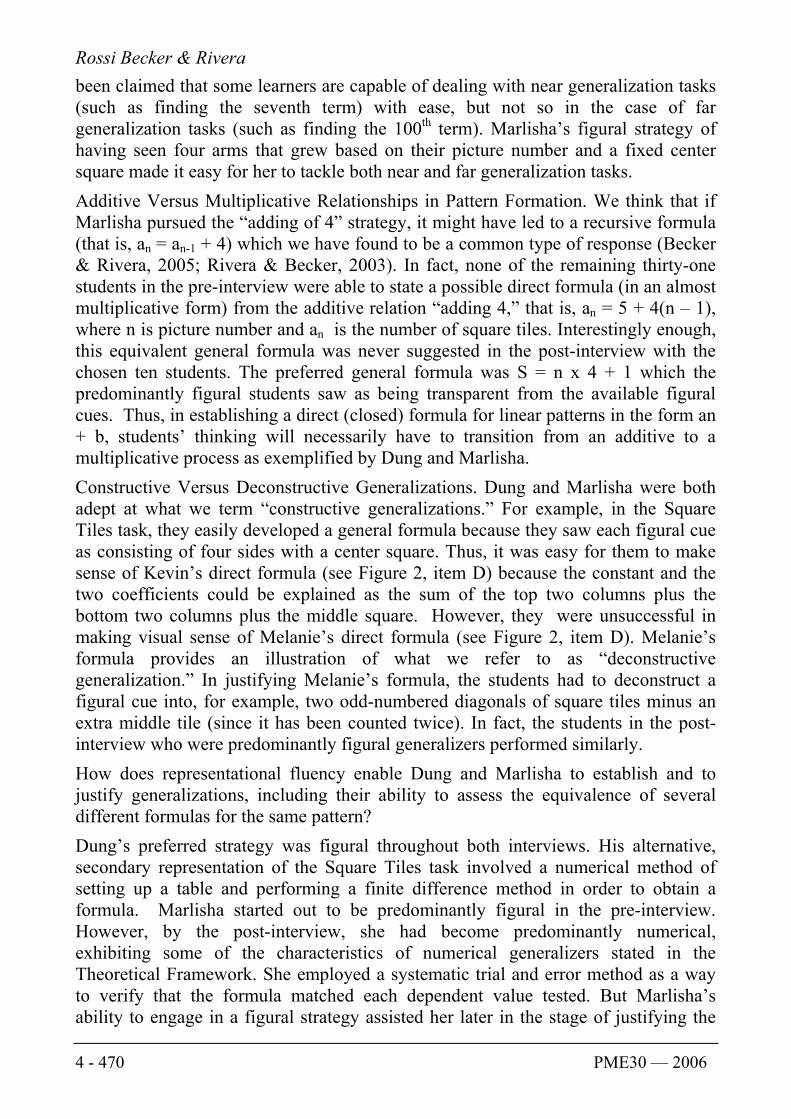


![PME Lecture 2011presentation[1]](https://static.documents.pub/doc/80x56/577d23931a28ab4e1e9a2f54/pme-lecture-2011presentation1.jpg)


