62
2015 Tbilisi. Georgia
| Date post: | 11-Jan-2019 |
| Category: |
Documents |
| Upload: | doannguyet |
| View: | 219 times |
| Download: | 0 times |

2015
Tbilisi. Georgia
1 | P a g e
Study On Electoral Behavior of Ethnic Armenians in Georgia
Addressing hindering factors of Qualitative and Quantitative Involvement in electoral processes
Research Consultants: Ewa Chylinski Giorgi Bobghiashvili Tamta Kupatadze Elene Proshikian Tinatin Hakobyan ISBN: The Views Expressed in this Publication are those of authors and do not necessarily represent the views of the Central Election Commission, Center of Electoral Systems Development, Reforms and Trainings. The Study was conducted within the framework of the project “Informed choice – delivery of assistance in the promotion of wider quantitative as well as qualitative engagement of ethnic Armenian constituencies residing in Akhalkalaki, Ninotsminda, Aspindza, Akhaltsikhe, Tsalka and Borjomi electoral districts in the electoral process for the upcoming elections cycles” implemented by the Public Movement Multinational Georgia with financial support of the Center of Electoral Systems Development, Reforms and Trainings. The Publication was prepared by European Center for Minority Issues – Caucasus (ECMI).
2 | P a g e
Contents Chapter 1: Executive Summery 6
Chapter 2: Methodology 11
2.1 Dynamics of Representation and Participation of Ethnic Armenians in the 2014 local self‐
government elections 11
2.1.1 Research Design 11
2.1.2 Research method 11
2.1.3 Selection of districts for analysis 11
2.2 Research on factors hindering (hampering) participation of ethnic Armenians in the 2014 local self‐
government elections and analysis of effectiveness of measures/activities in support of raising awareness
on election participation 12
2.2.1 Research design 12
2.2.2 Quantitative Research 13
2.2.3 Qualitative research 14
Chapter 3: Representation and electoral behavior of ethnic Armenians – comparing 2014 local self‐
government and previous Elections 16
3.1 Registered Voters and Turnout Rate 16
3.2 Share of Ethnic Armenians in Targeted PECs 17
3.3 Official Positions held by ethnic Armenians in PECs 19
3.4 Share of ethnic Armenians in DECs and their positions 20
Chapter 4: Electoral behavior of ethnic Armenian 22
4.1 Socio‐Demographic Characteristics 22
4.1.1 Municipalities covered; Gender and Age composition of Respondents 22
4.1.2 Share of Urban/Rural Respondents 23
4.1.3 Education 23
4.1.4 Knowledge of Languages 24
4.1.5 Type / Sector of employment 25
4.2 General Attitudes towards Elections 27
4.2.1 Importance of voting, participation and reasons 27
4.2.2 Importance of Elections Ranked 29
4.2.3 Voting preferences 30
4.2.4 Voting for ruling political party and loss aversion 33
4.2.5 Voting for female candidates 35
4.3 Analysis of Local Self‐Government Elections 2014 36
4.3.1 Importance and Participation 36
3 | P a g e
4.3.2 Assessment and Deviations from standards 38
4.3.3 Voters’ Lists 40
4.3.4 Access to and level of Information about Political Subjects 41
4.3.5 Interests in politics and knowledge of politicians/political parties 42
4.3.6 Source of Information about elections 44
4.4 Effectiveness of activities implemented for Elections 2014 47
4.4.1 Effectives of CEC and PECs – Measures and Activities for Equal electoral environment 47
4.4.2 CEC’s Media work 50
4.4.3 CEC for member of PECs 51
4.4.4 The Reforms and Training Center’s funded Projects and Effectiveness of Other NGOs 53
Chapter 5: Conclusions & Recommendations 56
5.1 To the Central Election Commission 56
5.2 To the Center of Electoral Systems Development, Reforms and Trainings 57
5.3 To the central and local authorities 58
5.4 To International organizations and diplomatic Missions 59
5.5 To Political parties 59
5.6 To Media Outlets 60
5.7 To civil society Organizations 61
4 | P a g e
Table 1: Number of targeted Precincts ............................................................................................................. 12
Table 2: Number of Respondents from Each strata .......................................................................................... 14
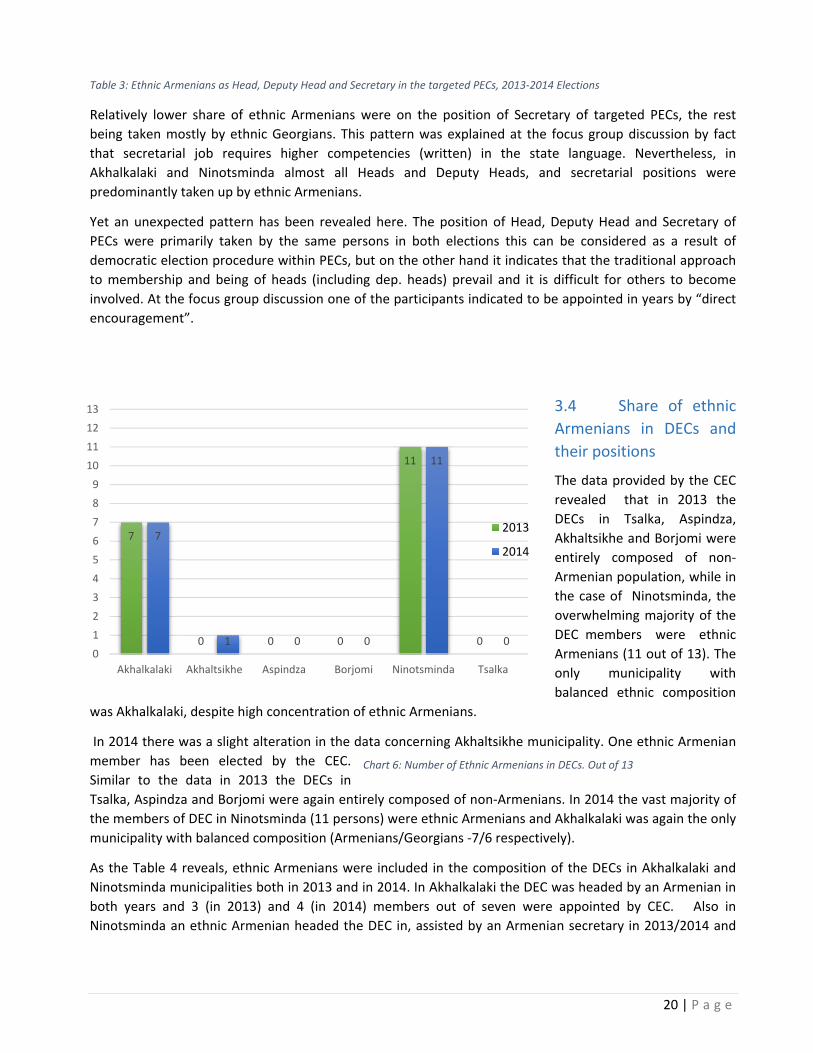
Table 3: Ethnic Armenians as Head, Deputy Head and Secretary in the targeted PECs, 2013‐2014 Elections . 20
Table 4: ethnic Armenian Members of DECs and Official Positions taken up in 2013‐2014 Elections ............. 21
Table 5: Factors Motivating to Participate in Elections ..................................................................................... 28
Table 6: Factors which motivate NOT to Participate ......................................................................................... 30
Table 7: Deviations 2014‐2012 Elections ........................................................................................................... 40
Table 8: Knowledge of local ruling parties and Governors/Mayors .................................................................. 43
Table 9: Effectiveness of measures/activities implemented by the CEC........................................................... 48
Table 10: Effectiveness of CEC's media work .................................................................................................... 50
Table 11: Effectiveness of the Trainings for the PECs members ....................................................................... 53
Table 12: Assessment of Effectiveness of the project supported by the Center .............................................. 55
Chart 1: Registered & Participated number of Armenians in 2010 VS 2014 16
Chart 2: Turnout rate and number of registration in 2010‐2014 Election BY MUNICIPALITIES 17
Chart 3: Number of Ethnic Armenians in Targeted PECs 18
Chart 4: PEC Armenian members Elected VS Aointed 18
Chart 5: Number & Share of Ethnic Armenians in PECs in 2013 VS 2014 18
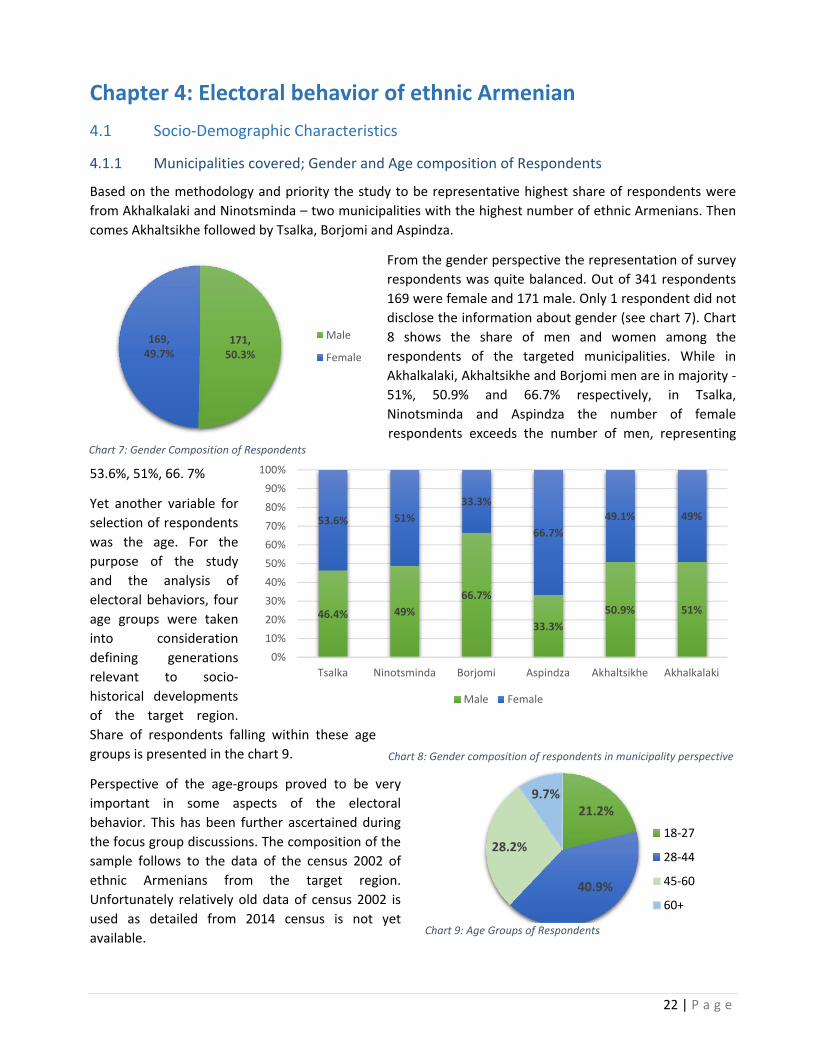
Chart 6: Number of Ethnic Armenians in DECs. Out of 13 20
Chart 7: Gender Composition of Respondents 22
Chart 8: Gender composition of respondents in municipality perspective 22
Chart 9: Age Groups of Respondents 22
Chart 10: Share of Respondents in Settlement type perspective 23
Chart 11: Education 24
Chart 12: Education in the Age Perspective 24
Chart 13: Knowledge of Languages 25
Chart 14: Knowledge of Georgian language ‐ Age groups 25
Chart 15: Employment Sector 26
Chart 16: Employment 26
Chart 17: Importance of Voting in General 27
Chart 18: Frequency of Voting 27
Chart 19: Elections Ranged 30
Chart 20: Factors Determining Electoral Preferences Regarding Political Parties 30
Chart 21: Factors Determining Electoral Preferences regarding Politicians/Candidates 32
Chart 22: Importance of Ethnicity of Politician/Candidate 33
Chart 23: Voting for RULING and SAME political parties 33
Chart 24: Loss Aversion ‐ Would you for an undesired political party/politician just in order to get rid of
ruling/winning political elite? 35
Chart 25: Voting for Women in Municipality perspective 35
Chart 26: Would you vote for a female candidate? 35
Chart 27: Importance of the 2014 local Self‐Government Elections 37
Chart 28: Factors that motivated NOT to participate in the Election 2014 37
Chart 29: Factors which motivated to participate in the Elections 2014 38
Chart 30: Assessment of the Elections 2014 38
Chart 31: Assessment of the Elections in the municipality perspective 39
5 | P a g e
Chart 32: Access to the Voters' List 41
Chart 33: Knowledge of Programs and Parties/Politicians 41
Chart 34: Following/Interests in Politic 42
Chart 35: Following news on the Elections 2014 44
Chart 36: Assessment of Media 44
Chart 37: Sources of Information on the Elections 2014 45
Chart 38: The most watched TV channels 46
Chart 39: The most effective/desired ways of getting information on elections 46
Chart 40: satisfaction with the work of CEC and PECs 47
Chart 41: Equal Electoral Environment for ethnic Armenians 49
Chart 42: Ways PEC members have been elected/appointed 51
Chart 43: Competence of Trainer in Municipality perspective 53
Chart 44: Effectiveness of local NGOs in General 53
Chart 45: Effectiveness of Activities organized by other organizations regarding the Elections 2014 55
6 | P a g e
Chapter 1: Executive Summery
Ethnic Armenians represent second largest ethnic minority group in Georgia. According to the census 2002
they amount to 6.5% of total population. Besides Tbilisi, Armenians are compactly settled in municipalities
of Samtskhe‐Javakheti and Kvemo Kartli regions.
Civic and political integration of large ethnic minority groups still remains a challenge for Georgia. This is
particularly true in case of ethnic Armenians, especially in compact settled regions. This includes problems
associated with their electoral behavior. Although Armenians are characterized with comparatively high
level of turnout rate at elections, their involvement in electoral processes in a conscious and civilly
responsible manner is still limited.
Ethnic minority regions, including those inhabited by ethnic Armenians, had always been a source of
plentiful votes for governmental parties and thus, of legitimization. This had been determined by several
factors out which the most important were lack of awareness of local population on the electoral processes,
their voting rights and importance of mindful participation. All these factors coupled with limited knowledge
of the state language and insufficient provision of information in Armenian language leaves these
communities marginalized with lower level of civic integration. Therefore, it is urgently needed that relevant
state bodies, state institutions, local authorities and civil society assist in integration by, building the capacity
and raise awareness of local ethnic Armenian population on democratic development.
To that end the recommendations of the present research aim at supporting conscious and responsible
involvement of ethnic Armenians living in Akhalkalaki, Akhaltsikhe, Aspindza, Borjomi, Ninotsminda and
Tsalka election districts in the electoral processes.
The study presents a comprehensive overview of the electoral participation in the target region, and gives
recommendation to all relevant stakeholders what needs to be done to improve involvement of ethnic
Armenians in the regions in electoral activities.
Chapter 2 explains the methodological framework of the study. Based on mixed quantitative and
qualitative methods, starting from desk research, to survey and focus groups. Desk research has been used
for analysis of the data provided from CEC on dynamics of participation of ethnic Armenians voters as well
as share of Armenians represented in election administration. Survey method has been used for
understanding the social aspects of electoral behavior as well as satisfaction with implemented measures
and activities. The focus groups served as auxiliary method for the survey for more profound interpretation
of the patterns found.
In total, 341 questionnaires have been collected and collected from respondents in Akhalkalaki, Akhaltsikhe,
Aspindza, Borjomi, Ninotsminda and Tsalka election districts. Stratified Random Sampling has been used for
selection of respondents. In addition, three focus groups totaling 36 persons, have been conducted with
representatives from all target municipalities.
Chapter 3 presents results of desk research and analysis of existing official data on the target population
participation dynamics in the elections of and how ethnic Armenians are involved in the election
administration.
Chapter 4 focuses on electoral behavior of ethnic Armenians: what factors motivate/prevent their
[non]participation and how their electoral preferences are determined. Furthermore, the research assesses

7 | P a g e
effectiveness of measures and activities implemented by different stakeholders in order to address existing
problems.
Finally Chapter 5 offers general and concrete recommendations to stakeholders how to address actions for
improvement within their mandates and competencies.
Main Findings:
Socio‐Demographic Situation
Unemployment remains the most important problems among the target population. Almost one
third of respondents (31.4%) identified themselves as “unemployed”. One fifth maintained that they
are self‐employed.
Comparing to other ethnic minority groups of Georgia, Armenians have more educational
experience. Out of the total number of respondents 36.6% indicted having high education.
The younger generation (18‐27) shows highest rate of having high education. In gender perspective
10% more female than male indicate to be university graduates while rural population have
relatively less high education.
Knowledge of the state language still remains a problematic issues. Akhalkalaki and Ninotsminda
tend to have highest share of people without Georgian language skills. Significantly less people
speak the state language in rural areas compared to the urban ones. The younger generation (18‐27)
has the best command of Georgian language.
Participation in Elections
There is drastic decline of participation in the elections in the target municipalities. During the 4 year
period (2010‐2014) voters’ turnout in the 125 precincts fell from 70% in 2010 to 49.8 % in 2014,
meaning that 20,471 less persons have voted.
Ninotsminda and Akhalkalaki, the best‐performing districts in Georgia in terms of turnout in 2010
have seen the radical decline in 2014 – 26% and 24% less voters, respectively.
There is also decline in the number of registered voters in the targeted precincts. General finding in
this regard is that the number of registered ethnic Armenians in the six municipalities in 4 year
period of time has declined by 6,604 persons amounting to ‐7.7%.
Share of Ethnic Armenians in DECs and PECs
An increase of number of ethnic Armenians in target PECs was observed from 2013 to 2014. Share
of ethnic Armenians has increased from 86.7% in 2013 to 87.2% in 2014.
This tendency mainly comes from the number of PEC members appointed by political parties (739
in 2013 and 750 in 2014) while the number of Armenian PEC members elected to DECs has slightly
declined from 669 in 2013 to 666 in 2014.
The overwhelming majority of PEC members in Akhalkalaki and Ninotsminda were ethnic
Armenians, representing 97.9% and 98.6% respectively. 92.8% of the head of targeted PECs in 2013
were ethnic Armenians while Deputy Heads amounted to 92%. These numbers insignificantly
decline in 2014 to 91.2% and 90.4%, respectively.
The research showed that positions of Head, Deputy Head and Secretary of PECs are continuously
taken by same persons. This can be considered as a result of democratic election procedure within
PECs, on the other hand, it indicates traditional approach to the membership.
8 | P a g e
Ethnic Armenians in DECs are represented only in Akhalkalaki (7 persons), Ninotsminda (11) and
Akhaltsikhe (1). Yet, the share of ethnic Armenians in Tsalka, Akhalkalaki and Akhaltsikhe DECs do
not correspond to the ethnic composition of municipality population (respectively 55%, 94.3%,
36.6% are ethnic Armenians).
Importance and Factors of [Non] Participation;
For 54.3% of respondents voting in each election is “Very Important” while for 35.4% ‐ “Somewhat
Important”. Only 10% of the respondents indicated that it is “Not important”.
Main reasons for participation in elections are: 1. Civic right and duty; 2. to elect the favorite
candidate; 3. to change the ruling party or politician. First three factors named for non‐participation:
1. One’s vote does not change anything; 2. No trust in local politicians; 3. No candidate that fits
interests.
Presidential elections are considered by 35.9% most important; 35.1% ‐ local self‐government, and
29% indicated parliamentary elections.
The key factors which determine electoral preferences regarding political parties are party program;
party’s ideology and campaign meetings/rallies with candidates.
The key factors which determine electoral preferences regarding politicians/candidates are:
election program of the candidate; candidate’s personality and reputation; candidate’s awareness
of local problems,
Armenians do not rule out possibility of always voting for the RULING party. The number of those
who always vote for the ruling party seems to be 5 times more than those who say never. Always
voting for SAME political party seems yet another socially accepted behavior, but has lower
frequency than voting for RULING Party.
Gender as a factor ‐ two third of respondents would vote for a female candidate. Only 12.9%
declined this option and 21.6% refused to answer.
Elections 2014 and Sources of Information
When assessing the participation in the election 2014, 40.9% mentioned that it was very important,
31.5% ‐ somewhat important and 9.2% ‐ not important. Remaining 18.4% did not have an opinion.
Key reasons for non‐participation in the election 2014 were: 1. No trust in local politicians; 2. No
time; 3. One’s vote would not have changed anything.
One third of population claim that they are actively involved/following politics in the municipality.
39.6% of respondents indicated they often watched the news concerning 2014 elections. Those who
followed election news every now and then amounted to 34%. While merely 7.5% declared they
never followed the news.
More than half of the respondents (52.3%) mentioned TV as a source of information, followed by
campaign meetings with candidates (36.1%), internet (35.2%) and friends and family (20.6%).
Out of the TV channels the most frequently watched broadcasters are TV Channels in Armenia,
Russian Federation TV Channels and Georgian Public Broadcaster.
Highest share of respondents (53.7 %) indicated that effective instrument for getting first‐hand
information are pre‐election campaigns and meetings with candidates. TV advertisements had the
second highest number of approval among the respondents, followed by seminar and trainings. The
CEC call center had lowest number.
Effectiveness of Implemented measures and activities to create equal election environment
9 | P a g e
Majority of the respondents evaluated the efficiency of CEC and PEC as satisfactory, representing
56.5% and 58.3% correspondingly. The shares of those who were very satisfied with the work of
Central and Precinct Election commissions was relatively small, equaling 12.2% and 13.6% of the
respondents .
In terms of equal electoral environment for ethnic Armenians created by CEC, 44.5% have indicated
that the environment was equal to the one for ethnic Georgians. Almost 13% held the environment
was even better for ethnic Armenians than for ethnic Georgians. Very few, considered its opposite.
The study show that effectiveness of CEC’s media work, aimed at raising awareness of the local
population on electoral process, has been quite limited in achieving its goals.
PEC members have highly appreciated the measures provided by the CEC to create most favorable
environment throughout the electoral processes. They have positively evaluated trainings. However,
doubtful comments have been made regarding competences of trainers. Yet, general population
criticized professionalism of PEC members.
Effectiveness of the projects funded by the Elections Reform Center has been in general assessed
positively except for the outreach of these projects. Remote and rural areas have in the most cases
not been covered. Targeting only younger generation (18‐27) makes middle‐aged and elder
generations marginalized, as they have the lowest level of awareness on electoral processes and
civic rights.
Key recommendations
CEC to develop appropriate policy which would ensure free and fair system of selection of the PEC members based on merits and popularize the selection process.
The CEC should cooperate more with local media outlets on the long‐term projects which would make more people interested in participating in elections
Within its mandate to ensure relative balance of proportion of ethnic Armenian members of DECs in municipalities where ethnic Armenians are compactly represented
Have heads of the PECs warned of the strong control over political agitation in close proximities to
the polling stations. Work alongside with Ministry of Internal Affairs to ensure that voters do not
hesitate to participate because of the tense situation around precincts.
Seminars/trainings organized by the CEC in ethnic minority regions should be held more in rural
areas than in urban centers, in as much as according to this study, village dwellers always have
lesser access to such events.
Popularize more among ethnic minorities its multilingual information call center
Grant facility of Center of Electoral Systems Development, Reforms and Trainings needs to be more accessible for the non‐governmental organizations working in the target region
It is recommended for the Center to work alongside with the Central Election Commission on development of professional election administration in the target region
Governmental bodies need to ensure that the problems of civic integration as identified in this research are adequately addressed in the Concept of Tolerance and Civic Integration and its action plan for 2015‐2019
Ministry of education and science (MES) needs to ensure quality teaching of the state language in public schools and for adult population
MES should evaluate effectiveness of the past and current programs to improve teaching of Georgian language to different segments of ethnic Armenian population
It is important to develop and implement business and economic projects in these regions.
10 | P a g e
It is recommended for the international organization and diplomatic missions which are active in the
target region to mainstream the problems identified in the research and include civil society
dimension in their work
In their donor work IOs need mainstream ethnic minority issues with emphasis on development of
remote and rural locations;
Political parties need to work with local communities on daily basis. Among ethnic Armenians there
is an image of politicians who “come to see us just when need our votes”. In order to eliminate such
attitudes frequent communication with constituencies is very important;
It is highly recommended to political parties to include new generation and young politicians locally,
as they have better knowledge and are willing to contribute to the development of their region.
Local media should act as monitor and evaluator of the work of current politicians and during the
pre‐election period assess the progress they have achieved based on their election program;
Local Media needs to run more analytical, talk and debate shows before the elections if necessary
by support of the different stakeholders;
CSOs need to prioritize to work with beneficiaries from different age groups. As the study show, the
younger generation (18‐27) has much better standing in developing civic qualities, while the other
groups are highly lagging behind in that regard. It is very important for the CSO to also work with
middle‐aged and older population. Women need to be targeted as well;
Local civil society organization need to be involved in advocacy campaigns in cooperation with other
counterparts and be part of coalitions, NGO fora and platforms;
Local CSOs need to actively work with local media in order to popularize their work and spread
information about the activities.

11 | P a g e
Chapter 2: Methodology
Due to the complexity of the topic related to the 2 separate body of data, two different methodological sets
have been elaborated within the study. The first deals with representation and participation of ethnic
Armenians in the 2014 local self‐government elections compared to the previous elections (2010, 2012,
2013), while second set identifies socio‐demographic aspects of general electoral behavior of ethnic
Armenians from the target regions. Both methodological standards are explained in details in this chapter.
2.1 Dynamics of Representation and Participation of Ethnic Armenians in the 2014
local self‐government elections
2.1.1 Research Design
As much as this part of research mainly includes interpretation of already existing official (objective) data,
the comparative approach, as a research design, has been selected for studying the dynamics of
representation and participation of ethnic Armenians in the elections. Particularly, the following four main
aspects have been analyzed to compare corresponding data from the previous elections. This approach
makes two main variables observable in dynamics and gives more credibility to the research:
Comparison of the number of registered voters and voters who actually participated in 2014 and
2010 local self‐government elections.
Comparison of number of ethnic Armenian members of District Election Commissions in 2014 Local
self‐government elections and 2013 Presidential elections.
Comparison of number of ethnic Armenian members of Precinct Election Commissions in 2014 Local
self‐government elections and 2013 Presidential elections.
Comparison of number of ethnic Armenians acting as a head, a deputy head and secretary of
Precinct Election Commission in 2014 Local self‐government elections and 2013 Presidential
elections.
By using these data it is possible to interpret the existing situation and what is an empiric picture regarding
dynamics of participation of ethnic minorities.
2.1.2 Research method
The method was based on desk research, analyzing existing official data available, with the main source
being statistics from the Central Election Commission (CEC) of Georgia, publicly accessible to anyone
through summary protocols on the website.
2.1.3 Selection of districts for analysis
Six elections districts have been selected as target area:
• In Samtskhe‐Javakheti: Akhaltsikhe, Akhalkalaki, Aspindza, Borjomi and Ninotsminda
• In Kvemo Kartli: Tsalka.
According to the Georgian legislation, there is no indication of ethnicity of the voters in any official
document either personal or voters’ lists, the CEC could not provide the data on ethnic Armenians
participation. These municipalities (districts) are mainly populated by ethnic Armenians.
12 | P a g e
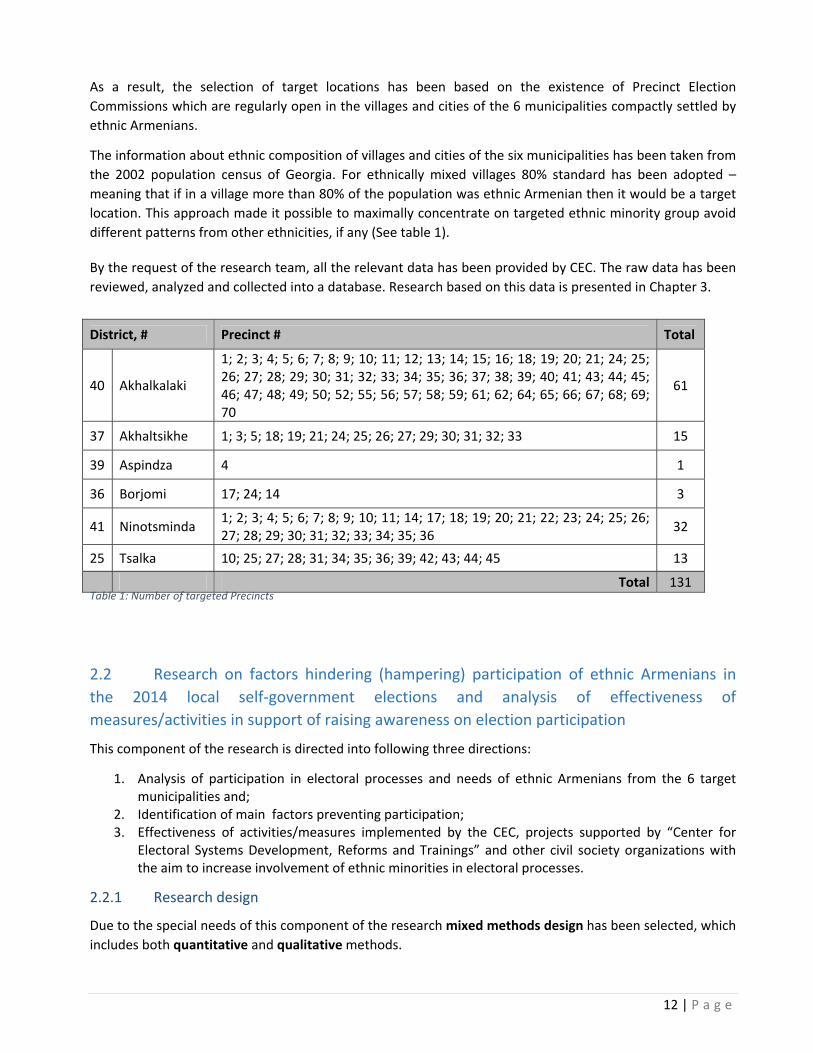
As a result, the selection of target locations has been based on the existence of Precinct Election
Commissions which are regularly open in the villages and cities of the 6 municipalities compactly settled by
ethnic Armenians.
The information about ethnic composition of villages and cities of the six municipalities has been taken from
the 2002 population census of Georgia. For ethnically mixed villages 80% standard has been adopted –
meaning that if in a village more than 80% of the population was ethnic Armenian then it would be a target
location. This approach made it possible to maximally concentrate on targeted ethnic minority group avoid
different patterns from other ethnicities, if any (See table 1).
By the request of the research team, all the relevant data has been provided by CEC. The raw data has been
reviewed, analyzed and collected into a database. Research based on this data is presented in Chapter 3.
2.2 Research on factors hindering (hampering) participation of ethnic Armenians in
the 2014 local self‐government elections and analysis of effectiveness of
measures/activities in support of raising awareness on election participation
This component of the research is directed into following three directions:
1. Analysis of participation in electoral processes and needs of ethnic Armenians from the 6 target municipalities and;
2. Identification of main factors preventing participation; 3. Effectiveness of activities/measures implemented by the CEC, projects supported by “Center for
Electoral Systems Development, Reforms and Trainings” and other civil society organizations with the aim to increase involvement of ethnic minorities in electoral processes.
2.2.1 Research design
Due to the special needs of this component of the research mixed methods design has been selected, which
includes both quantitative and qualitative methods.
District, # Precinct # Total
40 Akhalkalaki
1; 2; 3; 4; 5; 6; 7; 8; 9; 10; 11; 12; 13; 14; 15; 16; 18; 19; 20; 21; 24; 25; 26; 27; 28; 29; 30; 31; 32; 33; 34; 35; 36; 37; 38; 39; 40; 41; 43; 44; 45; 46; 47; 48; 49; 50; 52; 55; 56; 57; 58; 59; 61; 62; 64; 65; 66; 67; 68; 69; 70
61
37 Akhaltsikhe 1; 3; 5; 18; 19; 21; 24; 25; 26; 27; 29; 30; 31; 32; 33 15
39 Aspindza 4 1
36 Borjomi 17; 24; 14 3
41 Ninotsminda 1; 2; 3; 4; 5; 6; 7; 8; 9; 10; 11; 14; 17; 18; 19; 20; 21; 22; 23; 24; 25; 26; 27; 28; 29; 30; 31; 32; 33; 34; 35; 36
32
25 Tsalka 10; 25; 27; 28; 31; 34; 35; 36; 39; 42; 43; 44; 45 13
Total 131 Table 1: Number of targeted Precincts
13 | P a g e
Therefore, as a research strategy sequential procedures has been adopted, which means utilization of
research methods orderly and interchangeably in order to explain a social phenomenon. This gives an option
of deeper interpretation of collected data. Therefore, in order to find out general attitudes and tendencies
first quantitative research has been conducted, which has given greater representation to the study. Only
after that qualitative research was held, in order to better analyze those social tendencies which had been
ascertained by mass survey.
2.2.2 Quantitative Research
In Georgia there has never been a research specifically on problems and needs of ethnic Armenians
population regarding electoral processes. Therefore it was of crucial importance to transfer the research
subject in quantitative dimension.
Survey has been selected as a method of quantitative research. Particularly, self‐administered survey which
means a method when interviewer gives questionnaire to a respondent and independently fills in it. This
gives sense of anonymity to respondents, which was crucially important in this case, when dealing with very
sensitive issues. It is also relatively fast and efficient method compared to others, especially in the
constrained timeframe.
2.2.2.1 Questionnaire
The Questionnaire, elaborated for the purpose, included 59 questions grouped in 4 blocks and had open‐
ended, closed, and semi‐open questions. Among the closed questions were grading scale, ranking scale and
checklists. 4 blocks of the questionnaire:
Socio‐demographical information on respondents
Electoral behavior ‐ general
Electoral behavior – local self‐government elections 2014
Effectiveness of measures for the participation in local self‐government elections 2014
The instrument has been pilot tested on 6 respondents. The feedback has been mainstreamed in the in the document. The final version of the questionnaire has been translated into Georgian, Russian and Armenian languages.
2.2.2.2 Selection of respondents for the survey
In this component of the research population was every ethnic Armenian citizens of Georgia living in the
territory of the 6 target municipalities and are at least 18 year‐old. In order to find concrete number of
population with voting rights, two data criteria have been applied:
1. Total number of registered voters for the 2014 elections at the relevant electoral precinct. 2. Relevant precincts have been selected based on the results of 2002 population census and share of
ethnicities living in the villages.
By merging these two data, population number amounted to 84,743 persons. Using these two data was
important to leave out under‐18 population of the region, as well as other ethnicities.
According to internationally accepted standard of representation, a calculated sample was set at 341
person, which gave a confidence level 95% to the study and a margin of error at 5.3%.

14 | P a g e
Stratified Random Sampling had been used as a method for defining the sample group. Particularly,
population has been divided into strata based on proportionality principle of persons living in the 6 target
municipalities at the time of 2002 census. As a result, proportion of respondents are presented in the table
2.
The next strata which has been used for selection of sample was proportionality between shares of rural and
urban population of ethnic Armenians. Therefore, questionnaires have been distributed among respective
city/village population based on the data from census 2002 (see table 2).
2.2.2.3 Data Collection and Computation
The research team within two weeks has managed to get all the required number of respondents and
questionnaire filled in. Interviewer with appropriate language skills has managed in timely manner to collect
all the information from the field work.
At the same time, a database has been set up and collected data had been entering at the same time in the
computer software program SPSS 17.0. One week before the start of qualitative research the formation of
database had already been completed and preliminary result and analysis had already been done.
2.2.3 Qualitative research
Qualitative research was aimed to be additional factor of explanation, interpretation and deeper analysis of
the findings of quantitative research.
Municipality City/Village Number of respondents Total
Aspindza Damala 6 6
Akhalkalaki
Akhalkalaki 60
147
village Ghadolari 11
village Aragva 20
village Vachiani 11
village Sulda 12
village Turtskhi 16
village Diliska 17
Akhaltsikhe
Akhaltsikhe 25
58
village Pamaji 7
village Tskruti 8
village Skhvilisi 6
Vale 12
Borjomi village Tabatskuri 4
6 village Moliti 2
Ninotsminda
Ninotsminda 20
96
village Foka 19
village Satkha 18
village Gandza 29
village Didi Khanchali 10
Tsalka village Kizil‐Kilisa 15
28 village Nardevani 13
Total 341 341
Table 2: Number of Respondents from Each strata
15 | P a g e
2.2.3.1 Focus groups
Focus group has been selected as a method of qualitative research in order to discuss and provide deeper
analysis of observed patterns. 3 focus groups have been conducted in the framework of the research:
2 focus groups have been conducted in Ninotsminda and Akhalkalaki each lasting 2.5 hours.
Yet another 2‐day focus group was organized. It was divided into 3 separate thematic sessions:
1. General attitudes towards elections
2. Participation in the lections 2014
3. Effectiveness of the implemented projects and measure by different stakeholders.
2.2.3.2 Selection
Selection for the first 2 focus was primarily based on socio‐demographical perspectives: particularly
Ninotsminda and Akhalkalaki have been selected due to high concentration of ethnic Armenians in Georgia.
For these focus group discussions 10 people have been selected mainly from civil society organizations and
local opinion leaders.
As for the two‐day focus group discussion, 16 participants from the 6 target municipalities, representing civil
society, media and educational institutions have been brought together with relevant proportions of the
Armenian population:
6 from Akhalkalaki
4 from Ninotsminda
2 from Akhaltsikhe
2 from Tsalka
1 from Aspindza
1 from Borjomi
2.2.3.3 Instrument
Semi‐structured questionnaire has been prepared based on the survey as well as the findings of the
quantitative research.
The discussions have been driven by facilitator with “community mapping’ technique, primarily. However,
different within‐group exercises have also been given to the participants.
16 | P a g e
Chapter 3: Representation and electoral behavior of ethnic
Armenians – comparing 2014 local self‐government and previous
Elections
3.1 Registered Voters and Turnout Rate
As pointed out in the methodology chapter (p. 12) there is an objective, legal obstacle in recording
participation of ethnic Armenians nor any other ethnic minority group, as all are recorded as citizens of
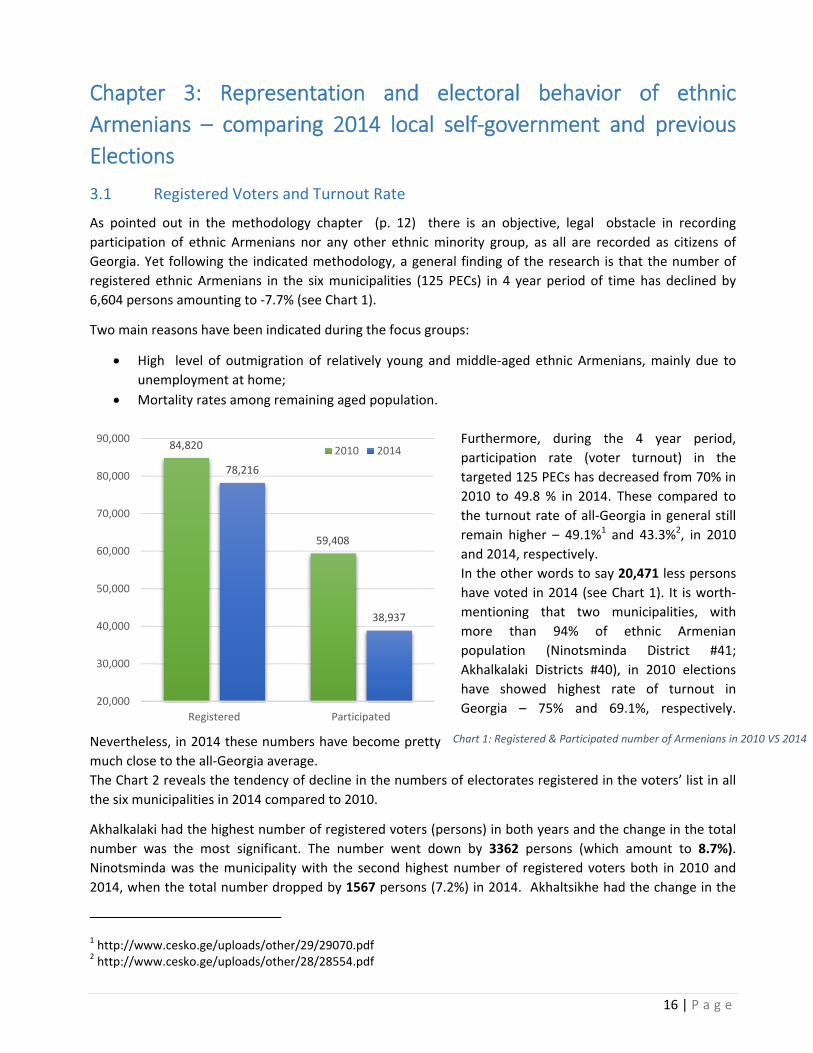
Georgia. Yet following the indicated methodology, a general finding of the research is that the number of
registered ethnic Armenians in the six municipalities (125 PECs) in 4 year period of time has declined by
6,604 persons amounting to ‐7.7% (see Chart 1).
Two main reasons have been indicated during the focus groups:
High level of outmigration of relatively young and middle‐aged ethnic Armenians, mainly due to
unemployment at home;
Mortality rates among remaining aged population.
Furthermore, during the 4 year period,
participation rate (voter turnout) in the
targeted 125 PECs has decreased from 70% in
2010 to 49.8 % in 2014. These compared to
the turnout rate of all‐Georgia in general still
remain higher – 49.1%1 and 43.3%2, in 2010
and 2014, respectively.
In the other words to say 20,471 less persons
have voted in 2014 (see Chart 1). It is worth‐
mentioning that two municipalities, with
more than 94% of ethnic Armenian
population (Ninotsminda District #41;
Akhalkalaki Districts #40), in 2010 elections
have showed highest rate of turnout in
Georgia – 75% and 69.1%, respectively.
Nevertheless, in 2014 these numbers have become pretty
much close to the all‐Georgia average.
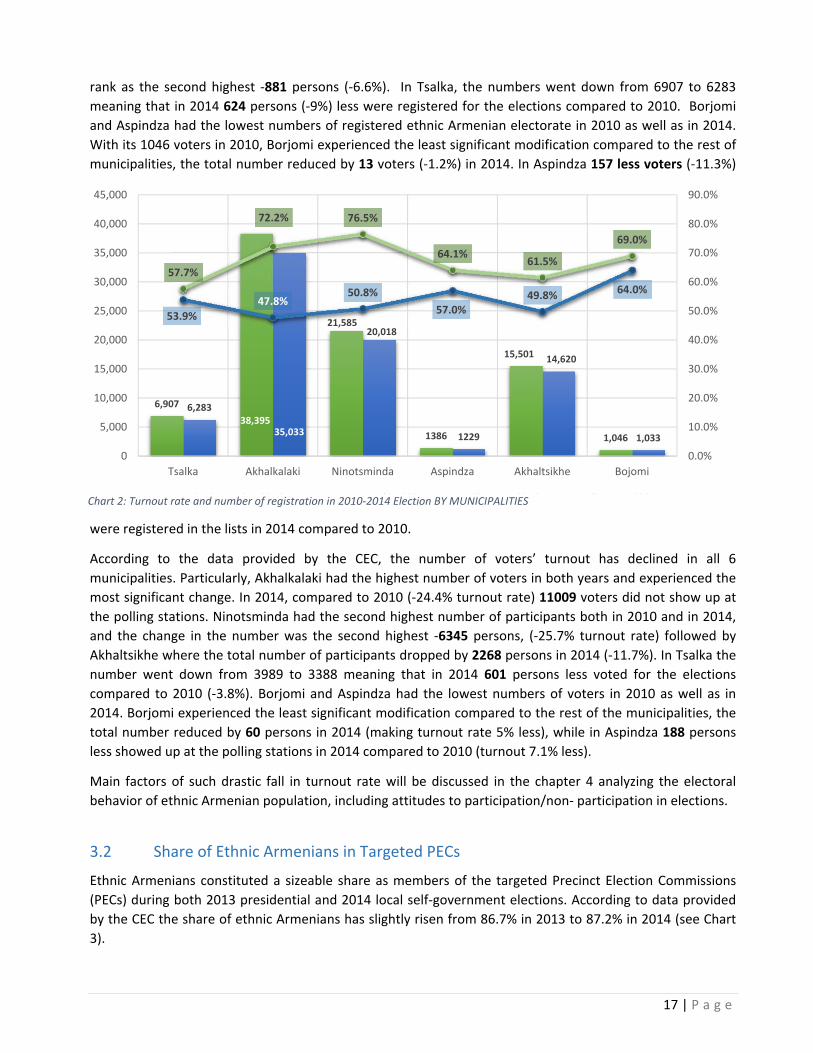
The Chart 2 reveals the tendency of decline in the numbers of electorates registered in the voters’ list in all
the six municipalities in 2014 compared to 2010.
Akhalkalaki had the highest number of registered voters (persons) in both years and the change in the total
number was the most significant. The number went down by 3362 persons (which amount to 8.7%).
Ninotsminda was the municipality with the second highest number of registered voters both in 2010 and
2014, when the total number dropped by 1567 persons (7.2%) in 2014. Akhaltsikhe had the change in the
1 http://www.cesko.ge/uploads/other/29/29070.pdf 2 http://www.cesko.ge/uploads/other/28/28554.pdf
84,820
59,408
78,216
38,937
20,000
30,000
40,000
50,000
60,000
70,000
80,000
90,000
Registered Participated
2010 2014
Chart 1: Registered & Participated number of Armenians in 2010 VS 2014
17 | P a g e
rank as the second highest ‐881 persons (‐6.6%). In Tsalka, the numbers went down from 6907 to 6283
meaning that in 2014 624 persons (‐9%) less were registered for the elections compared to 2010. Borjomi
and Aspindza had the lowest numbers of registered ethnic Armenian electorate in 2010 as well as in 2014.
With its 1046 voters in 2010, Borjomi experienced the least significant modification compared to the rest of
municipalities, the total number reduced by 13 voters (‐1.2%) in 2014. In Aspindza 157 less voters (‐11.3%)
were registered in the lists in 2014 compared to 2010.
According to the data provided by the CEC, the number of voters’ turnout has declined in all 6
municipalities. Particularly, Akhalkalaki had the highest number of voters in both years and experienced the
most significant change. In 2014, compared to 2010 (‐24.4% turnout rate) 11009 voters did not show up at
the polling stations. Ninotsminda had the second highest number of participants both in 2010 and in 2014,
and the change in the number was the second highest ‐6345 persons, (‐25.7% turnout rate) followed by
Akhaltsikhe where the total number of participants dropped by 2268 persons in 2014 (‐11.7%). In Tsalka the
number went down from 3989 to 3388 meaning that in 2014 601 persons less voted for the elections
compared to 2010 (‐3.8%). Borjomi and Aspindza had the lowest numbers of voters in 2010 as well as in
2014. Borjomi experienced the least significant modification compared to the rest of the municipalities, the
total number reduced by 60 persons in 2014 (making turnout rate 5% less), while in Aspindza 188 persons
less showed up at the polling stations in 2014 compared to 2010 (turnout 7.1% less).
Main factors of such drastic fall in turnout rate will be discussed in the chapter 4 analyzing the electoral
behavior of ethnic Armenian population, including attitudes to participation/non‐ participation in elections.
3.2 Share of Ethnic Armenians in Targeted PECs
Ethnic Armenians constituted a sizeable share as members of the targeted Precinct Election Commissions
(PECs) during both 2013 presidential and 2014 local self‐government elections. According to data provided
by the CEC the share of ethnic Armenians has slightly risen from 86.7% in 2013 to 87.2% in 2014 (see Chart
3).
6,907
38,395
21,585
1386
15,501
1,046
6,283
35,033
20,018
1229
14,620
1,033
57.7%
72.2% 76.5%
64.1%61.5%
69.0%
53.9%47.8%
50.8%
57.0%49.8% 64.0%
0.0%
10.0%
20.0%
30.0%
40.0%
50.0%
60.0%
70.0%
80.0%
90.0%
0
5,000
10,000
15,000
20,000
25,000
30,000
35,000
40,000
45,000
Tsalka Akhalkalaki Ninotsminda Aspindza Akhaltsikhe Bojomi
Registered in 2010 Registered in 2014 Turnout 2010 Turnout 2014Chart 2: Turnout rate and number of registration in 2010‐2014 Election BY MUNICIPALITIES
18 | P a g e
739 750
669 666
0%
10%
20%
30%
40%
50%
60%
70%
80%
90%
100%
2013 2014
Appointed from Polit. Parties Elected by DECs
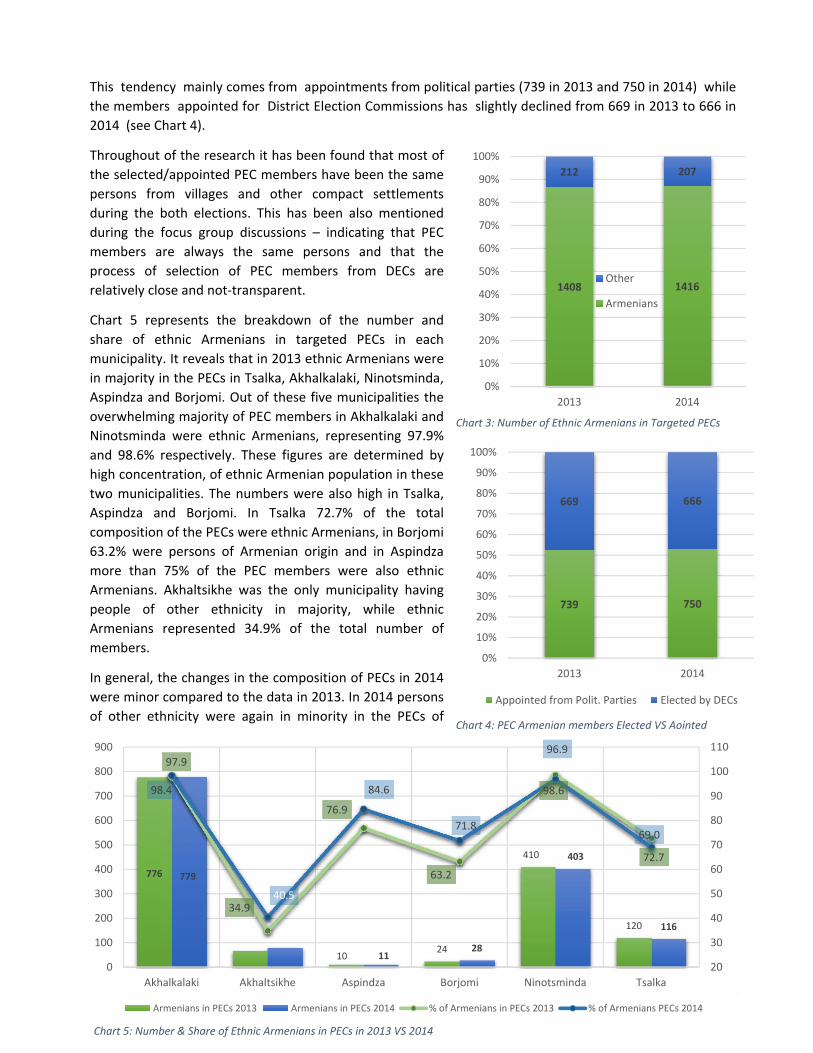
This tendency mainly comes from appointments from political parties (739 in 2013 and 750 in 2014) while
the members appointed for District Election Commissions has slightly declined from 669 in 2013 to 666 in
2014 (see Chart 4).
Throughout of the research it has been found that most of
the selected/appointed PEC members have been the same
persons from villages and other compact settlements
during the both elections. This has been also mentioned
during the focus group discussions – indicating that PEC
members are always the same persons and that the
process of selection of PEC members from DECs are
relatively close and not‐transparent.
Chart 5 represents the breakdown of the number and
share of ethnic Armenians in targeted PECs in each
municipality. It reveals that in 2013 ethnic Armenians were
in majority in the PECs in Tsalka, Akhalkalaki, Ninotsminda,
Aspindza and Borjomi. Out of these five municipalities the
overwhelming majority of PEC members in Akhalkalaki and
Ninotsminda were ethnic Armenians, representing 97.9%
and 98.6% respectively. These figures are determined by
high concentration, of ethnic Armenian population in these
two municipalities. The numbers were also high in Tsalka,
Aspindza and Borjomi. In Tsalka 72.7% of the total
composition of the PECs were ethnic Armenians, in Borjomi
63.2% were persons of Armenian origin and in Aspindza
more than 75% of the PEC members were also ethnic
Armenians. Akhaltsikhe was the only municipality having
people of other ethnicity in majority, while ethnic
Armenians represented 34.9% of the total number of
members.
In general, the changes in the composition of PECs in 2014
were minor compared to the data in 2013. In 2014 persons
of other ethnicity were again in minority in the PECs of
1408 1416
212 207
0%
10%
20%
30%
40%
50%
60%
70%
80%
90%
100%
2013 2014
Other
Armenians
Chart 3: Number of Ethnic Armenians in Targeted PECs
776
68
1024
410
120
779
79
1128
403
116
97.9
34.9
76.9
63.2
98.6
72.7
98.4
40.5
84.6
71.8
96.9
69.0
20
30
40
50
60
70
80
90
100
110
0
100
200
300
400
500
600
700
800
900
Akhalkalaki Akhaltsikhe Aspindza Borjomi Ninotsminda Tsalka
Armenians in PECs 2013 Armenians in PECs 2014 % of Armenians in PECs 2013 % of Armenians PECs 2014
Chart 5: Number & Share of Ethnic Armenians in PECs in 2013 VS 2014
Chart 4: PEC Armenian members Elected VS Aointed
19 | P a g e
Tsalka, Akhalkalaki, Ninotsminda, Aspindza and Borjomi. Overwhelming majority of PEC members in
Akhalkalaki and Ninotsminda were ethnic Armenians, representing 98.4% and 96.9%, respectively, keeping
the figures very close to the previous data. In Tsalka, the PECs included 69% of Armenians, which is 3.7% less
compared to the previous year 2013. In Aspindza, a 13‐member PEC included not more than two non‐
Armenians increasing the percentage of ethnic Armenians up to 84.6%. Borjomi experienced a slight change
in the composition. By adding four Armenians in the commissions the percentage altered to 71.8% in 2014.
The absolute number of ethnic Armenians in Akhaltsikhe PECs increased by 15 persons compared to the
previous year 2013. However, Akhaltsikhe was again the only municipality having ethnic Armenians in
minority, representing merely 40.5% of the total composition of all PECs.
To summarize, in the PECs there was a tendency, although insignificant (0.3%), in raising share of ethnic
Armenian members from 2013 to 2014. This pattern mostly comes from the increase of appointed PEC
members provided by political parties. Akhalkalaki and Ninotsminda districts maintain highest share of
ethnic Armenians in the PECs, determined by highest concentration of ethnic Armenian population in the
municipalities. The Akhaltsikhe district, retains the lowest share, determined by two factors:
Share of Armenians in the City of Akhaltsikhe (with 7 targeted PECs) ranges from 40‐46% according
to different sources and thus there are mixed ethnic groups represented in PECs making Armenians
maximum 2 members of PECs in the both elections. Although PECs in Armenian villages of
Akhaltsikhe have been fully staffed with ethnic Armenians, the share is affected by the situation in
city of Akhaltsikhe.
Ethnic Armenians of Akhaltsikhe are well integrated into Georgian society and the problem of
miscommunication between staff and voters, due to lack of knowledge of the state language is not
present here (unlike in other targeted municipalities).
3.3 Official Positions held by ethnic Armenians in PECs
It was important to find out how frequently ethnic Armenians take up key positions in the targeted PECs and
how ethnic Armenians are involved in decision making processes.
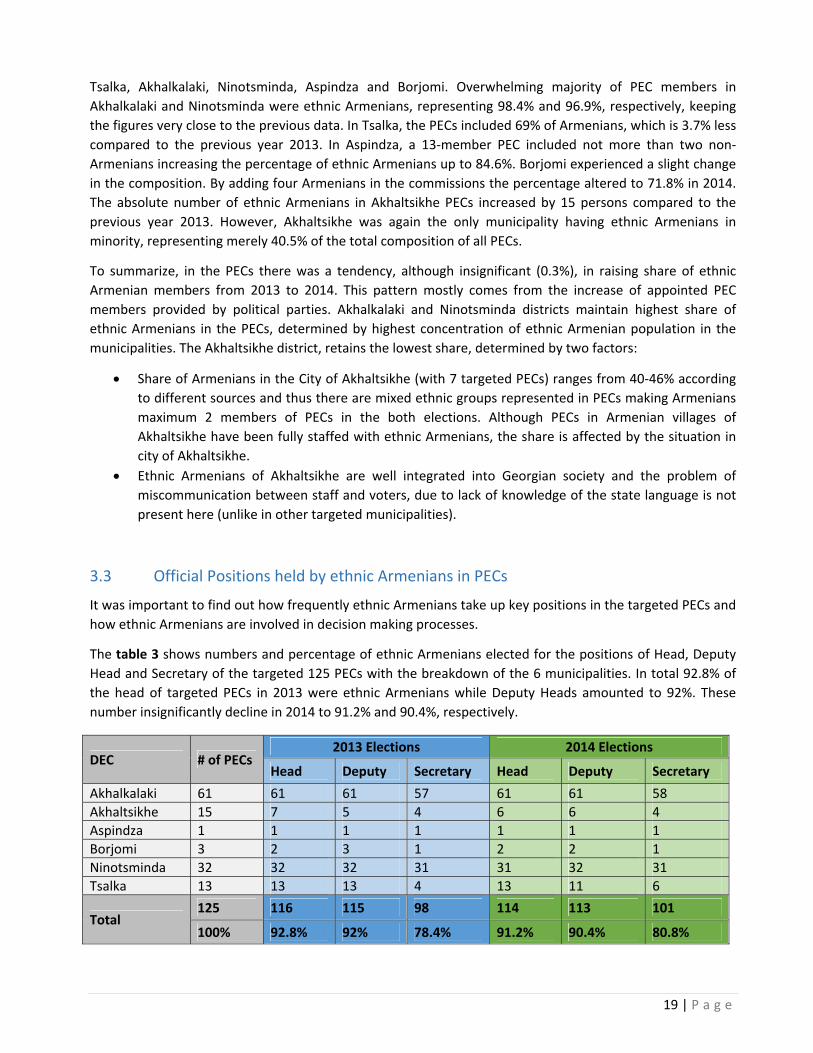
The table 3 shows numbers and percentage of ethnic Armenians elected for the positions of Head, Deputy
Head and Secretary of the targeted 125 PECs with the breakdown of the 6 municipalities. In total 92.8% of
the head of targeted PECs in 2013 were ethnic Armenians while Deputy Heads amounted to 92%. These
number insignificantly decline in 2014 to 91.2% and 90.4%, respectively.
DEC # of PECs 2013 Elections 2014 Elections
Head Deputy Secretary Head Deputy Secretary
Akhalkalaki 61 61 61 57 61 61 58
Akhaltsikhe 15 7 5 4 6 6 4
Aspindza 1 1 1 1 1 1 1
Borjomi 3 2 3 1 2 2 1
Ninotsminda 32 32 32 31 31 32 31
Tsalka 13 13 13 4 13 11 6
Total 125 116 115 98 114 113 101
100% 92.8% 92% 78.4% 91.2% 90.4% 80.8%
20 | P a g e
7
0 0 0
11
0
7
1 0 0
11
00
1
2
3
4
5
6
7
8
9
10
11
12
13
Akhalkalaki Akhaltsikhe Aspindza Borjomi Ninotsminda Tsalka
2013
2014
Table 3: Ethnic Armenians as Head, Deputy Head and Secretary in the targeted PECs, 2013‐2014 Elections
Relatively lower share of ethnic Armenians were on the position of Secretary of targeted PECs, the rest
being taken mostly by ethnic Georgians. This pattern was explained at the focus group discussion by fact
that secretarial job requires higher competencies (written) in the state language. Nevertheless, in
Akhalkalaki and Ninotsminda almost all Heads and Deputy Heads, and secretarial positions were
predominantly taken up by ethnic Armenians.
Yet an unexpected pattern has been revealed here. The position of Head, Deputy Head and Secretary of
PECs were primarily taken by the same persons in both elections this can be considered as a result of
democratic election procedure within PECs, but on the other hand it indicates that the traditional approach
to membership and being of heads (including dep. heads) prevail and it is difficult for others to become
involved. At the focus group discussion one of the participants indicated to be appointed in years by “direct
encouragement”.
3.4 Share of ethnic
Armenians in DECs and
their positions
The data provided by the CEC
revealed that in 2013 the
DECs in Tsalka, Aspindza,
Akhaltsikhe and Borjomi were
entirely composed of non‐
Armenian population, while in
the case of Ninotsminda, the
overwhelming majority of the
DEC members were ethnic
Armenians (11 out of 13). The
only municipality with
balanced ethnic composition
was Akhalkalaki, despite high concentration of ethnic Armenians.
In 2014 there was a slight alteration in the data concerning Akhaltsikhe municipality. One ethnic Armenian
member has been elected by the CEC.
Similar to the data in 2013 the DECs in
Tsalka, Aspindza and Borjomi were again entirely composed of non‐Armenians. In 2014 the vast majority of
the members of DEC in Ninotsminda (11 persons) were ethnic Armenians and Akhalkalaki was again the only
municipality with balanced composition (Armenians/Georgians ‐7/6 respectively).
As the Table 4 reveals, ethnic Armenians were included in the composition of the DECs in Akhalkalaki and
Ninotsminda municipalities both in 2013 and in 2014. In Akhalkalaki the DEC was headed by an Armenian in
both years and 3 (in 2013) and 4 (in 2014) members out of seven were appointed by CEC. Also in
Ninotsminda an ethnic Armenian headed the DEC in, assisted by an Armenian secretary in 2013/2014 and
Chart 6: Number of Ethnic Armenians in DECs. Out of 13

21 | P a g e
Armenians represented overwhelming majority of the DEC. Five members out of total 11 Armenian
representatives were appointed by CEC in both years.
In Akhaltsikhe in 2014, only one ethnic Armenian member of the PEC was nominated by CEC, while in 2013
no Armenians were included in the DEC.
DEC
2013 2014
Total
Arm
enians
by CEC
Head
Dep
uty
Secretary
Total
Arm
enians
by CEC
Head
Dep
uty
Secretary
Akhalkalaki 13 7 4 1 . . 13 7 4 1 . .
Akhaltsikhe 13 . . . . . 13 1 1 . . .
Aspindza 13 . . . . . 13 . . . . .
Borjomi 13 . . . . . 13 . . . . .
Ninotsminda 13 11 5 1 . 1 13 11 5 1 . 1
Tsalka 13 . . . . . 13 . . . . .
Total 78 18 9 2 0 1 78 19 10 2 0 1 Table 4: ethnic Armenian Members of DECs and Official Positions taken up in 2013‐2014 Elections
To summarize, in the 2 election years, there was an insignificant development in the share of ethnic
Armenians in the target DECs. It was primarily due to election by the CEC of Karapet Kirakosyan for a 5‐year
period as a member of DEC #37 in Akhaltsikhe. No any other change in share of ethnic Armenians has been
observed during that period.
Although election/appointment of membership of DECs (by the CEC as well as appointment from qualified
political parties) is regulated by respective law which specifically defines the procedure, the reality shows
that the share of ethnic Armenians in Tsalka, Akhalkalaki and Akhaltsikhe DECs does not correspond to
ethnic composition of the total municipality population (respectively 55%, 94.3%, 36.6% ethnic Armenians).
In addition, none of the ethnic minorities (including ethnic Armenians) are represented in the CEC despite
the fact that 16.24% of the population of Georgia (2002 census) are ethnic minorities.
22 | P a g e
Chapter 4: Electoral behavior of ethnic Armenian
4.1 Socio‐Demographic Characteristics
4.1.1 Municipalities covered; Gender and Age composition of Respondents
Based on the methodology and priority the study to be representative highest share of respondents were
from Akhalkalaki and Ninotsminda – two municipalities with the highest number of ethnic Armenians. Then
comes Akhaltsikhe followed by Tsalka, Borjomi and Aspindza.
From the gender perspective the representation of survey
respondents was quite balanced. Out of 341 respondents
169 were female and 171 male. Only 1 respondent did not
disclose the information about gender (see chart 7). Chart
8 shows the share of men and women among the
respondents of the targeted municipalities. While in
Akhalkalaki, Akhaltsikhe and Borjomi men are in majority ‐
51%, 50.9% and 66.7% respectively, in Tsalka,
Ninotsminda and Aspindza the number of female
respondents exceeds the number of men, representing
53.6%, 51%, 66. 7%
Yet another variable for
selection of respondents
was the age. For the
purpose of the study
and the analysis of
electoral behaviors, four
age groups were taken
into consideration
defining generations
relevant to socio‐
historical developments
of the target region.
Share of respondents falling within these age
groups is presented in the chart 9.
Perspective of the age‐groups proved to be very
important in some aspects of the electoral
behavior. This has been further ascertained during
the focus group discussions. The composition of the
sample follows to the data of the census 2002 of
ethnic Armenians from the target region.
Unfortunately relatively old data of census 2002 is
used as detailed from 2014 census is not yet
available.
171, 50.3%
169, 49.7%
Male
Female
21.2%
40.9%
28.2%
9.7%
18‐27
28‐44
45‐60
60+
46.4% 49%
66.7%
33.3%
50.9% 51%
53.6% 51%
33.3%
66.7%
49.1% 49%
0%
10%
20%
30%
40%
50%
60%
70%
80%
90%
100%
Tsalka Ninotsminda Borjomi Aspindza Akhaltsikhe Akhalkalaki
Male Female
Chart 7: Gender Composition of Respondents
Chart 8: Gender composition of respondents in municipality perspective
Chart 9: Age Groups of Respondents

23 | P a g e
4.1.2 Share of Urban/Rural Respondents
The research primarily targeted rural population of ethnic Armenians as much as out of the six municipalities
only three (Akhalkalaki, Ninotsminda and Akhaltsikhe) have sizeable number of ethnic Armenians in urban
areas, while the other three have just none/insignificant number of Armenians, thus not important for our
study.
Overall, out of the 341 respondents 126 (37.5%) were from urban areas and 210 (62.5%) from rural. This
distribution matches with the composition of the target group.
The chart 10 reveals distribution rate of survey respondents according to the type of settlement in the
targeted municipalities. The numbers are quite evenly distributed in the case of Akhalkalaki ‐50.3% and
49.7% from city/villages respectively. In Ninotsminda 16.1% were from the urban area and 83.9 from
villages, while in Akhaltsikhe, 63.8% respondents were from the city and 36.2% from villages. The most
uneven distribution was in the case of Tsalka, Aspindza and Borjomi where 96.4%, 100%, 100% of
respondents respectively, were rural inhabitants, reflecting compact rural settlements of ethnic Armenians
in these municipalities.
Urban/Rural perspective of the study has proved to be very important in determining electoral behavior
reflecting the level of awareness of the democratic participation such as elections.
4.1.3 Education
As it has been mentioned, besides municipality, gender age and settlement type other variables have also
been controlled by the study, in some cases. Thefeore, these other socio‐demographic variables can also be
representative of the general situation in the target population.
Comparing to other ethnic minority groups of Georgia, Armenians have more educational experience. Out of
the total number of respondents 36.6% have held that they have high education. 23% of respondents
maintained that they have attended vocational education and 33.3% with complete secondary education.
3.6%
16.1%
0.0%
0.0%
63.8%
50.3%
96.4%
83.9%
100.0%
100.0%
36.2%
49.7%
0% 10% 20% 30% 40% 50% 60% 70% 80% 90% 100%
Tsalka
Ninotsminda
Borjomi
Aspindza
Akhaltsikhe
Akhalkalaki
Urban Rural
Chart 10: Share of Respondents in Settlement type perspective

24 | P a g e
Out of 341 only 18 (5.3%) were with incomplete secondary education and 6 (1.8%) were illiterate (see Chart
11).
The analysis showed an interesting correlation
between level of education and in the age
groups. Chart 12 reveals distribution rate of
the respondents according to age categories
and education level.
The highest share of respondents with
higher education degree (45.1%) falls in
the 18‐27 age group. No illiterate person
has been found here.
Almost the same educational patterns are
observed within both middle‐aged group
categories (28‐44 and 45‐60)
4.1.4 Knowledge of Languages
Knowledge of languages could have been one of the detrimental issues of electoral behavior as much as
perceived barriers of lack of knowledge of the state language can prevent ethnic Armenians from voting.
The respondents were asked to assess their skills in the knowledge of the 3 languages – Armenian, Georgian
and Russian. Additional line was also left for any other language, which in very few cases have been filled by
English or French. General tendencies of knowledge of languages of the respondents are presented in chart
13.
Armenian is predominantly (more than 86%) indicated as a language which respondents have “very
good” and “good” understanding and oral skills. None of respondents indicated “No Competence”
in understanding Armenian and only one did so in case of oral skills. .
1.8% 5.3%
33.3%
23.0%
36.6%
Illiterate
IncopmleteSecondary
Secondary
Vocational
High
Chart 11: Education
2.9%
2.1%
4.2%
2.9%
3.1%
24.2%
28.2%
35.5%
35.4%
30.3%
22.5%
25.4%
22.9%
15.2%
45.1%
33.3%
36.5%
30.3%
0% 10% 20% 30% 40% 50% 60% 70% 80% 90% 100%
18‐27
28‐44
45‐60
60 +
Illiterate Incomplete Secondary Secondary Vocational High
Chart 12: Education in the Age Perspective

25 | P a g e
Russian language remains first foreign language with relatively good skills in both understanding and
speaking.
Knowledge of Georgian as state
language still remains quite low.
Georgian had highest share of “No
Competence with 10% oral and 7.9%
understanding skills.
There is though a difference according
to age segments. 38.2% of respondents
aged 18‐27 indicated Georgian language
skills as “very good” or “good”. This is
highest compared to the other age‐
groups (see chart 14).
4.1.5 Type / Sector of employment
Type of employment or unemployment can
be a reasons for certain electoral behavior of
a person. Thus it was important include this
aspect of socio‐demographics character in the
questionnaire.
Out of the total number of 341 respondents 306 persons indicated their employment situation. As
presented in chart 16, the unemployment rate is 31.4% which is 11.1 % lower compared to the employment
rate (self‐employed and employed for wages) together.
The majority of self‐employed respondents (43.3 %) are employed in the family business. The second largest
sector of employment is education, with the respective percentage of 28.5%. Almost 10.3% of the
19.3%
16.8%
4.6%
5.8%
62.8%
59.1%
37.1%
25.8%
20.7%
15.8%
27.1%
27.7%
35.8%
43.5%
43.8%
34.8%
9.2%
11.3%
5.9%
11.0%
23.1%
33.5%
0.9%
1.5%
1.9%
2.9%
7.9%
10.0%
0.3%
0% 10% 20% 30% 40% 50% 60% 70% 80% 90% 100%
RUS Understanding
RUS Speaking
GEO Understanding
GEO Speaking
ARM Understanding
ARM Speaking
Very Good Good Satisfactory Bad Don't Have Competence
10.3%3.9% 3.6%
10.7%
27.9%
11.6% 11.9%
17.9%
27.9%
38.0% 39.3%
25.0%
23.5%
36.4% 35.7% 35.7%
10.3% 10.1% 9.5% 10.7%
0%
10%
20%
30%
40%
50%
60%
70%
80%
90%
100%
18‐27 28‐44 45‐60 60 +
Excellent Good Satisfactory bad Do Not speak
Chart 13: Knowledge of Languages
Chart 14: Knowledge of Georgian language ‐ Age groups
26 | P a g e
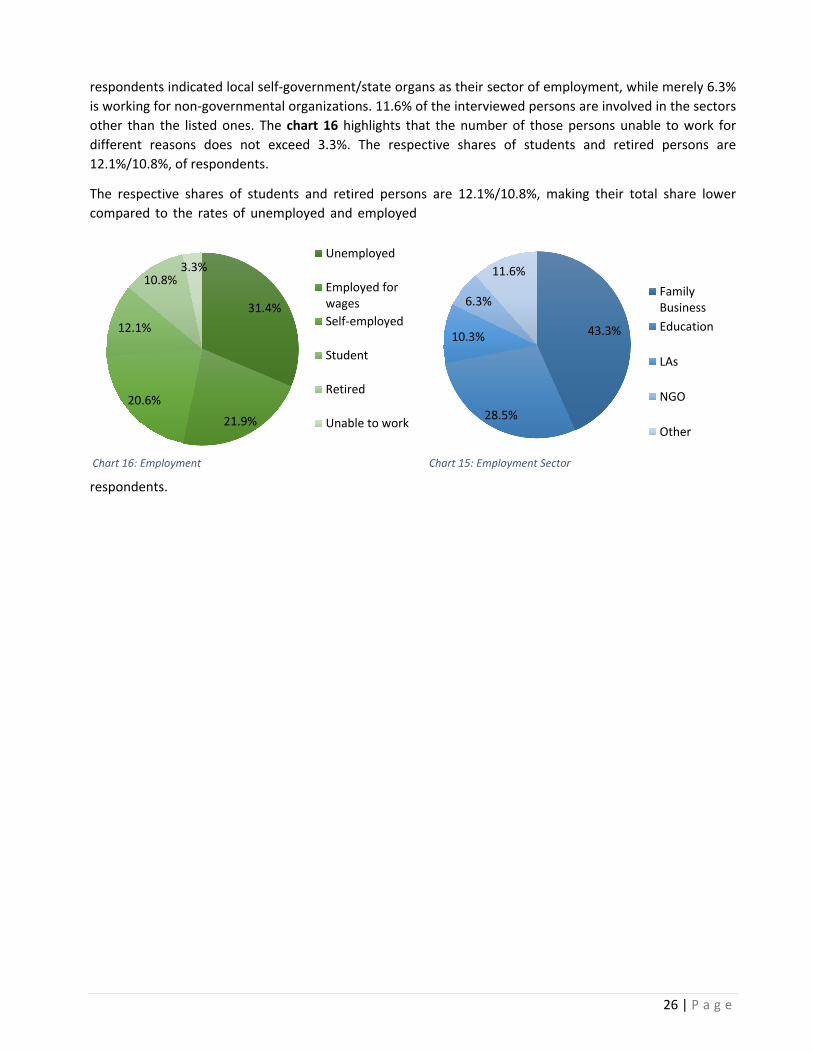
respondents indicated local self‐government/state organs as their sector of employment, while merely 6.3%
is working for non‐governmental organizations. 11.6% of the interviewed persons are involved in the sectors
other than the listed ones. The chart 16 highlights that the number of those persons unable to work for
different reasons does not exceed 3.3%. The respective shares of students and retired persons are
12.1%/10.8%, of respondents.
The respective shares of students and retired persons are 12.1%/10.8%, making their total share lower
compared to the rates of unemployed and employed
respondents.
31.4%
21.9%
20.6%
12.1%
10.8%3.3%
Unemployed
Employed forwages
Self‐employed
Student
Retired
Unable to work
43.3%
28.5%
10.3%
6.3%
11.6%
FamilyBusiness
Education
LAs
NGO
Other
Chart 16: Employment Chart 15: Employment Sector
27 | P a g e
4.2 General Attitudes towards Elections
4.2.1 Importance of voting, participation and reasons
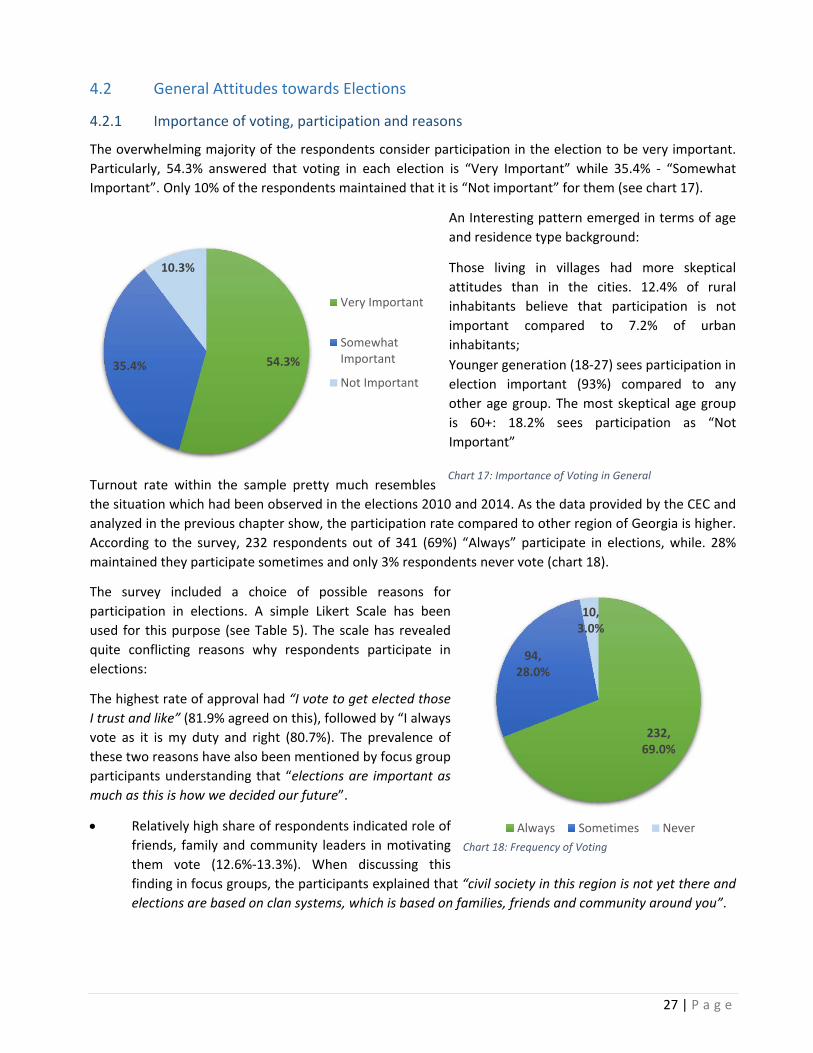
The overwhelming majority of the respondents consider participation in the election to be very important.
Particularly, 54.3% answered that voting in each election is “Very Important” while 35.4% ‐ “Somewhat
Important”. Only 10% of the respondents maintained that it is “Not important” for them (see chart 17).
An Interesting pattern emerged in terms of age
and residence type background:
Those living in villages had more skeptical
attitudes than in the cities. 12.4% of rural
inhabitants believe that participation is not
important compared to 7.2% of urban
inhabitants;
Younger generation (18‐27) sees participation in
election important (93%) compared to any
other age group. The most skeptical age group
is 60+: 18.2% sees participation as “Not
Important”
Turnout rate within the sample pretty much resembles
the situation which had been observed in the elections 2010 and 2014. As the data provided by the CEC and
analyzed in the previous chapter show, the participation rate compared to other region of Georgia is higher.
According to the survey, 232 respondents out of 341 (69%) “Always” participate in elections, while. 28%
maintained they participate sometimes and only 3% respondents never vote (chart 18).
The survey included a choice of possible reasons for
participation in elections. A simple Likert Scale has been
used for this purpose (see Table 5). The scale has revealed
quite conflicting reasons why respondents participate in
elections:
The highest rate of approval had “I vote to get elected those
I trust and like” (81.9% agreed on this), followed by “I always
vote as it is my duty and right (80.7%). The prevalence of
these two reasons have also been mentioned by focus group
participants understanding that “elections are important as
much as this is how we decided our future”.
Relatively high share of respondents indicated role of
friends, family and community leaders in motivating
them vote (12.6%‐13.3%). When discussing this
finding in focus groups, the participants explained that “civil society in this region is not yet there and
elections are based on clan systems, which is based on families, friends and community around you”.
54.3%35.4%
10.3%
Very Important
SomewhatImportant
Not Important
232, 69.0%
94, 28.0%
10, 3.0%
Always Sometimes Never
Chart 17: Importance of Voting in General
Chart 18: Frequency of Voting

28 | P a g e
Another reason pointed out by focus group participants was that one’s participation is “preventing
someone from stealing one’s vote. Even if you do not have someone you want to vote for, you have to
go and cross all, and so that you make sure your ballot will not be used by someone else”
# Statement Fully
Agree
Somewhat
Agree
Not
Agree
No
Answ
er
1 I always vote as it is my duty and right 80.7% 13.0% 1.5% 4.8%
2 I vote to get elected those I trust and like 81.9% 13.6% 1.9% 2.6%
3 I vote because my friend or family tell me so 13.3% 12.0% 68.7% 6%
4 I vote because local community leaders ask me so 12.6% 8.7% 72.3% 6.3%
5 I vote because local political party/political
representatives force me 2.9% 8.2% 85.3% 3.7%
6 I vote because I get financial benefit out of it 2.0% 5.7% 88.6% 3.7%
7 I vote because I simply want to change the ruling
political party/politician 17.1%
16.3%
56.3%
10.2%
Table 5: Factors Motivating to Participate in Elections
Although the share of respondents who do not vote is rather low, they were given several options to
indicate why they or people around them do not participate in the elections (see table 6).
The most common reasons for not voting was absence of a political party/political figure who would best fit
into their interests (agree in total 41.5%).
Another reason for not voting was connected to political subjects of electoral process. 35.8% deemed that
they do not trust local politicians and thus no point in voting. This factor has also been raised by focus group
participants (both in Ninotsminda and Akhalkalaki). “Politicians always come us just when they need votes.
Otherwise, they do not care about us”.
A general pessimistic attitude, that participation in elections does not change anything was also observed
both in quantitative and qualitative research. Focus group participants have expressed that “my single vote
will not affect to overall result of the elections, so no point in voting”
Non‐participation related to technical problems of access to polling stations or lack of knowledge of
Georgian language had the lowest score. This indicates that CEC had been quite successful in addressing the
(legal and formal) obstacles preventing ethnic Armenians in election participation. However, concerns have
been raised by focus group participants regarding effectiveness of election administration, described in
details in Chapter 4.4.
Relatively high number of respondents indicated that they do not participate as they do not care about
politics in Georgia. In focus group discussions few participants explained that politics in Armenia or
“elsewhere” are more interesting for some inhabitants of the region.
29 | P a g e
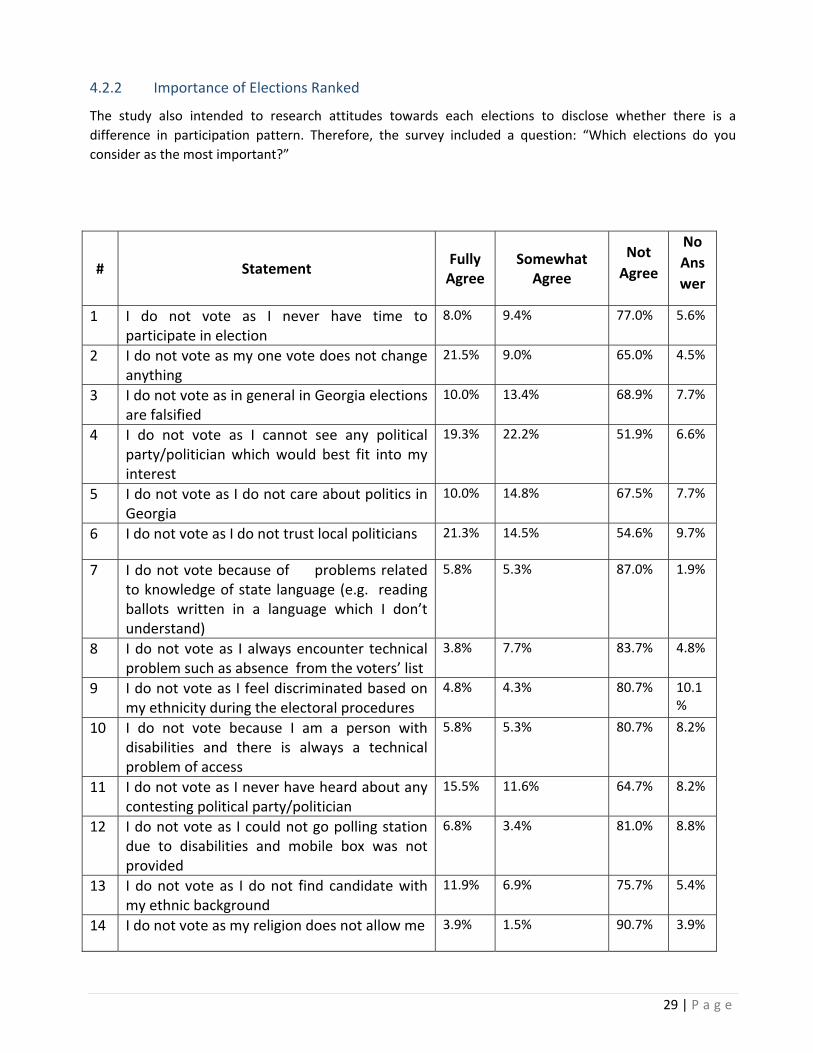
4.2.2 Importance of Elections Ranked
The study also intended to research attitudes towards each elections to disclose whether there is a
difference in participation pattern. Therefore, the survey included a question: “Which elections do you
consider as the most important?”
# Statement Fully Agree
Somewhat Agree
Not
Agree
No
Ans
wer
1 I do not vote as I never have time to participate in election
8.0% 9.4%
77.0%
5.6%
2 I do not vote as my one vote does not change anything
21.5%
9.0%
65.0%
4.5%
3 I do not vote as in general in Georgia elections are falsified
10.0%
13.4%
68.9%
7.7%
4 I do not vote as I cannot see any political party/politician which would best fit into my interest
19.3%
22.2%
51.9%
6.6%
5 I do not vote as I do not care about politics in Georgia
10.0%
14.8%
67.5%
7.7%
6 I do not vote as I do not trust local politicians 21.3%
14.5%
54.6%
9.7%
7 I do not vote because of problems related to knowledge of state language (e.g. reading ballots written in a language which I don’t understand)
5.8%
5.3% 87.0%
1.9%
8 I do not vote as I always encounter technical problem such as absence from the voters’ list
3.8%
7.7%
83.7%
4.8%
9 I do not vote as I feel discriminated based on my ethnicity during the electoral procedures
4.8%
4.3%
80.7%
10.1%
10 I do not vote because I am a person with disabilities and there is always a technical problem of access
5.8%
5.3%
80.7%
8.2%
11 I do not vote as I never have heard about any contesting political party/politician
15.5%
11.6%
64.7%
8.2%
12 I do not vote as I could not go polling station due to disabilities and mobile box was not provided
6.8%
3.4%
81.0%
8.8%
13 I do not vote as I do not find candidate with my ethnic background
11.9%
6.9%
75.7%
5.4%
14 I do not vote as my religion does not allow me 3.9%
1.5%
90.7%
3.9%
30 | P a g e
29.0%
35.9%
35.1%
Parliamentary Presidential Local self‐Government
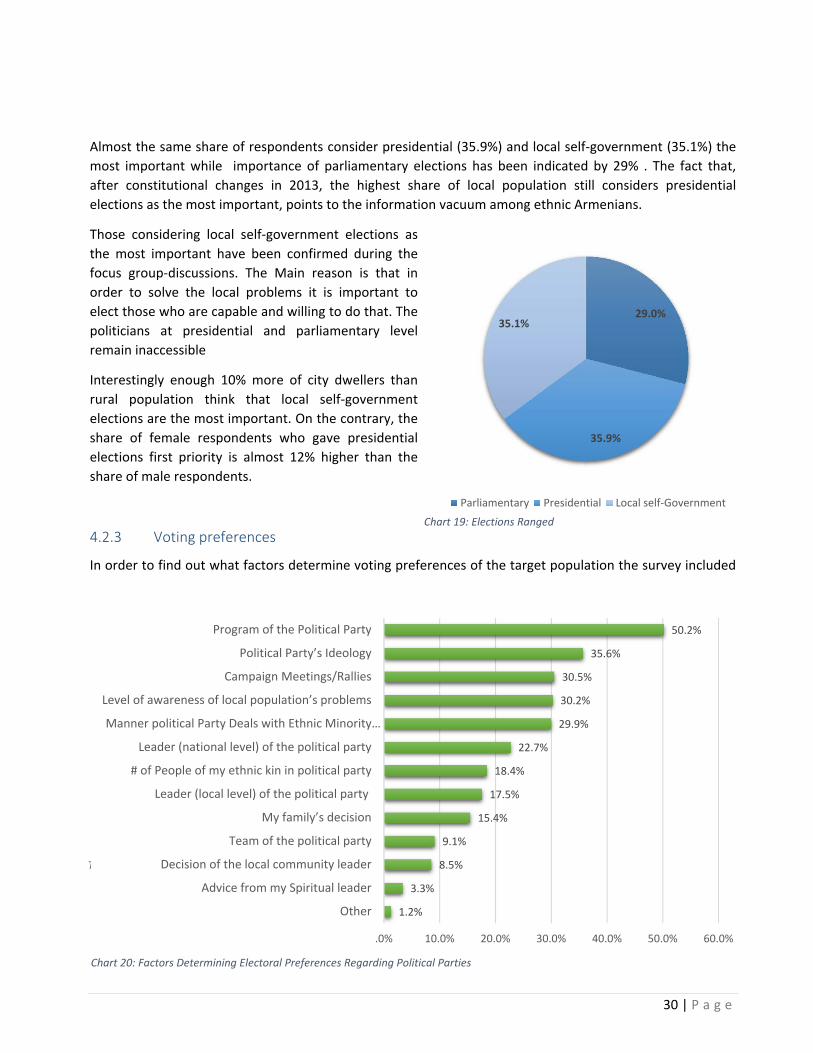
Almost the same share of respondents consider presidential (35.9%) and local self‐government (35.1%) the
most important while importance of parliamentary elections has been indicated by 29% . The fact that,
after constitutional changes in 2013, the highest share of local population still considers presidential
elections as the most important, points to the information vacuum among ethnic Armenians.
Those considering local self‐government elections as
the most important have been confirmed during the
focus group‐discussions. The Main reason is that in
order to solve the local problems it is important to
elect those who are capable and willing to do that. The
politicians at presidential and parliamentary level
remain inaccessible
Interestingly enough 10% more of city dwellers than
rural population think that local self‐government
elections are the most important. On the contrary, the
share of female respondents who gave presidential
elections first priority is almost 12% higher than the
share of male respondents.
4.2.3 Voting preferences
In order to find out what factors determine voting preferences of the target population the survey included
Table 6: Factors which motivate NOT to Participate
1.2%
3.3%
8.5%
9.1%
15.4%
17.5%
18.4%
22.7%
29.9%
30.2%
30.5%
35.6%
50.2%
.0% 10.0% 20.0% 30.0% 40.0% 50.0% 60.0%
Other
Advice from my Spiritual leader
Decision of the local community leader
Team of the political party
My family’s decision
Leader (local level) of the political party
# of People of my ethnic kin in political party
Leader (national level) of the political party
Manner political Party Deals with Ethnic Minority…
Level of awareness of local population’s problems
Campaign Meetings/Rallies
Political Party’s Ideology
Program of the Political Party
Chart 19: Elections Ranged
Chart 20: Factors Determining Electoral Preferences Regarding Political Parties
31 | P a g e
semi‐open questions with multiple choice responses as well as an option for additional indications.
The first question aimed at identifying factors which motivate the population to vote for a political party.
The results are presented in chart 20.
Over half of the respondents maintained that program of the political party is one of the factors
they consider when voting. This is followed by “Political Party’s Ideology”. Although these results
seem to be quite rational, focus group discussions showed that actually the reality is a more
controversial. Participants who have also selected both “program” and “ideology” as their factors
then have been asked by facilitator if they could name some points of the program or ideology of
party they voted for in last elections. Most of them were not able to list one. This brings us to
conclusion that high share of program and ideology in the survey is a result of influence of
commonly accepted norm of voting behavior based on program and ideology.
Besides these, three almost same frequently named factors of voting, named also during focus
groups, were:
1. Campaign meetings and rallies of this political party as much as direct contact with the
population creates confidence;
2. Level of Awareness of the local problems – this again gives advantages to the party as they will
more likely work on this issues than others;
3. How political party deals with ethnic minority problems
Yet another factor raised by focus group participants was local leader/representative of the political
party in the region. Issue of reputation of local representative plays vital role here. “If I know a
person who is respected in our community and who is supported by most, I will also vote for his
political party without hesitation”
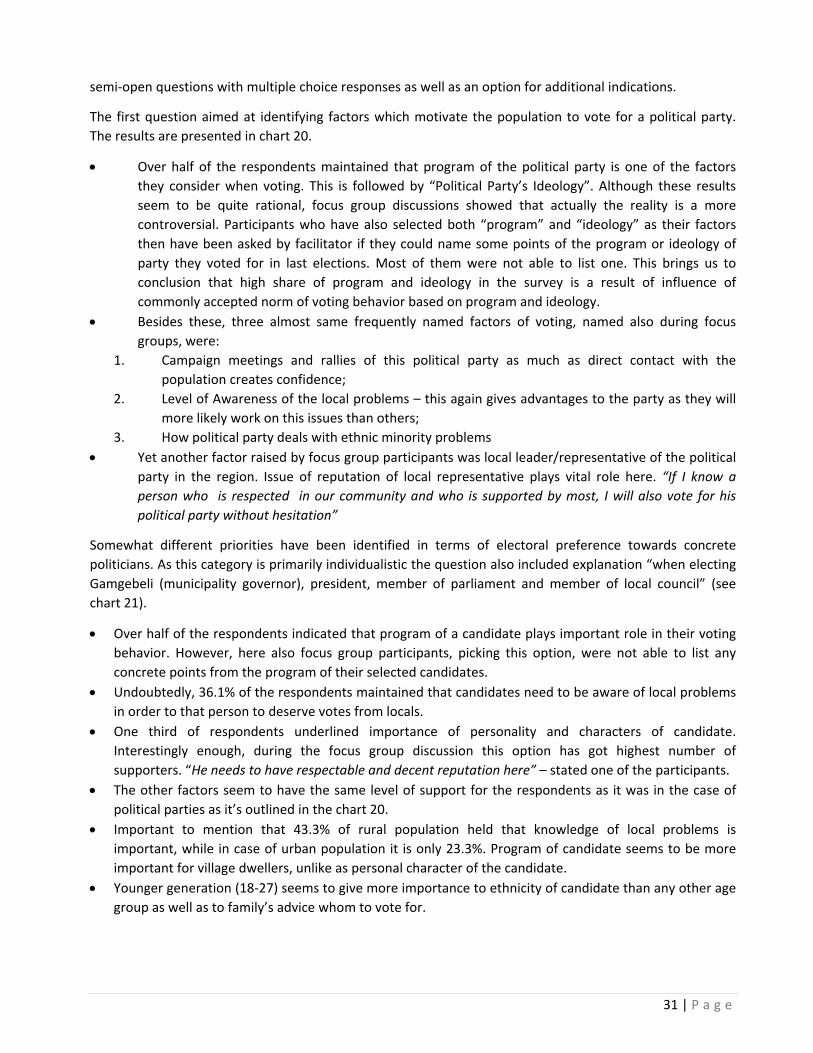
Somewhat different priorities have been identified in terms of electoral preference towards concrete
politicians. As this category is primarily individualistic the question also included explanation “when electing
Gamgebeli (municipality governor), president, member of parliament and member of local council” (see
chart 21).
Over half of the respondents indicated that program of a candidate plays important role in their voting
behavior. However, here also focus group participants, picking this option, were not able to list any
concrete points from the program of their selected candidates.
Undoubtedly, 36.1% of the respondents maintained that candidates need to be aware of local problems
in order to that person to deserve votes from locals.
One third of respondents underlined importance of personality and characters of candidate.
Interestingly enough, during the focus group discussion this option has got highest number of
supporters. “He needs to have respectable and decent reputation here” – stated one of the participants.
The other factors seem to have the same level of support for the respondents as it was in the case of
political parties as it’s outlined in the chart 20.
Important to mention that 43.3% of rural population held that knowledge of local problems is
important, while in case of urban population it is only 23.3%. Program of candidate seems to be more
important for village dwellers, unlike as personal character of the candidate.
Younger generation (18‐27) seems to give more importance to ethnicity of candidate than any other age
group as well as to family’s advice whom to vote for.
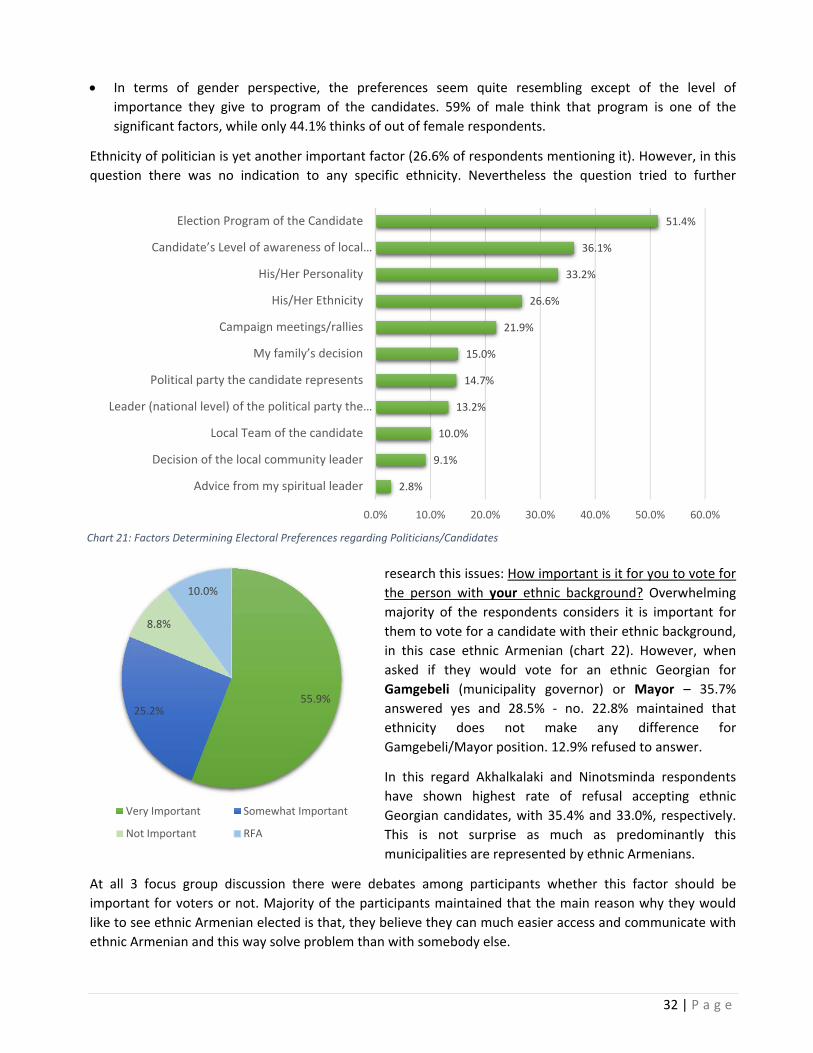
32 | P a g e
In terms of gender perspective, the preferences seem quite resembling except of the level of
importance they give to program of the candidates. 59% of male think that program is one of the
significant factors, while only 44.1% thinks of out of female respondents.
Ethnicity of politician is yet another important factor (26.6% of respondents mentioning it). However, in this
question there was no indication to any specific ethnicity. Nevertheless the question tried to further
research this issues: How important is it for you to vote for
the person with your ethnic background? Overwhelming
majority of the respondents considers it is important for
them to vote for a candidate with their ethnic background,
in this case ethnic Armenian (chart 22). However, when
asked if they would vote for an ethnic Georgian for
Gamgebeli (municipality governor) or Mayor – 35.7%
answered yes and 28.5% ‐ no. 22.8% maintained that
ethnicity does not make any difference for
Gamgebeli/Mayor position. 12.9% refused to answer.
In this regard Akhalkalaki and Ninotsminda respondents
have shown highest rate of refusal accepting ethnic
Georgian candidates, with 35.4% and 33.0%, respectively.
This is not surprise as much as predominantly this
municipalities are represented by ethnic Armenians.
At all 3 focus group discussion there were debates among participants whether this factor should be
important for voters or not. Majority of the participants maintained that the main reason why they would
like to see ethnic Armenian elected is that, they believe they can much easier access and communicate with
ethnic Armenian and this way solve problem than with somebody else.
2.8%
9.1%
10.0%
13.2%
14.7%
15.0%
21.9%
26.6%
33.2%
36.1%
51.4%
0.0% 10.0% 20.0% 30.0% 40.0% 50.0% 60.0%
Advice from my spiritual leader
Decision of the local community leader
Local Team of the candidate
Leader (national level) of the political party the…
Political party the candidate represents
My family’s decision
Campaign meetings/rallies
His/Her Ethnicity
His/Her Personality
Candidate’s Level of awareness of local …
Election Program of the Candidate
55.9%25.2%
8.8%
10.0%
Very Important Somewhat Important
Not Important RFA
Chart 21: Factors Determining Electoral Preferences regarding Politicians/Candidates
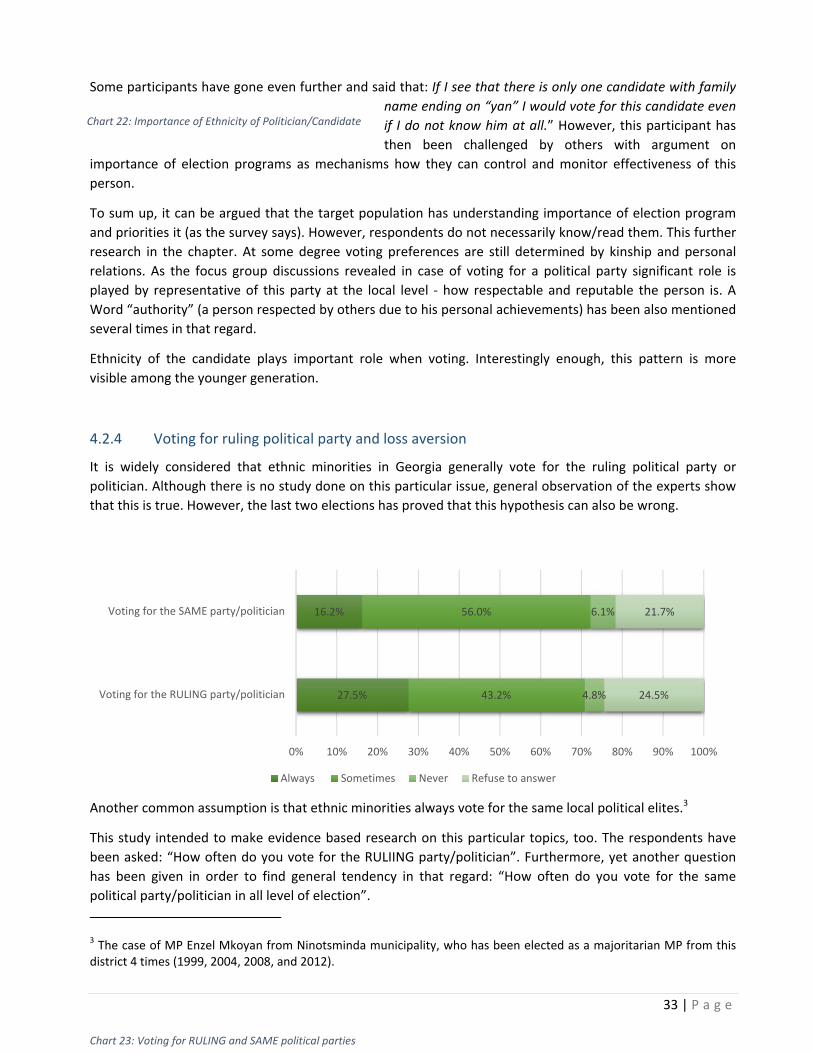
33 | P a g e
Some participants have gone even further and said that: If I see that there is only one candidate with family
name ending on “yan” I would vote for this candidate even
if I do not know him at all.” However, this participant has
then been challenged by others with argument on
importance of election programs as mechanisms how they can control and monitor effectiveness of this
person.
To sum up, it can be argued that the target population has understanding importance of election program
and priorities it (as the survey says). However, respondents do not necessarily know/read them. This further
research in the chapter. At some degree voting preferences are still determined by kinship and personal
relations. As the focus group discussions revealed in case of voting for a political party significant role is
played by representative of this party at the local level ‐ how respectable and reputable the person is. A
Word “authority” (a person respected by others due to his personal achievements) has been also mentioned
several times in that regard.
Ethnicity of the candidate plays important role when voting. Interestingly enough, this pattern is more
visible among the younger generation.
4.2.4 Voting for ruling political party and loss aversion
It is widely considered that ethnic minorities in Georgia generally vote for the ruling political party or
politician. Although there is no study done on this particular issue, general observation of the experts show
that this is true. However, the last two elections has proved that this hypothesis can also be wrong.
Another common assumption is that ethnic minorities always vote for the same local political elites.3
This study intended to make evidence based research on this particular topics, too. The respondents have
been asked: “How often do you vote for the RULIING party/politician”. Furthermore, yet another question
has been given in order to find general tendency in that regard: “How often do you vote for the same
political party/politician in all level of election”.
3 The case of MP Enzel Mkoyan from Ninotsminda municipality, who has been elected as a majoritarian MP from this district 4 times (1999, 2004, 2008, and 2012).
27.5%
16.2%
43.2%
56.0%
4.8%
6.1%
24.5%
21.7%
0% 10% 20% 30% 40% 50% 60% 70% 80% 90% 100%
Voting for the RULING party/politician
Voting for the SAME party/politician
Always Sometimes Never Refuse to answer
Chart 22: Importance of Ethnicity of Politician/Candidate
Chart 23: Voting for RULING and SAME political parties
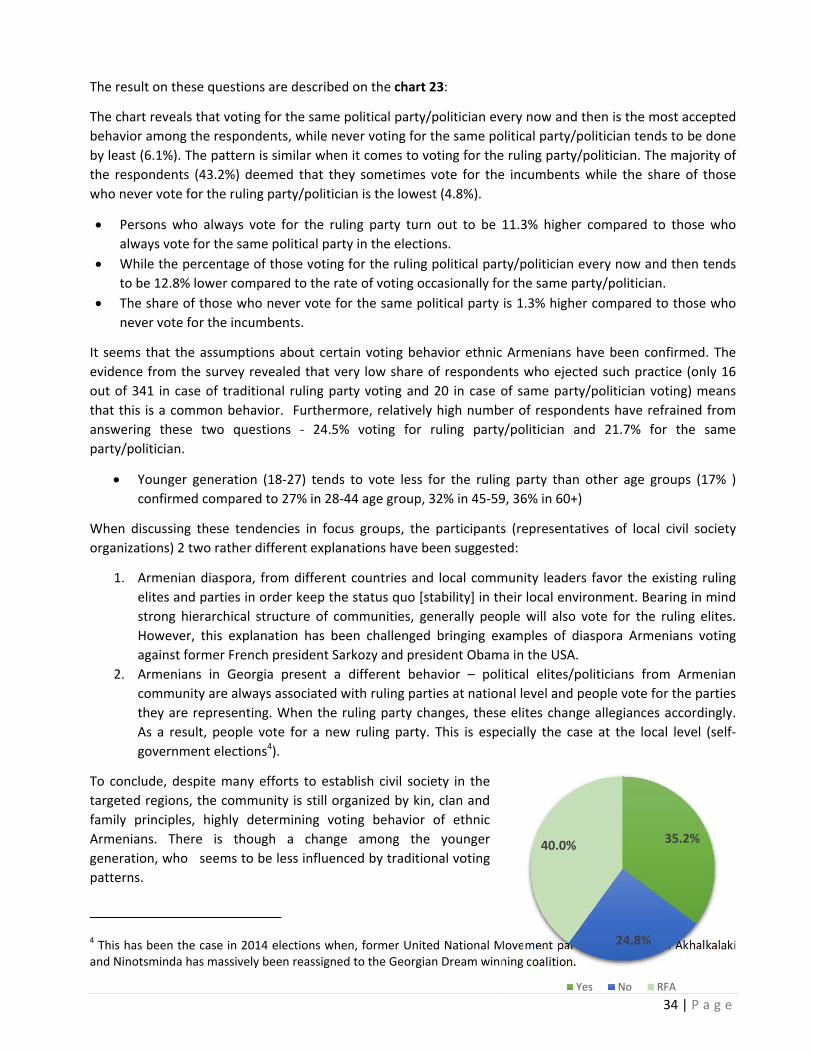
34 | P a g e
The result on these questions are described on the chart 23:
The chart reveals that voting for the same political party/politician every now and then is the most accepted
behavior among the respondents, while never voting for the same political party/politician tends to be done
by least (6.1%). The pattern is similar when it comes to voting for the ruling party/politician. The majority of
the respondents (43.2%) deemed that they sometimes vote for the incumbents while the share of those
who never vote for the ruling party/politician is the lowest (4.8%).
Persons who always vote for the ruling party turn out to be 11.3% higher compared to those who
always vote for the same political party in the elections.
While the percentage of those voting for the ruling political party/politician every now and then tends
to be 12.8% lower compared to the rate of voting occasionally for the same party/politician.
The share of those who never vote for the same political party is 1.3% higher compared to those who
never vote for the incumbents.
It seems that the assumptions about certain voting behavior ethnic Armenians have been confirmed. The
evidence from the survey revealed that very low share of respondents who ejected such practice (only 16
out of 341 in case of traditional ruling party voting and 20 in case of same party/politician voting) means
that this is a common behavior. Furthermore, relatively high number of respondents have refrained from
answering these two questions ‐ 24.5% voting for ruling party/politician and 21.7% for the same
party/politician.
Younger generation (18‐27) tends to vote less for the ruling party than other age groups (17% )
confirmed compared to 27% in 28‐44 age group, 32% in 45‐59, 36% in 60+)
When discussing these tendencies in focus groups, the participants (representatives of local civil society
organizations) 2 two rather different explanations have been suggested:
1. Armenian diaspora, from different countries and local community leaders favor the existing ruling
elites and parties in order keep the status quo [stability] in their local environment. Bearing in mind
strong hierarchical structure of communities, generally people will also vote for the ruling elites.
However, this explanation has been challenged bringing examples of diaspora Armenians voting
against former French president Sarkozy and president Obama in the USA.
2. Armenians in Georgia present a different behavior – political elites/politicians from Armenian
community are always associated with ruling parties at national level and people vote for the parties
they are representing. When the ruling party changes, these elites change allegiances accordingly.
As a result, people vote for a new ruling party. This is especially the case at the local level (self‐
government elections4).
To conclude, despite many efforts to establish civil society in the
targeted regions, the community is still organized by kin, clan and
family principles, highly determining voting behavior of ethnic
Armenians. There is though a change among the younger
generation, who seems to be less influenced by traditional voting
patterns.
4 This has been the case in 2014 elections when, former United National Movement party members from Akhalkalaki and Ninotsminda has massively been reassigned to the Georgian Dream winning coalition.
35.2%
24.8%
40.0%
Yes No RFA
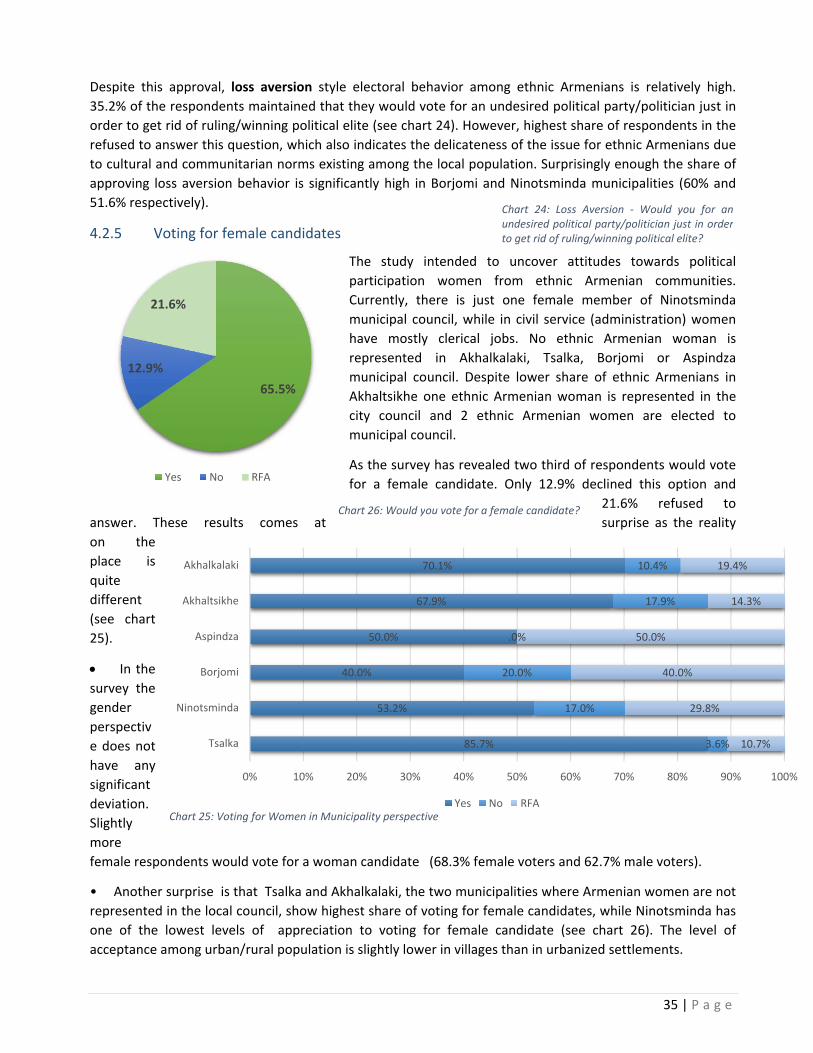
35 | P a g e
Despite this approval, loss aversion style electoral behavior among ethnic Armenians is relatively high.
35.2% of the respondents maintained that they would vote for an undesired political party/politician just in
order to get rid of ruling/winning political elite (see chart 24). However, highest share of respondents in the
refused to answer this question, which also indicates the delicateness of the issue for ethnic Armenians due
to cultural and communitarian norms existing among the local population. Surprisingly enough the share of
approving loss aversion behavior is significantly high in Borjomi and Ninotsminda municipalities (60% and
51.6% respectively).
4.2.5 Voting for female candidates
The study intended to uncover attitudes towards political
participation women from ethnic Armenian communities.
Currently, there is just one female member of Ninotsminda
municipal council, while in civil service (administration) women
have mostly clerical jobs. No ethnic Armenian woman is
represented in Akhalkalaki, Tsalka, Borjomi or Aspindza
municipal council. Despite lower share of ethnic Armenians in
Akhaltsikhe one ethnic Armenian woman is represented in the
city council and 2 ethnic Armenian women are elected to
municipal council.
As the survey has revealed two third of respondents would vote
for a female candidate. Only 12.9% declined this option and
21.6% refused to
answer. These results comes at surprise as the reality
on the
place is
quite
different
(see chart
25).
In the
survey the
gender
perspectiv
e does not
have any
significant
deviation.
Slightly
more
female respondents would vote for a woman candidate (68.3% female voters and 62.7% male voters).
• Another surprise is that Tsalka and Akhalkalaki, the two municipalities where Armenian women are not
represented in the local council, show highest share of voting for female candidates, while Ninotsminda has
one of the lowest levels of appreciation to voting for female candidate (see chart 26). The level of
acceptance among urban/rural population is slightly lower in villages than in urbanized settlements.
65.5%
12.9%
21.6%
Yes No RFA
85.7%
53.2%
40.0%
50.0%
67.9%
70.1%
3.6%
17.0%
20.0%
.0%
17.9%
10.4%
10.7%
29.8%
40.0%
50.0%
14.3%
19.4%
0% 10% 20% 30% 40% 50% 60% 70% 80% 90% 100%
Tsalka
Ninotsminda
Borjomi
Aspindza
Akhaltsikhe
Akhalkalaki
Yes No RFA
Chart 24: Loss Aversion ‐ Would you for anundesired political party/politician just in orderto get rid of ruling/winning political elite?
Chart 26: Would you vote for a female candidate?
Chart 25: Voting for Women in Municipality perspective

36 | P a g e
The focus group participants have also expressed their positive attitudes to vote for female candidates in the
elections. However, some of them mentioned that “lady needs to have very decent reputation, so that she
can respectfully represent us”. This finding opens up new possibilities for women in the target region.
However, interviewing the local active women about possibilities for running in any future elections, most of
them expressed concerns about stressing and personalized character of the pre‐election campaigns and
political environment. “Furthermore, being a lady in the local politics means double pressure from the society
just because of your gender” maintained one of the CSO female representative.
4.3 Analysis of Local Self‐Government Elections 2014
4.3.1 Importance and Participation
As mentioned above, more than one third of the target population considers local self‐government
elections most important compared to presidential and parliamentary.
Overwhelming majority (72.4%) answered that participation was important. Only 9.2% of respondents
maintained that it was not important (see chart 27).
Akhalkalaki has the highest number of respondents (52.1%), who believe that showing up at the polling
stations during the day of local elections 2014 was very important, followed by Akhaltsikhe with 40.4%,
whereas the majority of the respondents in Borjomi, Ninotsminda and Tsalka, consider participation as
somewhat important. The share of persons who believe that participation was not important is
relatively small in all the six municipalities compared to those who responded the question in any other
way.
The data reveals that the share of women positive evaluation to the question is 9.6% less compared to
the share of men
The results highlight that more people in villages tend to consider participation as important, compared
to city dwellers, though the difference is merely 4.2%.
The results reveal that the number of persons who do not have any particular opinion concerning the
local elections is highest among young people (18 and 27).
Furthermore, young generation tend to care less about the local elections compared to the people of
other age groups, having the persons who
consider participation to be unimportant in
the majority.
Survey had found out that overwhelming majority
of the respondents participated in the local self‐
government elections 2014. 80.4% have positively
answered the question about participation and
14.1% ‐ negatively. 5.6% have refrained from
answering the question.
Those who have not participated in the elections
2014 have been asked to tick the factors which
prevented them from voting. This question
suggested 12 possible answers (see chart 28).
40.9%
31.5%
9.2%
18.4%
Very Important Somewhat Important
Not Important IDK
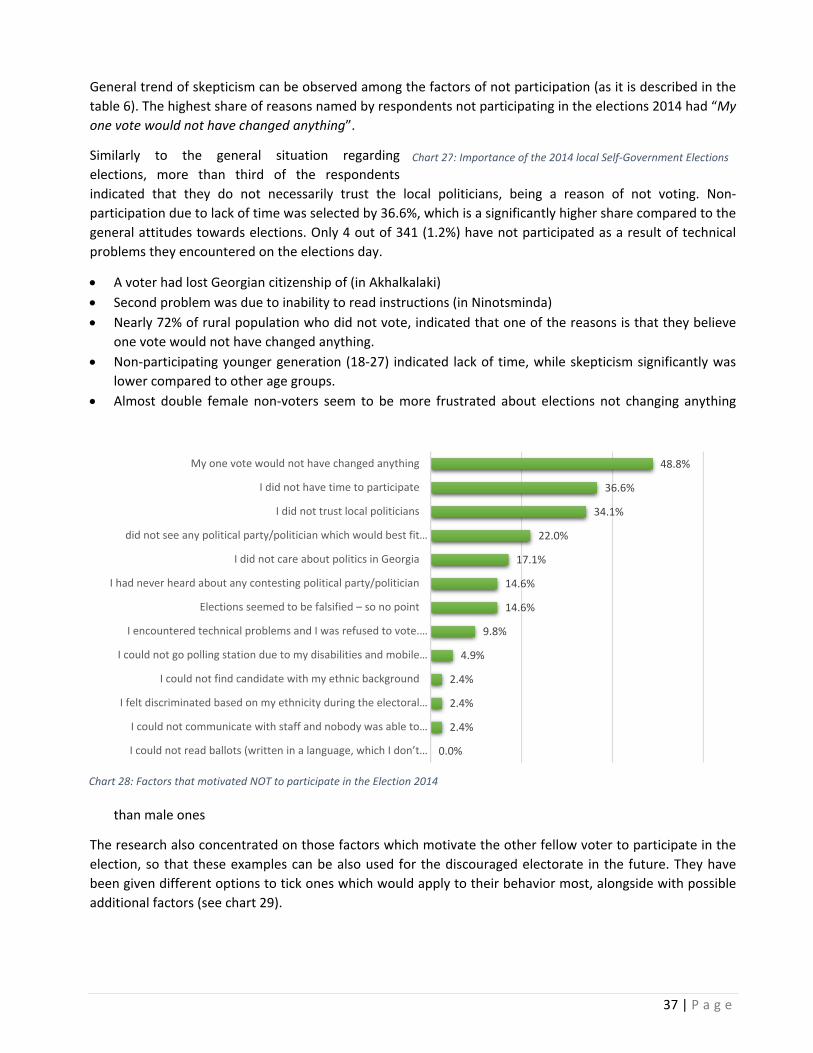
37 | P a g e
General trend of skepticism can be observed among the factors of not participation (as it is described in the
table 6). The highest share of reasons named by respondents not participating in the elections 2014 had “My
one vote would not have changed anything”.
Similarly to the general situation regarding
elections, more than third of the respondents
indicated that they do not necessarily trust the local politicians, being a reason of not voting. Non‐
participation due to lack of time was selected by 36.6%, which is a significantly higher share compared to the
general attitudes towards elections. Only 4 out of 341 (1.2%) have not participated as a result of technical
problems they encountered on the elections day.
A voter had lost Georgian citizenship of (in Akhalkalaki)
Second problem was due to inability to read instructions (in Ninotsminda)
Nearly 72% of rural population who did not vote, indicated that one of the reasons is that they believe
one vote would not have changed anything.
Non‐participating younger generation (18‐27) indicated lack of time, while skepticism significantly was
lower compared to other age groups.
Almost double female non‐voters seem to be more frustrated about elections not changing anything
than male ones
The research also concentrated on those factors which motivate the other fellow voter to participate in the
election, so that these examples can be also used for the discouraged electorate in the future. They have
been given different options to tick ones which would apply to their behavior most, alongside with possible
additional factors (see chart 29).
0.0%
2.4%
2.4%
2.4%
4.9%
9.8%
14.6%
14.6%
17.1%
22.0%
34.1%
36.6%
48.8%
0.0% 20.0% 40.0% 60.0%
I could not read ballots (written in a language, which I don’t …
I could not communicate with staff and nobody was able to…
I felt discriminated based on my ethnicity during the electoral…
I could not find candidate with my ethnic background
I could not go polling station due to my disabilities and mobile…
I encountered technical problems and I was refused to vote.…
Elections seemed to be falsified – so no point
I had never heard about any contesting political party/politician
I did not care about politics in Georgia
did not see any political party/politician which would best fit…
I did not trust local politicians
I did not have time to participate
My one vote would not have changed anything
Chart 27: Importance of the 2014 local Self‐Government Elections
Chart 28: Factors that motivated NOT to participate in the Election 2014
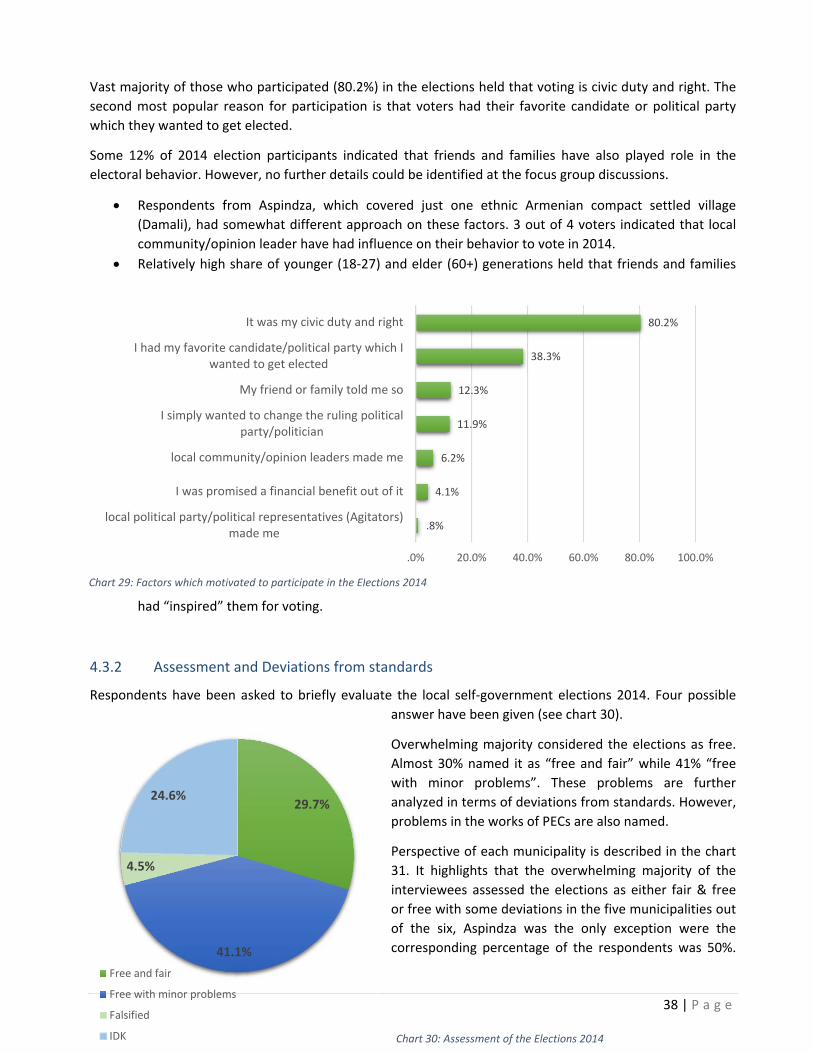
38 | P a g e
Vast majority of those who participated (80.2%) in the elections held that voting is civic duty and right. The
second most popular reason for participation is that voters had their favorite candidate or political party
which they wanted to get elected.
Some 12% of 2014 election participants indicated that friends and families have also played role in the
electoral behavior. However, no further details could be identified at the focus group discussions.
Respondents from Aspindza, which covered just one ethnic Armenian compact settled village
(Damali), had somewhat different approach on these factors. 3 out of 4 voters indicated that local
community/opinion leader have had influence on their behavior to vote in 2014.
Relatively high share of younger (18‐27) and elder (60+) generations held that friends and families
had “inspired” them for voting.
4.3.2 Assessment and Deviations from standards
Respondents have been asked to briefly evaluate the local self‐government elections 2014. Four possible
answer have been given (see chart 30).
Overwhelming majority considered the elections as free.
Almost 30% named it as “free and fair” while 41% “free
with minor problems”. These problems are further
analyzed in terms of deviations from standards. However,
problems in the works of PECs are also named.
Perspective of each municipality is described in the chart
31. It highlights that the overwhelming majority of the
interviewees assessed the elections as either fair & free
or free with some deviations in the five municipalities out
of the six, Aspindza was the only exception were the
corresponding percentage of the respondents was 50%.
.8%
4.1%
6.2%
11.9%
12.3%
38.3%
80.2%
.0% 20.0% 40.0% 60.0% 80.0% 100.0%
local political party/political representatives (Agitators)made me
I was promised a financial benefit out of it
local community/opinion leaders made me
I simply wanted to change the ruling politicalparty/politician
My friend or family told me so
I had my favorite candidate/political party which Iwanted to get elected
It was my civic duty and right
29.7%
41.1%
4.5%
24.6%
Free and fair
Free with minor problems
Falsified
IDK
Chart 29: Factors which motivated to participate in the Elections 2014
Chart 30: Assessment of the Elections 2014
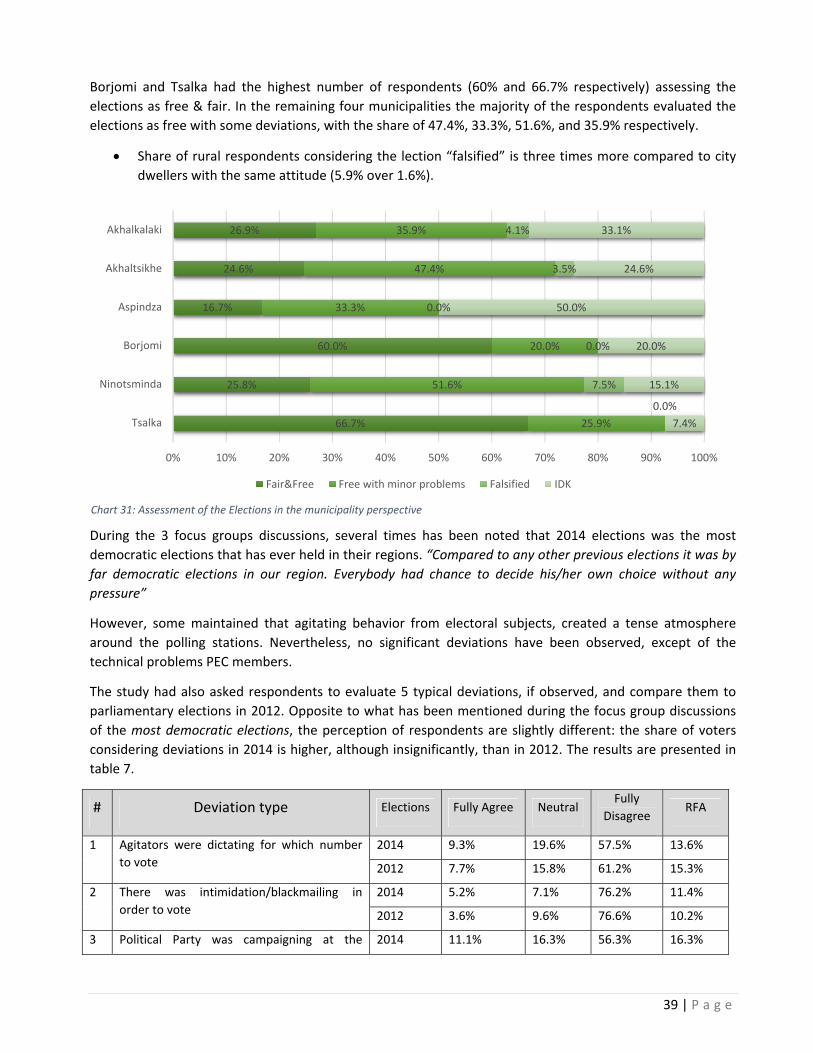
39 | P a g e
Borjomi and Tsalka had the highest number of respondents (60% and 66.7% respectively) assessing the
elections as free & fair. In the remaining four municipalities the majority of the respondents evaluated the
elections as free with some deviations, with the share of 47.4%, 33.3%, 51.6%, and 35.9% respectively.
Share of rural respondents considering the lection “falsified” is three times more compared to city
dwellers with the same attitude (5.9% over 1.6%).
During the 3 focus groups discussions, several times has been noted that 2014 elections was the most
democratic elections that has ever held in their regions. “Compared to any other previous elections it was by
far democratic elections in our region. Everybody had chance to decide his/her own choice without any
pressure”
However, some maintained that agitating behavior from electoral subjects, created a tense atmosphere
around the polling stations. Nevertheless, no significant deviations have been observed, except of the
technical problems PEC members.
The study had also asked respondents to evaluate 5 typical deviations, if observed, and compare them to
parliamentary elections in 2012. Opposite to what has been mentioned during the focus group discussions
of the most democratic elections, the perception of respondents are slightly different: the share of voters
considering deviations in 2014 is higher, although insignificantly, than in 2012. The results are presented in
table 7.
# Deviation type Elections Fully Agree Neutral Fully
Disagree RFA
1 Agitators were dictating for which number
to vote
2014 9.3% 19.6% 57.5% 13.6%
2012 7.7% 15.8% 61.2% 15.3%
2 There was intimidation/blackmailing in
order to vote
2014 5.2% 7.1% 76.2% 11.4%
2012 3.6% 9.6% 76.6% 10.2%
3 Political Party was campaigning at the 2014 11.1% 16.3% 56.3% 16.3%
66.7%
25.8%
60.0%
16.7%
24.6%
26.9%
25.9%
51.6%
20.0%
33.3%
47.4%
35.9%
0.0%
7.5%
0.0%
0.0%
3.5%
4.1%
7.4%
15.1%
20.0%
50.0%
24.6%
33.1%
0% 10% 20% 30% 40% 50% 60% 70% 80% 90% 100%
Tsalka
Ninotsminda
Borjomi
Aspindza
Akhaltsikhe
Akhalkalaki
Fair&Free Free with minor problems Falsified IDK
Chart 31: Assessment of the Elections in the municipality perspective
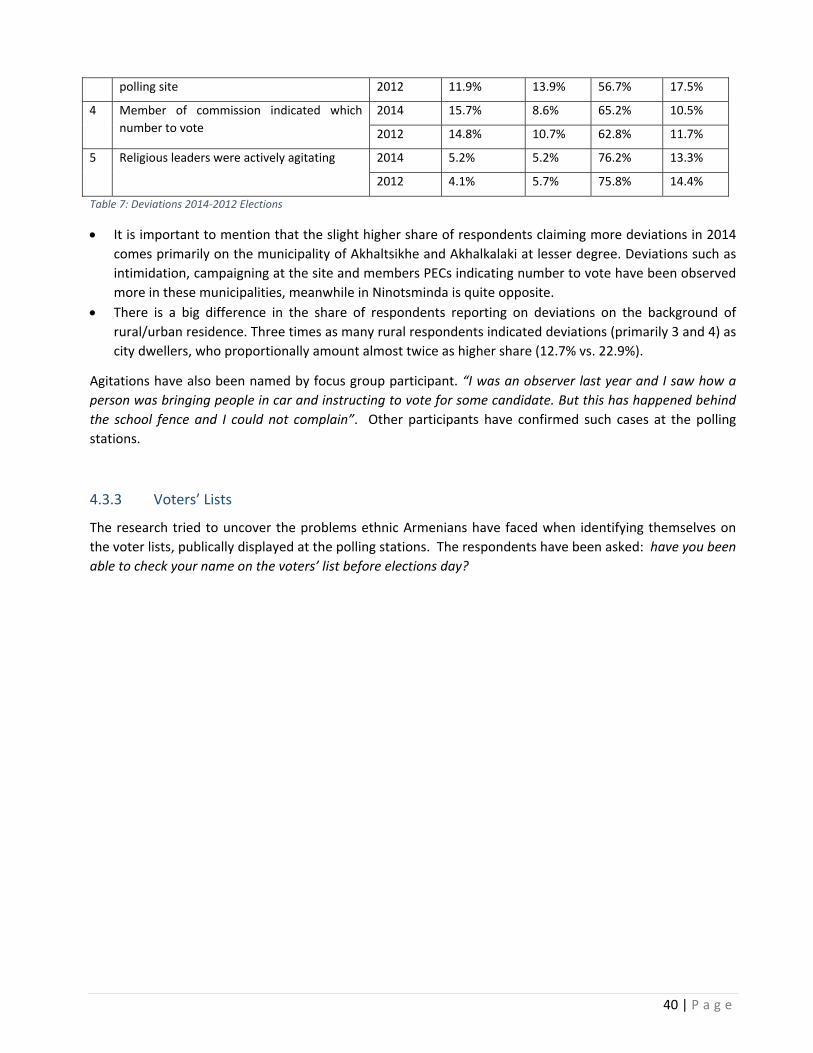
40 | P a g e
polling site 2012 11.9% 13.9% 56.7% 17.5%
4 Member of commission indicated which
number to vote
2014 15.7% 8.6% 65.2% 10.5%
2012 14.8% 10.7% 62.8% 11.7%
5
Religious leaders were actively agitating 2014 5.2% 5.2% 76.2% 13.3%
2012 4.1% 5.7% 75.8% 14.4%
Table 7: Deviations 2014‐2012 Elections
It is important to mention that the slight higher share of respondents claiming more deviations in 2014
comes primarily on the municipality of Akhaltsikhe and Akhalkalaki at lesser degree. Deviations such as
intimidation, campaigning at the site and members PECs indicating number to vote have been observed
more in these municipalities, meanwhile in Ninotsminda is quite opposite.
There is a big difference in the share of respondents reporting on deviations on the background of
rural/urban residence. Three times as many rural respondents indicated deviations (primarily 3 and 4) as
city dwellers, who proportionally amount almost twice as higher share (12.7% vs. 22.9%).
Agitations have also been named by focus group participant. “I was an observer last year and I saw how a
person was bringing people in car and instructing to vote for some candidate. But this has happened behind
the school fence and I could not complain”. Other participants have confirmed such cases at the polling
stations.
4.3.3 Voters’ Lists
The research tried to uncover the problems ethnic Armenians have faced when identifying themselves on
the voter lists, publically displayed at the polling stations. The respondents have been asked: have you been
able to check your name on the voters’ list before elections day?

41 | P a g e
Chart 32: Access to the Voters' List
The chart 32 highlights whether the participants had the opportunity to check their names in the voters list
in the targeted municipalities. The majority of the interviewees in all the municipalities, but Aspindza,
admitted that they verified their names either online or at the polling stations. The total number of those
who encountered certain language or technical problems while checking the list is relatively small. In
Borjomi, Aspindza and Tsalka no such incidents took place, while in Akhaltsikhe 7.3%, in Ninotsminda 8.4%
and in Akhalkalaki 5.6% complained about technical/ language problems while checking their names on the
list.
The answers reveal that the majority of persons in all the age categories checked their names at the
polling stations
4.3.4 Access to and level of Information about Political Subjects
Important aspects of electoral behavior is how informed and conscious decisions the voters make at the
polling stations. Therefore, the survey asked the following question: Did you know about all
18.5%
36.8%
0.0%
0.0%
20.0%
29.4%
70.4%
46.3%
100.0%
50.0%
60.0%
29.7%
0.0%
6.3%
0.0%
0.0%
5.5%
1.4%
0.0%
2.1%
0.0%
0.0%
1.8%
4.2%
11.1%
8.4%
0.0%
50.0%
12.7%
15.4%
0% 10% 20% 30% 40% 50% 60% 70% 80% 90% 100%
Tsalka
Ninotsminda
Borjomi
Aspindza
Akhaltsikhe
Akhalkalaki
Yes, I checked online
Yes, I went to the polling station
No, I went to the polling station but the voters' list was in georgian and could not check
No, I went to the polling station and encountered some other technical problem
No, I have not tried
15.3%
8.2%
27.6%
41.5%
40.2%
26.3%
16.9%
24.1%
0% 10% 20% 30% 40% 50% 60% 70% 80% 90% 100%
Politicians/Parties
Programs
I knew all of them I knew most of them I knew some of them I did not know any of themChart 33: Knowledge of Programs and Parties/Politicians
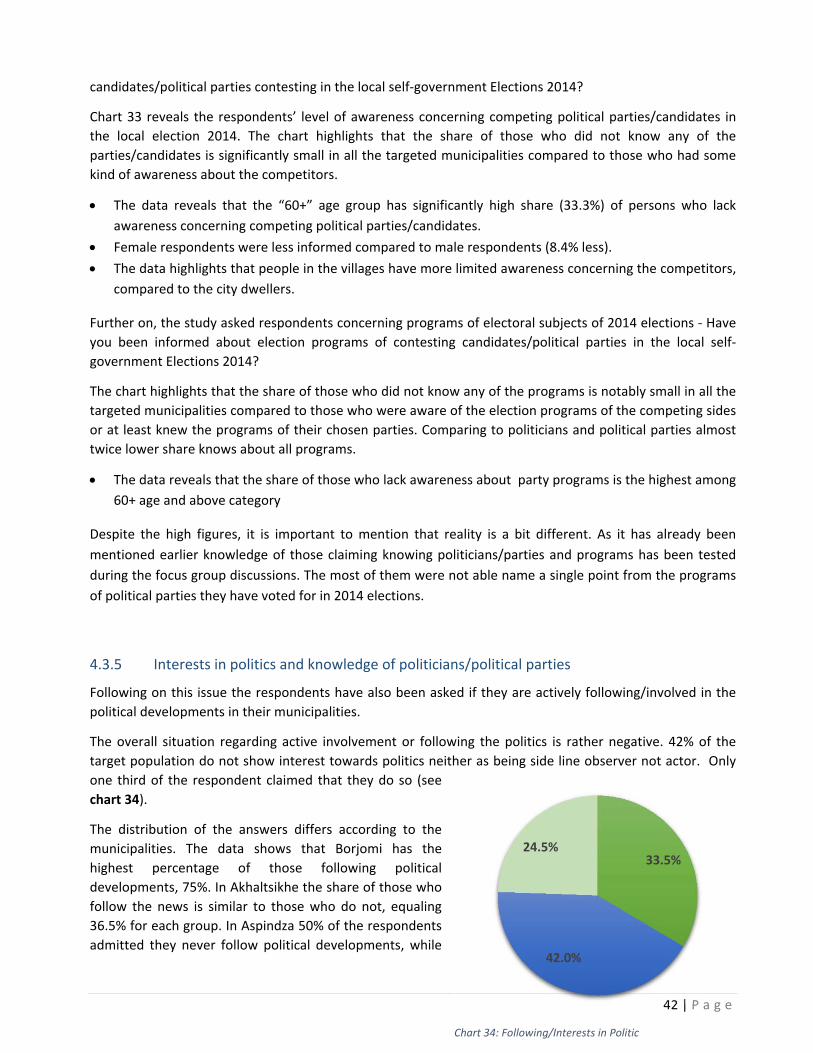
42 | P a g e
candidates/political parties contesting in the local self‐government Elections 2014?
Chart 33 reveals the respondents’ level of awareness concerning competing political parties/candidates in
the local election 2014. The chart highlights that the share of those who did not know any of the
parties/candidates is significantly small in all the targeted municipalities compared to those who had some
kind of awareness about the competitors.
The data reveals that the “60+” age group has significantly high share (33.3%) of persons who lack
awareness concerning competing political parties/candidates.
Female respondents were less informed compared to male respondents (8.4% less).
The data highlights that people in the villages have more limited awareness concerning the competitors,
compared to the city dwellers.
Further on, the study asked respondents concerning programs of electoral subjects of 2014 elections ‐ Have
you been informed about election programs of contesting candidates/political parties in the local self‐
government Elections 2014?
The chart highlights that the share of those who did not know any of the programs is notably small in all the
targeted municipalities compared to those who were aware of the election programs of the competing sides
or at least knew the programs of their chosen parties. Comparing to politicians and political parties almost
twice lower share knows about all programs.
The data reveals that the share of those who lack awareness about party programs is the highest among
60+ age and above category
Despite the high figures, it is important to mention that reality is a bit different. As it has already been
mentioned earlier knowledge of those claiming knowing politicians/parties and programs has been tested
during the focus group discussions. The most of them were not able name a single point from the programs
of political parties they have voted for in 2014 elections.
4.3.5 Interests in politics and knowledge of politicians/political parties
Following on this issue the respondents have also been asked if they are actively following/involved in the
political developments in their municipalities.
The overall situation regarding active involvement or following the politics is rather negative. 42% of the
target population do not show interest towards politics neither as being side line observer not actor. Only
one third of the respondent claimed that they do so (see
chart 34).
The distribution of the answers differs according to the
municipalities. The data shows that Borjomi has the
highest percentage of those following political
developments, 75%. In Akhaltsikhe the share of those who
follow the news is similar to those who do not, equaling
36.5% for each group. In Aspindza 50% of the respondents
admitted they never follow political developments, while
33.5%
42.0%
24.5%
Yes No RFAChart 34: Following/Interests in Politic

43 | P a g e
the respective share in Ninotsminda is even higher ‐ 62%. In Akhalkalaki and Tsalka the majority of
respondents indicated interest, representing 38% and 46.4% respectively. The share of those who refused to
specify their position was the highest in Aspindza (33.3%), followed by Akhalkalaki (29.9%), Akhaltsikhe
(26.9%), Tsalka (17.9%), and Ninotsminda (17.4%).
The data highlights that political developments in the targeted municipalities do not seem to be of
interest to many people neither in the cities nor in the villages.
The survey results reveal that there is no significant difference according to gender when it comes to
following the political developments. Relatively few male and female respondents revealed their
interest in the political developments in their respective municipalities.
The “60+” age category has the lowest share of persons who follow political developments, revealing
the tendency that elderly persons are less interested in the politics than middle aged groups. Young
generation does not have much interest either, though their respective share is 7.5% higher than the
share of the elders.
With the aim to find out about knowledge of local politicians and political parties by the population, the
questionnaire inquired respondents about their Gamgebeli (governor)/Mayor.
Fourteen concrete names of local politicians have been given as a choice. Out of those there was actual
governor/mayor for each electing unit (6 municipalities + 1 self‐governing city of Akhaltsikhe) and another
one second best performing candidate in 2014 elections.
The table 8 shows how correct the answers were. More than 2/3 of the respondents have answered
correctly. However, in municipalities such as Borjomi and Aspindza, where ethnic Armenians live in distant
isolated compactly settled villages, the rate of correct answers is relatively low.
Somewhat similar situation is regarding the knowledge of their governors’ political party, the rate of
incorrect answers in this case is slightly higher.
An Interesting case is the municipality of Ninotsminda, where more than 25% of respondents named a
former ruling political party which also was a former party of the current governor, who changed his
affiliation after the change of a ruling party at central government level. Some of the voters still believe that
their governor represents his former party. This pattern reveals tendency that voting behavior in the target
region is still determined by persons/authorities rather than political parties, programs or their ideologies.
Governor/Mayor Political Party of Governor/Mayor
Self‐Governing Unit Correctly Falsely DK Correctly Falsely DK
Akhalkalaki 72.5% 12.2% 15.3% 60.3% 2.2% 37.5%
Akhaltsikhe ‐ City 82.4% 5.8% 11.8% 86.1% 8.3% 5.6%
Akhaltsikhe ‐ Municipality 73.7% 10.5% 15.8% 63.2% 15.7% 21.1%
Aspindza 40% 40% 20% 66.7% 16.6% 16.7%
Borjomi 50% 0 50% 60.0% 20.0% 20.0%
Ninotsminda 84.7% 5.6% 9.7% 62.4% 27.9% 9.7%
Tsalka 92.9% 7.1% 0% 88.9% 7.4% 3.7%
Total 70.9% 11.6% 17.5% 69.66% 14.01% 16.33% Table 8: Knowledge of local ruling parties and Governors/Mayors

44 | P a g e
As it turned out, respondents from rural areas tend to be less knowledgeable about politicians and
political parties than people from urban areas (rate of correct answers in villages 60% versus to 75% in
cities).
60+ age group has the least knowledge about politicians and political parties in their municipalities
(53.1%). The younger generation tend to follow their suit (63.6%).
4.3.6 Source of Information about elections
The Survey included questions which aimed at disclosing how information about the elections are delivered
to the electorate and what (if so) instruments are the most popular.
The pie chart 32 reveals the tendency of following the news about
elections 2014 among respondents. Of all respondents 321
(94.1%) answered the question: How often did you follow news
about the elections 2014?
39.6% indicated they often followed the news. Those who
observed election news every now and then amounted to 34%.
19% of the respondents indicated they often watched election
news, while merely 7.5% declared they never followed the media
(Chart 35).
The results highlight that
most people in the cities tend to
follow media news rather often
while most people in the villages
observe election news every now and then.
The data also revealed that the share of those who did not follow
election news was highest among age group 60+ compared to the rest of
the age categories.
Respondent have been asked to assess the role of media in the elections
2014. 47% of respondents either did not know the answer to the question, or
refused to specify their opinion. 30% of the respondents believed media was
balanced and objective while presenting the information on elections. 16.3%
think media was indifferent to the elections, while merely 6.7% evaluated the
media as biased (chart 36).
The survey looked at the sources/channels of information flow in the target region. The questionnaire
included different options of receiving information regarding the elections 2014 with the possibility of
making multiple choices.
The results (chart 37) show that more than half of the respondents (52.3%) mentioned TV as a source of
information, making it #1 source. It is followed by campaign meetings with candidates (36.1%), internet
(35.2%) and friends and family (20.6%). The other sources enjoy almost the same level of attention from the
target audience.
19%
39.6%
34%
7.5%
Always Often Sometimes Never
30%
16.3%
7%
47.0%
Balanced and objectivebiasedindifferent to electionsI do not know
Chart 35: Following news on the Elections 2014
Chart 36: Assessment of Media
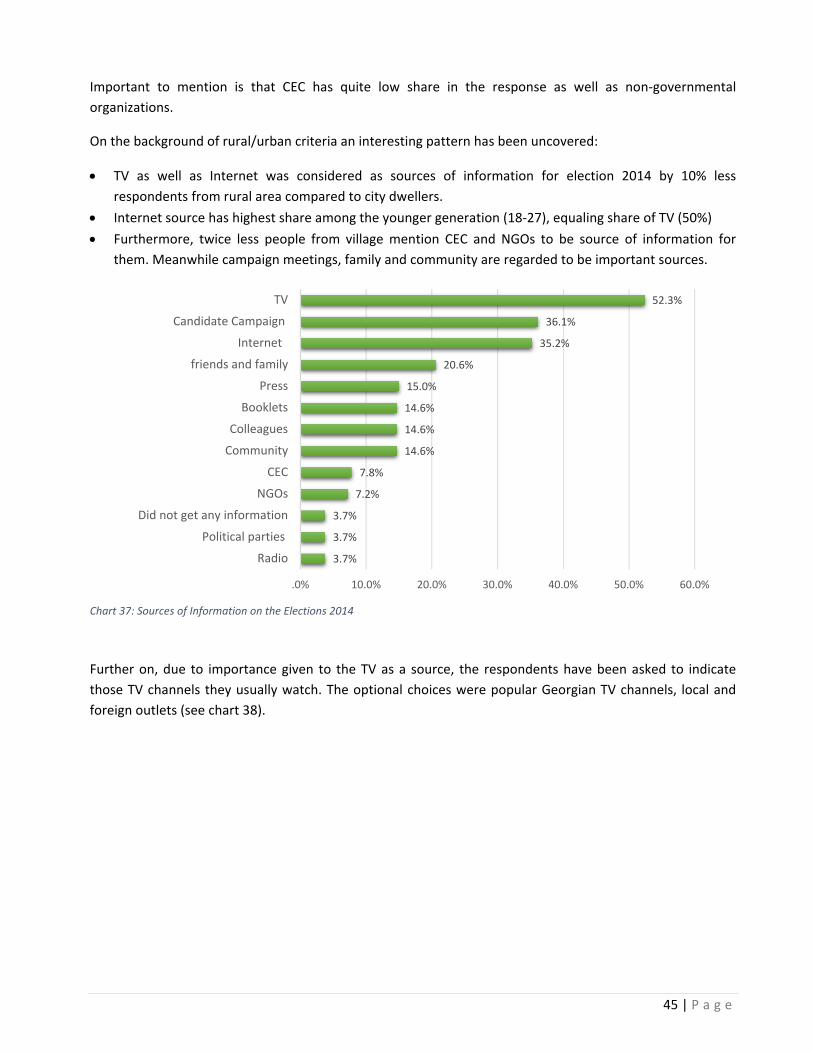
45 | P a g e
Important to mention is that CEC has quite low share in the response as well as non‐governmental
organizations.
On the background of rural/urban criteria an interesting pattern has been uncovered:
TV as well as Internet was considered as sources of information for election 2014 by 10% less
respondents from rural area compared to city dwellers.
Internet source has highest share among the younger generation (18‐27), equaling share of TV (50%)
Furthermore, twice less people from village mention CEC and NGOs to be source of information for
them. Meanwhile campaign meetings, family and community are regarded to be important sources.
Further on, due to importance given to the TV as a source, the respondents have been asked to indicate
those TV channels they usually watch. The optional choices were popular Georgian TV channels, local and
foreign outlets (see chart 38).
3.7%
3.7%
3.7%
7.2%
7.8%
14.6%
14.6%
14.6%
15.0%
20.6%
35.2%
36.1%
52.3%
.0% 10.0% 20.0% 30.0% 40.0% 50.0% 60.0%
Radio
Political parties
Did not get any information
NGOs
CEC
Community
Colleagues
Booklets
Press
friends and family
Internet
Candidate Campaign
TV
Chart 37: Sources of Information on the Elections 2014
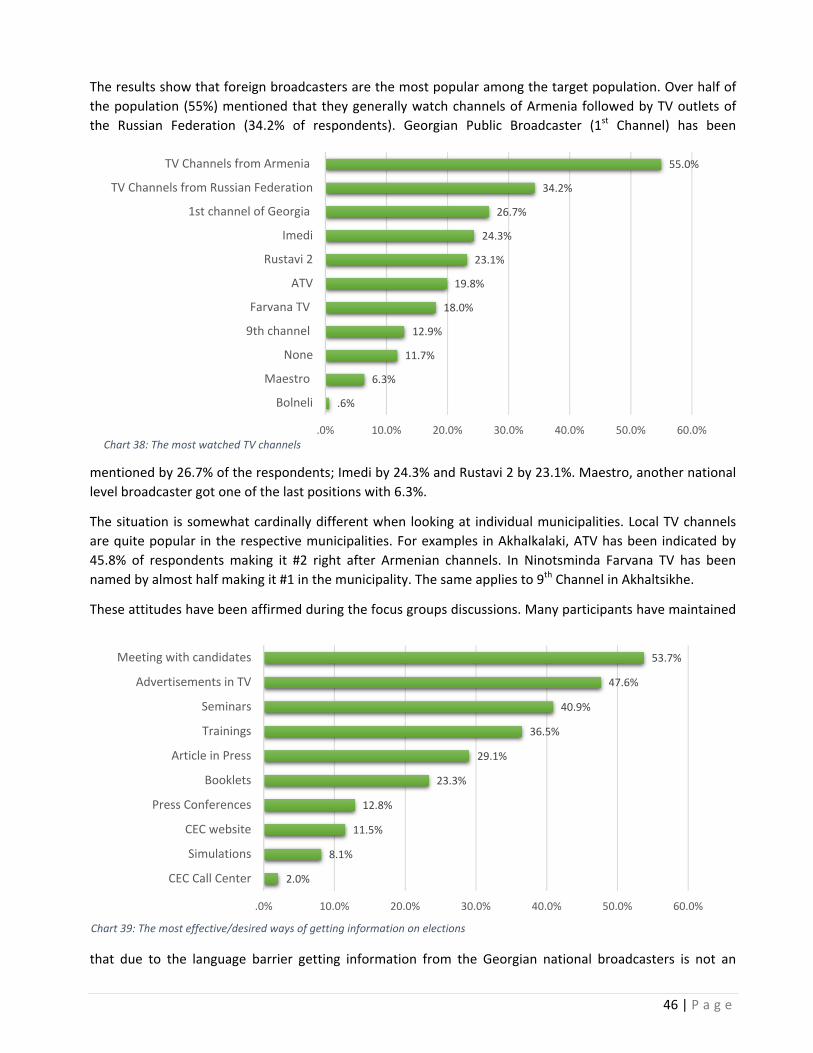
46 | P a g e
The results show that foreign broadcasters are the most popular among the target population. Over half of
the population (55%) mentioned that they generally watch channels of Armenia followed by TV outlets of
the Russian Federation (34.2% of respondents). Georgian Public Broadcaster (1st Channel) has been
mentioned by 26.7% of the respondents; Imedi by 24.3% and Rustavi 2 by 23.1%. Maestro, another national
level broadcaster got one of the last positions with 6.3%.
The situation is somewhat cardinally different when looking at individual municipalities. Local TV channels
are quite popular in the respective municipalities. For examples in Akhalkalaki, ATV has been indicated by
45.8% of respondents making it #2 right after Armenian channels. In Ninotsminda Farvana TV has been
named by almost half making it #1 in the municipality. The same applies to 9th Channel in Akhaltsikhe.
These attitudes have been affirmed during the focus groups discussions. Many participants have maintained
that due to the language barrier getting information from the Georgian national broadcasters is not an
.6%
6.3%
11.7%
12.9%
18.0%
19.8%
23.1%
24.3%
26.7%
34.2%
55.0%
.0% 10.0% 20.0% 30.0% 40.0% 50.0% 60.0%
Bolneli
Maestro
None
9th channel
Farvana TV
ATV
Rustavi 2
Imedi
1st channel of Georgia
TV Channels from Russian Federation
TV Channels from Armenia
2.0%
8.1%
11.5%
12.8%
23.3%
29.1%
36.5%
40.9%
47.6%
53.7%
.0% 10.0% 20.0% 30.0% 40.0% 50.0% 60.0%
CEC Call Center
Simulations
CEC website
Press Conferences
Booklets
Article in Press
Trainings
Seminars
Advertisements in TV
Meeting with candidates
Chart 38: The most watched TV channels
Chart 39: The most effective/desired ways of getting information on elections

47 | P a g e
option for them. And in many cases those foreign channels represent only source of information about
political developments in Georgia.
The research was also interested in finding the effective mechanisms of informing the population about
elections.
As the chart 39 shows highest share of respondents (53.7%, 159 person) indicated that effective instrument
for getting information is pre‐election rallies and meetings with the candidates. TV Advertisements had the
second highest number of approval among the respondents, followed by seminar and trainings. The CEC call
center has had number of lowest appreciators.
In settlement type perspective, TV Advertisements in rural population seem to be less popular than in urban
population. Quite opposite is about press articles and advertisements ‐ villagers tend to give more priority
than city dwellers.
In terms of age groups it is important to mention that younger generation (18‐27) gives more priorities to
the TV Ads over meetings with the candidates, while middle aged (45‐60) and elders (60+) prefer to read
booklets and press articles.
4.4 Effectiveness of activities implemented for Elections 2014
4.4.1 Effectives of CEC and PECs – Measures and Activities for Equal electoral environment
One of the key aims of the study was to assess the effectiveness of concrete activities that Central Election
Commission has been pursuing in order to create equal electoral environment for the ethnic minority
population of Georgia and raise their capacity. This study also aimed at understanding how successful PECs
and CEC were during 2014 elections day as well as in general.
Chart 40: satisfaction with the work of CEC and PECs
The chart 40 highlights assessment of effectiveness of CEC and PECs in the local elections 2014. The diagram
reveals that the majority of the respondents evaluated the efficiency of CEC and PECs as satisfactory, CEC at
56.5% and PEC/DEC at 58.3% correspondingly. The shares of those who were very satisfied with the work of
Central and Precinct Election commissions were relatively small, equaling 12.2% and 13.6% of the
participants who responded to the question.
12.2%
13.6%
56.5%
58.3%
3.3%
5.9%
28.0%
22.2%
0% 10% 20% 30% 40% 50% 60% 70% 80% 90% 100%
Effectiveness of CEC
Effectiveness of PECs
Very satisfactory Satisfactory Not satisfactory DK
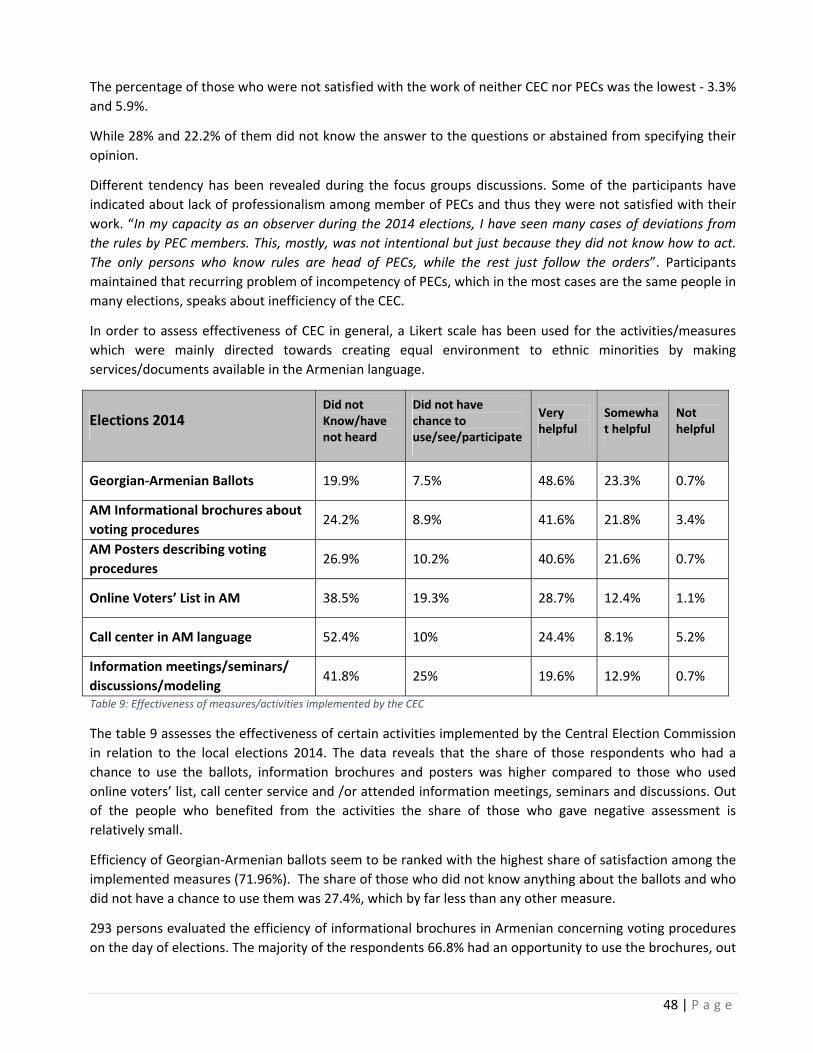
48 | P a g e
The percentage of those who were not satisfied with the work of neither CEC nor PECs was the lowest ‐ 3.3%
and 5.9%.
While 28% and 22.2% of them did not know the answer to the questions or abstained from specifying their
opinion.
Different tendency has been revealed during the focus groups discussions. Some of the participants have
indicated about lack of professionalism among member of PECs and thus they were not satisfied with their
work. “In my capacity as an observer during the 2014 elections, I have seen many cases of deviations from
the rules by PEC members. This, mostly, was not intentional but just because they did not know how to act.
The only persons who know rules are head of PECs, while the rest just follow the orders”. Participants
maintained that recurring problem of incompetency of PECs, which in the most cases are the same people in
many elections, speaks about inefficiency of the CEC.
In order to assess effectiveness of CEC in general, a Likert scale has been used for the activities/measures
which were mainly directed towards creating equal environment to ethnic minorities by making
services/documents available in the Armenian language.
Elections 2014 Did not Know/have not heard
Did not have chance to use/see/participate
Very helpful
Somewhat helpful
Not helpful
Georgian‐Armenian Ballots 19.9% 7.5% 48.6% 23.3% 0.7%
AM Informational brochures about
voting procedures 24.2% 8.9% 41.6% 21.8% 3.4%
AM Posters describing voting
procedures 26.9% 10.2% 40.6% 21.6% 0.7%
Online Voters’ List in AM 38.5% 19.3% 28.7% 12.4% 1.1%
Call center in AM language 52.4% 10% 24.4% 8.1% 5.2%
Information meetings/seminars/
discussions/modeling 41.8% 25% 19.6% 12.9% 0.7%
Table 9: Effectiveness of measures/activities implemented by the CEC
The table 9 assesses the effectiveness of certain activities implemented by the Central Election Commission
in relation to the local elections 2014. The data reveals that the share of those respondents who had a
chance to use the ballots, information brochures and posters was higher compared to those who used
online voters’ list, call center service and /or attended information meetings, seminars and discussions. Out
of the people who benefited from the activities the share of those who gave negative assessment is
relatively small.
Efficiency of Georgian‐Armenian ballots seem to be ranked with the highest share of satisfaction among the
implemented measures (71.96%). The share of those who did not know anything about the ballots and who
did not have a chance to use them was 27.4%, which by far less than any other measure.
293 persons evaluated the efficiency of informational brochures in Armenian concerning voting procedures
on the day of elections. The majority of the respondents 66.8% had an opportunity to use the brochures, out

49 | P a g e
of which 63.4% assessed them as very helpful. The share of those who never heard about the brochures and
who did not have a chance to use them was 33.1%.
CEC printed and distributed posters describing voting procedures in Armenian language. The majority of the
respondents 62.2% assessed the posters as very helpful, and the share of those who did not hear about this
particular activity or did not have a chance to use the poster was 37.1%.
CEC made it possible to access Voters’ List in Armenian language online for registered voters in Ninotsminda,
Akhaltsikhe, and Akhalkalaki. The table reveals that the majority of the participants did not know about this
possibility or did not have an opportunity to use it, representing 57.8%, while 28.7%, 12.4%, 1.1% assessed
this particular activity as very helpful, somewhat helpful or not helpful respectively.
Respondents also assessed effectiveness of the call center available in Armenian, Azerbaijani and Russian
languages. More than a half of the interviewees (52.4%) admitted that they never heard about the center
plus 10% which never used this service. Merely 32.5% assessed the call center as very helpful or somewhat
helpful. This measure has also got highest share of “not helpful” comparing to the other measures.
CEC organized information meetings/seminars/ discussions/modeling for ethnic minorities. The majority
(66.8%) admitted they never heard about these meetings, seminars and discussions, or never had a chance
to attend them, while merely 19.6% evaluated them as very helpful.
The data reveals that people in the villages had less opportunity to benefit from the activities/measures
implemented by the Central Election Commission in comparison to the city dwellers.
The share of those who benefited from the online voters’ list in the cities is 27% higher compared to the
share of those in the villages.
The same is true about the meetings, seminars, discussions organized by CEC, 44.2% more persons in
the countryside declared they did not have a chance to
participate in these events than in the cities.
For the assessment of the overall situation, respondents have
been inquired how equal the electoral environment for ethnic
Armenians was in the elections 2014.
44.5% have maintained that environment was equal to the one
for Georgians. Almost 13% held that the environment was even
better for ethnic Armenians than to ethnic Georgians. Very few,
lowest share (1.6%=5persons) considered its opposite.
Focus group discussions have also reaffirmed this pattern.
However, distribution of these shares differ within
municipalities. The majority of the respondents in Tsalka,
Ninotsminda, and Akhaltsikhe evaluated the environment as
equal to the one for ethnic Georgians, representing 70.4%, 44.9%
and 54.9% respectively. In Borjomi, Aspindza and Akhalkalaki the
majority of the participants could not (or did not) make
comparison. Their respective percentage represents 75%, 66.7% and 49.3%. The share of those who think
that the environment was better or worse compared to
the one for ethnic Georgians was small in all the
municipalities, equaling 3.9%/3.9% in Akhaltsikhe, 0%/0% in
44.5%
12.9%
1.6%
41.1%
Equal to the one for ethnic Georgians
Better than for ethnic Georgians
Worse than for ethnic Georgians
IDK
Chart 41: Equal Electoral Environment for ethnicArmenians
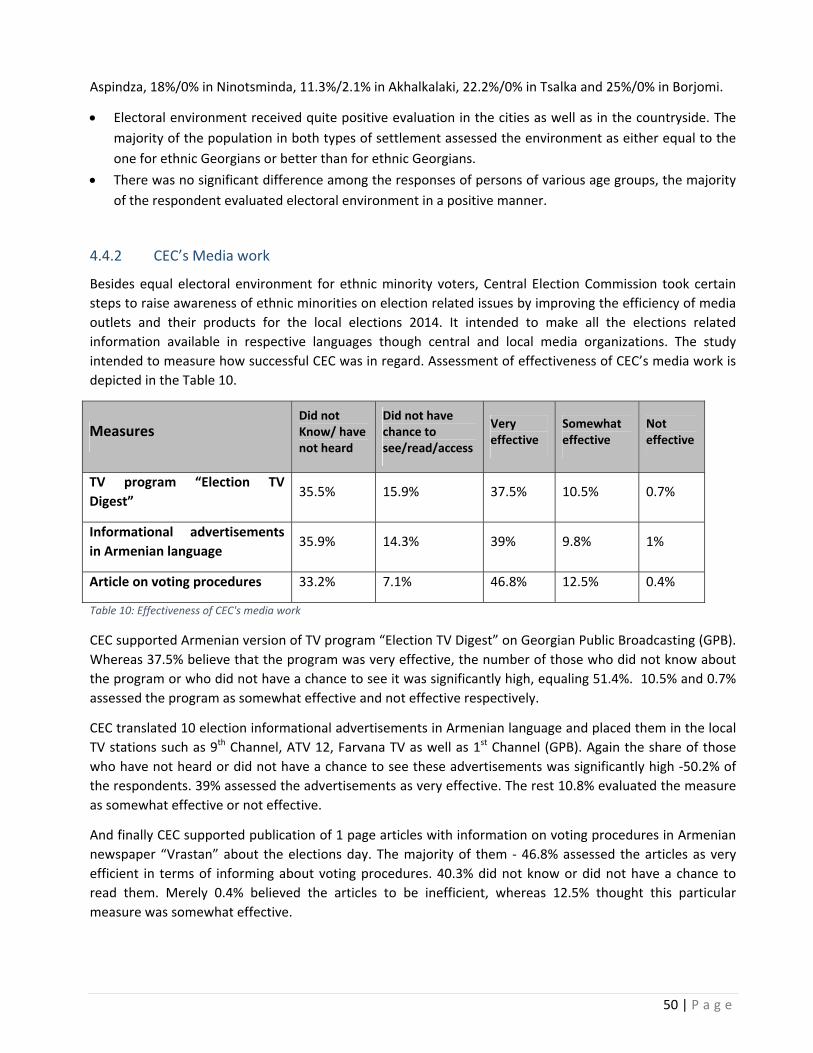
50 | P a g e
Aspindza, 18%/0% in Ninotsminda, 11.3%/2.1% in Akhalkalaki, 22.2%/0% in Tsalka and 25%/0% in Borjomi.
Electoral environment received quite positive evaluation in the cities as well as in the countryside. The
majority of the population in both types of settlement assessed the environment as either equal to the
one for ethnic Georgians or better than for ethnic Georgians.
There was no significant difference among the responses of persons of various age groups, the majority
of the respondent evaluated electoral environment in a positive manner.
4.4.2 CEC’s Media work
Besides equal electoral environment for ethnic minority voters, Central Election Commission took certain
steps to raise awareness of ethnic minorities on election related issues by improving the efficiency of media
outlets and their products for the local elections 2014. It intended to make all the elections related
information available in respective languages though central and local media organizations. The study
intended to measure how successful CEC was in regard. Assessment of effectiveness of CEC’s media work is
depicted in the Table 10.
Measures Did not Know/ have not heard
Did not have chance to see/read/access
Very effective
Somewhat effective
Not effective
TV program “Election TV
Digest” 35.5% 15.9% 37.5% 10.5% 0.7%
Informational advertisements
in Armenian language 35.9% 14.3% 39% 9.8% 1%
Article on voting procedures 33.2% 7.1% 46.8% 12.5% 0.4%
Table 10: Effectiveness of CEC's media work
CEC supported Armenian version of TV program “Election TV Digest” on Georgian Public Broadcasting (GPB).
Whereas 37.5% believe that the program was very effective, the number of those who did not know about
the program or who did not have a chance to see it was significantly high, equaling 51.4%. 10.5% and 0.7%
assessed the program as somewhat effective and not effective respectively.
CEC translated 10 election informational advertisements in Armenian language and placed them in the local
TV stations such as 9th Channel, ATV 12, Farvana TV as well as 1st Channel (GPB). Again the share of those
who have not heard or did not have a chance to see these advertisements was significantly high ‐50.2% of
the respondents. 39% assessed the advertisements as very effective. The rest 10.8% evaluated the measure
as somewhat effective or not effective.
And finally CEC supported publication of 1 page articles with information on voting procedures in Armenian
newspaper “Vrastan” about the elections day. The majority of them ‐ 46.8% assessed the articles as very
efficient in terms of informing about voting procedures. 40.3% did not know or did not have a chance to
read them. Merely 0.4% believed the articles to be inefficient, whereas 12.5% thought this particular
measure was somewhat effective.
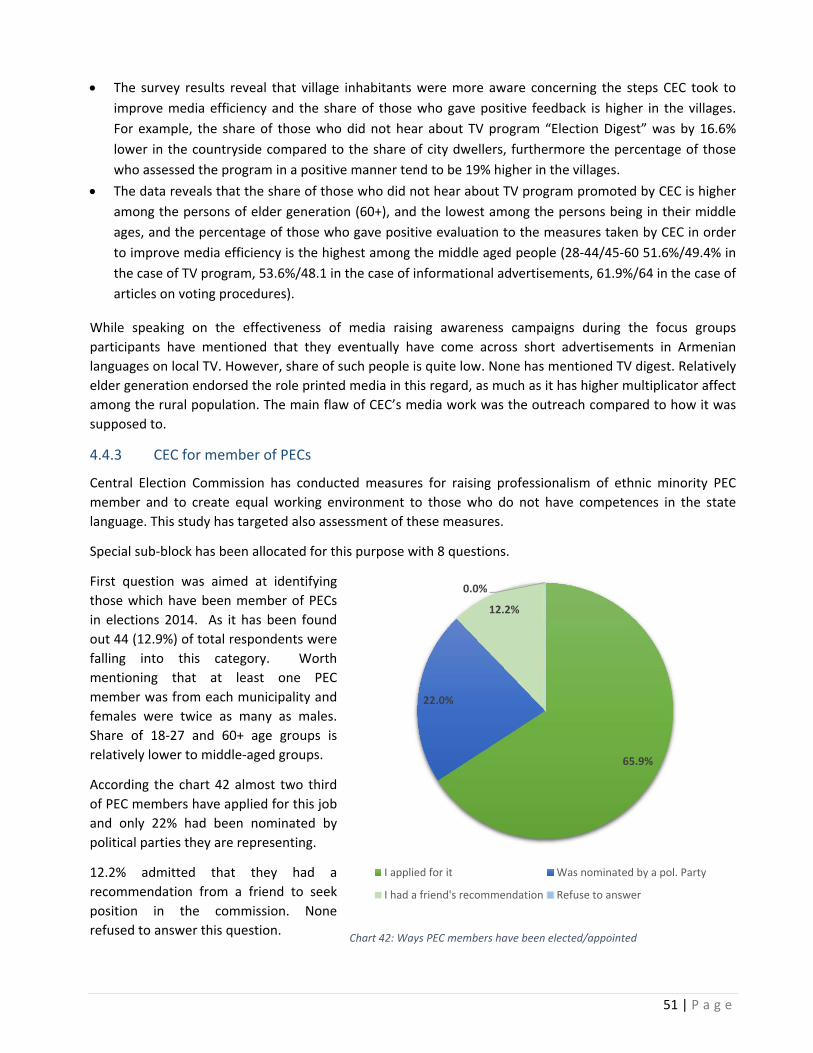
51 | P a g e
The survey results reveal that village inhabitants were more aware concerning the steps CEC took to
improve media efficiency and the share of those who gave positive feedback is higher in the villages.
For example, the share of those who did not hear about TV program “Election Digest” was by 16.6%
lower in the countryside compared to the share of city dwellers, furthermore the percentage of those
who assessed the program in a positive manner tend to be 19% higher in the villages.
The data reveals that the share of those who did not hear about TV program promoted by CEC is higher
among the persons of elder generation (60+), and the lowest among the persons being in their middle
ages, and the percentage of those who gave positive evaluation to the measures taken by CEC in order
to improve media efficiency is the highest among the middle aged people (28‐44/45‐60 51.6%/49.4% in
the case of TV program, 53.6%/48.1 in the case of informational advertisements, 61.9%/64 in the case of
articles on voting procedures).
While speaking on the effectiveness of media raising awareness campaigns during the focus groups
participants have mentioned that they eventually have come across short advertisements in Armenian
languages on local TV. However, share of such people is quite low. None has mentioned TV digest. Relatively
elder generation endorsed the role printed media in this regard, as much as it has higher multiplicator affect
among the rural population. The main flaw of CEC’s media work was the outreach compared to how it was
supposed to.
4.4.3 CEC for member of PECs
Central Election Commission has conducted measures for raising professionalism of ethnic minority PEC
member and to create equal working environment to those who do not have competences in the state
language. This study has targeted also assessment of these measures.
Special sub‐block has been allocated for this purpose with 8 questions.
First question was aimed at identifying
those which have been member of PECs
in elections 2014. As it has been found
out 44 (12.9%) of total respondents were
falling into this category. Worth
mentioning that at least one PEC
member was from each municipality and
females were twice as many as males.
Share of 18‐27 and 60+ age groups is
relatively lower to middle‐aged groups.
According the chart 42 almost two third
of PEC members have applied for this job
and only 22% had been nominated by
political parties they are representing.
12.2% admitted that they had a
recommendation from a friend to seek
position in the commission. None
refused to answer this question.
65.9%
22.0%
12.2%
0.0%
I applied for it Was nominated by a pol. Party
I had a friend's recommendation Refuse to answer
Chart 42: Ways PEC members have been elected/appointed

52 | P a g e
CEC prepared the Instruction documents in Armenian language on the functions of the each
assigned/elected members of the precinct commission. The questionnaire aimed at identifying how helpful
this instructions document was.
More than half of the inquired PEC members (54.8%) maintained that the instructions was very helpful,
while more than third considered it as “somewhat helpful”. None has indicated that it was “Not Helpful” or
that they “have not heard about it”. 4 Persons did not get chance use the document (in Ninotsminda,
Akhaltsikhe and Borjomi).
For the Elections 2014 CEC organized trainings in Armenian language concerning the functions, duties and
rights of the assigned/elected members of the PECs. In order to assess effectiveness of this training the
simple Likert scale has been elaborated based on internationally accepted standard of evaluation of
trainings.
The table 11 shows that the trainings, overall had quite successful assessments by PEC members. However,
the only question which lack confidence was the question regarding competences of the trainer. Only 51.6%
maintained that the trainer was competent enough for the job.
In municipality perspective not‐satisfaction becomes clearer (see chart 44)
In Akhaltsikhe share of disapproval of the trainer is pretty high (45%) followed by Akhalkalaki (33.3%).
Ninotsminda, although has vast majority saying neutral if trainer was competent, share of approval this idea
is relatively low. 1 person from Borjomi also maintained neutral position when assessing trainer. Tsalka had
the higher approval rate (66.7%).
66.7%
28.6%
0.0%
66.7%
54.5%
33.3%
71.4%
100.0%
0.0%
33.3%
45.5%
0% 10% 20% 30% 40% 50% 60% 70% 80% 90% 100%
Tsalka
Ninotsminda
Borjomi
Akhaltsikhe
Akhalkalaki
Strongly Agree neutral Strongly Disagree

53 | P a g e
Yet another interesting observation is that PEC members from rural areas evaluate trainer with much less
approval than from urban areas (43.5% in villages vs. 75% in cities).
Complaints about the qualifications of trainers have also been sounded in the focus groups in Ninotsminda
and Akhalkalaki. A participant held that last time when trainer have arrived from Tbilisi, they have just
approached to the rules in very basics. The person also indicated that this time trainers were speaking in
Russian (while in previous years it was in Armenian). However, no dissatisfaction with the language of the
training was observed at larger scale from survey.
Another issue which has been raised is that many of the PEC members skip the trainings and thus are not
equipped with the relevant skills to perform duly on the elections day. “I know a case when a member
showed up just on the Election Day” said one of the participants. This is mostly observed among assigned
PEC members from political parties.
4.4.4 The Reforms and Training Center’s funded Projects and Effectiveness of Other NGOs
The very last block of the research was about effectiveness of local civil society organizations. Based on the
results of the survey the following patterns are clear (chart 44).
The highest share of respondents (40.9%) deem that
they have never heard of local NGOs working in the
target municipalities. However, out of those who
have heard vast majority evaluates their work as very
effective or somewhat effective. Very small share of
respondents seem to be not satisfied with the work
of organizations.
The share of those who have not heard
about the NGO’s activity in their municipalities is
significantly high, ranging between 25.9% and 52%,
# CEC Trainings assigned/elected members of the PEC Strongly
Agree neutral
Strongly
Disagree
1 Participation and Interaction during the training was possible 91.7% 5.6% 2.8%
2 The language used was understandable 94.6% 2.7% 2.7%
3 The Training experience was very useful for my work 100% 0% 0%
4 The trainer was competent 51.6% 25.8% 22.6%
5 time allocated for the training was enough 90.6% 9.4% .0%
Table 11: Effectiveness of the Trainings for the PECs members
24.8%
27.5%
6.7%
40.9%
Very effective Somewhat effective
Not effective Have not Heard of them
Chart 43: Competence of Trainer in Municipality perspective
Chart 44: Effectiveness of local NGOs in General
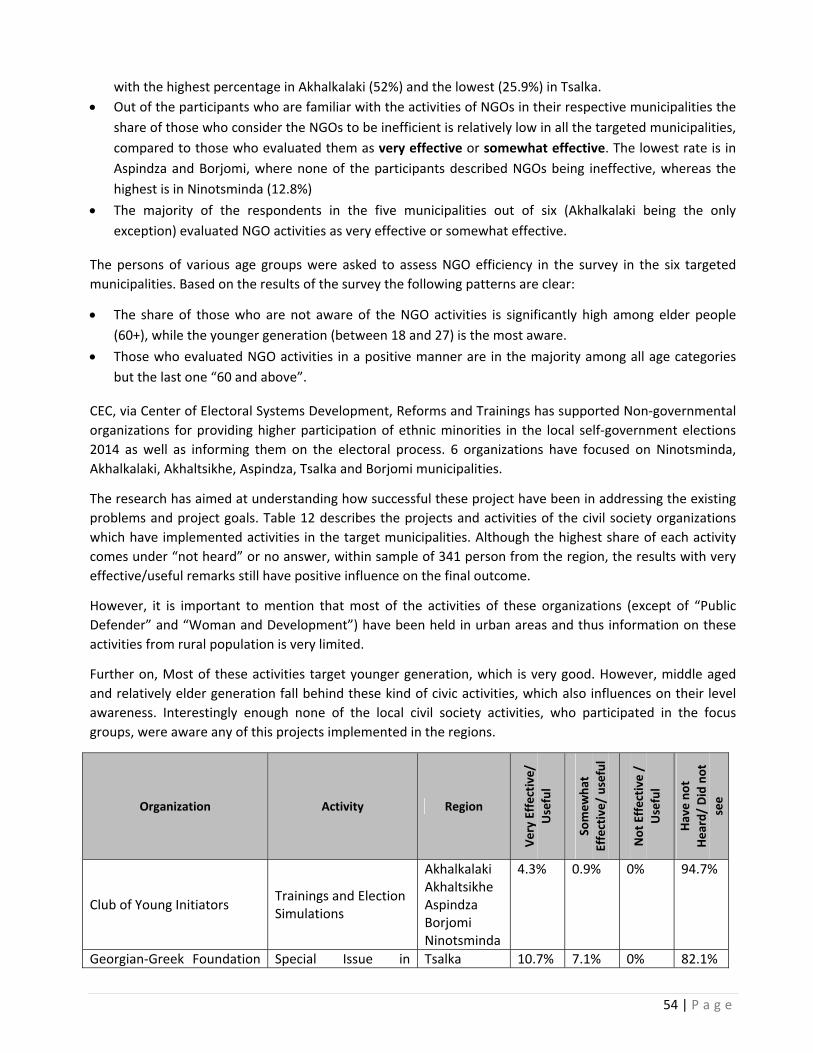
54 | P a g e
with the highest percentage in Akhalkalaki (52%) and the lowest (25.9%) in Tsalka.
Out of the participants who are familiar with the activities of NGOs in their respective municipalities the
share of those who consider the NGOs to be inefficient is relatively low in all the targeted municipalities,
compared to those who evaluated them as very effective or somewhat effective. The lowest rate is in
Aspindza and Borjomi, where none of the participants described NGOs being ineffective, whereas the
highest is in Ninotsminda (12.8%)
The majority of the respondents in the five municipalities out of six (Akhalkalaki being the only
exception) evaluated NGO activities as very effective or somewhat effective.
The persons of various age groups were asked to assess NGO efficiency in the survey in the six targeted
municipalities. Based on the results of the survey the following patterns are clear:
The share of those who are not aware of the NGO activities is significantly high among elder people
(60+), while the younger generation (between 18 and 27) is the most aware.
Those who evaluated NGO activities in a positive manner are in the majority among all age categories
but the last one “60 and above”.
CEC, via Center of Electoral Systems Development, Reforms and Trainings has supported Non‐governmental
organizations for providing higher participation of ethnic minorities in the local self‐government elections
2014 as well as informing them on the electoral process. 6 organizations have focused on Ninotsminda,
Akhalkalaki, Akhaltsikhe, Aspindza, Tsalka and Borjomi municipalities.
The research has aimed at understanding how successful these project have been in addressing the existing
problems and project goals. Table 12 describes the projects and activities of the civil society organizations
which have implemented activities in the target municipalities. Although the highest share of each activity
comes under “not heard” or no answer, within sample of 341 person from the region, the results with very
effective/useful remarks still have positive influence on the final outcome.
However, it is important to mention that most of the activities of these organizations (except of “Public
Defender” and “Woman and Development”) have been held in urban areas and thus information on these
activities from rural population is very limited.
Further on, Most of these activities target younger generation, which is very good. However, middle aged
and relatively elder generation fall behind these kind of civic activities, which also influences on their level
awareness. Interestingly enough none of the local civil society activities, who participated in the focus
groups, were aware any of this projects implemented in the regions.
Organization Activity Region
Very Effective/
Useful
Somewhat
Effective/ useful
Not Effective /
Useful
Have not
Heard/ Did not
see
Club of Young Initiators Trainings and Election Simulations
Akhalkalaki Akhaltsikhe Aspindza Borjomi Ninotsminda
4.3% 0.9% 0% 94.7%
Georgian‐Greek Foundation Special Issue in Tsalka 10.7% 7.1% 0% 82.1%
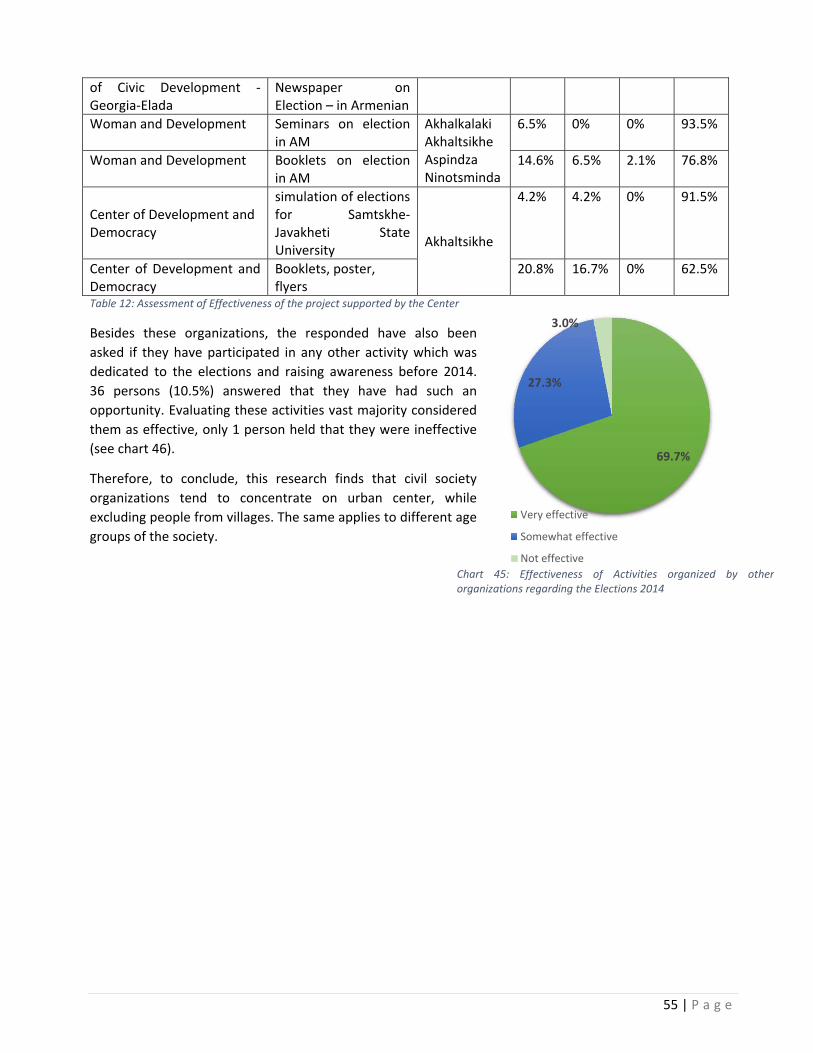
55 | P a g e
of Civic Development ‐ Georgia‐Elada
Newspaper on Election – in Armenian
Woman and Development Seminars on election in AM
Akhalkalaki Akhaltsikhe Aspindza Ninotsminda
6.5% 0% 0% 93.5%
Woman and Development Booklets on election in AM
14.6% 6.5% 2.1% 76.8%
Center of Development and Democracy
simulation of elections for Samtskhe‐Javakheti State University
Akhaltsikhe
4.2% 4.2% 0% 91.5%
Center of Development and Democracy
Booklets, poster, flyers
20.8% 16.7% 0% 62.5%
Table 12: Assessment of Effectiveness of the project supported by the Center
Besides these organizations, the responded have also been
asked if they have participated in any other activity which was
dedicated to the elections and raising awareness before 2014.
36 persons (10.5%) answered that they have had such an
opportunity. Evaluating these activities vast majority considered
them as effective, only 1 person held that they were ineffective
(see chart 46).
Therefore, to conclude, this research finds that civil society
organizations tend to concentrate on urban center, while
excluding people from villages. The same applies to different age
groups of the society.
Chart 45: Effectiveness of Activities organized by otherorganizations regarding the Elections 2014
69.7%
27.3%
3.0%
Very effective
Somewhat effective
Not effective

56 | P a g e
Chapter 5: Conclusions & Recommendations
The study has revealed the main problems and issues which make participation in electoral processes,
including voter turnout rate at elections, among ethnic Armenians to rapidly decline.
Combination of factors such as overall skepticism, clan relations at the local level, absence of sustainable
civil society, limited civic education, absence of trusted political elites and no interests in politics determine
poor performance in the elections year after year. The complexity of the problem requires comprehensive
and strategic approach from the institutions concerned.
Based on the analysis of the problems, perceptions and attitudes among the ethnic Armenian electorate
uncovered by the research through surveys and focus group discussions, following key recommendations
can be given to each institution which plays an important role in the motivation for involvement of ethnic
Armenians in the electoral process.
5.1 To the Central Election Commission
It is important to mention that the Central Election Commission has done a lot in order to create equal
environment for ethnic minorities so that the language barrier would not become a reason for not
participating in electoral processes. However, there are still areas that can be improved:
Develop appropriate policy which would ensure free and fair system of selection of the PEC
members based on merits and popularize the selection process. In the villages there is a perception
that these jobs are granted to certain people, who have been recurrently taking up these positions.
This ambiguous process of appointing the same persons, alienates the electorate.
Ensure attendance of all PECs member to the trainings (including those appointed from the political
parties) in order to avoid the situation when only heads of PECs are trained and informed about the
rules.
Make sure that trainers for the trainings of the PEC staff are competent and motivated to perform
their functions and can assist the voters in the language they understand (e.g. Armenian speaker).
Continue its successful work towards accessibility to full elections services by non‐Georgian speaking
citizens.
Popularize more among ethnic minorities its multilingual information call center
Seminars/trainings organized by the CEC in ethnic minority regions should be held more in rural
areas than in urban centers, in as much as according to this study, village dwellers always have
lesser access to such events.
The CEC should cooperate more with local media outlets on the long‐term projects which would
make more people interested in participating in elections (support programs, political talk‐show,
representatives of CEC or DEC to pay visits more often).
The CEC should work towards improving/substituting those components of activities which lack
effectiveness in terms of media related efforts.
Within its mandate to ensure relative balance of proportion of ethnic Armenian members of DECs in
municipalities where ethnic Armenians are compactly represented (e.g. Tsalka DEC).
Work towards updating of the voters’ list.
57 | P a g e
Have heads of the PECs warned of the strong control over political agitation in close proximities to
the polling stations. Work alongside with Ministry of Internal Affairs to ensure that voters do not
hesitate to participate because of the tense situation around precincts.
The CEC in cooperation with the government structures and the parliament need to update relevant
rules which define the area of polling places where agitation is prohibited. Considering strong clan
system of the society agitations have a dramatic influence on voter’s behavior.
5.2 To the Center of Electoral Systems Development, Reforms and Trainings
The work of the Center has a positive added l value for inclusion of ethnic minorities in the electoral
processes. Grant mechanism offered to civil society organizations, with the specific emphasis on raising
awareness of ethnic minorities on elections and integration can be regarded as an affirmative action, much
needed in the region. However, there are several steps which can be taken further for better results:
Grant facility needs to be more accessible for the non‐governmental organizations working in the
target region. Regional CSOs have much better access to local population, especially in rural areas,
and have advantage over Tbilisi‐ based organizations to cover the most vulnerable segment of
society.
As identified during the focus groups with civil society organizations, only few of them were
aware of this opportunity. Therefore it very important that the Center engages in
popularization of the grant scheme among the local non‐governmental organizations and
civic activists.
For those who have been aware of the grant scheme, the main problem was drafting project
proposals in Georgian language. As the knowledge of state language still remains an issue,
especially among middle‐aged population, who represent the most active part of the society
in the region. This resource can be successfully used for building active civil society,
especially when there is no communication barrier between the beneficiaries and service
deliveries. Therefore, an affirmative action, encouraging local CSOs to apply in at least
Russian (preferably in Armenian) language, would increase applications coming from
grassroot organizations in these regions.
Procedures and documentation of the grant competition are vague and complicated for
those who wanted to participate in the competition. Trainings offered by the Center’s staff
for local civil society organizations and activists on how to deliver a successful project
applications
Including all required additional documents would prevent misunderstanding of
requirements.
Include criteria of covering the most vulnerable groups (age cohort 45‐59 and 60+ and women) as
beneficiaries in the project evaluation, It is recommended that project proposals which primarily
target rural areas, be given a priority to close the gap of understanding of civic rights among rural
and urban inhabitants.
It is recommended for the Center to work alongside with the Central Election Commission on
development of professional election administration in the target region.
Certification of Elections Administration staff – there is a little knowledge on this mechanism
among ethnic Armenian population. This needs to be popularized, especially among the
younger generation, in cooperation with the DECs.

58 | P a g e
Although the registration is decentralized for election administration tests, it would be more
effective if the tests were held in regional centers in order to exclude barriers associated
with the travelling. Moreover, this would serve as yet another step for popularization of the
instrument.
In the capacity of a monitor it should ensure that the trainings for PEC members are of high
quality and the attendance of the members is controlled.
As a grant maker to political parties in the framework of projects, the Center should give incentives
to mainstream ethnic minority issues by political subjects. It is suggested that the Center gives
priorities to projects which include implementation of the recommendations for political parties as
below.
5.3 To the central and local authorities
The most important actors who can have positive influence on participation in electoral process are central
and local authorities and respective institutions. Although different governmental agencies have
mainstreamed ethnic minority problems in their policies, there is still lot of room for improvement. A
sustainable result can only be achieved by coordinated work of these agencies.
The most important factors named by respondents for not participating in the elections were distrust and
skeptical attitudes towards politicians and electoral subjects. It is recommended for the heads of
governmental bodies and institutions to visit this region more frequently, to meet and to speak with the
local population.
Specific recommendations to state bodies are:
To the Office of the State Minister for Reconciliation and Civic Integration(SMR): ‐ to ensure that the
problems of civic integration as identified in this research are adequately addressed in the Concept
of Tolerance and Civic Integration and its action plan for 2015‐2019 in terms of political and civic
engagement, especially with regard to the most vulnerable groups .
To the Ministry of Education and Sciences (MES)
Knowledge of the state language is a condition for civic and political participation of ethnic
Armenian. As the study shows, the knowledge of the state language is still a problem. MES
needs ensure quality teaching of the state language in public schools and for adult
population
In this regard, MES needs to evaluate effectiveness of the past and current programs to
improve teaching of Georgian language to different segments of ethnic Armenian
population.
Work towards development of human resources and their competencies in the target
regions.
Introduction of Civic Education curriculum, which included topics on elections, was a
positive development. However, the quality of teaching this course in the remote villages
remains still poor. Thus it is very important for MES to have adequate human resources
policy, especially for this region. Upgrading competencies of local resources is one of the
proposed solutions
Create incentives to the teachers of this course to more actively conduct mock elections
exercises in schools for pupils and for the local communities.

59 | P a g e
To the Ministry of Economic and Sustainable Development: – political and civic integration and thus
electoral behavior, are highly determined by the economic situation of the voters. It is important to
develop and implement business and economic projects in these regions.
To the Ministry of Regional Development and Infrastructure: – Infrastructure in the target region still
remains in poor condition. It is very important for such distant regions to have access to fast and
quality state services and goods. Infrastructural development of the region also makes the local
people understand that the central government and politicians work for them, too.
To the Ministry of Internal Affairs: – Ensure that there is no discrimination based on ethnicity in their
daily work and especially on the day of elections. Inability of the law enforcement structures to
guarantee the rule of law, order and safety during elections further discourages the voters from
participation.
To the Local authorities – main reasons of dissatisfaction and frustration with the politics and thus
with elections are associated with local politicians. Local self‐government representatives need to
be in constant communication with the local population. Through the “representatives” mechanism
visits and information meetings it is very important to maintain contact with their electorate, even if
the politicians cannot deliver solutions they have promised during election campaigns.
5.4 To International organizations and diplomatic Missions
International organizations as well as diplomatic missions are somewhat actively involved in the region
within their mandates.
It is crucially important to continue supporting formation and development of civil society in the
target communities. Small grassroots organizations have great difficulties in finding their way to
foreign donors, not less due to simple and unsophisticated project proposals and requests for small
grants. Therefore, it is of crucial importance to facilitate access of these organizations to
international donors and to offer less demanding grant scheme to support local civil society
organizations in their activities.
Be in communication with the local organizations, assist them in the advocacy vis‐à‐vis the
government.
It is recommended for the international organization and diplomatic missions which are active in the
target region to mainstream the problems identified in the research and include civil society
dimension in their work
Support election monitoring programs. It is highly recommended to conduct long‐term monitoring
projects at the local level.
In their donor work mainstream ethnic minority issues with emphasis on development of remote
and rural locations.
Support media initiatives suggested in this recommendations in the media part.
5.5 To Political parties
Political parties including their local representatives, are seen by ethnic Armenians as one of the main
sources of frustration over elections.
Political parties need to work with local communities on daily basis. Among ethnic Armenians there
is an image of politicians who “come to see us just when need our votes”. In order to eliminate such
attitudes frequent communication with constituencies is very important.
60 | P a g e
Parties need to engage in confidence building activities with local communities. As the results of the
survey show, pre‐election meetings highly determine electoral preferences of the voters.
One of the key factors which determined electoral preferences was inclusion of ethnic minority
issues into the political programs of parties and candidates. Therefore, it should be in the very
interest of political parties to address minority integration in their programs.
It is highly recommended to include new generation and young politicians locally, as they have
better knowledge and are willing to contribute to the development of their region.
Except of the dominant political parties no active campaigns are run by the local politicians.
Therefore, most of the people are no informed about other parties than the main ones. Central
bodies of political parties need to engage in monitoring how effectively the local branches are
working in terms of informing the population on their programs.
Political party programs need to be translated into Armenian languages. Printed version (booklets)
of the programs are efficient, as the study found.
The concerned political parties need to appoint motivated local people as members of DECs and
PECs and train them regularly in order to avoid deviations from election standards.
It would be more appropriate if election observers from political parties are not from the same
locations.
Awareness of the local community problems had the second highest priority given by the
respondents. Therefore, parties need to study problems of the local communities.
Cooperate with the local media and other stakeholders to promote active discussion and dialogue
between the local representative of competing political parties
5.6 To Media Outlets
Media outlets should play an important role in popularization of election participation in the region.
Especially local media broadcasting in Armenian language, have advantages over the national broadcaster to
inform and motivate local communities to participate in elections.
Local TV channels/Radio are encouraged to cover electoral campaigns of local politicians and
political parties on daily basis.
Local media should act as monitor and evaluator of the work of current politicians and during the
pre‐election period assess the progress they have achieved based on their election program.
Analytical TV and Radio programs related to the political processes would highly contribute to the
popularization of election participation.
Talk‐shows with participation of local as well as national politicians would trigger interest toward
the election process. Media outlets would benefit from higher ratings due to the interest in the
politics by local population.
CEC and DEC administrations should also participate in talk shows.
Election debates between competing politicians, transmitted by local media, would serve as yet
another factor in motivating people to vote. It will make campaigns more transparent and political
battles from streets can be transferred to studios. The initiative is usually commercially beneficial for
media outlets. Other stakeholders, including CEC, donors should encourage them to do so.
Georgian Public Broadcaster as public service body, in cooperation with other stakeholders should
translate elections related programs into Armenian language.

61 | P a g e
All national TV channels should engage with local broadcasters to make their signal transmitted
locally with Armenian translation added. This would be mutually beneficial for both media acting
towards better integration of ethnic Armenians into Georgian political life. .
5.7 To civil society Organizations
Civil society organization are quite effectively working on civic culture development in the region. However,
there are still aspects which can be improved:
As the survey shows, 41% of the respondents have not heard about CSO at all in their proximities.
This is highly determined by short coverage of the NGO activities, which primarily concentrates on
regional centers and urban areas, while leaving out the rural population. Tbilisi based organizations
need to be more inclusive and cover distant villages and settlements.
CSOs need to prioritize to work with beneficiaries from different age groups. As the study show, the
younger generation (18‐27) has much better standing in developing civic qualities, while the other
groups are highly lagging behind in that regard. It is very important for the CSO to also work with
middle‐ aged and older population. Women need to be targeted as well.
Within their work in the target region CSOs should mainstream the election related capacity
development and raising awareness activities.
Local organizations should apply with project proposals to the governmental and state funds.
Involvement in competitions such as one run by the ”Elections Center” is crucially important as they
have advantage of being close to their beneficiaries than the organizations based elsewhere.
Local civil society organization need to be involved in advocacy campaigns in cooperation with other
counterparts and be part of coalitions, NGO fora and platforms.
Local CSOs need to actively work with local media in order to popularize their work and spread
information about the activities
CSOs need to engage with various donors in order to work on sustainability of their organizations.


![Pharmed management group inc. [pmmg] brochure](https://static.documents.pub/doc/80x56/55a8491d1a28abae108b4805/pharmed-management-group-inc-pmmg-brochure.jpg)

![PHARMED MANAGEMENT GROUP INC. [PMMG] - BROCHURE](https://static.documents.pub/doc/80x56/55c43d51bb61ebf86b8b457f/pharmed-management-group-inc-pmmg-brochure-55c449c91580f.jpg)


