BLOOD REACTION AND BLOOD GASES IN PNEUMONIA A. B. Hastings, … , H. J. Morgan, C. A. L. Binger J Clin Invest. 1924; 1(1):25-45. https://doi.org/10.1172/JCI100003. Research Article Find the latest version: http://jci.me/100003-pdf
BLOODREACTION AND BLOODGASES IN PNEUMONIABY A. B. HASTINGS, J. M. NEILL, H. J. MORGAN,ANDC. A. L. BINGER
(From the Hospital of The Rockefeller Institute, New York)
(Received for publication, July 3, 1924)
Peabody in 1912 (1) published a paper on the metabolism in pneu-monia, in which he reviewed the previous literature and studied amongother factors the blood gases and acid-base balance. Since Peabody,a number of other investigators have studied the blood gases and thequestion of the existence and importance of acidosis in pneumonia.The present paper is a report of observations on these subjects, inwhich recently developed methods have made possible the attain-ment of more complete results and apparently have justified the draw-ing of deductions more definite in some respects than those attain-able from previous data.
Peabody stated that "the high excretion of ammonia and the low excretion ofsodium chloride are two of the most characteristic features of the urine duringfever. The diminution of the carbon dioxide of the blood is apparently a constantaccompaniment of fever." These results indicated a shift of some degree towardsacidosis in the acid-base balance, but whether it was sufficient to be of clinicalsignificance was at the time uncertain. Peabody states, "The evidence pointsagainst the theory that the retention of sodium chloride in fever depends onacidosis ... In diabetic acidosis and in experimental poisoning bymineral acids there is not a retention of bases as there is in pneumonia." Inthe gases of the venous blood much greater variations in oxygen than in carbondioxide were found.
Palmer (2) found that, although considerable amounts of a very weak unknownorganic acid could be titrated in the urine in certain severe cases of pneumonia,the alkali reserve of the venous blood plasma, as determined by the CO2capacitymethod of Van Slyke and Cullen (3) was uniformly normal or nearly so. Acidosisof metabolic origin was consequently excluded.
Stillman, Van Slyke, Cullen, and Fitz, (4), in a series of acidosis cases of whichthe rest were diabetic, published protocols on one case with a greatly diminishedplasma CO2capacity in acute nephritis after pneumonia. The alkali deficit, whichwas accompanied by an almost complete cessation of ammonia excretion (un-published data) was apparently due to the pneumonic nephritis. It disappearedas the kidney function and ammonia excretion improved.
25
BLOODREACTION AND' GASES IN PNEUMONIA
Stadie (5) and Stadie and Van Slyke (6) studied the oxygen content and capacityof the blood and the carbon dioxide content and capacity of the plasma in bothvenous and arterial blood of pneumonia patients. They confirmed Palmer'sobservation of normal alkali reserve as indicated by the CO2capacities. From thegas contents of the blood they observed that "even when pulmonary conditionsin pneumonia become so involved that the arterial blood is incompletely oxygen-ated, the arterial and venous carbon dioxide values are not increased above theusual normal levels." There was no evidence of pulmonary CO2 retention.
The data up to this point (1920) indicate that an acidosis ofmetabolic origin, such as would result in an alkali deficit in the body,is a rarity in pneumonia. Because the data do not include eitherdeterminations of the CO2tension in the blood, or of the pH from whichthe CO2 tensions can be estimated, they do not exclude the possi-bility of a CO2acidosis, due to hindrance in the evolution of CO2 fromthe pathologically involved lungs) although the combined determina-tions of CO2content and CO2capacity by Stadie and Van Slyke madea CO2 retention appear improbable.
Barach, Means and Woodwell (7) in 1922 estimated the pH of the arterial andvenous blood in pneumonia by interpolation on the CO2 absorption curve, cor-rected for the observed oxygen unsaturation. They found the alkali reserve nor-mal or slightly subnormal. In 3 of 10 patients, however, a low pH was observedwhich rose to normal after the crisis, the alkali reserve showing appreciable riseat the same time, although it had not been seriously lowered. The results indi-cated the possibility of a tendency towards both alkali deficit and lowered pH insome cases, and the authors suggested the use of alkali therapy in such casess
Binger, Hastings and Neill (8), however, found that the continued use of evenmoderate amounts of bicarbonate in a case of pneumonia with somewhat dimin-ished salt excreting power led to a dangerous alkalosis and edema, due to apparentinability to excrete the alkali.
It seemed advisable to make further observations on the bloodchanges in pneumonia patients, the more so because at the time ofthe work of Barach, Means and Woodwell, the colorimetric pHmethodfor blood was not available, and their pH values were determined bya method which makes such demands on technique that a certain pro-portion of irregular results is difficult to avoid. Thirty observationsof the pH and CO2content, and 22 observations of the oxygen contentand oxygen capacity of the arterial blood have accordingly beenmade on 16 patients.
26
HASTINGS, NEILL, MORGAN,AND BINGER
In our observations the gases were determined on the Van Slyke(9) i nometric apparatus. The pH's were determined colori-metrically by Cullen's method (10),in all cases, electrometrically in12 cases, and by calculation from the CO2absorption curves in 2 cases.All precautions to collect and preserve the blood without change inits constituents were observed (Austin, Cullen, et al., 11).
THE pH DETERMINATIONS
Electrometric and colorimetric values.-In table 1 are given theresults of the colorimetric determinations of pH at 20°C. and the
TABLE 1
The difference between the electrometric pH at 38° and the colorimetric pH at 200 of thKearterial blood of pnumonia patients
Average ApH = 0.27.Average deviation = 0.03.Ma2imum deviation = 0.05.
electrometric determinations made on the same blood at 38°C. Theaverage difference, ApH, between these determinations is 0.27 pH.The difference for the blood of normal individuals was found by Cullento be 0.22 pH. This value has been confirmed in this laboratory.The reason for the difference between the ApH found for normalsand for pneumonia patients is unknown. The formula we have usedin the calculation of the blood pH at 38° from the colorimetric pHat 200 is
PH38oc = PH20oc - 0.27
Since there were rather wide differences in the temperatures of thepatients at the time the blood analyses were made, a correction was
27
BLOODREACTION AND GASES IN PNEUMONIA
applied to convert the pH at 380 to its corresponding value at the tem-perature of the patient. The temperature coefficient for the pH ofblood is not well established. Direct determinations of the electro-metric pH of serum at 380and 20° have indicated that the ApHper l°C.is approximately 0.01. This value has been used to correct the pH tothe temperature of the blood as drawn.
Recent determinations made in this laboratory indicate that bymaking the colorimetric pH determinations at the temperature of thepatient, the necessity for temperature correction is avoided (Hastingsand Sendroy, paper in press) but the technique for such determina-tions had not been developed when the present work was done.
TABLE 2
A comparison of ekectrometric, colorimetric and calculated pH's
Electrometric pHI Colorimetric pH Caladated pH
Normals
1 7.38 7.402 7.39 7.41 7.38
Pneumonia patients
9 7.44 7.4410 7.42 7.47 7.47
pH values calculated from the carbon dioxide absorption curve.Since the pH results of Barach, Means and Woodwell (7) were alldetermined by calculation from the carbon dioxide content and thecarbon dioxide tension, four experiments were performed in orderto compare values obtained thus with those obtained by direct elec-trometric or colorimetric determinations.
Two of the experiments were on the venous blood of normal indi-viduals and two were on the arterial blood of pneumonia patients.The comparisons between the pH values obtained by direct determina-tion and by calculation are given in table 2. The agreement is withinthe limits of error of the method employed. Since difficulty has beenexperienced in obtaining satisfactory agreement by these two methods,certain points which contributed to the success of our experimentsmay be mentioned.
28
HASTINGS, NEILL, MORGAN,AND BINGER
Comp ed alki ao
, i.,5XXiEwEE
O'lECm ngtedacOs_
zpOF
'00000s o>;~~~~Ms Ud aci do
7.30 7.40pH
7.507.20 'L60
FIG. 1. ACiD-BASE DETERMINATIONSONPNEUMONIAPATIENTS ARE PLOTTEDWITHPH AS ABSCISSAE ANDC02 CONTENTAS ORDINATES
Constant C02 tension lines run diagonally across the chart.' The shaded arearepresents the revised normal acid-base area of arterial blood. The point . isthe average of a number of normal arterial acid-base values obtained by Barrand his collaborators.
75
70
65
60
55
45
C:
0
g
00E0HP
40
35
30
29
25
30 BLOODREACTION AND GASES IN PNEUMONIA
TABL
A summary of the hydrogen ion concentrations and
I~~~~,~~~~~~~~~~~~~~Area of pulmonary I
~~~~~~~~~Organisminovm t at time flood xT Treatment
__________ _________ iiwasd_w_ _ _ _
1 4522 4-27-22 Pneumococcus. Type III
2 4597 10-17-22 Pneumococcus. Type I
Pneumococcus. Group IV
Pneumococcus. Group IV
4630111-15-221 Pneumococcus. Type m
12-12-22 Pneumococcus. Type m
I2-18-22 Pneumococcus. Type II
Pneumocus. Type I
Consolidation of left lowerlobe, and whole right lung
Consolidation of right middlelobe. Resolution of rightlower lobe
Consolidation of right middlelobe. Resolution of rightlower lobe
Consolidation of right middlelobe. Resolution of rightlower lobe
Consolidation of right middleand lower lobes
Consolidation of right middleand lower lobes
Consolidation of left upperlobe. Diffuse bronchiticrAles
Consolidation of left upperlobe. Diffuse bronchiticriles
Consolidation the same.Diffuse riles less
Consolidation the same.Diffuse rAles less
Consolidation of left upperlobe. Riles lft lower andright upper
Consolidation of left upperand lower, and right upperlobes
Consolidation of left upperand lower, and right upperlobes
Consolidation of right middleand lower lobes
Consolidation of left upperand lower. Diffuse bron-chitic riles
Consolidation of left upperand lower, and right upperlobes
9
8
14
15
4
9
5
8
9
10
4
5
6
5
5
6
11
6
10
5
12
18
12
6
6
Oxygen chamber
Oxygen chamber
Oxygen chamber
Oxygen chamber
Oxygen chamber
Oxygen by nasalcatheter
Antlpneumococcuserum
4619
4623
10-23-22
10-24-22
11- 5-22
11-10-22
11-10-22
11-13-22
11-14-22
11-15-12
1
2
3
4
5
6
7
8
9
10
11
12
13
14
15
16
3
4
5
6
7
.8
11-16-22
11-17-22
4648
4651
4657 12-29-22
HASTINGS, NEILL, MORGAN,AND BINGER
E 3
gas analyses of the arterial blood in pneumonia
kg|t| Arteral blood analys8
Remarks ] i | |COscontent I no
| Wholeblod Pla 6 8__ _~~~~- _ 6 9
co 94)~~~mm
Respirations 58 per minute.
Arterosclerosis marked
Patient had received 600 cc.
Type I antipneumococcusSerum before bleeding.
Pneumococcus meningitis
Patient died suddenly when a-febrile and apparently con-valescent
Temperature normal for shortinterval only on 5th day ofdisease
Sterile pleural effusion. Righthydropneumothorax
Patient had received 400 occType I antipneunococserum before bleedin
°C.
38.9
38.8
38.5
38.1
38.7
37.7
39.6
38.8
38.1
37.3
39.6
39.0
37.8
39.7
39.3
39.6
7.45
7.45
7.46
7.33
7.45
7.37
7.42
7.43
7.41
7.46
7.47
7.36
7.37
7.42
7.41
7.46
mm
25.0
23.2
23.3
17.9
20.4
19.5
19.9
19.4
21.5
23.2
20.6
20.4
26.6
21.4
22.3
21.1
56.0
52.0
52.3
40.4
45.7
43.7
44.6
43.6
48.3
52.0
46.2
45.7
59.7
47.9
50.0
47.4
anVol.percost
MMb.Hg
45.2
43.8
42.7
42.9
38.1
42.3
39.6
38.2
43.1
41.2
45.9
46.2
58.2
44.0
46.8
37.2
mm
6.8
6.7
6.7
6.8
6.6
7.1
7.0
7.6
S.8
7.2
7.7
7.0
5.9
-Ol.percent
15.2
15.1
15.1
15.2
14.7
15.9
15.6
17.0
13.1
16.2
17.2
15.6
13.3
mx
7.3
8.2
8.3
7.8
7.2
7.8
8.6
8.2
8.9
9.2
6.6
wIt.percet
16.4
18.4
92.7
82.1
18.6 1 81.2
17.5 84.0
16.2
17.5
19.2
18.4
19.9
20.6
14.7
96.4
97.2
68.2
88.1
86.5
75.8
9. 5
31
Sol.
32 BLOODREACTION AND GASES IN PNEUMONIA
The blood was treated with one per cent neutral sodium fluorideas well as potassium oxalate which, as Lovatt Evans (12) has shown,inhibits acid fonnation during the period of saturation. Further,
TABLE 3
Area of palmonm. _ __Organism involvement at tfimelood f J Treatment
17 12-30-22 Consolidation of left upper 7 12 Serum. Oxygen byand lower, and right upper nasal catheterlobes
18 9 4671 1-19-23 Pneumococcus. Group IV Consolidation of right middle 5 6and lower lobes
19 1-23-23 Consolidation of right middle 7 6and lower lobes
20 10 4670 1-20-23 Pneumococcus. Group IV Consolidation of right upper 4 6lobe
21 11 4691 2- 7-23 Pneumoccus. Group IV. Consolidation right lower 9 26Streptococcus hemo- lobe. Right pleural effu-lyticus sion. Riles over left lower
lobe22 12 4690 2- 7-23 Pneumococcus. Group IV Consolidation of right lower 5 6
lobe23 13 4708 3- 1-23 Pneumococcus. Type II Consolidation of left lower 7 11
lobe24 3- 6-23 Consolidation of left lower 12
lobe25 14 4710 3- 2-23 Pneumococcus. Group IV Consolidation of right middle 4 8
and lower lobes26 3- 7-23 Signs of resolution over en- 9
tire right lung27 15 4715 3- 6-23 Pneumococcus. Group IV. Consolidation of right middle 3 9
and lower lobes28 3- 7-23 Consolidation of right middle 4
and lower lobes29 3-14-23 Resolution of right middle 11
and lower lobes30 16 4729 3-27-23 Pneumococcus. Group IV Consolidation of whole right 7 7 Oxygen by naso
lung and left lower lobe. catheterDiffuse bronchitic riles.
eindicates electrometric determination.
the CO2 saturation curves were determined on b,oth the reduced andoxygenated blood, thereby permitting the proper correction to bemade for the unsaturation of the blood. Finally, the pK' used in
HIASTINGS, NEILL, MORGAN,AND BINGER 33
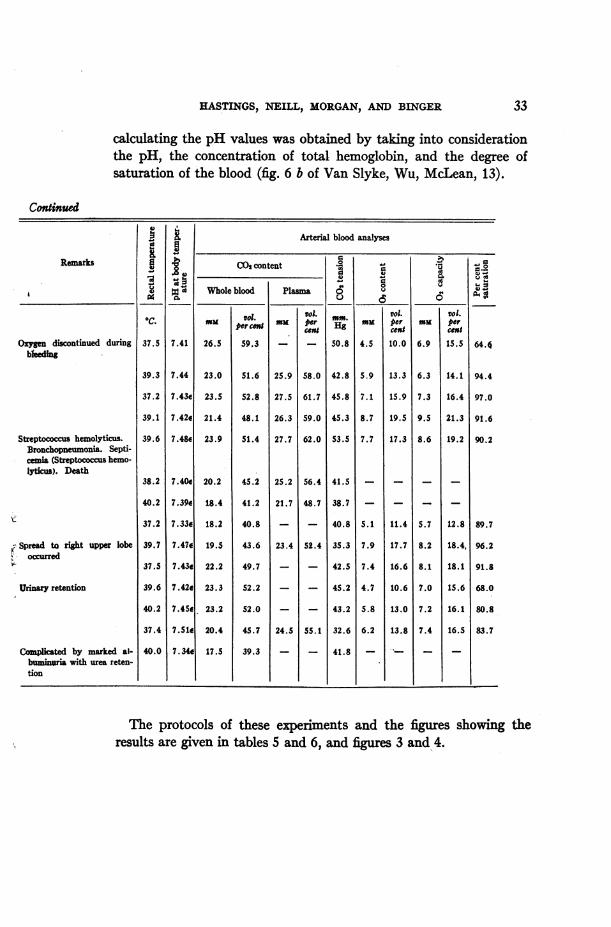
calculating the pH values was obtained by taking into considerationthe pH, the concentration of total hemoglobin, and the degree ofsaturation of the blood (fig. 6 b of Van Slyke, Wu, McLean, 13).
Continued
Remarks
Oxygen discontinued duringbleeding
Streptococcus hemolyticus.Bronchopneumonia. Septi-cemia (Streptocccus hemo-lytc). Death
Spread to right upper lobeoccurred
Urinary retention
Compiated by marked al-buminuria with urea reten-tion
a8
KIco
-.
tlx
cc.
37.5
39.3
37.2
39.1
39.6
38.2
40.2
37.2
39.7
37.5
39.6
40.2
37.4
40.0
7.41
7.44
7.43e
7.42e
7 .48e
7 .40e
7.39e
7. 33e
7.47e
7.43e
7.42e
7.45e
7.5le
7. 34e
Arterial blood analyses
COs content . 2 .0 ,,
Whole blood Plasma 8 oU~ ~~ ~ ~~~d5 05 A._
mm
26.5
23.0
23.5
21.4
23.9
20.2
18.4
18.2
19.5
22.2
23.3
23.2
20.4
17.5
Vol.percew
59.3
51.6
52.8
48.1
51.4
45.2
41.2
40.8
43.6
49.7
52.2
52.0
45.7
39.3
mm
25.9
27.5
26.3
27.7
Vol.percent
58.0
61.7
59.0
62.0
25.2 56.4
21.7 48.7
23.4 52.4
24.5 55.1
mm.Hg
50.8
42.8
45.8
45.3
53.5
41.5
38.7
40.8
35.3
42.5
45.2
43.2
32.6
41.8
mm
4.5
5.9
7.1
8.7
7.7
5.1
7.9
7.4
4.7
5.8
6.2
vol.percent10.0
13.3
15.9
19.5
17.3
11.4
17.7
16.6
10.6
13.0
13.8
mm
6.9
6.3
7.3
9.5
8.6
5.7
8.2
8.1
7.0
7.2
7.4
Vol.percent
15.5
14.1
16.4
21.3
19.2
12.8
18.4,
18.1
15.6
16.1
16.5
64.4
94.4
97.0
91.6
90.2
89.7
96.2
91.8
68.0
80.8
83.7
The protocols of these experiments and the figures showing theresults are given in tables 5 and 6, and figures 3 and, 4.
IL0a
I*0
ON
1 4)
d
tRd
BLOODREACTION AND GASESIN PNEUMONIA
RESULTS
The experimental results are collected in table 3 and are graph-ically shown in the acid-base diagram, figure 1.
The pH of the blood. Among the 30 observations on pneumoniapatients there was no pHlower than 7.30 or higher than 7.50. (Whereboth colorinetric and electrometric values were available, the latterwere taken as the more accurate.) Since the pH limits of 7.30 and7.50 for normals have been confirmed in this laboratory, it may besaid that no pneumonia patient studied by us had a pH definitelyoutside the normal limits. Certainly there was no case of uncom-pensated acidosis among them.
The CO2 content of the blood. Values of the CO2 content of ar-terial blood of normal resting individuals have been determined byBarr (14). The average of these determinations is 22 millimols perliter (49.4 volumes per cent).
The CO2contents of the blood of the pneumonia patients are aboutequally distributed on either side of the mean line. Except for threehigh and three low values they lie within the original limits of thenormal area outlined by Van Slyke (15). Some of these cases re-quire special mention. Of the low ones, No. 2 had a pneumococcusmeningitis and died three days later; No. 16 was complicated by ne-phritis and died the day the observation was made; No. 13 was afe-brile at the time of the analyses. Of the high points, No. 5 was mori-bund and died on the day of the observation; No. 8 had been havingoxygen therapy by nasal catheter. The.fact that this was discon-tinued during the bleeding may have contributed to the markedunsaturation of the blood.
It is concluded from determinations of CO2 content taken in con-junction with those of the pH, that an acidosis, either compensatedor uncompensated, is rarely, if ever, encountered in pneumonia un-complicated by other abnormal conditions.
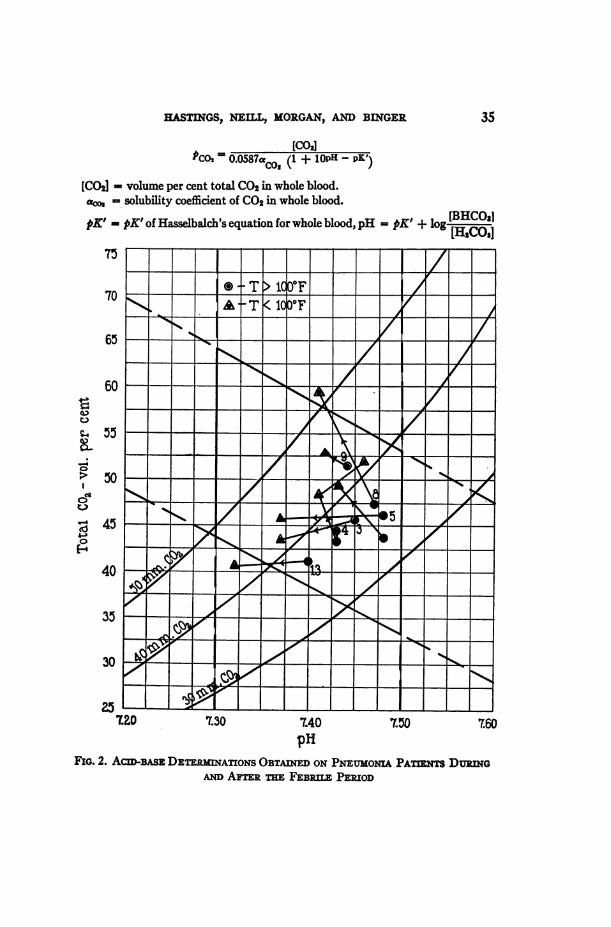
The CO2 tension. Twenty-five of the thirty arterial CO2 tensions,calculated from the serum pH and CO2 content, were within the 35to 45 mm. iso-pressure lines of figure 1. The CO2 tension was calcu-lated from the CO2 content and plasma pH by formula 5 in table 4of Austin et al. (11), viz.:
34
HASTINGS, NEILL, MORGAN,AND BINGER 35
[COJ=co 0.0587aco (1 + lOPH - pK')
[COCJ volume per cent total CO2in whole blood.aco, solubility coefficient of CO2 in whole blood.
p pK' of Hasselbalch's equation for whole blood, pH pK' + log [BHCOs]Th.
@T1F70
A T < 10F
65
60
35
7.20 7.30 7.40 7.50 7.60pH
FIG. 2. Acm-BASEDETERMIATIONSOBTAINEDONPNEuoNI PATINS DuRNGANDwAPTERTE FEBRILER PERIOD
36 BLOODREACTION AND GASES IN PNEUMONA
The value of aco, was estimated to be proportional to the watercontent of the blood (13). The water content, 'for blood of varyinghemoglobin content, is calculated from Equation 30 of Van Slyke,Wu, and McLean, (13) as
cc. H20 per cc. blood = 0.94 - 0.0067 Hb
32--.-- II I30--- --
28--- - ---
24 -- - --
D4-gYW X
.4- - 0-.72 73 7.4 7.5
pHs
7. 7.7
FIG. 3. JANUARY9, 1923. CO2 ABSORPTIONCURVESOF OXYGENATEDAND RE-DUCEDBLOODOF A NORMALINDIvDUAL PLOMDWITH pH AS
ABSCISSAEAND CO2 CONTENTAS ORDINATESThe point within the o represents the acid-base balance of the venous blood as
drawn determined by the CO2content and degree of unsaturation. The pH thusestimated is 7.40; as determined colorimetricallv, 7.38.
Hb = hemoglobin content of blood in volume per cent of oxygencapacity. (The constants in their equation are here altered to changethe H20 from terms of weight to those of volume, and the Hb from
terms of millimols to those of volumes per cent oxygen capacity.)
00L-
H
£S46
HASTINGS, NEILL, MORGAN,AND BINGER 37
Since the solubility coefficient of CO2for water is 0.555, the coefficientfor blood is estimated as
aCO2 = 0.555 (0.94 - 0.0067 Hb)
The pK' value for whole blood, as shown by Warburg (16) by VanSlyke, Wu, and McLean (13) and by Peters, Bulger, and Eisemann
30O
7.3
wW2 CRS-e
leN~~~~~.
7.4 76
PHSFIG. 4. JANUARY25, 1923. CO2 ABSORPTIONCURVESOF OXYGENATEDANDRE-
DUCEDBLOODOF A NORMALINDIVIDUAL PLOTTEDWITH pH AS
ABSCISSAE ANDCO2 CONTENTAS ORDINATESThe point within the 0 represents the add-base balance of the venous blood as
drawn determined by the CO2content and degree of unsaturation. The pH thusestimated is 7.38; as determined colorimetrically 7.41; electrometrically, 7.39.
(17), is greater for whole blood than for plasma by an amount, ApK',dependent on the oxygen saturation, pH, and hemoglobin contentof the blood. Hence, for whole blood,
pK' pK's + ApK',
"' [
t-26
E24
8 22I-,
1s I
-xuI
rU 75
BLOODREACTION AND GASES IN PNEUMONIA
wherepK's = pK' for serum = 6.12
ApKX' is estimated from figure 6 b of Van Slyke, Wu, and McLean,with an added correction for oxygen unsaturation.
With the above values for a,,,, and pK' in whole blood, the formularelating , to [CO2] and pH. becomes,
The progress of the CO2 tension during the course of the diseaseis shown in eight cases in which dataduring and after the febrileperiodwere obtained. These results are shown in table 4 and figure 2. Itis seen that there is a lower CO2 tension during the febrile period thanafter. Whether this is the result of the increased temperature aloneor whether it had its onrgin in the local pulmonary lesion it is impossibleto say. Haggard (18) found that elevation of the body temperatureby immersion in hot baths was sufficient to lower the alveolar CO0tension and reduce the dissolved CO2 in the blood; but Fridericia(19) who studied the alveolar CO2 tension in febrile diseases, believes
38
HASTINGS, NEILL, MORGAN,AND BINGER
that increased temperature alone is insufficient to account for thelower tension. That anoxemia per se is not the causal agent in thelowered arterial CO2tension is suggested by the fact that the unsatura-tion of the arterial blood in some cases did not seem to be less in theperiod of low tension than in the subsequent afebrile period.
That the respiratory mechanism is unimpaired in its ability to main-tain a normal CO2 tension and blood reaction is evidenced by the fact
pHsFIG. 5. JANUARY 19, 1923. CO2 ABSORPTION CURVES OF OXYGENATEDAND
REDUCEDBLOODOF A PNEUMONIAPATIENT PLOTTEDWITH pH ASABSCISSAE AND CO2 CONTENTAS OPDINATES
The point within the o represents the acid-base balance of the arterial blood asdrawn determined by the CO2content and degree of unsaturation. The pH thusestimated is 7.44; as determined colorimetricallv, 7.44.
that in only 2 of the 30 analyses was the arterial CO2 tension foundabove 45 mm., and in no case was the pH below 7.30. There was notendency towards CO2 acidosis.
The effect of the lung changes in pneumonia on the oxygenationof the arterial blood on the other hand is significant. Of the 10 cases inwhich the oxygen saturation of the arterial blood was determined,
39
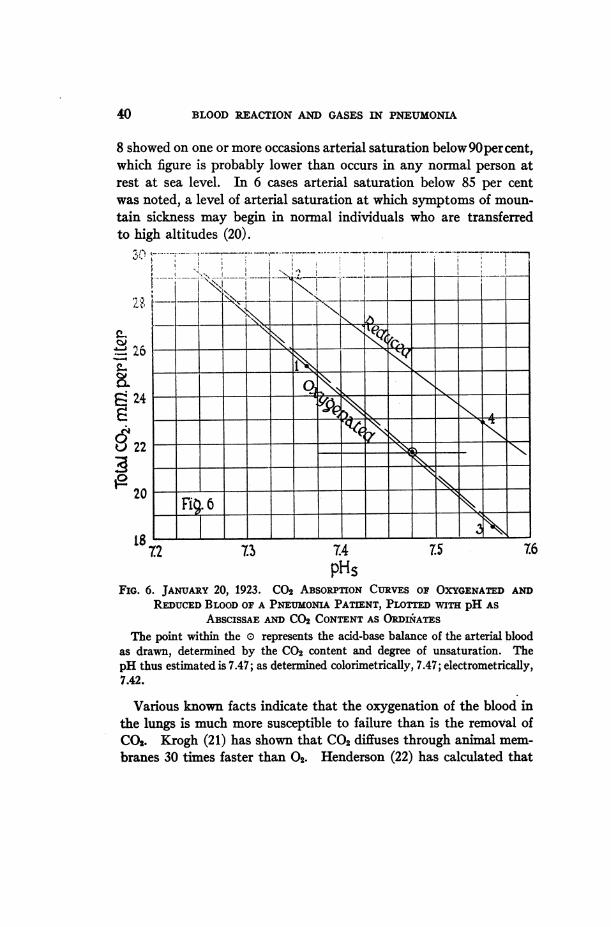
BLOODREACTION AND GASES IN PNEUMONIA
8 showed on one or more occasions arterial saturation below 90percent,which figure is probably lower than occurs in any normal person atrest at sea level. In 6 cases arterial saturation below 85 per centwas noted, a level of arterial saturation at which symptoms of moun-tain sickness may begin in normal individuals who are transferredto high altitudes (20).
4.
68:24
) 22
20
I I II~~~~~~~~~~~~I
Fig..6,p--..- -I--.-
"'72 73 7.4PHs
7.5 16
FiG. 6. JANUARY20, 1923. CO2 ABSORPnONCURVES OF OXYGENATEDANDREDUCEDBLOODOF A PNEUMONIAPATIENT, PLOTTEDWITH pH AS
ABSCISSAE AND CO2 CONTENTAS ORDIiATESThe point within the o represents the add-base balance of the arterial blood
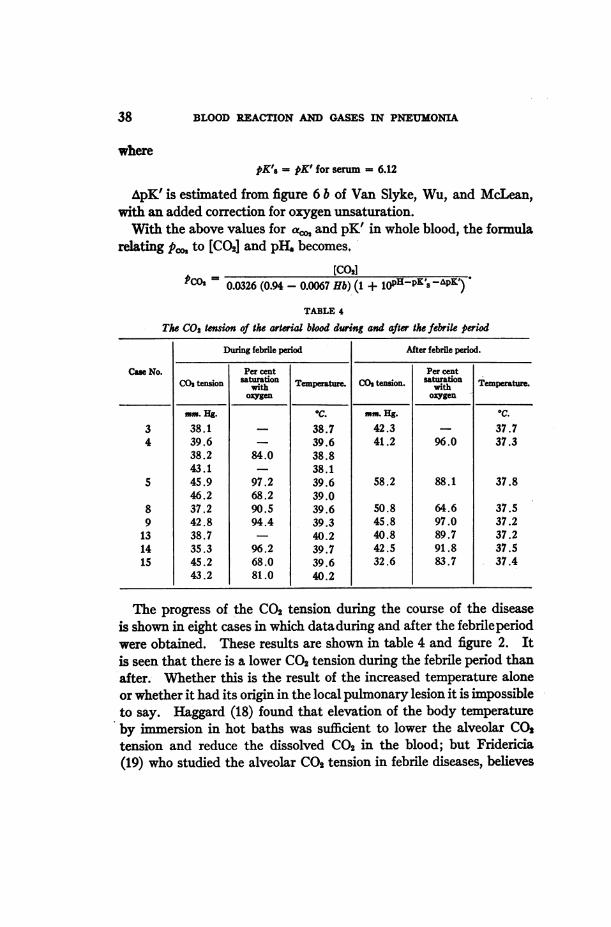
as drawn, determined by the CO2 content and degree of unsaturation. ThepH thus estimated is 7.47; as determined colorimetrically, 7.47; electrometrically,7.42.
Various known facts indicate that the oxygenation of the blood inthe lungs is much more susceptible to failure than is the removal ofCO2. Krogh (21) has shown that CO2 diffuses through animal mem-branes 30 times faster than 02. Henderson (22) has calculated that
40
It. !,)4;..
i 9
TABLE 5
A comparison of the pH of normal human blood determined directly and calcutd fromthe C02 saturation cures. Blood treated with 0.4 per cent K2C204 +
0.1 per cent NaF
Normal, No. 1.Date: January 9, 1924.
pK' = 6.12 + ApK'H2C0J = 0.0271 pCO2
Analysis of blood after saturation with definite C02 and 0s tensions.
the blood attains practically the CO2 tension of the alveolar air by thetime it has passed through about half the length of a lung capillary,while the arterial blood after traversing completely the pulmonarycapillaries still has an oxygen tension about 25 millimeters lower thanthe alveolar air. It has furthermore been shown by various observ-ers that the respiratory mechanism shows a relatively weak responseto oxygen lack as compared with that to carbon dioxide excess. Ac-cumulation of CO2 may cause a man to increase his ventilation perminute by 1000 per cent, while the maxumresponse to oxygen lackis about 50 per cent. Furthermore, if part of the lung area is cutoff from air, it is possible by over ventilation of the remainder to keepthe CO2tension of the mixed arterial blood down to normal; but sinceonly 20 volumes per cent of oxygen can be held by the average blood,it is not possible to overcharge one portion of the pulmonary bloodwith oxygen in order to compensate for under oxygenation in another.These considerations would lead to the conclusion that, in any indi-vidual breathing the ordinary atmosphere, respiratory hindrance mustresult in serious anoxemia long before C02 acidosis has become atall significant.
It will be noted in figures 1 and 2 that the shaded area indicated asnormal is bounded not only by normal pH and alkali reserve lines,but also by the 35 and 45 mm. C02 tension lines within which the al-veolar tensions of most normal individuals lie. It appears from re-sults at present available that respiration is stimulated by high CO2tension of itself, as well as by the high [H+] it may cause, and that thecondition found in the blood is a resultant of the two effects.
SUNInARY
1. A study has been made of the pH, CO2 content, CO2 tension,oxygen content, and oxygen capacity of the arterial blood in pneu-monia. The CO2 tension was calculated from the pH and CO2con-tent of the blood. The other values were all determined directly.
2. A comparison was made of colorimetric and electrometric pHvalues with values calculated from the CO2 absorption curves. Afair degree of consistency was obtained.
3. A lower arterial CO2 tension during the febrile period than afterthe return to normal temperature was noted in 7 cases. Oxygen
43
44- BLOODREACTION AND GASES IN PNEUMONIA
uinsaturation and lowered' CO2 tension do not occur together withsufficient regularity to indicate a causal relationship. Such relation-ship between temperature and CO2 tension seems more probable.
4. No tendency towards an acidosis of either metabolic or respira-tory origin was noted. The alkali reserve was within or near normali1mits in every case. The pH likewise was in each instance withinnormal limits, 7.30 to 7.50, with the greater number of observationsin the more alkaline half of this range.
5. These results contra-indicated alkali therapy in all the pneu-monia cases studied.
6. In 8 of the 10 cases in which the arterial oxygen saturation wasdetennined, an abnormally low saturation was observed at some stageof the disease. Taken with the non-occurrence of CO2acidosis, theseresults support the conclusion, made probable by known physiologicaland physico-chemical data, that when the mechanism for gas exchangein the lungs is affected absorption of oxygen fails before eliminationof carbon dioxide is significantly impaired.
BIBLIOGRAPHY
1. Peabody, F. W. Jour. Exp. Med., 1912, xvi, 701.2. Palmer, W. W. Jour. Exp. Med., 1917, xxvi, 495.3. Van Slyke, D. D., and Cullen, G. E. Jour. Biol. Chem., 1917, xxx, 289.4. StilUman, E., Van Slyke, D. D., Cullen, G. E., and Fitz, R. Jour. Biol.
Chem., 1917, xxx, 405.5. Stadie, W. C. Jour. Exp. Med., 1919, xxx, 215.6. Stadie, W. C., and Van Slyke, D. D. Jour. Biol. Chem., 1920, xli, 191.7. Barach, A. L., Means, J. H., and Woodwell, M. N. Jour. Biol. Chem.,
1922, 1, 413.8. Binger, C. A. L., Hastings, A. B., and Neill, J. M. Arch. Int. Med., 1923,
xxxi, 145.9. Van Slyke, D. D. Proc. Nat. Acad. Sc., 1921, vii, 229.
10. Cullen, G. E. Jour. Biol. Chem., 1922, lii, 501.t1. Austin, J. H., Cullen, G. E., Hastings, A. B., McLean, F. C., Peters, J. P.,
and Van Slyke, D. D. Jour. Biol. Chem., 1922, liv, 121.12. Evans, C. L. Jour. Physiol., 1922, lvi, 146.13. Van Slyke, D. D., Wu, H., and McLean, F. C. Jour. Biol. Chem., 1923,1vi, 765.14. Barr,D.P.,Himwich,H.E.,andGreen,R.P. Jour. Biol. Chem., 1923, lv, 495.15. Van Slyke, D. D. Jour. Biol. Chem., 1921, xlviii, 153.16. Warburg, E. Biochem. J., 1922, xvi, 153.
HASTINGS, NEILL, MORGAN,AND BINGER 45
17. Peters, J. P., Bulger, H. A., and Eisenman, A. J. Jour. Biol. Chem., 1923, lv,687.
18. Haggard, H. W. Jour. Biol. Chem., 1920, xliv, 131.19. Fridericia, L. S., and Olsen, 0. Deutsch. Arch. klin. Med., cvii, 236.20. Barcroft, J., Binger, C. A., Bock, A. V., Doggart, J. H., Forbes, H. S., Harrop,
G., Meakins, J. C., and Redfield, A. C. Trans. Roy. Soc. 1922, ccxi,(series B) 351.
21. Krogh, A. The anatomy and physiology of the capillaries. New Haven,1921.
22. Henderson, J. L., Bock, A. V.,Field,H.,andStoddard,J.L. Jour.Biol. Chem.1924, lix, 379.