GFA Envest, Germany The Development of this Manual has been co-financed within the framework of the International Climate Initiative of the German Federal Ministry for Environment, Nature Conservation and Nuclear Safety PoA CDM Manual Mini Biogas Plants for Households CD4CDM Working Paper Series WORKING PAPER NO. 8 August 2009
Transcript
GFA Envest, Germany
The Development of this Manual has been co-financed within the framework of the International Climate Initiative of the German Federal
Ministry for Environment, Nature Conservation and Nuclear Safety
PoA CDM Manual
Mini Biogas Plants for Households
CD4CDM Working Paper Series WORKING PAPER NO. 8 August 2009
PoA CDM Manual
“MINI BIOGAS PLANTS FOR HOUSEHOLDS”
DESIGNED WITHIN THE FRAMEWORK OF THE STUDY “POA CONCEPT DEVELOPMENT FOR THE USE OF BIOGAS INSTALLATIONS
IN SMALL AND MEDIUM SIZED PIG FARMS FOR A DECENTRALISED ENERGY SUPPLY IN VIETNAM”
Project supported by German Federal Ministry for the Environment, Nature
This manual has been developed by GFA ENVEST within the Study “PoA concept development for the use of biogas installations in
small and medium sized pig farms for a decentralized energy supply in Vietnam”, financed within the framework of the
International Climate Initiative of the German Federal Ministry for Environment, Nature Conservation and Nuclear Safety. The basis for the development of the Manual has been the PoA
Blueprint Book published by KfW (2009) whereby the topic of biogas for households is further elaborated.
A unique contribution came from the Netherland´s Development Organization (SNV), bringing in their experience from operating some of the largest biogas programmes in the world.
Authors
Blank Daniel
Brockmann Ksenia
Burian Martin
Foerster Elke
Kapor Zoran
2nd Version
September 2009
C O N T E N T
TABLE OF CONTENTS
CONTENT
LIST OF ABBREVIATIONS
1 INTRODUCTION 1
1.1 Objective of the manual 1
1.2 CDM Biogas projects 2 1.2.1 Overview of the existing biogas projects 2 1.2.2 Emission reduction from mini biogas installations
in a household 3
1.3 PoA vs. standard CDM approach 5
2 BIOGAS PROGRAMME FOR HOUSEHOLDS 10
2.1 Key components of a biogas programme for households 10
2.2 Technology of the mini biogas plants 14
2.3 Benefits of the biogas plant installation for households 16
2.4 Financial requirements 19
3 CDM POA BIOGAS PROGRAMME FOR HOUSEHOLDS 21
3.1 Timing 21
3.2 Key elements for PoA project structure 22
3.3 PoA project cycle and transaction costs 24
3.4 Selection of methodologies 26
3.5 Data collection and monitoring 30
3.6 Additionality 35
3.7 Optimizing benefits from carbon finance 36
3.8 Main obstacles in developing the PoA 39
4 CONCLUSIONS AND CHALLENGES 42
5 ANNEX 45
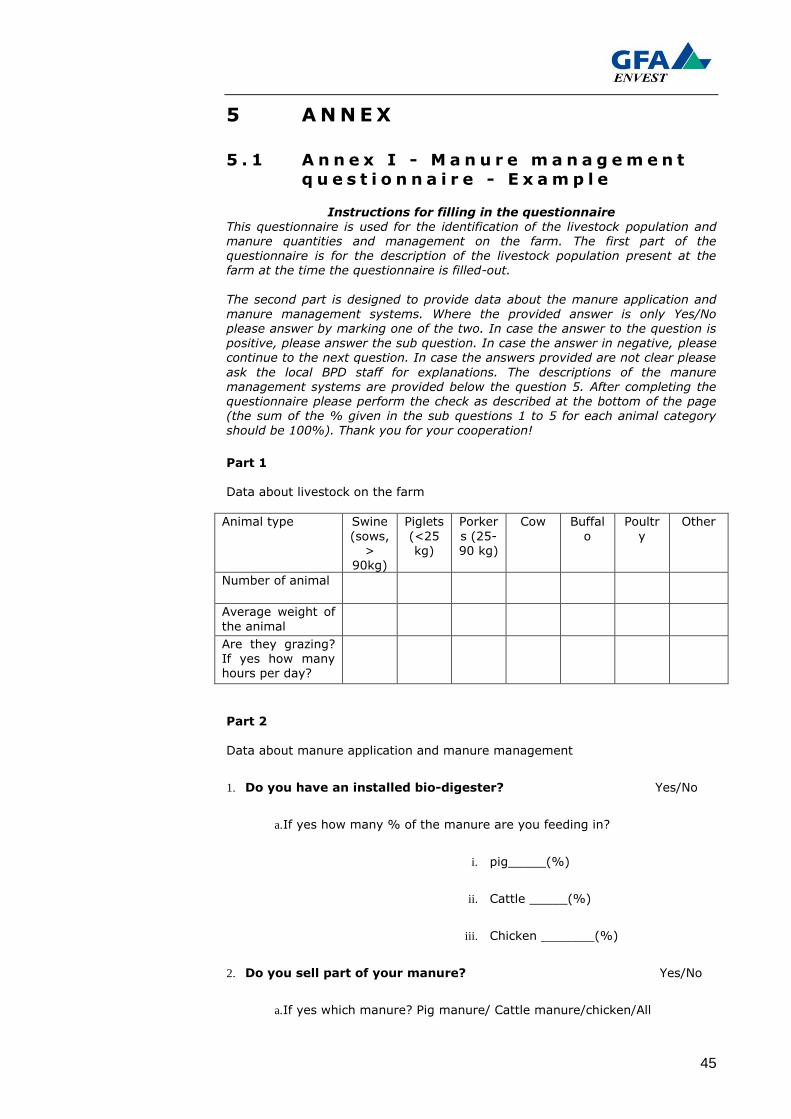
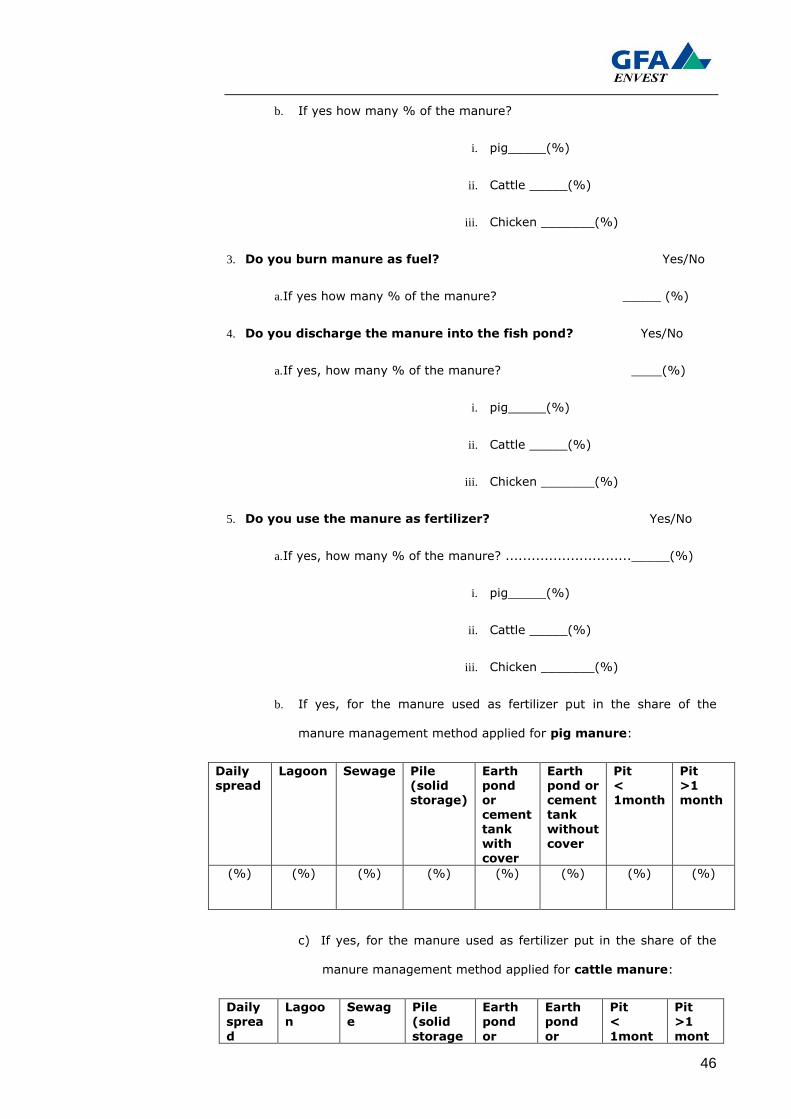
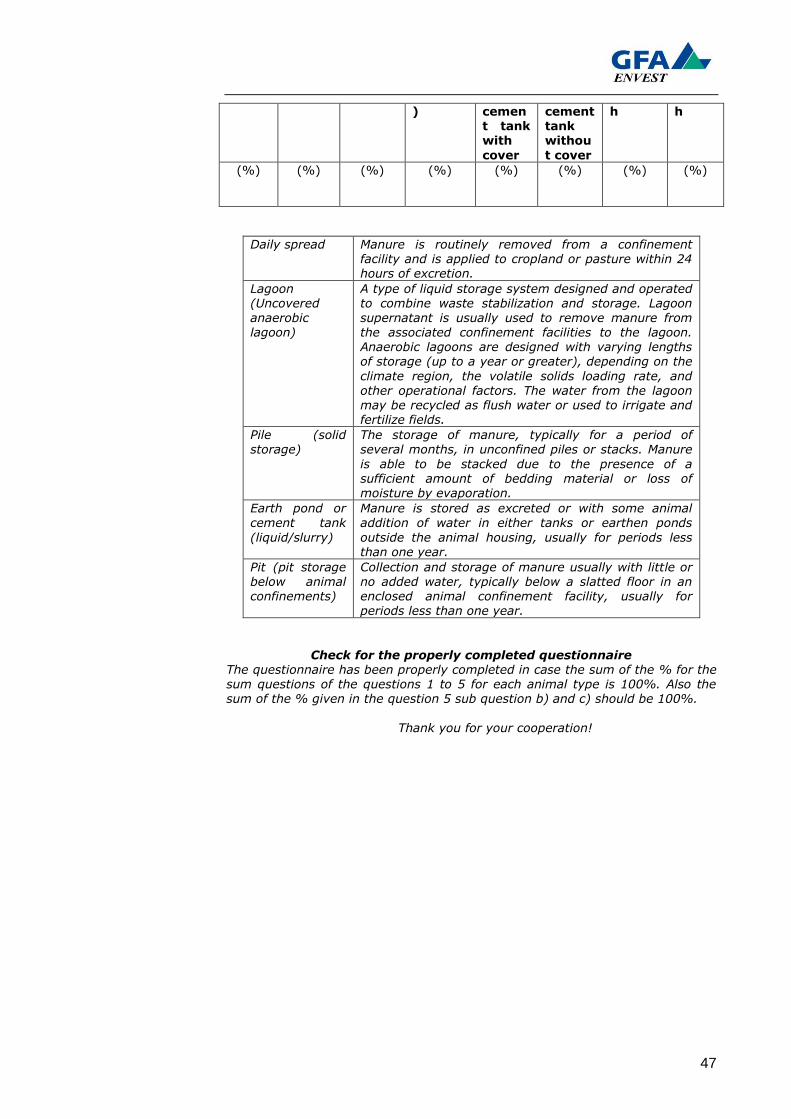
5.1 Annex I - Manure management questionnaire - Example 45
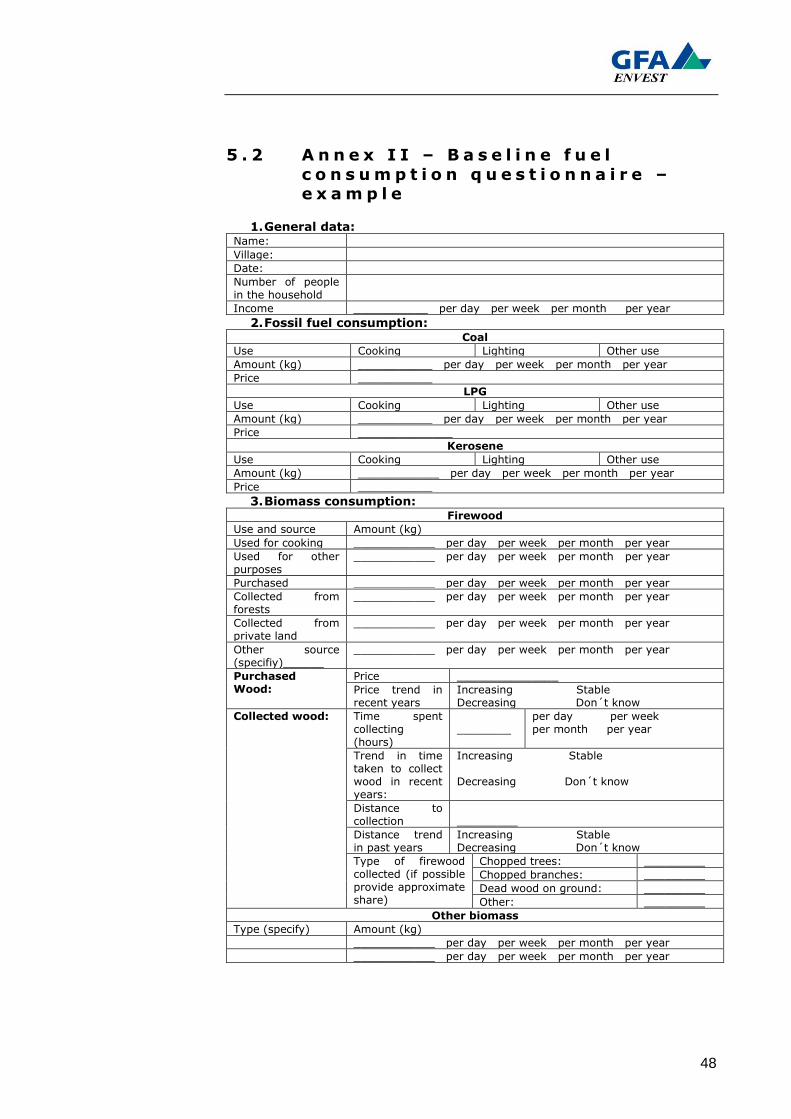
5.2 Annex II – Baseline fuel consumption questionnaire – example 48
6 LITERATURE 49
L I S T O F A B B R E V I A T I O N S
ADB Asian Development Bank
BP Biogas Program
BPD Biogas Program Division of the SNV Biogas Programme in Vietnam
BUS Biogas User Surveys
CDM Clean Development Mechanism
CDM EB CDM Executive Board
CNECB CDM National Executive and Consultative Board
CERs Certified Emission Reductions
CO2 Carbon Dioxide
COP Conference of the Parties to the UNFCCC
CPA-DD CDM Programme Activity Design Document
DGIS Directorate General for International Cooperation
DNA Designated National Authority
DOE Designated Operational Entity
ERPA Emission Reduction Purchase Agreement
EUR Euro
GEF Grid Emission Factor
GS Gold Standard
ICD International Cooperation Department
IRR Internal Rate of Return
LoA Letter of Approval
LoE Letter of Endorsement
ODA Official Development Assistance
NRB Non Renewable Biomass
OECD Organization of Economic Cooperation and Development
PDD Project Design Document
PIN Project Identification Note
PoA CDM Programme of Activities
PoA-DD PoA Design Document
SCUK Steering Committee for Implementing the UNFCCC
and Kyoto Protocol
SSC CDM Small Scale (Methodology/Project/PoA)
tCO2e Tons Carbon Dioxide Equivalents
UNFCCC
USD
United Nations Convention on Climate Change
US Dollar
VERs Verified Emission Reductions
VND Vietnamese Dong
1
1 I N T R O D U C T I O N
1 . 1 O b j e c t i v e o f t h e m a n u a l
The PoA CDM Manual “Mini biogas plants for households” has
been developed as part of the Study “PoA concept development for the use of biogas installations in small and medium sized pig
farms for a decentralized energy supply in Vietnam”, supported by the International Climate Protection Initiative of the German Federal Ministry for the Environment, Nature Conservation and
Nuclear Safety (BMU). The manual was designed based on the lessons learned during the study development, as well as on the
experience of one of the two largest biogas programmes of SNV, namely progammes in Nepal and in Vietnam. It further elaborates on the summarized discussion of the PoA approach provided in
the PoA Blueprint Book (KfW, 2009).
The objective of the manual is to support the development of biogas programmes as CDM PoA and to assist in determining the most suitable set-up for the biogas programme. Although hopes
are high towards the Programme of Activities approach bringing in micro size projects under the CDM mechanism, developers are
still facing numerous obstacles. In order to reach the critical number of participants, the biogas programmes for households often depend on a monetary incentive for the participants. The
high programme costs can only be partly reimbursed via the PoA carbon finance. However, the high risk involved with the lack of
experience with PoA approach and EB rules and procedures, presents a significant obstacle for its application. We hope that the lessons learned described in this manual will facilitate the
broader application of PoA.
2
1 . 2 C D M B i o g a s p r o j e c t s
1 . 2 . 1 O v e r v i e w o f t h e e x i s t i n g b i o g a s p r o j e c t s
The number of biogas projects that are under validation, requesting registration or registered is 516, or 11.6% of the CDM
projects (UNEP Risoe, March 2009). However, the highest number of biogas projects is concentrated in 5 countries, namely: Thailand, India, China, Malaysia and the Philippines.
Figure 1: Biogas projects in 8 countries that host together 85%
of the all biogas projects
Source: UNEP, Risoe, 2009
Most of the registered projects are situated on the commercial livestock farms and the main emission reduction takes place due
to the change of the manure management as well as from fuel switch in those cases where biogas is used for energy generation.
By installing the biogas unit the animal manure that was previously deposited in an open lagoon in the baseline scenario is fermented in the biogas digester and the methane emission is
avoided. The generated biogas can be either flared or used for energy generation. The average methane content of the biogas is
60-65% and the energy value 6-6.5 kWh/m3. Biogas can be used to replace fossil fuels for heating purposes, or for producing heat and electricity by introducing a CHP unit. Apart from the benefits
of replacing fossil fuels and improving the manure management system, the by-product after the fermentation of the manure is a
digestate (bio-slurry) which could be used as high nutrient organic fertilizer.
3
1 . 2 . 2 E m i s s i o n r e d u c t i o n f r o m m i n i
b i o g a s i n s t a l l a t i o n s i n a h o u s e h o l d
Domestic biogas installations reduce greenhouse gas (GHG) emissions in three ways: i) by changing the manure management modality; ii) by substituting fossil fuels and non-renewable
biomass for cooking (and to a smaller extent for lighting) with biogas, and; iii) by substituting chemical fertilizer with bio-slurry.
Figure 2: Schema of the GHG reduction by biogas plant
installation
Source: SNV, 2005
i) Emission reduction by change of manure management method depends on the method used before the biogas installation. Each manure management system is
characterised by the Methane Conversion Factor. The MCF defines the portion of methane production
potential. In general, in anaerobic conditions the MCF is higher than in aerobic systems with all its intermediary levels.
ii) The substitution of fossil fuels (so called “Fuel-
switch”) for cooking with biogas reduces the GHG emissions from fossil fuel consumption or electricity (partially) produced from fossil fuels. The amount of
emission reduction depends on the amount of fossil fuels replaced, and the type of fossil fuel replaced
Biogas & GHG reduction
Manure
handling
modality
Fossil- and
NRB fuel
substitution
Chemical
fertilizer
substitution
4
(decisive is the carbon intensity of the fuel type). In case biogas replaces grid electricity, e.g. by biogas
lamps, the emission reduction depends on the grid emission factor (calculated according to CDM
regulations). A part from the fossil fuels, biogas can also replace the non-renewable biomass and claim emission reductions.
iii) Substitution of chemical fertilizer with bio-slurry.
Bio-slurry is the by-product of biogas production and is a solid and fluid product of substrate decomposition in the fermenter. It can be applied as organic fertilizer and
thus replace mineral fertilizers. The substitution of mineral fertilizers entails an emission reduction, but due
to complicated monitoring this component is usually not taken into account in household biogas projects.
5
1 . 3 P o A v s . s t a n d a r d C D M a p p r o a c h
The Programmatic Approach was officially established in 2007 by the adoption of Guidelines and Procedures for PoA by the CDM EB. Due to high transaction costs small single CDM projects had
previously hardly been represented in the CDM portfolio. The PoA approach was designed in order to bring in the possibility for
small projects. With the PoA approach the project approval process for many individual activities that are distributed over space and time are brought together. The transaction costs for
small-scale CDM projects include: PDD development costs, validation costs, registration costs, monitoring, verification and
CERs issuance costs. Only the registration and CERs issuance (administration fee) costs are dependent on the project size (amount of generated CERs). Due to this fact, projects on micro
level, like household and small industry level are burdened with nearly the same transaction costs as other small scale projects.
One of the alternatives designed to lower the transaction costs in the standard CDM approach was bundling of projects. The differences between bundling and PoA approach will be elaborated
later in the text. A CDM PoA occurs at two levels: at the program level and at the
activity level. At the program level, the PoA is the organizational and financial framework that provides structure to the activities, and is managed by a coordinating entity for a period of no longer
than 28 years. At the program activity level, a single measure or a set of measures to reduce GHGs is applied to many
plants/installations of the same type over the time life of the Program. A CDM PoA is considered: “a voluntary coordinated action by a private or public entity which coordinates and
implements any policy/measure or stated goal (i.e., incentive schemes and voluntary programs), which leads to GHG emission
reductions or net GHG removals by sinks that are additional to any that would occur in the absence of the PoA, via an unlimited
number of CDM program activities (CPAs)” (Annex 38, EB32). On the other side, a CPA is more similar to a standard CDM project in the sense that both must comply with procedures and modalities
of the CDM and each must include an activity that has a direct, real and measurable impact on emission reductions. By definition
(Annex 38, EB32), a CPA is: “a single, or a set of interrelated measure(s), to reduce GHG emissions or result in net anthropogenic greenhouse gas removals by sinks, applied within
a designated area defined in the baseline methodology”.
6
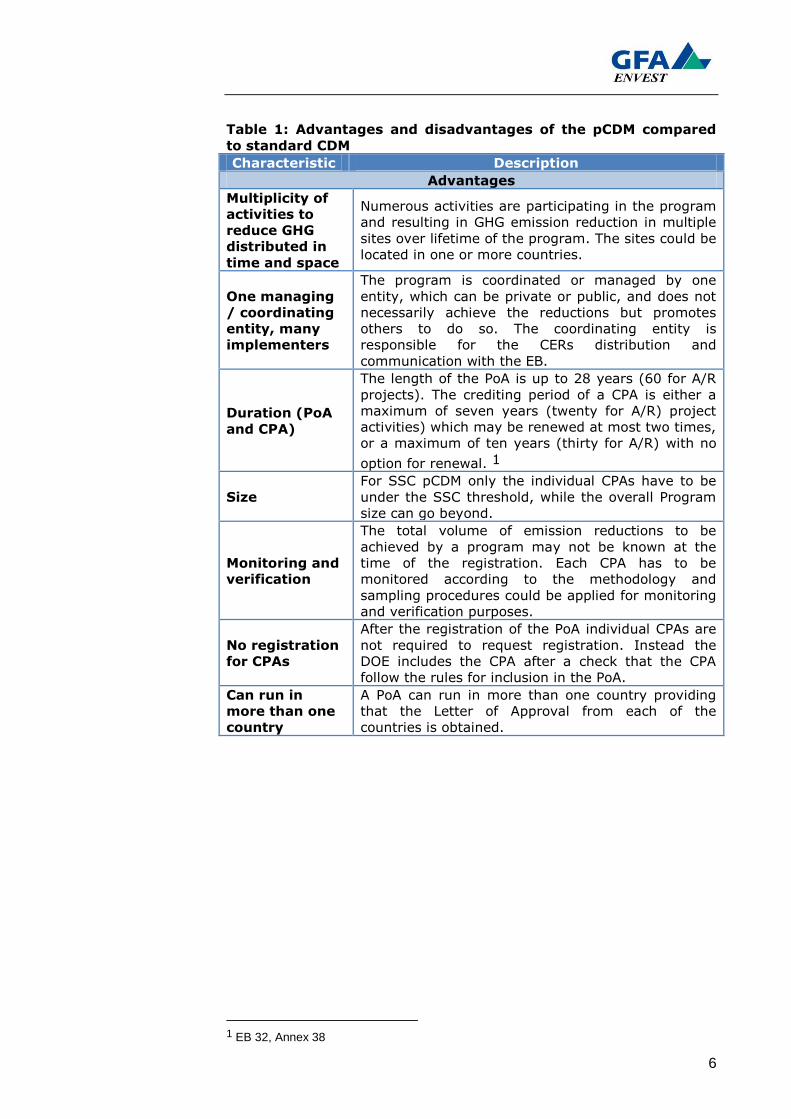
Table 1: Advantages and disadvantages of the pCDM compared
to standard CDM
Characteristic Description
Advantages
Multiplicity of
activities to
reduce GHG
distributed in
time and space
Numerous activities are participating in the program
and resulting in GHG emission reduction in multiple
sites over lifetime of the program. The sites could be
located in one or more countries.
One managing
/ coordinating
entity, many
implementers
The program is coordinated or managed by one
entity, which can be private or public, and does not
necessarily achieve the reductions but promotes
others to do so. The coordinating entity is
responsible for the CERs distribution and
communication with the EB.
Duration (PoA
and CPA)
The length of the PoA is up to 28 years (60 for A/R
projects). The crediting period of a CPA is either a
maximum of seven years (twenty for A/R) project
activities) which may be renewed at most two times,
or a maximum of ten years (thirty for A/R) with no
option for renewal. 1
Size
For SSC pCDM only the individual CPAs have to be
under the SSC threshold, while the overall Program
size can go beyond.
Monitoring and
verification
The total volume of emission reductions to be
achieved by a program may not be known at the
time of the registration. Each CPA has to be
monitored according to the methodology and
sampling procedures could be applied for monitoring
and verification purposes.
No registration
for CPAs
After the registration of the PoA individual CPAs are
not required to request registration. Instead the
DOE includes the CPA after a check that the CPA
follow the rules for inclusion in the PoA.
Can run in
more than one
country
A PoA can run in more than one country providing
that the Letter of Approval from each of the
countries is obtained.
1 EB 32, Annex 38
7
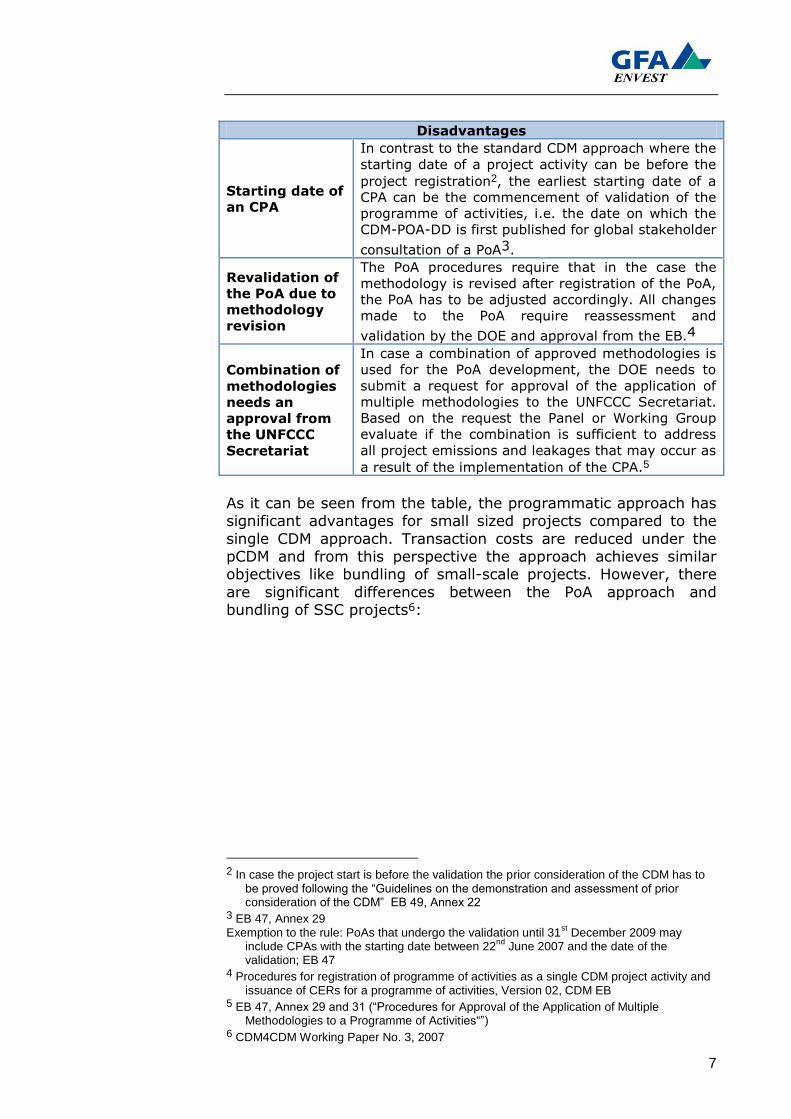
Disadvantages
Starting date of
an CPA
In contrast to the standard CDM approach where the
starting date of a project activity can be before the
project registration2, the earliest starting date of a
CPA can be the commencement of validation of the
programme of activities, i.e. the date on which the
CDM-POA-DD is first published for global stakeholder
consultation of a PoA3.
Revalidation of
the PoA due to
methodology
revision
The PoA procedures require that in the case the
methodology is revised after registration of the PoA,
the PoA has to be adjusted accordingly. All changes
made to the PoA require reassessment and
validation by the DOE and approval from the EB.4
Combination of
methodologies
needs an
approval from
the UNFCCC
Secretariat
In case a combination of approved methodologies is
used for the PoA development, the DOE needs to
submit a request for approval of the application of
multiple methodologies to the UNFCCC Secretariat.
Based on the request the Panel or Working Group
evaluate if the combination is sufficient to address
all project emissions and leakages that may occur as
a result of the implementation of the CPA.5
As it can be seen from the table, the programmatic approach has significant advantages for small sized projects compared to the
single CDM approach. Transaction costs are reduced under the pCDM and from this perspective the approach achieves similar objectives like bundling of small-scale projects. However, there
are significant differences between the PoA approach and bundling of SSC projects6:
2 In case the project start is before the validation the prior consideration of the CDM has to
be proved following the “Guidelines on the demonstration and assessment of prior consideration of the CDM” EB 49, Annex 22
3 EB 47, Annex 29 Exemption to the rule: PoAs that undergo the validation until 31
st December 2009 may
include CPAs with the starting date between 22nd
June 2007 and the date of the validation; EB 47
4 Procedures for registration of programme of activities as a single CDM project activity and issuance of CERs for a programme of activities, Version 02, CDM EB
5 EB 47, Annex 29 and 31 (“Procedures for Approval of the Application of Multiple Methodologies to a Programme of Activities“”)
6 CDM4CDM Working Paper No. 3, 2007
8
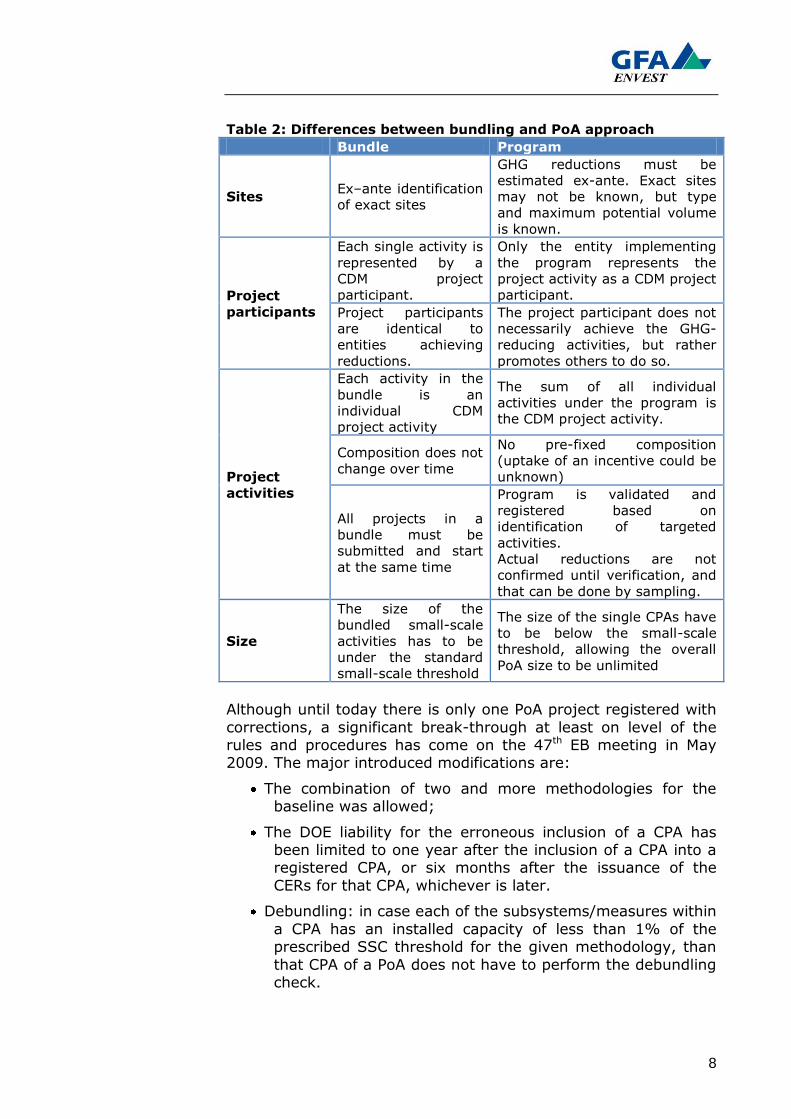
Table 2: Differences between bundling and PoA approach
Bundle Program
Sites Ex–ante identification
of exact sites
GHG reductions must be
estimated ex-ante. Exact sites
may not be known, but type
and maximum potential volume
is known.
Project
participants
Each single activity is
represented by a
CDM project
participant.
Only the entity implementing
the program represents the
project activity as a CDM project
participant.
Project participants
are identical to
entities achieving
reductions.
The project participant does not
necessarily achieve the GHG-
reducing activities, but rather
promotes others to do so.
Project
activities
Each activity in the
bundle is an
individual CDM
project activity
The sum of all individual
activities under the program is
the CDM project activity.
Composition does not
change over time
No pre-fixed composition
(uptake of an incentive could be
unknown)
All projects in a
bundle must be
submitted and start
at the same time
Program is validated and
registered based on
identification of targeted
activities.
Actual reductions are not
confirmed until verification, and
that can be done by sampling.
Size
The size of the
bundled small-scale
activities has to be
under the standard
small-scale threshold
The size of the single CPAs have
to be below the small-scale
threshold, allowing the overall
PoA size to be unlimited
Although until today there is only one PoA project registered with
corrections, a significant break-through at least on level of the rules and procedures has come on the 47th EB meeting in May 2009. The major introduced modifications are:
The combination of two and more methodologies for the baseline was allowed;
The DOE liability for the erroneous inclusion of a CPA has been limited to one year after the inclusion of a CPA into a registered CPA, or six months after the issuance of the
CERs for that CPA, whichever is later.
Debundling: in case each of the subsystems/measures within
a CPA has an installed capacity of less than 1% of the prescribed SSC threshold for the given methodology, than
that CPA of a PoA does not have to perform the debundling check.
9
At the time of writing this manual eleven PoA projects were under validation and one has been registered with corrections 7:
Table 3: PoA CDM project under validation and requesting
registration
Project name Country
Under validation
Installation of Solar Home Systems in Bangladesh Bangladesh
Methane capture and combustion from Animal
Waste Management System (AWMS) of the 3S
Program farms of the Sadia Institute
Brazil
New Energies Commercial Solar Water Heating
Programme in South Africa
South Africa
Uganda Municipal Waste Compost Programme Uganda
Promotion of Energy-Efficient lighting using
Compact Fluorescent Light Bulbs in rural areas in
Senegal
Senegal
Masca Small Hydro Programme Honduras
Solar Water Heater Programme in Tunisia Tunisia
Energy Saving Renovation Programme at Instant
Coffee Production Factories of Dongsuh Foods
Corporation in Korea
South Korea
Installing Solar Water Heating Systems in the
South of Viet Nam
Vietnam
Hydraulic rams for irrigation and domestic water
supply in Zhejiang, China
China
CFL lighting scheme – “Bachat Lamp Yojana” India
Registered with corrections
CUIDEMOS Mexico (Campana De Uso Intelegente
De Energia Mexico) – Smart Use of Energy Mexico
Mexico
7 UNEP Risoe, August 2009
10
2 B I O G A S P R O G R A M M E F O R H O U S E H O L D S
2 . 1 K e y c o m p o n e n t s o f a b i o g a s p r o g r a m m e f o r h o u s e h o l d s
In order to set-up a sustainable biogas programme for households the maximum of institutional capacities available in
the programme‟s geographical activity area (e.g. country) has to be mobilized. The goal of the programme is to promote the
dissemination of biodigesters that utilize manure at household level and/or to reduce the utilization of fossil fuels, finally establishing a developed, sustainable and commercial biogas
sector. The first step is the participatory assessment of the potential
demand for interventions of third parties and of possible constraints faced by service suppliers. Based on the results a
national programme can be outlined, together with objectives, targets, institutional arrangements, costs and financing (SNV,
2009). The programme has to be designed accordingly in order to
overcome the barriers that prevent dissemination of biodigesters in households8:
Initial costs barrier – provision of subsidy to lower the initial investment costs (could be in combination with a
microcredit). Technological barrier – the design of the biodigester
has to be adjusted to the needs of the participants. Also
the quality standard has to be implemented and training for the users about the biogas operation provided.
Information/behavior barrier – information about the benefits of the biogas, awareness raising and promotion
is required. The technology has to be selected together with the
biodigester (component) producer(s) in order to ensure quality standards. High and constant quality is quite a decisive factor
since the living time of a programme is typically long. These quality standards should also be defined for adjacent
equipment like stoves or biogas lamps.
8 PoA Blueprint book, KfW 2009
11
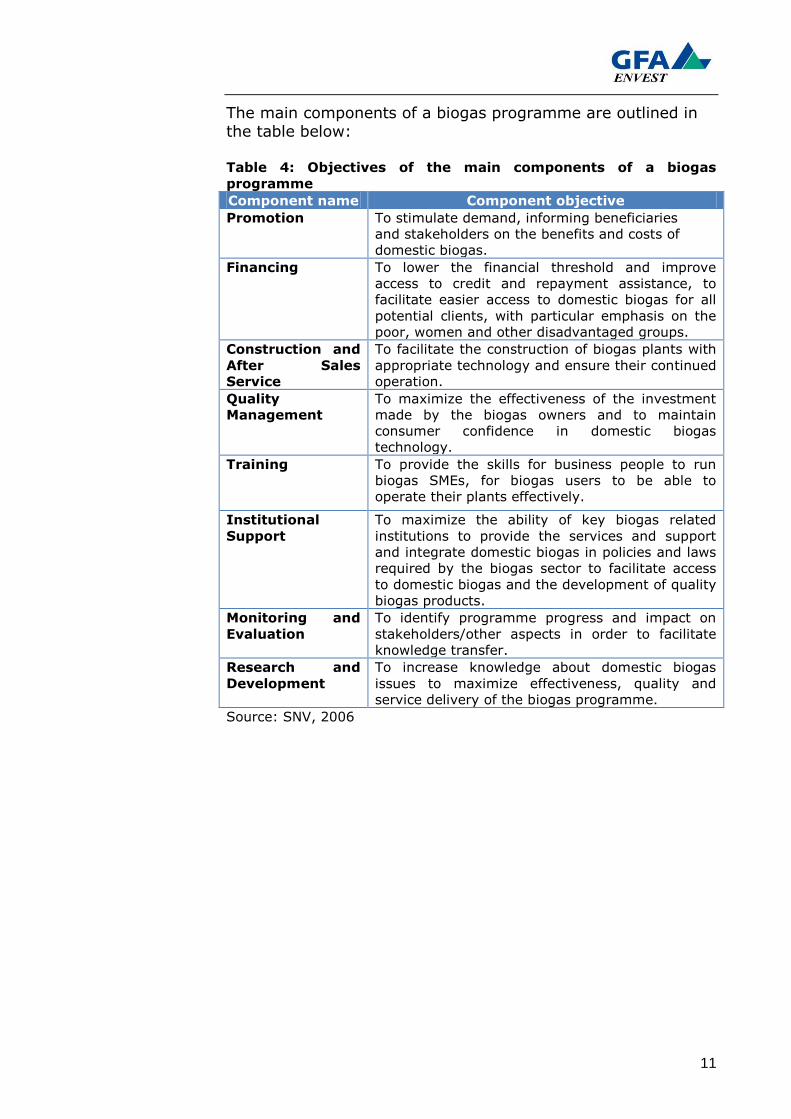
The main components of a biogas programme are outlined in the table below:
Table 4: Objectives of the main components of a biogas
programme
Component name Component objective
Promotion To stimulate demand, informing beneficiaries
and stakeholders on the benefits and costs of
domestic biogas.
Financing To lower the financial threshold and improve
access to credit and repayment assistance, to
facilitate easier access to domestic biogas for all
potential clients, with particular emphasis on the
poor, women and other disadvantaged groups.
Construction and
After Sales
Service
To facilitate the construction of biogas plants with
appropriate technology and ensure their continued
operation.
Quality
Management
To maximize the effectiveness of the investment
made by the biogas owners and to maintain
consumer confidence in domestic biogas
technology.
Training To provide the skills for business people to run
biogas SMEs, for biogas users to be able to
operate their plants effectively.
Institutional
Support
To maximize the ability of key biogas related
institutions to provide the services and support
and integrate domestic biogas in policies and laws
required by the biogas sector to facilitate access
to domestic biogas and the development of quality
biogas products.
Monitoring and
Evaluation
To identify programme progress and impact on
stakeholders/other aspects in order to facilitate
knowledge transfer.
Research and
Development
To increase knowledge about domestic biogas
issues to maximize effectiveness, quality and
service delivery of the biogas programme.
Source: SNV, 2006
12
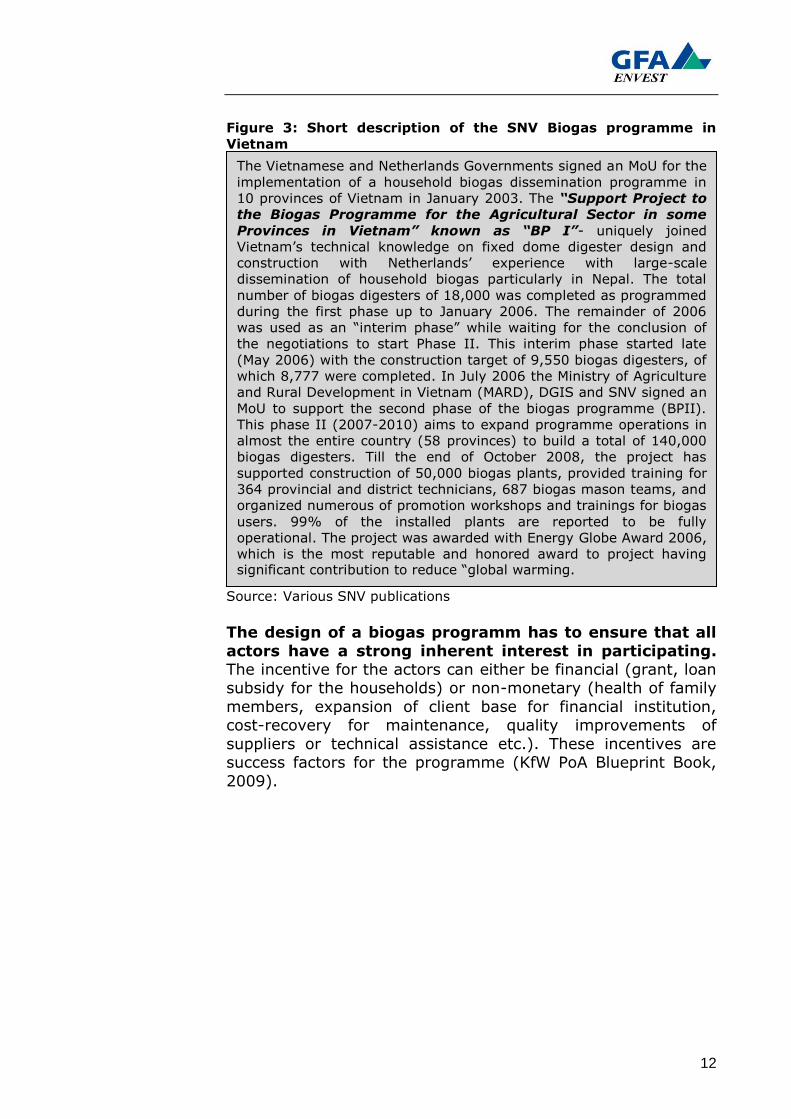
Figure 3: Short description of the SNV Biogas programme in
Vietnam
Source: Various SNV publications
The design of a biogas programm has to ensure that all
actors have a strong inherent interest in participating. The incentive for the actors can either be financial (grant, loan subsidy for the households) or non-monetary (health of family
members, expansion of client base for financial institution, cost-recovery for maintenance, quality improvements of
suppliers or technical assistance etc.). These incentives are success factors for the programme (KfW PoA Blueprint Book,
2009).
The Vietnamese and Netherlands Governments signed an MoU for the
implementation of a household biogas dissemination programme in
10 provinces of Vietnam in January 2003. The “Support Project to
the Biogas Programme for the Agricultural Sector in some
Provinces in Vietnam” known as “BP I”- uniquely joined
Vietnam‟s technical knowledge on fixed dome digester design and
construction with Netherlands‟ experience with large-scale
dissemination of household biogas particularly in Nepal. The total
number of biogas digesters of 18,000 was completed as programmed
during the first phase up to January 2006. The remainder of 2006
was used as an “interim phase” while waiting for the conclusion of
the negotiations to start Phase II. This interim phase started late
(May 2006) with the construction target of 9,550 biogas digesters, of
which 8,777 were completed. In July 2006 the Ministry of Agriculture
and Rural Development in Vietnam (MARD), DGIS and SNV signed an
MoU to support the second phase of the biogas programme (BPII).
This phase II (2007-2010) aims to expand programme operations in
almost the entire country (58 provinces) to build a total of 140,000
biogas digesters. Till the end of October 2008, the project has
supported construction of 50,000 biogas plants, provided training for
364 provincial and district technicians, 687 biogas mason teams, and
organized numerous of promotion workshops and trainings for biogas
users. 99% of the installed plants are reported to be fully
operational. The project was awarded with Energy Globe Award 2006,
which is the most reputable and honored award to project having significant contribution to reduce “global warming.
13
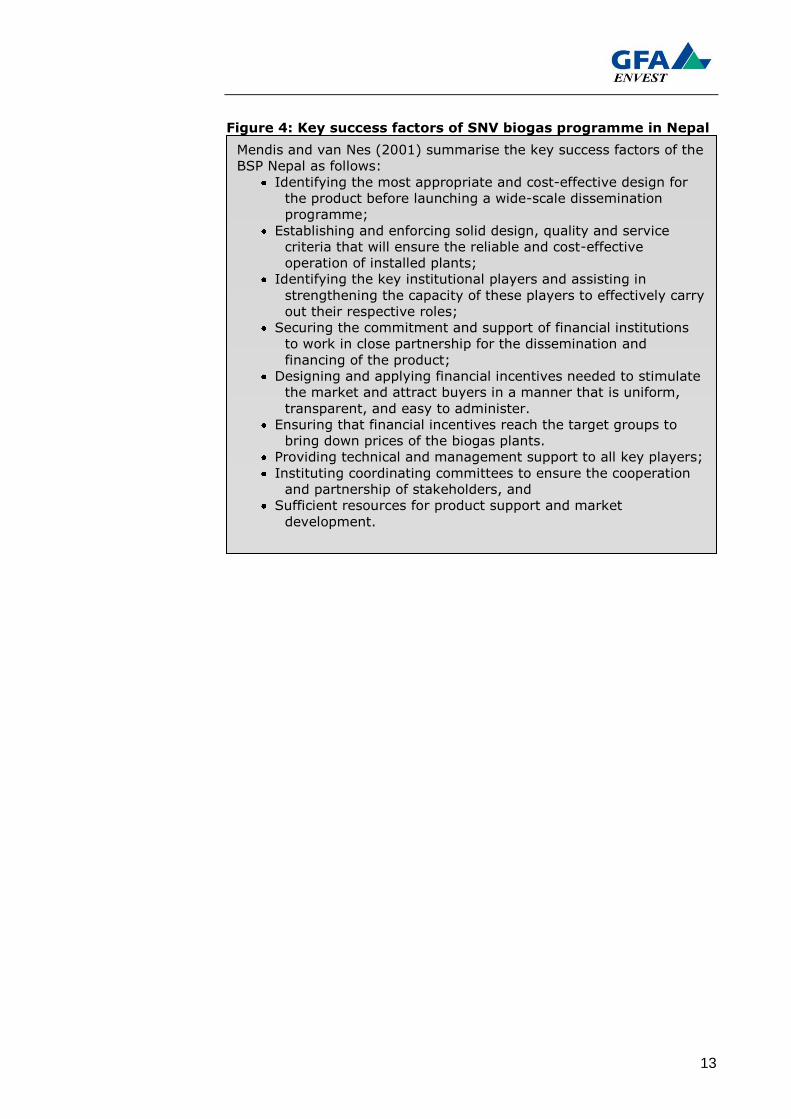
Figure 4: Key success factors of SNV biogas programme in Nepal
Mendis and van Nes (2001) summarise the key success factors of the
BSP Nepal as follows:
Identifying the most appropriate and cost-effective design for
the product before launching a wide-scale dissemination
programme;
Establishing and enforcing solid design, quality and service
criteria that will ensure the reliable and cost-effective
operation of installed plants;
Identifying the key institutional players and assisting in
strengthening the capacity of these players to effectively carry
out their respective roles;
Securing the commitment and support of financial institutions
to work in close partnership for the dissemination and
financing of the product;
Designing and applying financial incentives needed to stimulate
the market and attract buyers in a manner that is uniform,
transparent, and easy to administer.
Ensuring that financial incentives reach the target groups to
bring down prices of the biogas plants.
Providing technical and management support to all key players;
Instituting coordinating committees to ensure the cooperation
and partnership of stakeholders, and
Sufficient resources for product support and market
development.
14
2 . 2 T e c h n o l o g y o f t h e m i n i b i o g a s
p l a n t s
Biogas is generated from digesting human excreta, animal excreta or other organic substances (agricultural product). Biogas
consists of Methane - CH4, accounting for 60-70%, Carbon dioxide – CO2, accounting for 30-40%, and Nitrogen- N2 and
Hydro Sulphate – H2S, accounting for the rest. The calorific value of biogas is 4,500-6,000 cal/m3, which is roughly equivalent to energy obtained by burning 1 liter of ethanol, 0.8 liter of gasoline,
0.6 liter of crude oil or 1.4kg of char coal.
Today there are many biogas production technologies used for households: plastic digester, pipe digester, solid dome type, etc.
However most of the biogas programmes apply the solid dome type due to the high-safety level, relatively easy construction, high production capacity and long lifetime. The main parts of the
solid dome biogas plant are the digester and the compensation tank. In the digester the appropriate conditions for anaerobic
digestion are maintained and biogas is produced. The compensation tank has the task to create gas
pressure by retaining effluent coming out from
digester when gas is produced. In this way the produced biogas is under
pressure and distributed via the pipes to the end-
use point. The hemi-spherical fixed dome plants are made on-site,
entirely out of brick work. Upon the requirement of the households, biogas plants range in
digester size from 4m3 to 20m3. The additional appliances, also usually locally available, consist of gas pipe, main valves, stoves and gas lamps. The produced biogas is mainly used for cooking
using single stove and double stove cookers. Also the biogas can be used for water heating and lighting, using biogas lamps which
can replace a light bulb of 25 W (SNV; 2009).
15
Apart from biogas, a side product is bio-slurry, a mixture of solids and liquids produced by the decomposition of the organic substrate. Bio-slurry is a highly nutrient organic fertilizer and can
replace many types of mineral fertilizer in agricultural production.
The amount of produced biogas depends on the origin and amount of manure discharged into the unit, as well as the ratio manure/water. The gas yield per unit of feedstock, however, is
widely constant and is presented in the table below. Table 5: Gas yield per feedstock
Source: SNV Biogas programme in Vietnam
Fermentation
material
Amount of
waste per
day
(kg/ani-
mal head)
Dry
matter
content
(%)
Carbon/
nitrogen
(C/N)
ratio
Gas yield
of the
feedstock
(liter/kg/
day)
Manure
Cow 15 - 20 18 - 20 24 - 25 15 – 32
Buffalo 18 - 25 16 - 18 24 - 25 15 – 32
Pig 1.2 – 4.0 24 - 33 12 - 13 40 – 60
Poultry 0.02 – 0.05 25 - 50 5 - 15 50 - 60
Human 0.18 – 0.34 20 - 34 2.9 - 10 60 - 70
Plant
Fresh water
hyacinth 4 - 6 12 - 25 0.3 – 0.5
Dry paddy straw 80 - 85 48 - 117 1.5 – 2.0
16
2 . 3 B e n e f i t s o f t h e b i o g a s p l a n t
i n s t a l l a t i o n f o r h o u s e h o l d s
A high quality biogas plant needs minimum maintenance costs
and can produce gas for at least 15-20 years without major
problems and re-investments. On household level, biogas plants
provide clean cooking energy, contribute to health improvement
through a better hygienic situation and reduce the time needed
for biomass collection, especially for women. On programme
level, the benefits are in the first place creation of new
employment/work and environmental situation improvement.
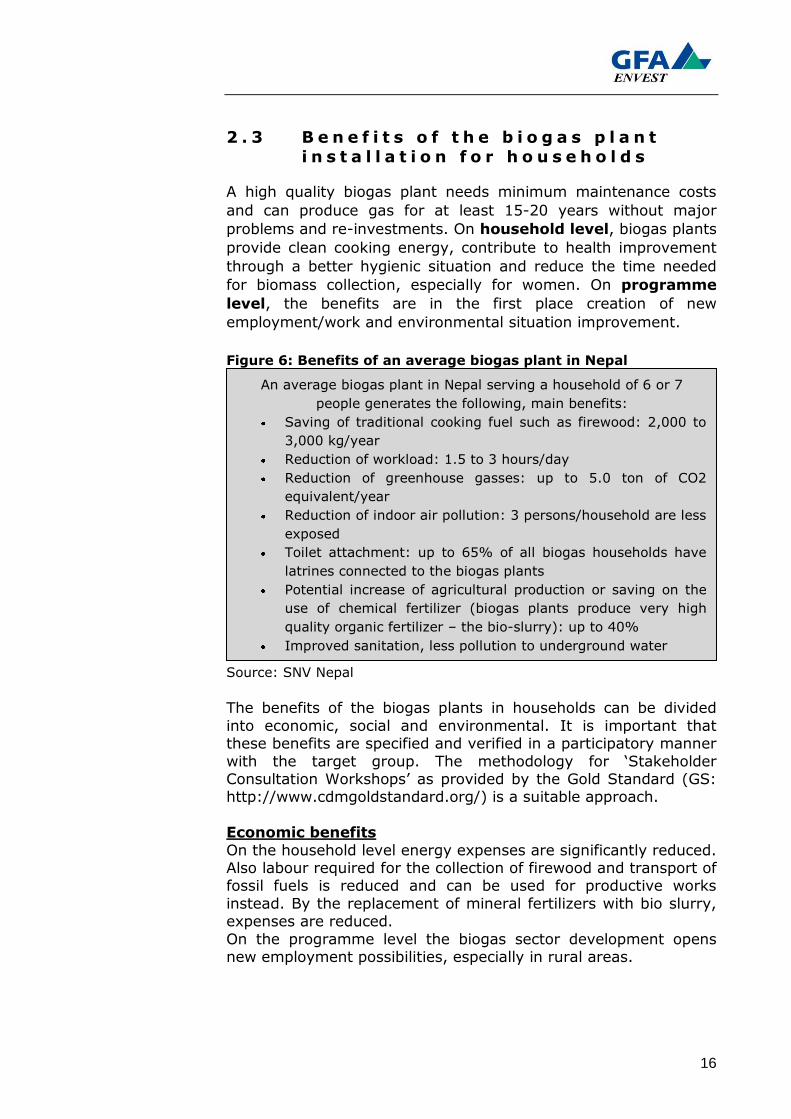
Figure 6: Benefits of an average biogas plant in Nepal
Source: SNV Nepal
The benefits of the biogas plants in households can be divided
into economic, social and environmental. It is important that these benefits are specified and verified in a participatory manner
with the target group. The methodology for „Stakeholder Consultation Workshops‟ as provided by the Gold Standard (GS: http://www.cdmgoldstandard.org/) is a suitable approach.
Economic benefits
On the household level energy expenses are significantly reduced. Also labour required for the collection of firewood and transport of fossil fuels is reduced and can be used for productive works
instead. By the replacement of mineral fertilizers with bio slurry, expenses are reduced.
On the programme level the biogas sector development opens new employment possibilities, especially in rural areas.
An average biogas plant in Nepal serving a household of 6 or 7
people generates the following, main benefits:
Saving of traditional cooking fuel such as firewood: 2,000 to
3,000 kg/year
Reduction of workload: 1.5 to 3 hours/day
Reduction of greenhouse gasses: up to 5.0 ton of CO2
equivalent/year
Reduction of indoor air pollution: 3 persons/household are less
exposed
Toilet attachment: up to 65% of all biogas households have
latrines connected to the biogas plants
Potential increase of agricultural production or saving on the
use of chemical fertilizer (biogas plants produce very high
quality organic fertilizer – the bio-slurry): up to 40%
Improved sanitation, less pollution to underground water
17
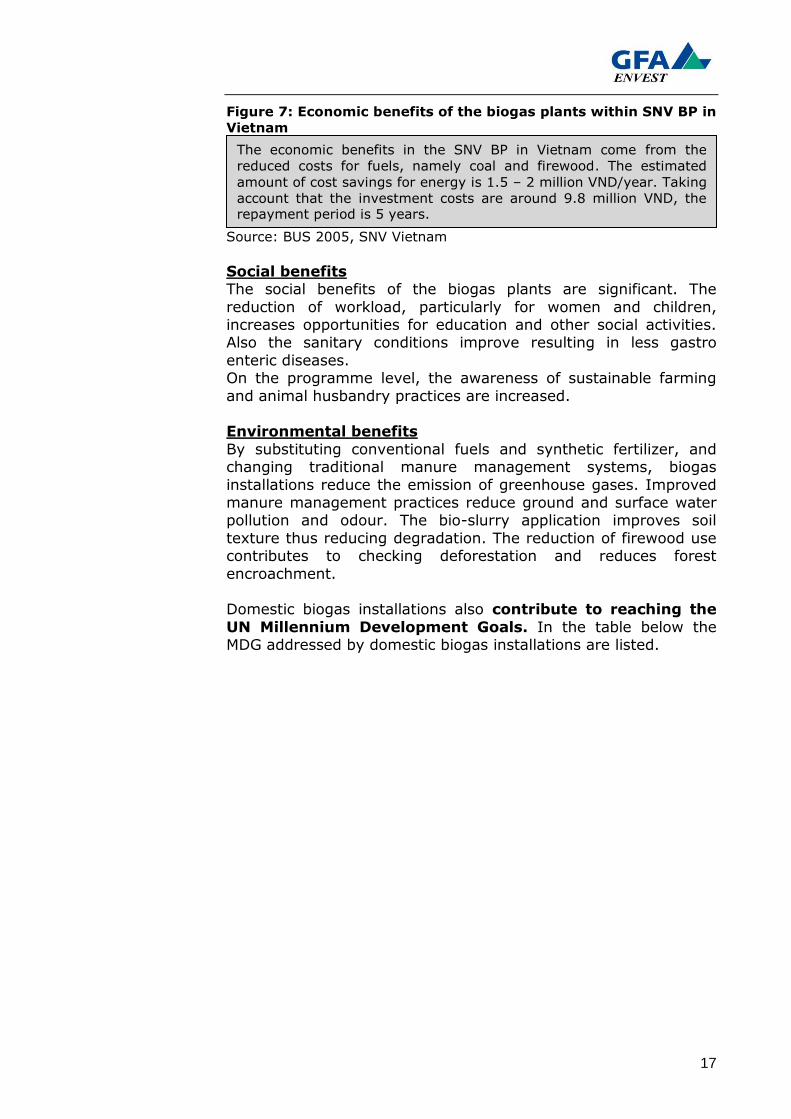
Figure 7: Economic benefits of the biogas plants within SNV BP in
Vietnam
Source: BUS 2005, SNV Vietnam
Social benefits The social benefits of the biogas plants are significant. The
reduction of workload, particularly for women and children, increases opportunities for education and other social activities. Also the sanitary conditions improve resulting in less gastro
enteric diseases. On the programme level, the awareness of sustainable farming
and animal husbandry practices are increased. Environmental benefits
By substituting conventional fuels and synthetic fertilizer, and changing traditional manure management systems, biogas
installations reduce the emission of greenhouse gases. Improved manure management practices reduce ground and surface water pollution and odour. The bio-slurry application improves soil
texture thus reducing degradation. The reduction of firewood use contributes to checking deforestation and reduces forest
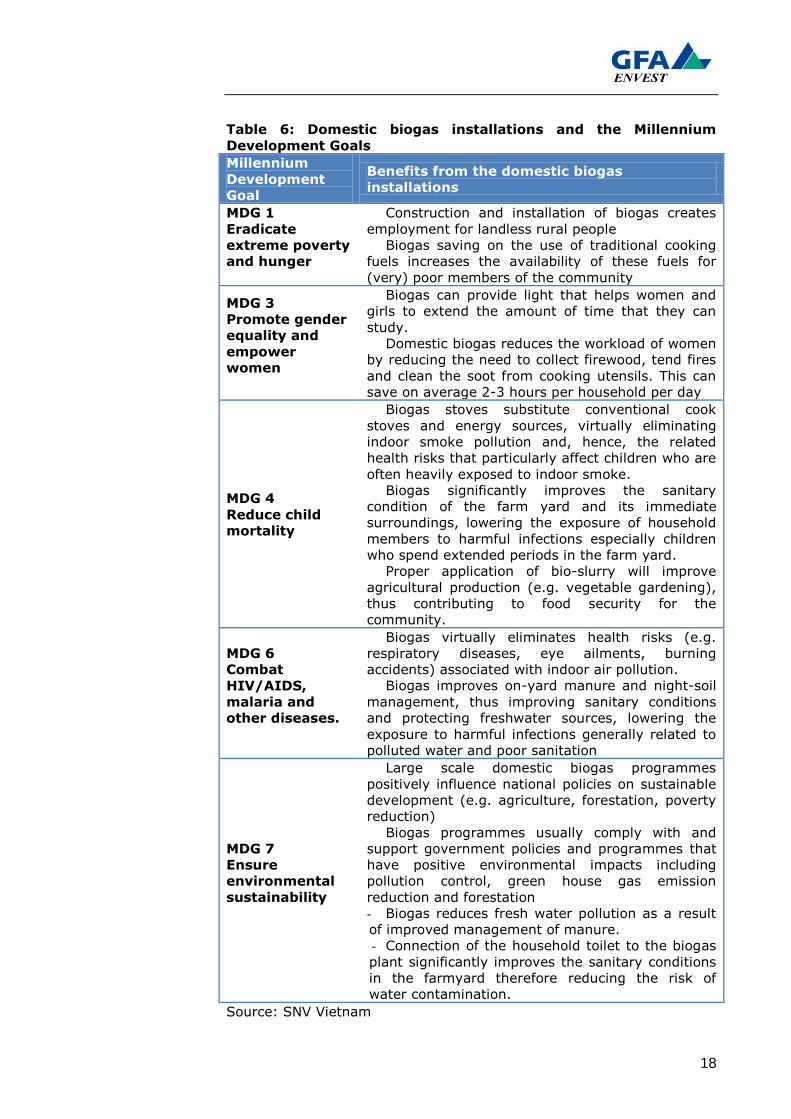
encroachment. Domestic biogas installations also contribute to reaching the
UN Millennium Development Goals. In the table below the MDG addressed by domestic biogas installations are listed.
The economic benefits in the SNV BP in Vietnam come from the
reduced costs for fuels, namely coal and firewood. The estimated
amount of cost savings for energy is 1.5 – 2 million VND/year. Taking
account that the investment costs are around 9.8 million VND, the repayment period is 5 years.
18
Table 6: Domestic biogas installations and the Millennium
Development Goals
Millennium
Development
Goal
Benefits from the domestic biogas
installations
MDG 1
Eradicate
extreme poverty
and hunger
Construction and installation of biogas creates
employment for landless rural people
Biogas saving on the use of traditional cooking
fuels increases the availability of these fuels for
(very) poor members of the community
MDG 3
Promote gender
equality and
empower
women
Biogas can provide light that helps women and
girls to extend the amount of time that they can
study.
Domestic biogas reduces the workload of women
by reducing the need to collect firewood, tend fires
and clean the soot from cooking utensils. This can
save on average 2-3 hours per household per day
MDG 4
Reduce child
mortality
Biogas stoves substitute conventional cook
stoves and energy sources, virtually eliminating
indoor smoke pollution and, hence, the related
health risks that particularly affect children who are
often heavily exposed to indoor smoke.
Biogas significantly improves the sanitary
condition of the farm yard and its immediate
surroundings, lowering the exposure of household
members to harmful infections especially children
who spend extended periods in the farm yard.
Proper application of bio-slurry will improve
agricultural production (e.g. vegetable gardening),
thus contributing to food security for the
community.
MDG 6
Combat
HIV/AIDS,
malaria and
other diseases.
Biogas virtually eliminates health risks (e.g.
respiratory diseases, eye ailments, burning
accidents) associated with indoor air pollution.
Biogas improves on-yard manure and night-soil
management, thus improving sanitary conditions
and protecting freshwater sources, lowering the
exposure to harmful infections generally related to
polluted water and poor sanitation
MDG 7
Ensure
environmental
sustainability
Large scale domestic biogas programmes
positively influence national policies on sustainable
development (e.g. agriculture, forestation, poverty
reduction)
Biogas programmes usually comply with and
support government policies and programmes that
have positive environmental impacts including
pollution control, green house gas emission
reduction and forestation
- Biogas reduces fresh water pollution as a result
of improved management of manure.
- Connection of the household toilet to the biogas
plant significantly improves the sanitary conditions
in the farmyard therefore reducing the risk of
water contamination.
Source: SNV Vietnam
19
2 . 4 F i n a n c i a l r e q u i r e m e n t s
The costs of a biogas programme depend on the costs of the biogas plant installation, support activities and programme implementation9. The investment costs for a biogas plant are
usually covered by the households, while the programme provides an incentive to install the biogas unit (e.g. a subsidy covering part
of the investment costs) and supporting activities, such as trainings for biogas users and biogas constructors, after sale services etc.. The costs for the progamme coordinator can be
covered from various sources. The sale of CERs can be one of the financing mechanisms.
One of the oldest biogas programmes is the SNV biogas programme in Nepal, running since 1992. The business model was the combination of an investment subsidy coupled to strict
enforcement of quality control. This programme was aimed at private biogas sector development and requires long term
engagement and mobilization of external financial support. Depending on the sector development, the external financing has to be phased out. As shown in the table and graph below during
the programme development, the shares of the sector support and the investment subsidy have been decreasing.
Table 7: Costs of various phases of the SNV biogas progamme in
Nepal
Phase I-II III IV
Period 1992-1997 1997-2003 2003-2009
Plants
(number) 20,119 91,196 200,000
Costs (in
million EUR) 7.8 41.7 97.4
Source: Van Nes, SNV Nepal
Figure 8: Shares of costs for sector support, net investment and
investment subsidy in SNV Nepal biogas programme
Source: Van Nes, SNV Nepal
9 For biogas dissemination barriers see chapter 2.1.
20
The costs of a biogas plant installation are the initial barrier for disseminating biogas plants to households. Depending on the
region and the size the costs of a biogas plant range from 200-400 EUR in Asia, to 500-1,000 EUR in Africa. The cost difference
between the regions results from different costs of production factors (raw materials, design, technology, human resources etc.), the way the installation is organized and the interaction
between supply and demand (KfW PoA Blueprint Book, 2009).
Figure 9: Average costs of a biogas unit installation in Vietnam
Source: SNV Vietnam
The average costs of a biogas digester per m3 installed capacity
amount to 38.2 EUR. The average size of a biogas facility comprises
10.4 m3. Thus, the total costs of an average facility amount to 397
EUR comprising material, labor and biogas appliances (i.e. cooking
devices and biogas lamps). This is complemented by costs arising
from support activities. The support comprises
Workshops where farm holders are informed on the
opportunities of biogas facilities,
Facilitation of the construction of biogas facilities ensuring the
application of resilient materials and biogas techniques,
12 months guarantee on the biogas facility,
Training in the sound operation of biogas facilities;
Above services, summarized as support, are crucial to the success of
the biogas programme and inherently connected to the
implementation of biogas techniques. The costs of support amount to
approx. 20% of a facility‟s investment cost. The average support
costs amount to 80 EUR resulting in average total costs of 476 EUR
per facility.
Average costs in EUR/m3 38.2
Average size of the biogas plant in m3 10.4
Total average costs in EUR/m3 397
Average support costs in EUR/unit 80
Total average costs (including support) in EUR/unit 476
This is a significant amount for a small farm holder. Vietnam‟s
average GDP per capita is 593 EUR. Thus biogas investment costs
make up 80.3% of the average annual income. This poses a
significant barrier to the implementation of biogas facilities without
the SNV biogas programme. The programme overcomes this barrier
by providing a subsidy of 48.2 EUR (vintage 2008) and by providing
all services summarized under support free of charge.
21
3 C D M P O A B I O G A S P R O G R A M M E F O R H O U S E H O L D S
3 . 1 T i m i n g
Experience has shown that in standard CDM projects it can take up to two years from the first project idea to project registration
(KfW PoA Blueprint Book, 2009). At the moment there is only one PoA registered , CUIDEMOS in Mexico, and it is expected that this
period will be even longer for PoA projects due to unclear procedures and the lack of experience among project developers, DOEs and EB.
In case the programme is designed as a CDM PoA, the project cycle should be started as soon as possible. Once the programme
set up is agreed the programme documentation should be developed and the registration procedure initiated. The current rule regarding the CPA design document preparation states that
the starting date of any CPA “is and will not be prior to the commencement of validation of the programme of activities, i.e.
the date on which the CDM PoA-DD is first published for global stakeholder consultation” (Annex 29, EB 47). This rule is a difference to regular CDM projects where projects that have
already started can be registered in case they prove the prior consideration of CDM (significant due to the time consuming
registration process). Analogue to CDM, in case the programme has started before the PoA -DD has been published for global stakeholder consultation,
the programme has to prove prior consideration of the CDM. This means that the programme coordinator has to provide evidence
that the CDM was considered as an integral part of the programme at the time of its planning. At its 41st meeting the EB introduced the “Guidelines on the demonstration and assessment
of prior consideration of the CDM”10 which oblige the project participants to notify the Host Party DNA and the UNFCCC
Secretariat about their intention to seek CDM status within 6 months after the project start11.
10 EB 41 Annex 46, revision EB 48, Annex 61 11 Starting date of a CDM project activity – the earliest date at which either the
implementation or construction or real action of a project activity begins. (CDM Glossary, ver. 05)
22
3 . 2 K e y e l e m e n t s f o r P o A p r o j e c t
s t r u c t u r e
The structure of a PoA project depends on the actors involved and the programme goal. In case of biogas programmes for
households as well as for other PoAs, the starting point is usually to determine the required type and level of incentive a
programme needs in order to attract the critical amount of participants for achieving its goal. In designing the PoA, the programme coordinator plays the
decisive role. The coordinator is responsible for the structure and business model of the PoA, as well as for organization of contracts
and agreements with programme partners or CPAs and CERs management. Also the programme coordinator is responsible for
designing an incentive system to attract programme participants. Possible types of incentives include price discounts, grants and loans at favorable rates or simply payments on delivery for
achieved emission reductions (KfW PoA Blueprint Book, 2009). The PoA coordinators can be banks which are engaging more and
more in the carbon market. In this context banks can also design attractive financial products. Also energy supply companies can be PoA coordinators, especially in case of energy savings
activities under the programme. NGOs and private companies with well established local network can be PoA coordinators, as
well as development organization with a good network and reputation among local population. However, in case of ODA financed projects, ODA diversion should be taken into account
(see chapter 3.6).
Carbon rights Before the development of the PoA is initiated, the carbon rights have to be clearly assigned. The host country´s legislation
relating this issue has to be taken into consideration, especially in case of ODA financed projects. Since the actual emission
reduction takes place on household level, the owners of the CERs should be the biogas plant owners. However, depending on the programme design, the participants can either receive carbon
revenues from the coordinator after the project is implemented or registered, or can cede their CERs to the coordinator in exchange
for the initial investment subsidy and support provided. Size of a CPA
A single CDM project activity (CPA) within a PoA can be determined by various factors. Due to the simplified rules and
procedures for small-scale methodologies, programme coordinators usually select the SSC thresholds as one of the
criteria for the CPA definition. In case of biogas programme replacing fossil fuels for thermal energy (cooking or heating), the CPA threshold is 45 MW thermal energy installed.
23
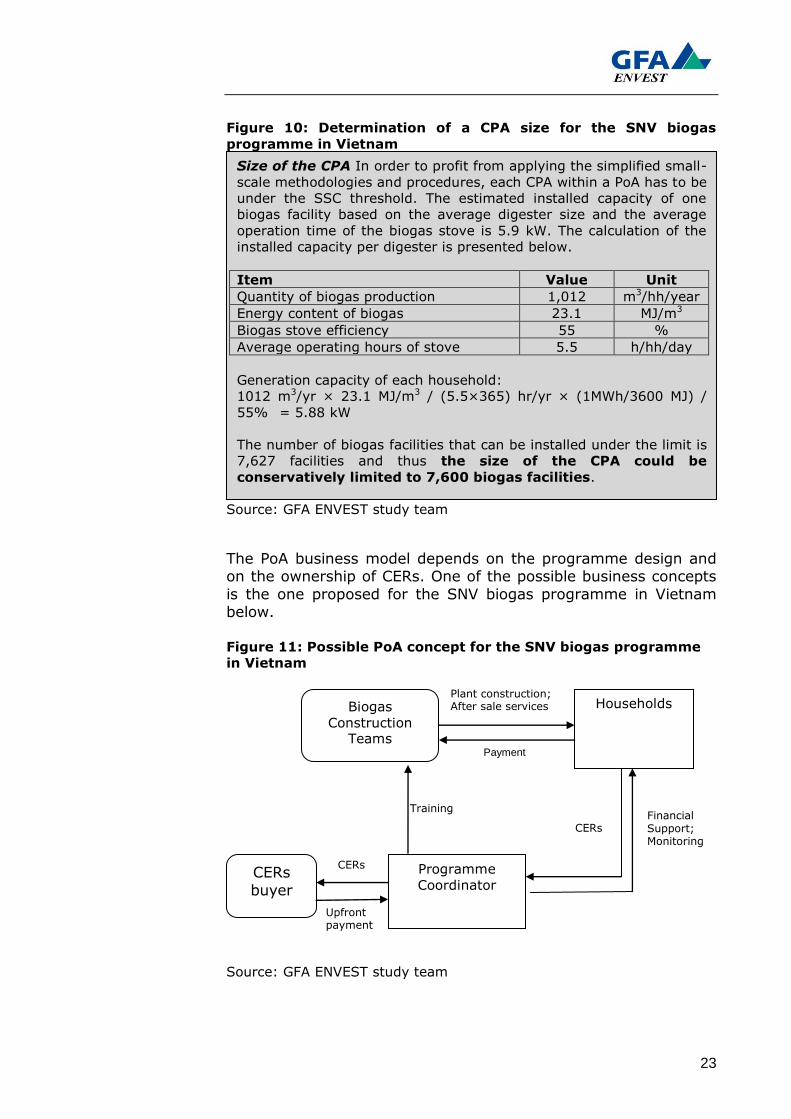
Figure 10: Determination of a CPA size for the SNV biogas
programme in Vietnam
Source: GFA ENVEST study team
The PoA business model depends on the programme design and on the ownership of CERs. One of the possible business concepts
is the one proposed for the SNV biogas programme in Vietnam below.
Figure 11: Possible PoA concept for the SNV biogas programme
in Vietnam
Source: GFA ENVEST study team
Size of the CPA In order to profit from applying the simplified small-
scale methodologies and procedures, each CPA within a PoA has to be
under the SSC threshold. The estimated installed capacity of one
biogas facility based on the average digester size and the average
operation time of the biogas stove is 5.9 kW. The calculation of the
installed capacity per digester is presented below.
The number of biogas facilities that can be installed under the limit is
7,627 facilities and thus the size of the CPA could be
conservatively limited to 7,600 biogas facilities.
Training
Plant construction; After sale services
Upfront payment
CERs
CERs
Programme
Coordinator
Biogas
Construction Teams
Households
CERs
buyer
Financial Support; Monitoring
Payment
24
3 . 3 P o A p r o j e c t c y c l e a n d
t r a n s a c t i o n c o s t s
The PoA project cycle is very similar to the standard CDM cycle. It is divided into the implementation phase and the operational
phase. The objective of the implementation phase is to have the project registered at the UNFCCC. Once the project is
registered and starts running, than the operational phase begins with the objective to have CERs issued. In the implementation phase the project design documents have to be developed,
namely PoA-DD and the CPA-DD. Based on the project design documents the host country is asked to issue the Letter of
Approval. The independent validation of the PoA-DD and CPA-DD is done by the Designated Operational Entity. After the successful
validation and the issuance of the LoA, a PoA can apply for the registration by the UNFCCC. The documents needed to apply for the registration are the project design documents (PoA-DD, CPA-
DD generic, and one specific CPA-DD), validation report from the DOE, and the LoA.
During the operational phase, the monitoring has to be done by the project coordinator and the monitoring reports have to be verified by the DOE. Based on the verified monitoring report, a
PoA can ask for the CERs to be issued by the UNFCCC. The difference between single CDM projects and the PoA CDM is that
additional CPAs can be added after the PoA registration. Each new CPA requires a CPA-DD. In the table below the steps in the PoA cycle are presented, as well as the estimated costs.
25
Table 8: PoA development steps and related transaction costs
Activity Entity Estimated
costs12 Comments
Implementation phase
Development
of a PoA idea and a PIN
Project management
entity and CDM
consultant
8,000 – 15,000 EUR
Without feasibility studies / field visits / baseline surveys etc.
Upfront
Letter of Endorsement
DNA N.A.
Development of PoA-DD
and CPA-DD
CDM Consultant
50,000 – 150,000 EUR
Using a small-scale
methodology which is likely in the case of PoAs
Upfront
Letter of Approval
DNA N.A. (translation
costs)
Validation of the CDP-POA-DD/CDM-CPA-
DD
DOE Up to 50,000 EUR
(once) Upfront and yearly
verification
Implementation concept
Project management
entity Up to 100,000 EUR
Includes record keeping
system for each CPA, adaptation of internal
procedures and
documentation etc.
Registration UNFCCC
Registration fee13 is calculated
depending on the
amount of CERs14
Registration costs of a POA are determined by the size of the first CPA.
Operational phase
Monitoring. Project
management entity
30,000 – 100,000 EUR
Upfront and yearly expenses
Ongoing
verification and validation of new CPAs
DOE 10,000 – 30,000
EUR
Issuance of the CERs
UNFCCC
Issuance fee is
calculated based
on the amount of
CERs15
Source: KfW PoA Blueprint Book, 2009
12 It is considered that the international consulting knowledge is needed. 13 No registration fee and share of proceeds at issuance have to be paid for CDM projects
activities hosted in least developed countries 14 0.10 USD for the first 15.000 t CO2e, 0.20 USD for any amount in excess of 15.000 t
CO2e in a given calendar year. No registration fee has to be paid for CDM project activities with expected average annual emission reduction over the crediting period below 15,000 t CO2-equivalent (EB 23, Annex 35).
15 See footnote 10. The issuance fee for the first CERs issuance is deducted from the registration fee. (EB 6 Annex 5) Apart from the administration fee the Adaptation Share of Proceeds is a deduction of 2% of the certified emission reductions (CERs) generated by the project each year used to fund measures in developing country Parties to the Protocol that will assist them in adapting to the adverse effects of climate change. In case the CDM project takes place in a Least Developed Country the adaptation share of proceeds is exempted. COP in 17/CP.7
26
3 . 4 S e l e c t i o n o f m e t h o d o l o g i e s
The emission reduction from a biogas digester is based on avoiding the combustion of fossil fuels respective non-renewable biomass, and on reducing methane emissions from the
agricultural waste management systems, and eventually from wastewater streams of the associated household.
In the following it will be evaluated if the available and approved CDM methodologies cover the relevant emission reduction components and if the same are applicable under the PoA. The
methodologies must cover the following emission reduction components:
a) Methane avoidance from animal manure management
system
b) Fuel switch from fossil fuel to renewable energy
c) Switch from non-renewable biomass to renewable energy.
Since the EB 47th meeting it is allowed to combine one or more methodologies for PoAs.
The question on the applicability of the approved CDM methodologies to the PoA is addressed by the Executive
Board (EB). During its 35th meeting the EB clarified “that methodologies are approved for application both to CDM project activity and to CDM programme activities (CPA) under a
Programme of Activities (PoA)” (EB 35 Meeting Report, paragraph 15). During a previous meeting, the 32nd meeting, the
EB had restricted the application of approved SSC CDM-Methodologies in case of CPAs which individually do not exceed the SSC threshold to SSC CDM-methodologies once they have
first been reviewed, and as needed, revised to account for leakage in the context of SSC-CPA (EB 32, Annex 38,
Version 2.1). The SSC-methodologies existing at that time have been reviewed meanwhile. However, it is concluded that the newer EB decision from the 35th meeting outdates the older EB
decision from the 32nd meeting and thus allows all approved CDM methodologies to be applied to CPAs under the PoA.
The applicability of large scale methodologies is not discussed here since their monitoring and/or leakage requirements seem too expensive or simply unachievable to be complied within a
household/ small farm level biogas programme like presented in this study. This discussion is thus superfluous.
So, the open question is on the approved CDM-Methodologies that cover the above emission reduction components. Since methodologies are subject to continuous revision and adoption
herein, only those versions of the methodologies are considered which were available at the time of production of this manual.
a) Methane Avoidance from Animal Manure Management
System
The emission reduction component of methane avoidance falls into Type III of SSC methodologies, denominated “Other
projects”. Under this type there offers AMS-III.R: “Methane
27
Recovery in Agricultural Activities at Household/ Small Farm Level” and AMS-III.D: “Methane Recovery in Animal Manure
Management Systems”. Generally speaking, AMS-III.R addresses project activities at individual households/ small farms while AMS-
III.D addresses larger (livestock) farms. Although this study explicitly addresses households/ small farms both methodologies are eligible and the applicability is not
restricted to the household methodology. Going for AMS-III.D the households/ small farms, however, might be unnecessarily over-
loaded with monitoring obligations or face narrower applicability criteria. In contrast, larger farms may only go for AMS-III.D since the applicability criteria of AMS-III.R exclude units with an
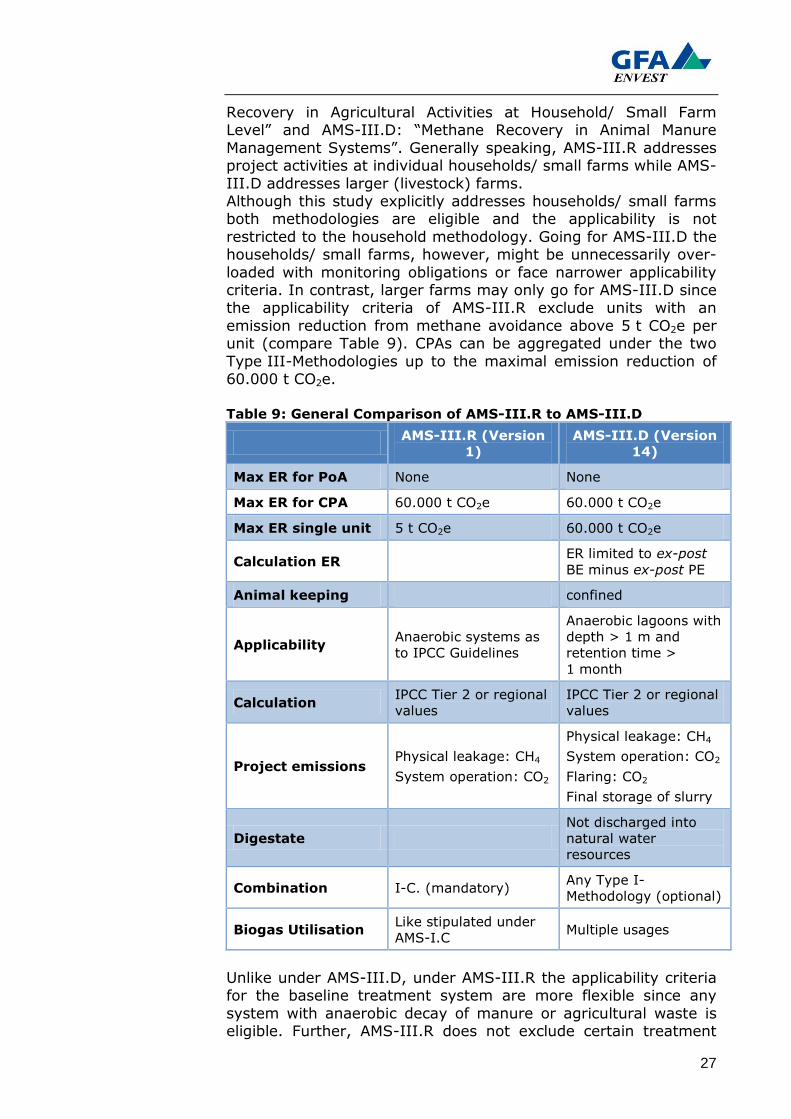
emission reduction from methane avoidance above 5 t CO2e per unit (compare Table 9). CPAs can be aggregated under the two
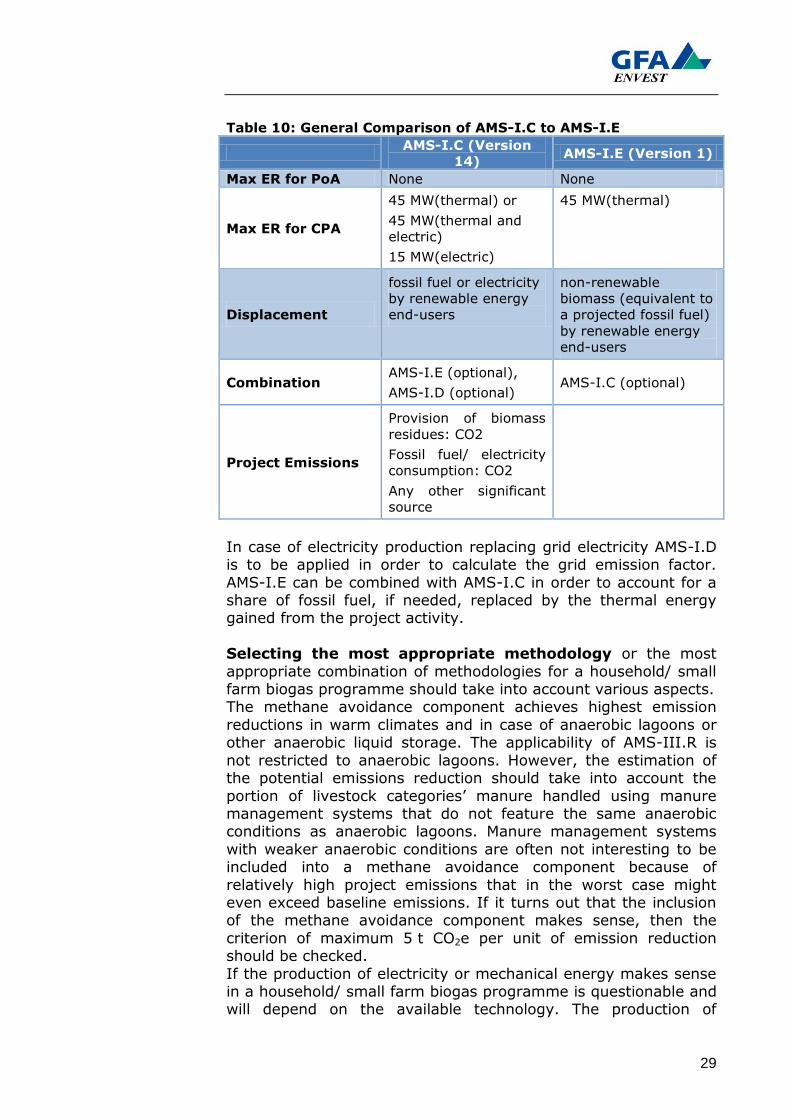
Type III-Methodologies up to the maximal emission reduction of 60.000 t CO2e. Table 9: General Comparison of AMS-III.R to AMS-III.D
AMS-III.R (Version
1)
AMS-III.D (Version
14)
Max ER for PoA None None
Max ER for CPA 60.000 t CO2e 60.000 t CO2e
Max ER single unit 5 t CO2e 60.000 t CO2e
Calculation ER ER limited to ex-post
BE minus ex-post PE
Animal keeping confined
Applicability Anaerobic systems as
to IPCC Guidelines
Anaerobic lagoons with
depth > 1 m and
retention time >
1 month
Calculation IPCC Tier 2 or regional
values
IPCC Tier 2 or regional
values
Project emissions Physical leakage: CH4
System operation: CO2
Physical leakage: CH4
System operation: CO2
Flaring: CO2
Final storage of slurry
Digestate
Not discharged into
natural water
resources
Combination I-C. (mandatory) Any Type I-
Methodology (optional)
Biogas Utilisation Like stipulated under
AMS-I.C Multiple usages
Unlike under AMS-III.D, under AMS-III.R the applicability criteria for the baseline treatment system are more flexible since any
system with anaerobic decay of manure or agricultural waste is eligible. Further, AMS-III.R does not exclude certain treatment
28
systems for the treated waste stream from the biogas digester while AMS-III.D excludes the discharge to natural water
resources. A hurdle in the application of AMS-III.R to a biogas programme
for households/ small farms might be the mandatory combination with AMS-I.C “Thermal Energy Production with or without Electricity”. The major use of accruing biogas is thus limited to
thermal energy production. Electricity production is not excluded, but must only occur in second place (e.g. in a cogeneration unit).
Also, the displaced energy source must be fossil fuel instead of non-renewable biomass. The displacement of non-renewable biomass can be accounted for under AMS-I.E. If this hurdle is
dominant to the project activity, AMS-III.D might represent the first choice.
b) Renewable Energy and Switch from Non-Renewable
Biomass
For the emission reduction component “renewable energy” within the biogas programme for households/ small farms, potential
methodologies are of the Type I (“Renewable Energy”). Most appropriate to the programme seem to be AMS-I.C “Thermal Energy Production with or without Electricity” and AMS-I.E
“Switch from Non-Renewable Biomass for Thermal Applications by the User”. The other Type I-Methodologies address electricity only
or mechanical energy production. As can be seen in Table 10 the applicability criteria for all SSC-Methodologies under Type I are restricted to such activities with
capacities below 45 MW (thermal). For electric energy generation the limit is 15 MW and for cogeneration systems the cumulated
generation limit is 45 MW (thermal) with the conversion electric to thermal energy 1:3. In the framework of the PoA these limits are relevant to the single CPAs.
29
Table 10: General Comparison of AMS-I.C to AMS-I.E
AMS-I.C (Version
14) AMS-I.E (Version 1)
Max ER for PoA None None
Max ER for CPA
45 MW(thermal) or
45 MW(thermal and
electric)
15 MW(electric)
45 MW(thermal)
Displacement
fossil fuel or electricity
by renewable energy
end-users
non-renewable
biomass (equivalent to
a projected fossil fuel)
by renewable energy
end-users
Combination AMS-I.E (optional),
AMS-I.D (optional) AMS-I.C (optional)
Project Emissions
Provision of biomass
residues: CO2
Fossil fuel/ electricity
consumption: CO2
Any other significant
source
In case of electricity production replacing grid electricity AMS-I.D is to be applied in order to calculate the grid emission factor.
AMS-I.E can be combined with AMS-I.C in order to account for a share of fossil fuel, if needed, replaced by the thermal energy gained from the project activity.
Selecting the most appropriate methodology or the most
appropriate combination of methodologies for a household/ small farm biogas programme should take into account various aspects. The methane avoidance component achieves highest emission
reductions in warm climates and in case of anaerobic lagoons or other anaerobic liquid storage. The applicability of AMS-III.R is
not restricted to anaerobic lagoons. However, the estimation of the potential emissions reduction should take into account the
portion of livestock categories‟ manure handled using manure management systems that do not feature the same anaerobic conditions as anaerobic lagoons. Manure management systems
with weaker anaerobic conditions are often not interesting to be included into a methane avoidance component because of
relatively high project emissions that in the worst case might even exceed baseline emissions. If it turns out that the inclusion of the methane avoidance component makes sense, then the
criterion of maximum 5 t CO2e per unit of emission reduction should be checked.
If the production of electricity or mechanical energy makes sense in a household/ small farm biogas programme is questionable and will depend on the available technology. The production of
30
thermal energy is normally directly via the use of biogas in cookers or water heaters.
3 . 5 D a t a c o l l e c t i o n a n d m o n i t o r i n g
The data need of the methodologies is defined by the data need
for the establishment of the baseline and the calculation of project emissions and monitoring requirements. The data
collection itself is not always strictly predefined, but can be modified by the project proponent within a certain range as long as good argumentation is provided.
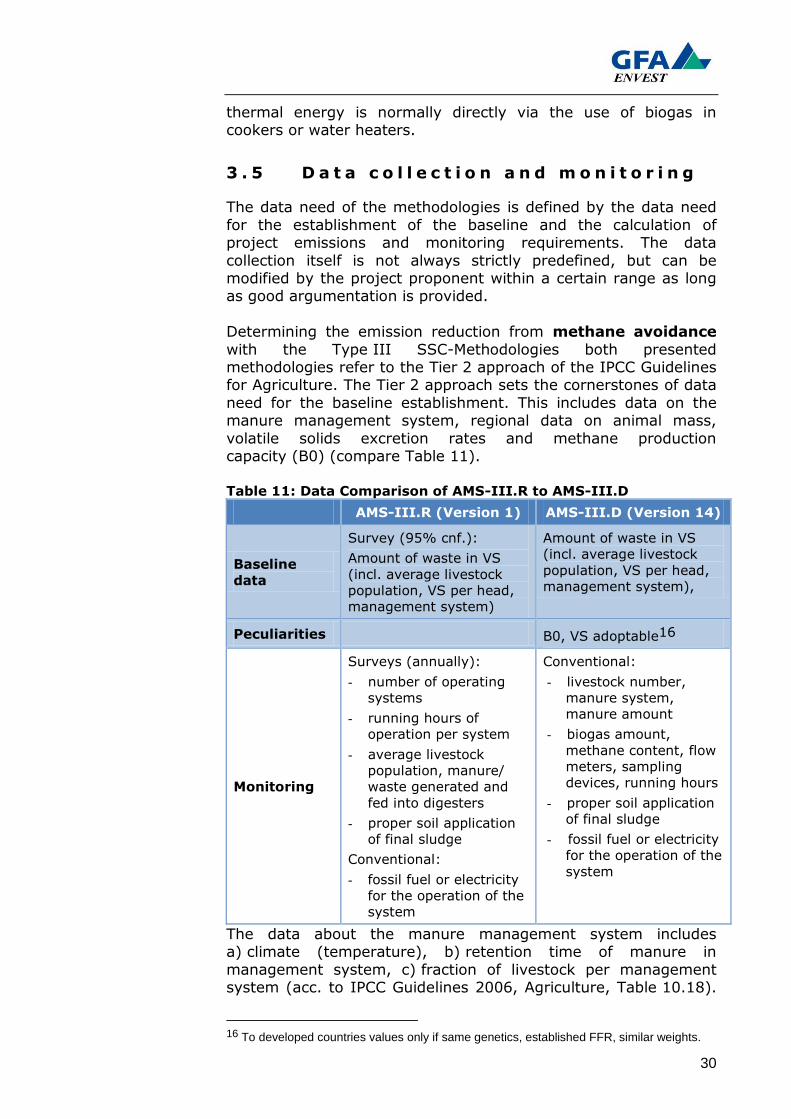
Determining the emission reduction from methane avoidance
with the Type III SSC-Methodologies both presented methodologies refer to the Tier 2 approach of the IPCC Guidelines for Agriculture. The Tier 2 approach sets the cornerstones of data
need for the baseline establishment. This includes data on the manure management system, regional data on animal mass,
volatile solids excretion rates and methane production capacity (B0) (compare Table 11). Table 11: Data Comparison of AMS-III.R to AMS-III.D
AMS-III.R (Version 1) AMS-III.D (Version 14)
Baseline
data
Survey (95% cnf.):
Amount of waste in VS
(incl. average livestock
population, VS per head,
management system)
Amount of waste in VS
(incl. average livestock
population, VS per head,
management system),
Peculiarities B0, VS adoptable16
Monitoring
Surveys (annually):
- number of operating
systems
- running hours of
operation per system
- average livestock
population, manure/
waste generated and
fed into digesters
- proper soil application
of final sludge
Conventional:
- fossil fuel or electricity
for the operation of the
system
Conventional:
- livestock number,
manure system,
manure amount
- biogas amount,
methane content, flow
meters, sampling
devices, running hours
- proper soil application
of final sludge
- fossil fuel or electricity
for the operation of the
system
The data about the manure management system includes a) climate (temperature), b) retention time of manure in
management system, c) fraction of livestock per management system (acc. to IPCC Guidelines 2006, Agriculture, Table 10.18).
16 To developed countries values only if same genetics, established FFR, similar weights.
31
In contrast to the other data, data on the manure management system cannot be displaced by IPCC default values. It is crucial
information in establishing the baseline. The same data must either be fitted to IPCC categories of animal waste management
systems or good scientifically justified argumentation acceptable to the DOE is needed that relates the identified systems to the IPCC categories of systems.
The definition of animal waste management systems in the IPCC
Guidelines for agriculture is meant to represent the whole range of manure management systems worldwide and as such should allow the fitting of an identified system. Within biogas
programmes for households/ small farms, however, the variety of management is huge often even within a single household/ farm.
Further, retention times vary across the cultivation season depending on the type of available crops and alternative utilizations of manure like sale or feeding into fish ponds. These
circumstances should be considered by the project proponent collecting the data on the manure management system.
For the calculation of the emission reduction achieved by utilising
recovered biogas for a fuel switch project component the Type I methodologies offer. Thereof, only AMS-I.C and AMS-I.E are considered in the following. This is due to the fact that AMS-
III.R can only be used in combination with AMS-I.C and that AMS-I.E can be interesting to biogas programmes since it accounts for
emission reductions due to the displacement of non-renewable biomass. Both methodologies are applicable for thermal appliances, the most relevant technology in small biogas
programmes.
In AMS-I.E “Switch from non-renewable biomass for thermal applications by the user” the quantity of biomass substituted can be determined by two different ways. The first is the collection of
historical data or surveyed data on the number of appliances multiplied by an average substitution per appliance. The second is
the calculation from the thermal energy produced by the project activity divided by the calorific value and the efficiency of the old appliance. The measurement of the thermal energy produced for
small scale biogas digesters might confront the project coordinator with problems of quantification/ metering. Equipping
household biogas digesters with gas flow meters usually is not cost effective.
32
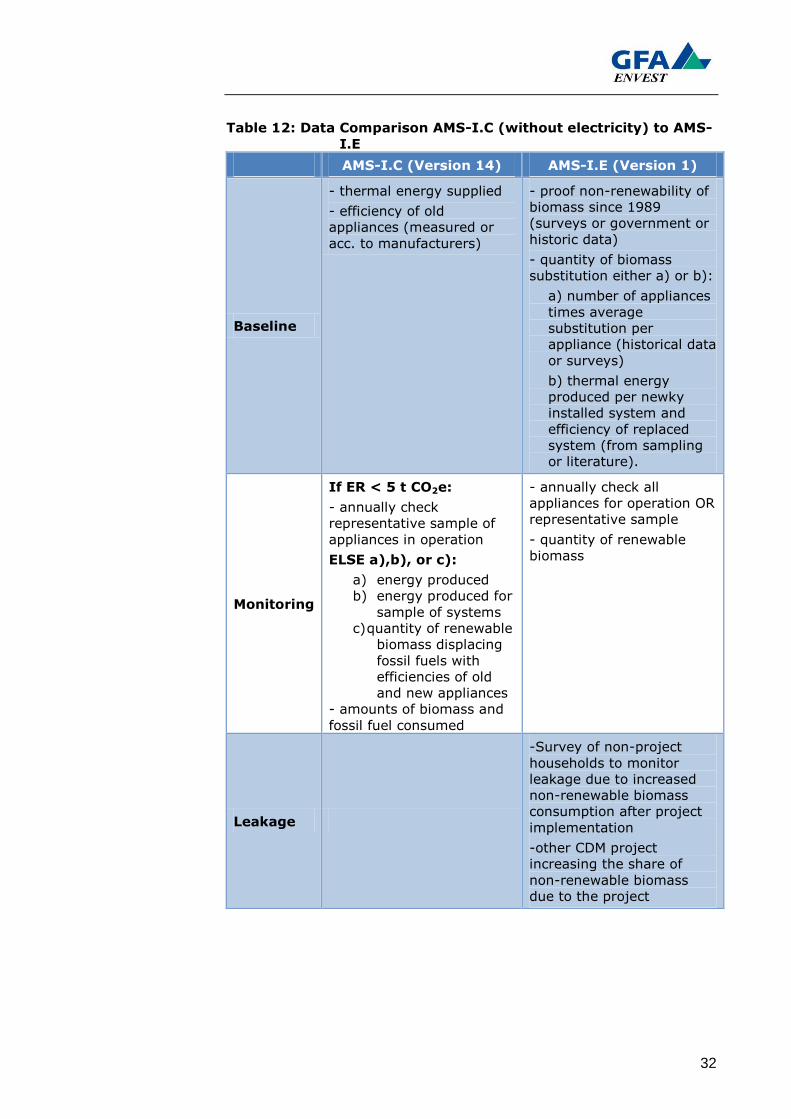
Table 12: Data Comparison AMS-I.C (without electricity) to AMS-
I.E
AMS-I.C (Version 14) AMS-I.E (Version 1)
Baseline
- thermal energy supplied
- efficiency of old
appliances (measured or
acc. to manufacturers)
- proof non-renewability of
biomass since 1989
(surveys or government or
historic data)
- quantity of biomass
substitution either a) or b):
a) number of appliances
times average
substitution per
appliance (historical data
or surveys)
b) thermal energy
produced per newky
installed system and
efficiency of replaced
system (from sampling
or literature).
Monitoring
If ER < 5 t CO2e:
- annually check
representative sample of
appliances in operation
ELSE a),b), or c):
a) energy produced
b) energy produced for
sample of systems
c) quantity of renewable
biomass displacing
fossil fuels with
efficiencies of old
and new appliances
- amounts of biomass and
fossil fuel consumed
- annually check all
appliances for operation OR
representative sample
- quantity of renewable
biomass
Leakage
-Survey of non-project
households to monitor
leakage due to increased
non-renewable biomass
consumption after project
implementation
-other CDM project
increasing the share of
non-renewable biomass
due to the project
33
Statistical Procedures for Data Collection and Monitoring Instead of measuring sampling techniques can be used. The
advantage of sampling is obvious and lies in the reduced number of systems for which data has to be collected. The relation
between the number of systems to the achieved emission reduction is extremely disadvantageous in household projects and often becomes worse in PoAs on household level, which are often
dispersed projects across wide geographical areas. Sampling, however, is not restricted to such variables that are
explicitly allowed for sampling within the respective methodology like shown in the above section on data need. “[...] Project implementers may propose to obtain estimates of [...] variables
using sampling techniques if that is the only practical or cost effective means to obtain them.” (Annex 27, EB47, paragraph 9).
The purpose of sampling is to obtain unbiased and reliable estimates of the mean or total values of key variables. The survey design should assure that inquired households/ farms reflect the
population of households/ farms without a significant deviation between both groups. Certain error levels and confidence levels
are therefore to be defined. The “Draft General Guidelines on Sampling and Surveys” (Annex 27, EB 47) define acceptable error
and confidence levels. In the draft “point estimates for engineering calculation”, “baseline penetration or equipment characteristic”, and “change in technology penetration or
performance” are distinguished against each other. For the first two a minimum confidence level of 90% with a maximum error
level (ε) of ±10% is recommended, for the third a minimum confidence level of 80% with a maximum error level of 20% is prescribed. In the described methodologies AMS-I.C and AMS-
III.R for the variables for which sampling is described ask for a confidence level of 95%.
The integral of the standard normal distribution depends on two variables: the standard deviation of a population and the mean of the population. With larger sample sizes the standard deviation of
the sample decreases and the standard normal distribution takes a steeper form. This means that with larger samples sizes the
confidence level is increased. However, it is not only the confidence level that increases with the sample size, but also the sampling effort. It is the goal to balance this trade-off at an
optimal level. In our case CDM-methodologies or the “Draft Guidelines” predefine the level of accuracy with the confidence
and error level. Thus the question remains which is the minimum sample size to assure the required accuracy. Thereby the relation of the sample size to the population size is less dominant than the
absolute size of the sample. In general, the minimum sample size for infinite populations (the
formula for finite populations delivers smaller values) can be estimated according to Formula 1. Other sources like the “Draft Guidelines on Sampling and Surveys” (CDM EB 47, 2009, Annex
27) suggest to use additionally the coefficient of variation (CV). The coefficient of variation calculates as (σ/μ)2, i.e. the standard
deviation of the sample divided by the mean of the sample.
34
Formula 1: Minimum Sample Size for Infinite Populations (Rinne,
1995)
y
szn
2
22
with: n: minimal sample size
ε: tolerated error (100% - confidence level) z: probability deduced from the central probability of the standard
normal distribution s: standard deviation of the sample y: mean of the sample
The minimum sample size is large enough so that the standard deviation of the sample is small enough to assure that the
required confidence level (reflected in the value of z) is kept at the tolerated error. However, this is only true for random
samples. Other sampling approaches usually require larger samples, which might be overcompensated by reduced costs
through easier executable sampling schemes than random sampling.
35
3 . 6 A d d i t i o n a l i t y
Additionality is an integral part of any emission reduction project. The so-called “additionality proof” needs to demonstrate that the project would not be implemented without carbon
revenues. This proof can be given following the “Tool for the demonstration and assessment of additionality” (CDM EB 39,
2008, Annex 10). Usually projects need to demonstrate that the project achieves a negative or unattractive internal rate of return (IRR) without carbon revenues.
In case of ODA (co-)funded projects it is recommended to check if the project can prove additionality on the programme level (e.g.
that the ODA funds do not suffice for the achievement of programme goals) and on the household level (i.e. that the installation of the biogas plants is not feasible without the support
provided by the programme).
36
3 . 7 O p t i m i z i n g b e n e f i t s f r o m c a r b o n
f i n a n c e
The benefit of carbon finance depends on the amount of CERs per digester, which is again, dependent on the size of digester and
the emission baseline. The existing CDM projects which have characteristics of biogas programmes include such with methane
emission reduction from the change of manure management and the fuel-switch through biogas, while others only include the fuel-switch component. In these projects the CER quantities per
household vary from 1.76 tCO2/year up to 7.0 tCO2/year. These amounts can only be reached in case the baseline emission
originates from fossil fuels, or from non-renewable biomass. In order to prove that the biomass is non-renewable, there is a need
for substantial amounts of data (statistical and survey data). The manure management component can bring in significant share of CERs only in case the applied manure management systems have
high MCF, which often is not the case in household systems.
Table 13: CER estimates for CDM biogas programmes
Programme
name
Nr. of
house-
holds
Size of
bio-
digester
(m3)
Cost
of bio-
digester
Emissions
from
manure
/hh
(tCO2)
Emissions
from fossil
fuels /hh
(tCO2)
Emissions
from fuel-
wood /hh
(tCo2)
Annual
amount
of CERs
Ave-
rage
amount
of CERs
per bio-dige-ster
Bagepalli
CDM Biogas
Programme
(India)
(AMS-I.C)
5,500 2 n.a. n.a. 0.08
(kerosene) 3.56 19,553 3.56
Biogas
Support
Program –
Nepal (BSP
– Nepal)
Activity
1&2 (AMS-
I.C)
Project
1:
9,708
Project
2:
9,688
4-10 183-287 n.a. 0.07
(kerosene) 7.52
Project
1:
46,990
Project
2:
46,893
7.00
Hubei Eco-
Farming
Biogas
Project Phase
(China)
(AMS-I.C +
AMS-III.R)
33,000 8-15 296-420 0.5-0.8 2.5-3.1 (coal)
n.a. 58,219 1.76
Kolar
Biogas
Project and
Hassan
Biogas
Project
(India)
(AMS-I.C + AMS-III.R)
10,000 2-3 250-290 3.47 0.09
(kerosene) 3.26 61,883 6.2
Source KfW PoA blueprint Book, 2009
In case the level of fossil fuel consumption on household level is
low in the baseline, it could be suspected that the demand is suppressed. Under the Gold Standard (GS) “Biodigester”
methodology, this effect is addressed with the possibility to survey only selected households with a higher living standard for
37
which it is assumed the fuel demand was satisfied (“satisfied demand” approach). Also, apart from GS, other VER standards
may be more suitable for providing carbon finance to a biogas programme and the coordinator should investigate all the options
before selecting the standard. Impact of carbon finance
In order to estimate the carbon finance the two SNV programmes with different incentive scheme were compared following the
approach applied in the KfW PoA Blueprint Book. In cases where the programme incentive includes a monetary subsidy to the participant for the investment, the programme
fixed costs are high. The SNV biogas programme in Vietnam is providing the subsidy of 48 EUR as well as financing the
supporting activities. Thus the estimated programme support costs per unit reach up to 120 EUR. Table 14: Overview of the programme costs for a biogas
programme
Cost components Upfront (EUR) Annual (EUR)
Project design and CDM
documentation 250,000 30,000
Monitoring 10,000
Programme support (subsidy,
training etc.) 120 per unit
Programme running costs 12 per unit
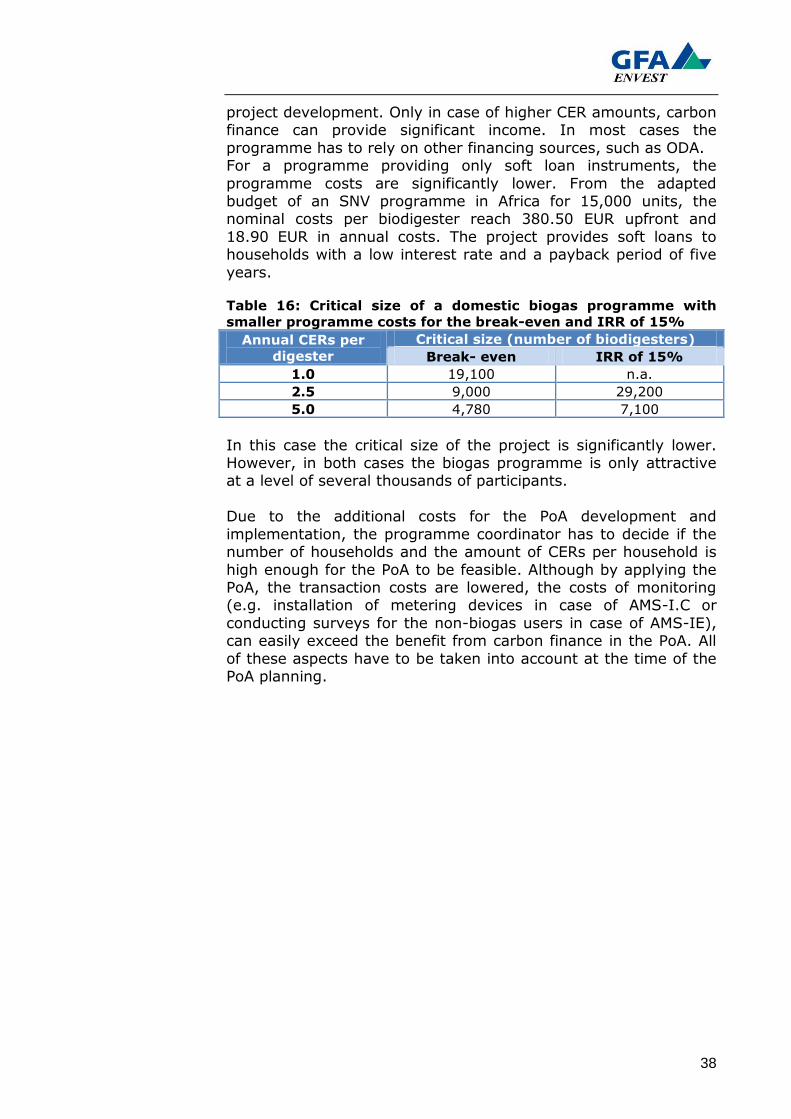
Taking into account 50,000 biogas units, the programme costs per unit reach 125 EUR upfront and 12.8 EUR annually.
In order to calculate the critical size of the programme for the break-even and the IRR of 15%, the CERs generation is taken
into account in three scenarios: (i) 1.0 tCO2/a resulting from small to medium digester, applying one methodology; (ii) 2.5
tCO2/a resulting from larger scale digester or combination of two methodologies; and (iii) 5 tCO2/a resulting from large scale digester and applying the combination of two methodologies. For
the calculation of the critical size of the project, a CER price of 10 EUR has been taken.
Table 15: Critical size of a domestic biogas programme with
higher support costs for the break-even and IRR of 15%17
Annual CERs per
digester
Critical size (number of biodigesters)
Break- even IRR of 15%
1.0 n.a. n.a.
2.5 13,500 80,000
5.0 2,660 3,530
As it can be seen in case of lower CER amounts per biodigester, the programme cannot rely on carbon revenues since the break-
even point is not achieved due to the high fixed costs for the
17 The discount rate of 10% for the calculation.
38
project development. Only in case of higher CER amounts, carbon finance can provide significant income. In most cases the
programme has to rely on other financing sources, such as ODA. For a programme providing only soft loan instruments, the
programme costs are significantly lower. From the adapted budget of an SNV programme in Africa for 15,000 units, the nominal costs per biodigester reach 380.50 EUR upfront and
18.90 EUR in annual costs. The project provides soft loans to households with a low interest rate and a payback period of five
years.
Table 16: Critical size of a domestic biogas programme with
smaller programme costs for the break-even and IRR of 15%
Annual CERs per
digester
Critical size (number of biodigesters)
Break- even IRR of 15%
1.0 19,100 n.a.
2.5 9,000 29,200
5.0 4,780 7,100
In this case the critical size of the project is significantly lower. However, in both cases the biogas programme is only attractive at a level of several thousands of participants.
Due to the additional costs for the PoA development and
implementation, the programme coordinator has to decide if the number of households and the amount of CERs per household is
high enough for the PoA to be feasible. Although by applying the PoA, the transaction costs are lowered, the costs of monitoring (e.g. installation of metering devices in case of AMS-I.C or
conducting surveys for the non-biogas users in case of AMS-IE), can easily exceed the benefit from carbon finance in the PoA. All
of these aspects have to be taken into account at the time of the PoA planning.
39
3 . 8 M a i n o b s t a c l e s i n d e v e l o p i n g
t h e P o A
The development of PoAs for biogas programme for households faces the obstacles related to the general PoA, as well as the
obstacles specific to the biogas programme for households.
Lack of data
In order to apply the CDM methodologies for the PoA CDM project and to develop the baseline extensive data is required. In case of biogas plants the data about the fossil fuel consumption for
cooking is needed, the data for the assessment of the non-renewable firewood and the data about the applied manure
management systems. Agricultural statistics usually do not collect and show data about small and medium farms (households), and
a programme coordinator has to obtain this data through surveys. Although the CDM EB allows project developers to use surveys for the data collection, the first draft procedures for sampling and
surveys for data collection have only be issued in May 2009. The collection of data via surveys has also proven to be difficult since
(local) staff usually require training and trial and error processes are often necessary and time consuming. Questionnaires are usually poorly understood by farmers since the data need for a
CDM project is something new to them. In order to improve understanding and thus data quality, the questionnaires should
apply locally recognized units for amounts of fuel consumed and the locally applied manure managements systems. An example of the manure management questionnaire and fuel consumption
questionnaire is provided in Annex.
High monitoring costs
From the applicable methodologies for the household biogas units, only AMS-III.R is completely adapted to the micro- household level. The Type I methodologies, namely AMS-I.C has
some provisions related to households (e.g. simplified monitoring in case the emission reduction per system is less than 5 t CO2
eq.), but it was rarely applied so far. The simplified monitoring for the AMS-I.C includes the measurements of the biogas consumed. The costs of the measuring equipment, even only applied to the
sample, would entail increased investment costs and training costs. This would significantly burden the biogas programme.
40
Unclear carbon rights Before the PoA implementation the carbon rights have to be
resolved. The standard approach is that the farmers participating in the programme have to cede their carbon rights against the
programme subsidy for the biogas installation. In this case the carbon revenues can support the programme financing. However, the farmer has little or no incentive to participate in the project
monitoring. The other option is that the subsidy to the farmer is financed by the carbon revenues. This option has limited
application for national biogas programmes since the subsidy for the initial investment is one of the main incentives for the farmers´ participation in the programme. Farmers will not trust in
carbon revenues, an asset they are not familiar with.
ODA diversion
Biogas programmes are often dependent on public funding. In case the programme is (co)financed using ODA, then the issue of ODA diversion has to be cleared out. ODA diversion refers to the
problem that ODA funding may be used to finance industrial countries efforts for meeting emission targets. The Development
Assistance Committee of the Organization of Economic Cooperation and Development (OECD-DAC) developed a note on
good practice for ODA diversion. OECD (2004) concludes that ODA funds may finance emission reduction projects, but the generated emission certificates shall not be transferred to the
donor without financial compensation. At its 7th Meeting in Marrakesh, in 2001 the Conference of the
Parties (CP) to the UNFCCC agreed on modalities and procedures for a Clean Development Mechanism. In particular, it was agreed (CP7, decision 17) “that public funding for clean development
mechanism projects from parties in Annex 1 is not to result in the diversion of official development assistance and is to be separate
from and not counted towards the financial obligations of Parties included in Annex I”. In case the programme uses ODA financing it is necessary to
prove that no ODA diversion will occur. In order to be on the safe side, the ODA provider and the carbon buyer should come from
the different Annex I parties.
41
Regulatory barriers The regulatory barriers have been partially lifted and modified by
EB in May 2009 (EB 47). However, several barriers are still valid:
- Liability of DOEs - CPAs can be reviewed within one year
after the inclusion of CPA or renewal of the crediting period of the CPA, or six months “after the issuance of CERs for that CPA”. In case the CPA is excluded, the DOE is liable for
CERs issued from rejected CPAs.
- Starting date of a CPA – the decision on PoA states that
the staring date of a CPA can only be after the validation of the PoA-DD.
- Constant adaptation to methodologies – in case the
approved methodology is put on hold or withdrawn, no new CPAs will be included in the PoA. If the methodology is
revised, the PoA has to be revised accordingly18.
- Combination of methodologies requires approval from the EB - Since the EB 47th meeting it is allowed to
combine one or more methodologies for PoAs. However, while the combination of methodologies is widely used in
standard CDM, it requires special approval from the EB following the “Procedures for approval of the application of
multiple methodologies to a programme of activities” (EB 47). This is probably going to hamper the use of combined methodologies, and PoA itself, since the procedure for
obtaining the approval might require too much time.
18 However, such revisions are not required in cases where a methodology is revised
without being placed on hold or withdrawn (Annex 29, EB 47).
42
4 C O N C L U S I O N S A N D C H A L L E N G E S
The conclusions and challenges given here are based on the experiences from the existing programmes in Nepal, Africa and Vietnam as well as on the findings of the Study “PoA concept
development for the use of biogas installations in small and medium sized pig farms for a decentralized energy supply in
Vietnam”.
Figure 12 Lessons learned on CDM from the SNV Nepal Biogas
Programme
The Biogas Support Programme (BSP) has been operating in Nepal
since 1992. Currently, the Programme is in its fourth phase (July
2003-June 2009) and is targeting to install 200,000 biogas plants
during this phase.
Two small scale biogas CDM projects got registered in December
2005 with the CDM Executive Board. These 2 CDM projects comprise
19,396 plants build through the Programme in the period November
2003 to April 2005.
One of the major problems during the conception of these projects
was the use of the methodology. The two registered projects are
using AMS I.C (version 6). However this methodology did not have
any provisions for the replacement of non-renewable biomass in the
baseline. Although the projects got registered, it started a process
with the CDM Executive Board and its small scale methodology
working group to develop a methodology applicable in this situation.
A new methodology was not available until early 2008, blocking the
development and registration of any new projects for two years. The
new methodology finally approved, takes a more conservative
approach therefore reducing the expected credits per biogas plant.
The most important lesson learned from this was the time and effort
it takes to go through these processes with the CDM Executive Board
while the outcome can be uncertain.
Another important lesson was the improvements necessary in the
Programme approaches and systems to meet the CDM requirements.
Particularly, improvements around the areas of quality control and
monitoring systems, database management system, and
environmental impact monitoring have been made. These
improvements were necessary to be able to both provide more
detailed data and also to keep collecting data over a longer period
than would have been required under normal Programme
requirements.
The first verification of the projects took place in December 2006,
however up to the second quarter of 2009, no CERs have been
issued. Problems arose around the monitoring plan for the projects
and how monitoring was performed in practice. The lesson learned
here is on the importance of a clear, specific and realistic monitoring
plan and the need for specific (and sometimes separate) monitoring
of the plants in the CDM project, even if they are part of a bigger programme.
43
Source: SNV Nepal
Conclusions:
- The primary incentive for installing biodigesters for farmers
is saving fuel costs. The second incentive is dealing with waste management problems like odour. Odour problems from manure occur often in densely populated areas with
high livestock farming density.
- By avoiding the use of fossil fuels and recovery of
methane, farmers contribute to the mitigation of greenhouse gases. Also the use of bio-slurry as organic fertilizer improves the soil quality and reduces mineral
fertilizers costs.
- Biodigester programmes furthermore have positive
sustainable development effects such as alleviating the workload for women and children and easing health problems due to indoor pollution.
- Biodigesters cost between EUR 200 and EUR 1,000 and high initial investment costs are the main barrier for
households installing biodigesters (KfW PoA Blueprint Book, 2009). In some countries, this can be successfully alleviated by developing suitable micro-finance support
systems or by introduction of financial incentives
- The PoA approach can support biogas programmes by
providing additional revenues. However, the transaction costs and monitoring costs have to be taken in consideration because carbon revenues can only give small
contribution to the programme implementation costs and prefinancing of grants and loans.
- A high-quality and cost-effective design of biodigesters and annual and solid aftersales service is important to ensure the lifetime of the installation and its use in the households
(KfW PoA Blueprint Book, 2009)
- Depending on size and region biodigesters reduce GHG by
between 0.5 and 7 t CO2e/year.
Looking forward, new challenges are coming up regarding the
debundling rules for small scale CDM projects and the possibilities
and difficulties in using a PoA approach. New lessons will need to be
learned in these processes. Therefore the biggest lesson learned
might be on the high demands the CDM puts on programme
implementers through its relative complexity and constantly changing methodological and procedural framework.
44
Challenges:
- This type of project will unlikely be of sufficient profitability for a commercial approach and needs public support. Seed
funding for grants and subsidies to credit lines are needed and the potential CER buyer or private investor has to undertake the risk of the PoA, or the programme has to
seek the support of the public institution or international donors (KfW PoA Blueprint Book, 2009). In this case ODA
diversion and additionality can be questioned
- The carbon finance has to be optimized so that the approach (PoA, standard CDM or VER) and methodologies
are selected which bring the highest profit (considering revenues and transaction and monitoring costs).
- The PoA is more suitable for well-established programmes as application period is long, in addition to the high critical mass of digesters required to secure the financial
attractiveness of the programme, requiring a high number of programme participants. In this case “prior consideration
of CDM” proof is needed (see chapter 3.1).
- The technical support (installation and management) is of
greatest importance and the incentives for all actors have to be designed in a proper way.
- The PoA set-up has to be flexible enough to adapt to the
market conditions due to the long period of adaptation and dynamic changes in the population habits in developing
countries.
45
5 A N N E X
5 . 1 A n n e x I - M a n u r e m a n a g e m e n t q u e s t i o n n a i r e - E x a m p l e
Instructions for filling in the questionnaire This questionnaire is used for the identification of the livestock population and manure quantities and management on the farm. The first part of the questionnaire is for the description of the livestock population present at the farm at the time the questionnaire is filled-out.
The second part is designed to provide data about the manure application and
manure management systems. Where the provided answer is only Yes/No please answer by marking one of the two. In case the answer to the question is positive, please answer the sub question. In case the answer in negative, please continue to the next question. In case the answers provided are not clear please
ask the local BPD staff for explanations. The descriptions of the manure management systems are provided below the question 5. After completing the questionnaire please perform the check as described at the bottom of the page (the sum of the % given in the sub questions 1 to 5 for each animal category should be 100%). Thank you for your cooperation!
Part 1 Data about livestock on the farm
Animal type Swine
(sows, >
90kg)
Piglets
(<25 kg)
Porker
s (25-90 kg)
Cow Buffal
o
Poultr
y
Other
Number of animal
Average weight of
the animal
Are they grazing? If yes how many hours per day?
Part 2
Data about manure application and manure management
1. Do you have an installed bio-digester? Yes/No
a. If yes how many % of the manure are you feeding in?
i. pig_____(%)
ii. Cattle _____(%)
iii. Chicken _______(%)
2. Do you sell part of your manure? Yes/No
a. If yes which manure? Pig manure/ Cattle manure/chicken/All
46
b. If yes how many % of the manure?
i. pig_____(%)
ii. Cattle _____(%)
iii. Chicken _______(%)
3. Do you burn manure as fuel? Yes/No
a. If yes how many % of the manure? _____ (%)
4. Do you discharge the manure into the fish pond? Yes/No
a. If yes, how many % of the manure? ____(%)
i. pig_____(%)
ii. Cattle _____(%)
iii. Chicken _______(%)
5. Do you use the manure as fertilizer? Yes/No
a. If yes, how many % of the manure? ............................._____(%)
i. pig_____(%)
ii. Cattle _____(%)
iii. Chicken _______(%)
b. If yes, for the manure used as fertilizer put in the share of the
manure management method applied for pig manure:
Daily spread
Lagoon Sewage Pile (solid storage)
Earth pond or cement tank with cover
Earth pond or cement tank without cover
Pit < 1month
Pit >1 month
(%)
(%) (%) (%) (%) (%) (%) (%)
c) If yes, for the manure used as fertilizer put in the share of the
manure management method applied for cattle manure:
Daily sprea
d
Lagoon
Sewage
Pile (solid
storage
Earth pond
or
Earth pond
or
Pit <
1mont
Pit >1
mont
47
) cement tank with
cover
cement tank withou
t cover
h h
(%)
(%) (%) (%) (%) (%) (%) (%)
Daily spread Manure is routinely removed from a confinement facility and is applied to cropland or pasture within 24 hours of excretion.
Lagoon (Uncovered
anaerobic lagoon)
A type of liquid storage system designed and operated to combine waste stabilization and storage. Lagoon
supernatant is usually used to remove manure from the associated confinement facilities to the lagoon. Anaerobic lagoons are designed with varying lengths of storage (up to a year or greater), depending on the
climate region, the volatile solids loading rate, and other operational factors. The water from the lagoon may be recycled as flush water or used to irrigate and fertilize fields.
Pile (solid storage)
The storage of manure, typically for a period of several months, in unconfined piles or stacks. Manure
is able to be stacked due to the presence of a sufficient amount of bedding material or loss of moisture by evaporation.
Earth pond or
cement tank
(liquid/slurry)
Manure is stored as excreted or with some animal
addition of water in either tanks or earthen ponds
outside the animal housing, usually for periods less than one year.
Pit (pit storage below animal confinements)
Collection and storage of manure usually with little or no added water, typically below a slatted floor in an enclosed animal confinement facility, usually for periods less than one year.
Check for the properly completed questionnaire The questionnaire has been properly completed in case the sum of the % for the sum questions of the questions 1 to 5 for each animal type is 100%. Also the sum of the % given in the question 5 sub question b) and c) should be 100%.
Thank you for your cooperation!
48
5 . 2 A n n e x I I – B a s e l i n e f u e l
c o n s u m p t i o n q u e s t i o n n a i r e – e x a m p l e
1. General data: Name:
Village:
Date:
Number of people in the household
Income ___________ per day per week per month per year
2. Fossil fuel consumption: Coal
Use Cooking Lighting Other use
Amount (kg) ___________ per day per week per month per year
Price ___________
LPG
Use Cooking Lighting Other use
Amount (kg) ___________ per day per week per month per year
Price ______________
Kerosene
Use Cooking Lighting Other use
Amount (kg) ____________ per day per week per month per year
Price ___________
3. Biomass consumption: Firewood
Use and source Amount (kg)
Used for cooking ____________ per day per week per month per year
Used for other purposes
____________ per day per week per month per year
Purchased ____________ per day per week per month per year
Collected from forests
____________ per day per week per month per year
Collected from private land
____________ per day per week per month per year
Other source (specifiy)______
____________ per day per week per month per year
Purchased Wood:
Price _______________
Price trend in recent years
Increasing Stable Decreasing Don´t know
Collected wood: Time spent collecting (hours)
________
per day per week per month per year
Trend in time taken to collect wood in recent years:
Increasing Stable Decreasing Don´t know
Distance to collection
_________
Distance trend in past years
Increasing Stable Decreasing Don´t know
Type of firewood collected (if possible provide approximate share)
Chopped trees: _________
Chopped branches: _________
Dead wood on ground: _________
Other: _________
Other biomass
Type (specify) Amount (kg)
____________ per day per week per month per year
____________ per day per week per month per year
49
6 L I T E R A T U R E
Hayashi, D. et al. (2009): PoA Blueprint book, KfW Bankengruppe
Hinostroza, M. et al. (2007): Potentials and barriers for end use
energy efficiency under programmatic CDM, Working paper no. 3, CDM4CDM, UNEP
Kanel, N. (1999): An Evaluation of BSP Subsidy Scheme for Biogas Plants - Final Report
Silwal, B. (1999): A Review of the Biogas Programme in Nepal,
Kathmandu
SNV (2005): Report on the Feasibility Study for a Biogas Support Programme in the Republic of Rwanda
SNV (2007): SNV and Energy Interventions
SNV Vietnam, MARD (2006): Summary project proposal “Biogas Program for the animal husbandry sector of Vietnam, Phase II,
2007-2010”.
SNV Vietnam (2006): Training module for Biogas Technicians.
Steinfeld, H. (2006): Livestock‟s Long Shadow Environmental Issues
and Options
Ter Heegde, F., Teune, B. (2009): Greenhouse gas emission reduction of domestic biogas installations in Vietnam:Testing
methodologies on practical feasibility.
Teune, B. (2007): The Biogas Programme in Vietnam; Amazing results in poverty reduction and economic development published in
Boiling Point No. 53 - www.hedon.info/docs/BP53-Teune-5.pdf
UNEP Risoe CDM/JI pipeline analysis and database http://www.cdmpipeline.org/
Van Nes, W. (2006): Asia hits the gas, published in Renewable energy world (Jan.–Feb. 2006) - http://www.snvworld.org/en/Documents/20060209%20Article%20o