53
184 High St. Suite 603, Boston, MA, 02110 • www.faireconomy.org • [email protected] • 617-423-2148 Pocket Political Education Slides & Handouts

184 High St. Suite 603, Boston, MA, 02110 • www.faireconomy.org • [email protected] • 617-423-2148
Pocket Political EducationSlides & Handouts

184 High St. Suite 603, Boston, MA, 02110 • www.faireconomy.org • [email protected] • 617-423-21482
The Nation in Crisis
H Growing Insecurity Unstable employmentStagnant wagesInsecure pensionsRoller-coaster stock market
H Greater BurdensLonger work hoursLoss of family timeRising costs of housing, health care, education, utilities, and food
H Stress, Isolation & Scapegoating Anger at immigrantsCriminalizationEnvironmental crisisEndless war

184 High St. Suite 603, Boston, MA, 02110 • www.faireconomy.org • [email protected] • 617-423-21483
$60,000
$50,000
$40,000
$30,000
$20,000
$10,000
$70,000
Median Adjusted Household Income by Race, 1967-2016
Racial income inequality persists
White
Asian
Black
Latino
2007 20161997198719771967
$39,490
Source: Pew Research Center’s Tabulations of 1968-2016 Current Population Survey Annual Social and Economic Supplement.
$80,000
$90,000
$65,041
$47,675
$81,431
*Data on Asian Americans can be mis-leading. Many data sets group together populations of Asian immigrants that have very different civic, economic and cultural characteristics .

184 High St. Suite 603, Boston, MA, 02110 • www.faireconomy.org • [email protected] • 617-423-21484
Median Annual Earnings for Women & Men, 1960-2015
$50,000
$45,000
$40,000
$35,000
$30,000
$25,000
$20,000
$15,0001960 1965 1970 1975 1980 1985 1990 1995 2000 2005 2010
The gender wage gap continues
Notes: Annual earnings data include self-employed workers; weekly data are for wage and salary workers only. Annual earnings are for people 15 years old and older beginning in 1980 and people 14 years old and older as of the following year for previous years. Before 1989 annual earnings are for civilian workers only. Weekly earnings are for full-time civilian workers aged 16 and older in and are not restricted to full-year workers. Full-time is work for at least 35 hours per week, full-year for at least 50 weeks per year. Annual median earnings data are typically released in September by the U.S. Census Bureau. The annual average of weekly median earnings is usually released in February by the U.S. Bureau of Labor Statistics. Both data series are derived from the Current Population Survey. Adjustments for data from earlier years to 2015 dollars are computed on the basis of the Consumer Price Index Research Series (CPI-U-RS); U.S. Bureau of Labor Statistics <http://www.bls.gov/cpi/cpiursai1977-2015.pdf> (accessed September 2016).
Source: Institute for Women’s Policy Research, IWPR Fact Sheet #C446, updated September 2016.
$51,212
$37,608$40,742
$22,819
Men
Women
2015

184 High St. Suite 603, Boston, MA, 02110 • www.faireconomy.org • [email protected] • 617-423-21485
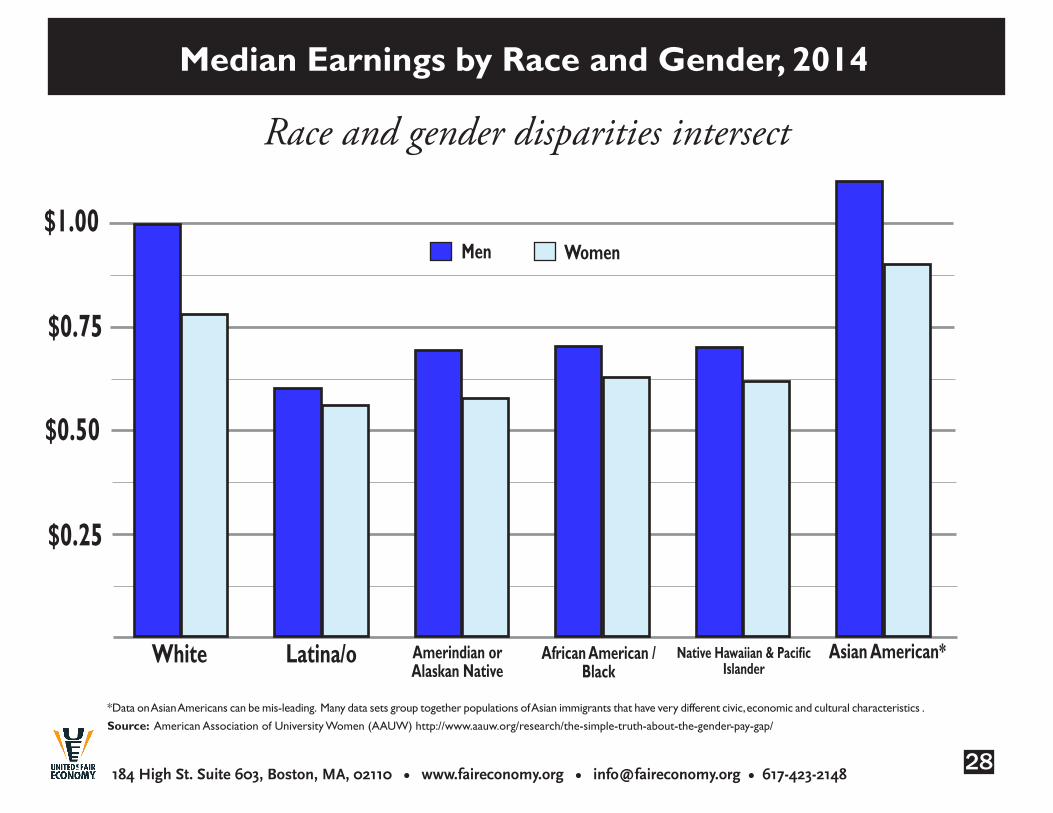
Median Annual Earnings by Race and Gender, 2014
Race and gender disparities intersect
White Latina/o Amerindian or Alaskan Native
African American / Black
Native Hawaiian & Pacific Islander
Asian American*
*Data on Asian Americans can be mis-leading. Many data sets group together populations of Asian immigrants that have very different civic, economic and cultural characteristics .
Source: American Association of University Women (AAUW) http://www.aauw.org/research/the-simple-truth-about-the-gender-pay-gap/
$0.25
$0.50
$0.75
$1.00Men Women

184 High St. Suite 603, Boston, MA, 02110 • www.faireconomy.org • [email protected] • 617-423-21486
The income gap has expanded
70%
60%
50%
40%
30%
20%
10%
+78%
Bottom 20% Second 20% Middle 20% Fourth 20% Top 20% Top 5%
0%
80%
+54%
+26%
+12%
–12%
Top 1%
+185%
Real Family Income Growth by Quintile & for Top 5% & Top 1%, 1979 - 2014
Source: For quintiles and top 5%: US Census Bureau Historical Income Tables, Table F-1 (Income Limits 1947-2014) and Table F-3 (Mean Income 1947-2014). For income threshold for top 1%: “Income Inequality in the United States, 1913-1998” Emanuel Saez with Thomas Piketty, Quarterly Journal of Economics, updated to 2014 in Excel format, June 2015 (TabFig2014prel.xls). For percent growth: of top 1% “Growing Together Growing Apart - Real Income Growth 1979-2012” by Colin Gordon <http://scalar.usc.edu/works/growing-apart-a-political-history-of-american-inequality/index>.
$29,101 -$52,697
$52,698 -$82,032
$82,033 -$129,006
$230,030and upUp to $29,100 $129,007
and up$423,090and up
+3%

184 High St. Suite 603, Boston, MA, 02110 • www.faireconomy.org • [email protected] • 617-423-21487
120%
100%
80%
60%
40%
20%
0%
+116%+100%
+111% +114%+99%
+86%
$9,861 -$16,215
$16,215 -$22,972
$22,972 -$31,632
$31,632 -and up
Bottom 20%
Second 20%
Middle 20%
Fourth 20%
Top 20%
Top 5%
This gap wasn’t as large before
Real Family Income Growth by Quintile & for Top 5%, 1947 - 1979
Sources: Analysis of Census Bureau data from The State of Working America 1994-95, Mishel, Lawrence and Bernstein, Jared, p. 37. Income ranges in 1979 dollars, from March 2000 Census Current Population Survey, Table F-1.
In 1979: up to
$9,861 $50,746 -
and up

184 High St. Suite 603, Boston, MA, 02110 • www.faireconomy.org • [email protected] • 617-423-21488
What’s the Difference Between Income & Wealth?
Think of a running stream that flows through a lake.• Income is the money &
assets that flow into the lake.
•Expenses are the money & assets that flow out.
•Ifthere’sanythingleftover,that’syourNet Wealth.
184 High St. Suite 603, Boston, MA, 02110 • www.faireconomy.org • [email protected] • 617-423-21489
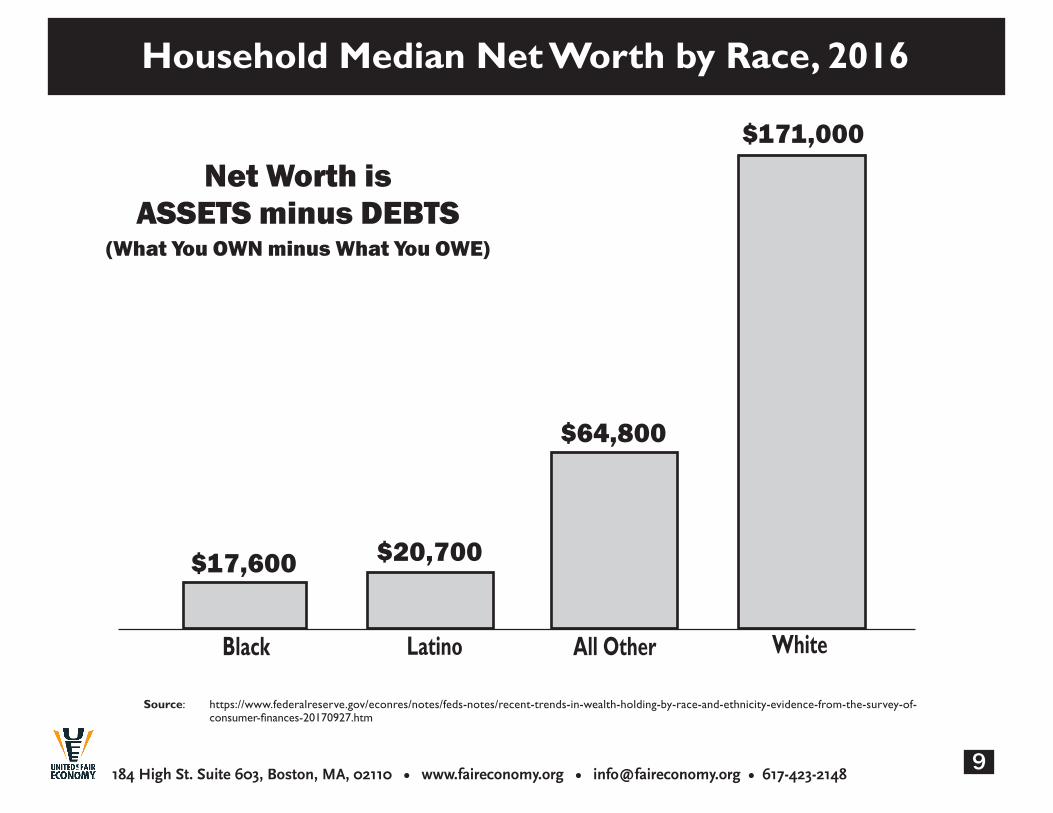
Net Worth isASSETS minus DEBTS
(What You OWN minus What You OWE)
$17,600
$171,000
$20,700
Black WhiteLatino
Household Median Net Worth by Race, 2016
Source: https://www.federalreserve.gov/econres/notes/feds-notes/recent-trends-in-wealth-holding-by-race-and-ethnicity-evidence-from-the-survey-of-consumer-finances-20170927.htm
$64,800
All Other

184 High St. Suite 603, Boston, MA, 02110 • www.faireconomy.org • [email protected] • 617-423-214810
$30,000
$20,000
$10,000
$0$200
$15,640
$28,900
$100
BlackWomen
WhiteWomen
WhiteMen
LatinaWomen
Median Wealth for Single Women by Race/Ethnicity & Single White Men, 2013
Source: Center for Global Policy Solutions <http://globalpolicysolutions.org/resources/wealth-gap-women-color/>.
Gender- and race-based disparities limit women’s ability to build wealth.

184 High St. Suite 603, Boston, MA, 02110 • www.faireconomy.org • [email protected] • 617-423-214811
Ownership of Household Wealth in the U.S., 2016
60.3%
Top 1%
Source: Billionaire Bonanza: The Forbes 400 and the Rest of Us by Chuck Collins and Josh Hoxie
Bottom 99%
The total net worth of the top 1% = $33.4 Trillion
39.7%

184 High St. Suite 603, Boston, MA, 02110 • www.faireconomy.org • [email protected] • 617-423-214812
Ownership of Global Wealth, est. 2014
Top 1%
Source: Global Wealth Report 2014. Credit Suisse Research Institute, October 2014.
Bottom 99%
48.2%
51.8%
184 High St. Suite 603, Boston, MA, 02110 • www.faireconomy.org • [email protected] • 617-423-214813
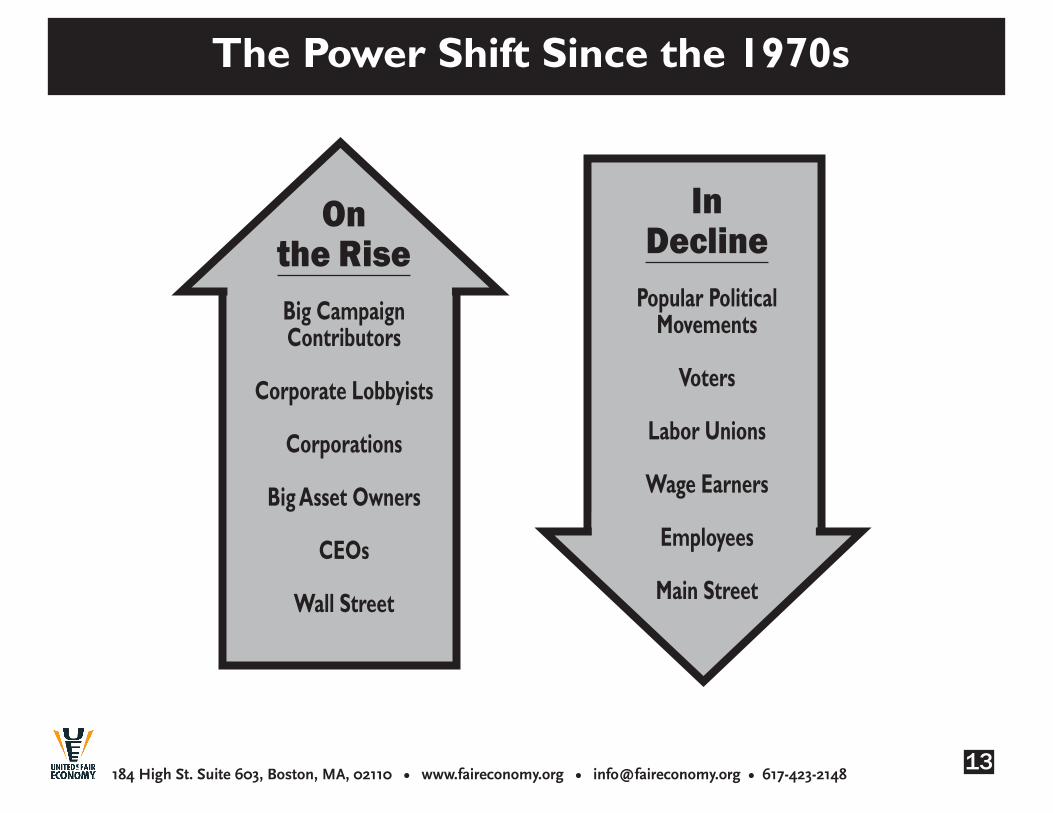
The Power Shift Since the 1970s
On the Rise
Big Campaign Contributors
Corporate Lobbyists
Corporations
Big Asset Owners
CEOs
Wall Street
In Decline
Popular Political Movements
Voters
Labor Unions
Wage Earners
Employees
Main Street

184 High St. Suite 603, Boston, MA, 02110 • www.faireconomy.org • [email protected] • 617-423-214814
Rule Changes Since the 1970s
Policy changes reflect and reinforce the power shift.
Minimum Wage: Not raised to keep up with inflation & increased cost of living.
Unions: Anti-union climate weakens the power & voice of workers.
Trade: Global treaties benefit corporations, not workers or communities.
Taxes: Taxes descreased for the corporate elite and increased for workers.
Budget: Public services cut. Corporate subsidies expand.
Privatization: Government outsourcing plus no-bid contracts hurts taxpayers, workers, and public safety.
Criminalization: People of color targeted, keeping racial divide in place.

184 High St. Suite 603, Boston, MA, 02110 • www.faireconomy.org • [email protected] • 617-423-214815
The Minimum Wage and the Poverty Line, 1968-2015
$11.00
$10.00
$9.00
$8.00
$7.00
$6.00
$5.00
$4.00
$3.00
$2.00
$1.00
$0
The federal minimum wage does not keep pace with the rising cost of living.
Poverty Line $1.71
Minimum Wage $1.60
196894% of the poverty wage
Minimum Wage $2.90
197981% of the poverty wage
Poverty Line $3.56
Sources: Living wage is calculated by dividing that year’s poverty threshhold for a family of four by 2080 hours (52 weeks x 40 hours). Poverty threshholds for 1968 and 1979 from U.S. Census Bureau, Historical Poverty Tables, Table 1. Poverty threshholds for 2015 from the U.S. Census Bureau, Poverty thresholds by Size of Family and Number of Children.
Minimum Wage $7.25
Poverty Line $11.60
201563% of the poverty wage

184 High St. Suite 603, Boston, MA, 02110 • www.faireconomy.org • [email protected] • 617-423-214816
Percentage of the Workforce in a Union, 1930-2017
35%
30%
25%
20%
15%
10%
5%
0%1930 1940 1950 1960 1970 1980 1990 2000 2010 2017
Anti-union policies weaken the power & voice of workers.
1981: Reagan Breaks
PATCO
1937: Wagner Act
1936: Sit-Down Strike
in Flint, MI
Manufacturing Declines in U.S.
1947: Taft-Hartley Act
Source: Bureau of Labor Statistics
“Right-to-work” rules Expand to 25 states
2017: 10.7% Unionized

184 High St. Suite 603, Boston, MA, 02110 • www.faireconomy.org • [email protected] • 617-423-214817
“Free” Trade Treaties Help Corporations, Not Workers or Communities
The aim of treaties such as NAFTA is to reduce “barriers” to trade. The worldwide result:• Jobs shifted to low-wage countries• Lower wages and living standards• Weakened worker rights• Environmental damage
• Weakened economies in developing nations• Cuts in social safety nets• Rise in poverty
New trade & investment agreements, such as the Trans-Pacific Partnership (TPP) . . .• permit foreign corporations operating in the U.S. to ignore
U.S. laws that protect the environment and workers’ rights;• threaten laws that protect community lending, health and
safety, pay equity, pro-human rights government purchasing rules, public control of water & education, etc.
FORSALE

184 High St. Suite 603, Boston, MA, 02110 • www.faireconomy.org • [email protected] • 617-423-214818
• Restricts credit - no loans to small farmers
• Lowers tariffs & opens markets - cheap imports flood the marketplace
• Reduces government spending to pay back foreign debt - cuts welfare, education, health care, etc. - but continues support for the military
• Lowers wages & cuts price subsidies
• Privatizes state industries
• Deregulates financial markets
Structural Adjustment

184 High St. Suite 603, Boston, MA, 02110 • www.faireconomy.org • [email protected] • 617-423-214819
Top Marginal Income Tax Rates for the Top 1%and the Median Family, 1947-2018
Big tax breaks for the wealthy - No tax relief for working families
80%
70%
60%
50%
40%
30%
20%
10%
0%1947 1955 1960 1965 1970 1975 1980 1985 1990 1995 2000 2005 2018
90%
91%
Top 1%70%
50%
Median Family
19%
31%
40%35%
22%25%28%25%
Source: Tax Foundation <http://www.taxfoundation.org/files/federalindividualratehistory-200901021.pdf>. & <https://taxfoundation.org/2018-tax-brackets/>
37%
22%
184 High St. Suite 603, Boston, MA, 02110 • www.faireconomy.org • [email protected] • 617-423-214820
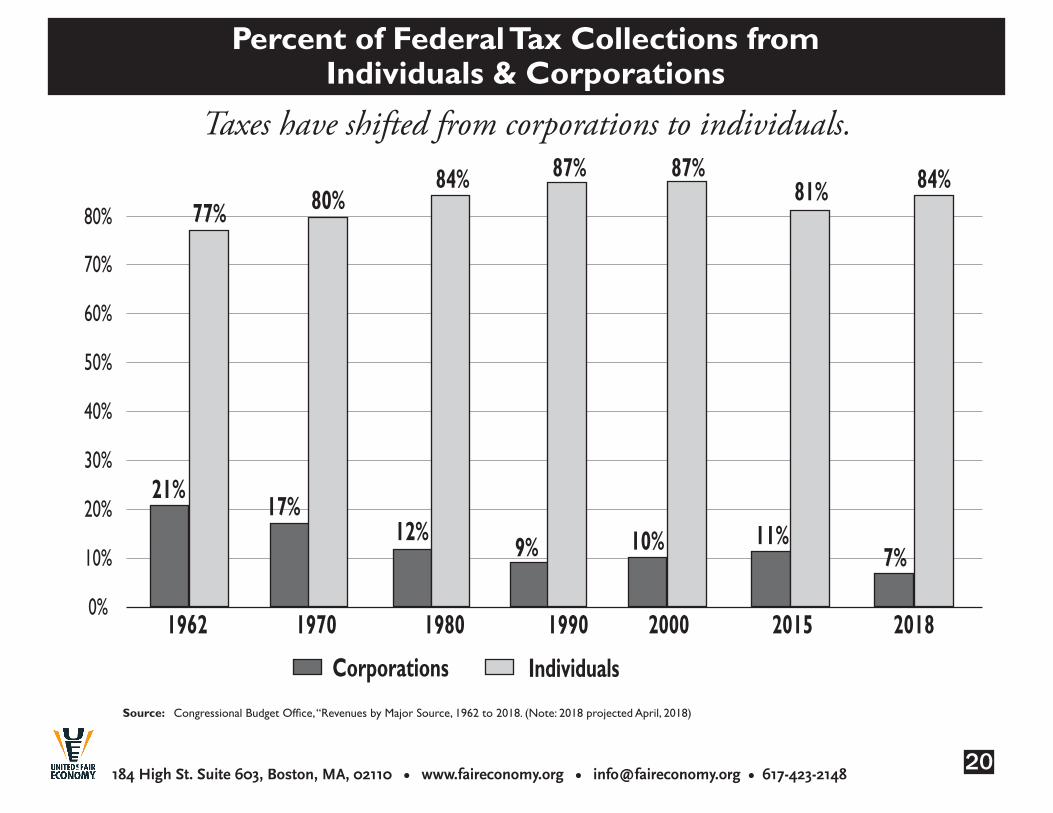
21%
77%
17%
80%
12%
84%
9%
87% 87%
10%
Corporations Individuals
1962 1970 1980 1990 2000
70%
60%
50%
40%
30%
20%
10%
0%
80%
Source: Congressional Budget Office, “Revenues by Major Source, 1962 to 2018. (Note: 2018 projected April, 2018)
Taxes:Percent of Federal Tax Collections from
Individuals & Corporations
Taxes have shifted from corporations to individuals.
81% 84%
11%7%
2015 2018

184 High St. Suite 603, Boston, MA, 02110 • www.faireconomy.org • [email protected] • 617-423-214821
Privatizing Public Services Helps Investors, Hurts Consumers and Workers
BAD IDEAS

184 High St. Suite 603, Boston, MA, 02110 • www.faireconomy.org • [email protected] • 617-423-214822
U.S. State and Federal Prison Population, 1925-2015
Incarceration has increased substantially...
1,600,000
1,400,000
1,200,000
1,000,000
800,000
600,000
400,000
200,000
019581950194219321925 1966 1974 1982 1990 1998 2006 2015
Source: The Sentencing Project. Fact Sheet: Trends in U.S. Corrections < http://sentencingproject.org/wp-content/uploads/2016/01/Trends-in-US-Corrections.pdf>
1,476, 847

184 High St. Suite 603, Boston, MA, 02110 • www.faireconomy.org • [email protected] • 617-423-214823
1,608
8561000
2000
0
324
African American WhiteLatino
U.S. Incarceration Rates by Race, 2016
Number of people incarcerated per 100,000
Sources: U.S. Department of Justice
Note: In 2010 American Indian and Alaskan Native were at 895 per 100,000 people.
People of Color are 26% of the U.S. population yet are roughly 60% of those in prison!
184 High St. Suite 603, Boston, MA, 02110 • www.faireconomy.org • [email protected] • 617-423-214824
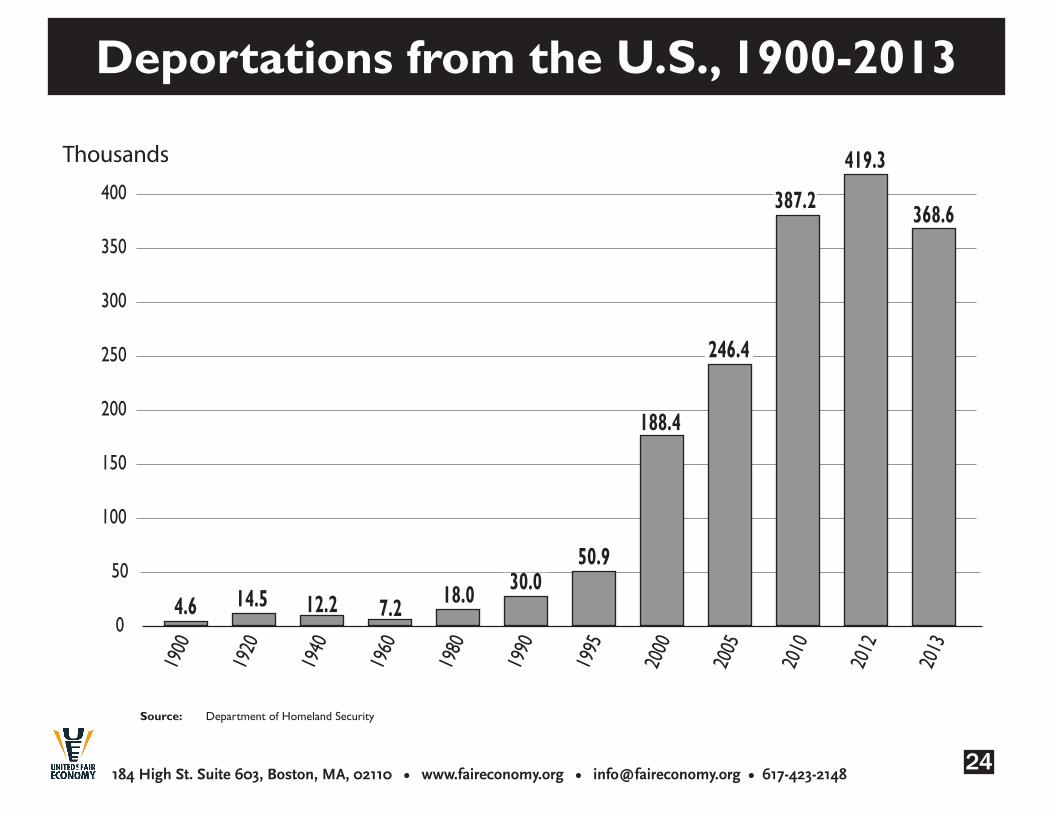
Deportations from the U.S., 1900-2013
1900
1920
1940
1960
1980
1990
1995
2000
2005
2010
2012
2013
4.6 14.5 7.2
419.3
368.6
Thousands400
350
300
250
200
150
100
50
0
Source: Department of Homeland Security
188.4
50.930.018.012.2
246.4
Thousands
387.2

184 High St. Suite 603, Boston, MA, 02110 • www.faireconomy.org • [email protected] • 617-423-214825
G.I. Bill: Free College
Homesteading Laws
Home Mortgage Interest Deduction
Social Security
FHA Loans
Boosts on the Escalator to the Middle Class

184 High St. Suite 603, Boston, MA, 02110 • www.faireconomy.org • [email protected] • 617-423-214826
Blocks on the Escalator to the Middle Class
G.I. Bill: Free College
Homesteading Laws
Home Mortgage Interest Deduction
Social Security
FHA LoansRacist Images
Immigration Quotas
Redlining
Predatory Lending
Jim Crow Laws
Slavery
Loss of Land
Bracero Program

184 High St. Suite 603, Boston, MA, 02110 • www.faireconomy.org • [email protected] • 617-423-214827
When women are employed doing work performed largely by men they EARN LESS than their male counterparts.
Our Economy Devalues Women’s Work
The work of child-rearing, care for the elderly and work in the home is often UNPAID WORK and is performed largely by women.
Women are concentrated in the LOW-WAGE WORKFORCE.
Source: Race, Gender and Work by Julie Matthaei & Teresa Amott, 1999
184 High St. Suite 603, Boston, MA, 02110 • www.faireconomy.org • [email protected] • 617-423-214828
Median Earnings by Race and Gender, 2014
Race and gender disparities intersect
White Latina/o Amerindian or Alaskan Native
African American / Black
Native Hawaiian & Pacific Islander
Asian American*
*Data on Asian Americans can be mis-leading. Many data sets group together populations of Asian immigrants that have very different civic, economic and cultural characteristics .
Source: American Association of University Women (AAUW) http://www.aauw.org/research/the-simple-truth-about-the-gender-pay-gap/
$0.25
$0.50
$0.75
$1.00Men Women

184 High St. Suite 603, Boston, MA, 02110 • www.faireconomy.org • [email protected] • 617-423-214829
• Women are only 46% of the total workforce but make up THREE-QUARTERS of LOW-WAGE workers.
Low-Wage Workforce
Low-Wage Workforce by Gender and Race, 2013
Source: National Women’s Law Center calculations based on IPUMS-CPS (2013). The “low-wage worfkforce” is defined as the 10 largest low-wage occupations with median wages of less than $10.10 per hour per BLS, Occupational Employment Statistics.
76%Women • Women of color are only16% of
the total workforce but make up 37% of LOW-WAGE workers.
37%Women of
Color
Low-Wage Workforce by Gender and Race, 2013

184 High St. Suite 603, Boston, MA, 02110 • www.faireconomy.org • [email protected] • 617-423-214830
Unpaid Work by Gender in the U.S.
21
13
Average number of hours per week Unpaid work includes:
•Householdmanagement
•Caringforandhelping householdmembers
•Buyinggoodsandservices
•Cooking
•Cleaning
•Laundry&sewing
•Lawnandgardencare
•Maintenanceandrepair
•Travelrelatedtoother unpaidworkactivities...
Source: Pew Research Center analysis of 2012 American Time Use Survey, ATUS-XNotes: Ages 16 and older Paid-work related activities include time on the job, commute time, and any other time spent on job-related activities
MenWomen
184 High St. Suite 603, Boston, MA, 02110 • www.faireconomy.org • [email protected] • 617-423-214831
1870
1880
1890
1900
1910
1920
1930
1940
1950
1960
1970
1980
1990
2000
5.6 6.710.4 11.7 10.4
19.8
2010
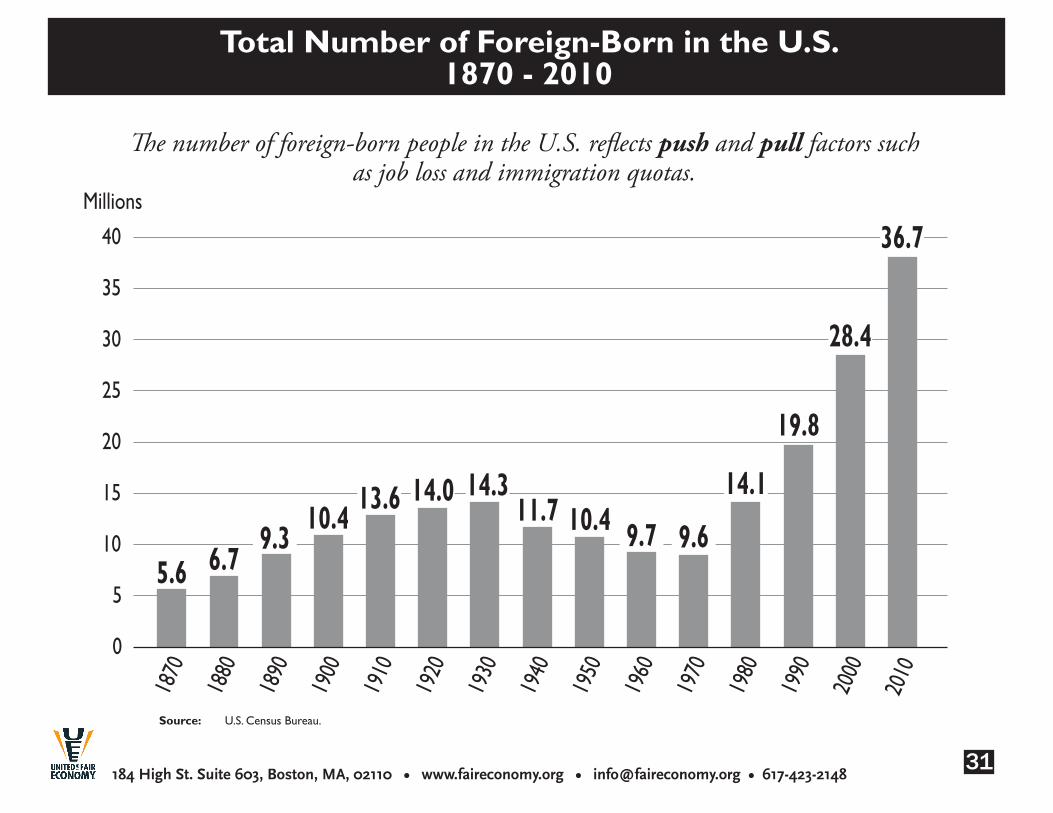
The number of foreign-born people in the U.S. reflects push and pull factors such as job loss and immigration quotas.
Total Number of Foreign-Born in the U.S. 1870 - 2010
Millions40
35
30
25
20
15
10
5
0
Source: U.S. Census Bureau.
36.7
28.4
14.1
9.69.714.0 14.313.6
9.3

184 High St. Suite 603, Boston, MA, 02110 • www.faireconomy.org • [email protected] • 617-423-214832
15%
1870
12%
9%
6%
3%
0%
1880
1890
1900
1910
1920
1930
1940
1950
1960
1970
1980
1990
2000
14.413.3
14.813.6
14.713.2
11.6
8.8
6.9
5.4 4.7
6.2
7.9
10.4
2010
12.7
The percentage of foreign-born people in the U.S. reflects push and pull factors such as job loss and immigration quotas.
Percent of Foreign-Born in the U.S. 1870 - 2010
Source: U.S. Census Bureau.

184 High St. Suite 603, Boston, MA, 02110 • www.faireconomy.org • [email protected] • 617-423-214833
Our Theory of Change: Social Movements

184 High St. Suite 603, Boston, MA, 02110 • www.faireconomy.org • [email protected] • 617-423-214834
Principles of a Fair Economy
H Equity in all dimensions (race, class, ethnicity, gender, etc.)
H Solidarity and Cooperation
H Political & Economic Democracy
H Sustainability
H Pluralism and Diversity
H Accountability
H Respect & Dignity for People and Planet
184 High St. Suite 603, Boston, MA, 02110 • www.faireconomy.org • [email protected] • 617-423-214835
Strategies for Building a Fair Economy
HEducate & Change the Conversation
HCampaign to Build Power & Change the Rules
HConnect the Dots and Build a Movement

184 High St. Suite 603, Boston, MA, 02110 • www.faireconomy.org • [email protected] • 617-423-214836
We Need New Rules to Reduce Wealth & Income Inequality
Lift the Floor for Lower Income PeopleH Establish Living Wage standardsH Raise the minimum wage
H Invest in job creation & trainingH Increase the supply of affordable housing
Level the Playing Field for EveryoneH Fair taxes that treat income from investments and work the sameH Postal banking services H Medicare for AllH Trade policies that benefit wage-earners, consumers, & the environmentH Quality education as a Constitutional right
Address the Concentration of Wealth and PowerH Progressive taxation of wealth and incomeH Reduced subsidies for excessive CEO payH Campaign finance reform to get big money out of politicsH Accountability for corporations receiving public subsidies

184 High St. Suite 603, Boston, MA, 02110 • www.faireconomy.org • [email protected] • 617-423-214837
What You Can Do Today
Educate Yourself and OthersH Host a UFE Popular Economics
Education workshop. H Learn to lead UFE workshops.H Educate yourself — look at the
resources on our list.
Influence the MediaH Write articles or letters to the editor. H Organize a writers’ group. H Stage a flash mob creative action.
Build PowerH Use your religious congregation as an
organizing base.H Join or support a labor union.H Get involved in coalitions or civic groups.
Support United for a Fair EconomyH Make a donation and become a UFE member.H Encourage friends and colleagues to join.H Organize a fundraising house party.H Help us with outreach.
Join Campaigns to Change the RulesH Support progressive tax proposals, such as the Robin Hood Tax.H Support local Living Wage campaigns and the Fight for $15.

62 S
umm
er S
t., 2
nd F
l., B
osto
n, M
A 0
2110
•
ww
w.fa
irec
onom
y.or
g •
in
fo@
fair
econ
omy.
org
• 6
17-4
23-2
148
A
Eco
nom
y Q
uiz
1. H
owm
uch
larg
eris
the
tota
lcom
pens
atio
nfo
rthe
M
cDon
ald’
sCEO
than
the
aver
age
McD
onal
d’s
wor
ker?
:
a)
408
tim
es la
rger
b)
100
tim
esla
rger
c)
347
tim
esla
rger
2. H
owd
oest
hec
urre
ntin
com
ega
pbe
twee
nW
hite
and
Bl
ack
fam
ilies
com
pare
toth
ega
pin
196
7?
a)
The
sam
e
b)
It’s
sligh
tlysm
alle
rtod
ay
c)
It’s
larg
erto
day
3.I
n19
90,t
hem
inim
umw
age
was
$3.
80a
nho
ur.I
n20
09,i
tinc
reas
edto
$7.
25a
nho
ur.I
fthe
min
imum
w
age
had
gone
up
with
pro
duct
ivity
,wha
twou
ldit
be
now
?
a)
$8.
15a
nho
ur
b)
$11
.35
anh
our
c)
$18
.85
anh
our
4. Th
esu
cces
sfulc
andi
date
sfor
U.S
.Sen
ate
in2
016
spen
tan
aver
age
ofh
owm
uch
mon
eyo
nhi
sorh
er
Sena
tec
ampa
ign?
a)
$1
mill
ion
b)
$5.
2m
illio
n
c)
$10
.4m
illio
n
5.N
etw
orth
iso
ne’s
asse
ts(w
haty
ouo
wn)
min
usd
ebts
(wha
tyou
ow
e).I
n20
13,t
hem
edia
nne
twor
th
forW
hite
hou
seho
ldsw
as$
141,
900.
Wha
twas
the
med
ian
netw
orth
forA
frica
nAm
eric
anh
ouse
hold
s?
a)
$11
,030
b)
$35
,800
c)
$10
2,30
0
6.O
nav
erag
eWhi
tew
omen
ear
n81
cen
tsto
eve
ry
dolla
rear
ned
byW
hite
men
.How
muc
hdo
Lat
ina
wom
ene
arn
com
pare
dto
Whi
tem
en?
a)
76
cent
s
b)
65
cent
s
c)
59
cent
s
7.H
istor
ical
ly,w
hatw
asth
ehi
ghes
tmar
gina
ltax
ra
teo
nth
eto
p1%
inth
eU
nite
dSt
ates
?(Th
eto
pm
argi
nali
ncom
eta
xra
teis
pai
don
just
the
amou
nt
ofin
com
eab
ove
the
cut-o
fffo
rthe
top
brac
ket.)
a)
35%
b)
92%
c)
70%
8. A
ccor
ding
toth
eSo
cial
Sec
urity
Adm
inist
ratio
nho
w
muc
hm
oney
do
undo
cum
ente
dim
mig
rant
spay
in
toso
cial
secu
rity?
(Ab
enefi
tthe
yar
ein
elig
ible
to
rece
ive.
)
a)
$70
0m
illio
n
b)
$13
bill
ion
c)
$2
billi
on
9.Th
eric
hest
eigh
tpeo
ple
own
asm
uch
wea
ltha
show
m
uch
ofth
egl
obal
pop
ulat
ion?
a)
The
poor
est2
0%
b)
The
botto
mth
ird
c)
The
botto
mh
alf
10. H
owp
ower
fula
rew
eif
we
wor
kto
geth
erfo
rafa
irec
onom
y?
a)
Kin
dap
ower
ful,
Igue
ss.
b)
Not
ver
y,if
you
thin
kab
outi
t.
c)
Incr
edib
lyp
ower
ful,
let’s
do
this!

B
Bottom Quintile $0 - 29,100

C
Second Quintile$29,101 - 52,697

D
Middle Quintile$52,698 - 82,032

E
Fourth Quintile$82,033 - 129,006

F
Top Quintile$129,007 and up

G
Top 5%$230,030 and up

H
Top 1%$423,090 and up

I1913
Alien Land Laws
1882Chinese Exclusion Act & Other Asian Exclusions
1852–1953Denial of Naturalization
1898Possession of
Philippines 1942-45
Japanese Internment
1898Annexation of Puerto Rico 1845–1848
Annexation of Mexican Land
1824Monroe Doctrine
1848Mexican Land Loss
1924US Border
Patrol
1965Immigration
Quotas
1954Operation Wetback
1919English Only
Laws 1943Bracero Program
1994NAFTA
1787Slavery in
Constitution
Jim Crow Laws
1850Fugitive Slave Law
1896Plessy
(Segregation Legal) 1960
Farm Loss Due to USDA
1935FHA Redlining
Indian Land Thefts1830
Indian Removal Act 1887
Allotment Act
1953Tribal
Termination
1968 Tribal
Taxation
1893Hawai‘i
Annexed
62 Summer St., 2nd Fl., Boston MA 02110www.faireconomy.org
1840s 1850s 1860s 1870s 1880s 1890s 1900s 1910s 1920s 1930s 1940s 1950s 1960s 1970s 1980s 1990s 2000s Colonial Early US 2010sWW IIWW I
Great Depression
Vietnam W ar1776 Civil War
Election of Obama
Subprime Mortgage Bubble
Open Doors to European Immigration
1862Homestead
Acts
Pre–1776Land
Grants to Colonists
1849 Gold Rush
Land Claims1790
Naturalization Act
1853 Preemptive
Acts
1935New Deal
Federal Housing LoansSocial SecurityLabor Rights 1944
GI Bill
1913 Home Mortgage
Interest Deduction
1997 Tax Cuts for Asset
Owners
1977 Community
Reinvestment Act
1952 Asian
Naturalization1964
Civil Rights Act & Affirmative Action
1865, 186813th and 14th Amendments
1934 Indian
Reorganization Act
1986Amnesty for Immigrants
1988Japanese
Reparations
1962 Cuban Refugee Assistance Act1865-69
Freedmen’s Bureau
GOVERNMENT BOOSTS AND BLOCKS TO BUILDING WEALTHB
oo
sts
Blo
cks

J
J
0
10M
9M
8M
7M
6M
5M
4M
3M
2M
1M
1820s
151,824
1830s
599,125
1840s
1,713,251
1850s
2,598,214
1860s
2,314,824
1870s
2,812,191
1880s
5,246,613
1890s
3,687,564
1900s
8,795,386
1910s
5,735,811
1920s
4,107,209
1930s
528,431
1940s
1,035,039
1950s
2,515,479
1960s
3,321,677
1970s
4,493,314
1980s
7,338,062
1990s
9,095,417
2000s
10,400,000
Nu
mb
er
of
Imm
igra
nts
PUSHFactors
Trends & Events Outside the U.S
PULLFactors
Trends, Events, Policies & Laws Inside
the U.S
WW I
Great DepressionWW I
WW II
WW II
Immigration Act of 1819
Indian
Mexican-American War
Treaty of Guadalupe
Hidalgo (1848)
Civil War
OTHER LAWS &
POLICIES AFFECTING MIGRATION TO THE U.S.
Chinese Exclusion Acts
(1882-88)
Contract Labor Law of 1885
Immigration Act of 1891
Irish Potato Famine
Industrial Revolution in Europe
Pogroms in Russia and Ukraine
Immigration Act of 1907
Immigration Act of 1917
Deportations of Mexicans
Industrial Revolution in the U.S.
Tyding-McDuffie Act 1934
McCarran-Walter Act
of 1952
Naturalization Act of 1790
Korean War
Vietnam War
Embargo of Cuba
Free Trade Agreements
Bracero Program
Free Trade Agreements
Immigrant Act of 1965
IndoChina Migration & Refugee
Assistance Act 1975-77
USA PATRIOT
Act2001
Illegal Immigration Reform & Immigrant
Responsibilities Act1996
Creation of ICE 2003
Prop. 187 1994
Immigrant Reform & Control
Act1986
14.4% 13.3% 14.8% 13.6% 14.7% 13.2% 11.6% 8.8% 6.9% 5.4% 4.7% 6.2% 7.9% 10.4%
Monroe Doctrine (1823)
Britain repeals
Passenger Acts1827
Homestead Act
(1862)Displaced Persons Act 1948
Immigration Act of 1924
Emergency Quota Act
of 1921
14th Amendment
(1868)
Structural Adjustment Programs
U.S.-lead War on Drugs in Latin America
12.7%
11M
Financial Crisis &Great
Recession2008-
Slavery
U.S. Military Intervention in Central America
PUSH & PULL FACTORS OF IMMIGRATION TO THE U.S.

184 High St. Suite 603, Boston, MA, 02110 • www.faireconomy.org • [email protected] • 617-423-2148K
Attitudes Toward Immigrants - 1
“[Immigrantsofthisgroup]…threatennothinglessthanthepossibilityofagreatandperilouschangeintheveryfabricofour[Anglo-Saxon]race.…Ifalowerracemixeswithahigherinsufficientnumbers,historyteachesusthatthelowerracewillprevail.”

184 High St. Suite 603, Boston, MA, 02110 • www.faireconomy.org • [email protected] • 617-423-2148L
“With respect to [these immigrants]we arecommitting cultural suicide.Thebarbariansat thegatewillonlyneed togiveus a slightpush, and the emancipatedbodyofWesternCivilizationwillcollapseinaheap.”
Attitudes Toward Immigrants - 2

184 High St. Suite 603, Boston, MA, 02110 • www.faireconomy.org • [email protected] • 617-423-2148
“Whenthehordesofotherlandsarepermittedtocomehere,asisthecasedaily;whenignorance,poverty,crimeisallowedtolanduponourshores...itistimethatgoodmenliftedtheirarmsandsoundedtheirvoicesagainsttheabomination...Becauseitiseverydayweakeningthestrength,anddestroyingthecharacterofthecountry.AmericacanonlybeAmericabykeeping itAmerican.Americansmustfillouroffices,greatandsmall...ThisisOURland.Weownit.”
M
Attitudes Toward Immigrants - 3

184 High St. Suite 603, Boston, MA, 02110 • www.faireconomy.org • [email protected] • 617-423-2148N
“[Immigrantsofthisnationality]areariffraffofdesperatescoundrals,ex-convicts,andjailbirds.”
Attitudes Toward Immigrants - 4

184 High St. Suite 603, Boston, MA, 02110 • www.faireconomy.org • [email protected] • 617-423-2148O
“[Theimmigrantsofthisnationality]arenothingbut‘importedbeggars’and‘animals’,amongrelmassofignoranceandcrimeandsuperstition,asutterlyunfitforsociety’sdutiesastheyarefor the common courtesies anddecencies ofcivilizedlife.”
Attitudes Toward Immigrants - 5

184 High St. Suite 603, Boston, MA, 02110 • www.faireconomy.org • [email protected] • 617-423-2148
1. Italian immigrants in New York City — Senator Henry Cabor Lodge (1909)
2. Mexicans — Congressman Tom Tancredo, In Mortal Danger - The Battle for
America’s Borders and Security (2006)
3. German and Catholic immigrants — The American Crusader (1854)
4. Russians, Hungarians, Poles, Italians, Greeks, and Asians — NYC Police Commissioner Theodore Bingham (1908)
5. Irish — The American Standard, a New Jersey newspaper (1859)
P
Attitudes Toward Immigrants


