Ten years ago, we listed on the bourses and it has been an exhilarating journey. By consistently growing Revenues and Earnings throughout this decade, we have demonstrated perseverance of purpose and excellence of performance. We have invested in future growth by expanding product categories, establishing new partnerships, venturing into new geographies and entering into new business lines.
Along the way, we have addressed various market idiosyncrasies by deriving strength from our understanding of the underlying dynamics and taking timely, informed business decisions.
We have seen numerous challenges and disruptions- global financial slowdowns, unstable currencies, geo-political tensions, technology disruption, demonetization, changing consumer tastes and demands, growth of E-Commerce and vendor mergers and acquisitions. Through it all, we have retained an unwavering focus on our goals and continuously looked for growth opportunities even during the most challenging times.
We owe our success to the support that we continuously receive from all our stakeholders - our vendors, our business partners and not the least, our shareholders. But a large part of the credit must go to the most important stakeholder of all - our people, who work for the Company's objectives with unflagging passion and dedication.
We have resolutely nurtured a culture of learning amongst our employees and have provided them with an ambience conducive towards realizing the full potential of their professional ambitions. While equipping them to address the ongoing business challenges, we have encouraged them to explore the opportunities presented by the fast evolving technology landscape and use them to further our business interests.
It is this work-culture, promoting a degree of "intrapreneurship" within the organization, which has helped transform a home-grown company into the multinational powerhouse it is today.
Corporate Information 2Message to Shareholders 4Financial Highlights (Since Listing) 6The Journey 8The Growth Story 10Diversification for Growth 12The Four Vectors of Growth 13The Winning Strengths 15Nourishing Employee Growth 16Foundation for CSR @ Redington 17Milestones Post Listing 20Awards 21
Board’s Report 22Business Responsibility Report 55Report on Corporate Governance 64Management Discussion and Analysis 77
Standalone Financial Statements 84Auditor’s Report 85Balance Sheet 92Statement of Profit and Loss 93Cash Flow Statement 94Statement of Changes in Equity 95Notes to Financial Statements 96
Consolidated Financial Statements 132Auditor’s Report 133Balance Sheet 138Statement of Profit and Loss 139Cash Flow Statement 140Statement of Changes in Equity 141Notes to Financial Statements 142
Form AOC1 183Notice 185
Contents0
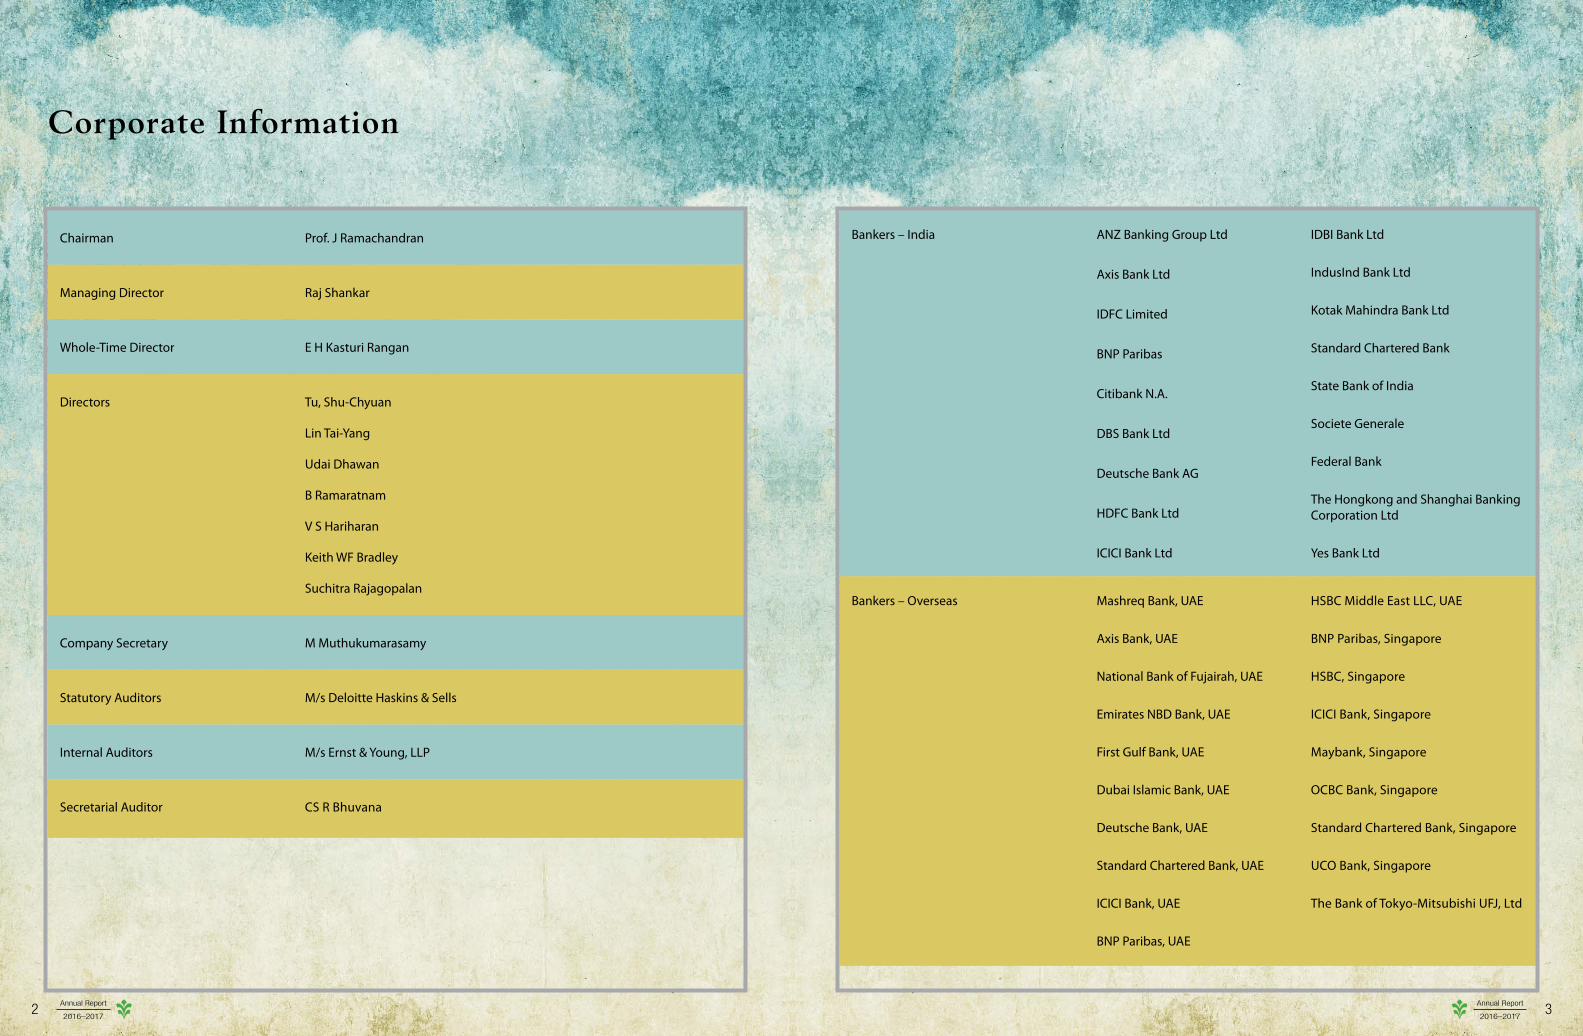
Chairman Prof. J Ramachandran
Managing Director Raj Shankar
Whole-Time Director E H Kasturi Rangan
Directors Tu, Shu-Chyuan
Lin Tai-Yang
Udai Dhawan
B Ramaratnam
V S Hariharan
Keith WF Bradley
Suchitra Rajagopalan
Company Secretary M Muthukumarasamy
Statutory Auditors M/s Deloitte Haskins & Sells
Internal Auditors M/s Ernst & Young, LLP
Secretarial Auditor CS R Bhuvana
Bankers – India ANZ Banking Group Ltd
Axis Bank Ltd
IDFC Limited
BNP Paribas
Citibank N.A.
DBS Bank Ltd
Deutsche Bank AG
HDFC Bank Ltd
ICICI Bank Ltd
IDBI Bank Ltd
IndusInd Bank Ltd
Kotak Mahindra Bank Ltd
Standard Chartered Bank
State Bank of India
Societe Generale
Federal Bank
The Hongkong and Shanghai Banking Corporation Ltd
Yes Bank Ltd
Bankers – Overseas Mashreq Bank, UAE
Axis Bank, UAE
National Bank of Fujairah, UAE
Emirates NBD Bank, UAE
First Gulf Bank, UAE
Dubai Islamic Bank, UAE
Deutsche Bank, UAE
Standard Chartered Bank, UAE
ICICI Bank, UAE
BNP Paribas, UAE
HSBC Middle East LLC, UAE
BNP Paribas, Singapore
HSBC, Singapore
ICICI Bank, Singapore
Maybank, Singapore
OCBC Bank, Singapore
Standard Chartered Bank, Singapore
UCO Bank, Singapore
The Bank of Tokyo-Mitsubishi UFJ, Ltd
Corporate Information
Annual Report
2016–20172
Annual Report
2016–20173
Dear Shareholders,
I am filled with much nostalgia as I look back to 2007 when your Company was listed on the bourses. At that time, we had 55 brands and were present in 11 countries. Today we have 200+ brands and are present in 24 countries. While each of the years in this last decade had its own share of spikes, dips and challenges, your Company grew consistently in all its markets. Further, by adopting a transparent work ethic, your Company earned the trust of both vendors and partners alike, across all the markets. This gives me a great degree of delight and satisfaction which is what I wish to whole-heartedly celebrate today.
From the time your Company went public in February 2007, Revenue has grown at a CAGR of 17%, EBITDA at a CAGR of 16%, and PAT at a CAGR of 16%. This has been possible due to a well-planned strategy based on a clear understanding of the various markets and their requirements. The strategy focused on geographic expansion, diversification of products and brands, prudent risk management, nurturing relationships with
vendors and partners, and our intrapreneurial culture. The dedication and competency of our people is reflected in their commitment to shared objectives, ability to quickly adapt to changing environments and finding innovative solutions for business challenges.
As you may be aware, the Board had declared a special (Interim) dividend of ` 2/- per share (i.e 100% of the Face Value) to commemorate the completion of ten years of listing in the bourses. Further, considering the improved performance of the Company for the financial year 2016-17, the Board recommended a final dividend of ` 2.30 per share (i.e 115% of the Face Value).
You may recall my mentioning last year that we were facing challenges in effectively managing our working capital. The good news is that during FY 17, we have been able to significantly reduce the working capital resulting in positive free cash flow. Your Company's overseas subsidiaries contributed significantly to the free cash flow.
During the year under review, we have once again registered strong growth, both in India and overseas markets. Revenue from India and Overseas operations grew by an impressive double digit at 18% and 15% respectively. All business verticals displayed growth, with IT contributing to 71% of the total revenue, Mobility contributing to 27%, and balance from Services.
Muted growth in the demand for IT products continued in FY 16-17 with PC and Print segment witnessing negative or flat growth. However, pockets of opportunities in the Enterprise and Infrastructure space, where we witnessed strong performances in Networking, Security, Server and Storage portfolios, allowed the Company to compensate and deliver a 2% growth in the IT vertical. The customers in the BFSI and Telco segments have shown good traction and this is expected to continue. We expect our IT vertical to grow at a healthy pace in the coming years, on the back of significant Government investments in Smart City and Digital India Projects. These initiatives have just started gaining momentum and we expect to capitalize on significant opportunities going forward.
In the Mobility vertical, we continued to derive value through the Apple business both in India and the Overseas markets. However, the growth in the non-Apple Smartphone segment was 39%, a clear indication that the other brands in our portfolio have started to contribute quite significantly to the growth. Overall the momentum in this segment looks promising.
I am pleased to tell you that your Company is evolving as a Cloud Solutions Provider in partnership with the Global 'Big Four' in Cloud Business - Amazon Web Services (AWS), Microsoft, IBM and Oracle. We are launching our
automated Unified Cloud Platform across multiple cloud service providers. This is a self-service platform which can be used for ordering and monthly billing. The Cloud Solutions Group provides cloud consulting, migration and managed cloud services.
Staying true to its strategy of periodic diversification, your company has evaluated opportunities in businesses such as 3D Printing, Solar and Heath & Medical Equipment. These are still at a nascent stage but we are confident that these businesses will become interesting once we achieve economies of scale.
Redington Gulf FZE remained the No.1 distributor in the MEA region for the 12th consecutive year. It gives me immense pride to share with you that this subsidiary has been placed amongst the top 24 'Great Places to Work' in the UAE.
Your Company has always been at the forefront of Technology adoption and Process Innovation. I am pleased to inform you that your Company has been an early adopter of digitalization towards driving agility and efficiency across the organization. We have defined a well-focused strategy and digitalization roadmap for us to stay competitive and drive future growth.
I am overjoyed to share with you that ProConnect Supply Chain Solutions Ltd., which your Company set up in 2012 as a wholly owned subsidiary for providing logistics services, has had another very good year. ProConnect is now fast growing into a 'crown jewel' within the Redington Group. ProConnect has acquired a 76% stake in Rajprotim Supply Chain Solutions Ltd, a Warehousing and Logistics Company having strong presence in Eastern and North Eastern part of India. This investment in Rajprotim will enable ProConnect to expand its Supply Chain business in the above region, resulting in 'net new business'. In addition, we expect this to bring in synergy for ProConnect across other regions within the country as well. We are well geared to adapt to the GST model and ProConnect will play a huge supporting role as a launch pad in this regard. With GST implementation, we could potentially see a reduction in warehouses, and a probable reduction in logistics and inventory holding costs with marked improvement in delivery timings.
Ensure Support Services has turned itself around by recording a good bottom line growth during FY 16-17. It is focusing more on the enterprise segment and now has 1800 customers in the Infrastructure Management Services division. The company upsells Managed Security Services which has good future growth potential.
Chennai faced a natural disaster, Cyclone Vardah. I am pleased to share with you that we managed and mitigated the crisis through robust business continuity plans and
disaster recovery strategy. Your Company's subsidiary ProConnect played a big role in ensuring TATs were met and customers were served inspite of this difficult circumstance.
Mr. R Srinivasan and Mr. R Jayachandran, the founder Directors of the Company retired during the year. I wish to express my deep gratitude for the guidance and wisdom received from them over the years. Mr. Udai Dhawan was co-opted as a Director during last year in place of Mr. Nainesh Jaisingh who expressed his inability to continue as a director due to his enhanced role and added responsibilities within his organization. I wish to take this opportunity to thank Mr Nainesh for his significant contribution to the Board. I am happy to share with you that all these changes were seamless.
Your company believes in giving back to the society and the Foundation set up two years ago continues to implement various CSR activities for the betterment of the community. It addresses needs in quality education for the underprivileged, the differently abled and the economically challenged. It is gratifying to note the good progress made by the Foundation during this year, details of which are included in this report.
Looking at the future, my Vision for your Company is "to become the most preferred Service Provider in the B2B & adjacent spaces, across different industry verticals, technologically enabled, offering simple and complete cost effective solutions, by keeping customers' best interests at all times".
I wish to once again thank all my colleagues at Redington for their phenomenal contribution towards your Company's growth. I also wish to thank all the stakeholders for their continued faith and trust in the company. I look forward to their on-going support this coming year and in the future.
Book Value per Share (FV ` 2) (`) 38.7 38.5 34.0 31.7 26.7 22.8 19.3 17.2 15.8 14.6 13.7
# For EPS calculation-weighted average number of equity shares have been considered. During the year 2010-11, Face value of shares got split from ` 10 to ` 2. EPS and Book Value for earlier years converted basis face value of ` 2
* Investments made in and Dividend income received from wholly owned Subsidiaries is excluded@ Including profit on sale of long-term investment in Easyaccess Financial Services Limited of ` 65.8 Crore during FY 13-14^ Figures for the Financial Year 2015-16 are restated in line with Ind AS
Book Value per Share (FV ` 2) (`) 78.2 73.2 57.6 48.8 39.5 33.2 31.7 27.4 25.7 18.5 16.1
# For EPS calculation weighted average number of equity shares have been considered. During the year 2010-11, face value of shares got split from ` 10 to ` 2 EPS and Book value for earlier years converted basis face value ` 2
* While calculating Return On average Capital Employed and Return On average Equity, goodwill has been excluded / capital reserve has been included appropriately@ Including loss on sale of long-term investment in Easyaccess Financial Services Limited of ` 9.07 Crore during FY 13-14^ Figures for the Financial Year 2015-16 are restated in line with Ind AS
Annual Report
2016–20176
Annual Report
2016–20177
The Journey
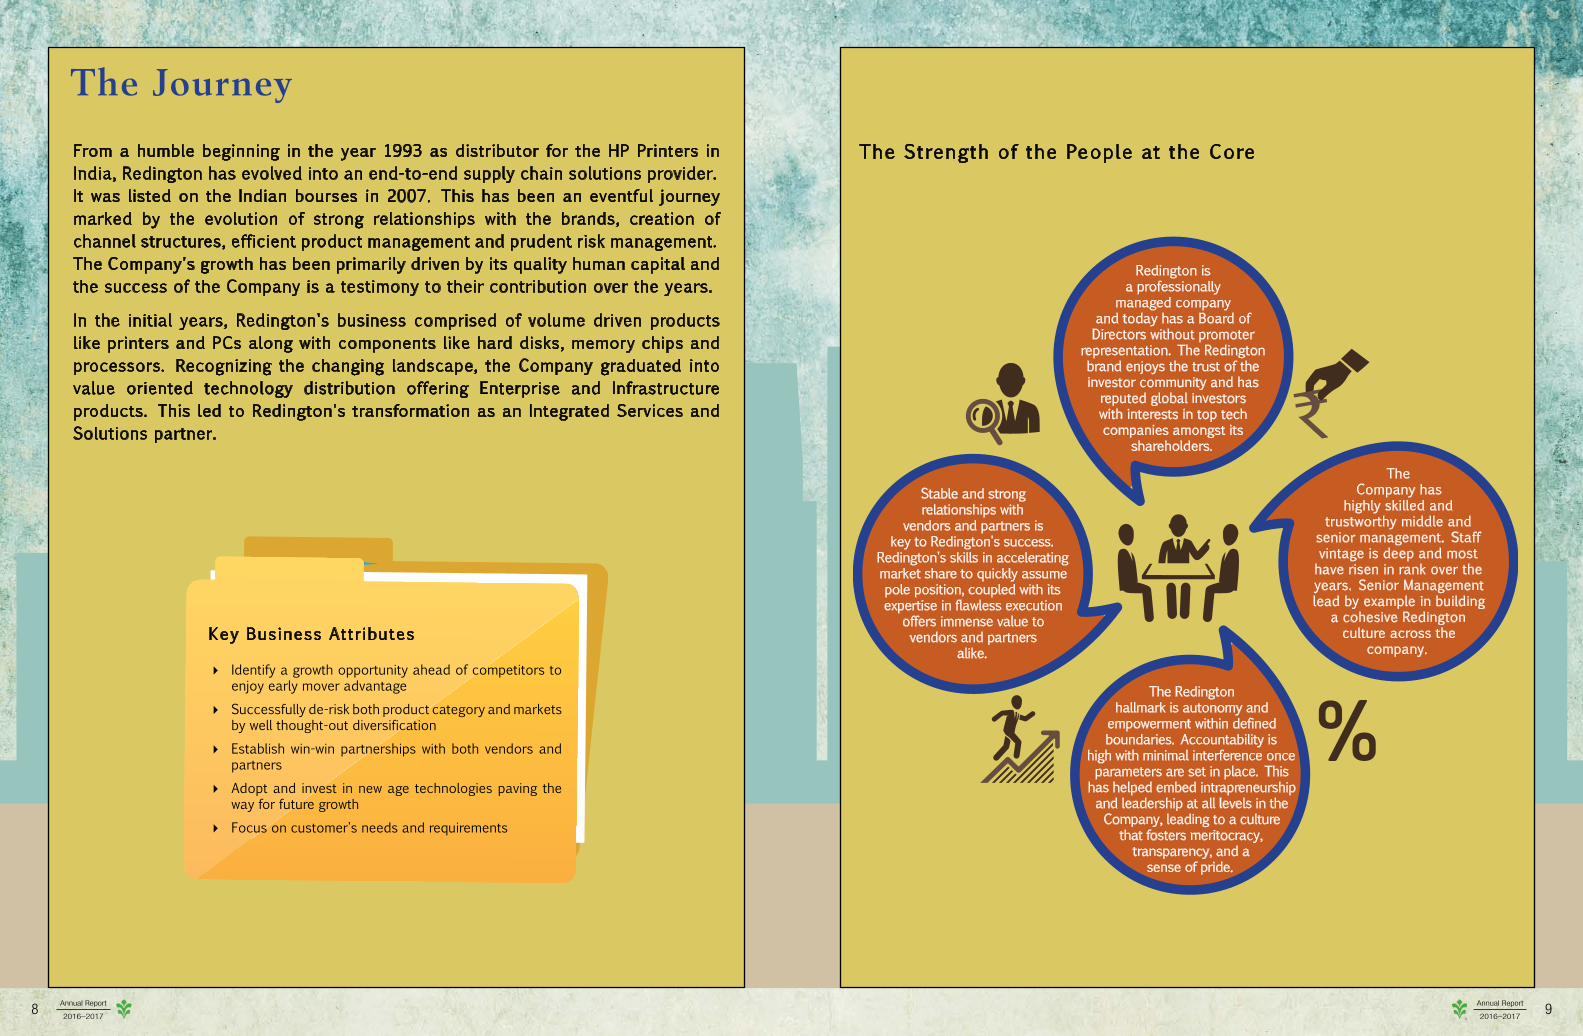
From a humble beginning in the year 1993 as distributor for the HP Printers in India, Redington has evolved into an end-to-end supply chain solutions provider. It was listed on the Indian bourses in 2007. This has been an eventful journey marked by the evolution of strong relationships with the brands, creation of channel structures, efficient product management and prudent risk management. The Company's growth has been primarily driven by its quality human capital and the success of the Company is a testimony to their contribution over the years.
In the initial years, Redington's business comprised of volume driven products like printers and PCs along with components like hard disks, memory chips and processors. Recognizing the changing landscape, the Company graduated into value oriented technology distribution offering Enterprise and Infrastructure products. This led to Redington's transformation as an Integrated Services and Solutions partner. `
Redington is a professionally
managed company and today has a Board of Directors without promoter
representation. The Redington brand enjoys the trust of the investor community and has reputed global investors with interests in top tech companies amongst its
shareholders.
The Company has
highly skilled and trustworthy middle and
senior management. Staff vintage is deep and most have risen in rank over the years. Senior Management lead by example in building
a cohesive Redington culture across the
company.
The Redington
hallmark is autonomy and empowerment within defined boundaries. Accountability is
high with minimal interference once parameters are set in place. This
has helped embed intrapreneurship and leadership at all levels in the Company, leading to a culture
that fosters meritocracy, transparency, and a
sense of pride.
Stable and strong relationships with
vendors and partners is key to Redington's success.
Redington's skills in accelerating market share to quickly assume pole position, coupled with its expertise in flawless execution
offers immense value to vendors and partners
alike.Key Business Attr ibutes
� Identify a growth opportunity ahead of competitors to enjoy early mover advantage
� Successfully de-risk both product category and markets by well thought-out diversification
� Establish win-win partnerships with both vendors and partners
� Adopt and invest in new age technologies paving the way for future growth
� Focus on customer's needs and requirements
The Strength of the People at the Core
Annual Report
2016–20178
Annual Report
2016–20179
Count
r ies
1
Brands
Sales Offic es
Warehouses
PartnersEmployee
s
Service Ce
ntres
Revenu
e (`/Cr) 1
31
255
13
Count
r ies
11
Brands
Sales Offices
Warehouses
PartnersEmployees
Service
Centres
Revenu
e (`
/Cr)
55+
50+55+
15,000+1,800+
180+
8,85
4
In India, the Company has focused on continuously augmenting its brand portfolio to have a comprehensive bouquet of products, technologies and solutions. Redington has emerged as a partner of choice for vendors, thanks to a wide range of skill sets to suit a brand's unique Go To Market (GTM) strategy, as well as for customers, given its full suite of products and solutions to cater to all their requirements.
The Growth Story
2007
1993
Countr
ies
24
Brands
Sales Off i ces
Warehouses
PartnersEmployees
Service Ce
ntres
Reve
nue (`/Cr)
200+80+
180+
51,400+4,750+
240+
41,156
2017
In the overseas market, Redington commenced its distribution business in 2000 with HP for consumables. Over the last 17 years the Company has consistently acquired new brands (presently 100+) across numerous product categories and addresses 22 markets in the Middle East, Turkey, Africa and CIS regions through an in-country business model, catering to the technology requirements of both consumer and enterprise customers.
In 2010, Redington took a 49.4% stake in Arena, a broad line distributor, listed on the Istanbul Stock Exchange. In 2015, it took 70% stake in Linkplus, a value added distributor, in Turkey.
The services business was branded as Ensure Services in 2013. The Company now has 50 service centers in the region. Similar to India, warehousing and logistics were housed under the ProConnect brand, first in the UAE followed by Saudi Arabia.
Annual Report
2016–201710
Annual Report
2016–201711
Diversification for Growth
A foray was made in the smartphone distribution space through a tie-up with BlackBerry. At that time, BlackBerry phones were being sold only in the 'locked' form through telecom operators. Redington signed-up with BlackBerry as a national distributor for both retail & channel distribution of 'unlocked' phones. This partnership successfully enabled the entire distribution ecosystem for the brand in India. Within 2 years, the volume scaled-up significantly to a level where 'locked' units contributed only a minuscule portion of BlackBerry sales in India.
This success paved the way for signing up with Apple for pan India distribution of iPhones, marking another milestone tie-up in the smartphone space. Apple's brand image and Redington's distribution capacity and network enabled yet another fascinating success story.
With both BlackBerry and Apple, Redington was instrumental in demonstrating to the brands, the inherent reach and superiority of a well-structured channel based GTM in India, as opposed to the operator based product sales strategy that these brands had adopted in other countries.
The strategy to move beyond IT has been a winning one for the Company: Nearly 30% of Redington's revenues now come from its mobil i ty and services portfol ios.
This is but an example of how the Company has made portfolio diversification the cornerstone of its growth strategy.
While continuously growing its portfolio of IT products since 1993, the Company anticipated the need to build the next growth engine and took steps to develop a portfolio of non-IT products in 2006.
New Product
Categories
Pole Player
Strategy
New Businesses
Brand Acquisit ion
From its humble beginning as a single brand distributor, Redington has grown by developing a bouquet of 200+ leading global brands and establishing successful partnerships by creating value for these brands.
Brand Acquisit ion
The Company has systematically expanded its footprints in India, METACIS and South Asia, growing its partner base from a small set of resellers to a family of 51,400+ Channel partners. This spans the entire channel category from small resellers to corporate resellers, Value Added Resellers, System
Integrators, Retailers, Solution partners, Large Format Retailers and Online E-Commerce. The Company has helped graduate corporate resellers and System Integrators (SIs) to a solution selling business model. It deploys highly skilled presales teams with partners to help them build solutions for their customers. Redington equips the pre-sales engine with the latest technical and product certification, who in turn work towards partner enablement and implementation. It works along with the partners in identifying business opportunities and expanding the customer base. Channel partners, big and small, gravitate naturally towards Redington, recognizing the company's emphasis on trust and transparency.
Pole Player
Strategy
The Four Vectors of Growth
Annual Report
2016–201712
Annual Report
2016–201713
Redington's success is underscored by its customers and its people. I ts abi l i ty to execute, understand and manage risks, and its fantast ic portfol io of brands, products and markets give the Company a winning edge in al l the geographies that it operates in.
Customer
Whether it is a customer with requirement for a single product line or one requiring support for large turnkey projects running into multi-million dollars involving multiple vendors, Redington's excellent execution capability has always been a source of great comfort and assurance to its vendors and partners. Redington strives to offer all its partners, big and small, the same degree of superior customer experience. The Company has an exclusive team for each vertical/product category and through its product management model, offers the customer a complete understanding of the domain. Redington does not transact with the end customer directly but connects only through its channel partners, building trust and transparency.
People
By far the biggest asset for Redington has been its high quality human capital - people who are custodians of knowledge about Vendors' processes, Market dynamics, Credit intelligence, various aspects of complex Project Management while delivering Revenue and Profit objectives.
Redington's skilled resources have been pivotal in building channel relationships and nurturing them to grow along with the brands. They play a major role in accessing Market Intelligence which is crucial for effective Risk Management. Redington's growth in Revenue @ CAGR of 17% and PAT @ CAGR of 16% is largely on account of its people, who have been the prime movers and key contributors in its storied journey till date.
While consolidating and nurturing its business in the Personal Computing and Printing space, the Company has continuously strengthened its Value portfolio of Server, Storage, Networking, Software and Security products and solutions. The Company can justifiably claim a well-diversified bouquet of brands in these verticals.
With the explosion of consumer demand of Smartphones, Mobility has been a huge growth engine for the Company. Redington has some of the best brands in this space with its relationships with Apple, Google Pixel, Samsung, Xiaomi and Asus. It also leads in the distribution of the lifestyle products from Apple.
The Value brands gave the Company opportunities to participate in some of the marquee Government projects like APDRP, SWAN, Biometric solutions for UID, Passport Seva Project for Ministry of External Affairs, CBDT, School Projects and many others. Redington commands dominant market share in such projects and is a lead distributor for brands like Cisco, DELL-EMC, HP and IBM.
New Product
Categories
With the view of leveraging the infrastructure and capabilities built around warehousing & logistics services over the years towards developing 3PL opportunities and in order to convert hardware support division into a truly neutral service provider, your Company hived them off into two separate wholly owned subsidiaries.
During 2012, the Company set up its warehousing & logistics subsidiary, ProConnect Supply Chain Solutions Limited, which apart from handling Redington's Supply Chain requirements, has gone on to add many prestigious independent customers, across different industry verticals. ProConnect offers an entire gamut of Third Party Logistics (3PL) services to customers spread across 12 different industry verticals. Redington aims to grow ProConnect from a pure warehousing entity to an integrated logistics solutions provider.
Ensure Support Services (India) Ltd. has been incorporated for the purpose of carrying out support services business in India. Ensure started operations from April 2014 as a neutral, independent service provider and provides a range of support services for various IT, Telecom and Consumer Electronics products.
Redington has also ventured into emerging business lines and has taken small steps in verticals like 3D printing, Solar, Health & Medical Equipments and Cloud.
New Businesses
The Winning Strengths
Annual Report
2016–201714
Annual Report
2016–201715
Nourishing Employee Growth
Redington's distinctive culture has, since its inception, bonded its people into one cohesive group, with a commonality of purpose and a unif ied goal, inspiring them to find winning solutions in the face of toughest odds.
Redington systematically recognizes employee contributions and offers them opportunities to learn and grow. Senior team members lead by example in building a cohesive culture across all levels of the Company. This culture builds strong bonds, encourages empowerment and promotes a shared vision and deep commitments towards the objectives of the Company.
eNewsletter
Town Halls
Skills Competency Mapping
Probation Review
Induction Program
Cross Functional
Dost (Buddy) Program
Management Training Program
“Back to School” Program for SBU & Sales
Heads
Long Service Award
10 & 20 Year Recognition
Talent Acquisition Learning &
Development
Regional Business Partners
Forum for People’s
Voice
“R Pulse”—Self-Help
Portal for all Employees
Cloud based
Employee Management
System
LibraryOutbound Training
People Policies
REACHThis is an extension of the READ program to include differently abled children. The aim is to make these children self sufficient so they can take care of themselves and become employable. Training is imparted by specialist teachers in partnership with various institutions like V-Sesh, V-Excel, RASA foundation, Amar Seva Sangam and Amar Jyoti.
RURAL SCIENCE PROGRAMOur rural science program focuses on intensive, job oriented live hands-on training for students to help them secure jobs in IT companies. Training includes on-site and online training programs with regular assignments.
REDINGTON EMPLOYABILITY ACADEMY FOR DEVELOPMENT (READ)This project aims to equip graduates from the lower socio economic groups with structured holistic training programs so as to improve their chances of becoming employable in a competitive environment.
REPORT CARDYouth from various backgrounds were brought into our Smart Learning Centres across the Tamil Nadu, parts of Delhi and Gwalior and trained in Communication Skills / Interpersonal Relationships/ Personality Development/ Problem Solving Ability/ Decision Making/ Office Etiquette.The youth have been trained and placed at starter level positions in front office, retail, and BPO companies. Our contribution to the society during the Financial Year under this project, inter alia, making difference in a remote rural location near Gwalior in Madhya Pradesh in association with Amar Jyoti Trust and Unnati Foundation, joining hands with "Child Voice" Nilakottai and an NGO "Reach The Unreached" at Genguvar Chathiram to train destitute ladies especially from Dindigul district in "Geriatric Care" at Kasturba Hospital at Gandhigram. These trained ladies were appointed at an old age home to give assistance to bed-ridden people who need attention.Rural Science Graduates were given rigorous software related training for 4 months at SSN Engineering College, Chennai, to help them secure remunerative jobs. COMPTIA, an international agency certifies the competency.
REPORT CARD � Vocational and special educational training for teachers through V-Excel � Regular vocational training by Rasa Foundation � Physio-therapy sessions for children by a professional therapist � Best practices spread across various rural schools � Hearing impaired children at Shanti School a unit of Avvai ashram were trained in sign language in English and Tamil by V-Shesh. A smart classroom with a smart board was set up for the benefit of the children
Foundation for CSR @ Redington
Foundation for CSR @ Redington is a trust formed by Redington (India) Limited to implement its Corporate Social Responsibi l i ty (CSR) related projects. Redington Foundation endeavors to improve employabil i ty at different levels in the community through various projects to bridge the digital divide between the have and have nots in educational infrastructure and faci l i t ies. It hones the employabil i ty ski l ls through various ski l l development programmes.
Annual Report
2016–201716
Annual Report
2016–201717
HR CONCLAVE & RAMP CENTERIn order to close the loop in the READ program through successful placements, the Foundation is now actively involved in carving out a suitable path for the trained students to find the right job. The HR conclave brings together various corporates and highlights the strength of the students to enable them to select suitable ones for employment. The proposed "Redington Hot Spot" centres under the "Redington Accredited Manning Program" (RAMP) would conduct Advanced Learning in Professional Development and Entrepreneurship for youth who have potential to be self-employed.
SAHYOG AWARDS
The SAHYOG award is a financial support extended to economically challenged students to help them complete their education. It also supports teachers financially in pursuing higher education. Outstanding and innovative teachers are recognized for their exemplary services.
PROJECT EXCELLENCE
Project Excellence focuses on enhancing excellence in the student community by associating with schools in rural and urban parts of Tamil Nadu. Foundation is engaged with educational institutions for setting up smart classes, providing material and renovating school infrastructure. It engaged with Knowledge partners like People Pro, Stem learning to co-create a learning ecosystem which brings out the improvised and holistic performance in students.
REPORT CARD � 300 Teachers and 150 Parents trained � 10,000 students from 10 schools covered in the Mini Science Lab activities (over 15,000 students from surrounding schools will benefit) � 50,000 students Learning through digital content from Smart Class
Annual Report
2016–201718
Annual Report
2016–201719
AwardsIndia
� IBM—Best Value Added Distributor for IBM software subscription and support Business � IBM—Asia Pacific IBM 2017 choice award for Top Value Added Distributor � Oracle—Iaas/Paas Cloud Transformation Partner of the year � Microsoft Volume Licensing Business—Best Distributor of the year 2016 � Palo Alto Networks—Best Distributor of the year 2016 - APAC � SonicWall—Business Excellence award for distributor of the year 2015 -16 � Schneider Electric—Top Distributor in India � Aruba—Top Distributor in India � Lenovo—Best Premium and Mainstream performance award Q2 2016 � Lenovo—Best TI partner for premium and mainstream models � Lenovo—Best TI Partner in the Data Centre Group Category 2016-17 � Quest—Best Distributor of the year 2016 � HP Indigo—Winner - Supplies excellence 2016 � HP Indigo—No. 1 world Wide with Press SW Upgrade � Autodesk—FY 17 VAD Growth Award for India Region � Autodesk—FY17 Best Partner Marketing � Service Tax top assessee award in Chennai Commissionerate III (FY 2016-17)
ProConnect � Express Logistics & Supply Chain Conclave (ELSC) – Best Mission Critical Company of the Year – Customer Intimacy & Service excellence Company of the Year – 3PL Company of the Year – Hi–Tech � ASSOCHAM—Best 3PL company on National Logistics Summit 2016 � Indus Tower—Recognition of Good Performance - Warehouse excellence Certification � Kansai Nerolac Paints/HariOm Communication—Best of Best Depot
Cadensworth � Polycom—Distributor of the year Overseas
� Great place to work—Top companies to work for in UAE 2016-17 � Sonic wall—Network Security excellence award for Best Run rate � Reseller Magazine—Best Presales Support by a distributor � WD—A Decade of Growth � Aruba—Distributor of the year for ME � HP Enterprise—Best Distributor of the year – Gulf � Aruba—Best Distributor of the year – UAE � Lenovo—Best Premium Product Distributor – East Africa � Microsoft—Distributor of the Year- Best SMB Cloud Mix � Reseller Magazine—Volume Distributor of the Year � HP Champion 2015—East Africa � Distree ME—Retail- IT Volume Distributor of the Year � Fortinet—Best Fortinet Focused Distributor � Sandisk—Outstanding award for 2015 � Sandisk—Distributor of the year 2015
Arena � Microsoft—Best Business Partner – Software � HP—Highest Sales amount � HP—Highest Sales Growth � Dell—Widest Distribution Channel
Annual Report
2016–201720
Annual Report
2016–201721
Board’s ReportTo the Members,
Your Directors are pleased to present their Twenty Fourth Annual Report together with the Audited Financial Statements of the Company for the Financial Year ended on March 31, 2017.
The Directors feel it appropriate to present the consolidated financial performance of the Company in the manner set out below, which factors the prevailing geo-political and economic environments and the associated risks and rewards.
Your Directors have made the following appropriations out of the standalone profits of the Company:
(Figures in ` /Crore)Surplus in the Statement of Profit and LossBalance as per the last Balance Sheet as on 31st March 2016 1,013.6Profit for the Financial Year 2016-17 201.7 Sub total 1,215.3Less: AppropriationsFinal Dividend paid (FY 2015-16) 84.0Special (Interim) Dividend paid (FY 2016-17) 80.0Dividend Distribution Tax on Dividend paid * 29.2Balance at the end of the year as on 31st March 2017 1,022.1
* Net of the Dividend Distribution Tax credit of ` 2.8 Crore on account of dividend received from subsidiary companies.
Financial Performance of the Company
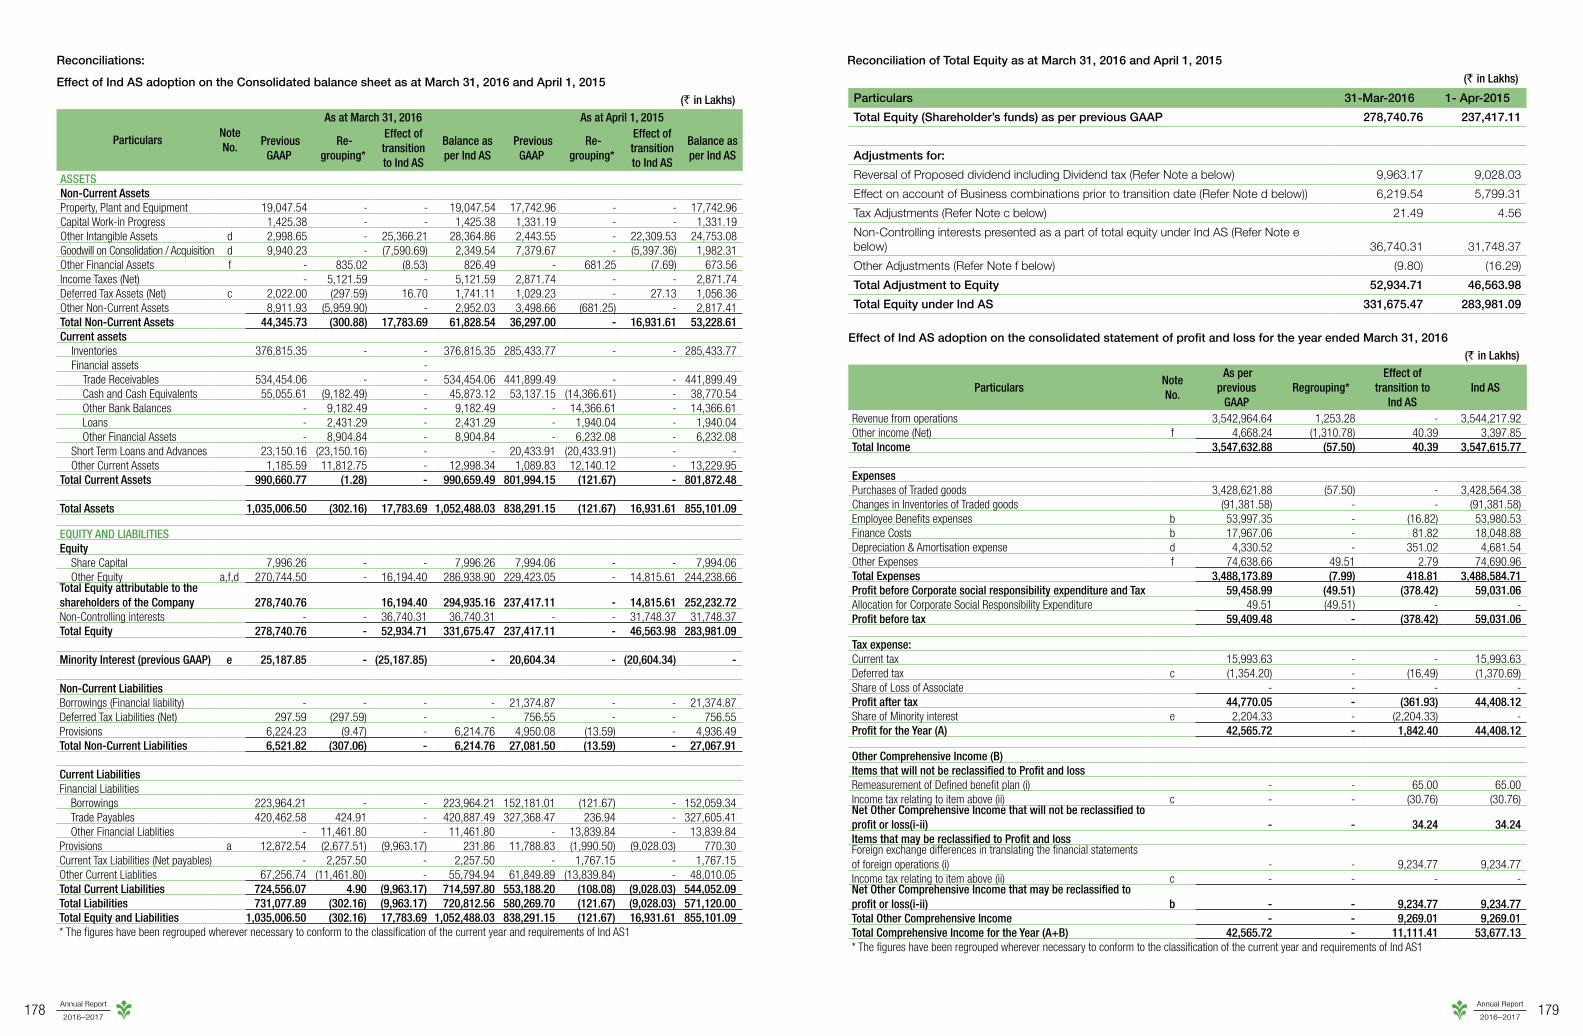
The Standalone and Consolidated Financial Statements of the Company for the Financial Year 2016-17 have been prepared, for the first time, in accordance with the Indian Accounting Standards (Ind AS) as required under the Companies Act, 2013.
The consolidated revenues of your Company was ` 41,156.1 Crore as against ` 35, 476.2 Crore in the previous year registering a growth of 16% . The consolidated net profit for the year grew by 9.6% to ` 464.2 Crore for 2016-17 as against ` 423.5 Crore in the previous year. The Company completed ten years of listing during the financial year with revenue CAGR of 17% and profit CAGR of 16%.
The Earnings Per Share (EPS) on a consolidated basis (based on weighted average number of shares during the year) increased to ` 11.6 for the year under review as compared to ` 10.6 for the previous year.
A detailed analysis on the financial performance of the Company is given as part of the Management Discussion and Analysis report, which forms part of this report.
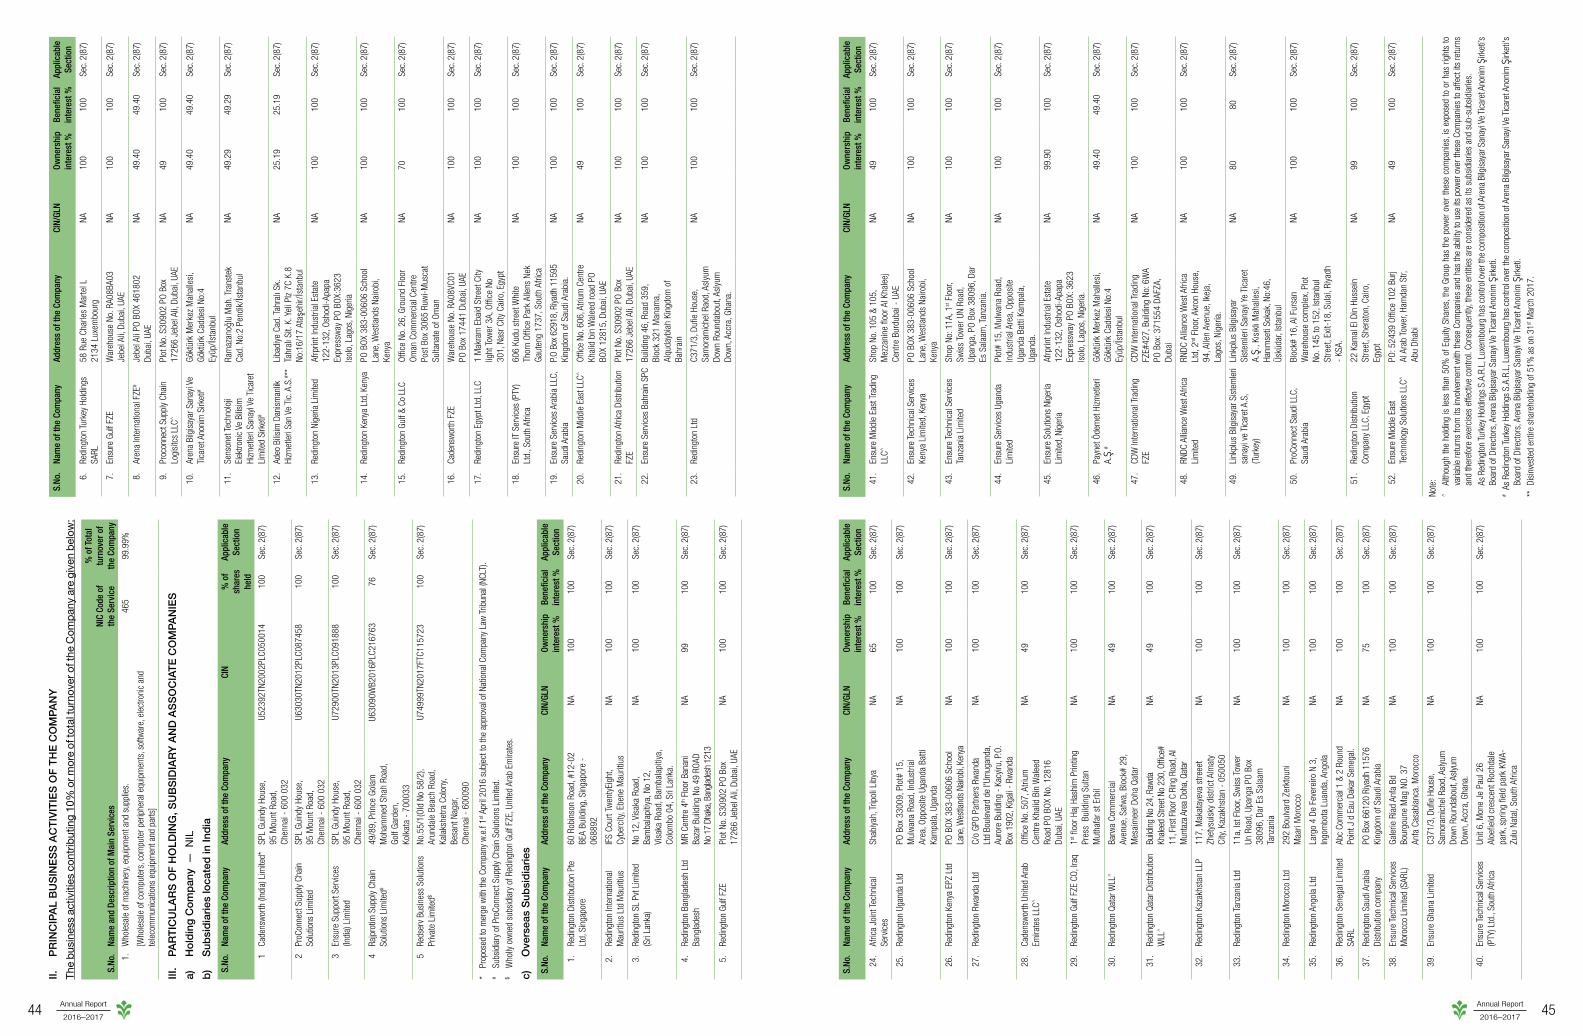
Statement on the salient features of the financial statements of Subsidiaries and Associate in the prescribed Form AOC 1 is appended as part of this report. The details of the subsidiaries incorporated during the financial year under review are given as part of notes to the consolidated financial statements.
Dividend
During the last financial year, the Board of Directors had declared a Special (Interim) Dividend of ` 2/- per share (i.e.100% of the Face Value), to commemorate the completion of 10 years of listing on the bourses.
In addition, considering the improved performance of the Company, the Directors are pleased to recommend an enhanced dividend of ` 2.30 per share (i.e.115% of the Face Value) for the year ended 31st March 2017 as compared to ` 2.10 per share (i.e. 105% of the Face Value) for the previous year.
Indian Operations
Information Technology Products
Personal Computing & Printing
Rising incomes have led to improvements in the standard of living. This, coupled with quicker adoption to changing trends has perceptibly transformed consumer behavior and spending patterns. These changes have negatively impacted the demand and purchasing frequency of IT products by the consumers. This trend which revealed itself over the past few years, is now more evident with proliferation of low-cost, big screen smartphones, which offer a compelling substitute to a PC for content consumption.
The absence of forceful demand drivers along with the effects of demonetization in the second half of the year adversely impacted the consumer segment. Your Company, however, overcame these challenges and grew its revenue in the PC space faster than industry, through systematic expansion of the partner base and effective capitalization of opportunities presented by the E-Commerce industry.
Some strategies which helped us grow the overall Consumer Group revenues are:
• SuccessfulcapitalizationofagrowingopportunityintheE-Commercesegment'sdemandforexternalharddrives.Thiswaspossible due to a strong collaboration with Western Digital (WD) and proactive planning towards Just-In-Time (JIT) inventory to efficientlycatertothesegment'sdemandpattern.
Future growth in the Consumer segment would be ensured through active participation in all possible growth opportunities (including the gaming segment), enabled by strong partnerships with key vendors & partners and through incremental enhancement of the portfolio.
Commercial, Enterprise & Infrastructure
The changing business mix of your Company has mirrored the growing technology adoption by Indian customers over the years. Your Company has kept pace with the fast changing demand pattern for technology products and solutions through proactive investments in skills and resources. This has enabled your Company evolve from a Volume Distributor of basic PC products to a Value Added Distributor for Enterprise grade Systems and recently, to a Solution oriented Distributor for its Technology vendors and partners.
YourCompany'srevenuesintheCommercial,Enterprise&Infrastructurespacegrewonthebackofstrongengagementwithtechnology vendors and aggressive participation in all available opportunities.
Growth in the Enterprise segment during FY 16-17 was fueled largely by infrastructure upgrades carried out by customers in the Telecom and BFSI segments. Investments in IT products and solutions remained guarded in the other Enterprise sectors. After showing buoyancy over the past few years, demand in the SMB and mid-market segment remained lackluster during the last fiscal.
Future growth in this segment is expected to be fueled strongly by Government investments for digitization of the country through theSmartCity&DigitalIndiaprojects.YourCompanyisstronglypositionedtoleveragetheopportunitiesthatwillpotentiallyarisefrom these investments.
Mobility
Over the years, your Company has successfully built a niche for itself in the Mobility space through strong partnerships with select Smartphone brands. Apart from being one of the largest partners for the Apple iPhone portfolio, during FY 16-17 it also secured thecontracttodistributeGoogle'sPixelbrandofsmartphonesinIndia.
Annual Report
2016–201723
Annual Report
2016–201722
The company considers E-Commerce as a valuable GTM path and during the year under review, generated 16% of its domestic mobility revenues from the E-Commerce players.
The Smartphone space will continue to provide growth opportunities in the coming years and your Company will aim to take advantageofthesamethroughjudiciousadditiontoitsportfolio.
Services
Cloud Services
Cloud Computing being clearly established as the future of buying and consuming IT infrastructure and Services, your Company has made significant investments over the past two years towards building its capabilities as a Distributor and Services provider for Cloud products and Solutions. It is building its offerings in the Cloud space in partnership with the Big Four in the Cloud Business - Amazon Web Services (AWS), Microsoft, IBM and Oracle. Your Company offers Cloud Consulting, Migration, Support and Managed Cloud Services and has gained early recognition in this area from Oracle as "The Cloud (Iaas/PaaS) Transformation Partner of the year 2016-17".
It has launched a "state of the art" Unified Digital Cloud Business Platform, integrated across multiple cloud technology vendors, productsandCloudServices.Thisessential,self-serviceplatformoffersyourCompany'spartnersandcustomersaseamlessinterface for selecting and ordering products and services from a catalogue, while allowing a choice of monthly / quarterly / annual billing, as per individual consumption patterns.
Other Services
Your Company was an early investor in the digital printing space and we are now witnessing a transition of several applications fromconventionalcommercialprinting todigitalprinting.Printing technologyproviders likeHPhavedevelopedproductsandsolutions to address the "print on-demand" requirements of a rapidly growing class of customers in this digital age. It is a matter of great pride for your Company that its "Centre of Excellence" for Digital Printing Technology is one of its kind in the country and hasbeenrecognizedbyHPasbest-in-classinAsia.
Application and usage of 3D Printing technology is evolving at a rapid pace and your Company expects increasing adoption of thistechnologyinverticalslikeAutomobiles,Education,R&D,Manufacturing,Aviation,DefenseandHealthCare,wherethereisa growing demand for customized parts at an optimal price, with the shortest possible lead time for design and development. To capture this opportunity and build an early mover advantage, your Company is investing in a digital parts manufacturing unit.
Automated Distribution Centers
The Automated Distribution Centers (ADCs) located in Chennai & Kolkata are leased out to and operated by ProConnect SupplyChainSolutionsLimited,awhollyownedsubsidiary.OperationsoutoftheseADCshavedemonstratedyourCompany'scapabilities in bringing efficiency through automation and process orientation in a cost-efficient manner in compliance with best practices in the Supply Chain business. The ADCs are equipped with Very Narrow Aisle (VNA) design and use hand-held, Radio Frequency controlled devices. Phase 2 expansion of Chennai ADC has been rolled out to meet the growing capacity needs for such state-of-the-art infrastructure.
Indian Subsidiaries
Cadensworth (India) Limited – (Cadensworth)
Changes in Vendor GTM strategies and evolving market dynamics has nullified the specific advantage of housing select Distribution portfolios underCadensworth (India) Limited.Hence, in order tomaximize synergies and bring in cost optimization throughintegrated resource utilization, your Company decided to recommend merging of the operations of Cadensworth with that of your Company's.TheBoardofDirectors,duringitsmeetingheldonMay24,2016gaveitsconsenttotheproposalanddecidedtomerge Cadensworth (India) Limited with the Company with effect from April 1, 2016, under a scheme of arrangement (merger), subjecttonecessarystatutoryandotherapprovals.
Pending approval of the Scheme by NCLT, the results of the said subsidiary as at and for the year ended March 31, 2017 have notbeenincludedintheStandaloneFinancialStatements.However,itispartofConsolidatedFinancialStatements.
ProConnect Supply Chain Solutions Limited (ProConnect), the wholly owned subsidiary of your Company, is engaged in providing supply chain solutions to varied industry verticals in India. Apart from your Company, ProConnect has 123 independent customers, who together contributed 65% of the consolidated total revenue for FY 16-17. For the year under review, on consolidated basis, Revenue grew by 64 % and Profit After Tax by 106 % YoY.
ProConnect is an emerging integrated logistics service provider. With a network of 150 warehouses spanning an area of 4.8 Million sq.ft. of storage space, it focuses on offering customized supply chain solutions to customers, pan India.
Robustsystems,well-definedprocessesandtightcontrolovereveryaspectof itsservicesare thehallmarkofProConnect'sbusiness offering to its customers. IP enabled physical surveillance ensure safety of goods and sanctity of stocks through avoidance of handling damage, pilferage and theft. A Disaster Recovery (DR) facility has also been set up in Chennai to enable seamless and continuous operations.
In an effort to take advantage of technological advancements, ProConnect has moved its workloads to the Cloud and has also invested in Customer Relationship Management (CRM) tools. Moving its Warehousing Management Systems (WMS) to the Cloud has enabled the Company realize 99.9% uptime for its operations.
Some of its Value-added offerings include GPS tracking for all high value shipments, enabling accurate cargo tracking & TAT management and electronic validation of receipt against ex-warehouse deliveries.
ProConnect has tapped into opportunities provided from E-Commerce segment and now manages Fulfillment Centers for some ofthemajorE-Commerceplayers.
ProConnect expects to derive benefits from transition to the GST regime by way of consolidation of warehouses as well as increased business opportunities for its integrated services. ProConnect's investments and diligent process changeswouldenable your Company to transition seamlessly to the GST era.
To augment its presence in the Eastern and North-Eastern region of India, an area offering high growth potential, ProConnect hasacquireda76%stakeinRajprotimSupplyChainSolutionsLimitedaWarehousingandLogisticsCompanyheadquarteredin Kolkata.
Ensure Support Services (India) Limited – (Ensure)
Ensure Support Services India Limited (Ensure), a wholly owned subsidiary of your Company, provides complete post-sales services covering call center support, national service delivery, warehousing & logistics including imports & re-exports, backend repairs, and online CRM for complaint and inventory management services for a range of products that includes mobile phones, desktops, laptops, printers, plotters, servers, networking components and storage products. It operates through a network of 40 company owned and 156 partner service centers.
Moving up the value chain, Ensure is investing in increasing its capabilities in the Enterprise space. The company has built a customer base of 1800 for its Infrastructure Management Services. It is building skills in Managed Security Services and Managed Print Services, potentially high growth areas in this digitized and Opex oriented age. Ensure also offers last mile support for ecommerce companies in India.
Initiatives like Work Force Management, Central Control Tower for monitoring and managing field engineers, Spare Parts forecasting system for improved fulfillment rate has enabled Ensure upgrade its performance and productivity levels. This is further evidenced by the results of online customer satisfaction surveys, which have been better than industry standards.
Indian Associate
Redington (India) Investments Limited is an Associate Company of your Company. It has a wholly owned subsidiary, Currents Technology Retail (India) Limited ("Currents") which manages a chain of retail stores across India. The company focuses operations in specific clusters of markets in the North, South and Eastern regions. During the year, the company has consolidated its brand in these respective catchments, backed by a strong Apple product line-up.
Overseas Operations
YourCompany'soverseasoperationsarecarriedout through twowhollyownedsubsidiaries;Redington InternationalMauritiusLimited, Mauritius (RIML) addressing Middle East, Turkey, Africa (META) region and Redington Distribution Pte Limited, Singapore (RDPL) addressing the South Asian region comprising of Sri Lanka, Bangladesh, Nepal and Maldives markets.
During 2016-17, RDPL as a consolidated entity, posted strong double digit growth in Earnings. It is expected that it will continue to grow in the coming years.
For Redington Gulf FZE (Redington Gulf), a wholly owned subsidiary of RIML addressing the META region, the year gone by was yet another period filled with turmoil due to varying challenges across the region - depreciating currencies in Turkey & Nigeria (as also continuing constraints on repatriation of US Dollars from Nigeria), coup attempt & its aftermath of political uncertainty in Turkey and a spate of credit defaults in the UAE markets, significantly heightening credit risk.
Increased credit risk in the UAE has resulted in an appreciable reduction in the appetite of the credit insurers. Redington Gulf has initiated certain changes to its risk management practices and has also taken measures to restrict extension of credit to resellers in the UAE. The business landscape in the Gulf Cooperation Council (GCC) countries is expected to undergo a significant change with theplannedimplementationofVATeffectiveJanuary'18intheregion.
Annual Report
2016–201725
Annual Report
2016–201724
However,undeterredbythechallenges,RedingtonGulfhasmaintaineditsrecordofimpressivegrowthinrevenuesandprofitswhileretaining its position as the largest technology distributor in the region. You would also be pleased to know that Redington Gulf has beenadjudgedasoneoftheTop24"GreatPlacestoWork"intheUAE.
The PC market globally and in the META has continued to decline, though the rate of decline has slowed down. In spite of this declining industry trend, Redington Gulf continued to demonstrate growth in the total number of PCs shipped. It has also fortified itspositionwithcertainkeyvendorssuchasHPandDell.
To further address the challenges of declining segment growth, Redington Gulf focused on significantly improving its Working Capital efficiencies. These efforts brought about rich dividends with a significant reduction in Working Capital deployment. It is committed to continuing these steps towards efficient Working Capital management.
In the printing segment, Redington Gulf now has a comprehensive print portfolio with the addition of brands such as Ricoh and Epson.Inaddition,akeyinitiativeundertakenwastocommencedistributionoftheHPcommerciallineofprinters(A3),whichisa focus area for the vendor due to its huge potential.
Converged Infrastructure
The Enterprise customers in the region have demonstrated a growing tendency of opting for Value-for-Money, mid-level infrastructure, rather than the traditional Capex-intensive, system-heavy solutions. Redington Gulf is well poised to leverage this shift,aligning itselfwithConvergedandHyper-Converged infrastructureproviderssuchasEMCVXRail,Pivot3andSimplivity(recentlyacquiredbyHPE).
With the networking space being transformed through "Software Defined Networking", Redington Gulf has positioned itself to exploit opportunities in this space by strengthening its alliances and investing strategically in partnerships with key vendors like VMware,NSX,etc.Expandingitsreachintonewermarketsegments,ithaspartneredwithHuawei,acompanywhichhasbeenrapidly gaining market share in the enterprise networking space.
In order to showcase its capabilities in Private Cloud and Software Defined Networking Solutions to potential end-customers, Redington Gulf has invested in a state-of-the-art Solution Center - "Red Vault", boasting of the largest transparent touch screen interface in the region.
Software and Security Solutions
SoftwareSolutionsandEnterpriseLinuxcontinuetogeneratedemandandRedingtonGulf'sstrategicalliancewithRedHat,theleader in the software space is a key relationship in this area. We would continue to expand and invest in our partnership with RedHat.
Redington Gulf has partnered with Fortinet, which, according to IDC, is the number one security vendor in the region. We have highly-skilledpre-salesconsultants,givingthecapabilitytoexecutemajorsecurityprojectsfordifferentindustryverticals.Weplanto sign up with key end-point and network security vendors, while acquiring skills in the area of consulting services on Cyber Security.
Mobility
Overthe lastfewyears,RedingtonGulf'sreputationasa leadingTelecomdistributorwas limitedtoAfrica.However,withtheacquisition of the distribution agreement for iPhones for KSA during FY 16-17, in addition to UAE and Africa, it now has a dominant position in the Mobility distribution in these 3 regions.
In addition to a good brand portfolio, Redington Gulf has built distribution reach in the Middle East through a fleet of vans that cater to multiple reseller points in Tier-1 cities, as well as resellers in Tier-2 towns.
Cloud Computing, Big Data Analytics and Internet of Things
To position itself as a relevant partner in the Cloud Computing space, Redington Gulf has entered into strategic alliances with leading Cloud providers in the region - Microsoft and Amazon Web Services. In order to address the opportunities presented by growing Cloud adoption in the region, it has developed "Red Cloud", a Cloud aggregation portal. The portal serves as a marketplace and one-stop shop for Cloud solutions, thereby ensuring hassle free migration for the customers
The company recognizes the growing importance of Big Data Analytics in studying business trends and for developing effective business strategies. By onboarding Splunk, a Magic Quadrant Leader on Big Data Analytics, Redington Gulf is developing the competency to take this technology to the market and building a pipeline as the technology gathers momentum.
Directors and Key Managerial Personnel
The details of changes in the Directorships during the Financial Year 2016-17 is given below:
a) Details of Appointment:
Name Designation Date of AppointmentMr.E.H.KasturiRangan Whole Time Director May 24, 2016Mr. B. Ramaratnam Director May 24, 2016Mr. Udai Dhawan Director January 10, 2017
b) Details of Resignation/Retirement:
Name Designation Date of ResignationMr. M. Raghunandan Whole Time Director May 24, 2016Mr. N. Srinivasan Director May 24, 2016Mr. R. Jayachandran Director September 30, 2016Mr. Nainesh Jaisingh Director January 9, 2017Mr. R. Srinivasan Director February 2, 2017
The Board place on record their appreciation of the services rendered by each director during their tenure in the Company.
During course of the year, Mr. Nainesh Jaisingh, citing his added roles and responsibilities within his organization, resigned from theBoardandMr.UdaiDhawan,ManagingDirectorandHeadofStandardCharteredPrivateEquityinIndia,wasappointedonthe Board as an Additional Director effective 10th January 2017. Your Company has received notice from a member proposing Mr. Dhawan's appointment as Director of the Company, along with the requisite deposit. Resolution for appointment ofMr. Udai Dhawan as Director of the Company is included in the notice of Annual General Meeting.
ThetenureofappointmentofMr.RajShankarasManagingDirectorwillcometoanendon25th July 2017. The Board of Directors at their meeting held on 25thMay2017haveapprovedre-appointmentofMr.RajShankarasManagingDirectorforaperiodoffive years with effect from 26thJuly2017subjecttotheapprovalofshareholdersintheensuingAnnualGeneralMeetingandtheapproval of the Central Government, since he is a non-resident.
Mr. B. Ramaratnam and Mr. Tu, Shu-Chyuan, Directors of the Company are liable to retire by rotation, and being eligible, have offered themselves for re-appointment.
Brief resumes of the Directors who are getting appointed / reappointed are furnished in the Notice of Annual General Meeting.
Directors' Responsibility StatementIn compliance with Section 134(5) of the Companies Act, 2013, the Directors of the Company, state that:a) in the preparation of the annual accounts for the year ended March 31, 2017, the applicable accounting standards read with
are reasonable and prudent so as to give a true and fair view of the state of affairs of the Company as at March 31, 2017 and oftheprofitoftheCompanyfortheyearendedonthatdate;
c) The Directors have taken proper and sufficient care for the maintenance of adequate accounting records in accordance with the provisions of the Act, for safeguarding the assets of the Company and for preventing and detecting fraud and other irregularities;
d) TheDirectorshavepreparedtheannualaccountsona'goingconcern'basis;e) The Directors have laid down internal financial controls to be followed by the Company and that such internal financial
controlsareadequateandareoperatingeffectively;andf) The Directors have devised proper systems to ensure compliance with the provisions of all applicable laws and that such
systems are adequate and operating effectively.
Credit Rating
During the year,
• CRISIL(AS&PGlobalCompany)hasreaffirmeditsratingonthelong-termbankfacilitiesofyourCompanyasAA-.However,it has upgraded the outlook from "STABLE" to "POSITIVE". The current rating stands at AA- Positive (read as double A minus, Positive).Theratingontheshort-termdebtandbankloanfacilitieshadbeenreaffirmedat'CRISILA1+'(readasCRISILAoneplus), which is the highest rating for this category.
• ICRA(AMoody'sInvestorsServiceCompany)reaffirmeditsratingsforthelong-termfundbasedfacilitiesas'ICRAAA-'(readas ICRA Double A minus). It has also reaffirmed its rating on the short-term debt program/commercial paper, fund and non-fundbasedfacilitiesat'ICRAA1+'(readasICRAAoneplus),theirhighestratinginthiscategory.
Annual Report
2016–201727
Annual Report
2016–201726
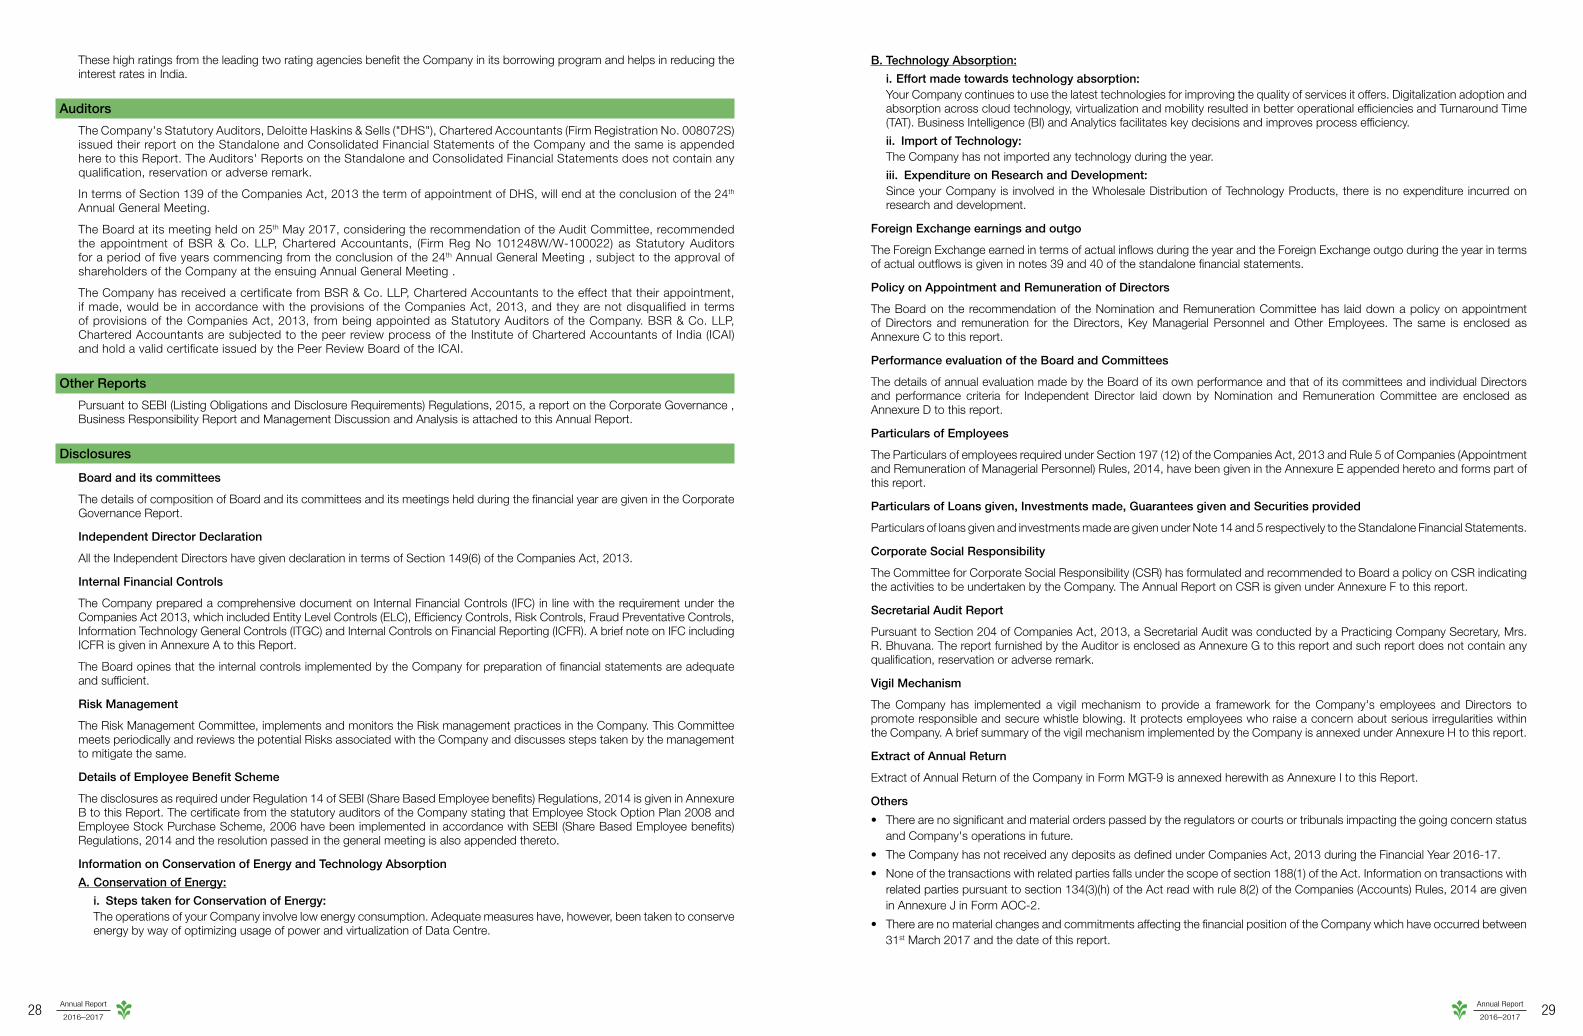
These high ratings from the leading two rating agencies benefit the Company in its borrowing program and helps in reducing the interest rates in India.
Auditors
TheCompany'sStatutoryAuditors,DeloitteHaskins&Sells("DHS"),CharteredAccountants(FirmRegistrationNo.008072S)issued their report on the Standalone and Consolidated Financial Statements of the Company and the same is appended heretothisReport.TheAuditors'ReportsontheStandaloneandConsolidatedFinancialStatementsdoesnotcontainanyqualification, reservation or adverse remark.
IntermsofSection139oftheCompaniesAct,2013thetermofappointmentofDHS,willendattheconclusionofthe24th Annual General Meeting.
The Board at its meeting held on 25th May 2017, considering the recommendation of the Audit Committee, recommended the appointment of BSR & Co. LLP, Chartered Accountants, (Firm Reg No 101248W/W-100022) as Statutory Auditors for a period of five years commencing from the conclusion of the 24thAnnualGeneralMeeting,subjecttotheapprovalofshareholders of the Company at the ensuing Annual General Meeting .
The Company has received a certificate from BSR & Co. LLP, Chartered Accountants to the effect that their appointment, if made, would be in accordance with the provisions of the Companies Act, 2013, and they are not disqualified in terms of provisions of the Companies Act, 2013, from being appointed as Statutory Auditors of the Company. BSR & Co. LLP, CharteredAccountantsaresubjectedtothepeerreviewprocessoftheInstituteofCharteredAccountantsofIndia(ICAI)and hold a valid certificate issued by the Peer Review Board of the ICAI.
Other Reports
Pursuant to SEBI (Listing Obligations and Disclosure Requirements) Regulations, 2015, a report on the Corporate Governance , Business Responsibility Report and Management Discussion and Analysis is attached to this Annual Report.
Disclosures
Board and its committees
The details of composition of Board and its committees and its meetings held during the financial year are given in the Corporate Governance Report.
Independent Director Declaration
All the Independent Directors have given declaration in terms of Section 149(6) of the Companies Act, 2013.
Internal Financial Controls
The Company prepared a comprehensive document on Internal Financial Controls (IFC) in line with the requirement under the Companies Act 2013, which included Entity Level Controls (ELC), Efficiency Controls, Risk Controls, Fraud Preventative Controls, Information Technology General Controls (ITGC) and Internal Controls on Financial Reporting (ICFR). A brief note on IFC including ICFR is given in Annexure A to this Report.
The Board opines that the internal controls implemented by the Company for preparation of financial statements are adequate and sufficient.
Risk Management
The Risk Management Committee, implements and monitors the Risk management practices in the Company. This Committee meets periodically and reviews the potential Risks associated with the Company and discusses steps taken by the management to mitigate the same.
Details of Employee Benefit Scheme
The disclosures as required under Regulation 14 of SEBI (Share Based Employee benefits) Regulations, 2014 is given in Annexure B to this Report. The certificate from the statutory auditors of the Company stating that Employee Stock Option Plan 2008 and Employee Stock Purchase Scheme, 2006 have been implemented in accordance with SEBI (Share Based Employee benefits) Regulations, 2014 and the resolution passed in the general meeting is also appended thereto.
Information on Conservation of Energy and Technology Absorption
A. Conservation of Energy:
i. Steps taken for Conservation of Energy:The operations of your Company involve low energy consumption. Adequate measures have, however, been taken to conserve energy by way of optimizing usage of power and virtualization of Data Centre.
B. Technology Absorption:
i. Effort made towards technology absorption:Your Company continues to use the latest technologies for improving the quality of services it offers. Digitalization adoption and absorption across cloud technology, virtualization and mobility resulted in better operational efficiencies and Turnaround Time (TAT). Business Intelligence (BI) and Analytics facilitates key decisions and improves process efficiency.
ii. Import of Technology:The Company has not imported any technology during the year.
iii. Expenditure on Research and Development:Since your Company is involved in the Wholesale Distribution of Technology Products, there is no expenditure incurred on research and development.
Foreign Exchange earnings and outgo
The Foreign Exchange earned in terms of actual inflows during the year and the Foreign Exchange outgo during the year in terms of actual outflows is given in notes 39 and 40 of the standalone financial statements.
Policy on Appointment and Remuneration of Directors
The Board on the recommendation of the Nomination and Remuneration Committee has laid down a policy on appointment of Directors and remuneration for the Directors, Key Managerial Personnel and Other Employees. The same is enclosed as Annexure C to this report.
Performance evaluation of the Board and Committees
The details of annual evaluation made by the Board of its own performance and that of its committees and individual Directors and performance criteria for Independent Director laid down by Nomination and Remuneration Committee are enclosed as Annexure D to this report.
Particulars of Employees
The Particulars of employees required under Section 197 (12) of the Companies Act, 2013 and Rule 5 of Companies (Appointment and Remuneration of Managerial Personnel) Rules, 2014, have been given in the Annexure E appended hereto and forms part of this report.
Particulars of Loans given, Investments made, Guarantees given and Securities provided
Particulars of loans given and investments made are given under Note 14 and 5 respectively to the Standalone Financial Statements.
Corporate Social Responsibility
The Committee for Corporate Social Responsibility (CSR) has formulated and recommended to Board a policy on CSR indicating the activities to be undertaken by the Company. The Annual Report on CSR is given under Annexure F to this report.
Secretarial Audit Report
Pursuant to Section 204 of Companies Act, 2013, a Secretarial Audit was conducted by a Practicing Company Secretary, Mrs. R. Bhuvana. The report furnished by the Auditor is enclosed as Annexure G to this report and such report does not contain any qualification, reservation or adverse remark.
Vigil Mechanism
TheCompany has implemented a vigilmechanism to provide a framework for theCompany's employees andDirectors topromote responsible and secure whistle blowing. It protects employees who raise a concern about serious irregularities within theCompany.AbriefsummaryofthevigilmechanismimplementedbytheCompanyisannexedunderAnnexureHtothisreport.
Extract of Annual Return
Extract of Annual Return of the Company in Form MGT-9 is annexed herewith as Annexure I to this Report.
• Noneofthetransactionswithrelatedpartiesfallsunderthescopeofsection188(1)oftheAct.Informationontransactionswithrelated parties pursuant to section 134(3)(h) of the Act read with rule 8(2) of the Companies (Accounts) Rules, 2014 are given in Annexure J in Form AOC-2.
• TherearenomaterialchangesandcommitmentsaffectingthefinancialpositionoftheCompanywhichhaveoccurredbetween31st March 2017 and the date of this report.
With regard to the downstream investments in Indian subsidiaries, the Company is in compliance with the FDI regulations and the Company has obtained a certificate from the statutory auditors in this regard.
Sexual Harassment of Women at Workplace (Prevention, Prohibition and Redressal) Act, 2013
Your Directors take this opportunity to thank the shareholders including the principal shareholders, suppliers, customers, bankers, businesspartners/associates,fortheirconsistentsupportandencouragementtotheCompany.PleasejoinmeandtheBoardMembers in conveying our sincere appreciation to all employees of the Company, its Subsidiaries and Associate for their hard work and commitment. Their dedication and competence has ensured that the Company continues to be a significant and leading player in the industry.
On behalf of the Board of Directors
Place : Chennai J RamachandranDate : May 25, 2017 Chairman
Index of Annexure to the Board's Report
Annexure Reference Details of disclosure
A Note on Internal Financial ControlsB Disclosures as required under Regulation 14 of SEBI (Share Based Employee benefits) Regulations, 2014C Policy on appointment of Directors and remuneration for the Directors, Key Managerial Personnel and Other
Employees.D Details of Performance evaluation of Board & Committee and the Evaluation criteria for Independent DirectorsE Particulars of employees required under Rule 5 of Companies (Appointment and Remuneration of Managerial
Personnel) Rules, 2014F Report on Corporate Social ResponsibilityG Secretarial Audit ReportH Summary of the vigil mechanismI Extract of Annual Return of the Company in Form MGT-9J Form AOC-2K Policy on Dividend Distribution
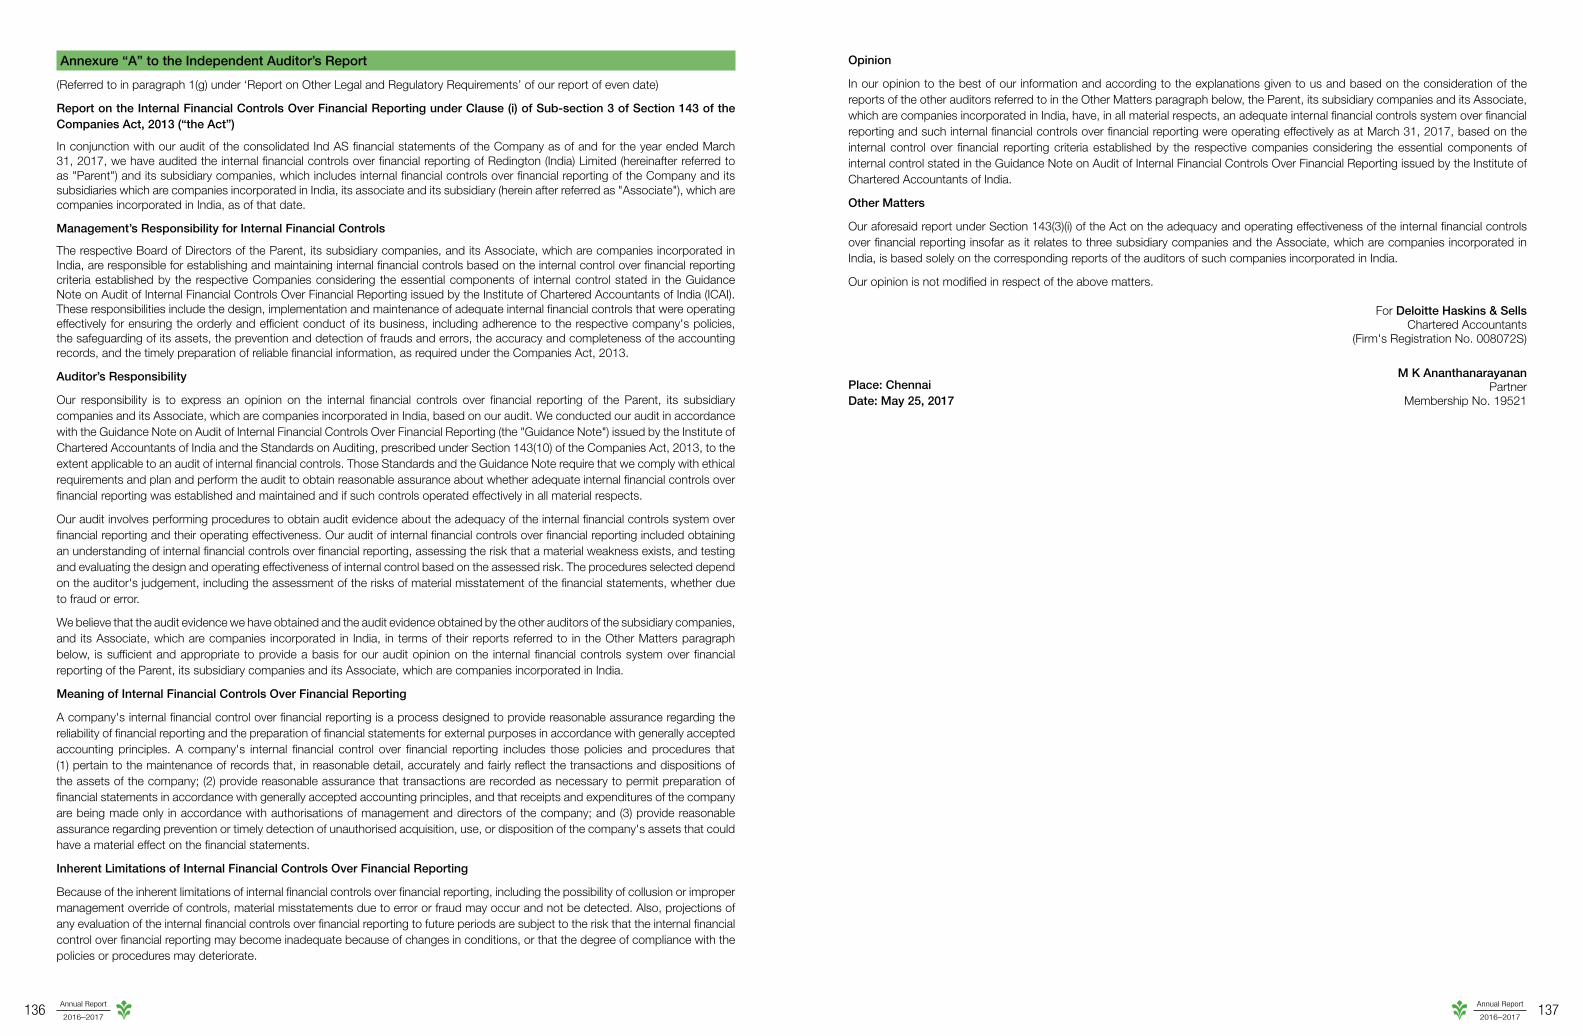
Annexure A
The Companies Act, 2013 has laid down responsibility on the Directors with respect to Internal Financial Control (IFC). The Institute of Chartered Accountants of India has issued a Guidance Note which prescribes the framework and risks that needs to be covered by a company regarding IFC.
The Company has envisaged the necessity for a good financial control environment much ahead of the requirement envisioned under the Companies Act, 2013. The Company has an existing framework of IFC which has been documented and tested based on the results of such assessments carried out by Management, no reportable material weakness or significant deficiencies in the design or operation of internal financial controls was observed.
Some of the key controls are:
Entity Level Controls (ELCs):
ELCs are imperative to an organisation as it fosters a culture which sets the tone for a sound control environment within the organization. Support of management is essential to build and sustain an effective control environment. The Company has perceived this necessity and has demonstrated its intention and commitment by adopting COSO Principle (Committee of Sponsoring Organisation of the Treadway Commission), which is followed across the globe, in framing its IFC.
Entity-level controls include
• Controlsrelatedtothecontrolenvironment;
• Controlsovermanagementoverride
Efficiency Controls:
Over the years, the Company has built up a reservoir of knowledge in the field of distribution which has evolved into distinct business intelligence. This business intelligence is being leveraged to assist in the decision making process by way of efficiency controls.
TheCompanybelievesthatefficiencycontrolsareessentialforlongtermsustenanceoftheCompany.Hence,higheremphasisis placed on coverage and completeness of efficiency controls. Influence of market trends, geography, the economy and vendor policy are considered in formulating efficiency controls.
Risk Controls:
The Company has a defined process for risk management. Risks are identified based on internal and external factors. Risk are then analysed and managed based on appetite, transfer, mitigation and avoidance.
Insurance coverage, factoring etc., is resorted to wherever the risk can be transferred. Risks are mitigated when it is not avoidable. Risks are avoided when it cannot be transferred or mitigated and the returns are not commensurate with the rewards.
Fraud Deterrence Controls:
The Company has identified certain key areas where possibility of fraud could occur. Checks & balances are built into the system duringtransactionprocessingtodeterfraud.Areaspronetofraudsaresubjecttoconstantreviewandauditbytheexternalandthe in-house internal audit team.
ITGCs is an integral part of control environment of the Company. ITGCs are broad controls over general IT activities, such as security and access, computer operations, and systems development and system changes. .
Emphasis is placed on preventive controls and internal checks through the IT System.
Internal Control on Financial Reporting (ICFR):
The Company has developed robust controls for financial reporting. The controls hovers around two parameters, one, based on information generated by the Company through its operations, and two, requirements specified under various statutes.
The controls are designed from the point of view of "What could go wrong" or the inherent risk associated with the particular transaction or account that could distort the financial statement. The Institute of Chartered Accountants of India has issued a Guidance Note which is considered for detailing the inherent risk associated with a particular account in addition to the risk perceived by the Company.
Annexure B
Details related to Employee Stock Option Plan, 2008 (ESOP)
A. Summary of Status of ESOPs Granted
The position of the existing schemes is summarized as under -
Particulars Redington (India) Limited
1 DateofShareholder'sApproval 27-Feb-08
2 Total Number of Options approved under ESOPs 2,335,973
3 Vesting requirement 50% of options - 1 year from date of grant, 25% of options - 2 years from date of grant, 25% of options - 3 years from date of grant
4 Exercise Price or Pricing Formula Market price or such price as decided by the Board
5 Maximum term of Options granted 5 years from the date of vesting
6 Source of shares Primary
7 Variation in terms of ESOP No variations made in the current year
B. The Company uses Fair Valuation method of accounting for Equity based plans.
C. The weighted average market price of options exercised during the year: ` 106.09
D. Diluted EPS for the Financial Year ended 31st March 2017: ` 5.04
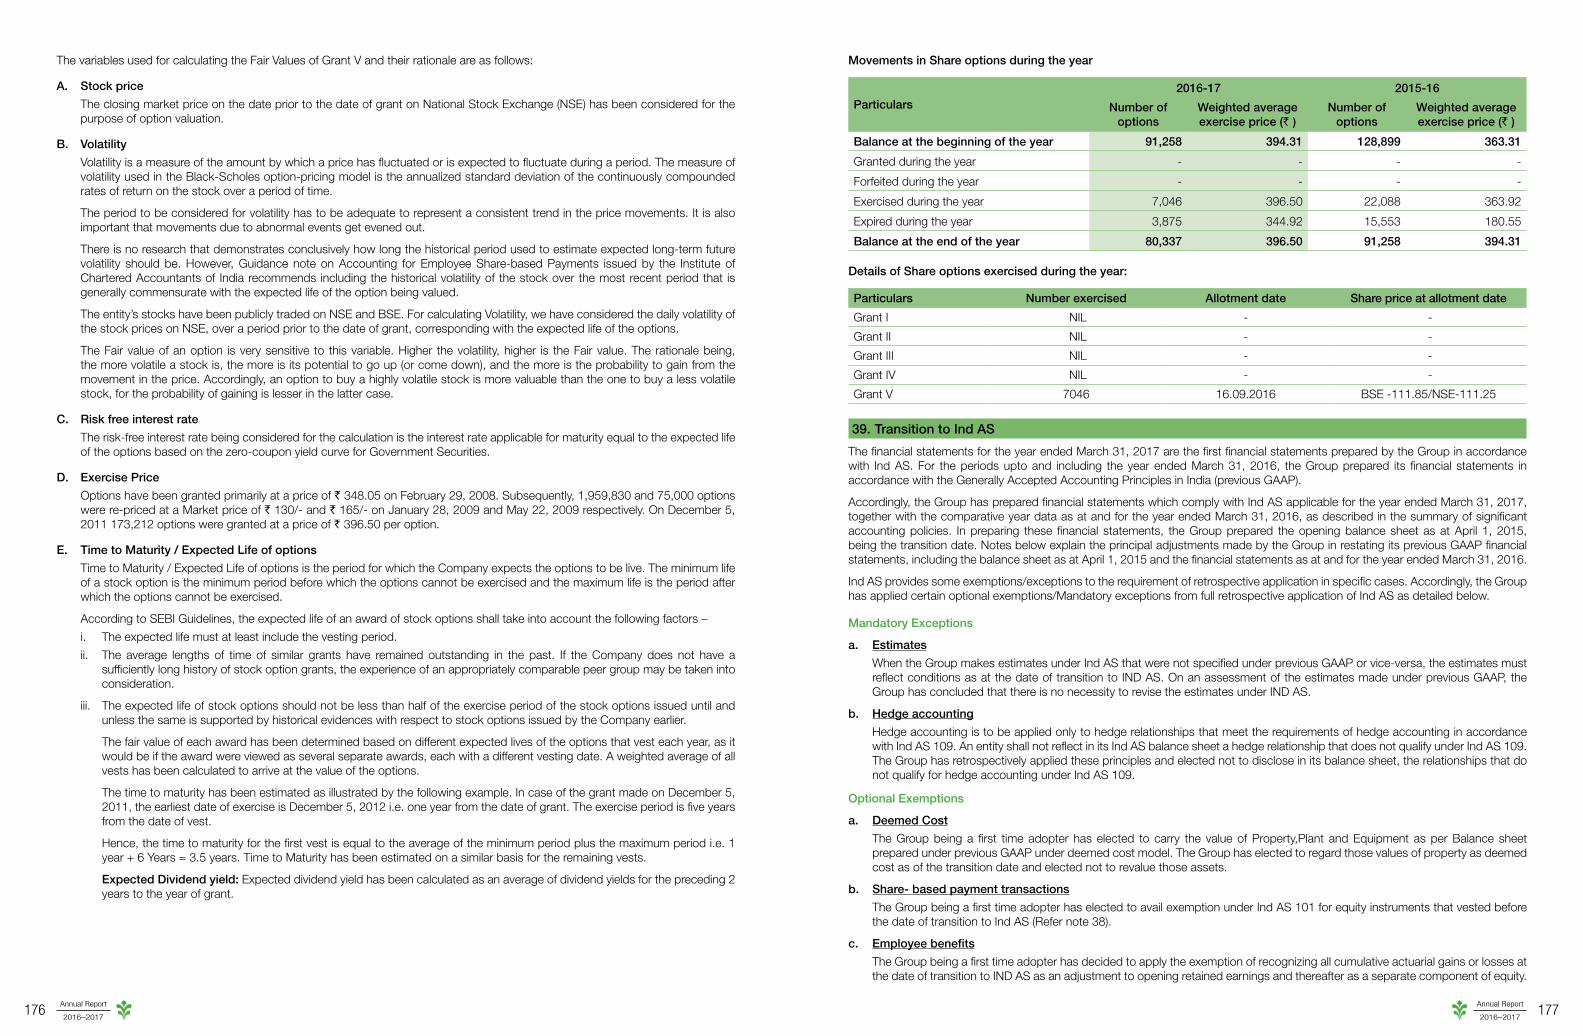
E. Option Movement during the year 2016-17
Sr.No. Particulars Numbers Wt. Avg Exercise price
1 Options outstanding at the beginning of the year 91,258 394.31
2 Number of options granted during the year - -
3 Options Forfeited / Surrendered during the year - -
4 Options Vested during the year - -
5 Options Exercised during the year 7,046 396.50
6 Options Lapsed during the year 3,875 344.92
7 Total number of shares arising as a result of exercise of options 35,230 396.50
8 Money realised by exercise of options (In ` ) 2,793,739.00 -
9 Options outstanding at the end of the year 80,337 396.50
10 Options exercisable at the end of the year 80,337 396.50
F. Weighted average exercise price of options granted during 2016-17 whose
during FY 2016-17(b) Exercise price is greater than market price
(c) Exercise price is less than market price
Weighted average fair value of options granted during 2016-17 whose
(a) Exercise price equals market price (` ) No options were Granted during FY 2016-17(b) Exercise price is greater than market price
(c) Exercise price is less than market price
G. Employee-wise details of options granted during the financial year 2016-17 to:
(i) Senior managerial personnel: No options were granted during FY 2016-17
(ii) Employees who were granted, during any one year, options amounting to 5% or more of the options granted during the year:
Nil
(iii) Identified employees who were granted option, during any one year equal to or exceeding 1% of the issued capital (excluding outstanding warrants and conversions) of the Company at the time of grant:
Nil
H. Method and Assumptions used to estimate the fair value of options granted during the year:
The fair value has been calculated using the Black Scholes Option Pricing model
Variables Date of Grant
1. Risk Free Interest Rate
No options were granted during FY 2016-17
2. Expected Life
3. Expected Volatility
4. Dividend Yield
5. Price of the underlying share in market at the time of the option grant. (` )
Details related to Employee Share Purchase Scheme, 2006 (ESPS)
I. The details on each ESPS under which allotments were made during the year 2016-17: No allotment was made.
II. The details regarding allotment made under each ESPS during the year 2016-17: No allotment was made.
Details related to Trust
I. General information on all schemes
S.No. Particulars Details
1. Name of the Trust Redington Employee Share Purchase Trust
2. Details of the Trustee(s) Mr. B. Arunachalam Mr. A. Athinarayanan Mr.A.S.Varadharajan
3. Amount of loan disbursed by Company / any company in the group, during the year Nil
4. Amount of loan outstanding (repayable to Company / any company in the group) as at the end of the year
Nil
5. Amount of loan, if any, taken from any other source for which Company / any company in the group has provided any security or guarantee
Nil
6. Any other contribution made to the Trust during the year Nil
II. Brief details of transactions in shares by the Trust
a) Number of shares held at the beginning of the year
Nil
b) Number of shares acquired during the year through (i) primary issuance (ii) secondary acquisition, also as a percentage of paid up equity capital as at the end of the previous financialyear,alongwithinformationonweightedaveragecostofacquisitionpershare;
c) Number of shares transferred to the employees / sold along with the purpose thereof
d) Number of shares held at the end of the year
Annual Report
2016–201733
Annual Report
2016–201732
III. Secondary acquisition of shares by the Trust
Number of shares As a percentage of paid-up equity capital as at the end of the year immediately preceding the year in which shareholders' approval
was obtained
Heldatthebeginningoftheyear Nil
Acquired during the year
Sold during the year
Transferred to the employees during the year
Heldattheendoftheyear
Auditor's Certificate
1. We,DeloitteHaskins&Sells,Chennai,CharteredAccountants(Firm'sRegistrationNumber:008072S),StatutoryAuditorsof Redington (India) Limited ("Company") have examined the audited books of account for the year ended March 31, 2017 and other relevant records maintained by the Company in the usual course of its business for the limited purpose of certifying that
A. The Employee Stock Option Scheme 2008 (ESOP Scheme) has been implemented in accordance with the Securities and Exchange Board of India (Share Based Employee Benefits) Regulations, 2014 and as per the "the Securities and Exchange Board of India (Share Based Employee Benefits) (Amendment) Regulation 2015" (collectively called "the Regulations") and in accordance with the Resolution passed in the Extra-ordinary General Meeting of the company held on February 27, 2008.
B. The Employee Share purchase Scheme 2006 (ESPS Scheme) has been implemented in accordance with the Regulations and in accordance with the Resolution passed in the Extra-ordinary General Meeting of the company held on July 01, 2006.
2. The Management of the Company is responsible for the maintenance of proper books of account and such other records as may be required. The Management of the Company is also responsible for compliance with the Regulations and the Resolution passed in the Extra-ordinary General Meeting of the company held on July 01, 2006 and February 27, 2008.
3. Our responsibility, for the purpose of this certificate, is limited to certifying that the Schemes have been implemented in accordance with the Regulations on the basis of the relevant books of account and other records maintained by the Company. We conducted our verification in accordance with the Guidance Note on Audit Reports and Certificates for Special Purposes issued by the Institute of Chartered Accountants of India ("ICAI") and the Standards on Auditing specified under section 143(10) of the Companies Act 2013. This Guidance Note requires that we comply with the ethical requirements of the code of Ethics issued by the ICAI. We have complied with the relevant applicable requirements of the StandardonQualityControl("SQC")1,QualityControlforFirmsthatPerformAuditsandReviewsofHistoricalFinancialInformation, and Other Assurance and Related Services Engagements.
4. On the basis of our verification as referred to in paragraph 3 above, and the information and explanations provided to us by the Management of the Company, and read together with para 1 above, we certify that the ESOP Scheme and ESPS Scheme have been implemented in accordance with the Regulations and in accordance with the resolutions of the company in the Extra-ordinary General Meeting.
5. This certificate is solely intended to meet the requirements of Regulation 13 of the Regulations and is not to be used, referred to or distributed for any other purpose without our prior written consent.
Place: Chennai Date: May 25, 2017
For Deloitte Haskins & SellsChartered Accountants
(Firm'sRegistrationNo.008072S)
M K Ananthanarayanan Partner
Membership No. 19521
Annexure C
Part A — Policy on appointment of Directors
For the Board of a Company to be effective and efficient, it should comprise of individuals who have professional qualifications and proven experience in their respective fields of specialization.
The Nomination and Remuneration committee evaluates the Directors and recommends the Board for their appointment / reappointment and ensures optimum composition of Board. While recommending appointment of an Individual as a Director on the Board, the committee has to review the following factors including the others:• DiversityoftheBoard• Qualificationandpositiveattributes• IndependenceofDirectors(inthecaseofIndependentDirectors)
Diversity of Board
Diversity in theBoardenhancesdiversityof ideas.Having this ideology inmind, theCommitteeshall take intoconsiderationvarious factors including the following to ensure Board Diversity:• OptimumcompositionofExecutiveDirectorsandNon-ExecutiveDirectorsontheBoard;• Professionalexperienceandexpertiseindifferentareasofspecialization;• Diversitycriteriaincluding,butnotlimitedtogender,age,ethnicity,race,religion,cultureandgeographicbackground;• Academicqualification,functionalexpertise,personalskillsandqualities
The ultimate decision is based on merit and contribution that the selected candidates brings to the Board.
Qualification and positive attributes
The committee may also assess whether they meet qualification criteria and the positive attributes set below:• Financially literate,whichmeanshe/shepossesstheability toreadandunderstandbasicfinancialstatements i.e.balance
sheet, Statement of Profit and Loss, and statement of cash flows.• Possesshighlevelsofpersonal,professionalintegrity• Haveappropriateknowledge/experienceabouttheindustryandtheCompany,orabilitytoacquirerequiredknowledgeand
Independence of Directors (only in the case of Independent Directors)
Any relationship between the Company and Directors other than in the normal course will affect the Independence of Directors in many ways. The Committee shall assure that the candidate proposed for the position of Independent Director meets the minimum criteria for Independence set out under Section 149 of the Companies Act, 2013. It shall also assess if the candidate would be able to meet the standards mentioned in the code for Independent Directors under the Companies Act, 2013.
Part B — Policy on Remuneration to Board of Directors, key managerial personnel and other employees
Introduction
With the view to ensure that the Company attracts, motivates and retains qualified industry professionals for the Board and Management in order to achieve its strategic goals this policy is designed to encourage behavior that is focused on long-term value creation, while adopting the highest standards of good corporate governance. The remuneration policy of the Company is aimed at rewarding performance, based on review of achievements on a regular basis and is in consonance with the existing industry practices.
This policy is now re-framed to ensure that the requirements of Section 178 of the Companies Act, 2013 is met and it intends to definegeneralguidelinesfortheCompany'spaytotheBoardofDirectors,KeymanagerialPersonnelandSeniorManagementand other employees.
Remuneration of Directors
The Board of Redington (India) Limited comprises of three categories of Directors viz., Executive Directors, Non Executive Directors and Non Executive Independent Directors.
Annual Report
2016–201735
Annual Report
2016–201734
The Remuneration to Executive and Non Executive Directors are governed by the provisions of Companies Act, 2013 and the rules framed thereunder and the notifications issued by the Ministry of Corporate Affairs from time to time.
Executive Directors
TheExecutiveDirector'scompensationcomprisesoftwobroadcomponents-FixedRemunerationandaperformance-linkedvariablecomponent.ThefixedremunerationisdeterminedbasedonmarketstandardsandtheCompany'sspecificneedsfromtime to time. The Board of Directors evaluate the fixed remuneration annually based on the results from the previous period and with due consideration to the trend within the market standards.
Variable Components of the Executive Directors includes performance linked bonus, which will be decided by the Board based ontheperformancecriteriawiththeobjectivetocreatelongtermshareholdervalue.
Executive Directors do not receive any sitting fees for attending the Board and Committee meetings.
Non Executive Directors
The Non Executive Directors including Independent Directors are paid commission upto one percent of the profits as may be decided by the Nomination and Remuneration committee and the Board of Directors. This profit is to be shared amongst the Non Executive Directors.
Non Executive Independent Directors are eligible for fixed amount of sitting fees for attending meeting of the Board of Directors and its committees as allowed under the Companies Act 2013.
Reimbursement of expenses
All expenses incurred by the Board of Directors for attending the meetings and events of the Company are reimbursed at actuals.
Remuneration to Key Managerial Personnel and Senior Management Personnel
It is to be ensured that Key Managerial Personnel (KMP) and Senior Management Personnel are paid as per the trend prevalent in the similar industry, nature and size of business. The level and components of remuneration is reasonable and sufficient to attract and retain the KMPs and Senior Management.
The remuneration for Key Managerial Personnel and Senior Management comprises of two broad components i.e Fixed and Variable.
The fixed component is paid on a monthly basis and the variable component is paid on the degree of their achieving "Key Result Areas". Executive Directors on yearly basis, on discussion with the KMP and senior management personnel, frame the Key Result Area(KRA).TheKRAisfixedwithanaimtoachievetheoverallobjectivesoftheCompany.
Remuneration to other employees
To have a strong bondage with the Company and long time association of the employees, the management while fixing remuneration to the employee ensures that it:
Inconsonancewiththiswellformulatedprinciple,thecompensationofemployeeshasbeenlinkedtoperformance.Howeverforcompensation above certain limits have variable component in the salary structure and are linked to Key Result Area (KRA) fixed to the employees.
Share/Stock based compensation
To attract and retain the talent, motivate employees to achieve business goals, reward performance with ownership and align employees interests with those of shareholders, the Company endeavours to create wealth to the Directors and employees by way of share/stock based compensation framed by the Company. Prior to and post listing of the shares of the Company on the stock exchanges, the Company, formulated various schemes to offer shares/stock based compensation to the Directors and employees.
Insurance coverage
To protect the interest of the Directors and employees while carrying out their duties which are exposed to various legal and regulatoryrequirements,theCompanyhasobtainedvariousinsurancepoliciessuchasDirectors&Officer'sLiabilityInsurance,etc.The Professional Indemnity policies are intended to protect the Directors and executives from legal action. The policy normally covers legal costs for defending civil suits.
Annexure D
Performance Evaluation Process & Criteria
Nomination and Remuneration Committee (the Committee) of Board of Directors appointed an external agency and availed their assistance in designing, implementing, analyzing and reporting of performance evaluation of the Board and its committees and the members thereof in compliance with the statutory requirements.
With their assistance, the Committee has formulated criteria and questionnaires to evaluate the performance of Board, its committees and Individual Directors including the Independent Directors.
The performance evaluation criteria is determined by the Committee taking into consideration the composition of the Board, role oftheDirectorsandcommitteesetc.ItalsoincludesBoard'sculture,stewardshipoftheBoard,participationandcontributionbythe individual Directors during Board Meetings , interface with the senior management team and independence of behaviour and judgementetc.
Based on the feedback received on the questionnaires, the performance of every Director was evaluated. Independent Directors at their separate meeting carried out evaluation on the performance of Non Independent Directors and Board as a whole. Chairman'sevaluationwascarriedoutbyentireBoardofDirectorsincludingtheIndependentDirectors.
Annexure E
PARTICULARS PURSUANT TO SECTION 197(12) AND THE RELEVANT RULES:
Note:
1. Total Remuneration entitled (Paid / Payable) for the entire Financial Year 2016-17 is considered.
2. The remuneration received by Directors from the Company is only considered.
A. TheratiooftheremunerationofeachDirectortothemedianremunerationoftheemployeesoftheCompanyforthefinancialyear;
Name of Director Designation Ratio to median remuneration
Prof J. Ramachandran Chairman, Non-Executive Independent Director 5.4Mr.V.S.Hariharan Non-Executive Independent Director 5.0Mr. Keith WF Bradley Non-Executive Independent Director 4.4Ms.SuchitraRajagopalan Non-Executive Independent Director 4.6Mr. N. Srinivasan# Non-Executive Director 0.1Mr. B. Ramaratnam* Non-Executive Director 4.5Mr. M. Raghunandan# Whole Time Director 3.0Mr.E.H.KasturiRangan* Whole Time Director 28.0
* Mr.B.RamaratnamandMr.E.H.KasturiRanganwereappointedontheBoardonMay24,2016.# Mr. M. Raghunandan and Mr. N. Srinivasan resigned from the Board w.e.f. May 24, 2016.
B. The percentage change in remuneration of each Director, Chief Executive Officer, Chief Financial Officer, Company Secretary or Manager, if any, in the financial year:
Name of Director Designation YOY %
Prof J. Ramachandran Chairman, Non-Executive Independent Director 12.6Mr.V.S.Hariharan Non-Executive Independent Director 11.9Mr. Keith WF Bradley Non-Executive Independent Director 7.2Ms.SuchitraRajagopalan Non-Executive Independent Director 5.3Mr. N. Srinivasan# Non-Executive Director -Mr. B. Ramaratnam* Non-Executive Director -Mr. M. Raghunandan# Whole-Time Director -Mr.E.H.KasturiRangan* Whole-Time Director -Mr. S. V. Krishnan Chief Financial Officer 15.0Mr. M. Muthukumarasamy Company Secretary 20.0
* Mr.B.RamaratnamandMr.E.H.KasturiRanganwereappointedtotheBoardonMay24,2016.Hence,theremunerationis not comparable.
Mr.RajShankar,ManagingDirector of theCompany is beingpaid remuneration from theoverseaswholly ownedsubsidiaryoftheCompany.Hencethesameisnotconsideredhere.
C. Percentage increase in median remuneration of employees in the financial year: 1.11%
D. Number of permanent employees on the rolls of Company as on March 31, 2017: 1,645
E. Average percentile increase already made in the salaries of employees other than the managerial personnel in the last financial yearanditscomparisonwiththepercentileincreaseinthemanagerialremunerationandjustificationthereofandpointoutifthereareanyexceptionalcircumstancesforincreaseinthemanagerialremuneration;
Average percentile increase made in the salaries of employees other than the managerial personnel in the last financial year I.e.2016-17was3.6%.Duringtheyear,Mr.EHKasturiRanganwasappointedasWholeTimeDirectorw.e.fMay24,2016on retirement of Mr. M Raghunandan. The increase in Managerial remuneration (Whole Time Director) for the Financial Year 2016-17 was 5.3%.
F. It is affirmed that the remuneration is as per the remuneration policy of the Company.
G. Particulars of Employees:
Details of Top 10 employees as on 31st March 2017 in terms of Remuneration drawn during FY 2016-17
Name of the Employee Mr. E.H. Kasturi Rangan
Mr. Parthasarthi Neogi
Mr. S.V. Krishnan Mr. Ramesh Natarajan
Mr. Clynton Almeida
Designation Whole-Time Director Joint Chief Operating Officer
Chief Financial Officer Senior President Chief Information Officer
Nature of employment Permanent Permanent Permanent Permanent Permanent
Qualification Master of Business Administration
Master of Business Administration
Bachelor of Science B.E, M Sc., EGMP Bachelor of Science
Experience with the Company
19 years 13 years 12.5 years 1.5 years 16.5 years
Date of Joining June 15, 1998 February 17, 2004 August 18, 2004 November 1, 2015 September 1, 2003
Age 51 51 40 36 59
Last Employment Divisional Manager - Sinar Mas (India)
Private Limited
Branch Manager - Tech Pacific India
Limited
Nebula Technologies Private Limited
Kanlife Asia, Singapore Oglivy & Mather
Name of the Employee Mr. J.K. Senapati Mr. Gautam Hukku Mr. R. Venkatesh Mr. Murtuza K Tambawala
Ms. Parvathi Jagannadhan
No. of shares as on 31st March 2017
Nil Nil Nil Nil Nil
Relation to Board of Directors
Nil Nil Nil Nil Nil
- Details of Employees who were employed throughout the financial year, and were in receipt of remuneration for that year which, in the aggregate, was not less than ` 1.02 Crore:
Name of the Employee Mr. E.H. Kasturi Rangan Mr. Parthasarthi Neogi Mr. Ramesh Natarajan
Designation Whole-Time Director Joint Chief Operating Officer Senior President
No. of shares as on 31st March 2017 10,050 207 Nil
Relation to Board of Directors Nil Nil Nil
Details of Employees who were employed for a part of the financial year, and were in receipt of remuneration for any part of that year, at a rate which, in the aggregate, was not less than ` 8.5 Lakhs per month:
Name of the Employee Mr A Francis Albert
Designation Vice President
Remuneration* ` 4,304,005
Nature of employment Permanent
Qualification Bachelor of Commerce
Experience with the Company 16 years
Date of Joining December 1, 2000
Age 46
Last Employment Assistant Manager Marketing —SSI Ltd
No. of shares as on 31st March 2017 Nil
Relation to Board of Directors Nil
* As per Income Tax Act, 1961 and includes Gratuity amount paid.
Annexure F
Report on Corporate Social Responsibility
1. Company's policy on CSR — An Overview
Every organization has the right to exist in the society. With this right, there comes a duty to give back to society a portion of what it receives from it. As a corporate citizen we receive various benefits from society and it is our co-extensive responsibility to pay back in return to the society.
Redington'sbusinessmantrais"Createvalue,profitswillfollow".Itbelievesthatcreationandmaximizationofvaluetostakeholdersis paramount. The Company is committed to improving the quality of life of the workforce and their families as well as of the local community and society at large. With the Companies Act, 2013 mandating Corporates to contribute towards social development andwelfare,Redingtoniscommittedtofulfillingthismandateandsupplementthegovernment'sefforts.
Annual Report
2016–201739
Annual Report
2016–201738
Redington'sCSRpolicyisaimedatcaringforthecommunityandfocusesitseffortsonpromotingemployability,skilldevelopment,health & wellness. We consider it our duty to build both social and environmental capital that transcends business interests to help build a better and more sustainable way of life for the less privileged members of our community. Your Company believes in making an impact towards creating a fair, humane and sustainable society.
We believe that growth needs to be both inclusive and equitable. We support the marginalized sections of society by providing opportunities to improve their quality of life. We offer skills training and employment opportunities for the differently abled. Redington has an ongoing vibrant CSR program operated through its Foundation.
3. Average net profit of the Company for last three financial years — ` 270.43 Crore
4. Prescribed CSR expenditure for the year 2016-17 (2%) — ` 5.41 Crore
5. Details of the CSR Spent during the financial year:
a) Total amount to be spent in the financial year : ` 5.41 Crore
b) Total amount spent in the financial year* : ` 5.40 Crore
c) Amount unspent# : ` 0.01 Crore
* Being the amount transferred during the year to Foundation for CSR @ Redington (Foundation), a trust registered under Income Tax Act, 1961.
# ` 0.01 Cr would be transferred to the Foundation during Q1 FY 18.
d) Manner in which the amount spent directly by the Foundation during the financial year:(` in Crore)
Sl. No.
CSR Project or activity identified Sector in which the project is covered
Projects or programs(1) Local area or other(2) Specify the state and district where
projects or programs were underetaken
Amount outlay (budget)
project or programs
wise
Amount spent on the
projects or programsOverheads
Cumulativeexpenditure
up to thereporting
period
Amount spent:Direct orthrough
implementingagency
1 READ Education
Various places across Tamil Nadu
4.15 3.92 5.08Through
Foundation for CSR @ Redington
2 EXCELLENCE Education 2.30 2.24 2.79
3 REACH Education 0.60 0.42 0.62
4 Immunization in Public areas Preventive Healthcare 0.10 0.03 0.03
5 Employability Skills Training Education - - 0.04Direct
6 Protection of Flora and Fauna Environment Ghaziabad - - 0.05
7 Common Expenses 0.35 0.21 0.41
TOTAL 7.50 6.82 9.02
Note: During FY 16, the Company transferred ` 4.95 Cr to the Foundation. Out of which the ` 2.86 Cr was spent and ` 2.09 Cr was not spent by the Foundation.
DuringFY17,inadditiontoFY17'sprescribedexpenditureof` 5.41 Cr, the foundation budgeted to spend the amount including thelastyear'sunspentamountof` 2.09 cr. The total expenditure budgeted by the Foundation was ` 7.50 Cr. Out of which the foundation spent ` 6.82 Cr and ` 0.68Crisremainingunspent.Thisisearmarkedprimarilyfortheexistingprojects.
TheCSRCommitteeconfirmsthattheimplementationandmonitoringofCSRPolicy,isincompliancewithCSRobjectivesandpolicy of the company.
Raj Shankar V. S. Hariharan Managing Director Chairman – CSR Committee
Annexure G
Secretarial Audit Report
For the Financial Year Ended on 31st March 2017
[Pursuant to Section 204(1) of the Companies Act, 2013 and RuleNo.9 of the Companies (Appointment and Remuneration of Managerial Personnel) Rules, 2014]
The Members of the Company Redington (India) Limited
I have conducted the Secretarial Audit of the compliance of applicable statutory provisions and the adherence to good corporate practices by REDINGTON (INDIA) LIMITED ("the Company"). The Secretarial Audit was conducted in a manner that provided me a reasonable basis for evaluating the corporate conducts / statutory compliances and expressing my opinion thereon.
BasedonmyverificationoftheCompany'sbooks,papers,minutebooks,formsandreturnsfiledandotherrecordsmaintainedby the Company and also the information provided by the Company, its officers, agents and authorized representatives during the conduct of Secretarial Audit, I hereby report that in my opinion, the Company has, during the audit period covering the financial year ended on 31st March 2017 complied with the statutory provisions listed hereunder and also that the Company has proper Board-processes and compliance-mechanism in place to the extent and in the manner reported hereinafter.
I have examined the books, papers, minute books, forms and returns filed and other records maintained by the Company for the financial year ended on 31st March 2017 according to the provisions of -
4. The Foreign Exchange Management Act, 1999 and the Rules and Regulations made there under to the extent applicable to FDI Regulations relating to downstream investments in Indian subsidiaries and Overseas Direct Investment (ODI).
a) The Securities and Exchange Board of India (Substantial Acquisition of Shares and Takeovers) Regulations, 2011
b) TheSecuritiesandExchangeBoardofIndia(ProhibitionofInsiderTrading)Regulations,2015;
c) The Securities and Exchange Board of India (Share based Employee Benefits) Regulations, 2014
d) The Securities and Exchange Board of India (Issue and Listing of Debt Securities) Regulations, 2008- Not applicable to the Company during the audit period
e) The Securities and Exchange Board of India (Registrars to an Issue and Share Transfer Agents) Regulations, 1993 - Not applicable to the Company during the audit period
f) The Securities and Exchange Board of India (Delisting of Equity Shares) Regulations, 2009 - Not applicable to the Company during the audit period
g) The Securities and Exchange Board of India (Buyback of Securities) Regulations, 1998 - Not applicable to the Company during the audit period
h) The Securities and Exchange Board of India (Listing Obligation and Disclosure Requirements) Regulations, 2015
6. There are no Sector Specific laws applicable to the company.
I have also examined compliance with applicable clauses of the following:
a) Secretarial Standards issued by the Institute of Company Secretaries of India and notified by the Ministry of Corporate Affairs.
7. During the period under review the company has complied with the provisions of the Acts, Rules, Regulations, Guidelines, Standards etc. mentioned above.
I further report that
The Board of Directors of the Company is duly constituted with proper balance of Executive Directors, Non-Executive Directors and Independent Directors. The changes in the composition of the Board that took place during the year were carried out in compliance with the provisions of the Act.
Adequate notice is given to all directors to schedule the Board Meetings, agenda and detailed notes on agenda were sent at least seven days in advance, except in one case wherein the shorter notice was consented by the Directors, and a system exists for seeking and obtaining further information and clarifications on the agenda items before the meeting and for meaningful participation at the meeting.
All decisions at Board Meeting and Committee Meetings are carried out unanimously as recorded in the minutes of the meetings of the Board of Directors or Committee of the Board, as the case may be.
I further report that there are adequate systems and processes in the Company commensurate with the size and operations of the Company to monitor and ensure compliance with all applicable laws, rules, regulations and guidelines.
I further report that during the audit period, the Board of Directors of the Company has approved the Merger of Cadensworth (India) Limited (a wholly owned subsidiary of the Company) with the Company.
Place: ChennaiDate: May 25, 2017
R. Bhuvana Practicing Company Secretary
Certificate of Practice No. 8161 Membership No. 22108
This Report is to be read with our letter of even date which is annexed as Annexure 1 and Forms an integral part of this report.
Annexure 1
The Members of the Company Redington (India) Limited
My report of even date is to be read along with this letter.
1. Maintenance of Secretarial record is the responsibility of the management of the company. My responsibility is to express an opinion on these secretarial records based on my audit.
2. I have followed the audit practices and processes as were appropriate to obtain reasonable assurance about the correctness of the contents of the Secretarial records. The verification was done on test basis to ensure that correct facts are reflected in Secretarial records. I believe that the processes and practices, I followed provide a reasonable basis for my opinion.
3. I have not verified the correctness and appropriateness of financial records and Books of Accounts of the company.
4. Where ever required, I have obtained the Management representation about the compliance of laws, rules and regulations and happening of events etc.
5. The compliance of the provisions of Corporate and other applicable laws, rules, regulations, standards is the responsibility of management. My examination was limited to the verification of procedures on test basis.
6. The Secretarial Audit report is neither an assurance as to the future viability of the company nor of the efficacy or effectiveness with which the management has conducted the affairs of the company.
Place: ChennaiDate: May 25, 2017
R. Bhuvana Practicing Company Secretary
Certificate of Practice No. 8161 Membership No. 22108
i) In case the Protected Disclosure is proved, accept the findings of the Whistle Officer/Committee and take such DisciplinaryActionashemaythinkfitandtakepreventivemeasurestoavoidreoccurrenceofthematter;or
iii) Depending upon the seriousness of the matter, Ombudsperson may refer the matter to the Committee of Directors with proposed disciplinary action/counter measures
The Company has not entered into any contracts/arrangements/transactions with its related parties which are not in ordinary courseofbusinessoratarm'slengthduringFY2016-17.
a) Name(s) of the related party and nature of relationship: Not Applicable
b) Nature of contracts/arrangements/transactions: Not Applicable
c) Duration of the contracts/ arrangements/transactions: Not Applicable
d) Salient terms of the contracts or arrangements or transactions including the value, if any: Not Applicable
e) Justification for entering into such contracts or arrangements or transactions: Not Applicable
f) Date(s) of approval by the Board: Not Applicable
g) Amount paid as advances, if any: Not Applicable
h) Date on which the special resolution was passed in general meeting as required under first proviso to section 188: Not Applicable
a) Name(s) of the related party and nature of relationship: Not Applicable
b) Nature of contracts / arrangements / transactions: Not Applicable
c) Duration of the contracts / arrangements / transactions: Not Applicable
d) Salient terms of the contracts or arrangements or transactions including the value, if any: Not Applicable
e) Date(s) of approval by the Board, if any: Not Applicable
f) Amount paid as advances, if any: NoneNote: The above disclosures on material transactions are based on the principle and fact that transactions with wholly owned subsidiaries are exempt for purpose of section 188(1) of the Act and no material transactions entered into with associate companies.
On behalf of the Board of Directors
Place : Chennai J RamachandranDate : May 25, 2017 Chairman
Annual Report
2016–201753
Annual Report
2016–201752
Business Responsibility ReportSection A: General Information about the Company
1. Corporate Identity Number (CIN) of the Company L52599TN1961PLC028758
2. Name of the Company Redington (India) Limited
3. Registered address SPLGuindyHouse,95,MountRoad Chennai, TN 600032 IN
7. Sector(s) that the Company is engaged in (industrial activity code-wise)
Wholesale of machinery, equipment and supplies
465 as per NIC 2008
8. List three key products/services that the Company manufactures/provides (as in balance sheet)
Whole sale distribution of Information Products
9. Total number of locations where business activity is undertaken by the Company:
Number of International Locations (Providedetailsofmajor5)
24Countries.Major5beingUAE,Turkey,SaudiArabia,Singapore and Kenya.
Number of National Locations 48 Sales Offices, 40 Service Centres and 192 Warehouses
10. Markets served by the Company India, Middle East, Turkey, Commonwealth of Independent States (CIS) and South Asia.
Section B: Financial Details of the Company (Standalone Basis) (` in lakhs)
1. Paid up Capital 7,996.97
2. Total Turnover 15,43,179.97
3. Total profit after taxes 20,168.47
4. Total Spending on Corporate Social Responsibility (CSR) as percentage of profit after tax (%) 2.68
5. List of activities in which expenditure in 4 above has been incurred:
S.No. Sector in which the project is covered CSR Project or activity identified
1 Education Employability Skill training, Vocational Training to differently-abled, Sponsorship to educational institutions and needy students
2 PreventiveHealthcare Immunization in public areas
The details of expenditure can be accessed in the CSR report which is annexed to the Boards Report.
Section C: Other Details
1. Does the Company have any Subsidiary Company/ Companies?
The Company has Fifty Seven subsidiaries as on 31st March 2017. Out of these, 3 are wholly owned subsidiaries in India namely Cadensworth (India) Limited, ProConnect Supply Chain Solutions Limited and Ensure Support Services (India) Limited.
2. Do the Subsidiary Company/ Companies participate in the BR Initiatives of the parent company? If yes, then indicate the number of such Subsidiary Company/ Companies
TheCompany'stwoDirectIndianSubsidiariesnamelyviz.,ProConnect Supply Chain Solutions Limited and Ensure Support Services (India) Limited have adopted the applicable BR principles as prescribed by SEBI. The foreign subsidiaries comply with the requirements of their respective countries.
3. Do any other entity/entities (e.g. suppliers, distributors etc.) that the Company does business with, participate in the BR initiatives of the Company? If yes, then indicate the percentage of such entity/entities? [Less than 30%, 30-60%, More than 60%]
The Company has long lasting relationships with its suppliers & dealers who support the BR initiatives of the Company. Our business partners take part in their independent BR initiatives.
Annexure K
Policy on Dividend Distribution
Purpose
TheCompany'sdividendpolicyistoincreasetheshareholders'returnbywayofdeclaringincreaseddividends,consideringtwoprimary factors i.e Earnings and the financial needs of the Company
This policy is drafted in Compliance with the provisions of SEBI (Listing Obligations and Disclosure Requirements) Regulations, 2015 ("Listing Regulations"). The parameters set out in the policy are applicable for declaration of both Interim Dividend and Final Dividend.
Process for declaration and distribution of Dividend
The Board of Directors recommend/declare dividend as per the provisions of Companies Act, 2013. Interim Dividend will be paid on declaration of the same by the Board and the final dividend will be paid on the approval of shareholders at the Annual General Meeting. The company pays the dividend within 30 days of approval of shareholders / declaration by the Board.
Parameters to be considered for declaration of Dividend
1. Financial Parameters
a) Quantum of Standalone and Consolidated Net Profits
b) An Acceptable debt level and debt to equity ratio
c) Adequate Cash flow
2. Internal and external factors
a) Budget and forecast of future - Plans for any fund requirements eg., investment in new business verticals, expansion of business to new areas, Mergers & Acquisitions and downstream investment etc.
b) Liquidity Position - If the Company has negative cash flow on year to date basis then the Company may choose to declare dividend or not.
c) Business and Regulatory contingencies - If the Company expects any liabilities including statutory liabilities, non performance of business verticals, then company need to save cash instead of paying out as dividend.
The Company may utilize its Retained earnings after paying dividends for building strong reserves for future expansion plans and for contingencies.
The Company has only a single class of shares (Equity) and this policy shall be applicable only in this respect.
ThisPolicyissubjecttoregulationssuchastheCompaniesAct,2013,theSEBI(LODR)Regulations,2015andotherprovisionsthat govern the declaration and distribution of dividend applicable to the Company and shall stand amended in line with any regulatory amendments, modifications as the case maybe.
The Company, from time to time will declare the changes and rationale for changes on its website and the Annual Report as and when applicable.
2. Principle-wise (as per NVGs) BR Policy/policies (Reply in Y/N)
Principle 1 Businesses should conduct and govern themselves with Ethics, Transparency and Accountability
Principle 2 Businesses should provide goods and services that are safe and contribute to sustainability throughout their life cycle
Principle 3 Businesses should promote the well being of all employees
Principle 4 Businesses should respect the interests of and be responsive towards all stakeholders, especially those who are disadvantaged, vulnerable and marginalized
Principle 5 Businesses should respect and promote human rights
Principle 6 Businesses should respect, protect and make efforts to restore the environment
Principle 7 Businesses, when engaged in influencing public and regulatory policy, should do so in a responsible manner
Principle 8 Businesses should support inclusive growth and equitable development
Principle 9 Businesses should engage with and provide value to their customers and consumers in a responsible manner
(a) Questions P 1
P 2
P 3
P 4
P 5
P 6
P 7
P 8
P 9
1. Do you have a policy/ policies for Y Y Y Y Y Y Y Y Y
2. Hasthepolicybeingformulatedinconsultationwiththerelevantstakeholders? Y Y Y Y Y Y Y Y Y
3. Does the policy conform to any national / international standards? If yes, specify? (50 words)
Y Y Y Y Y Y Y Y Y
ThespiritandintentoftheCompany'sBR policies conform to the National Voluntary Guidelines issued by the Ministry of Corporate Affairs
8. Does the company have in-house structure to implement the policy/ policies? Y Y Y Y Y Y Y Y Y
9. Does the Company have a grievance redressal mechanism related to the policy/ policiestoaddressstakeholders'grievancesrelatedtothepolicy/policies?2
Y Y Y Y Y Y Y Y Y
10. Hasthecompanycarriedoutindependentaudit/evaluationoftheworkingofthispolicy by an internal or external agency?
Y Y Y Y Y Y Y Y Y
1 The policies are communicated to the internal stakeholders. The policies are available in the website of the Company. The Company would endeavor to communicate to other stakeholders through formal communication channels.
2 The Company has an email and helpline facility for its external stakeholders to raise ethical issues and grievances;Email: [email protected];Helpline:1800-300-12333.
3. Governance related to BR
(a) Indicate the frequency with which the Board of Directors, Committee of the Board or CEO to assess the BR performance of the Company. Within 3 months, 3-6 months, Annually, More than 1 year
The Company has formed an In-house team to oversee the implementation of the BR policy and its performance on a quarterly basis.
In addition to the above, the Audit Committee of the Board of Directors is responsible for assessing the BR performance of the Company. The assessment is carried out on an annual basis by the Audit Committee.
(b) Does the Company publish a BR or a Sustainability Report? What is the hyperlink for viewing this report? How frequently it is published?
The Company is not mandated to publish a Sustainability Report.
Section E: Principle-Wise Performance
Principle 1—Businesses should conduct and govern themselves with Ethics, Transparency and
Accountability
1. Does the policy relating to ethics, bribery and corruption cover only the company? Yes/ No. Does it extend to the Group/Joint Ventures/ Suppliers/Contractors/NGOs /Others?
No. The Policy relating to Ethics, Transparency and Accountability covers the employees of the Company and its Indian subsidiary companies.
The policy on Code of Conduct prescribed by the Company applies to all its employees including the Directors of the Company.
These policies cover issues related to ethics, bribery and corruption. It covers dealings with suppliers, customers and other business partners and stakeholders.
The Company encourages parties associated with its value chain like vendors, suppliers, contractors, etc. to follow the principles envisaged in the policy.
2. How many stakeholder complaints have been received in the past financial year and what percentage was satisfactorily resolved by the management? If so, provide details thereof, in about 50 words or so.
During the Financial Year 2016-17, the Company had received one complaint from an investor relating to non- uploading ofsubsidiaries'financials in thewebsiteof theCompanyandthesamewasresolved immediately.Therearenopendingcomplaints at the end of the financial year.
The Company has different mechanisms for receiving and dealing with complaints from other stakeholders like Customers, Employees, Suppliers, etc.
Stakeholder Complaints
No. of complaints received during the Year
No. Complaints resolved during the year % of complaints resolved
Investor Complaints 1 1 100%
Principle 2—Businesses should provide goods and services that are safe and contribute to sustainability
throughout their life cycle
1. List up to 3 of your products or services whose design has incorporated social or environmental concerns, risks and/or opportunities.
The Company along with its subsidiaries is engaged in the business of wholesale distribution of Technology products and offers warehousing and logistics services besides supply chain solutions and after sales service.
The Company does not distribute any hazardous products which are harmful to the environment and the products distributed areROHS(Reductionofhazardoussubstances)compliant.
While the products being distributed by the Company are not hazardous to the environment or society, the waste generated thereof,ifnotproperlydisposedorrecycled,maydamagetheenvironmenttotheextentitisexposed.Hence,theCompanyhas extended liability to channelize the e-waste generated through authorized recyclers.
A subsidiary company of the Company, Ensure Support Services (India) Limited (Ensure) is into the business of providing service support for IT products. Ensure works on the principle of Reduce, Re-use and Re-cycle electronic products, making optimum use of electronic parts.
2. For each such product, provide the following details in respect of resource use (energy, water, raw material etc.) per unit of product (optional):
(a) Reduction during sourcing/production/ distribution achieved since the previous year throughout the value chain?
The Company and its subsidiaries are not into the activity of manufacturing or production, hence the scope of usage of natural resources like water and electricity are limited. The following measures are taken to further improve the usage efficiency of the said resources at the corporate office at Chennai, the largest corporate establishment of the organization.
1. Rain water harvesting system is installed. Further, paved blocks have been laid to enable water to seep through the ground so that ground water reserves are preserved.
2. Scope of usage of water is limited to consumption and usage by the employees. Wastage in this regard is kept to the minimum by installing automatic sensors, which enable stopping water supply when not in use.
3. Harmonicfiltersareusedforchannelizingpowertoelectronicappliancesfromthetransformers.Duetothesepowerfilters, electronic appliances receive power only to the extent required for their functioning. This drastically reduces wastage of electricity.
The Company makes use of the specialized warehousing and logistics services of its Wholly Owned subsidiary ProConnect Supply Chain Solutions Limited (ProConnect) for transportation of goods. This has resulted in optimum usage of resources through planned transportation and route consolidation.
ProConnect, which provides Warehousing and Logistics Solutions for the Company and other Third party clients took the followingmeasuresinordertoefficientlymakeuseofitsresources;
1. Warehouse is designed in such a way that it utilizes natural light instead of artificial lighting resulting in conservation of energy.
2. Instead of diesel Fork lift, battery operated Material handling equipment are used which reduces carbon emission, thereby reducing pollution.
3. Rain water harvesting systems and water treatment plants have been installed in its warehouses resulting in conservation of water
(b) Reduction during usage by consumers (energy, water) has been achieved since the previous year?
The Company is engaged in distribution of Solar panels, as part of its new business initiatives. This would benefit the consumers to save the non-renewable energy sources by utilizing clean and pure energy from the sun. Installing solar panels would help combat greenhouse gas emissions and reduce our collective dependence on fossil fuels.
3. Does the company have procedures in place for sustainable sourcing (including transportation)?
(a) If yes, what percentage of your inputs was sourced sustainably? Also, provide details thereof, in about 50 words or so.
The Company is in the distribution business and is not involved in production/manufacturing activities, hence it is not required to source any raw materials.
The Company has entered into agreement with its vendors for its continuing business. The Company is the preferred partner for its Vendors.
4. Has the company taken any steps to procure goods and services from local & small producers, including communities surrounding their place of work?
Yes. The Company procures the resources for its day to day operations including stationery items, diesel and water from the local & small producers.
The Company's subsidiary, ProConnectmakes use of local resources for its packing and logistics operations. Further,ProConnect procures packing materials from local and small producers.
(a) If yes, what steps have been taken to improve their capacity and capability of local and small vendors?
Local and Small vendors are required to meet the standards set by the company thereby improving their capabilities and efficiencies. The Company has been witnessing the growth of various stakeholders associated with it along with the growth of the Company.
5. Does the company have a mechanism to recycle products and waste? If yes what is the percentage of recycling of products and waste (separately as <5%, 5-10%, >10%). Also, provide details thereof, in about 50 words or so.
The Company is in the distribution business and is not involved in production/manufacturing activities, hence it is not required to source any raw materials.
The Company has a detailed mechanism to manage, handle and safely dispose E-waste. It has set up collection centers across the country for facilitating customers to deposit E-waste. The Company further arranges logistics services for safe transportation of the same. The Company has engaged authorised recyclers for proper disposal of such Electronic waste. Management of such E-waste is aligned to the Governmental norms.
Principle 3—Businesses should promote the wellbeing of all employees throughout their life cycle
1. Please indicate the Total number of employees.
Total number of employees of the Company as on 31st March 2017 is 1645.
2. Please indicate the Total number of employees hired on temporary/contractual/casual basis.
106 employees.
3. Please indicate the Number of permanent women employees.
Total number of women employees of the Company as on 31st March 2017 is 403.
4. Please indicate the Number of permanent employees with disabilities.
5. Do you have an employee association that is recognized by the management?
The Company respects right to freedom of association, participation, collective bargaining and provides access to appropriate grievance redressal mechanism.
6. What percentage of your permanent employees is members of this recognized employee association?
Not Applicable. Presently, the Company does not have any employee association.
7. Please indicate the Number of complaints relating to child labour, forced labour, involuntary labour, sexual harassment in the last financial year and pending, as on the end of the financial year.
The Company has always advocated a business environment that favours the concept of equal employment opportunities for all, without any discrimination with respect to caste, creed, gender, race, religion, disability or sexual orientation. It provides a workplace environment that is safe, hygienic, humane and which upholds the dignity of its employees. We focus to make Redington the favoured employer in the marketplace.
Child, forced and involuntary labour is prohibited in theworkplace as stated in theCompany'sCode of Conduct. TheCompany has adopted a policy on prevention, prohibition and redressal of sexual harassment at workplace in line with the provisionsoftheSexualHarassmentofWomenatWorkplace(Prevention,ProhibitionandRedressal)Act,2013andtheRulesthereunder.
The Company did not receive any complaints relating to child labour, forced labour, involuntary labour or sexual harassment from the employees of the Company during the last financial year.
No. CategoryNo of complaints filed during
the financial yearNo of complaints pending
as on end of the financial year
1 Child labour/forced labour/involuntary labour NIL NIL
2 Sexual harassment NIL NIL
3 Discriminatory employment NIL NIL
8. What percentage of your under mentioned employees were given safety & skill up-gradation training in the last year?
(a) Permanent Employees - 13.4% (approx)
(220 out of the total of 721 sales professionals (31%) have been provided training.)
The Company organizes various training sessions in-house on a regular basis and also sponsors its employees to attend training sessions organized by external professional bodies to facilitate up-gradation of the skills of its employees.
Annual Report
2016–201759
Annual Report
2016–201758
At the Company's Subsidiary Ensure, Company sponsored technical certification programmes are organized for skillupgradation.SeminarsonHarassmentarearrangedforpromotingsafetyandwell-beingofemployees.
As the warehouses of the Company are managed by ProConnect, safety drills and training with regard to warehouse operations are provided periodically. Location-wise drills are also organized.
Principle 4—Businesses should respect the interests of, and be responsive towards all stakeholders,
especially those who are disadvantaged, vulnerable and marginalized
1. Has the company mapped its internal and external stakeholders? Yes/No.
Yes.
Following are the stakeholders identified by the company:
• Employees
• Investors/Shareholders
• Vendors
• Customers
• Government
• LocalCommunities
• Banks
The Company engages with the identified stakeholders on a constant basis through various modes.
Employee TownHallMeeting Mailers Events during special occasions Satisfaction surveys Intranet
Local Community (Through CSR foundation) Local Community meetings Mailers / Brochures Meeting with Associations / NGOs
Bankers Periodical Meetings Periodical reports
2. Out of the above, has the company identified the disadvantaged, vulnerable & marginalized stakeholders.
All the stakeholders of the Company in its business value chain are equally significant and no one is considered as disadvantaged, vulnerable and marginalized.
Under the Company's Corporate Social Responsibility initiatives, disadvantaged, vulnerable & marginalized sections ofsociety are identified as beneficiaries and activities are undertaken to uplift them.
3. Are there any special initiatives taken by the company to engage with the disadvantaged, vulnerable and marginalized stakeholders. If so, provide details thereof, in about 50 words or so.
The Company through its CSR trust, Foundation for CSR @ Redington, undertakes and has rolled out several programmes andprojectsdesignedtobenefitmarginalizedsectionsofthesocietysuchas
The initiatives taken by the Company includes enhancing employability skills, vocational training and developing entrepreneurship skills etc.,
The Foundation also undertakes livelihood support programmes concentrating on developing entrepreneurship skills to women and the physically and mentally challenged thus helping them to become independent and gain a steady source of income.
Principle 5—Businesses should respect and promote human rights
1. Does the policy of the company on human rights cover only the company or extend to the Group/Joint Ventures/Suppliers/Contractors/NGOs/Others?
The policy of the company on human rights is applicable to the Company, its subsidiaries, vendors and channel partners.
TheCompanyremainscommittedtorespectandprotecthumanrights.TheCompany'scodeofconductandthehumanresource practices cover most of these aspects. The Company does not hire child labour, forced labour or involuntary labour. The Company never discriminates between its employees.
2. How many stakeholder complaints have been received in the past financial year and what percent was satisfactorily resolved by the management?
The Company did not receive any complaints in the area of human right violation from its external and internal stakeholders.
Principle 6—Business should respect, protect, and make efforts to restore the environment
1. Does the policy related to Principle 6 cover only the company or extends to the Group/Joint Ventures/Suppliers/Contractors/NGOs/others?
The policy on environment covers the Company and its subsidiaries.
2. Does the company have strategies/ initiatives to address global environmental issues such as climate change, global warming, etc.? Yes/No. If yes, please give hyperlink for webpage etc.?
As stated earlier in this report, the Company and its subsidiaries are not involved in manufacture and do not source any raw materials. Being only a distributor of electronic products, E-waste arising out of such products, is the only manner by which the operations of the Company impact the environment.
The Company has taken cognizance of this environmental impact and has made arrangements for ensuring safe handling of such waste as stated earlier.
3. Does the company identify and assess potential environmental risks? Yes/No.
Yes, the Company has identified the risks involved in the generation of e-waste by the electronic products distributed by the Company as a potential environmental risk and the same is mitigated by managing and disposing such waste in an environmental friendly manner.
The Company has a mechanism for taking back the e-waste generated from such electronic products. The Company has made arrangements at several collection centers across India to facilitate customers to dispose the e-waste in an environmental friendly manner.
4. Does the company have any project related to Clean Development Mechanism? If so, provide details thereof, in about 50 words or so. Also, if yes, whether any environmental compliance report is filed?
The operations of the Company involve low energy consumption. Adequate measures have been taken to conserve energy by way of optimizing usage of power and virtualization of the Data Centre.
5. Has the company undertaken any other initiatives on - clean technology, energy efficiency, renewable energy, etc.? Yes/No. If yes, please give hyperlink for web page etc.
The Company continues to use the latest technologies for improving the quality of services it offers. Some of the technology adoption and absorption like cloud technology, virtualization and mobile based technologies has resulted in better operational efficiencies.
Annual Report
2016–201761
Annual Report
2016–201760
6. Are the Emissions/Waste generated by the company within the permissible limits given by CPCB/SPCB for the financial year being reported?
Not Applicable. The company does not emit/generate any effluents/pollutants.
7. Number of show cause/ legal notices received from CPCB/SPCB which are pending (i.e. not resolved to satisfaction) as on end of Financial Year.
Nil.
Principle 7—Businesses, when engaged in influencing public and regulatory policy, should do so in a
responsible manner
1. Is your Company a member of any trade and chamber or association? If yes, Name only those major ones that your business deals with:
The Company and its subsidiaries are associated with industry bodies and associations like Technology Distributors Association of India (TDAI), Madras Chamber of Commerce and Industry and EFSI (Employee Federation of Southern India).
2. Have you advocated/lobbied through above associations for the advancement or improvement of public good? Yes/No; if yes specify the broad areas ( drop box: Governance and Administration, Economic Reforms, Inclusive Development Policies, Energy security, Water, Food Security, Sustainable Business Principles, Others)
The Company participated in the consultations on E Waste Management, Corporate Social Responsibility, Tax Legislations etc.
Principle 8—Businesses should support inclusive growth and equitable development
1. Does the company have specified programmes/initiatives/projects in pursuit of the policy related to Principle 8? If yes details thereof.
Yes.
The Company has a specified agenda framed to implement various corporate social responsibility activities towards the betterment of society. The activities are implemented through Foundation for CSR @ Redington as part of social activities under Corporate Social Responsibility. Ensure Support Services (India) Limited, ProConnect Supply Chain Solutions Limited, and Cadensworth (India) Limited, the wholly owned Indian subsidiaries of the Company are also involved in the social initiatives by way of contributing funds to the Foundation for carrying out activities prescribed under their CSR policy. In addition to the above, employees of the Company and its subsidiaries, participate actively in the CSR initiatives of the Company.
3. Have you done any impact assessment of your initiative?
The impact assessment of the initiatives is carried out by an In-house Team of the foundation and also reviewed by the Corporate Social Responsibility Committee of the Board of Directors.
5. Have you taken steps to ensure that this community development initiative is successfully adopted by the community? Please explain in 50 words, or so.
Community development programmes of the Company are focused to create economic well being of people in rural areas by providingbetterinfrastructuralfacilities,amenities,sustainablemanagementetc.throughprojectssuchasRuralDevelopmentProgramme.
"Rural Development"oneoftheprojectsidentifiedbytheFoundationtolayandrepairlinkroadlocatedatKuruthanameduvillage where the Company is carrying out warehousing & logistics services. This would help the people in and around KuruthanameduvillagetoconnecteasilytotheNationalHighwaysthroughthelinkroad.
Principle 9—Businesses should engage with and provide value to their customers and consumers in a
responsible manner
1. What percentage of customer complaints/consumer cases are pending as on the end of financial year?
39%. These are being addressed.
2. Does the company display product information on the product label, over and above what is mandated as per local laws? Yes/No/N.A./Remarks (additional information).
The goods procured locally do not require any product labeling by the Company, whereas the goods imported will contain the label affixed by the company with requisite information as required under Packaged Commodities Rules 2011.
3. Is there any case filed by any stakeholder against the company regarding unfair trade practices, irresponsible advertising and/or anti-competitive behaviour during the last five years and pending as on end of financial year? If so, provide details thereof, in about 50 words or so.
No such instances.
4. Did your Company carry out any consumer survey/ consumer satisfaction trends?
The Company regularly meets its channel partners and vendors to enhance the service of its offerings.
TheCompanyisthesoledistributorofHPIndigoPrintersandeveryyearHPconductsaTotalCustomerExperienceSurvey(TCE)onHPIndigoCustomers.ThesurveyisbeingconductedthroughanonlinelinksentdirectlybyHP.Itincludesquestionson the supplies and support on various parameters including back office support. Redington being the exclusive Service Provider facilitates the participation of the customers in the survey.
Ensure Support Services (India) Limited, subsidiary of the Company that directly interacts with customers has a formalized mechanism for tracking customer satisfaction/grievances called "Net Performance Score" (NPS). Based on the scores of NPS for the financial year 2016-17, Ensure has 85% happy customers, and 7% satisfied customers. Every customer who availed service is sent the survey request and the feedback is taken into consideration for obtaining the score, through automated system. Ensure constantly strives to better the scores.
Report on Corporate Governance1. Company's Philosophy on the Code of Corporate Governance
Redington (India) Limited ("Redington / Company") believes that effective Corporate governance is the fulcrum upon which organizational performance revolves. In its abiding commitment to adopt and follow the best practices of governance, your Company has been proactive to the changes introduced by Statutory Regulations for promoting a responsive and responsible business culture. The board and management of Redington recognize that well-defined corporate governance processes are crucial in enhancing corporate accountability and long-term sustainability, and are committed to high standards of governance topreserveandmaximizevaluetoallstakeholders.Redington'scorestrength, itsEmployees,have imbibedgoodCorporateGovernance practices and are instrumental in implementing and monitoring the systems, policies, and processes that underpin effective and good corporate governance.
ThisreportsetsouttheCompany'scorporategovernanceprocessesandactivitiesforthefinancialyear2016-17withreferenceto the Companies Act, 2013 and SEBI (Listing Obligations and Disclosure Requirement) Regulations, 2015.
2. Board of Directors
The Board of Directors believe that good corporate governance is not an end in itself, but a means to an end. It is more of a moving benchmark where there is always scope for improvement. The Company does not consider Corporate Governance as a separate pillar concerned only with Compliance, but a more integrated way of running the business effectively and efficiently. Your Company is committed to creating value for all stakeholders without compromising on ethical principles.
The Board has gone beyond basic compliance and has provided strategic counsel to the Company. They were the sentinels of good governance, thereby achieving a proper balance between performance and conformance.
Being a company, which operates in multiple geographies, it is necessary to have a Strong Board which should implement a versatile board governance strategy. The Composition of your board reflects versatility and a broad knowledge base.
The Nomination and Remuneration Committee is entrusted with the responsibility of screening and selection process of new directors. The Committee has developed the criteria for appointment of Independent Directors, Non-Executive Directors and Executive Directors in compliance with the Companies Act, 2013 and SEBI (LODR) Regulations, 2015. A detailed policy on the appointmentofDirectorsisenclosedaspartofBoard'sReport.(ReferPartA-AnnexureC).TheChairmanoftheCommitteemakes recommendation to the Board on the induction of new Directors. The Committee is also responsible for implementing the succession policy and also for monitoring orderly succession of Board and Senior Management.
Out of the total strength of ten Directors as on March 31, 2017, four Directors are Independent, four directors are Non-Executive and two Directors are Executive. The Chairman of the Board is a Non-Executive Independent Director. There are no inter se relationships between the Directors.
The calendar for the Board Meetings is decided in consultation with the Board and the schedule of such meetings is communicated to all Directors well in advance. Though the dates of the Board meeting are circulated in advance, the directors of the Company are residing at various parts of the world and it may not be possible for each one of them to be physically present. To enable all the directors to participate in the Board meetings, the Company offers video conferencing facility to enable their participation. The agenda for Board Meetings include all matters as required to be placed under SEBI (Listing Obligations and Disclosure Requirements) Regulations, 2015 and that of the Companies Act, 2013. The agenda is generally circulated seven clear days prior to the date of the Meetings and includes detailed notes on the items to be discussed to enable the Directors to take informed decisions. At each Board meeting, the Board reviews the action taken on the approvals given / decisions taken at the earlier board meeting. Apart from the detailed business information shared to the Board at its meeting, the management also shares the information on material events, if any, on immediate basis to the Board of Directors
During the Financial Year 2016-2017, five (5) Board Meetings were held on May 24, 2016, July 28, 2016, October 27, 2016, February 2, 2017 and February 3, 2017. The maximum time gap between any two meetings was less than 120 days. The necessary quorum was present throughout all the meetings. Two separate meetings of the independent directors of the Company was held on May 24, 2016 and February 1, 2017.
The Directors, at the time of their appointment, are provided with information about the Company and its organization structure, business model, vision and values, latest published results and internal policies to enable them to familiarize themselves with the Company'sproceduresandpractices.ThenewDirectorsarebriefedbyseniorexecutivesoftheCompanyon itsoperations.ExistingdirectorsarealsoperiodicallyfamiliarizedwiththeoperationsoftheCompany'ssubsidiariesinIndiaandOverseas.TheCompany invites experts to make presentations to the Directors on new statutory regulations. The details of such familiarization programmes are uploaded on the website of the Company. (https://redingtonindia.com/images/FamiliarizationProgrammes.pdf).
The Composition of the Board and the details of Directors' participation at the Board Meetings and the Annual General Meeting held during FY 2016-17:
Name DIN Category
No. of Board Meetings Attended
Whether Attended Last AGM
Prof. J. Ramachandran 00004593 Non-Executive Independent Chairman 4 Yes
Mr. R. Srinivasan## 00575854 Non-Executive Vice Chairman 4 Yes
Mr. R. Jayachandran## 00769254 Non-Executive Director 2 No
Mr. Tu, Shu-Chyuan 02336015 Non-Executive Director 4 No
Mr. Lin Tai-Yang 05110881 Non-Executive Director 4 No
Mr. Nainesh Jaisingh## 00061014 Non-Executive Director 2$ No
Mr. Udai Dhawan** 03048040 Non-Executive Director 1 No
Mr. N. Srinivasan# 00004195 Non-Executive Director 1 No
Mr. B. Ramaratnam* 07525213 Non-Executive Director 4 Yes
Mr.V.S.Hariharan 05352003 Independent Director 5 Yes
Mr. Keith WF Bradley 06564581 Independent Director 4 Yes
Ms.SuchitraRajagopalan 07004299 Independent Director 4 Yes
Mr.RajShankar 00238790 Managing Director 5 Yes
Mr. M. Raghunandan# 00082171 Whole-Time Director 1 No
Mr.E.H.KasturiRangan* 01814089 Whole-Time Director 4 Yes
** Mr. Udai Dhawan was appointed to the Board w.e.f. January 10, 2017.# Mr. N. Srinivasan and Mr. M. Raghunandan stepped down from the Board w.e.f. May 24, 2016.## Mr. R. Jayachandran, Mr. Nainesh Jaisingh and Mr. R. Srinivasan stepped down from the Board w.e.f. September 30, 2016,
January 9, 2017 and February 2, 2017 respectively.$ Additionally, Mr. Nainesh Jaisingh participated in the meeting held on July 28, 2016 through Audio conferencing.
Details of the Directorships and Membership/Chairmanship of Committees of each director in other Indian Public Companies as on March 31, 2017:
Name Category Directorship
Committees
Membership Chairmanship
Prof. J. Ramachandran Non-Executive Independent Chairman 5 4 1
Mr. Udai Dhawan Non-Executive Director 4 3 0
Mr.V.S.Hariharan Independent Director 1 0 0
Mr.E.H.KasturiRangan Whole-Time Director 3 1 0
Notes:
1. None of the Directors of the Company have held memberships in more than ten (10) committees nor are they Chairpersons of more than five (5) committees at any time during the year [as per Reg.26 (1) (a) of SEBI (LODR) Regulations, 2015].
2.OnlyAuditCommitteeandStakeholders'RelationshipCommitteeareconsideredforthepurposeofCommitteepositions(as per Reg.26 (1) (b) of SEBI (LODR) Regulations, 2015.)
3. Committees of the Board
The committees of the Board play a crucial role in the governance structure of the Company. The Committees are set up under the formal approval of the Board with clearly defined roles.
Currently,therearesevencommittees-AuditCommittee,Stakeholders'RelationshipCommittee,Nomination&RemunerationCommittee, Corporate Social Responsibility (CSR) Committee, Risk Management Committee, ESOP Compensation Committee and ESOP Share Allotment Committee. All committees are chaired by Non-Executive Directors.
Generally, the Audit Committee and Stakeholders' Relationship Committee meet at least four times a year; Nomination &RemunerationCommittee,RiskManagementCommitteeandCSRCommitteemeetatleasttwiceayear;ESOPCompensation
Committee and ESOP Share Allotment Committee meet on a need basis.
During the Financial Year 2016-17 the Board formed a Non Mandatory Committee of Directors under the name and style of 'StrategyCommittee'toassisttheBoardinpreparingaLongTermStrategyoftheCompany,reviewtheprogressofthestrategicplan and decide suitable course corrections to ensure Long term sustainable value creation for shareholders.
Except where a quorum has been prescribed by statute, the quorum for Committee meetings is either two members or one third of the total strength of the Committee, whichever is higher. The Chairman of each of the Committees provides an update on the deliberations and decisions taken during the meetings to the Board of Directors at the Board meeting. Draft minutes of the Board and Committee meetings are circulated to the members for their comments and thereafter confirmed at the next meeting. The Board also takes note of the minutes of the Committee meetings held during the previous quarter.
(I) Audit Committee
The Company's Audit Committee consists of two Independent Directors namely Prof. J. Ramachandran and Ms. SuchitraRajagopalanandaNon-ExecutiveDirectorMr.B.Ramaratnam.AllmembersoftheAuditCommitteearefinanciallyliterate.TheChiefFinancial Officer of the Company, Partners/Representatives of the Statutory Auditors and the Internal Auditors are invited to attend the meetings of the Committee. Presentations are made by the audit Firms on their findings as well as on various regulatory updates suchasrequirementsonInternalFinancialControls,ProposedGoodsandServicesTaxActandIndASetc.ToensureCommittee'seffective performance, the Board has laid down the charter of the Audit Committee, which embraces the requirements specified in the Companies Act, 2013 and SEBI (Listing Obligations and Disclosure Requirements) Regulations, 2015 as amended from time to time and inter-alia provides assurance to the board on the adequacy of the internal control systems and financial disclosure.
During the year the audit committee—
1. Reviewed the operations, the financial results and the annual accounts on quarterly/half yearly/annual intervals.
3. Reviewed the Company's financial, risk management and, accounting policies and the accounting standards that areapplicable to the Company.
4. Reviewed the adequacy of the internal audit function, including the structure of the internal audit department, staffing and seniority of the official heading the department, audit coverage and frequency
5. Recommended to the Board on the appointment of internal auditors and statutory auditors and also their remuneration.
6. Periodically interacted with External/Internal auditors.
7. Reviewed the findings of External/Internal auditors together with Management response and action taken
8. Reviewed the performance of Internal and Statutory auditors, evaluation of the internal control system and effectiveness of the Audit process.
9. Discussed with statutory auditors before commencement of audit, about the nature and scope of audit. Separate discussions with internal and external auditors were also held without the presence of management.
10. Reviewed the adequacy of Insurance cover.
11. Reviewed the Related Party Transactions.
Attendance record of Audit Committee
During FY 2016-17, the Audit Committee met four times - May 23, 2016, July 27, 2016, October 26, 2016 and February 1, 2017. The details of attendance of members are given below:
S.No. Name of the Director Category Position
No. of meetings
Held Attended
1 Prof.J.Ramachandran Independent Director Chairman 4 4
2 Mr. N. Srinivasan# Non - Executive Director Member 4 1
3 Mr. B. Ramaratnam* Non - Executive Director Member 4 3
4 Ms.SuchitraRajagopalan Independent Director Member 4 4
* Co-opted as member of the Committee w.e.f. May 24, 2016# Ceased to be a member w.e.f. May 24, 2016
(II) Stakeholders' Relationship Committee
TheCompanyhasconstitutedaStakeholders'RelationshipCommitteewithanobjectivetomonitorandresolvethegrievancesof the security holders of the Company.
The terms of reference of the Committee are as follows:
Duringtheyear,theCompanyhadreceivedonecomplaintfromaninvestorrelatingtonon-uploadingofsubsidiaries'financialsinthe website of the Company and the same was resolved immediately. The Company has a dedicated e-mail address: [email protected]'tocommunicatetheirgrievances.
Attendance record of Stakeholders' Relationship Committee
DuringFY2016-17,theStakeholders'RelationshipCommitteemetfourtimes-May23,2016,July28,2016,October26,2016and February 1, 2017. The details of attendance of members are given below:
S.No. Name of the Director Category Position
No. of meetings
Held Attended
1 Prof. J. Ramachandran# Independent Director Chairman 4 4
2 Mr. R. Srinivasan#$ Non - Executive Director Member 4 3
3 Mr. M. Raghunandan# Whole Time Director Member 4 1
4 Mr.E.H.KasturiRangan* Whole Time Director Member 4 3
to be members w.e.f. February 3, 2017 and February 2, 2017 respectively.$ Additionally, Mr.R.Srinivasan participated in the meeting held on February 1, 2017 through Audio conferencing.
Mr. B. Ramaratnam and Mr. Udai Dhawan were co-opted as Chairman and Member of the Committee respectively w.e.f. February 3, 2017.
Mr. M. Muthukumarasamy, Company Secretary is designated as the Compliance Officer of the Company.
(III) Nomination and Remuneration Committee
The Nomination and Remuneration Committee assists the Board in fulfilling its governance responsibilities with regard to nomination and remuneration of Directors and evaluation of their performance.
The Committee is responsible for the following, amongst other matters:
This Committee was re-constituted during the year with the replacement of Mr. R Jayachandran by Mr. Keith WF Bradley and presently, the committee comprises of three Independent Directors namelyMr. V.S. Hariharan, Prof. J. Ramachandran andMr. Keith WF Bradley.
The details of annual evaluation made by the Board of its own performance and that of its Committees and individual Directors and performance criteria for Independent Directors laid down by Nomination and Remuneration Committee are enclosed as AnnexureDoftheBoard'sReport.
Attendance record of Nomination and Remuneration Committee
During FY 2016-17, the Nomination and Remuneration Committee met three times - May 23, 2016, July 27, 2016, and February 1, 2017. The details of attendance of members are given below:
Annual Report
2016–201767
Annual Report
2016–201766
S.No. Name of the Directors Category Position
No. of meetings
Held Attended
1 Mr.V.S.Hariharan Independent Director Chairman 3 3
2 Prof.J.Ramachandran Independent Director Member 3 3
3 Mr. R. Jayachandran# Non - Executive Director Member 3 2
4 Mr. Keith WF Bradley* Independent Director Member 3 1
* Co-opted as Member of the committee w.e.f. October 27, 2016# Ceased to be a Member w.e.f. September 30, 2016
Details of remuneration paid/payable to Directors for the financial year ended March 31, 2017
S.No. Name of the Directors
Salary & Perquisites
(` /Lacs)Commission
(` /Lacs)#
Performance Linked Bonus
(` /Lacs)Sitting Fees
(` /Lacs)#
1 Prof J. Ramachandran - 18.00 - 6.55
2 Mr. N. Srinivasan - - - 0.50
3 Mr.V.S.Hariharan - 18.00 - 4.60
4 Mr. Keith WF Bradley - 18.00 - 2.15
5 Ms.SuchitraRajagopalan - 18.00 - 2.75
6 Mr. B. Ramaratnam - 18.00 - 2.25
7 Mr. M. Raghunandan 13.57 - - -
8 Mr.E.H.KasturiRangan$ 49.89 - 77.42 -
Total 63.46 90.00 77.42 18.80
# Exclusive of Service Tax$ Salary entitlement for the full Financial Year 2016-17 is considered
Note:
Pursuant to the resolution passed at the Annual General Meeting held on July 27, 2016, Nomination and remuneration committee (“Committee”)revisedthesalaryofMr.E.H.KasturiRangan,WholeTimeDirectorasfollows:
Basic Salary 207,870/- per month Allowances 182,926/- per month Contribution to Provident Fund 12% of Basic Salary Leave Travel Allowance As per the Policy of the Company
PerformanceLinkedBonus:AsmaybeapprovedbytheNominationandRemunerationCommitteesubjecttothemaximumof` 38.26 Lakhs per annum
During the year, on the occasion of Company completing 10 years of listing its shares in the stock exchanges, declared a special payment of one month fixed salary to every employee, who had been with the Company for ten years or more. Accordingly, with the approval of the Committee, Mr Kasturi Rangan, since associated with the Company for more than 10 years, was paid off one month fixed salary of ` 4.16 Lakhs.
MrKasturiRanganisoneofthemembersofLongTermIncentivePlan,rolledoutbytheCompany.Subjecttotheapprovalofthe Committee, for the Financial Year 2016-17 he is eligible for an incentive of ` 35 Lakhs on achievement of certain criteria laid down as part of the incentive scheme.
Shareholding of Directors in the Company as on March 31, 2017
S.No. Name of the Directors Category No. of Shares % to Equity Shares
1 Prof J. Ramachandran Independent Director 5,000 0.0013
2 Mr.RajShankar Managing Director 5,94,946 0.1487
3 Mr.E.H.KasturiRangan Whole Time Director 10,050 0.0025
No options were granted during FY 2016-17 to any of the Directors.
(IV) Corporate Social Responsibility Committee
Your Company has constituted a Corporate Social Responsibility (CSR) Committee to review and monitor the CSR policy and the CSR activities undertaken by the Company. Your Company will continue to take measures to make a positive and significant contribution to society.
TheCSRCommitteeof theBoardcomprisesofMr.V.S.Hariharan, IndependentDirector,Mr.KeithWFBradley, IndependentDirector and Mr. B. Ramaratnam, Non - Executive Director.
Attendance record of Corporate Social Responsibility Committee
During FY 2016-17, the Corporate Social Responsibility Committee met three times - May 23, 2016, October 26, 2016, and February 1, 2017. The details of attendance of members are given below:
S.No. Name of the Directors Category Position
No. of meetings
Held Attended
1 Mr.V.S.Hariharan Independent Director Chairman 3 3
2 Mr. R. Srinivasan$# Non - Executive Director Member 3 2
3 Mr. M. Raghunandan# Whole Time Director Member 3 1
4 Mr. B. Ramaratnam* Non - Executive Director Member 3 2
Notes:
* Mr. B. Ramaratnam was appointed as a member w.e.f. May 24, 2016.# Mr. M. Raghunandan and Mr. R. Srinivasan ceased to be members w.e.f. May 24, 2016 and February 2, 2017 respectively.$ Additionally, Mr. R. Srinivasan participated in the meeting held on February 1, 2017 through Audio conferencing.
Mr. Keith WF Bradley was co-opted as a Member of the Committee w.e.f. February 3, 2017.
(V) Risk Management Committee
The Company has formed a risk management committee to frame, implement and monitor the risk management plan for the Company. The committee is responsible for reviewing the risk management plan and ensuring its effectiveness.
The terms of reference of the Committee inter alia, include the following:
1. To review and approve the Risk Management Policy and associated frameworks, processes and practices.
2. To ensure that the Company is taking appropriate measures to achieve prudent balance between risk and reward in both ongoing and new business activities.
3. Toevaluatesignificant riskexposuresof theCompanyandassessmanagement'sactionstomitigate theexposures inatimely manner (including one-off initiatives and ongoing activities such as business continuity planning and disaster recovery planning & testing).
4. To coordinate its activities with the Audit Committee in instances where there is any overlap with audit activities (e.g. internal or external audit issue relating to risk management policy or practice).
5. To assist the Board in fulfilling its corporate governance oversight responsibilities with regard to the identification, evaluation and mitigation of operational, strategic and external environment risks.
TheCommittee consists of three IndependentDirectors namelyMr. KeithWFBradley,Mr. V.S.Hariharan andMs. SuchitraRajagopalanandtwoExecutiveDirectorsMr.RajShankarandMr.E.H.KasturiRangan.
Attendance record of Risk Management Committee
The Committee met three times during the year on May 24, 2016, October 27, 2016 and February 1, 2017. The details of attendance of members are given below:
Annual Report
2016–201769
Annual Report
2016–201768
S.No. Name of the Directors Category Position
No. of meetings
Held Attended
1 Mr. Keith WF Bradley Independent Director Chairman 3 3
2 Mr.V.S.Hariharan Independent Director Member 3 3
3 Ms.SuchitraRajagopalan Independent Director Member 3 3
4 Mr.RajShankar Managing Director Member 3 3
5 Mr. M. Raghunandan# Whole Time Director Member 3 1
The Company has formulated and implemented a Code of Conduct for the Board of Directors and Senior Management of the Company.TheCodehasalsobeenpostedontheCompany'swebsitewww.redingtonindia.com. Annual Affirmation of compliance with the code has been made by the Directors and Senior Management of the Company. The necessary declaration by the Managing Director of the Company regarding compliance of the Code of Conduct for the financial year 2016-17 is given below.
DECLARATION BY THE MANAGING DIRECTOR REGARDING COMPLIANCE TO THE CODE OF CONDUCT
I hereby confirm that the Company has obtained affirmations from all the members of the Board and Senior Management Team that they have complied with the code of business conduct and ethics for Directors and Senior Management in respect of the Financial Year 2016-17.
Date: May 25, 2017 Raj Shankar
Place: Chennai Managing Director
5. General Body Meetings
I. Location and time of last three Annual General Meetings:
Year Location Date Day Time
2015-16 NaradaGanaSabha,MiniHall,No.314,T.T.KRoad, Chennai -600 018.
July 27, 2016 Wednesday 10.00 A.M.
2014-15 NaradaGanaSabha,MiniHall,No.314,T.T.KRoad, Chennai -600 018.
August 3, 2015 Monday 10.00 A.M.
2013-14 NaradaGanaSabha,MiniHall,No.314,T.T.KRoad, Chennai -600 018.
July 31, 2014 Thursday 10.30 A.M.
No Extra-ordinary General Meeting was convened or postal ballot conducted during the last financial year.
Details of Special Resolutions passed in the last three Annual General Meeting.
Year Special resolutions passed
2015-16 None
2014-15 Payment of remuneration to the Directors of the Company, other than Whole-time Directors, by way of Commission up to a limit of 1% of the net profits of the Company computed in accordance with the provisions of Section 198 of Companies Act, 2013 for a period of five years commencing from financial year ended March 31, 2015
Year Special resolutions passed
2013-14 I. Approval for appointment of Prof. J. Ramachandran as Independent Director on the Board of the Company
II. ApprovalforappointmentofMr.V.S.HariharanasIndependentDirectorontheBoardoftheCompany
III. Approval for appointment of Mr. Keith WF Bradley as Independent Director on the Board of the Company
IV. Approval for adoption of new set of articles of association of the Company pursuant to the new provisions of Companies Act, 2013
6. Subsidiary Companies
i. The Company has three Wholly Owned unlisted non - material Indian subsidiary companies Viz., Cadensworth (India) Limited, ProConnect Supply Chain Solutions Limited and Ensure Support Services (India) Limited.
ii. Cadensworth (India) Limited has made a petition for merging it with the Company. The petition is pending for sanction by the National Company Law Tribunal, Chennai.
iii. The Board of Directors of the Company has regularly been apprised of the business and financial performance of the subsidiary companies. The minutes of the Board meetings, significant transactions and important events of unlisted subsidiary companies are periodically placed before the board. The Management invites key managers of the subsidiaries to provide updates on their business operations to the Board.
7. Disclosures
Related Party Transactions
Transactions with related parties are disclosed in note 36 to the standalone financial statements for the year ended March 31, 2017.
The policy of the Company on transactions with the related parties is formulated and approved by the Board. The same is available on the website of the Company www.redingtonindia.com. Omnibus approval of the Audit Committee is obtained for the related party transactions carried out with the Subsidiaries and Associate. Further the details of transactions with the related parties are placed before the Audit Committee for its review.
There are no transactions entered into by the Company with the related parties during the financial year ended March 31, 2017 whichareprejudicialtotheinterestsoftheCompanyatlarge.
Non Compliance by the Company, Penalties, Strictures, etc.
The Company has complied with the requirements of Stock Exchange / SEBI / any Statutory Authority on all matters relating to capital markets, wherever applicable. There were no instances of non-compliances of any matter relating to the capital markets, no penalties and strictures were imposed by Stock Exchanges or SEBI or any statutory authority during the last three years.
Whistle Blower Policy
The Company has designed a whistle blower policy in the form of Vigil Mechanism and the same is disclosed in the Annexure to theBoards'Report.
The Company confirms that no personnel have been denied access to the audit committee.
8. Compliance with the Discretionary Requirements
The Company has adopted the following Discretionary Requirements in pursuit of adoption of its best governance practices.
The Board
TheChairman of the Board is a Non-Executive Independent Director. He is a Professor in Indian Institute ofManagement,BangaloreandperformshisdutiesfromtheInstitute'squartersatBangalore.Hence,theCompanyhasnotprovidedaseparateoffice to him. The Company as per its policy allows reimbursement of expenses incurred in performance of his duties.
Shareholder's rights
The Company communicates the highlights of financial performance to the investors regularly through email, telephone and Investor conferences and road shows. The Company has enabled an option on its website www.redingtonindia.com to allow the present and prospective investors to subscribe e-alerts on all the communications and financial results announced by the Company.
The Company values and follows a high level of transparency and integrity in financial reporting. The Company's financialstatements are unqualified.
Separate posts of Chairman and Managing Director
The Company has separate posts of Chairman and Managing Director. The Chairman of the Board is a Non-executive Independent Director. The Scope and duties of the Chairman differs from that of the Managing Director.
Reporting by Internal Auditor
Ernst & Young LLP, the Internal Auditors of the Company after discussing and obtaining responses to their findings from the Management of the Company submit their report directly to the Audit Committee.
9. Means of Communication
A. The quarterly, half yearly and annual results are published in newspapers, namely Business Standard in English and Makkal Kural in the regional language, Tamil.
B. The quarterly, half-yearly and annual financial results including official news releases appear on our corporate website www.redingtonindia.com under the investors section.
C. Management'sDiscussionandAnalysisReport:ThisinformationiscoveredelsewhereinthisAnnualReport.
D. Presentations made to institutional investors or to the analysts are available on our website www.redingtonindia.com.
E. The Company has designated [email protected] as an email id for the purpose of registering complaints by investors andhasdisplayedthesameontheCompany'swebsite.
F. TheCompanyorganizes'Earningscall'postannouncementofthequarterlyfinancialresults.Thetranscriptofthesecallsarecommunicated to Stock Exchanges and uploaded in the website of the Company.
G. TheCompanyorganizes'InvestorConnect'sessionperiodicallytoenabletheshareholderstointeractwiththeManagementand clarify their queries on the performance of the Company.
10. General Shareholders' Information
I. Annual General Meeting
Date & Day : July 28, 2017, Friday Time : 10.00 A.M. Venue : NaradaGanaSabha,MiniHall,No.314,T.T.K.Road,Alwarpet,Chennai-600018.
II. Financial Calendar : 1st April to 31st March
(Tentative Board Meeting Calendar for the Financial Year 2017-18)Adoption of results for & considering other items for the I Quarter : July 27, 2017Adoption of results for & considering other items for the II Quarter : October 31, 2017Adoption of results for & considering other items for the III Quarter : February 1, 2018Adoption of results for & considering other items for the IV Quarter : Before May 30, 2018
III. Date of Book Closure : July 22, 2017 to July 28, 2017
IV. Dividend payment date : August 23, 2017
V. Listing on Stock Exchanges
Name Address Scrip / Stock codeNational Stock Exchange of India Ltd Exchange Plaza, 5th Floor, Plot No. C/1, G Block,
Listing fees have been paid to National Stock Exchange of India Limited and BSE Limited.
VI. Depositories (Stock Code) : INE891D01026
VII. Registrar and Share Transfer Agent : Cameo Corporate Services Limited,Subramanian Building, No.1,ClubHouseRoad,Chennai–600002. PhoneNo : +914428460390(5lines) FaxNo : +914428460129 Email : [email protected] Website : www.cameoindia.com
VIII. Share Transfer System
The listing regulation provides that the Board can delegate the authority for transfer / transmission of securities to the Compliance Officer.Hence,theBoardhasdelegatedthepowertoMr.M.Muthukumarasamy,ComplianceOfficertodeal,interalia,onmattersrelating to transfer and transmission of shares and split and consolidation of share certificates.
TheCompanyobtainsandsubmits to theStockExchangesonaHalfYearlybasisaSecretarialComplianceCertificate froma qualified Practicing Company Secretary, confirming that the Company has delivered share certificates relating to transfer of shares within the specified period. As per the certificates issued by the Practicing Company Secretary during FY 2016-17, the Company has ensured the requisite compliance with regard to the transfer of shares and issue of duplicate share certificates and dematerialization/rematerialisation of shares.
IX. Reconciliation of Share Capital Audit
As stipulated by SEBI, a qualified Practicing Company Secretary carries out Secretarial Audit to reconcile the total admitted capital with National Securities Depository Limited (NSDL) and Central Depository Services (India) Limited (CDSL) and the total issued and listed capital. This audit is carried out every quarter and the report thereon is submitted to the Stock Exchanges, where the Company'ssharesarelisted.TheauditconfirmsthatthetotalListedandPaid-upCapitalisinagreementwiththeaggregateofthe total number of shares in dematerialized form (held with NSDL and CDSL) and total number of shares in physical form.
X. Market Price Data
High, Low and Closing price during each month of the Financial Year 2016-17
Total of Non promoter Holding 23,750 367,070,861 91.80
Grand Total 23,751 399,848,460 100.00
XIII. Dematerialization of Shares and Liquidity
The shares of the Company are compulsorily traded in dematerialized form by all categories of investors. As on March 31, 2017, 76.40% shares of the Company were held in dematerialized form.
XIV. ECS Mandate
In order to enable the Company to serve the investors in a better way, the Company requests shareholders to update their bank accounts with their respective depository participants.
XV. Convertible Instruments
There are no outstanding GDRs/ ADRs/ Warrants or any convertible instruments.
XVI. Foreign Exchange Risk and Hedging Activities
Since there are significant import purchases, the transactions of the Company are exposed to Foreign Currency fluctuations. The Company takes forward contracts to mitigate such risk.
XVII. Locations of Branches
Our Company has the following distribution offices, warehouses and services centers both in India and overseas.
Particulars* India Overseas
Sales offices 48 33
Warehouses 156 28
Owned Service Centers 40 22
Partner Service Centers 156 29
* Includes branches of subsidiary companies
XVIII. Address for Correspondence
The shareholders may address their communication/ suggestions/ grievances/ queries to the Registrar and Share Transfer Agents at their address mentioned in Para VII above or to:
Mr. M. Muthukumarasamy Company Secretary, Redington (India) Limited Centre Point, Plot No. 8 & 11 (SP), Thiru-vi-ka Industrial Estate, Guindy, Chennai - 600 032. TelNo:+914442243353;FaxNo:+914422253799 Email : [email protected]
The Company has its own website namely www.redingtonindia.com. The website provides detailed information about the Company, its products and services offered, locations of its corporate offices and various sales offices, etc. The quarterly results, annual reports and shareholding patterns are updated on the website of the Company.
Management Discussion and AnalysisEconomic Outlook
YourCompany'sbusinessinterestsarespreadacrossIndia,SouthAsia,MiddleEast,Turkey,Africa(META)andCISregions.Inthe inter-connected world of today, no region / country is totally immune to the geo-political or economic upheavals of another region / country.
Since most of the geographies in which your Company operates fall in the "emerging", "developing" and "under-developed" categories, the impact of global developments tend to impact them more than most.
A discussion of Global geopolitical and Economic developments, in the year gone by, is therefore essential, in order to position yourCompany'sFY16-17businessperformanceinthepropercontext.
Global Economy - Review and Outlook
Last year, we had dwelled at length on the severe impact terrorism and its related refugee crisis along with the low crude prices has had on the economies of most African and Middle East / West Asian countries. The situation remains highly volatile and has rendered business performance in this region extremely uncertain. The prolonged political turmoil in Turkey has also nearly decimated one of the stronger economies of the region.
Under these challenging circumstances, your Company has had to exercise extreme caution while conducting its business in these territories.Theemphasishasbeenon totalprotectionofyourcompany'shumanandeconomiccapitalwhile trying toaccess the available business opportunities.
While the World Economy tried to recover from prolonged slowness, two events completely overshadowed all other occurrences. Brexit and the victory of Donald Trump in the US elections are likely to set the tone for the Global Economy in the years to come.
AspertheUnitedNationsReportonWorldEconomicSituationandProspects,in2016,theworldeconomyexpandedbyjust2.2%, the slowest rate of growth since the Great Recession of 2009. Growth momentum of the advanced economies picked up marginally in the second half of the year.
Amongst the emerging economies, China, though still continuing with policy support for business growth, initiated an economy "reset", moderating its high-growth momentum, while the Indian economy hit a speed-breaker in the second half of the fiscal year on account of demonetization of the currency.
Commodity markets - both Oil and non-Oil, remained weak. Geopolitical challenges in Africa and in the Arab World, which had cascading repercussions in Europe, poses a threat to the overall economic recovery in several regions.
As per the recent forecast by the International Monetary Fund (IMF), World growth is expected to rise to 3.5% in 2017 and 3.6% in 2018. Growth in the Middle East and North Africa is forecast to recover modestly, to 2.3% in 2017 and to 3.2% in 2018, with the recovery being strongest in the oil importing countries.
Indian Economy - Review and Outlook
Theyeargonebywasmarkedbytwomajordomesticpolicydevelopments;passageoftheConstitutionalamendment,pavingtheway for implementing the transformational Goods and Services Tax (GST), and demonetization of the two highest denomination notes. Though there were near-term pains on account of demonetization and foreseeable challenges in GST implementation, thesepoliciesareexpectedtohavemajorpositiveimpactsonthefutureeconomicgrowthofthecountry.WhileBrexitandthepolicies of the new US regime may pose uncertainties, the Indian economy is expected to remain resilient on the back of strong domestic demand.
The transition to the unified GST regime, scheduled to be rolled out in FY 17-18, is expected to have a favourable impact on the economy as it would pave way for seamless input credit and removal of a complex tax structure, leading to economies of scale in production and efficiency in supply chain.
Certificate under Regulation 17(8) of the SEBI (Listing Obligations and Disclosure Requirements) Regulations, 2015
We,RajShankar,ManagingDirectorandS.V.Krishnan,ChiefFinancialOfficeroftheCompanyherebyconfirmandcertifythatA. We have reviewed the financial statements/results for the quarter and year ended 31st March 2017 and Cash Flow Statement
for the year ended on that date and that to the best of our knowledge and belief:I. These statements do not contain any materially untrue statement or omit any material fact or contain statements/figures
accounting standards, applicable laws and regulations.B. There are, to the best of our knowledge and belief, no transactions entered into by the Company during the said period which
arefraudulent,illegalorviolativeoftheCompany'scodeofconduct.C. We accept responsibility for establishing and maintaining internal controls for financial reporting and that we have evaluated
the effectiveness of internal control systems of the Company pertaining to financial reporting and we have disclosed to the auditors and the audit committee, deficiencies in the design or operation of such internal controls, if any, of which we are aware and the steps we have taken or propose to take to rectify these deficiencies.
D. We have indicated to the auditors and the Audit committee:i. Thatnosignificantchangesininternalcontrolhaveoccurredoverfinancialreportingduringthesaidperiod;ii. That changes in accounting policies, if any, during the period have been disclosed in the notes to the financial statements/
results;andiii. That no instances of significant fraud of which we have become aware and the involvement therein, if any, of the
Place:Chennai RajShankar S.V.Krishnan Date : May 25, 2017 Managing Director Chief Financial Officer
Independent Auditor's Certificate
To the Members of Redington (India) Limited1. We,DeloitteHaskins&Sells,Chennai,CharteredAccountants,theStatutoryAuditorsofRedington(India)Limited("theCompany"),
have examined the compliance of conditions of Corporate Governance by the Company, for the year ended on March 31, 2017, as stipulated in Regulations 17 to 27 and Clauses (b) to (i) of Regulation 46(2) and paras C and D of Schedule V of the SEBI (Listing Obligations and Disclosure Requirements) Regulations, 2015 (the Listing Regulations).
Managements' Responsibility2. The compliance of conditions of Corporate Governance is the responsibility of the Management. This responsibility includes the
design, implementation and maintenance of internal control and procedures to ensure the compliance with the conditions of the Corporate Governance stipulated in Listing Regulations.
Auditor's Responsibility3. Our responsibility is limited to examining the procedures and implementation thereof, adopted by the Company for ensuring
compliance with the conditions of the Corporate Governance. It is neither an audit nor an expression of opinion on the financial statements of the Company.
4. We have examined the books of account and other relevant records and documents maintained by the Company for the purposes of providing reasonable assurance on the compliance with Corporate Governance requirements by the Company.
5. We have carried out an examination of the relevant records of the Company in accordance with the Guidance Note on Certification of Corporate Governance issued by the Institute of the Chartered Accountants of India (the ICAI), the Standards on Auditing specified under Section 143(10) of the Companies Act 2013, in so far as applicable for the purpose of this certificate and as per the Guidance Note on Reports or Certificates for Special Purposes issued by the ICAI which requires that we comply with the ethical requirements of the Code of Ethics issued by the ICAI.
6. We have complied with the relevant applicable requirements of the Standard on Quality Control (SQC) 1, Quality Control for Firms thatPerformAuditsandReviewsofHistoricalFinancialInformation,andOtherAssuranceandRelatedServicesEngagements.
Opinion7. Based on our examination of the relevant records and according to the information and explanations provided to us and the
representations provided by the Management, we certify that the Company has complied with the conditions of Corporate Governance as stipulated in Regulations 17 to 27 and Clauses (b) to (i) of Regulation 46(2) and paras C and D of Schedule V of the Listing Regulations during the year ended March 31, 2017.
8. We state that such compliance is neither an assurance as to the future viability of the Company nor the efficiency or effectiveness with which the Management has conducted the affairs of the Company.
Place: Chennai Date: May 25, 2017
For Deloitte Haskins & SellsChartered Accountants
(Firm'sRegistrationNo.008072S)
M K Ananthanarayanan Partner
Membership No. 19521
Annual Report
2016–201777
Annual Report
2016–201776
Industry Structure, Developments, Opportunities and Threats
As per IDC, Global Personal Computer (PC) shipments once again declined during CY 2016, this time by 5.7%. PC shipments in Asia/Pacific(includingJapan)totaled101.8millionunitsduringCY2016,reflectingaYOYdeclineof5.5%.However,inthefirstquarter of CY 2017, the PC market posted YOY growth of 0.6%, representing its first foray back into positive territory since Q1, CY 2012.
The decline is largely attributed to longer refresh cycles of technology products by customers and lack of any fresh computing /dataconsumptiondriversthatmightrequirefrequentupgradingofPCs,aswasthenormintheprecedingdecades.However,as per IDC, the commercial market is beginning a replacement cycle that is expected to drive growth. Consumer demand is expected to remain under pressure, although growth in segments like PC gaming as well as rising saturation of tablets and smartphones will move the consumer market towards stabilization as well
In India, CY 2016 witnessed decline in PC shipments due to lack of special educational deals as was prevalent in the past years. While there is considerable debate about smartphones cannibalizing the PC demand, the fact remains that the Indian market remains largely unpenetrated and computational requirements will ensure growth in PC sales once Tier-3 and Tier-4 towns and the untapped potential of the huge SMB base are brought into the technology fold.
Thewidespread,cheapavailabilityofbroadband,coupledwiththecurrentGovernment's intensepushtowardsdigitizationofthe entire economy is expected to provide a huge impetus for consumption of IT products and technologies. This will be further augmented by the transition of the Indian Economy to the GST regime, as this would require all businesses to incorporate basic IT infrastructure, in order to comply with the statutory requirements.
The ongoing and planned investments by Central and State Governments in Digital India and Smart City projects requiressubstantial investments in IT infrastructure by way of Networking, Storage, Security and Enterprise Software solutions. This, coupled with necessary investments by PSU Banks and the BFSI sector is expected to form the bulk of the demand for IT products and solution in the foreseeable future.
Indian customers have woken up to the advantages of Cloud technology and there has been an appreciable momentum towards adoption of Cloud for specific workloads. This momentum is expected to accelerate in the next 3-5 years and will create substantial opportunities in the space of Cloud Consulting & Migration.
As per IDC, Global smartphone sales witnessed slow-down in growth, with YoY growth at 2.5% in CY 2016. Worldwide smartphone shipments are expected to rebound slightly in 2017 to 1.52 billion units, an increase of 3% over CY 2016. In the Indian context, the smartphone shipments, at 109.1 million units, registered a marginal annual growth of 5.2% in CY 2016. The impact of demonetization led to relatively lower sales in November and December.
Backed by aggressive marketing spends and investments in brand building, Chinese vendors have been quick to capitalize on the online channels and migration from 3G to 4G devices in India. With a 40% share for China based vendors during the first quarter of CY 2017, there has been a definite shift of demand, away from local brands and towards Chinese brands. Consequently, while Samsung retains its pre-eminent position in the Indian market with a dominant 25.1% market share during CY 2016, the next 4 slots in the market-share hierarchy are occupied by Chinese brands.
The growth of smartphones in India for 2017 is expected to reach 125 million units registering a YOY growth of 15%, largely on account of 4G services launched newly by Telecom Operators, declining data prices as well as sharply declining Average Selling Prices (ASPs), besides government incentives for local assembly / manufacturing in India.
The E-commerce space in India is undergoing consolidation with shift in focus towards profitability. Some of the E Commerce players are planning to address the B2B segment which in our opinion will take time to scale.
Core Business: This constitutes the traditional IT distribution business. Your company will continue to develop its capabilities and skills as a Value-Added Distributor, moving up the value chain by offering Pre-Sales consulting, Solutioning and Installation services to partners and vendors for their customers. At the same time, your company would participate and exploit all business opportunities in the traditionalstock-and-sellandBack toBack (B2B)projectspace for ITproductsandsolutions.Wehavesingled out diversification as one of the key growth strategy, considering our distribution competency as well as the infrastructure wehavebuiltovertime.ThishasgivenustheconfidencetoevaluatedistributionopportunitiesindiverseverticalssuchasHealth& Medical Equipment and Solar.
Mobility: Recognizing that Mobility will remain an important growth driver and in view of the continued convergence between Information Technology and Communication, your Company would continue to expand its portfolio and hone its business strategy
in order to meaningfully participate in the growth available in this space, while maintaining its focus on return on the investments made.
Services: Your company is on the path of transforming itself into a full-blown service provider and in the way ahead, significant portion of the business will be led by services such as Supply Chain Solution Services, Support Services, Cloud Services, 3D PrintingservicesandHigh-endPrintingSolutionServices.Significantinvestmentsareearmarkedintheseareas,towardsbuildingup infrastructure, skills and resources, which would transform your Company into a leading services oriented organization, on the back of a strong distribution business base.
Yourcompany'sfocusandenergiesaregearedtowardstransformingitselfforthebusinessofthefuture,withthesoleobjectiveof delivering increasing value to all its stake holders - its Shareholders, its Employees, its Vendors, its Channel Partners and last, but not the least, the Social eco-system in which it operates and thrives.
Internal Control System and their adequacy
AdetailednoteontheInternalControlssystemsoftheCompanyanditsadequacyisgiveninAnnexureAtotheBoard'sReportforming part of this Annual Report.
Human Resource Management
Your company has constantly recognized and appreciated the importance of human capital for its success and growth. With the changing times, the company endeavors to add fresh talent as well as up-skill its existing Redingtonians. Your company creates a conducive work culture that has fostered growth and development of employees and has thus led to a symbiotic relationship. Employee engagements are regular events organized for employee socialization and building happiness at the workplace.
Financial Performance Analysis
The Consolidated financials of your Company and its subsidiaries ("The Group") have been prepared in accordance with Ind AS, notified under the Companies (Indian Accounting Standards) Rules, 2015. Upto the year ended March 31, 2016 the Group prepared its financial statements in accordance with the requirements of previous GAAP, (Indian GAAP) which includes Standardsnotifiedunder theCompanies (AccountingStandards)Rules,2006.Theseare theGroup'sfirst IndASfinancialstatements and the date of transition to Ind AS is April 1, 2015. Accordingly all the comparative and corresponding figures have been regrouped/reclassified in line with the requirement of all applicable Ind AS.
Segment-wise Performance Analysis
Your Company has identified "India" and "Overseas" as its Operating segments, in a manner consistent with Ind AS 108 and its internal reporting. The reported operating segments
a. engage in business activities from which the Group earns revenues and incur expenses
b. havetheiroperatingresultsareregularlyreviewedbytheentity'schiefoperatingdecisionmakertomakedecisionsaboutresources to be allocated to the segment and assess its performance, and
c. have discrete financial information available.
In both Operating Segments, your Company has performed well during the current financial year. Despite a subdued demand environment in India, taking into account, the effect of demonetization and Geo-political tensions in Turkey, the Company has posted double digit growth in both Revenue and Earnings After tax during the current year.
YourCompany'sconsolidatedfinancialperformanceismarkedbyhealthyrevenueandprofitgrowthmixinbothdomesticandoverseas markets and a strong market position in both these markets.
Analysis on the Consolidated Financial Performance
Revenue
Consolidated revenue grew by 16.0% during the fiscal year 2016-17, with a Compounded Annual Growth Rate (CAGR) for 5 years of 14.2%. IT business revenue grew by 2.0% and Mobility business revenue grew by 70.4% during the fiscal year 2016-17. Both segments registered higher growth in mobility business.
India operation grew by 18.0%, with a CAGR of 9.6% for five years and overseas operations grew by 14.8% with a CAGR of 17.6% for five years. IT business registered a subdued growth due to lower demand for consumer products.
Annual Report
2016–201779
Annual Report
2016–201778
Gross Margin
Gross margin grew by 10.8% during the fiscal year 2016-17. Gross margin growth was lesser than revenue growth due to change in sales mix. Share of mobile business revenue increased as a percentage to the total revenue in both India and Overseas segments. Since mobile business gross margin percentage is lower than the IT gross margin percentage, there was a marginal drop in the overall gross margin percentage.
Overheads
The consolidated overhead expenses of grew by 13.9% with 17.8% in India and 11.5% in overseas due to various reasons mentioned below. Of the overall increase in overseas expenditure, 5.5% increase is due to the two majorensuingreasons.
• DevaluationofIndianrupeesagainstUSdollarby2.4%.
• Acquisition of Linkplus Bilgisayar Sistemleri Sanayi veTicaret AS in the third quarter of the previous financial year by 3.1%.
Employee Costs
Employee cost increased by 16.2% during the financial year 2016-17. This increase is primarily on account of:
Other expenses increased by 12.2% during the fiscal year 2016-17. This increase is primarily on account of increase in the ensuing costs:
• Sales promotion expenses in both India andOverseas segments contributed to an increase of 8.1%due to contractualobligation which needs to be incurred.
• CorporateSocialResponsibilityexpenditureamountingto` 6.1 crore was spent in India segment, in line with Companies Act 2013. This expense contributed to an increase of 0.8%.
• WarehousecostinIndiaduetoformationanewstep-downsubsidiaryRajprotimSupplyChainSolutionsLimitedforLogisticsbusiness in the current financial year and the same contributed 1.5% to overall increase.
EBITDA
Growth in EBITDA is 5.9% in financial year 2016-17 with a CAGR for 5 years of 6.1%. Better leveraging of fixed expenses resulted inmaintainingahighergrowthrateinEBITDAascomparedtogrossmargingrowthrateof5.7%.However,therewasamarginaldrop in EBITDA as a percentage to revenue to 2.1% from 2.3% due to lower growth in gross margin as compared to revenue growth.
Finance Costs
Finance costs reduced by 13.0% during the fiscal year 2016-17. The reduction in finance cost is 6.1% in India operations and 19.4% in overseas operations.
Reduction in finance cost in overseas segment is primarily on account of consistent reduction of Working Capital. Reduction in India segment is primarily on account of reduction in interest rates and reduction in working capital from 38 days in the fiscal year 2015-16 to 37 days in fiscal year 2016-17.
The working capital days in overseas operations dropped from 58 days for the fiscal year 2015-16 to 34 days in the fiscal year 2016-17. Considering the geo-political tensions reduction in working capital was driven as a focussed exercise, even over the business metrics.
The reduction in finance cost has had a favourable impact on the interest cover ratio, which has moved up from 4.3 times for the fiscal year 2015-16 to 5.2 times in the fiscal year 2016-17.
PBT & PAT
PBT & PAT (after Non-controlling Interests) increased by 10.9% and 9.7% respectively during the fiscal year 2016-17 with a CAGR for 5 years of 9.1% and 9.5% respectively.
Cashflow from Operations
Cash flow generated from operation was ` 1,348.6 Crores. Positive cash flow could be generated in excess of profit earned during the fiscal year 2016-17 due to significant reduction in working capital especially in overseas segment.
Capital intensive business units or geographical enterprises, which did not generate healthy ROCE, commensurate with the associated risk, were hived off to reduce the working capital requirement. In addition, various capital reduction methods were implemented to reduce inventory and receivable.
Cash from investment activities was negative at ` 63.4CroreslargelyonaccountofinvestmentinPhase–IIADC,atChennai.
Cash from financing activities is negative at ` 1,119.7 Crores primarily due to repayment of borrowings. The excess cash flow generated from operation were utilised for the purpose of repayment of loan and distribution of dividend.
With the above repayment your Company has brought down its net debts to equity ratio to 0.2 times and is favourably poised to capture any upswing in the business opportunity, in the ensuing years.
Key Ratios
Particulars FY 2016-17 FY 2015-16
Return on Average Capital Employed (%)* 15.3 14.9
Return on Average Equity (%)* 15.3 15.6
Book Value/ Share (in ` ) 78.2 73.2
EPS (in ` ) 11.6 10.6
Interest Cover (times) 5.2 4.3
Gross Debt : Equity (times) 0.4 0.7
Net Debt : Equity (times) 0.2 0.5
* Goodwill has been excluded and Capital reserve has been included appropriately.
Return on capital employed has improved in the current fiscal year 2016-17 primarily due effective working capital management. Return on Average Equity has marginally dropped, primarily on account of reduction in debt levels from 0.5 times to equity during the fiscal year 2015-16 to 0.2 times to equity during the fiscal year 2016-17.
However return on closing equity has increased to 14.8% from 14.4%. Book value has increased by ` 5, despite Rupee appreciation against US dollars as at the balance sheet date and interim (special) dividend payment in the financial year.
EPS has also steadily grown due to Profit growth in the current fiscal year 2016-17.
It is important to mention here that after the Company’s initial public offering during February 2007, the Company did not raise any further equity. The profits it made during these years and the resultant cash flow generated was sufficient enough to fuel its growth in the last 10 years and still maintain a robust debt to equity ratio inspite of consistent dividend payment to the shareholders.
The Company will drive towards improving capital efficiency and allocate capital in ventures that generate superior return on capital employed.
Analysis on the Standalone Financial Performance
Revenue
Revenue grew by 22.1% during the fiscal year 2016-17 with a CAGR for 5 years of 10.3%. Mobility business segment grew by 48.6% and IT business segment grew by 15.0% during the fiscal year 2016-17 as compared to the fiscal year 2015-16.
Revenue from new vendors in mobility business contributed to 4.0% growth.
IT revenue grew strongly in commercial segment at 21.9%. The revenue growth in IT consumer segment remained subdued at 8.3%.
Gross Margin
Gross margin grew by 10.9% during the fiscal year 2016-17. Gross margin grew at a lesser percentage than revenue growth due to change in sales mix. Mobility segment generates less gross margin compared to IT segment.
Expenses
Employee benefit
Employee cost increased by 20.0% during the current fiscal year 2016-17. The increase is due to the ensuing reasons:
• Expenditureof` 5.4 Crore was spent during the current fiscal year 2016-17 towards corporate social responsibility. This expense is grouped under "Other Expenses" first time and it resulted in overall increase of 2.2%.
EBITDA grew by 3.6% during the fiscal year 2016-17 despite a strong revenue growth. The subdued growth is on account of:
• Reducedgrossmarginpercentageduetosalesmix.
• CSRexpenditurewhichwasincurredduringtheyear.
• Increaseinotherexpenses
Finance Costs
Reduction of 3.4% in finance cost is on account of reduction in the Interest Rate and reduction in average working capital from 37 to 35 days during the fiscal year 2016-17.
The reduction in finance cost coupled with reduction in average working capital days has improved interest cover to 4.78 times during the fiscal year 2016-17 from 4.47 times for the previous fiscal year 2015-16.
Profit before tax grew by 5.4% during the fiscal year 2016-17. Growth in PBT was better than growth in EBITDA due to reduced interest cost.
The spike during the fiscal year 2013-14 is on account of sale of shares in wholly owned subsidiary Easyaccess Financial Services Limited amounting to ` 65.8 Crores.
Profit after Tax
Profit after tax grew higher than profit before tax by 6.9% during the fiscal year 2016-17. The higher growth is on accountofdividendincomewhichissubjecttotax inthehands of the payer.
The spike during the fiscal year 2013-14 is on account of sale of shares in wholly owned subsidiary Easyaccess Financial Services Limited.
Cash Flow Statement
Cash flow from operation was positive at 58.2 Crores for the fiscal year 2016-17. Positive cash flow from operation could be achieved due to reduced utilisation of working capital. There has been a consistent positive cash flow generation from operation signifying strong business fundamentals and prudent operational control.
Cash flow from investment activities was positive at ` 8.7 Crores for the fiscal year 2016-17, due to increased dividend from subsidiaries.
Cash flow from financing activities was negative at ` 52.1 Crores for the fiscal year 2016-17, due to payment of interim dividend. Positive cash flow from operating and investment activity enabled payment of an interim (special) dividend of 100% on the share capital during the year.
Funds Employed
Shareholder funds increased to ` 1,546.3 Crores as on March 31, 2017 from ` 1,538.4 Crores on March 31, 2016, due to transfer of profit earned post dividend pay-out for the fiscal year 2015-16 and interim dividend pay-out during the fiscal year 2016-17.
Debt increased by ` 220.3 Crores during the fiscal year 2016-17 on account of working capital requirement.
The debt to equity ratio was maintained at 0.48 times through efficient cash flow management. The Company is favourably poised to capture any upswing in the business opportunity in the ensuing years.
Dividend
With comfortable Debt levels, the Board of Directors have recommended 115% dividend on the face value of shares for the year 2016-17, equivalent to ` 2.3 per share, making it the highest ever dividend pay-out in any year.
Book value and Earnings per Share
Book Value of the Company increased from ` 38.5 per share to ` 38.7 per share.
Earnings per share increased by 6.9% to ` 5.0 per share for the year ended March 31, 2017 as compared to the previous fiscal year.
Independent Auditor's Report to the Members of Redington (India) Limited
Report on the Standalone Ind AS Financial Statements
We have audited the accompanying standalone Ind AS financial statements of Redington (India) Limited ("the Company"), which comprise the Balance Sheet as at 31 March 2017, and the Statement of Profit and Loss (including Other Comprehensive Income), the Cash Flow Statement and the Statement of Changes in Equity for the year then ended, and a summary of the significant accounting policies and other explanatory information, in which are incorporated the Returns for the year ended on that date audited by the branchauditoroftheCompany'sbranchlocatedatSingapore.
Management's Responsibility for the Standalone Ind AS Financial Statements
TheCompany'sBoardofDirectorsisresponsibleforthemattersstatedinSection134(5)oftheCompaniesAct,2013("theAct")with respect to the preparation of these standalone Ind AS financial statements that give a true and fair view of the financial position, financial performance including other comprehensive income, cash flows and changes in equity of the Company in accordance with the accounting principles generally accepted in India, including the Indian Accounting Standards (Ind AS) prescribed under section 133 of the Act.
This responsibility also includes maintenance of adequate accounting records in accordance with the provisions of the Act for safeguardingtheassetsoftheCompanyandforpreventinganddetectingfraudsandotherirregularities;selectionandapplicationofappropriateaccountingpolicies;makingjudgmentsandestimatesthatarereasonableandprudent;anddesign,implementationandmaintenance of adequate internal financial controls, that were operating effectively for ensuring the accuracy and completeness of the accounting records, relevant to the preparation and presentation of the standalone Ind AS financial statements that give a true and fair view and are free from material misstatement, whether due to fraud or error.
Auditor's Responsibility
Our responsibility is to express an opinion on these standalone Ind AS financial statements based on our audit.
In conducting our audit, we have taken into account the provisions of the Act, the accounting and auditing standards and matters which are required to be included in the audit report under the provisions of the Act and the Rules made thereunder.
We conducted our audit of the standalone Ind AS financial statements in accordance with the Standards on Auditing specified under Section 143(10) of the Act. Those Standards require that we comply with ethical requirements and plan and perform the audit to obtain reasonable assurance about whether the standalone Ind AS financial statements are free from material misstatement.
An audit involves performing procedures to obtain audit evidence about the amounts and the disclosures in the standalone Ind AS financialstatements.Theproceduresselecteddependontheauditor'sjudgment,includingtheassessmentoftherisksofmaterialmisstatement of the standalone Ind AS financial statements, whether due to fraud or error. In making those risk assessments, the auditorconsidersinternalfinancialcontrolrelevanttotheCompany'spreparationofthestandaloneIndASfinancialstatementsthatgive a true and fair view in order to design audit procedures that are appropriate in the circumstances. An audit also includes evaluating theappropriatenessoftheaccountingpoliciesusedandthereasonablenessoftheaccountingestimatesmadebytheCompany'sDirectors, as well as evaluating the overall presentation of the standalone Ind AS financial statements.
We believe that the audit evidence obtained by us and the audit evidence obtained by the branch auditor in terms of their report referred to in the Other Matters paragraph below, is sufficient and appropriate to provide a basis for our audit opinion on the standalone Ind AS financial statements.
Opinion
In our opinion and to the best of our information and according to the explanations given to us, and based on the consideration of report of the branch auditor on separate financial statements / financial information of the branch referred to in the Other Matters paragraph below, the aforesaid standalone Ind AS financial statements give the information required by the Act in the manner so required and give a true and fair view in conformity with the accounting principles generally accepted in India, of the state of affairs of the Company as at 31 March 2017, and its profit, total comprehensive income, its cash flows and the changes in equity for the year ended on that date.
Other matter
a) We did not audit the financial statements / financial information of a branch included in the standalone Ind AS financial statements of the Company whose financial statements reflect total assets of Rs. 8,446 Lakhs as at 31 March 2017 and total revenues of Rs. 20,977 Lakhs for the year ended on that date, as considered in the standalone Ind AS financial statements. The financial statements / financial information of the branch has been audited by the branch auditor whose report has been furnished to us, and our opinion in so far as it relates to the amounts and disclosures included in respect of the branch and our report in terms of subsection (3) of Section 143 of the Act, in so far as it relates to the aforesaid branch, is based solely on the report of such branch auditor.
Standalone Financial Statements
Annual Report
2016–201785
Annual Report
2016–201784
b) The comparative financial information for the year ended 31 March 2016 and the transition date opening balance sheet as at 1 April 2015 in respect of the branch included in this Standalone Ind AS financial statements prepared in accordance with the Ind AS have been audited by the branch auditor.
Our opinion on the standalone financial statements and our report on Other Legal and Regulatory Requirements below is not modified in respect of these matters.
Report on Other Legal and Regulatory Requirements
1. As required by Section 143(3) of the Act, based on our audit and on the consideration of the report of the branch auditor on the separate financial statements / financial information of the branch, referred to in the Other Matters paragraph above we report, to the extent applicable that:
a) We have sought and obtained all the information and explanations which to the best of our knowledge and belief were necessary for the purposes of our audit.
b) In our opinion, proper books of account as required by law have been kept by the Company so far as it appears from our examination of those books and the report of the branch auditor.
c) The report on the financial statements of the branch of the Company audited under Section 143(8) of the Act by the branch auditor has been sent to us and has been properly dealt with by us in preparing this report.
d) The Balance Sheet, the Statement of Profit and Loss including Other Comprehensive Income, the Cash Flow Statement and Statement of Changes in Equity dealt with by this Report are in agreement with the books of account and with the returns received from the branch not visited by us.
e) In our opinion, the aforesaid standalone Ind AS financial statements comply with the Indian Accounting Standards prescribed under section 133 of the Act.
f) On the basis of the written representations received from the directors as on 31 March 2017 taken on record by the Board of Directors, none of the directors is disqualified as on 31 March 2017 from being appointed as a director in terms of Section 164(2) of the Act.
g) With respect to the adequacy of the internal financial controls over financial reporting of the Company and the operating effectiveness of such controls, refer to our separate Report in "Annexure A". Our report expresses an unmodified opinion on theadequacyandoperatingeffectivenessoftheCompany'sinternalfinancialcontrolsoverfinancialreporting.Thisreportingrequirement is not applicable to the branch of the Company incorporated outside India.
h) WithrespecttotheothermatterstobeincludedintheAuditor'sReportinaccordancewithRule11oftheCompanies(Auditand Auditors) Rules, 2014, as amended, in our opinion and to the best of our information and according to the explanations given to us:
i. The Company has disclosed the impact of pending litigations on its financial position in its standalone Ind AS financial statements;
ii. The Company did not have any long-term contracts including derivative contracts.
iii. There has been no delay in transferring amounts, required to be transferred, to the Investor Education and Protection Fund by the Company.
iv. The Company has provided requisite disclosures in the standalone IND AS financial statements as regards its holding and dealings in Specified Bank Notes as defined in the Notification S.O. 3407(E) dated the 8th November, 2016 of the Ministry of Finance, during the period from 8 November 2016 to 30 December 2016. Based on audit procedures performed and the representations provided to us by the management we report that the disclosures are in accordance with the books of account maintained by the Company and as produced to us by the Management. This reporting requirement is not applicable to the branch of the Company situated in Singapore.
2. AsrequiredbytheCompanies(Auditor'sReport)Order,2016("theOrder")issuedbytheCentralGovernmentintermsofSection143(11) of the Act, we give in "Annexure B" a statement on the matters specified in paragraphs 3 and 4 of the Order.
Report on the Internal Financial Controls Over Financial Reporting under Clause (i) of Sub-section 3 of Section 143 of the Companies Act, 2013 ("the Act")
We have audited the internal financial controls over financial reporting of Redington (India) Limited ("the Company") as of 31 March 2017inconjunctionwithourauditofthestandaloneIndASfinancialstatementsoftheCompanyfortheyearendedonthatdate.
Management's Responsibility for Internal Financial Controls
TheCompany'smanagementisresponsibleforestablishingandmaintaininginternalfinancialcontrolsbasedontheinternalcontrolover financial reporting criteria established by the Company considering the essential components of internal control stated in the Guidance Note on Audit of Internal Financial Controls Over Financial Reporting issued by the Institute of Chartered Accountants of India. These responsibilities include the design, implementation and maintenance of adequate internal financial controls that were operatingeffectively forensuringtheorderlyandefficientconductof itsbusiness, includingadherencetocompany'spolicies, thesafeguarding of its assets, the prevention and detection of frauds and errors, the accuracy and completeness of the accounting records, and the timely preparation of reliable financial information, as required under the Companies Act, 2013.
Auditor's Responsibility
OurresponsibilityistoexpressanopinionontheCompany'sinternalfinancialcontrolsoverfinancialreportingbasedonouraudit.We conducted our audit in accordance with the Guidance Note on Audit of Internal Financial Controls Over Financial Reporting (the "Guidance Note") issued by the Institute of Chartered Accountants of India and the Standards on Auditing prescribed under Section 143(10) of the Companies Act, 2013, to the extent applicable to an audit of internal financial controls. Those Standards and the Guidance Note require that we comply with ethical requirements and plan and perform the audit to obtain reasonable assurance about whether adequate internal financial controls over financial reporting was established and maintained and if such controls operated effectively in all material respects.
Our audit involves performing procedures to obtain audit evidence about the adequacy of the internal financial controls system over financial reporting and their operating effectiveness. Our audit of internal financial controls over financial reporting included obtaining an understanding of internal financial controls over financial reporting, assessing the risk that a material weakness exists, and testing and evaluating the design and operating effectiveness of internal control based on the assessed risk. The procedures selected depend ontheauditor'sjudgement,includingtheassessmentoftherisksofmaterialmisstatementofthefinancialstatements,whetherdueto fraud or error.
We believe that the audit evidence we have obtained, is sufficient and appropriate to provide a basis for our audit opinion on the Company'sinternalfinancialcontrolssystemoverfinancialreporting.
Meaning of Internal Financial Controls over Financial Reporting
Acompany'sinternalfinancialcontroloverfinancialreportingisaprocessdesignedtoprovidereasonableassuranceregardingthereliability of financial reporting and the preparation of financial statements for external purposes in accordance with generally accepted accountingprinciples.A company's internal financial control over financial reporting includes thosepolicies andprocedures that(1) pertain to the maintenance of records that, in reasonable detail, accurately and fairly reflect the transactions and dispositions of theassetsofthecompany;(2)providereasonableassurancethattransactionsarerecordedasnecessarytopermitpreparationoffinancial statements in accordance with generally accepted accounting principles, and that receipts and expenditures of the company arebeingmadeonlyinaccordancewithauthorisationsofmanagementanddirectorsofthecompany;and(3)providereasonableassuranceregardingpreventionortimelydetectionofunauthorisedacquisition,use,ordispositionofthecompany'sassetsthatcouldhave a material effect on the financial statements.
Inherent Limitations of Internal Financial Controls over Financial Reporting
Because of the inherent limitations of internal financial controls over financial reporting, including the possibility of collusion or improper managementoverrideofcontrols,materialmisstatementsduetoerrororfraudmayoccurandnotbedetected.Also,projectionsofanyevaluationoftheinternalfinancialcontrolsoverfinancialreportingtofutureperiodsaresubjecttotheriskthattheinternalfinancialcontrol over financial reporting may become inadequate because of changes in conditions, or that the degree of compliance with the policies or procedures may deteriorate.
Annual Report
2016–201787
Annual Report
2016–201786
Opinion
In our opinion, to the best of our information and according to the explanations given to us the Company has, in all material respects, an adequate internal financial controls system over financial reporting and such internal financial controls over financial reporting were operating effectively as at 31 March 2017, based on the internal control over financial reporting criteria established by the Company considering the essential components of internal control stated in the Guidance Note on Audit of Internal Financial Controls Over Financial Reporting issued by the Institute of Chartered Accountants of India.
(i) (a) The Company has maintained proper records showing full particulars, including quantitative details and situation of fixed assets/property, plant and equipment.
(b) Some of the fixed assets/property, plant & equipment were physically verified during the year by the Management in accordance with a programme of verification which, in our opinion provides for physical verification of all the fixed assets at reasonable intervals. According to the information and explanations given to us, no material discrepancies were noticed on such verification.
(c) With respect to immovable properties of acquired land and buildings that are freehold, according to the information and explanationsgiventousandtherecordsexaminedbyusandbasedontheexaminationofregisteredsaledeeds/Hon'bleMadrasHighCourt'sOrderapprovingschemeofmergerprovidedtous,wereportthat,thetitledeedsofsuchimmovableproperties are held in the name of the Company as at the balance sheet date.
(ii) As explained to us, the inventories were physically verified during the year by an external firm of Chartered Accountants at reasonable intervals and no material discrepancies were noticed on physical verification.
(iii) The Company has not granted any loans, secured or unsecured, to companies, firms, Limited Liability Partnerships or other parties covered in the register maintained under Section 189 of the Companies Act, 2013.
(iv) In our opinion and according to the information and explanations given to us, the Company has complied with the provisions of Sections 185 and 186 of the Companies Act, 2013 in respect of grant of loans, making investments and providing guarantees and securities, as applicable.
(v) In our opinion and according to the information and explanations given to us, the Company has not accepted any deposit during the year. There are no unclaimed deposits outstanding at any time during the year.
(vii) According to the information and explanations given to us, in respect of statutory dues:
(a) The Company has been regular in depositing undisputed statutory dues, including Provident Fund, Employees' StateInsurance, Income-tax, Sales Tax, Service Tax, Customs Duty, Excise Duty, Value Added Tax, Cess and other material statutory dues applicable to it to the appropriate authorities.
(b) TherewerenoundisputedamountspayableinrespectofProvidentFund,Employees'StateInsurance,Income-tax,SalesTax, Service Tax, Customs Duty, Excise Duty, Value Added Tax, Cess and other material statutory dues in arrears as at 31 March, 2017 for a period of more than six months from the date they became payable.
(c) Details of dues of Sales Tax, Value Added Tax, Customs Duty and Service Tax which have not been deposited as on 31 March, 2017 on account of disputes are given below:
Name of Statute Nature of Dues
Forum where dispute is Pending Period to which the amount relates
Disputed Amount Involved
(` in lakhs)
Unpaid Amount
(` in lakhs)
CUSTOMS ACT, 1962
Customs duty Customs Excise and Service Tax Appellate Tribunal, Chennai
2007-2008 15.27 15.27
THEFINANCEACT,1994
Service tax Customs Excise and Service Tax Appellate Tribunal, New Delhi
(viii) In our opinion and according to the information and explanations given to us, the Company has not defaulted in the repayment of loans or borrowings to financial institutions and banks. The Company has not taken any loans or borrowings from government and have not issued any debentures.
(ix) The Company has not raised monies by way of initial public offer or further public offer (including debt instruments) or term loans and hence reporting under clause (ix) of the CARO 2016 Order is not applicable.
(x) To the best of our knowledge and according to the information and explanations given to us, no fraud by the Company and no material fraud on the Company by its officers or employees have been noticed or reported during the year.
(xi) In our opinion and according to the information and explanations given to us, the Company has paid / provided managerial remuneration in accordance with the requisite approvals mandated by the provisions of section 197 read with Schedule V to the Companies Act, 2013.
(xii) The Company is not a Nidhi Company and hence reporting under clause (xii) of the CARO 2016 Order is not applicable.
(xiii) In our opinion and according to the information and explanations given to us the Company is in compliance with Section 177 and 188 of the Companies Act, 2013, where applicable, for all transactions with the related parties and the details of related party transactions have been disclosed in the financial statements as required by the applicable accounting standards.
(xiv) During the year the Company has not made any preferential allotment or private placement of shares or fully or partly convertible debentures and hence reporting under clause (xiv) of CARO 2016 is not applicable to the Company.
(xv) In our opinion and according to the information and explanations given to us, during the year the Company has not entered into any non-cash transactions with its directors or directors of its subsidiaries or associate company or persons connected with them and hence provisions of Section 192 of the Companies Act, 2013 are not applicable.
(xvi) The Company is not required to be registered under Section 45-IA of the Reserve Bank of India Act, 1934.
Place: Chennai Date: 25 May, 2017
For Deloitte Haskins & Sells Chartered Accountants
(Firm'sRegistrationNo.008072S)
M K Ananthanarayanan Partner
(Membership No. 19521)
Annual Report
2016–201791
Annual Report
2016–201790
In terms of our report attached For and on behalf of the Board of Directors
For Deloitte Haskins & Sells Chartered Accountants
M K Ananthanarayanan Raj Shankar E H Kasturi Rangan Partner Managing Director Whole-Time Director (DIN-00238790) (DIN-01814089)
S V Krishnan M Muthukumarasamy Chief Financial Officer Company SecretaryPlace : Chennai Date : May 25, 2017
Trade receivables 11 188,985.30 145,846.82 130,420.99 Cash and cash equivalents 12 6,448.80 4,972.97 2,579.10 Other Bank balances 13 560.34 6.43 499.94 Loans 14 4,390.00 5,201.04 4,949.55 Other financial assets 15 563.05 465.32 483.02
Other current assets 16 4,482.47 6,577.57 10,052.36 Total current assets 358,266.03 311,757.25 238,643.47 Assets classified as held for sale 3 1,850.54 - - Total Assets 439,712.56 390,690.68 307,646.47
EQUITY AND LIABILITIESEquity
Share capital 17 7,996.97 7,996.26 7,994.06 Other equity 18 146,629.90 145,847.21 135,889.89
Total equity 154,626.87 153,843.47 143,883.95 LiabilitiesNon-current liabilitiesProvisions 19 776.89 688.32 729.61 Total non-current liabilities 776.89 688.32 729.61 Current liabilitiesFinancial Liabilities:
Provisions 23 189.06 200.57 724.37 Other current liabilities 24 20,907.47 21,760.48 20,547.01 Total current liabilities 284,308.80 236,158.89 163,032.91 Total Liabilities 285,085.69 236,847.21 163,762.52 Total Equity and Liabilities 439,712.56 390,690.68 307,646.47 See accompanying notes forming part of the financial statements
Balance Sheet as at March 31, 2017
In terms of our report attached For and on behalf of the Board of Directors
For Deloitte Haskins & Sells Chartered Accountants
M K Ananthanarayanan Raj Shankar E H Kasturi Rangan Partner Managing Director Whole-Time Director (DIN-00238790) (DIN-01814089)
S V Krishnan M Muthukumarasamy Chief Financial Officer Company SecretaryPlace : Chennai Date : May 25, 2017
Statement of Profit and Loss for the year ended March 31, 2017(` in Lakhs)
Particulars Note No.Year Ended
March 31, 2017Year Ended
March 31, 2016Revenue from operations 25 1,543,179.97 1,263,815.43
Other income 26 4,894.78 3,582.49
Total Income 1,548,074.75 1,267,397.92
Expenses
Purchases of traded goods 1,472,871.18 1,254,879.96
Changes in inventories of traded goods (4,148.97) (59,028.59)
Employee benefits expense 27 11,246.00 9,374.11
Finance costs 28 7,955.74 8,237.28
Depreciation and amortisation expense 3&4 1,100.19 1,002.60
Other expenses 29 28,958.46 24,386.44
Total Expenses 1,517,982.60 1,238,851.80
Profit before tax 30,092.15 28,546.12
Tax expense
Current tax 9,454.10 9,865.00
Deferred tax 469.58 (190.69)
Profit for the year (A) 20,168.47 18,871.81
Other comprehensive income
Items that will not be reclassified to Profit or loss
Remeasurements of the defined benefit plans (124.77) (0.57)
Income Tax relating to item above 43.18 0.20
Net Other Comprehensive Income that will not be reclassified to profit or loss
(81.59) (0.37)
Items that may be reclassified to Profit or loss
Foreigncurrencytranslationadjustment (18.57) 7.10
Income Tax relating to item above - -
Net Other Comprehensive Income that may be reclassified to Profit or loss
(18.57) 7.10
Total other comprehensive income (B) (100.16) 6.73
Total comprehensive income for the year (A+B) 20,068.31 18,878.54
Earnings per equity share: (Face value ` 2 each) 30
Basic (in ` ) 5.04 4.72
Diluted (in ` ) 5.04 4.72
See accompanying notes forming part of the financial statements
Annual Report
2016–201793
Annual Report
2016–201792
Cash Flow Statement for the year ended March 31, 2017(` in Lakhs)
ParticularsYear Ended
March 31, 2017Year Ended
March 31, 2016A. Cash flow from operating activities:Profit for the year after tax 20,168.47 18,871.81 Adjustmentsfor:
- Income tax expense recognised in profit and loss 9,923.68 9,674.31 - Depreciation and amortisation expense 1,100.19 1,002.60 - Finance costs 7,955.74 8,237.28 - Interest income (2,115.44) (1,989.01) - Allowance for doubtful receivables 621.08 1,739.80 - Provision for warranty 145.20 180.20 - Dividend from subsidiaries (2,050.48) (698.26) - Income from short term investments (148.35) (118.01) - Unrealised exchange loss/ (gain) (net) 258.31 (712.26) - Gain on sale of Property, Plant and Equipment (net) (44.92) (57.94)
Operating Profit before working capital changes 35,813.48 36,130.52 Increase in trade receivables (43,759.56) (17,165.63)Increase in inventories (4,148.97) (59,028.59)Decrease in other assets 2,506.06 3,208.29 Increase in trade payables 26,988.70 55,937.09 Increase/(decrease) in provisions 77.06 (565.09)Decrease in other liabilities (1,826.27) (3,558.08)Cash generated from operations 15,650.50 14,958.51 Income taxes paid (net) (9,834.02) (12,039.83)Net cash generated from operating activities 5,816.48 2,918.68 B. Cash flow from investing activities:Payments for Property, Plant and Equipment (2,263.96) (1,498.58)Payments for intangible assets - (11.14)Proceeds from sale of Property, Plant and Equipment 103.96 103.54 Interest received 2,078.79 1,566.71 Dividends received from subsidiaries 2,050.48 698.26 Income received from short term investments 148.35 118.01 Loans and advances given to subsidiaries & associate (17,453.04) (20,870.00)Loans and advances settled by subsidiaries & associate 18,264.08 20,779.51 Changes in bank deposits not treated as cash and cash equivalents (553.91) 493.51 Investments in subsidiaries (1,500.48) (6,748.60)Net cash generated from/(used in) investing activities 874.27 (5,368.78)C. Cash flow from financing activities:Proceeds from short term borrowings (net) 22,032.84 21,890.30 Proceeds from allotment of shares, including premium, under ESOP, 2008 27.94 80.38 Dividends paid (including dividend tax) (19,308.94) (8,997.91)Finance costs paid (7,966.76) (8,128.80)Net cash (used in)/ generated from financing activities (5,214.92) 4,843.97 Net increase in cash and cash equivalents 1,475.83 2,393.87 Cash and cash equivalents at the beginning of the year 4,972.97 2,579.10 Cash and cash equivalents at the end of the year (Refer Note No:12) 6,448.80 4,972.97 See accompanying notes forming part of financial statements
In terms of our report attached For and on behalf of the Board of Directors
For Deloitte Haskins & Sells Chartered Accountants
M K Ananthanarayanan Raj Shankar E H Kasturi Rangan Partner Managing Director Whole-Time Director (DIN-00238790) (DIN-01814089)
S V Krishnan M Muthukumarasamy Chief Financial Officer Company SecretaryPlace : Chennai Date : May 25, 2017 S
tate
men
t o
f C
hang
es in
Eq
uity
fo
r th
e ye
ar e
nded
Mar
ch 3
1, 2
017
` in
Lak
hs
Othe
r Equ
ity
Part
icul
ars
Shar
e Ca
pita
lSe
curit
ies
Prem
ium
Gene
ral R
eser
ve
Fore
ign
Curr
ency
Tr
ansl
atio
n Re
serv
e
Retir
emen
t Be
nefit
Ob
ligat
ion
Rese
rve
Surp
lus
in th
e St
atem
ent o
f Pr
ofit a
nd L
oss
Tota
l Equ
ity
Bal
ance
as
at A
pril
1, 2
015
7,99
4.06
3
5,37
4.35
9,
030.
13
1.38
-
9
1,48
4.03
1
43,8
83.9
5
Pro
fit fo
r th
e ye
ar -
-
-
-
-
1
8,87
1.81
1
8,87
1.81
Oth
er C
ompr
ehen
sive
Inco
me
for
the
year
(net
of t
axes
) -
-
-
7.
10
(0.3
7) -
6
.73
Tota
l co
mp
rehe
nsiv
e in
com
e fo
r th
e ye
ar -
-
-
7.
10
(0.3
7) 1
8,87
1.81
18
,878
.54
Allo
tmen
t of s
hare
s un
der
Em
ploy
ee S
tock
Opt
ion,
200
82.
20
78.
18
-
-
-
-
80.
38
Fina
l div
iden
d pa
id -
-
-
-
-
(7
,595
.32)
(7,5
95.3
2)
Div
iden
d di
strib
utio
n ta
x pa
id o
n fin
al d
ivid
end
-
-
-
-
-
(1,4
32.7
1) (1
,432
.71)
Div
iden
d di
strib
utio
n ta
x cr
edit
on a
ccou
nt o
f div
iden
d re
ceiv
ed fr
om s
ubsi
diar
y -
-
-
-
-
2
8.63
2
8.63
Bal
ance
as
of
Mar
ch 3
1, 2
016
7,99
6.26
3
5,45
2.53
9,
030.
13
8.48
(0
.37)
101
,356
.44
153
,843
.47
Bal
ance
as
at A
pril
1, 2
016
7,99
6.26
3
5,45
2.53
9
,030
.13
8.4
8 (0
.37)
101
,356
.44
153
,843
.47
Pro
fit fo
r th
e ye
ar-
-
- -
- 2
0,16
8.47
2
0,16
8.47
Oth
er c
ompr
ehen
sive
inco
me
for
the
year
(net
of t
axes
)-
-
- (1
8.57
)(8
1.59
) -
(1
00.1
6)
Tota
l co
mp
rehe
nsiv
e in
com
e fo
r th
e ye
ar-
-
- (1
8.57
)(8
1.59
)20
,168
.47
20,0
68.3
1
Allo
tmen
t of s
hare
s un
der
Em
ploy
ee S
tock
Opt
ion,
200
8 0
.71
27.
23
- -
- -
2
7.94
Fina
l div
iden
d pa
id-
-
- -
- (8
,396
.07)
(8,3
96.0
7)
Spe
cial
(Int
erim
) Div
iden
d pa
id (F
Y 2
016-
17)
- -
-
- -
(7,9
96.9
7) (7
,996
.97)
Div
iden
d di
strib
utio
n ta
x pa
id-
-
- -
- (3
,195
.09)
(3,1
95.0
9)
Div
iden
d di
strib
utio
n ta
x cr
edit
on a
ccou
nt o
f div
iden
d re
ceiv
ed fr
om s
ubsi
diar
ies
- -
-
- -
275
.28
275
.28
Bal
ance
as
at M
arch
31,
201
77,
996.
97
35,
479.
76
9,03
0.13
(1
0.09
) (8
1.96
) 1
,02,
212.
06
1,5
4,62
6.87
See
acc
ompa
nyin
g no
tes
form
ing
part
of t
he fi
nanc
ial s
tate
men
ts
In t
erm
s o
f o
ur r
epo
rt a
ttac
hed
F
or
and
on
beh
alf
of
the
Bo
ard
of
Dire
cto
rs
Fo
r D
elo
itte
Has
kins
& S
ells
Cha
rter
ed A
ccou
ntan
ts
M K
Ana
ntha
nara
yana
n R
aj S
hank
ar
E H
Kas
turi
Ran
gan
P
artn
er
Man
agin
g D
irect
or
Who
le-T
ime
Dire
ctor
(D
IN-0
0238
790)
(D
IN-0
1814
089)
S V
Kri
shna
n M
Mut
huku
mar
asam
y
C
hief
Fin
anci
al O
ffice
r C
ompa
ny S
ecre
tary
Pla
ce :
C
henn
ai
Dat
e :
May
25,
201
7
Annual Report
2016–201795
Annual Report
2016–201794
Notes to financial statements for the Year Ended March 31, 2017
1. Company Overview
Redington (India) Limited (“the Company”), is a public limited Company domiciled in India and incorporated under the provisions of the Companies Act,1956. The Company’s equity shares are listed on the bourses of BSE Limited and National Stock Exchange of India Limited. The Company engaged in the business of Information Technology and Mobility product distribution besides supply chain solutions and after sales service. The Company has an operating branch in Singapore. The Company, its subsidiaries and associate operate in India, Middle East, Turkey, Africa, and South Asian countries.
2.1 a. Statement of Compliance:
The financial statements have been prepared in accordance with Ind AS notified under the Companies (Indian Accounting Standards) Rules, 2015. Upto the year ended March 31, 2016 the Company prepared its financial statements in accordance with the requirements of previous GAAP, which includes Standards notified under the Companies (Accounting Standards) Rules, 2006. These are the Company’s first Ind AS financial statements. The date of transition to Ind AS is April 1, 2015. Refer Note 47 for the details of first-time adoption exemptions availed by the Company.
b. Critical Judgments
i. Revenue Recognition
The Company has considered the detailed criteria for the recognition of revenue from the sale of goods and from rendering of services set out in Ind AS 18 Revenue and in particular whether the Company has transferred the risks and rewards of ownership of the goods and whether it is probable that the economic benefits associated with the transaction will flow to the Company. Based on the acceptance by the customer of the liability for the goods sold and services rendered, the Company is satisfied that the significant risks and rewards have been transferred and that it is probable that the economic benefits associated with the transaction will flow to the Company and the recognition of the revenue is appropriate.
ii. Useful lives of Property, Plant and Equipment
The cost of Property, Plant and Equipment is depreciated over the estimated useful life, which is based on expected usage of the asset, expected physical wear and tear, the repair and maintenance program and technological obsolescence arising from changes and the residual value.
c. Recent Accounting Pronouncements - Recent Standards Issued but not effective
In March 2017, the Ministry of Corporate Affairs issued the Companies (Indian Accounting Standards) (Amendments) Rules,2017,notifyingamendments to IndAS7, 'Statementofcashflows'and IndAS102, 'Share-basedpayment'.These amendments are in accordance with the recent amendments made by International Accounting Standards Board (IASB) to IAS7, 'Statementof cash flows' and IFRS2, 'Share-basedpayment', respectively. The first amendment isapplicable to the Company from April 1, 2017.
Amendment to Ind AS 7:
The amendment to Ind AS 7 requires the Company to provide disclosures that enable users of financial statements to evaluate changes in liabilities arising from financing activities, including both changes arising from cash flows and non-cash changes, suggesting inclusion of a reconciliation between the opening and closing balances in the balance sheet for liabilities arising from financing activities, to meet the disclosure requirement.
Amendment to Ind AS 102:
The amendment to Ind AS 102 provides specific guidance to measurement of cash-settled awards, modification of cash-settled awards and awards that include a net settlement feature in respect of withholding taxes. It clarifies that the fair value of cash-settled awards is determined on a basis consistent with that used for equity-settled awards. Market-basedperformanceconditionsandnon-vestingconditionsarereflectedinthe'fairvalues',butnon-marketperformanceconditions and service vesting conditions are reflected in the estimate of the number of awards expected to vest. Also, the amendment clarifies that if the terms and conditions of a cash-settled share-based payment transaction are modified with the result that it becomes an equity-settled share-based payment transaction, the transaction is accounted for as such from the date of the modification. Further, the amendment requires the award that includes a net settlement feature in respect of withholding taxes to be treated as equity-settled in its entirety. The cash payment to the tax authority is treated as if it was part of an equity settlement.
2.2 Basis of preparation of financial statements
The financial statements of the Company have been prepared in accordance with the Indian Accounting Standard (Ind AS) to comply with the Accounting Standards specified under Section 133 of the Companies Act, 2013 ("the Act") read with Rule 3 of the Companies (Indian Accounting Standards) Rules 2016 and the relevant provisions of the Act, as applicable. Being first Ind AS financial statements, the Company has adopted all the applicable Ind AS Standards in accordance with First time AdoptionofIndianAccountingStandards(IndAS101)andtheimpactontransitionhasbeenadjustedtotheReservesasatApril 1, 2015. Refer Note No. 47.1 for adoption of Ind AS by the Company.
The financial statements have been prepared on accrual basis under the historical cost convention except for:
Lease deposits, the initial fair value of which is estimated at the present value of the deposit, are discounted using the prevailing market rate of Government securities. The difference between the initial fair value and the refundable amount of the deposit is recognized as lease rent over the lease period.
The accounting policies adopted in the preparation of the Financial Statements are in line with Ind AS.
2.3 Summary of Significant Accounting Policies
a. Use of Estimates / judgements
The preparation of the financial statements in conformity with Ind AS requires the Management to make estimates and judgements considered in the reported amounts of assets and liabilities (including contingent assets and contingentliabilities)andthereportedincomeandexpensesduringtheyear.TheManagementbelievesthattheestimates/judgementsused in the preparation of the financial statements are prudent and reasonable. Future results could differ due to these estimates and the differences between the actual results and the estimates are recognised in the periods in which the results are known / materialise.
b. Property, Plant and Equipment:
Property, Plant and Equipment except Capital work in progress is stated at cost, net of accumulated depreciation and impairment losses, if any. Capital work in progress is stated at cost less any recognised impairment loss. Cost comprises of purchase price and other directly attributable cost of bringing the assets to its working condition for the intended use. Subsequent costs are included in the asset’s carrying amount or recognised as a separate asset, as appropriate, only when it is probable that future economic benefits associated with the item will flow to the Company and the cost of the item can be measured reliably.
Gains or losses arising from derecognition of Property, Plant and Equipment are measured as the difference between the net proceeds from disposal/net realisable value and carrying amount of the asset and are recognised in the Statement of Profit and Loss. All other repairs and maintenance costs are charged to the Statement of Profit and Loss as and when incurred.
Depreciation on Property, Plant and Equipment:
1. Depreciable amount for assets is the cost of an asset, or other amount substituted for cost, less its estimated residual value.
2. Depreciation on Property, Plant and Equipment has been provided on the straight-line method as per the useful life prescribed in Schedule II to the Companies Act, 2013 or technical estimate made by the Company, whichever is lower.
Class of Asset Years
Buildings 20
Plant & Equipment 5
Furniture & Fixtures 4
Office Equipment 5
Computers 3
Vehicles 5
3. Depreciation on additions to assets is provided from the month of addition.
4. Individual assets whose cost does not exceed ` 5,000/- are fully depreciated in the month of addition.
5. Expenditure on Interiors on premises taken on lease (included in furniture & fixtures) are capitalized and depreciated not exceeding five years.
Annual Report
2016–201797
Annual Report
2016–201796
c. Intangible assets
1. Intangible assets are stated at cost less accumulated amortization and impairment losses, if any.
2. Intangible assets are amortized on straight line basis over a period of three years.
3. The estimated useful life of the intangible assets and the amortisation period are reviewed at the end of each financial year and the amortisation period is revised to reflect the changed pattern, if any.
4. An intangible asset is de-recognized on disposal, or when no future economic benefits are expected from its use or disposal. Gains or losses arising from de-recognition of an intangible asset, measured as the difference between the net disposal proceeds and the carrying amount of the asset are recognized in the statement of profit and loss when the asset is de-recognized.
d. Impairment of Intangible Assets and Property, Plant and Equipment:
At each reporting date, the Company assesses whether there is any indication that an asset with finite lives may be impaired. If there is any indication of impairment exists, the recoverable amount of the asset is estimated in order to determine the extent of the impairment if any. The recoverable amount is determined for an individual asset, unless the asset does not generate cash inflows that are largely independent of those from other assets or group of assets. Where it is not possible to estimate the recoverable amount of individual asset, the Company estimates the recoverable amount of cash-generating unit to which the asset belongs.
e. Leases
Leases, where the lessor effectively retains substantially all the risks and rewards incidental to ownership of the leased item are classified as operating leases. Lease Rentals under operating leases are recognised in the Statement of Profit and Loss on a systematic basis.
f. Investments
Investments in Subsidiaries and Associate are accounted at cost in accordance with Ind AS 27.
g. Inventories
Inventories are stated at lower of cost and the net realizable value. Costs includes cost of purchase and other costs incurred in bringing the inventories to the present location and condition, net of discounts and rebates and is determined on weighted average basis. Net realisable value represents the estimated selling price for inventories less all estimated costs of completion and the costs necessary to make the sale.
h. Foreign Currency Transactions
On initial recognition, all foreign currency transactions are stated by applying to the foreign currency amount the exchange rate as on the date of the transaction. Gains or losses on settlement of import payments are accounted under appropriate heads and grouped as part of cost of goods sold in the statement of profit and loss.
All monetary assets and liabilities in foreign currency are restated at the end of the accounting period at the prevailing exchange rates as on the reporting date and exchange gain/loss is considered in the Statement of Profit and Loss.
For Branch operations: Transactions of branch operations are translated at the exchange rates prevailing on the date of the transaction or at rates that closely approximate the rate at the date of the transaction. All assets and liabilities are translated at the closing rates and resulting exchange differences are debited / credited to Other Comprehensive income and included under Foreign Currency Translation Reserve (“FCTR”) as a component of Equity
i. Warranties
The Original Equipment Manufacturer generally warrants the products distributed by the Company. In a few cases, as per the terms of the contracts, the Company provides post-contract services / warranty support to its customers. The Company accounts for the post-contract support / provision for warranty on the basis of the information available with the Management duly taking into account the current and past technical estimates.
j. Revenue Recognition
1. Revenue from Sales is recognized when the significant risks and rewards of ownership and title is transferred which generally coincides with delivery. While recognizing revenue, management has considered the detailed criteria for the recognition of revenue from the sale of goods set out in Ind AS 18 and in particular whether the Company has transferred the risks and rewards of ownership of the goods and whether it is probable that the economic benefits associated with the transaction will flow to the Company. Revenue from sales is stated net of discounts, rebates and sales tax.
2. Service Income is recognized when services are rendered. Income from Warranty and Maintenance Contracts is recognized as per the terms of contract.
3. Income from supplier schemes is accrued, based on fulfillment of terms of such programs.
k. Other Income
1. Dividend from investments is recognized when the right to receive the payment is established and when no significant uncertainty as to measurability or collectability exists.
2. Rental Income arising from operating leases is accounted for over the lease terms. It is accrued, based on the transfer of right to use the premises or location of the leased property, over the lease period
3. Interest income is recognised on the time proportion basis determined by the amount outstanding and the rate applicable and where no significant uncertainty as to measurability or collectability exists. Interest income on overdue receivables is recognized only when there is a certainty of receipt.
l. Employee Benefits
1. Short-term Employee Benefits
Short-term employee benefits including accumulated short-term compensated absences determined as per Company’s policy/scheme are recognized at the reporting date as expense based on the expected obligation on an undiscounted basis.
2. Long-term Employee Benefits
Defined Benefit Plan
Compensated Absences & Gratuity
The liability for Gratuity and long term compensated absences, both unfunded, is provided based on actuarial valuation asat thereportingdate,usingtheProjectedUnitCreditMethod.Actuarialgainsand lossesarerecognised in thebalance sheet with a corresponding debit or credit through Other Comprehensive Income for the period in which they occur. The retirement benefit obligation recognized in the Balance Sheet represents the present value of the estimated future cash outflows expected to be made by the Company in respect of services provided by the employees upto the reporting date .
Defined Contribution Plan
Contribution under statutory laws relating to employee benefits, including Provident Fund and Employee State Insurance, is made in accordance with the respective Acts and is charged to the Statement of Profit and Loss as and when services are rendered by the employees.
m. Employee share based payments
Equity-settled share-based payments are measured at the fair value of the equity instruments at the grant date. The fair value determined at the grant date of the equity-settled share-based payments is expensed on a straight-line basis over thevestingperiod,basedontheCompany'sestimateofequityinstrumentsthatwilleventuallyvest,withacorrespondingincrease in equity.
n. Current and deferred tax
i. Tax expense for the year, comprising current tax and deferred tax, are included in the determination of the net profit for the year except when they relate to items that are recognised in other comprehensive income or directly in equity, in which case, the current and deferred tax are also recognised in other comprehensive income or directly in equity respectively.
ii. Current tax is the amount of tax payable on the taxable income for the year as determined in accordance with the applicable tax rates under the provisions of the Income Tax Act, 1961.
iii. Deferred tax is recognised on temporary differences between the carrying amounts of assets and liabilities in the financial statements and the corresponding tax bases used in the computation of taxable profit. Deferred tax liabilities are recognised for all taxable temporary differences. Deferred tax assets are recognized for all deductible temporary differences to the extent that it is probable that taxable profits will be available against which those deductible temporary differences can be utilized.
o. Provisions, Contingent Liabilities and Contingent Assets:
Provisions are recognized when the Company has a present obligation (legal or constructive) as a result of past event, it is probable that the Company will be required to settle the obligation, and a reliable estimate can be made of the amount of the obligation.
Annual Report
2016–201799
Annual Report
2016–201798
Contingent liability is disclosed for all
i. Possible obligation that arises from past events and whose existence will be confirmed only by the occurrence or non-occurrence of one or more uncertain future events not wholly within the control of the Company (or)
ii. Present obligations arising from past events where it is not probable that an outflow of resources embodying economic benefits will be required to settle the obligation or a sufficiently reliable estimate of the amount of the obligation cannot be made.
Contingent asset if any are disclosed in the financial statements if a possible asset that arises from past events and whose existence will be confirmed only by the occurrence or non-occurrence of one or more uncertain future events not wholly within the control of the Company.
p. Cash and cash equivalents
Cash comprises cash on hand and demand deposits with banks. Cash equivalents are short-term, highly liquid investments thatarereadilyconvertibleintoknownamountsofcashandwhicharesubjecttoinsignificantrisksofchangesinrate.
q. Cash flow statement
Cashflowsarereportedusingtheindirectmethod,wherebyProfitaftertaxisadjustedfortheeffectsoftransactionsofnon-cash nature and any deferrals or accruals of past or future cash receipts or payments. The cash flows from operating, investing and financing activities of the Company are segregated based on the nature of transaction.
r. Earnings per share
Basic earnings per share is computed by dividing the profit after tax by the weighted average number of equity shares outstanding during the year.
Dilutedearningspershareiscomputedbydividingtheprofitaftertaxasadjustedfordividend,interestandotherchargesto expense or income (net of any attributable taxes) relating to the dilutive potential equity shares, by the weighted average number of equity shares considered for deriving basic earnings per share and the weighted average number of equity shares which would have been issued on the conversion of all dilutive potential equity shares.
Potential equity shares are deemed to be dilutive only if their conversion to equity shares would decrease the net profit per share from continuing operations. Potential dilutive equity shares are deemed to be converted as at the beginning of theperiod,unlesstheyhavebeenissuedatalaterdate.Thedilutivepotentialequitysharesareadjustedfortheproceedsreceivable had the shares been actually issued at average market value of the outstanding shares. Dilutive potential equity shares are determined independently for each period presented. The number of equity shares and potentially dilutive equitysharesareadjustedforsharesplits/reversesharesplitsandbonusshares,asappropriate.
s. Derivative Financials instruments
The Company uses foreign currency forward contracts to hedge its risks associated with foreign currency fluctuations relating to certain firm commitments and highly probable forecast transactions. The Company does not hold derivative financial instruments for speculative purposes. Forward contracts are initially recognised at transaction value on the date the contract is entered into and are subsequently re-measured to Mark to Market (MTM) at each reporting date. The resulting gain or loss is recognised in the statement of profit and loss.
t. Dividend to Shareholders
Dividend distributed to Equity shareholders is recognised in the period in which it is approved by the members of the Company in the Annual General Meeting. Interim dividend is recognised when approved by the Board of Directors at the Board Meeting. Both dividend and Interim dividend are recognised in the Statement of Changes in Equity.
u. Fair value measurement:
Fair value is the price that would be received to sell an asset or paid to transfer a liability in orderly transactions between market participants at the time of measurement date. The fair value of an asset or a liability is measured using the assumptions that market participants would use when pricing the asset or liability at the measurement date, assuming that market participants act in their economic best interest. Fair value for measurement and /or disclosure purpose in these financial statements is determined on such basis, except for share based payment transactions that are within the scope of Ind AS 102, leasing transactions that are within the scope of Ind AS 17, and measurements that have some similarities to fair value but are not fair value, such as net realizable value in Ind AS 2 or value used in Ind AS 36.
Fair value hierarchy
The following details provide an analysis of financial instruments that are measured subsequent to initial recognition at fair value, grouped into Levels 1 to 3 based on the degree to which the fair value is observable and the significance of the inputs to the fair value measurement in its entirety:
• Level1 fair valuemeasurementsare thosederived fromquotedprices (unadjusted) inactivemarkets for identicalassets or liabilities.
• Level2fairvaluemeasurementsarethosederivedfrominputsotherthanquotedpricesincludedwithinLevel1thatare observable for the asset or liability, either directly (i.e. as prices) or indirectly (i.e. derived from prices).
• Level3fairvaluemeasurementsarethosederivedfromvaluationtechniquesthatincludeinputsfortheassetorliabilitythat are not based on observable market data (unobservable inputs).
v. Financial instruments:
Financial assets and financial liabilities are recognized when the Company becomes a party to the contractual provisions of the instrument.
Financial assets and financial liabilities are initially measured at fair value. Transaction costs that are directly attributable to the acquisition or issue of financial assets and financial liabilities (other than financial assets and financial liabilities at fair value through profit or loss) are added to or deducted from the fair value of the financial assets or financial liabilities, as appropriate, on initial recognition. Transaction costs directly attributable to the acquisition of financial assets or financial liabilities at fair value through profit or loss are recognised immediately in the statement of profit and loss.
(i). Financial assets:
Financial assets are classified into the following specified categories: financial assets ‘at fair value through profit or loss’ (FVTPL)/financial assets at amortized cost. The classification depends on the nature and purpose of the financial assets and is determined at the time of initial recognition.
Impairment of Financial assets
At every Balance sheet date the Company assesses whether financial assets carried at amortised costs are credit impaired. A financial asset is ‘credit impaired’ when one or more events that have a detrimental impact on the estimated future cash flows of the financial asset have occurred. For such assets, the Company measures loss allowances at an amount equal to lifetime expected credit losses
With respect to Trade receivables, lifetime expected credit losses are the expected credit losses that result from all possible default events over the expected life of a financial instrument. 12 month expected credit losses are the portion of expected credit losses that result from default events that are possible within 12 months after the reporting date (or a shorter period if the expected life of the instrument is less than 12 months). In all cases, the maximum period considered when estimating expected credit losses is the maximum contractual period over which the Company is exposed to credit risk.
When determining whether the credit risk of a financial asset has increased significantly since initial recognition and when estimating expected credit losses, the Company considers reasonable and supportable information that is relevant and available at appropriate cost or efforts.
FinancialassetscarriedatFVTPLareconsideredtobeimpairedwhenthereisobjectiveevidencethatasaresultofone or more events that occurred after the initial recognition of the financial asset, the estimated future cash flows of the investment have been affected.
Derecognition of Financial assets
The Company de-recognizes a financial asset only when the entire contractual rights to the cash flows from the asset expire;orittransfersthefinancialassetandsubstantiallyalltherisksandrewardsofownershipoftheassettoanotherentity. On de-recognition of a financial asset in its entirety, the difference between the asset’s carrying amount and the sum of the consideration received and receivable and the cumulative gain or loss that had been recognised in the Statement of Profit and Loss.
(ii). Financial liabilities and equity instruments:
Classification as debt or equity
Debt and equity instruments issued by the Company are classified as either financial liabilities or as equity in accordance with the substance of the contractual arrangements and the definitions of a financial liability and an equity instrument.
Annual Report
2016–2017101
Annual Report
2016–2017100
Equity instruments
An equity instrument is any contract that evidences a residual interest in the assets of an entity after deducting all of its liabilities. Equity instruments issued by the Company are stated at the proceeds received, net of direct issue costs if any.
Financial liabilities
Financial liabilities are classified as either financial liabilities ‘at FVTPL’ or financial liabilities carried at amortized cost and are recognized at fair value at the time of initial recognition and are subsequently measured at amortized cost using the effective interest rate method.
Financial liabilities at FVTPL
Financial liabilities are classified as at FVTPL when the financial liability is designated as a financial liability at FVTPL.
Financial liabilities subsequently measured at amortised cost:
Financial liabilities that are not held -for-trading and are not designated as at FVTPL are measured at amortised cost at the end of subsequent accounting periods. The carrying amounts of financial liabilities that are subsequently measured at amortised cost are determined based on the effective interest method. Interest expense that is not capitalised as part of costs of an asset is included under finance costs.
De-recognition of financial liabilities
The Company de-recognises financial liabilities when, and only when, the Company’s obligations are discharged, cancelled or expired. The difference between the carrying amount of the financial liability de-recognised and the consideration paid and payable is recognized in the statement of profit and loss.
Derivative financial instruments:
For accounting of Derivative financial instruments, refer Note: 2.3 (s)
w. Non-Current Assets held for sale:
Non-Current assets classified as held for sale are measured at lower of their carrying value and fair value less costs to sell.
3.
Pro
per
ty, P
lant
and
Eq
uip
men
t:`
in L
akhs
Des
crip
tion
Gro
ss C
arry
ing
val
ueA
ccum
ulat
ed D
epre
ciat
ion
Net
Car
ryin
g V
alue
As
at
01.0
4.16
#A
dd
itio
nsD
elet
ions
As
at
31.0
3.17
As
at
01.0
4.16
#F
or
the
Year
Del
etio
nsA
s at
31
.03.
17A
s at
31
.03.
17A
s at
31
.03.
16
Land
(Fre
eho
ld)
Cur
rent
yea
r3,
076.
46N
il1,
376.
68*
1,69
9.78
Nil
Nil
Nil
Nil
1,69
9.78
3,07
6.46
Pre
viou
s ye
ar3,
076.
46N
ilN
il3,
076.
46N
ilN
ilN
ilN
il3,
076.
463,
076.
46
Bui
ldin
gs
Cur
rent
yea
r4,
618.
781,
063.
90N
il5,
682.
6827
0.12
302.
34N
il57
2.46
5,11
0.22
4,34
8.66
Pre
viou
s ye
ar4,
618.
78N
ilN
il4,
618.
78N
il27
0.12
Nil
270.
124,
348.
664,
618.
78
Pla
nt a
nd M
achi
nery
Cur
rent
yea
r38
5.36
215.
5530
.89
570.
0210
7.10
111.
6827
.56
191.
2237
8.80
278.
26
Pre
viou
s ye
ar37
1.17
17.0
82.
8938
5.36
Nil
107.
10N
il10
7.10
278.
2637
1.17
Fur
nitu
re &
Fix
ture
s
Cur
rent
yea
r75
7.78
472.
5996
.45
1,13
3.92
264.
3924
9.38
90.8
842
2.89
711.
0349
3.39
Pre
viou
s ye
ar75
0.10
7.93
0.25
757.
78N
il26
4.39
Nil
264.
3949
3.39
750.
10
Offi
ce E
qui
pm
ent
Cur
rent
yea
r23
0.38
636.
3736
.20
830.
5561
.41
88.8
233
.62
116.
6171
3.94
168.
97
Pre
viou
s ye
ar20
6.67
24.8
11.
1023
0.38
Nil
61.4
1N
il61
.41
168.
9720
6.67
Co
mp
uter
s
Cur
rent
yea
r46
4.01
352.
9392
.11
724.
8315
1.28
196.
0386
.02
261.
2946
3.54
312.
73
Pre
viou
s ye
ar31
1.11
158.
946.
0446
4.01
Nil
151.
28N
il15
1.28
312.
7331
1.11
Vehi
cles
Cur
rent
yea
r50
4.07
321.
3712
8.13
697.
3110
2.25
141.
1286
.66
156.
7154
0.60
401.
82
Pre
viou
s ye
ar28
8.97
257.
2842
.18
504.
07N
il10
2.25
Nil
102.
2540
1.82
288.
97
Tota
l
Cur
rent
yea
r10
,036
.84
3,06
2.71
1,76
0.46
11,3
39.0
995
6.55
1,08
9.37
324.
741,
721.
189,
617.
919,
080.
29
Pre
vio
us y
ear
9,62
3.26
466.
0452
.46
10,0
36.8
4N
il95
6.55
Nil
956.
559,
080.
299,
623.
26
# In
clud
es A
dditi
on p
ursu
ant t
o th
e N
ook
Tran
sfer
(Ref
er N
ote:
43)
* B
ased
on
a M
emor
andu
m o
f Und
erta
king
for s
ale
ente
red
into
on
Apr
il 5,
201
7 fo
r sal
e of
land
situ
ated
at D
elhi
, the
cos
t of l
and
amou
ntin
g to
1
,376
.68
Lakh
s to
geth
er w
ith a
mou
nt
of `
473
.86
Lakh
s, re
pres
entin
g re
late
d ca
pita
l wor
k in
pro
gres
s, a
ggre
gatin
g to
` 1
,850
.54
Lakh
s ha
s be
en re
-cla
ssifi
ed a
s "A
sset
hel
d fo
r S
ale"
Annual Report
2016–2017103
Annual Report
2016–2017102
4.
Inta
ngib
le a
sset
s `
in L
akhs
Des
crip
tion
Gro
ss C
arry
ing
val
ueA
ccum
ulat
ed A
mo
rtis
atio
nN
et C
arry
ing
val
ue
As
at
01.0
4.16
#A
dd
itio
nsD
elet
ions
As
at
31.0
3.17
As
at
01.0
4.16
#F
or
the
Year
Del
etio
nsA
s at
31
.03.
17A
s at
31
.03.
17A
s at
31
.03.
16
So
ftw
are
Cur
rent
yea
r80
.60
Nil
Nil
80.6
046
.05
10.8
2N
il56
.87
23.7
334
.55
Pre
viou
s ye
ar69
.46
11.1
4N
il80
.60
Nil
46.0
5N
il46
.05
34.5
569
.46
Tota
l
Cur
rent
yea
r80
.60
Nil
Nil
80.6
046
.05
10.8
2N
il56
.87
23.7
334
.55
Pre
vio
us y
ear
69.4
611
.14
Nil
80.6
0N
il46
.05
Nil
46.0
534
.55
69.4
6
# In
clud
es A
dditi
on p
ursu
ant t
o th
e N
ook
Tran
sfer
(Ref
er N
ote:
43)
Dep
reci
atio
n/A
mo
rtis
atio
n
` in
Lak
hs
Cat
ego
ry
2016
-17
2015
-16
Pro
pert
y, P
lant
and
Equ
ipm
ent
1,08
9.37
956.
55
Inta
ngib
le a
sset
s10
.82
46.0
5
Tota
l1,
100.
191,
002.
60
5. Non-current Investments
Trade Investments
Investment in Equity of Subsidiaries and Associate - Unquoted
a. Investment in Indian Subsidiaries ` in Lakhs
Name of the Entity 31-Mar-2017 31-Mar-2016 1-Apr-2015
1,301,294 (31-Mar-2016 & 1-Apr-2015: 1,301,294) Equity Shares of ` 10/- each fully paid-up in Cadensworth (India) Limited (Refer Note No. 42)
612.27 612.27 612.27
7,243,230 (31-Mar-2016 & 1-Apr-2015: 4,550,000) Equity Shares of ` 10/- each fully paid-up in ProConnect Supply Chain Solutions Limited
1,955.48 455.00 455.00
4,500,000 (31-Mar-2016: 4,500,000 &1-Apr-2015: 2,050,000) Equity Shares of ` 10/- each fully paid-up in Ensure Support Services (India) Limited
450.00 450.00 205.00
Total 3,017.75 1,517.27 1,272.27
b. Investment in Overseas Subsidiaries ` in Lakhs
Name of the Corporate Body 31-Mar-2017 31-Mar-2016 1-Apr-2015
27,668,025 (31-Mar-2016: 27,668,025 & 1-Apr-2015: 26,700,987) Equity Shares of US$ 1 each fully paid-up in Redington International Mauritius Limited
3,800,000 (31-Mar-2016 & 1-Apr-2015: 3,800,000) Equity Shares of US$ 1 each fully paid-up in Redington Distribution Pte. Limited
1,762.81 1,762.81 1,762.81
Total 57,856.89 57,856.89 51,353.29
*Represents transfer of investment held in RedingtonGulf FZE by RIHL on July 10, 2013, to comply with the directive of theReserve Bank of India
c. Investment in associate: ` in Lakhs
Name of the Entity 31-Mar-2017 31-Mar-2016 1-Apr-2015
100,000 (31-Mar-2016 & 1-Apr-2015: 100,000) Equity Shares of ` 10/- each fully paid-up in Redington (India) Investments Limited 10.00 10.00 10.00
Total Investments 60,884.64 59,384.16 52,635.56
The Company has given undertakings on behalf of some of its subsidiaries to various banks/vendors, that it shall not dilute its shareholding in such subsidiaries below the agreed percentages.
6. Other Financial Asset:
` in Lakhs
Particulars 31-Mar-2017 31-Mar-2016 1-Apr-2015
Deposits 145.50 191.94 248.09
7. Income Taxes:
` in Lakhs
Particulars 31-Mar-2017 31-Mar-2016 1-Apr-2015
Income Tax (Net of Provisions) 5,335.19 4,955.27 2,780.44
Annual Report
2016–2017105
Annual Report
2016–2017104
Movement in Income Tax:
` in Lakhs
Particulars 31-Mar-2017 31-Mar-2016 1-Apr-2015
Balance at the beginning of the year 4,955.27 2,780.44 5,905.19
Add: Taxes paid (Net of Refunds) 9,834.02 12,039.83 5,717.87
Less: Provision during the year 9,454.10 9,865.00 8,842.62
Balance at the end of the year 5,335.19 4,955.27 2,780.44
Income tax expense recognized in Profit and loss
` in Lakhs
Particulars 2016-17 2015-16
Profit before tax (a) 30,092.15 28,546.12
Enacted Tax rate (b) 34.61% 34.61%
Income Tax expense (a*b) 10,414.90 9,879.81
Effect on exempted income (709.67) (241.67)
Effect on non-deductible expense 841.54 1,125.77
Effect on deductible claims (1,092.67) (898.91)
Effect of deferred taxes 469.58 (190.69)
Income Tax Expense recognized in Profit and loss 9,923.68 9,674.31
8. Deferred tax (net)
` in Lakhs
Particulars 31-Mar-2017 31-Mar- 2016 1-Apr-2015
i. Deferred Tax Assets:
Allowance for doubtful Trade Receivables 327.03 724.85 552.37
Provision for Gratuity 226.45 189.61 182.00
Provision for Compensated absences 61.07 87.87 87.00
Depreciation - 22.83 12.90
Total 614.55 1,025.16 834.27
ii. Deferred Tax Liabilities:
Depreciation 15.79 Nil Nil
Total 15.79 Nil Nil
Deferred Tax Assets (Net) 598.76 1,025.16 834.27
Movement in Deferred Tax:` in Lakhs
ParticularsBalance as on April 1, 2015
Recognised in the statement of profit and
loss
Recognised in the other
comprehensive income
Balance as on March 31, 2016
Deferred Tax Assets
Allowance for doubtful Trade Receivables 552.37 172.48 Nil 724.85
Provision for Gratuity 182.00 10.73 (3.12) 189.61
Provision for Compensated absences 87.00 (2.45) 3.32 87.87
Depreciation 12.90 9.93 Nil 22.83
Total 834.27 190.69 0.20 1,025.16
` in Lakhs
ParticularsBalance as on April 1, 2016
Recognised in the statement of profit and
loss
Recognised in the other
comprehensive income
Balance as on March 31, 2017
Deferred Tax Assets
Allowance for doubtful Trade Receivables 724.85 (397.82) Nil 327.03
Provision for Gratuity 189.61 1.36 35.48 226.45
Provision for Compensated absences 87.87 (34.50) 7.70 61.07
Depreciation 22.83 (38.62) Nil (15.79)
Total 1,025.16 (469.58) 43.18 598.76
Consequenttothesaleof theCompany's investment in itswhollyownedsubsidiaryEasyaccessFinancialServicesLimited inFY2013-14, there was a long term capital loss, under the Income Tax Act 1961, which resulted in a deferred tax asset of ` 1,310.48 Lakhs. Out of this ` 249.48 Lakhs was recognised against realised Long Term Capital Gains in an earlier year. The balance deferred tax asset of ` 1,061.00 Lakhs will be recognised as and when there is a long term capital gain.
9. Other Non-Current Assets:
` in Lakhs
Particulars 31-Mar-2017 31-Mar-2016 1-Apr-2015
Unsecured & Considered Good
Capital Advances 94.44 14.50 0.75
Receivable from Government authorities (Customs, Sales tax, Service tax, etc.)
2,845.42 2,844.61 2,433.86
Total 2,939.86 2,859.11 2,434.61
10. Inventories (Lower of cost and Net realizable value-Refer Note 2.3 (g))
` in Lakhs
Particulars 31-Mar-2017 31-Mar-2016 1-Apr-2015
Trading Stocks 117,925.50 116,964.75 78,011.77
Goods in Transit 34,910.57 31,722.35 11,646.74
Total 152,836.07 148,687.10 89,658.51
11. Trade receivables – Unsecured` in Lakhs
Particulars 31-Mar-2017 31-Mar-2016 1-Apr-2015
Trade receivables outstanding for a period exceeding six months from the date they were due for payment
Less :- Allowance for doubtful trade receivables 944.90 2,094.64 1,839.82
Total 188,985.30 145,846.82 130,420.99
Annual Report
2016–2017107
Annual Report
2016–2017106
Movement in the allowance for doubtful receivables` in Lakhs
Particulars 2016-17 2015-16
Balance at the beginning of the year 2,094.64 1,839.82
Allowance recognized during the year 621.08 1,739.80
Less: Allowance utilised for written-off 1,768.48 1,485.21
CurrencytranslationAdjustment (2.34) 0.23
Balance at the end of the year 944.90 2,094.64
Ageing of past due but not impaired:` in Lakhs
Particulars 31-Mar-2017 31-Mar-2016 1-Apr-2015
1-90 days overdue 22,962.50 24,344.93 24,670.42
91-180 days overdue 2,289.63 2,969.43 1,831.84
Over 180 days overdue 6,755.01 4,347.01 8,203.33
Total 32,007.14 31,661.37 34,705.59
In determining the recoverability of a trade receivable, the Company considers any change in the credit quality of the trade receivable from the date credit was initially granted up to the reporting date. The concentration of credit risk is limited due to the customer base being large and unrelated. Accordingly, the Company believes that there is no further credit allowance required in excess of the allowance for doubtful debts.
12. Cash and cash equivalents
` in Lakhs
Particulars 31-Mar-2017 31-Mar-2016 1-Apr-2015
Cash on hand 8.87 11.50 15.86
Balance in Current Account 6,439.93 4,961.47 2,563.24
Total 6,448.80 4,972.97 2,579.10
13. Other Bank balances
` in Lakhs
Particulars 31-Mar-2017 31-Mar-2016 1-Apr-2015
(i) In Deposit account 550.09 - -
(ii) In earmarked accounts
(a) Unclaimed Dividend account 10.25 6.34 4.85
(b) Unspent for Corporate Social Responsibility account - - 495.00
(c) Margin Money with Banks - 0.09 0.09
Total 560.34 6.43 499.94
14. Loans:` in Lakhs
Particulars 31-Mar-2017 31-Mar-2016 1-Apr-2015
Loan & Advances to related parties
Cadensworth (India) Limited Nil 2,600.03 2,200.00
Ensure Support Services (India) Limited 250.00 169.72 809.51
The above loans have been given for working capital / business purposes.
Particulars of maximum amount of loans and advances outstanding at any time during the year to Subsidiaries and Associates (disclosed pursuant to Regulation 34(3) of the SEBI (Listing Obligations and Disclosure Requirements) Regulations, 2015).
* During the year, the Company allotted 35,230 (FY 2015-16: 110,440, FY 2014-15: 220,970) Equity Shares of ` 2 each to eligible employees pursuant to exercise of options under the Employee Stock Option Plan at applicable premiums
Annual Report
2016–2017109
Annual Report
2016–2017108
iii. Terms/rights attached to equity shares;
Each holder of equity share is entitled to one vote per share. The Company declares and pays dividends in Indian rupees. For the year ended March 31, 2017 a dividend of ` 2.30 per equity share has been proposed by the Board of Directors (31-Mar-2016: ` 2.10, 1-Apr-2015 ` 1.90perequityshare).ThedividendproposedbytheBoardofDirectorsissubjecttotheapprovaloftheshareholdersat the ensuing Annual General Meeting.
iv. Details of shares held by shareholder holding more than 5% of the paid-up equity capital
Special (Interim) Dividend paid (FY 2016-17) 7,996.97 Nil Nil
Dividend Distribution Tax on Dividend paid 3,195.09 1,432.71 Nil
Dividend including Dividend distribution tax for previous year ( Refer note below)
Nil Nil 0.96
Dividend distribution tax credit on account of dividend received from subsidiaries
(275.28) (28.63) (94.76)
Balance at the end of the year 102,212.06 101,356.44 91,484.03
Total Other Equity 146,629.90 145,847.21 135,889.89
Subsequent to the date of balance sheet as on March 31, 2016, 2015 and 2014 but before the book closure date, Nil (March 31 2015-Nil, March 31, 2014- 90,900) equity shares were allotted under the employee stock option plan 2008 and dividend of Nil (March 31 2015 - Nil, March 31, 2014 - ` 0.81 Lakhs) on these shares were paid. The total amount of Nil (March 31 2015 - Nil, March 31, 2014 - ` 0.96 Lakhs) including tax on dividend has been appropriated from the Statement of Profit and Loss.
19. Provisions` in Lakhs
Particulars 31-Mar-2017 31-Mar-2016 1-Apr-2015
Compensated Absences 160.57 149.07 166.26
Gratuity 616.32 539.25 563.35
Total 776.89 688.32 729.61
Gratuity (included as part of Employee benefits in Note 27)
The Company’s obligation towards Gratuity is a Defined Benefit Plan and the details of actuarial valuation as at the year end is given below:
` in Lakhs
Particulars 2016-17 2015-16
Projected Benefit Obligation at the beginning of the year 570.46 559.49
Liability Transferred from Nook Micro Distribution Ltd. on account of Merger (Refer Note No: 43)
Nil 22.64
Total 570.46 582.13
Service cost 53.09 41.66
Liability Transferred to Ensure Support Services (India) Limited a wholly owned Subsidiary, due to transfer of employees
(11.87) Nil
Interest Cost 41.92 46.57
Actuarial Loss /(Gain) 102.51 (8.99)
Benefits paid (101.81) (90.91)
Projected Benefit Obligation at the end of the year 654.30 570.46
Liability recognized in the Balance Sheet 654.30 570.46
Annual Report
2016–2017111
Annual Report
2016–2017110
` in Lakhs
Particulars 2016-17 2015-16
Cost of the defined plan for the year:
Current service cost 53.09 41.66
Interest on obligation 41.92 46.57
Net actuarial loss/(Gain) recognized during the year 102.51 (8.99)
Net cost recognized in the Statement of Profit and Loss 197.52 79.24
b. Assumptions for Gratuity/ Compensated Absences:
Particulars 2016-17 2015-16
Discount Rate 7.5% 8.0%
Salary escalation rate 5.0% 5.0%
Attrition rate 9.0% 8.0%
Demographicassumptions–MortalityIALM 2006-08
UltimateLIC (2006-08)
The amount provided for gratuity as per actuarial valuation has been arrived at after considering future salary increase, inflation, seniority and promotion.
Sensitivity analysis:
The Company applies 1% as the sensitivity rate while ascertaining retirement benefit obligation. Accordingly 1% increase in Discount Rate, Salary escalation rate and Attrition rate would have increased/(decreased) profit before tax by ` 94.88 Lakhs, (` 62.97 Lakhs) and ` 94.88 Lakhs, respectively, and ` 83.64 Lakhs, (` 56.95 Lakhs) and ` 83.64 Lakhs for the previous year. Similarly, 1% decrease in Discount Rate, Salary escalation rate and Attrition rate would have (decreased)/ increased profit before tax by (` 113.88 Lakhs), ` 71.20 Lakhs and (` 113.88 Lakhs), respectively, and (` 100.86 Lakhs), ` 63.90 Lakhs and (` 100.68 Lakhs) for the previous year.
20. Short-term borrowings
` in Lakhs
Particulars 31-Mar-2017 31-Mar-2016 1-Apr-2015
Secured Loan from Banks (Refer note a) 39,102.45 27,194.79 11,674.30
Unsecured Loan from Banks 20,842.37 20,556.79 1,543.09
Commercial Paper (Refer note b) 9,839.60 Nil 18,078.33
Unsecured deposits Nil Nil 6.02
Total 69,784.42 47,751.58 31,301.74
a. Secured by pari-passu charge on Inventories and Trade receivables and repayable on demand.
b. The facility is unsecured and the maximum amount outstanding at any time during the year was ` 136,500 Lakhs (Previous year - ` 126,000 Lakhs).
21. Trade payables
` in Lakhs
Particulars 31-Mar-2017 31-Mar-2016 1-Apr-2015
(A) Total outstanding due to Micro enterprises & Small enterprises 641.94 6,517.43 3,399.42
Total ( A ) 641.94 6,517.43 3,399.42
(B) Total outstanding other than due to Micro enterprises & Small enterprises
i. Trade payables 191,528.63 158,840.25 106,023.22
ii. Other payables 1,133.45 957.64 955.59
Total ( B ) 192,662.08 159,797.89 106,978.81
Total (A+B) 193,304.02 166,315.32 110,378.23
Trade payables are dues in respect of goods purchased or services received (including from employees) in the normal course of business.
The Company has circulated letters to suppliers and based on confirmations received so far from the parties necessary disclosures relating to Micro and Small Enterprises as defined under the Micro, Small and Medium Enterprises Development Act, 2006 are made in the financial statements in accordance with the Notification No: GSR 719 (E) dated November 16, 2007 issued by the Ministry of Corporate Affairs. There are no overdue outstanding amounts (including interest) payable to these enterprises.
22. Other Financial Liabilities
` in Lakhs
Particulars 31-Mar-2017 31-Mar-2016 1-Apr-2015
Interest Accrued But Not Due on borrowings 113.58 124.60 76.71
Unclaimed Dividend * 10.25 6.34 4.85
Total 123.83 130.94 81.56
*No Amount is due and outstanding to be credited to Investor Education and Protection Fund.
23. Provisions
` in Lakhs
Particulars 31-Mar-2017 31-Mar-2016 1-Apr-2015
Compensated absences 15.88 13.25 9.01
Gratuity 37.98 31.21 18.79
Warranty 135.20 156.10 201.57
Corporate social responsibility expense Nil 0.01 495.00
Total 189.06 200.57 724.37
Movement in Provision for warranty
` in Lakhs
Description 2016-17 2015-16
Balance at the beginning of the year 156.10 201.57
Add: Provision made 145.20 180.20
Less: Provision Utilised 166.10 225.67
Balance at the end of the year 135.20 156.10
24. Other current liabilities
` in Lakhs
Particulars 31-Mar-2017 31-Mar-2016 1-Apr-2015
Creditors for other liabilities^ 12,028.42 14,381.03 12,817.97
Statutory Liabilities 5,880.47 5,009.64 5,270.83
Other Liabilities 419.36 444.55 518.89
Advances/deposit received from Customers 1,982.45 1,396.79 1,600.83
Unamortized Revenue 0.08 7.35 39.55
Due to related parties 596.69 521.12 298.94
Total 20,907.47 21,760.48 20,547.01
^ Includes ` Nil (March 31, 2016 ` 1.23 Lakhs & as on April 1, 2015: ` 137.18 Lakhs) payable towards acquisition of Property, Plant and Equipment.
Annual Report
2016–2017113
Annual Report
2016–2017112
25. Revenue from operations
` in Lakhs
Particulars 2016-17 2015-16
Sales 1,503,605.12 1,229,637.25
Service Income 1,613.53 2,594.61
Rebates 37,947.31 31,579.91
Other operating revenue 14.01 3.66
Total 1,543,179.97 1,263,815.43
26. Other income
` in Lakhs
Particulars 2016-17 2015-16
Dividend from subsidiaries 2,050.48 698.26
Interest on loan to related parties 254.63 357.60
Interest from dealers 1,153.07 1,070.28
Interest on Bank deposits 5.08 5.37
Income from Short term Investments 148.35 118.01
Bad debts written off in earlier years recovered 77.54 64.35
Gain on sale of Property, Plant and Equipment (Net) 44.92 57.94
Interest on Income tax refund 702.66 555.76
Rental Income 289.49 334.11
Other non-operating income 168.56 320.81
Total 4,894.78 3,582.49
27. Employee benefits
` in Lakhs
Particulars 2016-17 2015-16
Salaries & Bonus 10,292.11 8,567.85
Contribution to Provident & Other Funds 345.13 461.63
Corporate Social Responsibility Expenditure (Refer Note: 44)
540.00 Nil
Miscellaneous expenses 696.11 1,041.53
Total 28,958.46 24,386.44
Auditor’s Remuneration
` in Lakhs
Particulars 2016-17 2015-16
Audit fees 27.00 23.50
Tax Audit fee 2.20 1.70
Certification 11.60 10.86
Reimbursement of expenses including taxes 6.13 7.12
Remuneration to Branch Auditors 15.07 19.91
Remuneration to Nook Auditors (Refer Note:43) Nil 4.23
Total 62.00 67.32
Annual Report
2016–2017115
Annual Report
2016–2017114
30. Earnings per Equity Share
Particulars 2016-17 2015-16
Profit after Tax (` In Lakhs) 20,168.47 18,871.81
Weighted Average Number of equity shares (Basic) 399,832,245 399,777,814
Earnings per share- Basic ` 5.04 4.72
Add: Effect of ESOPs 104,593 174,657
Weighted Average Number of equity shares on account of Employee Stock Option Plan 2008 (Diluted)
399,936,838 399,952,471
Earnings per share- Diluted ` 5.04 4.72
Face Value per share in ` 2/- 2/-
31. Contingent Liabilities & Commitments` in Lakhs
Particulars 31-Mar-2017 31-Mar-2016 1-Apr-2015
i. Channel financing 435.00 750.00 1,975.00
ii. Factoring Nil 8,750.00 7,525.00
iii. Claims not acknowledged as debts 224.49 281.57 359.36
iv. Disputed Customs Duty/Income Tax/Sales Tax/Service Tax demands` in Lakhs
Nature of Dues 31-Mar-2017 31-Mar-2016 1-Apr-2015
Customs duty * 95.82 2,255.38 97.03
Income Tax 563.80 530.19 952.79
Sales Tax 4,724.24 3,771.12 1,566.34
Service Tax^ 2,159.42 2,159.42 Nil
* The Company has received a favourable order from CESTAT – Mumbai setting aside the adjudication order passed by theCommissionerofCustoms(Imports),Mumbai(‘CommonAdjudicatingAuthority’)disallowingCVDnotificationbenefitonexternalharddiskdrives for theperiodMar2011–Nov2012withadutydemandof` 2,160 Lakhs (including interest & penalty), with consequential relief thereto. The Company had made a pre-deposit of ` 400 Lakhs under protest as part of the proceedings. Basis the CESTAT order the Company has reduced its contingent liability to the tune of ` 2,160 Lakhs and is in the process of taking steps for applying refund of the pre-deposit made
^ In the previous year, the Company received a Service tax demand of 2,159.42 Lakhs (including interest & penalty) from Service Tax authorities for the period October 2009 to September 2014, determining certain divisible sale and service contracts as composite works contract. An amount of 400.00 Lakhs was deposited under protest during the proceedings. The Company is contesting the demand before the appropriate legal forum. The legal counsel has opined that the demand is not sustainable in law and accordingly no provision is presently considered necessary.
With respect to the contingencies above, the Company believes that no capital outflow or material impact in the statement of Profit and loss will arise and hence no provision has been made as of the reporting date.
v. Capital Commitments
Estimated amount of contracts remaining to be executed on capital account and not provided for (net of advances) is ` 131.74 Lakhs (March 31, 2016 ` 486.29 Lakhs and ` 34.25 Lakhs as of April 1, 2015).
32. Operating Leases
The Company has taken a cancelable operating lease for its office premises, which is for a period ranging from 11 months to 9 years.
Payments recognized as expense` in Lakhs
Particulars 2016-17 2015-16
Minimum lease payments 1,042.57 996.34
Contingent rentals Nil Nil
Sub-lease payments received Nil Nil
Total 1,042.57 996.34
Future minimum lease payments
The future minimum lease payments under non-cancellable operating leases are as follows:
` in Lakhs
Particulars 31-Mar-17 31-Mar-16 1-Apr-15
Payable in less than one year 381.27 344.92 337.99 Payable between one and five years 570.26 865.62 1,101.24 Total 951.53 1,210.54 1,439.23
33. Financial instruments
Details of the significant accounting policies and methods adopted, including the criteria for recognition, the basis of measurement and the basis on which income and expenses are recognized, in respect of each class of financial asset and financial liability are disclosed in the statement of profit and loss. The fair values of financial assets and financial liabilities at the end of the reporting period approximate the amounts as shown in the Balance sheet.
The following is an analysis of financial instruments that are measured subsequent to initial recognition at fair value, grouped into Levels 1 to 3 based on the degree to which the fair value is observable.
` in Lakhs
Particulars 31-Mar-17 31-Mar-16 1-Apr-15
Financial assets measured at fair value
Deposits (Level 2) 708.55 657.26 731.11
34. Accounting for Financial Instruments
The Company entered into foreign exchange forward contracts with the intention of reducing the foreign exchange risk of expected purchases. These contracts are not designated in hedge relationships and are measured at fair value through profit or loss and grouped under Cost of goods sold. Forward contracts taken towards borrowings has been measured at fair value through profit or loss and grouped under Finance cost.
The exchange gain or loss on settlement of trade payables arising on imports during the year amounted to 1,635.17 Lakhs (Previous year: ` 1,867.95 Lakhs) and the same has been included in cost of goods sold in the Statement of Profit and Loss.
Details of Derivative Exposures are as under :-
Type of Derivative31-Mar-2017 31-Mar-2016
$ in Lakhs ` in Lakhs $ in Lakhs ` in Lakhs
Outstanding Forward Exchange Contracts entered into by the Company on account on payables including forecast payables
Payables including forecast payables 684.40 44,386.28 516.30 35,254.75
Annual Report
2016–2017117
Annual Report
2016–2017116
Type of Derivative31-Mar-2017 31-Mar-2016
$ in Lakhs ` in Lakhs $ in Lakhs ` in Lakhs
The year end foreign currency exposures that have not been hedged by a derivative instrument or otherwise
Payables 61.69 4,000.36 109.26 7,238.85
Receivables 78.51 5,091.67 48.01 3,180.36
Management covers foreign currency transactions through hedging foreign exchange, while the unhedged balances relate to balance in vendor accountwhich to a larger extent have natural hedge.However the foreign currency exposure is closelymonitored inconsultation with Authorised dealers.
35. Financial risk management:
These financial risk management policies are applied in order to mitigate potential adverse impact on the financial performance. The note below explains how the Company’s exposure to various risks, such as market risk (foreign exchange and interest rate risk) credit risk, liquidity risk and capital risk are addressed/mitigated.
1. Market Risks
a. Foreign exchange risk:
The Company enters into transactions denominated in foreign currencies. In order to mitigate risks arising on account of foreign currency fluctuations, the Company has set the following policies with respect to foreign exchange risk management.
The Company, wherever applicable have used foreign currency forward contracts to hedge its risks associated with foreign currency fluctuations relating to certain firm commitments and highly probable forecast transactions. Most of the transactions oftheCompanyareinIndianrupeesandtransactionsinforeigncurrenciesaremajorlyhedgedbyaforwardcover.
Sensitivity analysis:
The Company applies 10% as the sensitivity rate while ascertaining foreign currency exposure. Accordingly 10% strengthen of Indian Rupees against all relevant uncovered foreign currency transactions would have impacted profit before tax by ` 109.13 Lakhs (Previous year ` 405.85 Lakhs). Similarly for 10% weakening of Indian Rupees these transactions, there would be an equal and opposite impact on the profit before tax.
b. Interest rate risk management
TheCompanyfundsatfixedinterestrates.HencetheCompanyisnotrequiredtodeterminethesensitivityanalyseswithregard to interest rate risk
2. Credit risk management
Credit risk is minimized through conservative credit policy by the Company. Credit insurance is also taken to mitigate the credit risk. The Company sells to both small retailers and large format retailers, giving them a credit period of 30- 60 days. The Company mitigates credit risk by strict receivable management procedures and policies. The Company has a dedicated independent team to review credit and monitor collection of receivables on a pan India basis. The efficacy of this process is proven by the fact that receivables more than 6 months are only 5% of the total receivable.
3. Liquidity risk management
The Company has built an appropriate liquidity risk management framework for its short, medium and long-term funding and liquidity requirements. The Company manages liquidity risk by maintaining adequate reserves, banking facilities and reserve borrowing facilities, by continuously monitoring forecast and actual cash flows and matching the maturity profiles of financial assets and financial liabilities.
The following table details the Company’s remaining contractual maturity for its non-derivative financial liabilities. The table has been drawn up based on the undiscounted cash flows of financial liabilities based on the earliest date on which the Company will be required to pay.
` in Lakhs
Particulars31-Mar-17 31-Mar-16 1-Apr-15
< 1 year > 1 year < 1 year > 1 year < 1 year > 1 year
Total financial liabilities 263,212.27 Nil 214,197.84 Nil 141,761.53 Nil
The following table details the Company’s remaining contractual maturity for its non-derivative financial assets. The table has been drawn up based on the undiscounted cash flows of financial assets based on the earliest date on which the Company can collect
` in Lakhs
Particulars31-Mar-17 31-Mar-16 1-Apr-15
< 1 year > 1 year < 1 year > 1 year < 1 year > 1 year
Total financial assets 261,832.13 145.50 215,876.74 191.94 191,568.16 248.09
4. Capital risk management
The Company manages its capital to ensure that the Company will be able to continue as a going concern while maximizing the return to shareholder through the optimisation of the debt and equity balance.
The Company, over the years, has maintained parity between Net Debt to Equity. The capital structure of the Company consists of debt, represents the borrowings net of cash and bank balances as disclosed in the respective notes above and total equity of the Company comprising issued share capital and other equity attributable to the shareholders, as disclosed in the statement of changes in equity. The gearing ratio at the end of the financial period is as below:
Subsidiary Companies Nook Micro Distribution Limited, India (Refer Note:43)Cadensworth (India) Limited, India*Redington International Mauritius Limited, Mauritius*Redington Gulf FZE, DubaiCadensworth FZE, DubaiRedington Gulf & Co. LLC, OmanRedington Nigeria Ltd, NigeriaRedington Egypt Ltd (Limited liability company), EgyptRedington Kenya Ltd, KenyaRedington Middle East LLC, DubaiRedington Qatar WLL, QatarEnsure Services Arabia LLC, Saudi Arabia Redington Africa Distribution FZE, DubaiEnsure Services Bahrain S.P.C, Bahrain Redington Distribution Pte. Limited, Singapore *Redington Bangladesh Limited, Bangladesh
Annual Report
2016–2017119
Annual Report
2016–2017118
Subsidiary Companies Redington Qatar Distribution W.L.L., QatarRedington Kenya (EPZ) Ltd, KenyaRedington Limited, GhanaRedington Uganda Limited, UgandaAfrica Joint Technical Services, LibyaRedington Gulf FZE Co, IraqCadensworth UAE LLC, DubaiRedington Morocco Limited, MoroccoRedington Tanzania Ltd., TanzaniaRedington SL (Private) Ltd., Sri lanka Redington Angola Limited, AngolaRedingtonTurkeyHoldingsS.A.R.L,LuxembourgArena Bilgisayar Sanayi Ve Ticaret A.S.,TurkeyArena International FZE, DubaiEnsure IT services (pty) Ltd., South Africa ProConnect Supply Chain Solutions Limited, India* Ensure Gulf FZE, DubaiEnsure Technical Services (PTY) Ltd., South Africa Ensure Middle East Trading LLC, DubaiEnsure Technical Services Kenya Limited, KenyaEnsure Technical Services Tanzania Limited, TanzaniaEnsure Services Uganda Limited, Uganda Ensure Solutions Nigeria Limited, NigeriaRedington Rwanda Ltd, RwandaRedington Kazakhstan LLP, Kazakhstan SensonetTeknolojiElektronikVeBilisimHizmetleriSanayiVeTicaretA.S.,TurkeyProConnect Supply Chain Logistics LLC, DubaiEnsure Ghana Limited, Ghana Ensure Support Services (India) Limited, India*Ensure Technical Services Morocco Limited (SARL), MoroccoAdeoBilisimDanismanlikHizmetleriSan.VeTic.A.S.(“ADEO”),Turkey**Redington Senegal Limited SARLRedington Saudi Arabia Distribution Company, Saudi Arabia PaynetÖdemeHizmetleriA.S.,TurkeyCDW International Trading FZE, DubaiRNDC Alliance West Africa Limited, NigeriaLinkplus Bilgisayar Sistemleri Sanayi ve Ticaret A.S, Turkey
Incorporated during the year Redserv Business Solutions Private Limited, IndiaProConnect Saudi LLC, Saudi Arabia Redington Distribution Company LLC, EgyptEnsure MiddleEast Technology Solutions LLC, Abu DhabiRajprotimSupplyChainSolutionsLimited,India
Associate Redington (India) Investments Limited, India
Subsidiary of Associate Currents Technology Retail (India) Limited, India*
* Represents related parties with whom transactions have taken place during the year.** Disposed during the year
Related Parties are as identified by the management.
3) Nature of Transactions
` in Lakhs
Nature of Transactions2016-17 2015-16
Party Where Control Exists
Party Where Control Exists
Redington Employee Share Purchase Trust
Deficit absorbed 0.07 0.07
Redington Employees Share Purchase Trust administers the Employee Share Purchase Scheme (ESPS), which is in accordance with Securities and Exchange Board of India (Employee Stock Option Scheme and Employee Stock Purchase Scheme) Guidelines, 1999. The deficit of the trust for the year ended March 31, 2017 amounting to ` 0.07 Lakhs (Previous Year ` 0.07 Lakhs) has been absorbed in the Statement of Profit and Loss.
` in Lakhs
Nature of Transactions
2016-17 2015-16
Parties having Significant Influence
Parties having Significant Influence
Synnex Mauritius Limited
Dividend Paid 3,866.13 1,791.62
Harrow Investment Holding Limited
Dividend Paid 1,343.88 1,012.38
` in Lakhs
Nature of Transactions2016-17 2015-16
Subsidiary Companies
Subsidiary Companies
Cadensworth (India) Limited
Sales/ServiceCharges–Expenses 19.41 1.32
Sales/ServiceCharges–Income 29.62 50.28
Rent received 10.41 12.58
Dividend Income 312.31 Nil
Interest Income 49.25 108.73
Loan disbursed 4,493.04 9,700.00
Loan settled 7,093.04 9,300.00
Loan outstanding at the year beginning 2,600.00 2,200.00
Loan outstanding at the year end Nil 2,600.00
Amount Receivable at the year beginning 0.03 Nil
Amount Receivable at the year end Nil 0.03
Redington International (Mauritius) Limited
Equity contribution Nil 6,503.60
Redington Distribution Pte Limited
Trading Purchases 4,452.17 5,277.07
Sales/ServiceCharges–Income 187.63 260.42
Dividend Income 1,556.17 698.26
Amount Receivable at the year beginning 115.08 127.82
Amount Receivable at the year end 33.06 115.08
Amount Payable at the year beginning 114.16 2,351.80
Loan outstanding receivable at the year end 1,000.00 Nil
Amount Receivable at the year beginning 27.94 30.98
Amount Receivable at the year end 37.92 27.94
Amount Payable at the year beginning (Net) 837.67 621.78
Amount Payable at the year end (Net) 994.62 837.67
Equity Contribution made during the year 1,500.48 Nil
Ensure Support Services (India) Limited
Sales/ServiceCharges–Income 28.56 53.91
Rental Income 42.30 49.87
Interest Income 4.11 37.06
Purchases–Expenses 20.55 98.52
ServiceCharges–Expense 257.94 529.50
Loan disbursed 250.00 4,465.00
Loan settled Nil 5,274.51
Loan outstanding at the year beginning Nil 809.51
Loan outstanding at the year end 250.00 Nil
Equity Contribution made during the year Nil 245.00
Amount Payable at the year beginning 745.96 677.44
Amount Payable at the year end 152.22 745.96
Amount Receivable at the year beginning 915.77 1,763.44
Amount Receivable at the year end 208.97 915.77
` in Lakhs
Nature of Transactions2016-17 2015-16
Subsidiary of Associate
Subsidiary of Associate
Currents Technology Retail (India) Limited
Sales/ServiceCharges–Income 5,785.75 6,577.08
Interest Income 179.87 209.60
Loan disbursed 9,410.00 5,130.00
Loan settled 8,710.00 4,630.00
Loan outstanding at the year beginning 2,440.00 1,940.00
Loan outstanding at the year end 3,140.00 2,440.00
Amount receivable at the year beginning 1,015.56 905.50
Amount receivable at the year end 1,208.43 1,015.56
37. Key Managerial Remuneration
` in Lakhs
Nature of Transactions 2016-17 2015-16
Remuneration to Whole-Time directors 140.87* 24.00
* a) Includes Gratuity paid to Mr. M. Raghunandan on his retirement amounting to ` 10.38 Lakhs
b) Salaryentitlementforthefullfinancialyear2016-17forMr.E.H.KasturiRanganisconsidered.
38. CIF Value of Imports
` in Lakhs
Particulars 2016-17 2015-16
Trading Stocks 203,978.00 132,834.92
39. Expenditure in Foreign Currency
` in Lakhs
Particulars 2016-17 2015-16
Royalty (Cost of Software included under purchases) 2,111.15 1,103.20
Travel 80.52 68.24
License fee Nil 49.70
Directors’ sitting fee 9.50 4.70
Directors’ Commission 54.00 47.25
40. Earnings in Foreign Exchange
` in Lakhs
Particulars 2016-17 2015-16
Rebates & Discount 11,846.47 7,713.01
Warranty claims 54.36 415.87
Dividend from Overseas Subsidiaries 1,556.17 698.26
FOB value of exports 187.63 3,591.58
Others 18.43 Nil
41. Dividend remitted in Foreign Currency
Particulars 2016-17 2015-16
Special (Interim) Dividend:
No. of non-resident shareholders 5
NilNo. of Equity shares held (Face value of ` 2) 127,701,305
Amount remitted ( ` in Lakhs ) 2,554.03
Financial Year to which it relates 2016-17
Final Dividend:
No. of non-resident shareholders 6 9
No. of Equity shares held (Face value of ` 2) 127,736,305 148,324,318
Amount remitted ( ` in Lakhs ) 2,682.46 2,818.16
Financial Year to which it relates 2015-16 2014-15
42. Merger of Cadensworth (India) Limited
The Board of Directors at its meeting held on May 24, 2016 approved the proposed merger of Cadensworth (India) Limited, a Wholly-ownedsubsidiarywiththeCompanywitheffectfromApril1,2016,underaschemeofArrangement(Merger),subjecttothesanctionbytheHon’bleMadrasHighCourt.BothNationalStockExchangeofIndiaLimited(NSE)andBSELimited(BSE)havecommunicatednoobjectioninthisregard.
Pending approval of the Scheme by NCLT, the results of the said subsidiary as at and for the Year Ended March 31, 2017 have not been included in the Standalone Financial Results.
43. Merger of Nook Micro Distribution Limited
Nook Micro Distribution Limited (“Nook / Transferor Company”), an erstwhile wholly owned subsidiary of the Company was engaged in trading on IT, Consumer Durable and Telecom products. The Board of Directors of the Company, in their meeting held on August 3, 2015 had approved a scheme of amalgamation of Nook with the Company, with effect from 1st April 2015. The Scheme was sanctionedbytheHon’bleHighCourtofJudicatureatMadrasvidetheirOrderdatedMarch11,2016andtheassetsandliabilitiesofthe Transferor Company were transferred to and vested with the Company with effect from the Appointed date - April 1, 2015. Since this is the common control transaction, as per Appendix C of Ind AS 103, the impact of the scheme has been considered in the earliest period presented, i.e. the balance sheet as on April 1, 2015 (Refer Note 48 for the effect of the merger on the opening balance sheet on the date of transition to Ind AS)
44. For the year 2016-17, the Company is required to spend ` 540.97 Lakhs (Previous year: ` 516.78 Lakhs) on "Corporate Social Responsibility (CSR)" against which the Company has spent ` 540.00 Lakhs, being the contribution made by the Company to a Trust formed for the purposes of carrying out CSR activities. In the previous financial year, CSR activities were performed out of the funds/provision earmarked for this purpose in the earlier years.
45. Segment Reporting
Since the Company prepares consolidated financial statements as per Ind AS-108 “Operating Segment”, segment information has been disclosed in consolidated financial statements.
46. Employee Stock Option Plan 2008
The Company follows intrinsic value method as per previous GAAP for accounting of employee stock options and decided to avail exemption under Ind AS 101 from retrospective application of accounting requirements prescribed under Ind AS 102 for outstanding optionsasonthetransitiondate.Hencenocompensationcostshavebeenrecognizedintheseaccountsastheoptionshavebeengranted at the prevailing market prices.
Particulars Grant I Grant II Grant III Grant IV Grant V
Date of Grant 29-Feb-08 25-Jul-08 28-Jan-09 22-May-09 05-Dec-11
Options exercised at the beginning of the year 1,748,303 6,250 276,143 25,000 41,204
Options exercised during the year - - - - 7,046
Total options outstanding and not exercised as on March 31, 2017
- - - - 80,337
* Out of the total options granted in 2008, 1,959,830 options were repriced at ` 130/- on January 28, 2009 and 75,000 options were repriced at ` 165/- on May 22, 2009
Out of the lapsed options the Board/Committee of directors at their meetings had approved reissue of options as follows:
Date of Grant 25-Jul-08 28-Jan- 09 22-May- 09 5-Dec-11
No. of options 11,000 276,143 25,000 173,212
The fair value of options based on the valuation of the independent valuer as of the respective dates of grant are given below:
Grant Date 29-Feb-08Repriced on 28-Jan-09
Repriced on 22-May-09
25-Jul-08Repriced on 28-Jan-09
28-Jan-09 22-May-09 5-Dec-11
Fair Value 171.33 25.56 33.04 159.71 23.77 47.46 79.82 171.72
The variables used for calculating the Fair Values of Grant V and their rationale are as follows:
A. Stock price
The closing market price on the date prior to the date of grant on National Stock Exchange (NSE) has been considered for the purpose of option valuation.
B. Volatility
Volatility is a measure of the amount by which a price has fluctuated or is expected to fluctuate during a period. The measure of volatility used in the Black-Scholes option-pricing model is the annualized standard deviation of the continuously compounded rates of return on the stock over a period of time.
The period to be considered for volatility has to be adequate to represent a consistent trend in the price movements. It is also important that movements due to abnormal events get evened out.
There is no research that demonstrates conclusively how long the historical period used to estimate expected long term future volatility shouldbe.However,GuidancenoteonAccounting forEmployeeShare-basedPayments issuedby the InstituteofChartered Accountants of India recommends including the historical volatility of the stock over the most recent period that is generally commensurate with the expected life of the option being valued.
The entity’s stocks have been publicly traded on NSE and BSE. For calculating Volatility, we have considered the daily volatility of the stock prices on NSE, over a period prior to the date of grant, corresponding with the expected life of the options.
TheFairvalueofanoption isverysensitivetothisvariable.Higherthevolatility,higher is theFairvalue.Therationalebeing,the more volatile a stock is, the more is its potential to go up (or come down), and the more is the probability to gain from the movement in the price. Accordingly, an option to buy a highly volatile stock is more valuable than the one to buy a less volatile stock, for the probability of gaining is lesser in the latter case.
C. Risk free interest rate
The risk-free interest rate being considered for the calculation is the interest rate applicable for maturity equal to the expected life of the options based on the zero-coupon yield curve for Government Securities.
D. Exercise Price
Options have been granted primarily at a price of ` 348.05 on February 29, 2008. Subsequently, 1,959,830 and 75,000 options were re-priced at a Market price of ` 130/- and ` 165/- on January 28, 2009 and May 22, 2009 respectively. On December 5, 2011 173,212 options were granted at a price of ` 396.50 per option.
E. Time to Maturity / Expected Life of options
Time to Maturity / Expected Life of options is the period for which the Company expects the options to be live. The minimum life of a stock option is the minimum period before which the options cannot be exercised and the maximum life is the period after which the options cannot be exercised.
i. The expected life must at least include the vesting period.
ii. The average lengths of time of similar grants have remained outstanding in the past. If the Company does not have a sufficiently long history of stock option grants, the experience of an appropriately comparable peer group may be taken into consideration.
iii. The expected life of stock options should not be less than half of the exercise period of the stock options issued until and unless the same is supported by historical evidences with respect to stock options issued by the Company earlier.
The fair value of each award has been determined based on different expected lives of the options that vest each year, as it would be if the award were viewed as several separate awards, each with a different vesting date. A weighted average of all vests has been calculated to arrive at the value of the options.
The time to maturity has been estimated as illustrated by the following example. In case of the grant made on December 5, 2011, the earliest date of exercise is December 5, 2012 i.e. one year from the date of grant. The exercise period is five years from the date of vest.
Expected Dividend yield: Expected dividend yield has been calculated as an average of dividend yields for the preceding 2 years to the year of grant.
Annual Report
2016–2017125
Annual Report
2016–2017124
Movements in Share options during the year:
ParticularsFY 2016-17 FY 2015-16
Number of options
Weighted average exercise price (` )
Number of options
Weighted average exercise price (` )
Balance at the beginning of the year 91,258 394.31 128,899 363.31
Granted during the year - - - -
Forfeited during the year - - - -
Exercised during the year 7,046 396.50 22,088 363.92
Expired during the year 3,875 344.92 15,553 180.55
Balance at the end of the year 80,337 396.50 91,258 394.31
Details of Share options exercised during the year:
Particulars Number exercised Allotment dateShare price at allotment date
Grant I NIL - -
Grant II NIL - -
Grant III NIL - -
Grant IV NIL - -
Grant V 7,046 16.09.2016 BSE -111.85/NSE-111.25
Total 7,046
47. Transition to Ind AS:
47.1 First-time adoption of Ind AS:
The financial statements for the year ended March 31, 2017 are the first financial statements prepared by the Company in accordance with Ind AS. For the periods upto and including the year ended March 31, 2016, the Company prepared its financial statements in accordance with the Generally Accepted Accounting Principles in India (previous GAAP). Reconciliation and description of the effect of transition from previous IGAAP to Ind AS are provided in Note 48.
Accordingly, the Company has prepared financial statements which comply with Ind AS applicable for the year ended March 31, 2017, together with the comparative year data as at and for the year ended March 31, 2016, as described in the summary of significant accounting policies. In preparing these financial statements, the Company prepared the opening balance sheet asatApril1,2015,beingthetransitiondate.Note48explainstheprincipaladjustmentsmadebytheCompanyinrestatingitsprevious GAAP financial statements, including the balance sheet as at April 1, 2015 and the financial statements as at and for the year ended March 31, 2016.
47.2 Exceptions to retrospective application of Ind AS:
Ind AS 101 allows certain exemptions to first-time adopters from the retrospective application of certain requirements under Ind AS. The Company has applied the following exemptions:
Mandatory Exceptions:
a. Estimates:
When the Company needs to make estimates under Ind AS that were not required under previous GAAP or vice-versa, the estimates must reflect conditions at the date of transition to Ind AS. On an assessment of the estimates made under previous GAAP, the Company has concluded that there is no necessity to revise the estimates under IND AS.
b. Hedge Accounting:
Hedgeaccountingistobeappliedonlytohedgerelationshipsthatmeettherequirementsofhedgeaccountinginaccordancewith Ind AS 109. An entity shall not reflect in its Ind AS balance sheet a hedge relationship that does not qualify under Ind AS 109. The Company has retrospectively applied these principles and elected not to disclose in its balance sheet, the relationships that do not qualify for hedge accounting under Ind AS 109.
Optional Exemptions:
a. Deemed Cost:
The Company being a first time adopter has elected to carry the value of Property, Plant and Equipment and Intangible assets as per Balance sheet prepared under previous GAAP under deemed cost model. The Company has elected to regard those values of property as its deemed cost as at the date of transition and elected not to revalue those assets.
b. Share- based payment transactions:
The Company being a first time adopter has elected to avail exemption under Ind AS 101 for equity instruments that vested before the date of transition to Ind AS.
c. Employee Benefits:
The Company being a first time adopter has decided to apply the exemption of recognizing all cumulative actuarial gains or lossesatthedateoftransitiontoIndASasanadjustmenttoopeningretainedearningsandthereafterasaseparatecomponentof equity.
48. Reconciliation between previous GAAP & Ind AS:
Effect of Ind AS adoption on the Balance Sheet as at April 1, 2015
Other Current Assets a (i) 18,965.93 (9,220.56) 228.65 78.34 10,052.36Total Current assets 232,123.69 (121.67) 10,343.86 3,780.75 78.34 238,643.47Assets classified as held for Sale - - - - - -Total assets 303,131.97 (121.67) 10,419.25 5,791.07 7.99 307,646.47
Equity and liabilitiesEquity
Share Capital 7,994.06 2,000.00 2,000.00 7,994.06Other Equity f 128,063.40 (1,199.21) 10.32 9,036.02 135,889.89
Total Equity 136,057.46 - 800.79 2,010.32 9,036.02 143,883.95
Borrowings 28,377.52 (121.67) 6,746.12 3,700.23 31,301.74Trade and other payables 107,801.99 2,576.24 110,378.23Other Financial Liabilities - 81.56 - 81.56
Provisions c 9,750.75 1.65 (9,028.03) 724.37Other Current Liabilities 20,451.09 (81.56) 258.00 80.52 20,547.01Total Current Liabilities 166,381.35 (121.67) 9,582.01 3,780.75 (9,028.03) 163,032.91Total Liabilities 167,074.51 (121.67) 9,618.46 3,780.75 (9,028.03) 163,762.52Total Equity and Liabilities 303,131.97 (121.67) 10,419.25 5,791.07 7.99 307,646.47* The figures have been regrouped wherever necessary to conform to the classification of the current year and requirements of Ind AS 1
Annual Report
2016–2017127
Annual Report
2016–2017126
Effect of Ind AS adoption on the Balance Sheet as at March 31, 2016
Other Current Assets a (i & ii) 12,181.92 (5,666.36) 62.01 6,577.57Total Current assets 311,695.24 - 62.01 311,757.25Assets held for SaleTotal assets 390,683.22 - 7.46 390,690.68
Equity and liabilitiesEquity
Share Capital 7,996.26 7,996.26Other Equity f 135,876.58 9,970.63 145,847.21
Borrowings 47,751.58 47,751.58Trade and other payables 166,315.32 166,315.32Other Financial Liabilities 130.94 130.94
Provisions c 10,163.74 (9,963.17) 200.57Other Current Liabilities 21,891.42 (130.94) 21,760.48Total Current Liabilities 246,122.06 - (9,963.17) 236,158.89Total Liabilities 246,810.38 - (9,963.17) 236,847.21Total Equity and Liabilities 390,683.22 (0.00) 7.46 390,690.68* The figures have been regrouped wherever necessary to conform to the classification of the current year and requirements of Ind AS 1
Effect of Ind AS adoption on the Statement of Profit and Loss for the year ended March 31, 2016
` in Lakhs
ParticularsNote No.
As per previous
GAAP Regrouping*
Ind AS Adjustments
As per Ind AS
Revenue from Operations 1,263,872.93 (57.50) 1,263,815.43Other Income a (ii) 3,714.60 (147.78) 15.67 3,582.49Total Income 1,267,587.53 (205.28) 15.67 1,267,397.92
ExpensesPurchases of Traded goods 1,254,937.46 (57.50) 1,254,879.96Changes in Inventories of Traded goods (59,028.59) (59,028.59)Employee benefits expense g 9,435.27 (61.16) 9,374.11Finance Costs g 8,176.69 60.59 8,237.28Depreciation and amortisation expense 1,002.60 1,002.60Other expenses a (ii) & d 24,500.23 (147.78) 33.99 24,386.44Total expenses 1,239,023.66 (205.28) 33.42 1,238,851.80
Profit for the year (A) 18,889.63 - (17.82) 18,871.81
Items that will not be reclassified to Profit or lossRemeasurements of the defined benefit plans g - (0.57) (0.57)Income Tax Effect on above item g - 0.20 0.20Net Other Comprehensive Income that will not be reclassified to profit or loss - (0.37) (0.37)Items that may be reclassified to Profit or lossForeign currency translation adjustment e - 7.10 7.10Net Other Comprehensive Income that may be reclassified to Profit or loss - 7.10 7.10Total Other comprehensive income (B) - - 6.73 6.73Total Comprehensive Income (A+B) 18,889.63 - (11.09) 18,878.54* The figures have been regrouped wherever necessary to conform to the classification of the current year and requirements of Ind AS 1
Reconciliation of total comprehensive income for the year ended March 31, 2016 ` in Lakhs
Particulars 31-Mar-2016
Net Profit After Tax under previous GAAP 18,889.63
Adjustments for:
Effects of measuring forward contracts through Profit and loss (Refer Note d) (17.66)
Change in Net Present Value for Lease Deposits (Refer Note a(ii)) (0.66)
Lease deposits held as on the transition date has been measured at fair value of which is estimated at the present value of the deposit, discounted using the prevailing market rate of Government securities.
i. The difference between the carrying value and the fair value amounting to 90.40 Lakhs is increased to the Retained earnings as on 1st April 2015. The said difference between the present value of the deposit and the recoverable value is amortised over the lease period as prepaid expenses. The value of prepaid expense for the lease deposit held as on transition date is ` 78.34 Lakhs which is decreased to the Retained earnings as on 1st April 2015.
ii. Rental expenses & Interest Income for the above amortization value for the year ended March 31, 2016 has been charged to Statement of Profit and loss to the extent of ` 16.33 Lakhs and ` 15.67 Lakhs respectively.
Annual Report
2016–2017129
Annual Report
2016–2017128
b. Tax adjustments:
Taxexpensehasbeen recomputedbasedon the IndASadjustmentand thedifferentialamount ischarged toProvision forTaxation which has been charged to Statement of Profit and loss to the extent of 0.07 Lakhs. The difference effect on Transition datehasbeenadjustedagainstDeferredTaxandtheRetainedearningsason1st April 2015, to the extent of ` 20.05 Lakhs.
c. Dividend:
Under previous GAAP, equity dividend recommended by the board of directors after the end of the reporting period but before the financial statements were approved was recognised in the financial statements as a liability. Under Ind AS 10, such dividends are to be recognised when approved by the members in a general meeting. Accordingly an amount of ` 9,963.17 Lakhs recognised asliabilityinthefinancialyear2015-16isreversedandthesameisadjustedinEquityintheyear2016-17andsimilarlyanamountof ` 9,028.03Lakhsrecognisedasliabilityinthefinancialyear2014-15wasreversedandadjustedinEquityintheyear2015-16as paid.
d. Effect of changes in Foreign Exchange:
NetmovementinHedgeaccountingreserveshasbeenreclassifiedasExchangegain/(loss)whichhasbeenchargedtoStatementof Profit and loss, amounting to ` 17.66 Lakhs
e. Foreign Currency Translation Reserve:
Movement Foreign Currency Translation reserve (FCTR) for the year ended March 31, 2016 amounting to ` 7.10 Lakhs has been reclassified under Other Comprehensive Income, which was shown as a part of Reserves in the Balance Sheet. Refer Note 2.3(h) for accounting of FCTR
f. Other Reserves: ` in Lakhs
Particulars 31-Mar-16 01-Apr-15
Reserves as per previous GAAP 135,876.58 128,063.40
AdjustmentsarisingonAmalgamation - (1,209.53)
135,876.58 126,853.87
Ind AS Adjustments:
Proposed equity dividend for the year 8,396.07 7,595.32
Dividend Distribution Tax on the Proposed Dividend 1,567.10 1,432.71
Movement in Deferred Tax 20.25 20.05
Movement in Current Tax (0.07) -
Fair value measurement on Security Deposits (74.73) (90.40)
Amortisation of Prepaid Rent 62.01 78.34
Reserves as per Ind AS 145,847.21 135,889.89
g. Employee Benefits, Finance cost & Other Comprehensive Income: ` in Lakhs
ParticularsEmployee Benefits
Finance CostsOther
ComprehensiveIncome
As reported under previous IGAAP 9,435.27 8,176.69 Nil
Ind AS Adjustments on Employee Benefits:
Interest Cost:
Gratuity (46.57) 46.57 Nil
Compensated Absences (14.02) 14.02 Nil
Actuarial Gain/Loss:
Gratuity 8.99 Nil 8.99
Compensated Absences (9.56) Nil (9.56 )
Total 9,374.11 8,237.28 (0.57)
Less: Deferred Tax Nil Nil 0.20
Amount reportable under Ind AS 9,374.11 8,237.28 (0.37)
h. There were no significant reconciliation items between cash flows prepared under previous GAAP and those prepared under Ind AS
49. Events after the Reporting period (Non-adjusting)
The Board of Directors at its meeting held on May 25, 2017 has recommended a dividend of 2.30 per Equity share of 2/- each (i.e., 115% of face value) for the Financial Year Ended March 31, 2017 (Previous Year ` 2.10 per Equity Share of ` 2/- each - i.e., 105% of facevalue)subjecttotheapprovalofshareholdersintheensuingAnnualGeneralMeeting.
50. Disclosure on Specified Bank Notes (SBNs)
During the year, the Company had specified bank notes and other denomination notes. As defined in the MCA notification G.S.R. 308 (E) dated March 30, 2017 on the details of Specified Bank Notes (SBN) held and transacted during the period from November 8, 2016 to December 30, 2016, the denomination wise SBNs and other notes as per the notification is given below:
` in Lakhs
Particulars SBNs*Other
denomination Notes
Total
Closing Cash in hand as on November 8, 2016 14.78 1.67 16.45
(+)Permittedreceipts Nil 59.97 59.97
(-) Permitted payments Nil 45.13 45.13
(-) Amount deposited in Banks 14.78 Nil 14.78
Closing Cash in hand as on December 30, 2016 Nil 16.51 16.51
*For the purpose of this disclosure, the term ‘Specified Bank Notes’ shall have the same meaning provided in the notification of the Government of India, in the Ministry of Finance, Department of Economic Affairs, S.O No. 3407(E), dated November 8, 2016
51. The Board of Directors at its meeting held on February 3, 2017 declared a special (Interim) dividend of ` 2/- per Equity share of ` 2/- each -i.e.,100% of face value.
52. The financial statements were approved for issue by the board of directors on May 25, 2017.
For and on behalf of the Board of Directors
Raj Shankar E H Kasturi Rangan Managing Director Whole-Time Director (DIN-00238790) (DIN-01814089)
S V Krishnan M Muthukumarasamy Chief Financial Officer Company SecretaryPlace : Chennai Date : May 25, 2017
Annual Report
2016–2017131
Annual Report
2016–2017130
Consolidated Financial Statements
Independent Auditor's Report to the Members of Redington (India) Limited
Report on the Consolidated Ind AS Financial Statements
We have audited the accompanying consolidated Ind AS financial statements of Redington (India) Limited (hereinafter referred to as "the Parent") and its subsidiaries (the Parent and its subsidiaries together referred to as "the Group"), its associate and its subsidiary (herein after referred as "Associate"), comprising the Consolidated Balance Sheet as at March 31, 2017, the Consolidated Statement of Profit and Loss including other comprehensive income, the Consolidated Cash Flow Statement, the Consolidated Statement of Changes in Equity, for the year then ended, and a summary of the significant accounting policies and other explanatory information (hereinafter referred to as "the consolidated Ind AS financial statements"), in which are incorporated the Returns for the year ended on that date audited by the branch auditor of the branch of the Parent located at Singapore.
Management's Responsibility for the Consolidated Ind AS Financial Statements
TheParent'sBoardofDirectorsisresponsibleforthepreparationoftheseconsolidatedIndASfinancialstatementsintermsoftherequirements of the Companies Act, 2013 (hereinafter referred to as "the Act") that give a true and fair view of the consolidated financial position, consolidated financial performance including other comprehensive income, consolidated cash flows and statement of changes in equity of the Group including its Associate in accordance with the accounting principles generally accepted in India, including the Indian Accounting Standards (Ind AS) prescribed under Section 133 of the Act. The respective Board of Directors of the companies included in the Group and of its Associate are responsible for maintenance of adequate accounting records in accordance with the provisions of the Act for safeguarding the assets of the Group and its Associate and for preventing and detecting frauds andotherirregularities;theselectionandapplicationofappropriateaccountingpolicies;makingjudgmentsandestimatesthatarereasonableandprudent;andthedesign,implementationandmaintenanceofadequateinternalfinancialcontrols,thatwereoperatingeffectively for ensuring the accuracy and completeness of the accounting records, relevant to the preparation and presentation of the financial statements that give a true and fair view and are free from material misstatement, whether due to fraud or error, which have been used for the purpose of preparation of the consolidated Ind AS financial statements by the Directors of the Parent, as aforesaid.
Auditor’s Responsibility
Our responsibility is to express an opinion on these consolidated Ind AS financial statements based on our audit. In conducting our audit, we have taken into account the provisions of the Act, the accounting and auditing standards and matters which are required to be included in the audit report under the provisions of the Act and the Rules made thereunder.
We conducted our audit in accordance with the Standards on Auditing specified under Section 143(10) of the Act. Those Standards require that we comply with ethical requirements and plan and perform the audit to obtain reasonable assurance about whether the consolidated Ind AS financial statements are free from material misstatement.
An audit involves performing procedures to obtain audit evidence about the amounts and the disclosures in the consolidated Ind AS financialstatements.Theproceduresselecteddependontheauditor'sjudgment,includingtheassessmentoftherisksofmaterialmisstatement of the consolidated Ind AS financial statements, whether due to fraud or error. In making those risk assessments, the auditorconsidersinternalfinancialcontrolrelevanttotheParent'spreparationoftheconsolidatedIndASfinancialstatementsthatgivea true and fair view in order to design audit procedures that are appropriate in the circumstances. An audit also includes evaluating the appropriatenessoftheaccountingpoliciesusedandthereasonablenessoftheaccountingestimatesmadebytheParent'sBoardofDirectors, as well as evaluating the overall presentation of the consolidated Ind AS financial statements.
We believe that the audit evidence obtained by us and the audit evidence obtained by the branch auditor and other auditors in terms of their reports referred to in sub-paragraphs (a) and (b) of the Other Matters paragraph below, is sufficient and appropriate to provide a basis for our audit opinion on the consolidated Ind AS financial statements.
Opinion
In our opinion and to the best of our information and according to the explanations given to us and based on the consideration of reports of the branch auditor and other auditors on separate financial statements / financial information of the branch, the subsidiaries, and Associate referred to below in the Other Matters paragraph, the aforesaid consolidated Ind AS financial statements give the information required by the Act in the manner so required and give a true and fair view in conformity with the accounting principles generally accepted in India, of the consolidated state of affairs of the Group, and its Associate as at March 31, 2017, and their consolidated profit, consolidated total comprehensive income, their consolidated cash flows and consolidated statement of changes in equity for the year ended on that date.
Other Matters
(a) We did not audit the financial statements / financial information of the branch included in the standalone Ind AS financial statements of the Parent, whose financial statements / financial information reflect total assets of Rs. 8,446 Lakhs as at March 31, 2017 and total revenues of Rs. 20,977 Lakhs for the year ended on that date, as considered in the standalone financial statements of the Parent. The financial statements / financial information of the branch has been audited by the branch auditor whose report has been furnished to us, and our opinion in so far as it relates to the amounts and disclosures included in respect of the branch, and our report in terms of subsection (3) of Section 143 of the Act, in so far as it relates to the aforesaid branch is based solely on the report of such branch auditor.
Annual Report
2016–2017133
(b) We did not audit the financial statements / financial information of fifty seven subsidiaries, whose financial statements / financial information reflect total assets of Rs. 631,956 Lakhs as at March 31, 2017, total revenues of Rs. 2,581,857 Lakhs and net cash inflows amounting to Rs. 16,084.60 lakhs for the year ended on that date, as considered in the consolidated Ind AS financial statements.TheconsolidatedIndASfinancialstatementsalsoincludetheGroup'sshareofnetlossofRs.NilfortheyearendedMarch 31, 2017, as considered in the consolidated Ind AS financial statements, in respect of its Associate, whose financial statements / financial information have not been audited by us. These financial statements have been audited by other auditors whose reports have been furnished to us by the Management and our opinion on the consolidated Ind AS financial statements, in so far as it relates to the amounts and disclosures included in respect of these subsidiaries, and the Associate, and our report in terms of sub-section (3) of Section 143 of the Act, in so far as it relates to the aforesaid subsidiaries, and the Associate is based solely on the reports of the other auditors.
(c) The comparative financial information for the year ended March 31, 2016 and the transition date opening balance sheet as at April 1, 2015 in respect of the branch, fifty three subsidiaries and the Associate included in this consolidated Ind AS financial statements prepared in accordance with the Ind AS have been audited by the branch auditor/ other auditors and have been relied upon by us.
Our opinion on the consolidated Ind AS financial statements above, and our report on Other Legal and Regulatory Requirements below, is not modified in respect of the above matters with respect to our reliance on the work done and the report of the branch auditor and other auditors.
Report on Other Legal and Regulatory Requirements
1. As required by Section 143(3) of the Act, based on our audit and on the consideration of the report of the branch auditor and other auditors on separate financial statements and the other financial information of subsidiaries and the Associate incorporated in India, referred in the Other Matters paragraph above we report, to the extent applicable, that:
(a) We have sought and obtained all the information and explanations which to the best of our knowledge and belief were necessary for the purposes of our audit of the aforesaid consolidated Ind AS financial statements.
(b) In our opinion, proper books of account as required by law relating to preparation of the aforesaid consolidated Ind AS financial statements have been kept so far as it appears from our examination of those books, returns and the report of the branch auditor and the reports of the other auditors.
(c) The report on the accounts of the branch of the Parent included in the Group audited under Section 143(8) of the Act by branch auditor has been sent to us and has been properly dealt with by us in preparing this report.
(d) The Consolidated Balance Sheet, the Consolidated Statement of Profit and Loss (including Other Comprehensive Income), the Consolidated Cash Flow Statement and Consolidated Statement of Changes in Equity dealt with by this Report are in agreement with the relevant books of account maintained for the purpose of preparation of the consolidated Ind AS financial statements and with the returns received by us from the branch auditor / other auditors.
(e) In our opinion, the aforesaid consolidated Ind AS financial statements comply with the Indian Accounting Standards prescribed under Section 133 of the Act.
(f) On the basis of the written representations received from the directors of the Parent as on March 31, 2017 taken on record by the Board of Directors of the Parent and the reports of the statutory auditors of its subsidiary companies and the Associate incorporated in India, none of the directors of the Group companies and Associate incorporated in India is disqualified as on March 31, 2017 from being appointed as a director in terms of Section 164 (2) of the Act.
(g) With respect to the adequacy of the internal financial controls over financial reporting and the operating effectiveness of suchcontrols,refertoourseparateReportin"AnnexureA",whichisbasedontheauditors'reportsoftheParent,subsidiarycompanies, and Associate incorporated in India. Our report expresses an unmodified opinion on the adequacy and operating effectiveness of the internal financial controls over financial reporting of the Parent Company and subsidiaries and Associate incorporated in India.
(h) WithrespecttotheothermatterstobeincludedintheAuditor'sReportinaccordancewithRule11oftheCompanies(AuditandAuditor's)Rules,2014,asamended,inouropinionandtothebestofourinformationandaccordingtotheexplanationsgiven to us:
i. The consolidated Ind AS financial statements disclose the impact of pending litigations on the consolidated financial position of the Group, including the branch of the Parent, and its Associate.
ii. The Group, including the branch of the Parent, and its Associate did not have any material foreseeable losses on long-term contracts including derivative contracts.
iii. There has been no delay in transferring amounts required to be transferred, to the Investor Education and Protection Fund by the Parent. There were no amounts which were required to be transferred to the Investor Education and Protection Fund by the subsidiary companies and the Associate incorporated in India.
iv. The Parent has provided requisite disclosures in the consolidated Ind AS financial statements as regards the holding and dealings in Specified Bank Notes as defined in the Notification S.O. 3407(E) dated the 8 November 2016 of the Ministry of Finance, during the period from 8 November 2016 to 30 December 2016 of the Group entities as applicable. Based on audit procedures performed and the representations provided to us by the management we report that the disclosures are in accordance with the relevant books of accounts maintained by those entities for the purpose of preparation of the consolidated Ind AS financial statements and as produced to us and the other auditors by the Management of the respective Group entities.
Place: Chennai Date: May 25, 2017
For Deloitte Haskins & Sells Chartered Accountants
(Firm'sRegistrationNo.008072S)
M K Ananthanarayanan Partner
Membership No. 19521
Annual Report
2016–2017135
Annual Report
2016–2017134
Annexure “A” to the Independent Auditor’s Report
(Referred to in paragraph 1(g) under ‘Report on Other Legal and Regulatory Requirements’ of our report of even date)
Report on the Internal Financial Controls Over Financial Reporting under Clause (i) of Sub-section 3 of Section 143 of the Companies Act, 2013 (“the Act”)
InconjunctionwithourauditoftheconsolidatedIndASfinancialstatementsoftheCompanyasofandfortheyearendedMarch31, 2017, we have audited the internal financial controls over financial reporting of Redington (India) Limited (hereinafter referred to as "Parent") and its subsidiary companies, which includes internal financial controls over financial reporting of the Company and its subsidiaries which are companies incorporated in India, its associate and its subsidiary (herein after referred as "Associate"), which are companies incorporated in India, as of that date.
Management’s Responsibility for Internal Financial Controls
The respective Board of Directors of the Parent, its subsidiary companies, and its Associate, which are companies incorporated in India, are responsible for establishing and maintaining internal financial controls based on the internal control over financial reporting criteria established by the respective Companies considering the essential components of internal control stated in the Guidance Note on Audit of Internal Financial Controls Over Financial Reporting issued by the Institute of Chartered Accountants of India (ICAI). These responsibilities include the design, implementation and maintenance of adequate internal financial controls that were operating effectivelyforensuringtheorderlyandefficientconductof itsbusiness,includingadherencetotherespectivecompany'spolicies,the safeguarding of its assets, the prevention and detection of frauds and errors, the accuracy and completeness of the accounting records, and the timely preparation of reliable financial information, as required under the Companies Act, 2013.
Auditor’s Responsibility
Our responsibility is to express an opinion on the internal financial controls over financial reporting of the Parent, its subsidiary companies and its Associate, which are companies incorporated in India, based on our audit. We conducted our audit in accordance with the Guidance Note on Audit of Internal Financial Controls Over Financial Reporting (the "Guidance Note") issued by the Institute of Chartered Accountants of India and the Standards on Auditing, prescribed under Section 143(10) of the Companies Act, 2013, to the extent applicable to an audit of internal financial controls. Those Standards and the Guidance Note require that we comply with ethical requirements and plan and perform the audit to obtain reasonable assurance about whether adequate internal financial controls over financial reporting was established and maintained and if such controls operated effectively in all material respects.
Our audit involves performing procedures to obtain audit evidence about the adequacy of the internal financial controls system over financial reporting and their operating effectiveness. Our audit of internal financial controls over financial reporting included obtaining an understanding of internal financial controls over financial reporting, assessing the risk that a material weakness exists, and testing and evaluating the design and operating effectiveness of internal control based on the assessed risk. The procedures selected depend ontheauditor'sjudgement,includingtheassessmentoftherisksofmaterialmisstatementofthefinancialstatements,whetherdueto fraud or error.
We believe that the audit evidence we have obtained and the audit evidence obtained by the other auditors of the subsidiary companies, and its Associate, which are companies incorporated in India, in terms of their reports referred to in the Other Matters paragraph below, is sufficient and appropriate to provide a basis for our audit opinion on the internal financial controls system over financial reporting of the Parent, its subsidiary companies and its Associate, which are companies incorporated in India.
Meaning of Internal Financial Controls Over Financial Reporting
Acompany'sinternalfinancialcontroloverfinancialreportingisaprocessdesignedtoprovidereasonableassuranceregardingthereliability of financial reporting and the preparation of financial statements for external purposes in accordance with generally accepted accountingprinciples.A company's internal financial control over financial reporting includes thosepolicies andprocedures that(1) pertain to the maintenance of records that, in reasonable detail, accurately and fairly reflect the transactions and dispositions of theassetsofthecompany;(2)providereasonableassurancethattransactionsarerecordedasnecessarytopermitpreparationoffinancial statements in accordance with generally accepted accounting principles, and that receipts and expenditures of the company arebeingmadeonlyinaccordancewithauthorisationsofmanagementanddirectorsofthecompany;and(3)providereasonableassuranceregardingpreventionortimelydetectionofunauthorisedacquisition,use,ordispositionofthecompany'sassetsthatcouldhave a material effect on the financial statements.
Inherent Limitations of Internal Financial Controls Over Financial Reporting
Because of the inherent limitations of internal financial controls over financial reporting, including the possibility of collusion or improper managementoverrideofcontrols,materialmisstatementsduetoerrororfraudmayoccurandnotbedetected.Also,projectionsofanyevaluationoftheinternalfinancialcontrolsoverfinancialreportingtofutureperiodsaresubjecttotheriskthattheinternalfinancialcontrol over financial reporting may become inadequate because of changes in conditions, or that the degree of compliance with the policies or procedures may deteriorate.
Opinion
In our opinion to the best of our information and according to the explanations given to us and based on the consideration of the reports of the other auditors referred to in the Other Matters paragraph below, the Parent, its subsidiary companies and its Associate, which are companies incorporated in India, have, in all material respects, an adequate internal financial controls system over financial reporting and such internal financial controls over financial reporting were operating effectively as at March 31, 2017, based on the internal control over financial reporting criteria established by the respective companies considering the essential components of internal control stated in the Guidance Note on Audit of Internal Financial Controls Over Financial Reporting issued by the Institute of Chartered Accountants of India.
Other Matters
Our aforesaid report under Section 143(3)(i) of the Act on the adequacy and operating effectiveness of the internal financial controls over financial reporting insofar as it relates to three subsidiary companies and the Associate, which are companies incorporated in India, is based solely on the corresponding reports of the auditors of such companies incorporated in India.
Our opinion is not modified in respect of the above matters.
Place: Chennai Date: May 25, 2017
For Deloitte Haskins & Sells Chartered Accountants
(Firm'sRegistrationNo.008072S)
M K Ananthanarayanan Partner
Membership No. 19521
Annual Report
2016–2017137
Annual Report
2016–2017136
In terms of our report attached For and on behalf of the Board of Directors
For Deloitte Haskins & Sells Chartered Accountants
M K Ananthanarayanan Raj Shankar E H Kasturi Rangan Partner Managing Director Whole-Time Director (DIN-00238790) (DIN-01814089)
S V Krishnan M Muthukumarasamy Chief Financial Officer Company SecretaryPlace : Chennai Date : May 25, 2017
Consolidated Statement of Profit and Loss for the Year Ended March 31, 2017(` in Lakhs)
Particulars Note No.Year Ended
March 31, 2017Year Ended
March 31, 2016Revenue from operations 22 4,111,465.44 3,544,217.92Other income (Net) 23 4,139.05 3,397.85Total Income 4,115,604.49 3,547,615.77
Profit before tax 65,451.19 59,031.06Tax expense:Current tax 17,134.49 15,993.63Deferred tax 642.72 (1,370.69)Share of Loss of Associate - -Profit for the Year (A) 47,673.98 44,408.12
Other Comprehensive income (B)Items that will not be reclassified to Profit and lossRemeasurement of Defined benefit plan (i) (158.63) 65.00Income tax relating to item above (ii) 54.90 (30.76)Net Other Comprehensive Income that will not be reclassified to profit or loss (i-ii) (103.73) 34.24Items that may be reclassified to Profit and lossForeign exchange differences in translating the financial statements of foreign operations (i) (6,848.44) 9,234.77Income tax relating to item above (ii) - -Net Other Comprehensive Income that may be reclassified to profit or loss (i-ii) (6,848.44) 9,234.77Total Other Comprehensive Income (6,952.17) 9,269.01Total Comprehensive Income for the year (A+B) 40,721.81 53,677.13
Profit for the year attributable to:Shareholders of the Company 46,422.26 42,352.45Non-Controlling Interests 1,251.72 2,055.67
Other Comprehensive Income for the year attributable to:Shareholders of the Company (6,952.17) 9,269.01Non-Controlling Interests - -
Total Comprehensive Income for the year attributable to:Shareholders of the Company 39,470.09 51,621.46Non-Controlling Interests 1,251.72 2,055.67Earnings per Equity Share: (Face value ` 2 each) 35
Basic (in ` ) 11.61 10.59Diluted (in ` ) 11.61 10.59
See accompanying notes forming part of the consolidated financial statements
Total Current Liabilities 648,763.51 714,597.80 544,052.09Total Liabilities 655,679.77 720,812.56 571,120.00Total Equity and Liabilities 1,006,619.71 1,052,488.03 855,101.09See accompanying notes forming part of the Consolidated Financial Statements
Consolidated Balance sheet as at March 31, 2017
Annual Report
2016–2017139
Annual Report
2016–2017138
Consolidated Cash Flow Statement for the Year Ended March 31, 2017(` in Lakhs)
ParticularsYear Ended
March 31, 2017Year Ended
March 31, 2016A. Cash flow from operating activities:Profit for the Year after tax 47,673.98 44,408.12 Adjustmentsfor: - Income tax expense recognised in Profit and Loss 17,777.21 14,622.94 - Depreciation and amortisation expense 5,467.64 4,681.54 - Finance Costs 15,703.46 18,048.88 - Interest Income (2,856.79) (2,376.82) - Provision no longer requried written back - (28.33) - Allowance for doubtful receivables 3,144.86 3,609.11 - Gain on sale of a subsidiary (331.93) - - Provision for warranty 145.20 180.20 - Income received from Short-Term Investments (192.82) (118.01) - Goodwill written off on merger of a wholly-owned subsidiary - 10.32 -Unrealisedforeignexchangenetgainincludingtranslationadjustment (1,984.24) (103.23) - Loss/ (Gain) on sale of Property,Plant and Equipment (Net) 1.76 (51.40)
Operating Profit before working capital changes 84,548.33 82,883.32 Decrease / (increase) Trade receivables 18,403.87 (79,544.20)Increase in Other assets (53,939.82) (9,883.66)Decrease / (increase) in Inventories 35,897.53 (80,403.20)Increase in Other liabilities 38,147.76 5,275.50 Increase in Trade Payables 30,878.96 84,648.38 (Decrease) / increase in provisions (2,126.41) 947.17 Cash generated from operations 151,810.22 3,923.31 Income taxes paid (Net) (16,951.72) (18,137.79)Net Cash generated from / (used in) operating activities 134,858.50 (14,214.48)B. Cash flow from investing activities:Payments for Property, Plant and Equipment (5,582.96) (4,389.11)Payments for Other Intangible Assets (818.03) (1,344.58)Proceeds from sale of Property, Plant and Equipment 444.48 137.49 Proceeds from sale of Other Intangible Assets - 21.78 Interest received 2,902.70 2,530.26 Income received from Short-Term Investments 192.82 118.01 Loans granted to Associate (9,410.00) (5,130.00)Loans settled by Associate 8,710.00 4,630.00 Investments in Mutual funds (450.00) - Changes in Bank Deposits not treated as Cash and Cash Equivalents (1,573.65) 5,184.12 Net Cash outflow for acquisition of additional interest / control in step-down subsidiary (Net) (760.14) (3,566.09)Net Cash used in investing activities (6,344.78) (1,808.12)C. Cash flow from financing activities:Proceeds from allotment of shares, including premium, under ESOP,2008 27.94 80.38 Repayment of Long-Term Borrowings (10,946.96) (23,533.82)(Repayment of) / Proceeds from Short-Term Borrowings (Net) (65,832.31) 71,728.80 Dividend paid by step-down subsidiary to Non-Controlling shareholders (360.02) (631.46)Dividends Paid (including dividend tax) (19,308.94) (8,997.91)Finance costs paid (15,553.54) (18,482.22)Net Cash (used in) / generated from financing activities (111,973.83) 20,163.77 Net increase in Cash and Cash Equivalents 16,539.89 4,141.17 Cash and cash equivalents at the beginning of the year 45,873.12 38,770.54 Add : Effect of Exchange differences on restatement of foreign currency Cash and Cash Equivalents (1,048.02) 2,961.41 Cash and Cash equivalents at the end of the year (Refer Note 13a) 61,364.99 45,873.12 See accompanying notes forming part of consolidated financial statements
In terms of our report attached For and on behalf of the Board of Directors
For Deloitte Haskins & Sells Chartered Accountants
M K Ananthanarayanan Raj Shankar E H Kasturi Rangan Partner Managing Director Whole-Time Director (DIN-00238790) (DIN-01814089)
S V Krishnan M Muthukumarasamy Chief Financial Officer Company SecretaryPlace : Chennai Date : May 25, 2017
Co
nso
lidat
ed S
tate
men
t o
f C
hang
es in
Eq
uity
fo
r th
e Ye
ar E
nded
Mar
ch 3
1, 2
017
(` in
Lak
hs)
Othe
r Equ
ity
Part
icul
ars
Shar
e Ca
pita
lSe
curit
ies
Prem
ium
Capi
tal
Rese
rve
Stat
utor
y Re
serv
e
Fore
ign
Curr
ency
Tr
ansl
atio
n Re
serv
e
Gene
ral
Rese
rve
Retir
emen
t Be
nefit
Ob
ligat
ion
Rese
rve
Surp
lus
in th
e St
atem
ent
of P
rofit
and
Lo
ss
Tota
lNo
n-Co
ntro
lling
in
tere
sts
Tota
l Equ
ity
Bala
nce
at A
pril
1, 2
015
7,99
4.06
35,3
74.3
57,
144.
3236
.89
20,8
12.5
410
,961
.30
(136
.73)
170,
045.
9924
4,23
8.66
31,7
48.3
728
3,98
1.09
Profi
t for
the
year
--
--
--
-42
,352
.45
42,3
52.4
52,
055.
6744
,408
.12
Othe
r Com
preh
ensi
ve In
com
e fo
r the
yea
r (ne
t of t
axes
)-
--
-9,
234.
77-
34.2
4-
9,26
9.01
-9,
269.
01To
tal c
ompr
ehen
sive
inco
me
for t
he y
ear
--
--
9,23
4.77
-34
.24
42,3
52.4
551
,621
.46
2,05
5.67
53,6
77.1
3Al
lotm
ent o
f sha
res
unde
r Em
ploy
ee S
tock
Opt
ion,
2008
2.20
78.1
8-
--
--
-78
.18
-80
.38
Tran
sfer
from
Sur
plus
in th
e St
atem
ent o
f Pro
fit a
nd L
oss
to
Stat
utor
y Re
serv
e-
--
27.2
4-
--
(27.
24)
--
-Fi
nal d
ivide
nd p
aid
--
--
--
-(7
,595
.32)
(7,5
95.3
2)(3
67.8
2)(7
,963
.14)
Divid
end
Dist
ribut
ion
Tax
paid
on
final
divi
dend
--
--
--
-(1
,432
.71)
(1,4
32.7
1)-
(1,4
32.7
1)Di
viden
d Di
strib
utio
n Ta
x cr
edit
on a
ccou
nt o
f divi
dend
re
ceive
d fro
m s
ubsi
diar
y-
--
--
--
28.6
328
.63
-28
.63
Curre
ncy
trans
latio
n ad
just
men
t-
--
--
--
--
3,30
4.09
3,30
4.09
Bala
nce
at M
arch
31,
201
67,
996.
2635
,452
.53
7,14
4.32
64.1
330
,047
.31
10,9
61.3
0(1
02.4
9)20
3,37
1.80
286,
938.
9036
,740
.31
331,
675.
47
Bala
nce
at A
pril
1, 2
016
7,99
6.26
35,4
52.5
37,
144.
3264
.13
30,0
47.3
110
,961
.30
(102
.49)
203,
371.
8028
6,93
8.90
36,7
40.3
133
1,67
5.47
Profi
t for
the
year
--
--
--
-46
,422
.26
46,4
22.2
61,
251.
7247
,673
.98
Othe
r Com
preh
ensi
ve In
com
e fo
r the
yea
r (ne
t of t
axes
)-
--
-(6
,848
.44)
-(1
03.7
3)-
(6,9
52.1
7)-
(6,9
52.1
7)To
tal C
ompr
ehen
sive
Inco
me
for t
he y
ear
--
--
(6,8
48.4
4)-
(103
.73)
46,4
22.2
639
,470
.09
1,25
1.72
40,7
21.8
1Al
lotm
ent o
f sha
res
unde
r Em
ploy
ee S
tock
Opt
ion,
2008
0.71
27.2
3-
--
--
-27
.23
-27
.94
Tran
sfer
from
Sur
plus
in th
e St
atem
ent o
f Pro
fit a
nd L
oss
to
Stat
utor
y Re
serv
e-
--
2.50
--
-(2
.50)
--
-Fi
nal d
ivide
nd p
aid
--
--
--
-(8
,396
.07)
(8,3
96.0
7)-
(8,3
96.0
7)Sp
ecia
l (In
terim
) divi
dend
pai
d (F
Y 20
16-1
7) (R
efer
not
e 41
)-
--
--
--
(7,9
96.9
7)(7
,996
.97)
-(7
,996
.97)
Divid
end
Dist
ribut
ion
Tax
--
--
--
-(3
,295
.72)
(3,2
95.7
2)-
(3,2
95.7
2)Di
viden
d Di
strib
utio
n Ta
x cr
edit
on a
ccou
nt o
f divi
ded
rece
ived
from
sub
sidi
arie
s-
--
--
--
275.
2827
5.28
-27
5.28
Acqu
isiti
on o
f Non
-Con
trollin
g in
tere
st-
--
--
--
(229
.99)
(229
.99)
(530
.15)
(760
.14)
Disp
osal
of i
nter
est i
n su
bsid
iary
--
--
--
--
-(4
49.4
0)(4
49.4
0)Cu
rrenc
y tra
nsla
tion
adju
stm
ent
--
--
--
--
-(8
62.2
6)(8
62.2
6)Ba
lanc
e at
Mar
ch 3
1, 2
017
7,99
6.97
35,4
79.7
67,
144.
3266
.63
23,1
98.8
710
,961
.30
(206
.22)
230,
148.
0930
6,79
2.75
36,1
50.2
235
0,93
9.94
See
acco
mpa
nyin
g no
tes
form
ing
part
of t
he c
onso
lidat
ed fi
nanc
ial s
tate
men
ts
In t
erm
s o
f o
ur r
epo
rt a
ttac
hed
F
or
and
on
beh
alf
of
the
Bo
ard
of
Dire
cto
rs
Fo
r D
elo
itte
Has
kins
& S
ells
Cha
rter
ed A
ccou
ntan
ts
M K
Ana
ntha
nara
yana
n R
aj S
hank
ar
E H
Kas
turi
Ran
gan
P
artn
er
Man
agin
g D
irect
or
Who
le-T
ime
Dire
ctor
(D
IN-0
0238
790)
(D
IN-0
1814
089)
S V
Kri
shna
n M
Mut
huku
mar
asam
y
C
hief
Fin
anci
al O
ffice
r C
ompa
ny S
ecre
tary
Pla
ce :
Che
nnai
D
ate
: M
ay 2
5, 2
017
Annual Report
2016–2017141
Annual Report
2016–2017140
Notes to Consolidated financial statements for the Year ended March 31, 2017
1. Overview
Redington (India) Limited (“the Company/Parent Company”), is a public limited Company domiciled in India and incorporated under the provisions of the Companies Act, 1956. The Company’s equity shares are listed on the bourses of BSE Limited and National Stock Exchange of India Limited. The Company, its fifty six subsidiaries (including fifty one overseas subsidiaries and step-down subsidiaries) and an associate operate in India, Middle East, Turkey, Africa and South Asian countries and are engaged mainly in the business of Information Technology & Mobility product distribution besides supply chain solutions and after sales service. The Company has an operating branch in Singapore.
2. Statement of Compliance
TheConsolidatedfinancialstatementsofCompanyanditssubsidiaries(togetherthe'Group')andanassociate&itssubsidiaryhavebeen prepared in accordance with Ind AS’s notified under the Companies (Indian Accounting Standards) Rules, 2015. Upto the year ended March 31, 2016 the Group and its associate prepared its financial statements in accordance with the requirements of previous GAAP,whichincludesStandardsnotifiedundertheCompanies(AccountingStandards)Rules,2006.ThesearetheGroup'sfirstIndAS financial statements. The date of transition to Ind AS is April 1, 2015. Refer Note 39 for the details of first-time adoption exemptions availed by the Group.
3. Basis of Preparation and presentation of financial statements and Consolidation
(i) The Consolidated Financial Statements of the Group and its Associate have been prepared in accordance with the Indian Accounting Standards (Ind AS) as specified under Section 133 of the Companies Act, 2013 (“the Act”) read with Rule 3 of the Companies (Indian Accounting Standards) Rules 2016. Being first Ind AS financial statements, the Group has adopted all the applicableIndASStandardsinaccordancewith–FirsttimeAdoptionofIndianAccountingStandards(IndAS101)andtheimpactontransitionhasbeenadjustedtotheReservesasatApril1,2015.
(ii) The Consolidated Financial Statements have been prepared on accrual basis under the historical cost convention except for the following:
a. Financial instruments at fair value through profit or loss are measured at fair value. (Refer note 5t for details regarding fair value)
b. Lease deposits, the initial fair value of which is estimated at the present value of the deposits, are discounted using the prevailing market rates of Government securities. The difference between the initial fair value and the refundable amount of the deposit is recognized as a lease rent over the lease period.
The accounting policies adopted in the preparation of the Consolidated Financial Statements are in line with Ind AS.
(iii) The Consolidated Financial Statements encompass financials of the Company and its subsidiaries for the year ended March 31, 2017. These Consolidated Financial Statements have been prepared in accordance with Ind AS 27, “Consolidated and Separate Financial Statements”. These Consolidated financials also include results of an Associate and its subsidiary accounted under Equity method as specified in Accounting Standard Ind AS 28 “Investments in Associates”.
(iv) The Consolidated financial statements are presented in Indian Rupees (`) which is the Group’s functional/presentation currency. All financial information presented in Indian Rupees has been rounded up to the nearest Lakhs unless otherwise indicated.
The following are the list of Direct and Step-down subsidiaries of the Company that are consolidated.
A. (i) Direct Subsidiaries
Name of the Company Principal business activityCountry of
Incorporation
Ownership / Beneficial Interest %
(As at March 31, 2017, March 31, 2016 and
April 1, 2015)
Nook Micro Distribution Limited@
Engaged in Micro distribution of IT and telecom products
India -
Cadensworth (India) Limited*
Distribution business and provides component level Repair services for the Information Technology (IT) products and also provides the services of part replacement for mission critical products in the IT and Telecom space and Logistics support service.
India 100
ProConnect Supply Chain Solutions Limited
Comprehensive Supply Chain Management (SCM), providing total logistics solution services including warehousing management and allied services for various corporate customers
India 100
Name of the Company Principal business activityCountry of
Incorporation
Ownership / Beneficial Interest %
(As at March 31, 2017, March 31, 2016 and
April 1, 2015)
Ensure Support Services (India) Limited
Engaged in the business of providing warranty and post warranty services, annual maintenance contract services, on-site support services and other related services.
India 100
Redington International Mauritius Limited (RIML)
Distribution of Information technology and Telecommunication products and spare parts, providing hardware support and maintenance services
Mauritius 100
Redington Distribution Pte. Limited (RDPL)
Importer and Exporter of computers, computer peripherals and components.
Singapore 100
@ Merged with the Parent Company on April 1, 2015.
* The Board of Directors at its meeting held on May 24, 2016 approved the proposed merger of Cadensworth (India) Limited, a Wholly-ownedsubsidiarywiththeCompanywitheffectfromApril1,2016,underaschemeofArrangement(Merger),subjecttothesanctionbytheHon’bleMadrasHighCourt.BothNationalStockExchangeofIndiaLimited(NSE)andBSELimited(BSE)havecommunicatednoobjectioninthisregard.
PursuanttothenotificationbytheMinistryofCorporateAffairs,thepetitionfortheapprovalofschemefiledwiththeHon’bleMadrasHighCourthasbeentransferredtoNationalCompanyLawTribunal(NCLT),ChennaiBench.ApprovalfromNCLTispending.Howeverthere is no impact in the consolidated financial statements.
B. (i) Step-down Subsidiaries
Name of the Company Principal business activityCountry of
Incorporation
Ownership Interest of the Group
%
Beneficial Interest of the Group
%
As at March 31, 2017, March 31, 2016 and
April 1, 2015
Redington Gulf FZE Distribution of information technology products, providing hardware support and maintenance services.
Dubai, UAE
100 100
Redington Egypt Ltd(Limited liability company)
Distribution of information technology products, providing hardware support and maintenance services.
Cairo,Egypt
100 100
Redington Nigeria Limited Distribution of information technology products, providing hardware support and maintenance services.
Lagos,Nigeria
100 100
Redington Gulf & Co. LLC Distribution of information technology products, providing hardware support and maintenance services.
Ruwi,Oman
70 100
Redington Kenya Limited Distribution of information technology products, providing hardware support and maintenance services.
Nairobi,Kenya
100 100
Cadensworth FZE Distribution of information technology products and spare parts.
Dubai, UAE 100 100
Redington Middle East LLC^
Distribution of information technology products, providing hardware support and maintenance services.
Dubai,UAE
49 100
Ensure Services Arabia LLC
Providing hardware support and maintenance services. Riyadh, Saudi Arabia
100 100
Redington Africa Distribution FZE
Distribution of information technology and telecommunication products.
Dubai, UAE 100 100
Redington Qatar WLL^ Providing hardware support and maintenance services. Dubai,UAE
49 100
Ensure Services Bahrain S.P.C.
Providing hardware support and maintenance services. Manama,Kingdom of
Bahrain100 100
Annual Report
2016–2017143
Annual Report
2016–2017142
Name of the Company Principal business activityCountry of
Incorporation
Ownership Interest of the Group
%
Beneficial Interest of the Group
%
As at March 31, 2017, March 31, 2016 and
April 1, 2015
Redington Qatar Distribution W.L.L.^
Providing hardware support and maintenance service. Doha,Qatar
49 100
Redington Limited Distribution of information technology products, providing hardware support and maintenance services.
Accra,Ghana
100 100
Redington Kenya (EPZ) Limited
Distribution of information technology products, providing hardware support and maintenance services.
Nairobi,Kenya
100 100
Africa Joint Technical Services*#
Providing hardware support and maintenance services. Tripoli,Libya
65 100
Redington Uganda Limited
Distribution of information technology products, providing hardware support and maintenance services.
Kampala,Uganda
100 100
Cadensworth UAE LLC^ Distribution of information technology products, providing hardware support and maintenance services.
Dubai,UAE
49 100
Redington Tanzania Limited
Distribution of information technology products, providing hardware support and maintenance services.
Dar e saalam,Tanzania
100 100
Redington Morocco Limited
Distribution of information technology products, providing hardware support and maintenance services.
Casablanca,Morocco
100 100
Redington Angola Ltd*# Distribution of information technology products, providing hardware support and maintenance services.
Luanda,Angola
100 100
EnsureIT Services (pty) LTD
Providing hardware support and maintenance services. Johannesburg, South Africa
100 100
Redington Gulf FZE Co** Distribution of information technology products, providing hardware support and maintenance services.
Erbil,Iraq
100 100
Redington Turkey HoldingsS.A.R.L
Investments in companies which are engaged in supply chain and related business.
Luxembourg city, Grand Duchy of
Luxembourg
100 100
Arena Bilgisayar Sanayi Ve Ticaret A.S.#
Distribution of information technology and telecommunication products.
Istanbul,Turkey
49.40 49.40
Arena International FZE@ Computer software trading, computerequipment requisites trading,telephones and telecommunicationequipment trading, computer and dataprocessing requisites trading.
Dubai, UAE 49.40 49.40
Redington Bangladesh Limited
Engaged in the business of providing warranty and post warranty services, annual maintenance contract services.
Dhaka,Bangladesh
99 100
Redington SL (Private) Limited
Wholesale distribution of Information Technology products and spare parts.
Colombo,Sri Lanka
100 100
Redington Rwanda Ltd Distribution of information technology products, providing hardware support and maintenance services.
Kigali,Rwanda
100 100
Redington Kazakhstan LLP
Distribution of information technology and telecommunication products.
Almaty,Kazakhstan
100 100
Ensure Gulf FZE Providing hardware support and maintenance services. Dubai, UAE 100 100
Ensure Technical Services (PTY) LTD**
Providing hardware support and maintenance services. Johannesburg,South Africa
100 100
Ensure Middle East Trading LLC^
Providing hardware support and maintenance services. Dubai,UAE
49 100
Name of the Company Principal business activityCountry of
Incorporation
Ownership Interest of the Group
%
Beneficial Interest of the Group
%
As at March 31, 2017, March 31, 2016 and
April 1, 2015
Ensure Solutions Nigeria Limited
Providing hardware support and maintenance services. Lagos,Nigeria
99.90 100
Ensure Technical Services Kenya Limited
Providing hardware support and maintenance services. Nairobi,Kenya
100 100
Ensure Services Uganda Limited
Providing hardware support and maintenance services. Kampala,Uganda
100 100
Ensure Technical Services Tanzania Limited
Providing hardware support and maintenance services. Dar e saalam,Tanzania
100 100
Ensure Ghana Limited Providing hardware support and maintenance services. Accra,Ghana
100 100
Proconnect Supply Chain Logistics LLC^
Providing logistic services.Dubai, UAE 49 100
Ensure Technical Services Morocco Limited (Sarl)
Providing hardware support and maintenance services. Casablanca, Morocco
Proconnect Saudi LLC** Providing logistics services Riyadh,Saudi Arabia
100 100
Redserv Business Solutions Private Limited**
Business process consulting and outsourcing Chennai,India
100 100
Redington Distribution Company LLC**
Distribution of information technology and telecommunication products
Cairo, Egypt 99 100
Explanations:
1. *@ There is a definitive commitment to purchase the balance 20% stake before May, 2018 on equitable basis (Refer note 34(c)).
The details of Consideration transferred for the control acquired in the previous financial year are as below. The balance was accounted as Non-controlling interest.
` in Lakhs
Particulars 31-Mar-2016 (70%)
Consideration transferred (A) 3,566.09
Fair value of Net Assets acquired including cash and bank balances (B) 3,112.61
Excess consideration over net assets acquired, allocated as follows(A-B) 453.48
Goodwill(Refer Note 7) 245.49
Call option(Accounted as derivative financial asset-Refer Note 14)* 207.99
* Call option represents the option to purchase the remaining net assets of Linkplus Bilgisayar Sistemleri Sanayi Ve Ticaret A.S. (Linkplus)
During the year, the Group acquired an additional 10% of Linkplus with carrying value of 530.15 Lakhs for a consideration of 760.14 Lakhs inclusive of a call option of ` 27.30 Lakhs which was exercised. This being a common control transaction, the premium paid over the carrying value is recognized as a reduction from retained earnings. Movement in Call option is as below.
` in Lakhs
Particulars 31-Mar-17
Balance at the beginning of the year (Refer note 14(b)) 207.99
Exercised during the year (27.30)
Gain on increase in fair value 66.25
CurrencyTranslationAdjustment (5.63)
Balance at the end of the year (Refer note 14(b)) 241.31
2. @^ On March 31, 2017, the entire holdings of the Group in Adeo have been sold to the existing shareholders of Adeo. The net assets of the subsidiary as at date of sale are as follows:
` in Lakhs
Particulars 31-Mar-17
Total Assets (A) 2,403.91
Total Liabilities (B) 1,486.77
Total Net assets (A-B) C 917.14
` in Lakhs
Particulars 31-Mar-17
Non-Controlling interest (D) (449.40)
Total Net assets (C-D) E 467.74
Goodwill (F) 183.54
Identifiable Net assets (E+F) G 651.28
Sale Proceeds Receivable (H) 972.75
Currency Translation adjustment (H-G-I) (10.46)
Gain on disposal (I) (Refer note 23) 331.93
3. ** Yet to commence operations.
4. ^ Although the holding is less than 50% of Equity Shares, the Group has the power over these companies, is exposed to or has rights to variable returns from its involvement with these Companies and has the ability to use its power over these Companies to affect its returns and therefore exercises effective control. Consequently, these entities are considered as its subsidiaries and sub-subsidiaries and are consolidated.
5. #/@ RedingtonTurkeyHoldingsS.A.R.L(RTHS),LuxembourghascontroloverthecompositionoftheBoardofDirectorsofArenaBilgisayar Sanayi Ve Ticaret Anonim Şirketi’s (Arena).Consequently Arena and its subsidiaries are considered for consolidation.
6. *# Operations ceased.
Details of Non-wholly owned subsidiaries of the Group that have Non-Controlling interests
The below is the summarised consolidated financial information of subsidiaries with material non-controlling interest, Arena and Linkplus before intra-group eliminations.
` in Lakhs
Particulars March 31, 2017 March 31, 2016 April 1, 2015
Current assets 121,988.72 107,691.22 125,654.12
Non-current assets 1,079.61 26,930.53 25,807.81
Current liabilities 71,458.90 62,892.15 86,061.01
Non-current liabilities 808.63 926.79 1,385.67
Equity attributable to the shareholders of Arena 14,652.11 35,636.20 32,266.89
Net Cash from Operating activities 5,626.11 7,139.64
Net Cash (used in) investing activities (608.44) (167.44)
Net Cash (used in) financing activities (4,650.62) (17,611.19)
C. (i) Associate of the Company
Name of the Company Country of IncorporationOwnership/Beneficial Interest %
(As at March 31, 2017, March 31, 2016 and April 1, 2015)
Redington (India) Investments Limited* India 47.62
Annual Report
2016–2017147
Annual Report
2016–2017146
(ii) Subsidiary of Associate
Name of the Company Country of IncorporationOwnership/Beneficial Interest %
(As at March 31, 2017, March 31, 2016 and April 1, 2015)
Currents Technology Retail (India) Limited* India 47.62
* In line with Ind AS 28, loss absorbed till March 31, 2017 in the Consolidated Financial Statements is equivalent to the total investment made for ` 10.00 Lakhs and the Group’s proportionate share of unabsorbed loss and Cumulative loss in line with Equity method of accounting, for the year March 31, 2017 is ` 179.87 Lakhs (Previous year is ` 297.98 Lakhs) and as at March 31, 2017 is ` 898.06 Lakhs (As at March 31, 2016 is ` 718.19 Lakhs and April 1, 2015 is ` 420.21 Lakhs) respectively.
4. Preparation of Consolidated Financial statements
a. Critical Judgments
i. Control
The Consolidated financial statements incorporate the financial statements of the Company and entities controlled by the Company and its subsidiaries. Control is achieved when the Company:
The Company reassesses whether or not it controls an investee if facts and circumstances indicate that there are changes to one or more of the three elements of control listed above.
WhentheCompanyhas lessthanamajorityof thevotingrightsofan investee, ithaspowerover the investeewhenthevoting rights are sufficient to give it the practical ability to direct the relevant activities of the investee unilaterally. The Company considers all relevant facts and circumstances in assessing whether or not the Company’s voting rights in an investee are sufficient to give it power, including:
• anyadditionalfactsandcircumstancesthatindicatethattheCompanyhas,ordoesnothave,thecurrentabilitytodirectthe relevant activities at the time that decisions need to be made, including voting patterns at previous shareholders’ meetings.
ii. Revenue Recognition
The Group has considered the detailed criteria for the recognition of revenue from the sale of goods and from rendering of services set out in Ind AS 18 Revenue and in particular whether the Group has transferred the risks and rewards of ownership of the goods and whether it is probable that the economic benefits associated with the transaction will flow to the Group. Based on the acceptance by the customer of the liability for the goods sold and services rendered, the Group is satisfied that the significant risks and rewards have been transferred and that it is probable that the economic benefits associated with the transaction will flow to the Group and the recognition of the revenue is appropriate.
iii. Intangible asset - Trade name
The Group considers that the acquired trade name, encompassing trademark, brand name, reputation and standing in the industry, which is separately identifiable and controlled by the Group, has an indefinite useful life, and is best valued using the ‘relief from royalty’ method in which a rate of 0.75% of revenue has been employed by the Group. The Group considers this to have an indefinite useful life on the basis that there is no foreseeable limit to the period over which the asset is expected to generate net cash inflows.
iv. Useful lives of Property, Plant and Equipment
The cost of Property, Plant and Equipment is depreciated over the estimated useful life, which is based on expected usage of the asset, expected physical wear and tear, the repair and maintenance program and technological obsolescence arising from changes and the residual value.
Recent accounting pronouncements (Standards issued but not yet effective)
In March 2017, the Ministry of Corporate Affairs issued the Companies (Indian Accounting Standards) (Amendments) Rules, 2017, notifying amendments to Ind AS 7, ‘Statement of cash flows’ andInd AS 102, ‘Share-based payment.’ These amendments are in accordance with the recent amendments made by International Accounting Standards Board (IASB) to IAS 7, ‘Statement of cash flows’ and IFRS 2, ‘Share-based payment,’ respectively. The first amendment is applicable to the Group from April 1, 2017.
Amendment to Ind AS 7:
The amendment to Ind AS 7 requires the Group to provide disclosures that enable users of financial statements to evaluate changes in liabilities arising from financing activities, including both changes arising from cash flows and non-cash changes, suggesting inclusion of a reconciliation between the opening and closing balances in the balance sheet for liabilities arising from financing activities, to meet the disclosure requirement.
Amendment to Ind AS 102:
The amendment to Ind AS 102 provides specific guidance to measurement of cash-settled awards, modification of cash-settled awards and awards that include a net settlement feature in respect of withholding taxes. It clarifies that the fair value of cash-settled awards is determined on a basis consistent with that used for equity-settled awards. Market-based performance conditions and non-vesting conditions are reflected in the ‘fair values’, but non-market performance conditions and service vesting conditions are reflected in the estimate of the number of awards expected to vest. Also, the amendment clarifies that if the terms and conditions of a cash-settled share-based payment transaction are modified with the result that it becomes an equity-settled share-based payment transaction, the transaction is accounted for as such from the date of the modification. Further, the amendment requires the award that includes a net settlement feature in respect of withholding taxes to be treated as equity-settled in its entirety. The cash payment to the tax authority is treated as if it was part of an equity settlement.
b. Basis and Principles
Consolidation of a subsidiary begins when the Company obtains control over the subsidiary and ceases when the Company loses control of the subsidiary. Specifically, income and expenses of a subsidiary acquired or disposed of during the year are included in the consolidated statement of profit and loss from the date the Company gains control until the date the Company ceases to control the subsidiary.
The audited financial statements of the Company and all its subsidiaries and step-down subsidiaries used in the Consolidation are drawn up to the same reporting date as that of the Company.
a. Financial Statements of Redington (India) Limited is prepared in accordance with Ind AS under historical cost convention (but forexceptionsmentionedin3(ii(b))above),onaccrualbasisandauditedbyDeloitteHaskins&Sells,Chennai.
b. Financial Statements of Cadensworth (India) Limited and erstwhile subsidiary Nook Micro Distribution Limited and the Consolidated Financial Statements of Redington (India) Investments Limited (Associate) and its subsidiary are prepared in accordance with Ind AS under historical cost convention (but for exceptions mentioned in 3(ii(b)) above), on accrual basis andauditedbyM/s.A.S.Varadharajan&Co,Chennai.
c. Consolidated Financial Statements of ProConnect Supply Chain Solutions Limited and Standalone Financial Statements of Ensure Support Services (India) Limited are prepared in accordance Ind AS under historical cost convention (but for exceptions mentioned in 3(ii(b)) above), on accrual basis and audited by BSR & Co. LLP, Chennai.
d. Consolidated Financial Statements of Redington International Mauritius Limited are prepared in accordance with International Financial Reporting Standards (IFRS) and audited by Deloitte, Mauritius.
e. Consolidated Financial Statements of Redington Distribution Pte. Limited and the Singapore Branch of the Company are prepared in accordance with Singapore Financial Reporting Standards (SFRS) and audited by Ernst & Young LLP, Singapore.
The Consolidated Financial Statements have been prepared using uniform Accounting Policies on the following basis:
a) The financial information of the Company and its subsidiaries has been combined on a line-by-line basis of assets, liabilities, income and expenses.
b) All intra-group assets and liabilities, equity, income, expenses, and cash flows relating to transactions between members of the Group are eliminated in full on consolidation.
c) The difference between the cost of investment in the subsidiaries and the Company’s share of Net assets at the time of acquisition of shares in the subsidiaries is recognized in the Consolidated Financial Statements as Goodwill or Capital Reserve asthecasemaybe.The'Goodwill’/'CapitalReserve'isdeterminedseparatelyforeachsubsidiaryCompany/jointlycontrolledentity and such amounts are not set off between different entities.
d) With respect to the Associate, the loss to the extent of cost of our investment is written off and the investment is reported at NIL value in line with Equity method of accounting in Ind AS 28.
5. Summary of Significant Accounting Policies
a. Use of Estimates / Judgments
Thepreparationofthefinancialstatementsinconformitywith IndAS, requirestheManagementtomakeestimatesandjudgmentsconsidered in the reported amounts of assets and liabilities (including contingent assets and liabilities) and the reported income andexpensesduringtheyear. TheManagementbelievesthattheestimates/judgmentsusedinpreparationofthefinancialstatements are prudent and reasonable. Future results could differ due to these estimates and the differences between the actual results and the estimates are recognised in the periods in which the results are known / materialise.
Annual Report
2016–2017149
Annual Report
2016–2017148
b. Accounting for Changes in Group’s ownership interests
(i). In existing Subsidiaries/Associate
ChangesintheGroup'sownershipinterestsinsubsidiariesthatdonotresultintheGrouplosingcontroloverthesubsidiariesareaccountedforasequitytransactions.ThecarryingamountsoftheGroup'sinterestsandthenon-controllinginterestsareadjustedtoreflectthechangesintheirrelativeinterestsinthesubsidiaries.Anydifferencebetweentheamountbywhichthenon-controllinginterestsareadjustedandthefairvalueoftheconsiderationpaidorreceivedisrecogniseddirectlyinequityand attributed to shareholders of the Company.
When the Group loses control of a subsidiary, a gain or loss is recognised in profit or loss and is calculated as the difference between (i) the aggregate of the fair value of the consideration received and the fair value of any retained interest and (ii) the previous carrying amount of the assets (including goodwill), and liabilities of the subsidiary and any non-controlling interests. All amounts previously recognised in other comprehensive income in relation to that subsidiary are accounted for as if the Group had directly disposed of the related assets or liabilities of the subsidiary (i.e. reclassified to profit or loss or transferred to another category of equity as specified/permitted by applicable Ind AS). The fair value of any investment retained in the former subsidiary at the date when control is lost is regarded as the fair value on initial recognition for subsequent accounting under Ind AS 109, or, when applicable, the cost on initial recognition of an investment in an associate.
(ii). Business Combinations
Acquisitions of businesses are accounted for using the acquisition method except for ‘common control’ transactions that are accounted for using pooling of interest method. The consideration transferred in a business combination is measured at fair value, which is calculated as the sum of the acquisition-date fair values of the assets transferred by the Group, liabilities incurred by the Group to the former shareholders of the acquiree and the equity interests issued by the Group in exchange for control of the acquiree. Acquisition-related costs are generally recognized in profit or loss as incurred.
At the acquisition date, the identifiable assets acquired and the liabilities assumed are recognised at their fair value.
Goodwill is measured as the excess of the sum of the consideration transferred, the amount of any non-controlling interests in the acquiree, and the fair value of the acquirer’s previously held equity interest in the acquiree (if any) over the net of the acquisition-date amounts of the identifiable assets acquired and the liabilities assumed.
If, after reassessment, net of the acquisition-date amounts of the identifiable assets acquired and liabilities assumed exceeds the sum of the consideration transferred, the amount of any non-controlling interests in the acquiree and the fair value of the acquirer’s previously held interest in the acquiree (if any), the excess is recognised in the Other Comprehensive income.
(iii). Non-Controlling interest
Non-controlling interests that have present ownership interests and entitle their holders to a proportionate share of the entity’s net assets in the event of liquidation may be initially measured either at fair value or at the non-controlling interests’ proportionate share of the recognised amounts of the acquiree’s identifiable net assets.
c. Property, Plant and Equipment & Intangible assets
Property, Plant and Equipment
Property, Plant and Equipment except Capital work in progress is stated at cost, net of accumulated depreciation and impairment losses, if any. Capital work in progress is stated at cost less any recognised impairment loss. Cost comprises of purchase price and other directly attributable cost of bringing the assets to its working condition for the intended use. Subsequent costs are included in the asset’s carrying amount or recognised as a separate asset, as appropriate, only when it is probable that future economic benefits associated with the item will flow to the Group and the cost of the item can be measured reliably.
Gains or losses arising from de-recognition of Property, Plant and Equipment are measured as the difference between the net proceeds from disposal/net realizable value and carrying amount of the asset and are recognized in the Consolidated Statement of Profit and Loss. For the purpose of consolidation, additions to fixed assets of overseas subsidiaries have been converted at average rate and closing balance at closing rate. All other repairs and maintenance costs are charged to the Consolidated Statement of Profit and Loss as and when required.
Depreciation on Property Plant and Equipment
1. Depreciable amount for assets is the cost of an asset, or other amount substituted for cost, less its estimated residual value.
2. Depreciation on Property, Plant and Equipment has been provided on the straight-line method as per the useful life assessed as under based on technical estimate, taking into account the nature of the asset, the estimated usage of the asset, manufacturers warranties and maintenance support, etc.
3. Depreciation on additions to assets is provided from the month of addition
4. Individual asset whose cost does not exceed ` 5,000/- are fully depreciated in the month of addition, in case of the Company and its Indian subsidiaries.
5. Expenditure on Interiors on premises taken on lease (included in furniture & fixtures) are capitalized and depreciated over a period of five years.
Intangible assets
1. Intangible assets acquired separately
1. Intangible assets are stated at cost less amortization and impairment losses, if any. For the purpose of consolidation of overseas subsidiaries, additions have been converted at average rate and closing balance at closing rate.
2. Intangible assets are amortized over the estimated useful economic life, on a straight line basis.
Class of Asset Years
SoftwareContract based intangible assets (Including employment contracts)
03-05
05-10
3. The estimated useful life of the intangible assets and the amortization period are reviewed at the end of each financial year and the amortization period is revised to reflect the changed pattern, if any.
4. An intangible asset is de-recognized on disposal, or when no future economic benefits are expected from its use or disposal. Gains or losses arising from de-recognition of an intangible asset, measured as the difference between the net disposal proceeds and the carrying amount of the asset are recognized in the Consolidated Statement of Profit and Loss when the asset is de-recognized.
2. Intangible assets acquired in a business combination
Intangible assets that are acquired in a business combination are recognized separately from goodwill and are initially recognized at their fair value at the acquisition date (which is regarded as their cost). Subsequent to initial recognition, intangible assets acquired in a business combination are reported at cost less accumulated amortization and accumulated impairment losses, on the same basis as intangible assets that are acquired separately.
The following useful lives are used in the calculation of amortisation.
Class of Asset Years
Trade name*Customer relationshipContract based intangible assets (Including employment contracts)
Indefinite07
05-10
* Intangible assets with indefinite useful lives are acquired separately and are carried at cost less accumulated impairment losses.
De-recognition of intangible assets
An intangible asset is de-recognized on disposal, or when no future economic benefits are expected from its use or disposal. Gains or losses arising from de-recognition of an intangible asset, measured as the difference between the net disposal proceeds and the carrying amount of the asset are recognized in the Consolidated Statement of Profit and Loss when the asset is de-recognized.
Goodwill
Goodwill arising on an acquisition of a business is carried at cost as established at the date of acquisition of the business (Refer Note 5.b (ii) above) less accumulated impairment losses, if any.
For the purposes of impairment testing, goodwill is allocated to each of the Group’s cash-generating units (or groups of cash-generating units) that is expected to benefit from the synergies of the combination.
Annual Report
2016–2017151
Annual Report
2016–2017150
A cash-generating unit to which goodwill has been allocated is tested for impairment annually, or more frequently when there is indication that the unit may be impaired. If the recoverable amount of the cash-generating unit is less than its carrying amount, the impairment loss is allocated first to reduce the carrying amount of any goodwill allocated to the unit and then to the other assets of the unit on a pro-rata based on the carrying amount of each asset in the unit.
For consolidation purpose, Goodwill is stated at the closing rates that exists as on a particular reporting date in accordance with Ind AS 21, The Effects of Changes in Foreign Exchange Rates.
d. Impairment of Intangible assets, Goodwill and Property, Plant and Equipment
At each Reporting date, the Group assesses whether there is any indication that an asset with finite lives may be impaired. If there is any indication of impairment exists, the recoverable amount of the asset is estimated in order to determine the extent of the impairment if any. The recoverable amount is determined for an individual asset, unless the asset does not generate cash inflows that are largely independent of those from other assets or group of assets. Where it is not possible to estimate the recoverable amount of individual asset, the Group estimates the recoverable amount of cash-generating unit to which the asset belongs.
Intangible assets with indefinite useful lives are tested for impairment at least annually, and whenever there is an indication that the asset may be impaired. Recoverable amount is the higher of fair value less costs of disposal and value in use. In assessing value in use, the estimated future cash flows are discounted to their present value using a pre-tax discount rate that reflects current market assessments of the time value of money and the risks specific to the asset for which the estimates of future cash flows havenotbeenadjusted.
If the recoverable amount of an asset (or cash-generating unit) is estimated to be less than its carrying amount, the carrying amount of the asset (or cash-generating unit) is reduced to its recoverable amount. An impairment loss is recognised immediately in profit or loss.
When an impairment loss subsequently reverses, the carrying amount of the asset (or a cash-generating unit) is increased to the revised estimate of its recoverable amount, but so that the increased carrying amount does not exceed the carrying amount that would have been determined had no impairment loss been recognised for the asset (or cash-generating unit) in prior years. A reversal of an impairment loss is recognised immediately in profit or loss.
Any impairment loss for goodwill is recognized directly in profit or loss. An impairment loss recognized for goodwill is not reversed in subsequent periods. On disposal of the relevant cash-generating unit, the attributable amount of goodwill is included in the determination of the profit or loss on disposal.
e. Leases
Leases, where the lessor effectively retains substantially all the risks and rewards incidental to ownership of the leased item are classified as operating leases. Lease Rentals under operating leases are recognised in the Consolidated Statement of Profit and Loss.
f. Inventories
Inventories are stated at lower of cost and the net realizable value. Costs includes cost of purchase and other costs incurred in bringing the inventories to the present location and condition, net of discounts and rebates and is determined on weighted average basis. Net realisable value represents the estimated selling price for inventories less all estimated costs of completion and the costs necessary to make the sale.
g. Foreign Currency Transactions
On initial recognition, all foreign currency transactions are stated by applying to the foreign currency amount, the exchange rate as on the date of the transaction. Gains or losses on settlement of import payments are accounted under appropriate heads and grouped as part of Cost of goods sold in the consolidated statement of profit and loss.
Forthepurposesofpresentingtheseconsolidatedfinancialstatements,theassetsandliabilitiesoftheGroup'sforeignoperationsare translated into Indian Rupees using exchange rates prevailing at the end of each reporting period. Income and expense items are translated at the average exchange rates for the period. Exchange differences arising, if any, are recognised in other comprehensive income and accumulated in equity.
On the disposal of a foreign operation all of the exchange differences accumulated in equity in respect of that operation attributable to the shareholders of the Company are reclassified to profit or loss.
Goodwill and fair value adjustments to identifiable assets acquired and liabilities assumed through acquisition of a foreignoperation are treated as assets and liabilities of the foreign operation and translated at the rate of exchange prevailing at the end of each reporting period. Exchange differences arising are recognised in other comprehensive income.
For Branch operations of the Company: Transactions of the branch operations are translated at the exchange rates prevailing on the date of the transaction or at rates that closely approximate the rate at the date of the transaction. All assets and liabilities are translated at the Closing rates and resulting exchange differences are debited / credited to Other Comprehensive income and included under Foreign Currency Translation Reserve (“FCTR”) as a component of Equity.
h. Investments
Investments that are readily realisable and are intended to be held for not more than one year from the date on which such investments are made are classified as current investments. Current investments are carried at lower of cost and fair value.
i. Revenue Recognition
1. Revenue from Sales is recognized when the significant risks and rewards of ownership and title is transferred which generally coincides with delivery. While recognizing revenue management has considered the detailed criteria for the recognition of revenue from the sale of goods set out in Ind AS 18 and in particular whether the Group had transferred the risks and rewards of ownership of the goods and whether it is probable that the economic benefits associated with the transaction will flow to the Group. Revenue from sales is stated net of discounts, rebates and sales tax.
2. Revenue from rendering of services is recognized as and when services are rendered and in accordance with the terms of agreement with the customers. Revenue from maintenance contract is considered on annuity basis proportionately over the period of the contract. Unbilled revenue represents services rendered and revenue is recognized on contracts to be billed in subsequent periods as per the terms of the related contract.
3. Income from supplier schemes is accrued, based on the fulfillment of terms of such schemes.
j. Other Income
1. Income from Operating lease is accrued over the period of lease. It is accrued, based on the transfer of right to use the premises or location of the leased property, over the lease period
2. Interest income is recognized on the time proportion basis determined by the amount outstanding and the rate applicable and where no significant uncertainty as to measurability or collectability exists. Interest income on overdue receivables is recognized only when there is a certainty of receipt.
3. Dividend income from short-term investments is accounted when right to receipt is established.
k. Employee Benefits
(i) Short-Term Employee Benefits
Short-term employee benefits including accumulated short term compensated absences determined as per Group’s policy/scheme are recognized at the Reporting date as expense based on expected obligation on an undiscounted basis.
(ii) Long-Term Employee Benefits
Defined Benefit Plan
Compensated Absences & Gratuity
The liability for Gratuity and long term compensated absences both unfunded is provided based on actuarial valuation as at the Reportingdate,usingtheProjectedUnitCreditMethod.ActuarialgainsandlossesarerecognizedintheBalancesheetwitha corresponding debit or credit through other comprehensive income in the period in which they occur. The retirement benefit obligation recognized in the Balance Sheet represents the estimated future cash outflows expected to be made by the Company and its Indian subsidiaries in respect of services provided by the employees upto the reporting date. With respect to overseas subsidiaries, provision for employee’s end of service indemnity is made in accordance with the laws as applicable in respective countries.
Defined Contribution Plan
Contribution under statutory laws relating to employee benefits, including Provident Fund and Employee State Insurance, is made in accordance with the respective Acts and is charged to the Consolidated Statement of Profit and Loss as and when services are rendered by the employees.
l. Employee share based payments
Equity-settled share-based payments are measured at the fair value of the equity instruments at the grant date. The fair value determined at the grant date of the equity-settled share-based payments is expensed on a straight-linebasis over the vesting period,basedontheGroup'sestimateofequityinstrumentsthatwilleventuallyvest,withacorrespondingincreaseinequity.
m. Taxation
Current and Deferred tax
i. Tax expense for the year, comprising current tax and deferred tax, are included in the determination of the net profit for the year except when they relate to items that are recognised in other comprehensive income or directly in equity, in which case, the current and deferred tax are also recognised in other comprehensive income or directly in equity respectively. Where current tax or deferred tax arises from the initial accounting for a business combination, the tax effect is included in the accounting for the business combination.
ii. Current tax is the amount of tax payable on the taxable income for the year as determined in accordance with the applicable tax rates and the provisions of the Acts prevailing in respective geographies.
iii. Deferred tax is recognised on temporary differences between the carrying amounts of assets and liabilities in the consolidated financial statements and the corresponding tax bases used in the computation of taxable profit. Deferred tax liabilities are generally recognised for all taxable temporary differences. Deferred tax assets are recognized for all deductible temporary
Annual Report
2016–2017153
Annual Report
2016–2017152
differences to the extent that it is probable that taxable profits will be available against which those deductible temporary differences can be utilised. Such deferred tax assets and liabilities are not recognised if the temporary difference arises from the initial recognition (other than in a business combination) of assets and liabilities in a transaction that affects neither the taxable profit nor the accounting profit. In addition, deferred tax liabilities are not recognised if the temporary difference arises from the initial recognition of goodwill.
Deferred tax liabilities are recognized for taxable temporary differences associated with investments in subsidiaries and associates except where the Group is able to control the reversal of the temporary difference and it is probable that the temporary difference will not reverse in the foreseeable future. Deferred tax assets arising from deductible temporary differences associated with such investments and interests are only recognised to the extent that it is probable that there will be sufficient taxable profits against which to utilise the benefits of the temporary differences and they are expected to reverse in the foreseeable future.
n. Provisions, Contingent Liabilities and Contingent Assets
Provisions are recognized when the Group has a present obligation (legal or constructive) as a result of a past event, it is probable that the Group will be required to settle the obligation, and a reliable estimate can be made of the amount of the obligation.
Contingent liability is disclosed for all
i. Possible obligations that arise from past events and whose existence will be confirmed only by the occurrence or non-occurrence of one or more uncertain future events not wholly within the control of the Group (or)
ii. Present obligations arising from past events where it is not probable that an outflow of resources embodying economic benefits will be required to settle the obligation or a sufficiently reliable estimate of the amount of the obligation cannot be made.
Contingent assets if any are disclosed in the financial statements if a possible asset that arises from past events and whose existence will be confirmed only by the occurrence or non-occurrence of one or more uncertain future events not wholly within the control of the Group.
o. Segment Reporting
“Operating Segments” reported are in a manner consistent with internal reporting. The reported operating segments
a. engage in business activities from which the Group earns revenues and incur expenses,
b. have their operating results regularly reviewed by the entity’s chief operating decision maker to make decisions about resources to be allocated to the segment and assess its performance, and
c. have discrete financial information available
p. Cash and Cash Equivalents
Cash comprises cash on hand and demand deposits with banks. Cash equivalents are short-term, highly liquid investments that arereadilyconvertibleintoknownamountsofcashandwhicharesubjecttoinsignificantrisksofchangesinrate.
Cash Flow Statement
Cashflowsarereportedusingtheindirectmethod,wherebyProfitaftertaxisadjustedfortheeffectsoftransactionsofnon-cashnature and any deferrals or accruals of past or future cash receipts or payments. The cash flows from operating, investing and financing activities of the Group are segregated based on the nature of the transaction.
q. Earnings per share
Basic earnings per share is computed by dividing the profit or loss after tax by the weighted average number of equity shares outstanding during the year.
Dilutedearningspershareiscomputedbydividingtheprofitorlossaftertaxasadjustedfordividend,interestandotherchargesto expense or income (net of any attributable taxes) relating to the dilutive potential equity shares, by the weighted average number of equity shares considered for deriving basic earnings per share and the weighted average number of equity shares which could have been issued on the conversion of all dilutive potential equity shares.
Potential equity shares are deemed to be dilutive only if their conversion to equity shares would decrease the net profit per share from continuing ordinary operations. Potential dilutive equity shares are deemed to be converted as at the beginning of the period,unlesstheyhavebeenissuedatalaterdate.Thedilutivepotentialequitysharesareadjustedfortheproceedsreceivablehad the shares been actually issued at fair value (i.e. average market value of the outstanding shares). Dilutive potential equity shares are determined independently for each period presented. The number of equity shares and potentially dilutive equity sharesareadjustedforsharesplits/reversesharesplitsandbonusshares,asappropriate.
r. Derivative financial instruments
The Company and its Indian Subsidiaries uses foreign currency forward contracts to hedge its risks associated with foreign currency fluctuations relating to certain firm commitments and highly probable forecast transactions No derivative financial instruments are held for speculative purposes. Forward contracts are initially recognised at transaction value on the date the
contract is entered into and are subsequently re-measured to Mark to Market (MTM) at each reporting date. The resulting gain or loss is recognised in Consolidated Statement of Profit and Loss.
s. Financial instruments
Financial assets and financial liabilities are recognized when the Group becomes a party to the contractual provisions of the instrument.
Financial assets and financial liabilities are initially measured at fair value. Transaction costs that are directly attributable to the acquisition or issue of financial assets and financial liabilities (other than financial assets and financial liabilities at fair value through profit or loss) are added to or deducted from the fair value of the financial assets or financial liabilities, as appropriate, on initial recognition. Transaction costs directly attributable to the acquisition of financial assets or financial liabilities at fair value through profit or loss are recognised immediately in profit or loss.
Financial assets
Financial assets are classified into the following specified categories: financial assets ‘at fair value through profit or loss’ (FVTPL) / financial assets at amortized cost. The classification depends on the nature and purpose of the financial assets and is determined at the time of initial recognition.
Effective interest method
The effective interest method is a method of calculating the amortized cost of a financial asset and of allocating interest income over the relevant period. The effective interest rate is the rate that exactly discounts estimated future cash receipts (including all fees on points paid or received that form an integral part of the effective interest rate, transaction costs and other premiums or discounts) through the expected life of the financial asset, or, where appropriate, a shorter period to the net carrying amount on initial recognition.
Impairment of financial assets
At every Reporting date the Group assesses whether financial assets carried at amortised costs are credit impaired. A financial asset is ‘credit impaired’ when one or more events that have a detrimental impact on the estimated future cash flows of the financial asset have occurred. For such assets, the Group measures loss allowances at an amount equal to lifetime expected credit losses.
With respect to Trade receivables, lifetime expected credit losses are the expected credit losses that result from all possible default events over the expected life of a financial instrument. 12 month expected credit losses are the portion of expected credit losses that result from default events that are possible within 12 months after the reporting date (or a shorter period if the expected life of the instrument is less than 12 months). In all cases, the maximum period considered when estimating expected credit losses is the maximum contractual period over which the Group is exposed to credit risk.
When determining whether the credit risk of a financial asset has increased significantly since initial recognition and when estimating expected credit losses, the Company considers reasonable and supportable information that is relevant and available at appropriate cost or efforts.
FinancialassetscarriedatFVPTLareconsideredtobeimpairedwhenthereisobjectiveevidencethatasaresultofoneormoreevents that occurred after the initial recognition of the financial asset, the estimated future cash flows of the investment have been affected.
De-recognition of financial assets
TheGroupde-recognizesafinancialassetonlywhentheentirecontractualrightstothecashflowsfromtheassetexpire;orit transfers the financial asset and substantially all the risks and rewards of ownership of the asset to another entity. On de-recognition of a financial asset in its entirety, the difference between the asset’s carrying amount and the sum of the consideration received and receivable, is recognised in the Consolidated Statement of Profit and Loss.
Financial liabilities and equity instruments
Classification as debt or equity
Debt and equity instruments issued by the Group entity are classified as either financial liabilities or as equity in accordance with the substance of the contractual arrangements and the definitions of a financial liability and an equity instrument.
Equity instruments
An equity instrument is any contract that evidences a residual interest in the assets of an entity after deducting all of its liabilities. Equity instruments issued by the Group are stated at the proceeds received, net of direct issue costs if any.
Financial liabilities
Financial liabilities are classified as either financial liabilities ‘at FVTPL’ or financial liabilities carried at amortized cost and are recognized at fair value at the time of initial recognition and are subsequently measured at amortized cost using the effective interest rate method.
Annual Report
2016–2017155
Annual Report
2016–2017154
Financial liabilities at FVTPL
Financial liabilities are classified as at FVPTL when the financial liability is designated as a financial liability at FVTPL. This is applicable for the financial liability held for trading for the Group.
Financial liabilities subsequently measured at amortized cost
Financial liabilities that are not held-for-trading and are not designated as at FVTPL are measured at amortized cost at the end of subsequent accounting periods. The carrying amounts of financial liabilities that are subsequently measured at amortized cost are determined based on the effective interest method. Interest expense that is not capitalized as part of costs of an asset is included under finance costs.
The effective interest method is a method of calculating the amortized cost of a financial liability and of allocating interest expense over the relevant period. The effective interest rate is the rate that exactly discounts estimated future cash payments (including all fees and points paid or received that form an integral part of the effective interest rate, transaction costs and other premiums or discounts) through the expected life of the financial liability, or (where appropriate) a shorter period, to the net carrying amount on initial recognition.
De-recognition of financial liabilities
The Group de-recognizes financial liabilities when, and only when, the Group’s obligations are discharged, cancelled or expired. The difference between the carrying amount of the financial liability de-recognized and the consideration paid and payable is recognized in profit or loss.
Derivative financial instruments
For accounting of derivative financial instruments refer Note 5r.
t. Fair Value measurement
Fair value is the price that would be received to sell an asset or paid to transfer a liability in orderly transactions between market participants at the time of measurement date. The fair value of an asset or a liability is measured using the assumptions that market participants would use when pricing the asset or liability at the reporting date, assuming that market participants act in their economic best interest. Fair value for measurement and /or disclosure purpose in these consolidated financial statements is determined on such basis, except for share based payment transactions that are within the scope of Ind AS 102, leasing transactions that are within the scope of Ind AS 17, and measurements that have some similarities to fair value but are not fair value, such as net realizable value in Ind AS 2 or value used in Ind AS 36.
The fair values of financial assets and financial liabilities at the end of the reporting period approximate the amounts as shown in the consolidated statement of financial position.
Fair value hierarchy
The following details provide an analysis of financial instruments that are measured subsequent to initial recognition at fair value, grouped into Levels 1 to 3 based on the degree to which the fair value is observable and the significance of the inputs to the fair value measurement in its entirety:
• Level2 fair valuemeasurementsare thosederived from inputsother thanquotedprices includedwithinLevel1 thatareobservable for the asset or liability, either directly (i.e. as prices) or indirectly (i.e. derived from prices).
• Level3fairvaluemeasurementsarethosederivedfromvaluationtechniquesthatincludeinputsfortheassetorliabilitythatare not based on observable market data (unobservable inputs).
u. Warranties
The Original Equipment Manufacturer generally warrants the products distributed by the Company. In a few cases, as per the terms of the contracts, the Group provides post-contract services / warranty support to its customers. The Group accounts for the post-contract support / provision for warranty on the basis of the information available with the Management duly taking into account the current and past technical estimates.
v. Non-Current Assets held for sale
Non-Current assets classified as held for sale are measured at lower of their carrying value and fair value less costs to sell.
w. Dividend to Shareholders
Dividend distributed to Equity shareholders is recognized, in the period in which it is approved by the members of the Company in the Annual General Meeting. Interim dividend is recognised when approved by the Board of Directors at the Board Meeting. Both dividend and Interim dividend are recognised in the consolidated Statement of Changes in Equity.
6.
Pro
per
ty, P
lant
and
Eq
uip
men
t /
Oth
er In
tang
ible
Ass
ets
(Ref
er N
ote
5c)
` in
Lak
hs
Des
crip
tion
Gro
ss C
arry
ing
valu
eAc
cum
ulat
ed D
epre
ciat
ion
Net
Car
ryin
g va
lue
As a
t01
.04.
16Ad
ditio
nAd
ditio
ns
on
Acqu
isiti
onD
elet
ions
Tran
slat
ion
Adju
stm
ents
As a
t 31
.03.
17As
at
01.0
4.16
For t
he
Year
Del
etio
nsTr
ansl
atio
nAd
just
men
tsAs
at
31.0
3.17
As a
t31
.03.
17As
at
31.0
3.16
a. T
angi
ble
Asse
ts
Land
Cur
rent
yea
r3,
068.
93-
-1,
376.
68@
-1,
692.
25-
--
--
1,69
2.25
3,06
8.93
Prev
ious
yea
r3,
068.
93-
--
-3,
068.
93-
- -
- -
3,06
8.93
3,06
8.93
Bui
ldin
gs**
Cur
rent
yea
r8,
131.
791,
064.
07-
-(9
4.45
)9,
101.
4155
0.63
527.
27-
(33.
45)
1,04
4.45
8,05
6.96
7,58
1.16
Prev
ious
yea
r7,
879.
37-
--
252.
428,
131.
79-
489.
93-
60.7
055
0.63
7,58
1.16
7,87
9.37
Plan
t and
Equ
ipm
ent
Cur
rent
yea
r1,
170.
891,
038.
81-
201.
56(4
4.62
)1,
963.
5241
7.46
458.
5916
5.29
(26.
42)
684.
341,
279.
1875
3.43
Prev
ious
yea
r71
0.75
413.
25-
12.6
259
.51
1,17
0.89
-37
1.84
-45
.62
417.
4675
3.43
710.
75
Furn
iture
& F
ixtu
res
Cur
rent
yea
r4,
704.
091,
663.
71-
988.
77(2
32.1
6)5,
146.
871,
359.
001,
092.
3772
5.90
(175
.07)
1,55
0.40
3,59
6.47
3,34
5.09
Prev
ious
yea
r2,
589.
621,
418.
1428
4.33
130.
7454
2.74
4,70
4.09
-92
5.15
-43
3.85
1,35
9.00
3,34
5.09
2,58
9.62
Offi
ce E
quip
men
t
Cur
rent
yea
r2,
804.
231,
059.
99-
209.
53(1
28.6
2)3,
526.
0792
0.27
749.
3217
7.06
(103
.73)
1,38
8.80
2,13
7.27
1,88
3.96
Prev
ious
yea
r1,
945.
1555
7.99
40.8
250
.13
310.
402,
804.
23-
708.
96-
211.
3192
0.27
1,88
3.96
1,94
5.15
Com
pute
rs
Cur
rent
yea
r2,
414.
451,
180.
92-
335.
60(5
9.98
)3,
199.
7974
6.38
871.
8628
0.03
(38.
71)
1,29
9.50
1,90
0.29
1,66
8.07
Prev
ious
yea
r95
6.65
1,36
0.95
53.9
253
.89
96.8
22,
414.
45-
668.
49-
77.8
974
6.38
1,66
8.07
956.
65
Vehi
cles
Cur
rent
yea
r1,
060.
6656
0.03
-27
9.94
(25.
49)
1,31
5.26
313.
7630
0.22
214.
45(2
0.81
)37
8.72
936.
5474
6.90
Prev
ious
yea
r59
2.49
475.
1316
.23
90.5
667
.37
1,06
0.66
-24
7.89
-65
.87
313.
7674
6.90
592.
49
Tang
ible
ass
ets-
Tota
l
Cur
rent
yea
r23
,355
.04
6,56
7.53
-3,
392.
08(5
85.3
2)25
,945
.17
4,30
7.50
3,99
9.63
1,56
2.73
(398
.19)
6,34
6.21
19,5
98.9
619
,047
.54
Prev
ious
yea
r17
,742
.96
4,22
5.46
395.
3033
7.94
1,32
9.26
23,3
55.0
4-
3,41
2.26
-89
5.24
4,30
7.50
19,0
47.5
417
,742
.96
** B
uild
ings
con
sist
of a
dis
trib
utio
n ce
nter
in J
ebel
Ali
Free
Zon
e w
hich
is c
onst
ruct
ed o
n la
nd le
ased
for
a pe
riod
of 1
0 ye
ars
whi
ch e
nded
in A
pril
2017
. The
leas
e ha
s be
en re
new
ed o
n A
pril
24, 2
017
for
anot
her
10 y
ears
end
ing
on
Apr
il 25
, 202
7.
@ B
ased
on
a M
emor
andu
m o
f Und
erta
king
for s
ale
ente
red
into
on
Apr
il 5,
201
7 fo
r sal
e of
land
situ
ated
at D
elhi
, the
cos
t of l
and
amou
ntin
g to
` 1
,376
.68
Lakh
s to
geth
er w
ith a
mou
nt o
f ` 4
73.8
6 La
khs,
repr
esen
ting
rela
ted
capi
tal
wor
k in
pro
gres
s, a
ggre
gatin
g to
` 1
,850
.54
Lakh
s ha
s be
en re
-cla
ssifi
ed a
s "A
sset
hel
d fo
r S
ale"
.
Annual Report
2016–2017157
Annual Report
2016–2017156
Dep
reci
atio
n/A
mo
rtis
atio
n `
in L
akhs
Par
ticul
ars
2016
-17
2015
-16
Pro
pert
y, P
lant
and
Equ
ipm
ent
3,99
9.63
3,41
2.26
Inta
ngib
le a
sset
s1,
468.
011,
269.
28
Tota
l5,
467.
644,
681.
54
` in
Lak
hs
Desc
riptio
n
Gros
s Car
rying
value
Accu
mulat
ed A
morti
zatio
nNe
t Car
rying
value
As at
01
.04.16
Chan
ges
on ac
coun
t of
busin
ess
comb
inatio
n (R
efer N
ote
39)
Addit
ions
Addit
ions o
n Ac
quisi
tion
Disp
osal
on ac
coun
t of
sale
of
subs
idiar
y
Delet
ions
Trans
lation
Ad
justm
ents
As at
31
.03.17
As at
01
.04.16
For t
he Ye
arTra
nslat
ion
Adjus
tmen
tsAs
at
31.03
.17As
at
31.03
.17As
at
31.03
.16
b. O
ther
Inta
ngib
le
Asse
ts
Softw
are
Cur
rent
yea
r3,
821.
85-
447.
48-
--
(150
.08)
4,11
9.25
922.
8795
0.55
(108
.46)
1,76
4.96
2,35
4.29
2,89
8.98
Prev
ious
yea
r2,
186.
07-
1,34
4.58
4.37
-21
.78
308.
613,
821.
85-
747.
2217
5.65
922.
872,
898.
982,
186.
07
Non
-com
pete
fee*
Cur
rent
yea
r31
5.25
--
--
-(2
1.62
)29
3.63
215.
5810
0.73
(22.
68)
293.
63-
99.6
7
Prev
ious
yea
r25
7.48
--
--
-57
.77
315.
25-
171.
0444
.54
215.
5899
.67
257.
48
Trad
e N
ame
Cur
rent
yea
r22
,436
.93
--
--
-(4
84.4
9)21
,952
.44
--
--
21,9
52.4
422
,436
.93
Prev
ious
yea
r-
20,8
62.0
0-
556.
601,
018.
3322
,436
.93
--
--
22,4
36.9
320
,862
.00
Cus
tom
er re
latio
n
Cur
rent
yea
r1,
886.
47-
--
--
(39.
72)
1,84
6.75
283.
1910
4.46
(10.
46)
377.
191,
469.
561,
603.
28
Prev
ious
yea
r-
329.
40-
1,51
7.40
--
39.6
71,
886.
47-
281.
951.
2428
3.19
1,60
3.28
329.
40
Con
tract
bas
ed
inta
ngib
le a
sset
s
Cur
rent
yea
r1,
395.
98-
370.
55#
-1,
255.
51-
(17.
15)
493.
8769
.98
312.
27(0
.01)
382.
2411
1.63
1,32
6.00
Prev
ious
yea
r**-
1,11
8.13
--
--
277.
851,
395.
98-
69.0
70.
9169
.98
1,32
6.00
1,11
8.13
Inta
ngib
le a
sset
s-To
tal
Cur
rent
yea
r29
,856
.48
-81
8.03
-1,
255.
51-
(713
.06)
28,7
05.9
41,
491.
621,
468.
01(1
41.6
1)2,
818.
0225
,887
.92
28,3
64.8
6
Prev
ious
yea
r2,
443.
5522
,309
.53
1,34
4.58
2,07
8.37
-21
.78
1,70
2.23
29,8
56.4
8-
1,26
9.28
222.
341,
491.
6228
,364
.86
24,7
53.0
8*
One
of t
he s
ubsi
diar
ies
of t
he G
roup
sig
ned
a no
n-co
mpe
te a
gree
men
t w
ith it
s fo
rmer
chi
ef e
xecu
tive
offic
er. B
ased
on
the
term
s of
the
non
-com
pete
agr
eem
ent,
the
form
er C
hief
Exe
cutiv
e O
ffice
r ag
reed
not
to
com
pete
with
the
su
bsid
iary
and
not
to e
ngag
e in
any
bus
ines
s tr
ansa
ctio
n w
hich
may
har
m th
e su
bsid
iary
’s re
latio
ns w
ith it
s bu
sine
ss p
artn
ers
until
Jun
e 30
, 201
6. In
retu
rn, t
he s
ubsi
diar
y ha
d co
mm
itted
to p
ay a
non
-com
pete
fee
to th
e fo
rmer
chi
ef
exec
utiv
e. T
he n
on-c
ompe
te a
gree
men
t had
bee
n ac
coun
ted
for a
s an
inta
ngib
le a
sset
with
a c
orre
spon
ding
liab
ility
stat
ed to
refle
ct th
e am
ount
pay
able
. The
non
-com
pete
fee
was
pai
d on
Jun
e 30
, 201
4 an
d ha
s be
en fu
lly a
mor
tized
.
** In
clud
es E
mpl
oym
ent c
ontr
acts
.# Oneofthesub
sidiariesofth
eGroup
entered
intoaBusinessTransferand
ShareSub
scrip
tionAgreementw
ithaCom
panyRAPA
LandMr.ParthaPratim
Banerjee('P
PB')toacq
uireasetof5
3identified
customercon
tracts.P
ursuant
to s
uch
agre
emen
t, th
e S
ubsi
diar
y ha
s ac
coun
ted
for
the
tran
sfer
of t
he a
fore
said
cus
tom
er c
ontr
acts
as
acqu
isiti
on o
f int
angi
ble
asse
ts a
nd c
onse
quen
tly, c
apita
lized
a s
um o
f ` 3
70.5
5 La
khs.
7. Goodwill on Consolidation / Acquisition
` in Lakhs
Particulars 31-Mar-2017 31-Mar-2016 1-Apr-2015
Balance at the beginning of the year 2,349.54 1,982.31 7,379.67
AdjustmentsfortheeffectonaccountofBusinesscombinationspriortotransition date (Refer Note 39) - - (5,397.36)
Add: On acquisition of step-down subsidiary - 245.49 -
Less: Written-off on merger of a wholly-owned subsidiary - 10.32 -
Less: Sale of a subsidiary 183.54 - -
Add:CurrencyTranslationadjustment (49.77) 132.06
Balance at the end of the Year 2,116.23 2,349.54 1,982.31
Goodwill arising on Consolidation is tested for Impairment for the following Cash-generating units on annual basis and is not amortized.
The below table gives the breakup of Goodwill for the respective Cash-generating units
` in Lakhs
Particulars 31-Mar-2017 31-Mar-2016 1-Apr-2015
Arena 1,875.95 1,916.53 1,805.42
Adeo - 187.52 176.89
Linkplus 240.28 245.49 -
Total 2,116.23 2,349.54 1,982.31The recoverable amount of the above cash-generating units is determined based on a value-in-use calculation which uses cash flow projectionsbasedonfinancialbudgetspreparedcoveringafive-yearperiod,afterwhichanestimatedlong-termgrowthrateof2%isapplied, and a weighted average cost of capital of 13.66% (March 31, 2016 is 15.6% and April 1, 2015 is 14.46%) per annum.
8. Income Taxes
TheGroupissubjecttotaxationinIndia,SouthAsiaandsomeoftheMiddleEastandAfricanregions.TheincometaxratesoftheGroup range from 10% to 35%.
(a) Movement in Income Taxes (Assets) ` in Lakhs
Particulars 2016-17 2015-16
Balance at the beginning of the year 5,121.59 2,871.74
Less: Provision during the year 11,600.18 11,619.84
Add: Taxes paid (Net of Refund received) 12,292.18 13,869.69
Balance at the end of the year 5,813.59 5,121.59
(b) Movement in Income Taxes (Liabilities)` in Lakhs
Particulars 2016-17 2015-16
Balance at the beginning of the year 2,257.50 1,767.15
Add: Provision during the year 5,534.31 4,373.79
Less: Taxes paid 4,659.54 4,268.10
Currencytranslationadjustment (487.78) 384.66
Balance at the end of the year 2,644.49 2,257.50
Annual Report
2016–2017159
Annual Report
2016–2017158
9. Deferred Taxes
Break-up of Deferred Tax Assets arising on account of timing differences
Total 1,056.36 (756.55) 1,370.69 (30.76) 101.37 1,741.11
Consequent to sale of the Company’s investment in its wholly-owned subsidiary Easyaccess Financial Services Limited in FY 2013-14, there was a Long-Term capital loss, under the Income Tax Act, 1961, which resulted in a deferred tax asset of ` 1,310.48 Lakhs. Of this, ` 249.48 Lakhs was recognized against realized Long-Term Capital Gain in an earlier year. The balance deferred tax asset of ` 1,061.00 Lakhs will be recognized as and when there is a Long-Term capital gain.
10. Other Non-Current Assets (Unsecured and Considered Goods)
` in Lakhs
Particulars 31-Mar-2017 31-Mar-2016 1-Apr-2015
Capital advances 127.48 106.21 39.65
Receivable from Government Authorities (Sales tax, Customs, Service tax, etc.) 2,845.42 2,844.61 2,433.86
Others 3.00 1.21 343.90
Total 2,975.90 2,952.03 2,817.41
11. Inventories (Lower of cost and Net realizable value-Refer Note 5f)
` in Lakhs
Particulars 31-Mar-2017 31-Mar-2016 1-Apr-2015
Trading Stocks 290,647.52 329,384.07 245,428.16
Goods in Transit 41,051.42 40,733.20 34,064.54
Service Spares 5,757.11 6,698.08 5,941.07
Total 337,456.05 376,815.35 285,433.77
12. Trade Receivables-Unsecured
` in Lakhs
Particulars 31-Mar 2017 31-Mar-2016 1-Apr 2015
(a) Trade Receivables outstanding for a period exceeding six months from the date they were due for payment
Considered Good 16,370.77 13,492.22 11,794.88
Considered doubtful 3,316.48 3,255.14 2,310.30
Less: Provision for doubtful debts 3,316.48 3,255.14 2,310.30
Total (a) 16,370.77 13,492.22 11,794.88
(b) Other Trade Receivables
Considered Good 492,354.57 520,961.84 430,104.61
Considered doubtful 10,045.15 9,895.83 9,326.15
Less: Provision for doubtful debts 10,045.15 9,895.83 9,326.15
Total (b) 492,354.57 520,961.84 430,104.61
Total Trade receivables (a+b) 508,725.34 534,454.06 441,899.49
` in Lakhs
Movement in the Allowance for receivables 2016-17 2015-16
Balance at the beginning of the year 13,150.97 11,636.45
Allowance recognized during the year 3,144.86 3,609.11
Less: Allowance utilized for written-off 2,157.22 2,103.35
CurrencyTranslationAdjustment (776.98) 8.76
Balance at end of the year 13,361.63 13,150.97
Ageing of past due but not impaired* ` in Lakhs
Particulars 31-Mar-2017 31-Mar-2016 1-Apr-2015
0-90 days 58,789.32 56,770.33 42,983.54
More than 91 days 22,774.64 19,276.65 17,403.07
Total 81,563.96 76,046.98 60,386.61
* In determining the recoverability of a trade receivable, the Group considers any change in the credit quality of the trade receivable. The concentration of credit risk is limited due to the customer base being large and unrelated. Accordingly, the Group believes that no further credit allowance is required in excess of the allowance already created for.
13. (a) Cash and Cash Equivalents
` in Lakhs
Particulars 31-Mar-2017 31-Mar-2016 1-Apr-2015
Cash and Cash Equivalents
(i) Cash on hand 237.91 726.00 470.32
(ii) Balance in current accounts 61,127.08 45,147.12 38,300.22
Total 61,364.99 45,873.12 38,770.54
(b) Other Bank Balances ` in Lakhs
Particulars 31-Mar-2017 31-Mar-2016 1-Apr-2015
(i) In deposit accounts 9,620.69 8,340.54 12,860.15
(ii) In earmarked accounts
a. Margin money with banks* 1,125.20 835.61 977.42
b. Unclaimed Dividend 10.25 6.34 4.85
c. Unspent for Corporate Social Responsibility - - 524.19
Total 10,756.14 9,182.49 14,366.61
* Margin Deposits pertaining to a wholly-owned subsidiary, Redington International Mauritius Limited (RIML) are held by Banks against Letters of Guarantee.
Annual Report
2016–2017161
Annual Report
2016–2017160
14. (a) Loans
` in Lakhs
Particulars 31-Mar-2017 31-Mar-2016 1-Apr-2015
Loan to Subsidiary of an Associate 3,140.00 2,431.29 1,940.04
Others 500.00 - -
Total 3,640.00 2,431.29 1,940.04
(b) Other Financial Assets
` in Lakhs
Particulars 31-Mar-2017 31-Mar-2016 1-Apr-2015
Advances to Suppliers and others 9,478.09 7,119.06 4,998.92
* During the year, the Company allotted 35,230 (2015-2016: 110,440, 2014-2015: 220,970) Equity Shares of ` 2 /- each to eligible employees pursuant to exercise of options under the Employee Stock Option Plan at applicable premiums.
iii. Terms/rights attached to equity shares
Each holder of equity share is entitled to one vote per share. The Company declares and pays dividends in Indian rupees. For the year ended March 31, 2017 a dividend of ` 2.30 per equity share has been proposed by the Board of Directors (31-Mar-2016: ` 2.10, 1-Apr-2015 ` 1.90perequityshare).ThedividendproposedbytheBoardofDirectorsissubjecttotheapprovaloftheshareholdersat the ensuing Annual General Meeting.
iii. Details of shares held by shareholders holiding more than 5% of the paid-up equity capital
Non-Current (Secured Loans from Banks) - - 21,374.87
Summary of Borrowing arrangements:
a. In case of the Company, loans from Banks are secured by pari-passu charge on Inventories and Trade Receivables repayable on demand and in case of overseas subsidiaries, by assignment of insurance policies over inventories on a pari-passu basis and by the shares of Redington Gulf FZE.
b. Commercial paper: The facility is unsecured and the maximum amount outstanding at any time during the year was ` 136,500 Lakhs (2015- 2016: ` 126,000 Lakhs).
Annual Report
2016–2017163
Annual Report
2016–2017162
c. Two of the Group companies had agreed on an installment payment arrangement with an external party amounting for a three-year installment payment on equal quarterly basis. The external party retains the right to recall the amount due to them on demand. The balances above reflect the total value outstanding towards the arrangement as of the respective reporting dates.
18. Provisions
` in Lakhs
Particulars 31-Mar-2017 31-Mar-2016 1-Apr-2015
Current
Provision for Corporate Social Responsibility expense - 0.01 524.19
Provision for Compensated absences 24.38 20.52 14.17
Provision for Gratuity 60.80 55.23 30.37
Provision for Warranty 135.20 156.10 201.57
Total 220.38 231.86 770.30
Non-Current
Provision for Compensated absences 257.19 219.63 251.26
Provision for Gratuity 6,659.07 5,995.13 4,685.23
Total 6,916.26 6,214.76 4,936.49
Movement in Provision for Gratuity ` in Lakhs
Particulars 2016-17 2015-16
Projected Benefit Obligation at the beginning of the year 6,050.36 4,715.60
Add:
Gross Amount charged to the Statement of Profit and Loss 1,795.98 1,782.82
Amount transferred on account of acquisition of a subsidiary - 60.38
Amount transferred on account of sale of a subsidiary (23.23) -
Benefits paid (879.96) (651.47)
CurrencyTranslationAdjustment (223.28) 143.03
Projected Benefit Obligation at the end of the year 6,719.87 6,050.36
Current 60.80 55.23
Non-current 6,659.07 5,995.13
Movement in Provision for warranties
` in Lakhs
Description 2016-17 2015-16
Balance at the beginning of the year 156.10 201.57
Add: Provision made 145.20 180.20
Less: Provision Utilised 166.10 225.67
Balance at the end of the year 135.20 156.10
Current 135.20 156.10
Non-Current - -
19. Trade Payables
` in Lakhs
Particulars 31-Mar-2017 31-Mar-2016 1-Apr-2015
Trade Payables*
(i) Total outstanding due to Micro Enterprises and Small Enterprises 641.94 6,517.43 3,399.42
Total (i) 641.94 6,517.43 3,399.42
(ii) Total outstanding dues of creditors other than Micro Enterprises and Small Enterprises
a. Trade Payables 444,402.11 412,855.12 322,046.89
b. Other payables 1,133.45 1,514.94 2,159.10
Total (ii) 445,535.56 414,370.06 324,205.99
Total (i+ii) 446,177.50 420,887.49 327,605.41
*Trade payables are dues in respect of goods purchased or services received (including from employees) in the normal course of business.
20. Other Financial Liabilities
` in Lakhs
Particulars 31-Mar-2017 31-Mar-2016 1-Apr-2015
Unclaimed Dividend* 10.25 6.34 4.85
Current Maturities of Long-term borrowings - 10,946.96 13,105.91
Dividend Payable - 367.82 595.67
Interest accrued but not due on borrowings 116.25 140.68 133.41
Total 126.50 11,461.80 13,839.84
*No Amount is due and outstanding to be credited to Investor Education and Protection Fund.
21. Other Current Liabilities
` in Lakhs
Particulars 31-Mar-2017 31-Mar-2016 1-Apr-2015
Creditors for other liabilities^ 30,008.65 36,753.66 31,993.69
Unamortized revenue 658.38 676.36 803.93
Statutory liabilities 6,983.74 6,220.76 6,167.21
Advances/Deposits received from customers 5,498.47 6,744.00 5,339.91
Others liabilities 4,861.33 5,400.16 3,705.31
Total 48,010.57 55,794.94 48,010.05
^ Includes ` Nil (March 31, 2016 : ` 1.23 Lakhs and on April 1, 2015 : ` 137.18 Lakhs) payable towards acquisition of Property, Plant and Equipment.
22. Revenue from Operations
` in Lakhs
Particulars 2016-17 2015-16
Sales 3,903,151.00 3,372,486.45
Service Income 66,207.15 66,069.00
Rebates 141,986.92 105,636.91
Other operating revenues 120.37 25.56
Total 4,111,465.44 3,544,217.92
Annual Report
2016–2017165
Annual Report
2016–2017164
23. Other Income (Net)
` in Lakhs
Particulars 2016-17 2015-16
Interest on loan 179.87 209.60
Interest from dealers 1,187.57 1,070.28
Interest on Bank deposits 786.69 541.18
Interest on Income Tax refund 702.66 555.76
Gain on sale of a subsidiary (Refer note 3 @^) 331.93 -
Income from Short-Term Investments 192.82 118.01
Gain on sale of Property,Plant and Equipment (Net) - 51.40
Bad Debts Written off in earlier years recovered 77.54 64.35
Provision no longer required written back - 28.33
Other Non-operating income 679.97 758.94
Total 4,139.05 3,397.85
24. Employee Benefits Expense
` in Lakhs
Particulars 2016-17 2015-16
Salaries & Bonus 59,442.90 50,457.15
Contribution to Provident Fund & Other Funds 993.65 912.99
The weighted average cost of the funds borrowed is 5.2% per annum (Previous year is 4.8% per annum)
26. Other Expenses
` in Lakhs
Particulars 2016-17 2015-16
Rent (Refer note 33) 9,773.03 8,444.24
Freight 8,913.05 8,785.61
Commercial Taxes 2,902.67 2,042.45
Repairs and Maintenance 2,175.33 2,027.07
Utilities 1,210.49 777.00
Insurance 4,193.29 3,196.86
Communication 2,615.13 2,652.37
Sales Promotion Expenses 18,403.67 12,338.47
Travelling Expenses 4,981.21 4,542.55
Professional Charges 1,957.77 2,997.93
WarehouseHandlingCharges 2,034.98 927.79
` in Lakhs
Particulars 2016-17 2015-16
Bad Debts 2,157.22 2,103.35
Less:- Written off against allowance for doubtful receivables
2,157.22 - 2,103.35 -
Allowance for Doubtful Receivables 3,144.86 3,609.11
Auditors’ remuneration (including remuneration to subsidiaries’ auditors) 815.66 908.43
Exchange loss (Net) 3,405.45 5,109.18
Factoring Charges 858.89 1,470.31
Directors’ Sitting Fee 33.39 14.44
Directors’ Commission 113.95 109.27
Outsourced Resource Cost 5,102.47 4,882.66
Loss on sale of Property,Plant and Equipment (Net) 1.76 -
Security Charges 1,168.59 972.76
Packing Charges 368.80 607.01
Software Expenses 2,472.65 2,315.85
Bank Charges 2,621.86 2,201.04
Corporate Social Responsibility Expenditure (Refer Note 37) 611.12 49.51
Miscellaneous Expenses 3,928.30 3,709.05
Total 83,808.37 74,690.96
27. Financial Instruments
Details of the significant accounting policies and methods adopted, including the criteria for recognition, the basis of measurement and the basis on which income and expenses are recognized, in respect of each class of financial asset and financial liability are disclosed in Note 5r to the consolidated financial statements. The fair values of financial assets and financial liabilities at the end of the reporting period approximate the amounts as shown in the Balance sheet.
The following is an analysis of financial instruments that are measured subsequent to initial recognition at fair value, grouped into Levels 1 to 3 based on the degree to which the fair value is observable.
Annual Report
2016–2017167
Annual Report
2016–2017166
` in Lakhs
Particulars 31-Mar-17 31-Mar-16 1-Apr-2015
Financial assets measured at fair value (FVTPL)
Call option (Level 3)* 241.31 207.99 -
Financial assets not measured at fair value (Amortized cost)
Security deposits (Level 2) 999.10 826.49 673.56
Total 1,240.41 1,034.48 673.56
* Call options have been calculated by using 11.09% (March 31, 2016: 11.71%) risk free rate and volatility of 53.3% (March 31, 2016: 63.78%).
28. Financial risk management:
These financial risk management policies are applied across the Group in order to mitigate potential adverse impact on the financial performance. The note below explains how the Group’s exposure to various risks, such as market risk (foreign exchange and interest rate risk) credit risk, liquidity risk and capital risk are addressed /mitigated.
1. Market Risks
a. Foreign exchange risk:
The Group enters into transactions denominated in foreign currencies. In order to mitigate risks arising on account of foreign currency fluctuations, the Group has set the following policies with respect to foreign exchange risk management in respective geographies
Company and its Indian Subsidiaries
The Company and its Indian subsidiaries, wherever applicable have used foreign currency forward contracts to hedge its risks associated with foreign currency fluctuations relating to certain firm commitments and highly probable forecast transactions. Most of the transactions of the Company and its Indian subsidiaries are in Indian Rupees and the transactions in foreign currencies are hedged by a forward cover. No derivative financial instruments are held for speculative purposes.
Sensitivity analysis
The Group applies 10% as the sensitivity rate while ascertaining foreign currency exposure. Accordingly 10% strengthening of Indian Rupee against all relevant uncovered foreign currency transactions would have positively impacted profit before tax by ` 361.64 Lakhs (Previous year ` 795.64 Lakhs). Similarly for 10% weakening of Indian rupee against these transactions, there would be an equal and opposite impact on the profit before tax.
Overseas subsidiaries
With respect to overseas subsidiaries, most of the local reporting currencies in the Middle East are pegged to US dollar and hence the requirement for taking a separate hedge does not arise. In other geographies, forward cover is taken wherever applicable.
Foreign currency sensitivity analysis:
The following table details the Group’s sensitivity to a 10% increase and decrease in the US$ against the relevant foreign currency transactions that are not covered/pegged. A positive number below indicates an increase in Profit before tax where the US$ strengthens 10% against the relevant currency. Similarly, for a 10% weakening of the US$ against the relevant currency, there would be an equal and opposite impact on the Profit before tax.
` in Lakhs
Particulars 2016-17 2015-16
Profit/(loss) before tax
Turkish Lira (47.29) 133.06
Kuwaiti Dinar (649.28) (939.59)
Kenyan Shilling 31.14 (68.59)
Moroccan Dirham (298.84) (408.09)
Nigerian Naira (127.76) (1,354.33)
Kazakhstan Tenge (654.18) (452.35)
Egyptian Pound (350.09) (736.96)
Tanzanian Shilling (39.79) (7.63)
Uganda Shilling (44.52) (19.61)
Ghanaian Cedi 13.57 (14.39)
South African Rand 2.73 14.34
` in Lakhs
Particulars 2016-17 2015-16
Iraqi Dinar (10.08) (9.99)
Libyan Dinar (0.82) (5.49)
Rwandan Franc (0.50) (7.83)
Euro 34.88 18.72
Senegal Franc (140.39) (107.16)
b. Interest rate risk management
TheGroup’soverseassubsidiariesobtainsfundsatbothfixedandfloatinginterestrates.Hencesensitivityanalysishasbeendetermined based on the exposure to interest rates for borrowings at floating interest rates. If interest rates had been 50 basis points higher/lower and all other variables were held constant, the Group’s profit before tax for the year ended March 31, 2017 would decrease/increase by ` 413.34 Lakhs (March 31, 2016: ` 818.29 Lakhs).
The Company and its Indian Subsidiaries borrow at fixed interest rates and hence no sensitivity analysis is required.
2. Credit risk management
Credit risk is minimized through conservative credit policies across the group. Credit insurance is also taken in some of the geographies. The average credit period allowed to both small and large retailers is 30-60 days. The Group mitigates credit risk by a strict receivable management procedures and policies. The efficacy of this process is proven by the fact that receivables more than 6 months are only 3% of the total receivables.
3. Liquidity risk management
The Group has built an appropriate liquidity risk management framework for the its short, medium and long-term funding and liquidity requirements. The Group manages liquidity risk by maintaining adequate reserves, banking facilities and reserve borrowing facilities, by continuously monitoring forecast and actual cash flows and matching the maturity profiles of financial assets and financial liabilities.
The following tables detail the Group’s remaining contractual maturity for its non-derivative financial liabilities. The tables have been drawn up based on the undiscounted cash flows of financial liabilities on the earliest date on which the Group will be required to pay.
Thefollowingtablesdetail theGroup'sremainingcontractualmaturity for itsnon-derivativefinancialassets.Thetableshavebeendrawn up based on the cash flows of financial assets based on the earliest date on which the Group can collect:
The Group manages its capital to ensure that entities in the Group will be able to continue as a going concern while maximizing the return to shareholder through the optimization of the debt and equity balance. The Group over the years has maintained parity between Net Debt to Equity. The capital structure of the Group consists of debt, which includes borrowings net of cash and bank balances as disclosed in respective notes above and total equity of the Group comprising issued Share capital, other equity and Non-controlling interests as disclosed in the consolidated statement of changes in equity, net of Goodwill. Gearing ratio at the end of the reporting period is as below.
The Group has identified India and Overseas as its reportable operating segments in line with the requirements Ind AS 108 as mentioned in Note 5o. Segment revenue (including interest income), interest expense and segment results, include transfers between segments and such transfers are eliminated in the consolidation of the segments. Expenses that are directly identifiable to segments are considered for determining the segment results. Segment assets and liabilities include those directly identifiable with the respective segments and unallocated items include Goodwill and other assets which are not used for business purposes.
` in Lakhs
Particulars
India Overseas Eliminations Corporate Unallocated Total
Other information with respect to the Operating Segments disclosed above
1. TheGrouphaselectednot todisclosedetailsofNon-currentassets located invariousgeographiesandrevenue frommajorproducts and services as the necessary information is not precisely available and the cost to develop it would be excessive.
2. The revenue from transactions with no single external customer exceeded 10% of the total revenue of the Group for each of the two years ended March 31, 2017.
30. Related party disclosures (As per Ind AS 24)
1) Remuneration to Key Management Personnel
Mr.RajShankar,ManagingDirector
Mr. R. Srinivasan, Director (Overseas subsidiary) (Till February 15, 2017)
Mr. M. Raghunandan, Whole-Time Director (Till May 24, 2016)
Party where the Company has control Redington Employee Share Purchase Trust
Parties having Significant Influence on the Company Synnex Mauritius Limited, Mauritius HarrowInvestmentHoldinglimited,Mauritius
3) Nature of Transactions
` in Lakhs
Nature of Transactions2016-17 2015-16
Party Where Control Exists
Party Where Control Exists
Redington Employee Share Purchase Trust*
Deficit absorbed 0.07 0.07
* It administers the Employee Share Purchase Scheme (ESPS), which is in accordance with Securities and Exchange Board of India (Employee Stock Option Scheme and Employee Stock Purchase Scheme) Guidelines, 1999. The deficit of the trust for the year ended March 31, 2017 amounting to ` 0.07 Lakhs (March 31, 2016: ` 0.07 Lakhs) has been absorbed in the Statement of Profit and Loss.
Annual Report
2016–2017171
Annual Report
2016–2017170
` in Lakhs
Nature of Transactions
2016-17 2015-16
Parties having Significant Influence
Parties having Significant Influence
Synnex Mauritius Limited
Dividend Paid 3,866.13 1,791.62
Harrow Investment Holding Limited
Dividend Paid 1,343.88 1,012.38
` in Lakhs
Nature of Transactions2016-17 2015-16
Subsidiary of Associate
Subsidiary of Associate
Currents Technology Retail (India) Limited
Sales/ServiceCharges–Income 5,785.75 6,577.08
Interest Income 179.87 209.60
Loan disbursed 9,410.00 5,130.00
Loan settled 8,710.00 4,630.00
Details of Receivable from Currents Technology Retail (India) Limited:` in Lakhs
Particulars 31-Mar-2017 31-Mar-2016 1- Apr-2015
Loan outstanding at the year end 3,140.00 2,440.00 1,940.00
Amount receivable at the year end 1,208.43 1,015.56 905.50
31. Key Managerial Remuneration
` in Lakhs
Nature of Transactions 2016-17 2015-16
Remuneration to Whole-Time Directors 140.87* 24.00
* (a) Includes Gratuity paid to Mr. M. Raghunandan on his retirement amounting to ` 10.38 Lakhs.
Remuneration to other KMPs’ from a wholly-owned overseas subsidiary is as below:` in Lakhs
Particulars 2016-17 2015-16
Salaries and Bonus 653.08 643.54
Contribution to Provident Fund 10.93 8.19
Total 664.01 651.73
32. Contingencies & Commitments
` in Lakhs
Particulars 31-Mar-2017 31-Mar-2016 1-Apr-2015
i. Bank Guarantees 1,317.70 1,454.53 1,273.27
ii. Channel financing 435.00 750.00 1,975.00
iii. Factoring - 8,750.00 7,525.00
iv. Claims not acknowledged as debts 226.25 281.57 359.36
v. Disputed Customs Duty/Income Tax/Sales Tax/Service Tax demands ` in Lakhs
Nature of Dues 31-Mar-2017 31-Mar-2016 1-Apr-2015
Customs duty* 95.82 2,255.38 97.03
Income Tax 608.10 576.89 999.01
Sales Tax 4,724.24 3,778.29 1,566.34
Service Tax # 2,159.42 2,159.42 NIL
* TheCompanyhasreceivedafavourableorderfromCESTAT–MumbaisettingasidetheadjudicationorderpassedbytheCommissionerofCustoms(Imports),Mumbai(‘CommonAdjudicatingAuthority’)disallowingCVDnotificationbenefitonexternalharddiskdrivesfortheperiodMar2011–Nov2012 with a duty demand of ` 2,160 Lakhs (including interest & penalty), with consequential relief thereto. The Company had made a pre-deposit of ` 400 Lakhs under protest as part of the proceedings. Basis the CESTAT order the Company has reduced its contingent liability to the tune of ` 2,160 Lakhs and is in the process of taking steps for applying refund of the pre-deposit made.
# In the previous year the Company received a Service tax demand of ` 2,159.42 Lakhs (including interest & penalty) from Service Tax authorities for the period October 2009 to September 2014, determining certain divisible sale and service contracts as composite works contract. An amount of ` 400.00 Lakhs has been deposited under protest during the proceedings. The Company is contesting the demand before the appropriate legal forum. The legal counsel has opined that the demand is not sustainable in law and accordingly no provision is presently considered necessary.
vi. LawsuitfiledbyRedingtonTurkeyHoldingS.A.R.L(RTHS)
AsatMarch31,2017,theadministrativelawsuitfiledbyRedingtonTurkeyHoldingS.A.R.L.(RTHS)beforethe8th Administrative Court of Ankara, as the plaintiff, requesting the cancellation of the decision of the Capital Markets Board (CMB) dated August 25,2011,requiringRTHStofileanapplicationwiththeaimtoconductamandatorytenderoffertowardstheshareholdersofArena Bilgisayar Sanayi ve Ticaret A.S. (Arena) in connection with its purchase of 49.4% stake in Arena on November 29, 2010 hasbeenconcludedinfavorofRTHS’requestandthedecisionoftheCMBdatedAugust25,2011hasbeencancelled.Thedecision of the 8th Administrative Court of Ankara dated September 25, 2012 was notified to us on December 7, 2012. With its petition dated January 3, 2013 the CMB appealed this decision following which the Company filed its responses on February 20, 2013. The lawsuit file has been assigned to the 13th Chamber of the Council of State for appellate review, and 13th Chamber of the Council of State had not concluded its appellate review as at March 31, 2017.
TheCMBhad later imposedanadministrativemonetary fineagainstRTHSamounting toUS$68,041by itsdecisiondatedApril11,2012,statingRTHS’non-compliancewithitsdecisiondatedAugust25,2011asthereason.OnMay9,2012,RTHSchallenged this fine by filing a lawsuit before the 20th Peace Criminal Court of Istanbul which was later on sent to 4th Peace Criminal Court due to organizational changes in the court house. On November 21, 2014, 4th Peace Criminal Court decided that considering the new Capital Markets Law, the peace criminal court are no more competent to review lawsuits regarding administrative fines issued by the CMB and the lawsuit must be filed before 13th Administrative Court of Ankara on January 27, 2015. The pleading process terminated, and both parties submitted their petitions and reply petitions. As at March 31, 2017, the 13th Administrative Court of Ankara had not yet resolved on this lawsuit.
TheCMB’sdecisiondatedAugust25,2011wasbasedonaninjunctiondecisiongivenbythe13th Chamber of the Council of StateonJuly18,2011,asaresultofalawsuitfiledbyanindividualinvestoragainsttheCMBrequestinginjunctiononandthecancellation of certain provisions of the CMB Communique regulating tender offers in Turkish public companies and the CMB decisionturningdowntherequestoftheinvestorseekingatenderoffertobelaunchedbyRTHSinconnectionwithitspurchaseof49.4%stakeinArenaonNovember29,2010.Theinjunctiondecisiongivenbythe13th Chamber of the Council of State was challenged by the CMB before the Council of Administrative Chambers of the Council of State which ruled for the revoke of the stay of execution on February 2, 2012. Prior to the decision rendered by the Council of Administrative Chambers, on October 10,2011,RTHShadappliedtothe13thChamberoftheCouncilofStatetojoinandbecomeapartyinthislawsuitonthesideofthedefendantCMB.RTHSalsosubmittedadetailedpetitionexplainingwhythechallengebytheCMBshouldbeupheld.OnSeptember20,2012,thecourtacceptedRTHS’requesttobecomeapartytothelawsuitonthesideofthedefendantCMB.OnJuly2,2015,theprosecutorofCouncilofStatehadissuedhisopinionmentioningthatthelawsuitshouldberejected.The13th Chamber held a hearing on October 15, 2015 and heard the parties. The Chamber has not rendered its decision yet. On October 19, 2016, the 13thChamberoftheCouncilofStaterejectedtheclaimsoftheindividualinvestor,andissuedaverdictinfavor of the Company, and the CMB, indicating that an obligation to conduct a mandatory tender offer did not arise, thus the CMB resolutioninrespecthadlegalgrounds.Theclaimant(individualinvestor)appealedagainstthejudgmentofthe13th Chamber of the Council of State on January 20, 2017, before the Council of State, Plenary Session of the Chambers for Administrative Cases. OnFebruary3,2017,RTHSfiledapetitionagainsttheappealclaimoftheindividualinvestor.AsofMarch31,2017,theappealclaim of the individual investor was pending.
With respect to the contingencies above, the Group believes that no capital outflow or material impact in the consolidated statement of Profit and loss will arise and hence no provision has been made as of the reporting date.
vii. Capital Commitments
Estimated amount of contracts remaining to be executed on capital account and not provided for (net of advances) is ` 169.77 Lakhs (March 31, 2016 ` 515.70 Lakhs and ` 49.84 Lakhs as of April 1, 2015).
Annual Report
2016–2017173
Annual Report
2016–2017172
33. Operating Leases
The Group has taken on lease a number of offices and warehouse facilities under operating leases. The leases are for varied periods which are renewable at the option of the Group. The amount recognized as rental expense in the Consolidated Statement of Profit and Loss towards such leases amounts to ` 9,773.03 Lakhs (Previous Year ` 8,444.24 Lakhs).
Future minimum rental payable under Non-Cancellable Operating leases at the end of the reporting period are as follows:
` in Lakhs
Particulars 31-Mar-2017 31-Mar-2016 1-Apr-2015
Payable within one year 1,005.21 807.11 745.64
Payable after one year 1,117.07 1,332.92 1,578.15
Total 2,122.28 2,140.03 2,323.79
34. Events after the Reporting period (Non-adjusting)
a. The Board at its meeting held on May 25, 2017 has recommended a dividend of ` 2.30/- per Equity share of ` 2/- each - i.e., 115% of face value for the financial Year Ended March 31, 2017 (March 31, 2016: 2.10 per Equity Share of 2/- each i.e., 105% offacevalue)subjecttotheapprovalofshareholdersintheensuingAnnualGeneralMeeting.
b. A subsidiary Citrus Consulting Services FZ-LLC was incorporated under a step-down subsidiary Redington Gulf FZE and is yet to commence operations.
c. Redington Gulf FZE has acquired an additional 10% stake in Linkplus Bilgisayar Sistemleri Sanayi ve Ticaret AS form the existing shareholder for a consideration of USD 0.99 Mn resulting in increase in shareholding to 90%.
35. Earnings per Equity Share
Description 2016-17 2015-16
Profit for the year attributable to the shareholders of the Company (` In Lakhs) 46,422.26 42,352.45
Weighted Average Number of equity shares (Basic) 399,832,245 399,777,814
Earnings per share- Basic ` 11.61 10.59
Add: Effect of ESOPs 104,593 174,657
Weighted Average Number of equity shares on account of Employee Stock Option Plan 2008 (Diluted)
399,936,838 399,952,471
Earnings per share- Diluted ` 11.61 10.59
Face Value per share in ` 2/- 2/-
36. Additional information as required by Paragraph 2 of the General Instructions for Preparation of
Consolidated Financial Statements to Schedule III to the Companies Act, 2013
Name of the Entity
Net assets(Total assets less Total liabilities) Share in Profit
Total 100.00 100.00 350,939.94 331,675.47 100.00 100.00 46,422.26 42,352.45
37. For the year 2016-17, the Group is required to spend ` 612.09 Lakhs (Previous year: ` 566.29 Lakhs) on "Corporate Social Responsibility (CSR)" against which the Group has spent during the year ` 611.12 Lakhs towards CSR Expenditure, being the contribution made by the Group to a Trust formed for the purposes of carrying out these activities. In the previous financial year, in addition to utilizing the funds/provision earmarked for CSR purposes by the Company in the earlier years, an amount of ` 49.51 Lakhs was contributed to the trust by the Subsidiaries.
38. Employee Stock Option Plan, 2008
The Group followed intrinsic value method as per pervious GAAP for accounting of employee stock options and decided to avail exemption under Ind AS 101 from retrospective application of accounting requirements prescribed under Ind AS 102 for outstanding optionsasonthetransitiondate.Hencenocompensationcostshavebeenrecognizedintheseaccountsastheoptionshavebeengranted at the prevailing market prices.
Particulars Grant I Grant II Grant III Grant IV Grant V
Date of Grant 29-Feb-08 25-Jul-08 28-Jan-09 22-May-09 05-Dec-11
Options exercised at the beginning of the year 1,748,303 6,250 276,143 25,000 41,204
Options exercised during the year - - - - 7,046
Total options outstanding and not exercised as on March 31, 2017 - - - - 80,337
* Out of the total options granted in 2008, 1,959,830 options were repriced at ` 130/- on January 28, 2009 and 75,000 options were repriced at ` 165/- on May 22, 2009
Out of the lapsed options the Board/Committee of directors at their meetings had approved reissue of options as follows
Date of Grant 25-Jul-08 28-Jan- 09 22-May- 09 5-Dec-11
No. of options 11,000 276,143 25,000 173,212
The fair value of options based on the valuation of the independent valuer as at the respective dates of grant are given below:
Grant Date 29-Feb-08Repriced
on 28-Jan-09
Repriced on
22-May-0925-Jul-08
Repriced on
28-Jan-0928-Jan-09 22-May-09 5-Dec-11
Fair Value 171.33 25.56 33.04 159.71 23.77 47.46 79.82 171.72
Annual Report
2016–2017175
Annual Report
2016–2017174
The variables used for calculating the Fair Values of Grant V and their rationale are as follows:
A. Stock price
The closing market price on the date prior to the date of grant on National Stock Exchange (NSE) has been considered for the purpose of option valuation.
B. Volatility
Volatility is a measure of the amount by which a price has fluctuated or is expected to fluctuate during a period. The measure of volatility used in the Black-Scholes option-pricing model is the annualized standard deviation of the continuously compounded rates of return on the stock over a period of time.
The period to be considered for volatility has to be adequate to represent a consistent trend in the price movements. It is also important that movements due to abnormal events get evened out.
There is no research that demonstrates conclusively how long the historical period used to estimate expected long-term future volatility shouldbe.However,GuidancenoteonAccounting forEmployeeShare-basedPayments issuedby the InstituteofChartered Accountants of India recommends including the historical volatility of the stock over the most recent period that is generally commensurate with the expected life of the option being valued.
The entity’s stocks have been publicly traded on NSE and BSE. For calculating Volatility, we have considered the daily volatility of the stock prices on NSE, over a period prior to the date of grant, corresponding with the expected life of the options.
TheFairvalueofanoption isverysensitive to thisvariable.Higher thevolatility,higher is theFairvalue.Therationalebeing,the more volatile a stock is, the more is its potential to go up (or come down), and the more is the probability to gain from the movement in the price. Accordingly, an option to buy a highly volatile stock is more valuable than the one to buy a less volatile stock, for the probability of gaining is lesser in the latter case.
C. Risk free interest rate
The risk-free interest rate being considered for the calculation is the interest rate applicable for maturity equal to the expected life of the options based on the zero-coupon yield curve for Government Securities.
D. Exercise Price
Options have been granted primarily at a price of ` 348.05 on February 29, 2008. Subsequently, 1,959,830 and 75,000 options were re-priced at a Market price of ` 130/- and ` 165/- on January 28, 2009 and May 22, 2009 respectively. On December 5, 2011 173,212 options were granted at a price of ` 396.50 per option.
E. Time to Maturity / Expected Life of options
Time to Maturity / Expected Life of options is the period for which the Company expects the options to be live. The minimum life of a stock option is the minimum period before which the options cannot be exercised and the maximum life is the period after which the options cannot be exercised.
i. The expected life must at least include the vesting period.
ii. The average lengths of time of similar grants have remained outstanding in the past. If the Company does not have a sufficiently long history of stock option grants, the experience of an appropriately comparable peer group may be taken into consideration.
iii. The expected life of stock options should not be less than half of the exercise period of the stock options issued until and unless the same is supported by historical evidences with respect to stock options issued by the Company earlier.
The fair value of each award has been determined based on different expected lives of the options that vest each year, as it would be if the award were viewed as several separate awards, each with a different vesting date. A weighted average of all vests has been calculated to arrive at the value of the options.
The time to maturity has been estimated as illustrated by the following example. In case of the grant made on December 5, 2011, the earliest date of exercise is December 5, 2012 i.e. one year from the date of grant. The exercise period is five years from the date of vest.
Expected Dividend yield: Expected dividend yield has been calculated as an average of dividend yields for the preceding 2 years to the year of grant.
Movements in Share options during the year
Particulars2016-17 2015-16
Number of options
Weighted average exercise price (` )
Number of options
Weighted average exercise price (` )
Balance at the beginning of the year 91,258 394.31 128,899 363.31
Granted during the year - - - -
Forfeited during the year - - - -
Exercised during the year 7,046 396.50 22,088 363.92
Expired during the year 3,875 344.92 15,553 180.55
Balance at the end of the year 80,337 396.50 91,258 394.31
Details of Share options exercised during the year:
Particulars Number exercised Allotment date Share price at allotment date
Grant I NIL - -
Grant II NIL - -
Grant III NIL - -
Grant IV NIL - -
Grant V 7046 16.09.2016 BSE -111.85/NSE-111.25
39. Transition to Ind AS
The financial statements for the year ended March 31, 2017 are the first financial statements prepared by the Group in accordance with Ind AS. For the periods upto and including the year ended March 31, 2016, the Group prepared its financial statements in accordance with the Generally Accepted Accounting Principles in India (previous GAAP).
Accordingly, the Group has prepared financial statements which comply with Ind AS applicable for the year ended March 31, 2017, together with the comparative year data as at and for the year ended March 31, 2016, as described in the summary of significant accounting policies. In preparing these financial statements, the Group prepared the opening balance sheet as at April 1, 2015, beingthetransitiondate.NotesbelowexplaintheprincipaladjustmentsmadebytheGroupinrestatingitspreviousGAAPfinancialstatements, including the balance sheet as at April 1, 2015 and the financial statements as at and for the year ended March 31, 2016.
Ind AS provides some exemptions/exceptions to the requirement of retrospective application in specific cases. Accordingly, the Group has applied certain optional exemptions/Mandatory exceptions from full retrospective application of Ind AS as detailed below.
Mandatory Exceptions
a. Estimates
When the Group makes estimates under Ind AS that were not specified under previous GAAP or vice-versa, the estimates must reflect conditions as at the date of transition to IND AS. On an assessment of the estimates made under previous GAAP, the Group has concluded that there is no necessity to revise the estimates under IND AS.
b. Hedge accounting
Hedgeaccountingistobeappliedonlytohedgerelationshipsthatmeettherequirementsofhedgeaccountinginaccordancewith Ind AS 109. An entity shall not reflect in its Ind AS balance sheet a hedge relationship that does not qualify under Ind AS 109. The Group has retrospectively applied these principles and elected not to disclose in its balance sheet, the relationships that do not qualify for hedge accounting under Ind AS 109.
Optional Exemptions
a. Deemed Cost
The Group being a first time adopter has elected to carry the value of Property,Plant and Equipment as per Balance sheet prepared under previous GAAP under deemed cost model. The Group has elected to regard those values of property as deemed cost as of the transition date and elected not to revalue those assets.
b. Share- based payment transactions
The Group being a first time adopter has elected to avail exemption under Ind AS 101 for equity instruments that vested before the date of transition to Ind AS (Refer note 38).
c. Employee benefits
The Group being a first time adopter has decided to apply the exemption of recognizing all cumulative actuarial gains or losses at thedateoftransitiontoINDASasanadjustmenttoopeningretainedearningsandthereafterasaseparatecomponentofequity.
Annual Report
2016–2017177
Annual Report
2016–2017176
Reconciliations:
Effect of Ind AS adoption on the Consolidated balance sheet as at March 31, 2016 and April 1, 2015
Provisions a 12,872.54 (2,677.51) (9,963.17) 231.86 11,788.83 (1,990.50) (9,028.03) 770.30Current Tax Liabilities (Net payables) - 2,257.50 - 2,257.50 - 1,767.15 - 1,767.15Other Current Liablities 67,256.74 (11,461.80) - 55,794.94 61,849.89 (13,839.84) - 48,010.05Total Current Liabilities 724,556.07 4.90 (9,963.17) 714,597.80 553,188.20 (108.08) (9,028.03) 544,052.09Total Liabilities 731,077.89 (302.16) (9,963.17) 720,812.56 580,269.70 (121.67) (9,028.03) 571,120.00Total Equity and Liabilities 1,035,006.50 (302.16) 17,783.69 1,052,488.03 838,291.15 (121.67) 16,931.61 855,101.09* The figures have been regrouped wherever necessary to conform to the classification of the current year and requirements of Ind AS1
Reconciliation of Total Equity as at March 31, 2016 and April 1, 2015
(` in Lakhs)
Particulars 31-Mar-2016 1- Apr-2015
Total Equity (Shareholder’s funds) as per previous GAAP 278,740.76 237,417.11
Adjustments for:
Reversal of Proposed dividend including Dividend tax (Refer Note a below) 9,963.17 9,028.03
Effect on account of Business combinations prior to transition date (Refer Note d below)) 6,219.54 5,799.31
TaxAdjustments(ReferNotecbelow) 21.49 4.56
Non-Controlling interests presented as a part of total equity under Ind AS (Refer Note e below) 36,740.31 31,748.37
OtherAdjustments(ReferNotefbelow) (9.80) (16.29)
Total Adjustment to Equity 52,934.71 46,563.98
Total Equity under Ind AS 331,675.47 283,981.09
Effect of Ind AS adoption on the consolidated statement of profit and loss for the year ended March 31, 2016
(` in Lakhs)
ParticularsNote No.
As per previous
GAAP Regrouping*
Effect of transition to
Ind ASInd AS
Revenue from operations 3,542,964.64 1,253.28 - 3,544,217.92Other income (Net) f 4,668.24 (1,310.78) 40.39 3,397.85Total Income 3,547,632.88 (57.50) 40.39 3,547,615.77
ExpensesPurchases of Traded goods 3,428,621.88 (57.50) - 3,428,564.38Changes in Inventories of Traded goods (91,381.58) - - (91,381.58)Employee Benefits expenses b 53,997.35 - (16.82) 53,980.53Finance Costs b 17,967.06 - 81.82 18,048.88Depreciation & Amortisation expense d 4,330.52 - 351.02 4,681.54Other Expenses f 74,638.66 49.51 2.79 74,690.96Total Expenses 3,488,173.89 (7.99) 418.81 3,488,584.71Profit before Corporate social responsibility expenditure and Tax 59,458.99 (49.51) (378.42) 59,031.06Allocation for Corporate Social Responsibility Expenditure 49.51 (49.51) - -Profit before tax 59,409.48 - (378.42) 59,031.06
Tax expense:Current tax 15,993.63 - - 15,993.63Deferred tax c (1,354.20) - (16.49) (1,370.69)Share of Loss of Associate - - - -Profit after tax 44,770.05 - (361.93) 44,408.12Share of Minority interest e 2,204.33 - (2,204.33) -Profit for the Year (A) 42,565.72 - 1,842.40 44,408.12
Other Comprehensive Income (B)Items that will not be reclassified to Profit and lossRemeasurement of Defined benefit plan (i) - - 65.00 65.00Income tax relating to item above (ii) c - - (30.76) (30.76)Net Other Comprehensive Income that will not be reclassified to profit or loss(i-ii) - - 34.24 34.24Items that may be reclassified to Profit and lossForeign exchange differences in translating the financial statements of foreign operations (i) - - 9,234.77 9,234.77Income tax relating to item above (ii) c - - - -Net Other Comprehensive Income that may be reclassified to profit or loss(i-ii) b - - 9,234.77 9,234.77Total Other Comprehensive Income - - 9,269.01 9,269.01Total Comprehensive Income for the Year (A+B) 42,565.72 - 11,111.41 53,677.13* The figures have been regrouped wherever necessary to conform to the classification of the current year and requirements of Ind AS1
Annual Report
2016–2017179
Annual Report
2016–2017178
Reconciliation of total Comprehensive income for the year ended March 31, 2016
` in Lakhs
Particulars 31-Mar-2016
Net Profit After Tax under previous GAAP 42,565.72
Adjustments for:
Effect on account of Business combinations prior to transition date (Refer Note d below) (351.11)
ShareofNon-controllinginterestsinprofitsofasubsidiaryadjustedunderpreviousGAAPtoarriveattheprofitof the Group now considered as an allocation of profit for the period(Refer Note e below) 2,204.33
OtherAdjustments(ReferNotefbelow) 6.49
Total Comprehensive income under Ind AS 53,677.13
Effect of Ind AS adoption on the consolidated statement of Cash flows for the year ended March 31, 2016` in Lakhs
Year ended March 31, 2016
Particulars Notes Previous GAAPEffect of
transition to Ind AS
Ind AS
Net Cash used in operating activities (14,214.48) - (14,214.48)
Net Cash used in investing activities g (6,407.93) 4,599.81 (1,808.12)
Net Cash generated from financing activities 20,163.77 - 20,163.77
Net increase in Cash and Cash Equivalents (458.64) 4,599.81 4,141.17
Cash and cash equivalents at the beginning of the year g 51,441.78 (12,671.24) 38,770.54
Add : Effect of Exchange differences on restatement of foreign currency Cash and Cash Equivalents 2,961.41 - 2,961.41
Cash and Cash equivalents at the end of the year (Refer Note 13a) 53,944.55 (8,071.43) 45,873.12
Analysis of cash and cash equivalents as at March 31, 2016 and as at April 1, 2015 for the purpose of statement of cash flows under Ind AS
` in Lakhs
Particulars NotesAs at
March 31, 2016As at
March 31, 2015
Cash and Cash equivalents for the purpose of statement of cash flows as per previous GAAP 53,944.55 51,441.78
Less: Other bank balances not considered as Cash and Cash equivalents under Ind AS g 8,071.43 12,671.24
Cash and Cash equivalents for the purpose of statement of cash flows under Ind AS 45,873.12 38,770.54
Notes to reconciliations
a. Under previous GAAP, equity dividend recommended by the board of directors after the end of the reporting period but before the financial statements were approved for issue was recognized in the financial statements as a liability. Under Ind AS 10, such dividends are to be recognized when approved by the members in a general meeting. Accordingly an amount of ` 9,963.17 Lakhsrecognisedasliabilityforthefinancialyear2014-15isreversedandthesameadjustedinOtherEquityintheyear2015-16and similarly an amount of ` 9,028.03Lakhsrecognisedasliabilityinthefinancialyear2013-14wasreversedandadjustedinOther Equity in the year 2014-15 as paid.
b. Under previous GAAP, actuarial gains and losses on re-measurement of net defined benefit liability/asset were recognized in the Consolidated Statement of Profit and Loss, whereas as per Ind AS 1 Presentation of Financial statements and Ind AS 19 Employee Benefits, the effect of the same shall be recognised in other Comprehensive income by accumulating in a separate component of Equity. Accumulated gains and losses on re-measurement of net defined benefit liability as on April 1, 2015 have beentransferredfromretainedearningstoaseparatecomponentRetirementbenefitobligationreserve.Howeverthere isnochangeintotalEquityonaccountofthisadjustment.Anamountof` 34.24 Lakhs (net of taxes) is recognized as gain (gain under previous GAAP regrouped to other comprehensive income resulting in a reduction in profits to the extent of ` 34.24 Lakhs) for the year 2015-16 under Ind AS.
Similarly, movement in foreign currency translation Reserve amounting to 9,234.77 Lakhs upon translation of financial statements of foreign subsidiaries and branch is treated as other comprehensive income in line with Ind AS 1.
c. Taxexpensehasbeen recomputedbasedon the IndASadjustmentand thedifferential amount ischarged toProvision forTaxation which has been charged to Consolidated Statement of Profit and loss. The difference effect on Transition date has been adjustedagainstDeferredTaxandtheRetainedearningsason1st April 2015.
d. The Group being a first time adopter has elected to apply IND AS 103 “Business Combinations” retrospectively to past business combinations (business combinations that occurred before or after April 1, 2015 ).
Inlinewiththeprinciplesadoptedasexplainedabove,adjustmentshavebeenmadetotheopeningconsolidatedstatementofchanges in equity for the following:
The Group acquired controlling stake in Arena, Adeo and Linkplus respectively in 2010-11, 2013-14 and 2015-16. The excess consideration paid over the fair value of assets on acquisition of these subsidiaries were accounted as Trade name, Customer relationship and Goodwill, in line with IFRS by RIML. The group in Consolidated Financial Statements reversed the recognition of these intangibles and related amortization for the purpose of preparation of consolidated financial statements in accordance with the previous GAAP till the year ended March 31, 2016.
On transition to Ind AS, the Group has recognised these assets and the resultant impact arising on account of the same, on amortisation and translation effects retrospectively, as on the date of Transition. Consequent to this change, there is an increase in Total Equity as at March 31, 2016 for 6,219.54 Lakhs (` 5,799.31Lakhs as on April 1, 2015), reduction in Goodwill for 7,590.69 Lakhs (` 5,397.36 Lakhs as on April 1, 2015) and increase in other Intangible assets for ` 25,366.21 Lakhs (` 22,309.53 Lakhs as on April 1, 2015).
e. Under previous GAAP, non-controlling interests (Minority interests) were presented in the consolidated balance sheet separately from liabilities and the equity of the company’s shareholders. Under Ind AS, non-controlling interests are presented in the consolidated balance sheet within total equity, separately from the equity attributable to the shareholders of the Company.
Further,underpreviousGAAP,theshareofNon-controllinginterestsintheprofitorlossofsubsidiariesisadjustedinordertoarrive at the profit of the Group whereas under Ind AS, this is reflected as an allocation of the profit or loss for the period to the shareholders of the Company and the non-controlling interests. The effect of this change is an increase in total equity as at March 31, 2016 of ` 36,740.31 Lakhs (` 31,748.37 Lakhs as on April 1, 2015) and an increase in profit for the year ended March 31, 2016 for ` 2,055.67 Lakhs.
f. Lease deposits held as on the transition date has been measured at value which is estimated at the present value of the deposit, discounted using the prevailing market rate of Government securities.
i. ThedifferencebetweenthecarryingvalueandthefairvalueamountisadjustedtotheRetainedearningsasonthetransitiondate. The said difference between the present value of the deposit and the recoverable value is amortised over the lease period as prepaid expenses.
ii. Rental expenses & Interest Income for the above amortization value for the year ended March 31, 2016 has been charged to Consolidated Statement of Profit and loss.
g. Deposits placed with banks that are not readily convertible into Cash are classified as Other bank balances under Ind AS both for the purpose of consolidated Balance sheet and consolidated cash flow statement.
Annual Report
2016–2017181
Annual Report
2016–2017180
40. Disclosure on Specified Bank Notes (SBNs)
During the year, the Company and its Indian Subsidiaries had specified bank notes and other denomination notes. As defined in the MCA notification G.S.R. 308 (E) dated March 30, 2017 on the details of Specified Bank Notes (SBN) held and transacted during the period from November 8, 2016 to December 30, 2016, the denomination wise SBNs and other notes as per the notification is given below:
` in Lakhs
Particulars SBNs*Other
denomination Notes
Total
Closing Cash in hand as on November 8, 2016 18.14 18.84 36.98
(+)Permittedreceipts - 123.24 123.24
(-) Permitted payments - 81.95 81.95
(-) Amount deposited in Banks 18.14 21.83 39.97
Closing Cash in hand as on December 30, 2016 - 38.30 38.30
*For the purpose of this disclosure, the term ‘Specified Bank Notes’ shall have the same meaning provided in the notification of the Government of India, in the Ministry of Finance, Department of Economic Affairs, S.O No. 3407(E), dated November 8, 2016.
41. The Board of Directors at its meeting held on February 3, 2017 declared a special (Interim) dividend of ` 2 per
Equity share of ` 2/- each -i.e.,100% of face value per share.
42. The financial statements were approved for issue by the board of directors on May 25, 2017.
For and on behalf of the Board of Directors
Raj Shankar E H Kasturi Rangan Managing Director Whole-Time Director (DIN-00238790) (DIN-01814089)
S V Krishnan M Muthukumarasamy Chief Financial Officer Company SecretaryPlace : Chennai Date : May 25, 2017
FO
RM
- A
OC
1
Sal
ient
Fea
ture
s o
f F
inan
cial
Sta
tem
ents
of
Sub
sid
iari
es/A
sso
ciat
es a
s p
er C
om
pan
ies
Act
, 201
3
Part
(A) S
UBSI
DIAR
IES
(` In
Lak
hs)
Sl.
No.
Com
pany
nam
eDa
te o
f Ac
quis
ition
Repo
rtin
g Pe
riod
Repo
r tin
g Cu
rren
cyEx
chan
ge
Rate
Shar
e Ca
pita
lRe
serv
es
& Su
rplu
sTo
tal
Asse
tsTo
tal
Liab
ilitie
sIn
vest
m
ents
@Tu
rnov
erPr
ofit
befo
re
taxa
tion
Prov
isio
n fo
r ta
xatio
n
Profi
t af
ter
tax
Prop
osed
di
vide
nd
Owne
r-sh
ip
Inte
rest
%
Ben-
efici
al
Inte
rest
%
1Ca
dens
wor
th (I
ndia
) Lim
ited
1-Ap
r-05
Mar
ch 3
1, 2
017
INR
1.00
0013
0.13
6,82
5.61
14,1
98.9
67,
243.
21-
32,7
52.2
21,
528.
9855
0.55
978.
43 -
10
010
0
2Pr
oCon
nect
Sup
ply
Chai
n So
lutio
ns L
imite
d31
-Aug
-12
Mar
ch 3
1, 2
017
INR
1.00
0072
4.32
4,97
9.46
8,09
1.80
2,38
8.02
-14
,757
.14
2,87
9.60
1,01
0.01
1,86
9.59
362
.16
100
100
3En
sure
Sup
port
Serv
ices
(Ind
ia) L
td27
-Jun
-13
Mar
ch 3
1, 2
017
INR
1.00
0045
0.00
1,50
1.54
6,57
6.21
4,62
4.67
476.
5312
,357
.08
1,07
1.42
352.
2671
9.16
157
.50
100
100
4Re
ding
ton
Inte
rnat
iona
l Mau
ritiu
s Li
mite
d16
-Jul
-08
Mar
ch 3
1, 2
017
USD
64.8
500
17,9
42.7
189
,716
.67
107,
659.
39-
--
10,9
04.4
1-
10,9
04.4
1 -
10
010
0
5Re
ding
ton
Dist
ribut
ion
Pte.
Lim
ited
1-Ap
r-05
Mar
ch 3
1, 2
017
USD
64.8
500
2,59
3.80
20,8
70.2
074
,372
.74
50,9
08.7
4-
298,
246.
267,
460.
641,
742.
955,
717.
69 -
10
010
0
6Re
ding
ton
Gulf
FZE
13-N
ov-0
8M
arch
31,
201
7AE
D17
.655
02,
118.
6014
3,95
6.67
406,
902.
7426
0,82
7.47
-1,
708,
846.
4515
,231
.18
52.8
215
,178
.36
11,1
21.3
7 10
010
0
7Re
ding
ton
Egyp
t Ltd
(Lim
ited
Liab
ility
Com
pany
)9-
Feb-
00De
cem
ber 3
1, 2
016
EGP
3.74
751.
8765
3.50
4,12
9.87
3,47
4.50
-33
,147
.27
708.
5118
3.86
524.
65 -
10
010
0
8Re
ding
ton
Nige
ria L
imite
d15
-Oct
-02
Mar
ch 3
1, 2
017
NGN
0.21
1721
.17
(1,7
32.0
3)4,
012.
155,
723.
01-
6,06
4.89
(1,9
42.4
3)-
(1,9
42.4
3) -
10
010
0
9Re
ding
ton
Gulf
and
Co. L
LC11
-Nov
-03
Mar
ch 3
1, 2
017
OMR
168.
4425
252.
6632
3.36
1,71
0.60
1,13
4.57
-2,
690.
7016
.99
4.10
12.8
9 -
70
100
10Re
ding
ton
Keny
a Li
mite
d19
-Jul
-04
Mar
ch 3
1, 2
017
KES
0.62
996.
3014
5.97
9,46
2.18
9,30
9.91
-27
,976
.78
162.
9252
.66
110.
26 -
10
010
0
11Ca
dens
wor
th F
ZE29
-Mar
-05
Mar
ch 3
1, 2
017
AED
17.6
550
176.
5512
,449
.95
17,9
20.5
75,
294.
07-
93,2
46.5
91,
350.
72-
1,35
0.72
-
100
100
12Re
ding
ton
Mid
dle
East
LLC
1-Ju
l-05
Mar
ch 3
1, 2
017
AED
17.6
550
52.9
71,
066.
4463
,421
.06
62,3
01.6
6-
496,
934.
5836
0.91
-36
0.91
-
4910
0
13En
sure
Ser
vices
Ara
bia
LLC
1-De
c-05
Mar
ch 3
1, 2
017
SAR
17.2
925
172.
9351
5.86
938.
7324
9.94
-2,
760.
81(5
0.86
)-
(50.
86)
-
100
100
14Re
ding
ton
Afric
a Di
strib
utio
n FZ
E1-
Dec-
05M
arch
31,
201
7AE
D17
.655
017
6.55
12,4
82.8
712
,659
.42
--
--
--
-
100
100
15Re
ding
ton
Qata
r WLL
1-De
c-05
Mar
ch 3
1, 2
017
QAR
17.8
075
35.6
242
4.81
1,00
8.46
548.
04-
3,12
7.80
76.9
714
.13
62.8
5 -
49
100
16En
sure
Ser
vices
Bha
rain
S.P
.C26
-Mar
-07
Mar
ch 3
1, 2
017
BHD
172.
0100
86.0
123
9.33
689.
0236
3.68
-24
6.33
8.48
-8.
48 -
10
010
0
17Re
ding
ton
Qata
r Dis
tribu
tion
W.L
.L15
-Aug
-07
Mar
ch 3
1, 2
017
QAR
17.8
075
35.6
230
1.41
8,66
8.12
8,33
1.10
-56
,306
.75
99.7
92.
2997
.49
-
4910
0
18Re
ding
ton
Lim
ited
28-N
ov-0
8M
arch
31,
201
7GH
S15
.202
284
.45
(13.
00)
141.
5570
.11
-18
7.27
(27.
49)
-(2
7.49
) -
10
010
0
19Re
ding
ton
Keny
a (E
PZ) L
imite
d10
-Dec
-08
Mar
ch 3
1, 2
017
KES
0.62
990.
63(1
07.8
6)18
1.07
288.
29-
-(1
2.80
)-
(12.
80)
-
100
100
20Af
rica
Join
t Tec
hnic
al S
ervic
es#
7-M
ay-0
8M
arch
31,
201
7LY
D45
.768
613
7.31
18.4
415
5.75
--
-2.
84-
2.84
-
6510
0
21Re
ding
ton
Ugan
da L
imite
d9-
Jan-
09M
arch
31,
201
7UG
X0.
0180
2.70
132.
673,
601.
253,
465.
89-
10,1
25.4
92.
880.
862.
02 -
10
010
0
22Ca
dens
wor
th U
AE L
LC5-
May
-09
Mar
ch 3
1, 2
017
AED
17.6
550
52.9
784
4.34
4,43
5.28
3,53
7.98
-11
8,41
7.25
430.
50-
430.
50 -
49
100
23Re
ding
ton
Tanz
ania
Lim
ited
13-A
ug-0
9M
arch
31,
201
7TZ
S0.
0291
0.03
38.0
52,
567.
702,
529.
62-
10,2
30.8
626
.05
9.34
16.7
1 -
10
010
0
24Re
ding
ton
Mor
occo
Lim
ited
5-Oc
t-09
Mar
ch 3
1, 2
017
MAD
6.45
3519
.36
97.5
84,
243.
304,
126.
36-
13,2
07.3
443
.61
66.0
4(2
2.43
) -
10
010
0
25Re
ding
ton
Ango
la L
td p
ty#
5-Oc
t-12
Mar
ch 3
1, 2
017
AOA
3.89
647.
15(3
5.75
)13
7.48
166.
07-
--
--
-
100
100
26En
sure
IT S
ervic
es (p
ty) L
td27
-Jul
-11
Mar
ch 3
1, 2
017
ZAR
4.85
0033
.89
136.
5848
3.01
312.
54-
1,10
1.24
42.1
911
.81
30.3
7 -
10
010
0
27Re
ding
ton
Turk
ey H
oldi
ngs
S.A.
R.L
8-No
v-10
Mar
ch 3
1, 2
017
USD
64.8
500
291.
8317
3.30
27,5
87.9
127
,122
.79
--
(178
.16)
-(1
78.1
6) -
10
010
0
28Ar
ena
Bilg
isay
ar S
anay
i Ve
Tica
ret A
.S.
8-No
v-10
Dece
mbe
r 31,
201
6US
D67
.925
015
,160
.18
32,0
17.1
312
1,23
3.22
74,0
55.9
1-
325,
587.
115,
382.
422,
614.
282,
768.
14 2
84.2
9 49
.40
49.4
0
29Ar
ena
Inte
rnat
iona
l FZE
25-M
ay-1
1De
cem
ber 3
1, 2
016
AED
18.4
925
184.
931,
044.
3215
,304
.31
14,0
75.0
7-
95,2
11.1
71,
033.
04-
1,03
3.04
-
49.4
049
.40
30Re
ding
ton
Bang
lade
sh L
imite
d24
-Jun
-05
Mar
ch 3
1, 2
017
BDT
0.80
8624
.26
17.7
989
.25
47.2
0-
132.
643.
630.
183.
45 -
99
100
31Re
ding
ton
SL (P
rivat
e) L
imite
d28
-Oct
-09
Mar
ch 3
1, 2
017
LKR
0.42
7412
1.55
331.
364,
414.
623,
961.
71-
14,5
70.4
925
1.63
92.8
615
8.77
-
100
100
32Re
ding
ton
Rwan
da L
td9-
May
-12
Mar
ch 3
1, 2
017
RWF
0.07
44-
(28.
58)
72.1
610
0.74
--
(15.
11)
-(1
5.11
) -
10
010
0
33Re
ding
ton
Kaza
khst
an L
LP4-
Dec-
12De
cem
ber 3
1, 2
016
KZT
0.20
3628
.51
(2,8
94.7
3)13
,548
.64
16,4
14.8
6-
23,8
38.6
61,
859.
36-
1,85
9.36
-
100
100
34En
sure
Gul
f FZE
25-J
ul-1
2M
arch
31,
201
7AE
D17
.655
017
6.55
694.
8020
,113
.08
19,2
41.7
3-
3,57
7.24
80.2
7-
80.2
7 -
10
010
0
35En
sure
Mid
dle
East
Tra
ding
LLC
14-N
ov-1
2M
arch
31,
201
7AE
D17
.655
052
.97
502.
7018
,879
.27
18,3
23.6
0-
9,95
7.74
104.
02-
104.
02 -
49
100
36En
sure
Sol
utio
ns N
iger
ia L
imite
d17
-Jan
-13
Mar
ch 3
1, 2
017
NGN
0.21
172.
1211
1.59
930.
9081
7.20
-1,
366.
5047
.52
13.0
134
.51
-
99.9
010
0
37En
sure
Tec
hnic
al S
ervic
es K
enya
Lim
ited
17-D
ec-1
2M
arch
31,
201
7KE
S0.
6299
6.30
(41.
92)
297.
0033
2.62
-35
0.58
(21.
75)
-(2
1.75
) -
10
010
0
Annual Report
2016–2017183
Annual Report
2016–2017182
Part
(A) S
UBSI
DIAR
IES
(` In
Lak
hs)
Sl.
No.
Com
pany
nam
eDa
te o
f Ac
quis
ition
Repo
rtin
g Pe
riod
Repo
r tin
g Cu
rren
cyEx
chan
ge
Rate
Shar
e Ca
pita
lRe
serv
es
& Su
rplu
sTo
tal
Asse
tsTo
tal
Liab
ilitie
sIn
vest
m
ents
@Tu
rnov
erPr
ofit
befo
re
taxa
tion
Prov
isio
n fo
r ta
xatio
n
Profi
t af
ter
tax
Prop
osed
di
vide
nd
Owne
r-sh
ip
Inte
rest
%
Ben-
efici
al
Inte
rest
%
38En
sure
Ser
vices
Uga
nda
Lim
ited
17-J
an-1
3M
arch
31,
201
7UG
X0.
0180
0.90
33.2
981
.97
47.7
8-
99.2
80.
420.
48(0
.06)
-
100
100
39En
sure
Tech
nica
l Ser
vices
Tanz
ania
Lim
ited
21-D
ec-1
2M
arch
31,
201
7TZ
S0.
0291
0.29
(10.
69)
240.
9325
1.33
-75
.24
(3.8
3)(1
.23)
(2.6
0) -
10
010
0
40En
sure
Gha
na L
imite
d10
-May
-13
Mar
ch 3
1, 2
017
GHS
15.2
022
38.9
211
.24
107.
7657
.61
-15
2.33
3.10
0.83
2.27
-
100
100
41Pr
ocon
nect
Sup
ply
Chai
n Lo
gist
ics
LLC
24-A
pr-1
3M
arch
31,
201
7AE
D17
.655
052
.97
258.
241,
027.
7671
6.56
-7,
256.
1358
9.63
-58
9.63
-
4910
0
42En
sure
Tec
hnic
al S
ervic
es M
oroc
co L
imite
d (S
arl)
26-J
ul-1
3M
arch
31,
201
7M
AD6.
4535
6.45
(37.
48)
324.
9035
5.93
-42
2.04
(1.8
5)1.
03(2
.88)
-
100
100
43AD
EO B
ili şim
Dan
ışm
anlık
Hizm
etle
ri Sa
n. v
e Ti
c. A
.Ş.**
29-A
ug-1
3De
cem
ber 3
1, 2
016
TRY
19.2
651
0.03
0.45
2.04
1.55
-6.
060.
080.
020.
06 -
25
.19
25.1
9
44Re
ding
ton
Sene
gal L
imite
d SA
RL14
-May
-14
Mar
ch 3
1, 2
017
XAF
0.10
555.
2861
9.00
1,88
4.18
1,25
9.91
-39
,634
.23
2,04
5.74
282.
031,
763.
72 -
10
010
0
45Re
ding
ton
Saud
i Ara
bia
Dist
ribut
ion
Com
pany
18-A
ug-1
4M
arch
31,
201
7SA
R17
.292
54,
668.
9892
3.73
69,1
78.0
963
,585
.38
-30
0,56
9.42
644.
2417
7.43
466.
81 -
75
100
46Pa
ynet
Öde
me
Hizm
etle
ri A.
S.16
-Jan
-15
Dece
mbe
r 31,
201
6TR
Y19
.265
10.
390.
191.
320.
74-
1.98
0.01
--
-
49.4
049
.40
47Se
nson
et T
ekno
loji
Elek
tronı
k Ve
Bılıs
ım H
ızmet
lerı
Sana
yı Ve
Tıc
aret
A.S
.5-
Nov-
12De
cem
ber 3
1, 2
016
USD
67.9
250
165.
741,
960.
9910
,654
.04
8,52
7.30
-11
,303
.02
500.
5515
7.89
342.
66 -
49
.29
49.2
9
48CD
W In
tern
atio
nal T
radi
ng F
ZE5-
Jul-1
5M
arch
31,
201
7AE
D17
.655
00.
18(4
6.72
)1,
811.
011,
857.
55-
11,5
98.9
827
6.19
-27
6.19
-
100
100
49RN
DC A
llianc
e W
est A
frica
Lim
ited
17-N
ov-1
5M
arch
31,
201
7NG
N0.
2117
21.1
7(4
0.13
)1,
742.
071,
761.
03-
6,91
0.62
(41.
84)
-(4
1.84
) -
10
010
0
50Li
nk P
lus
Bilg
isay
ar S
iste
mle
ri Sa
nayi
Ve T
icar
et A
.S.
26-N
ov-1
5De
cem
ber 3
1, 2
016
TRY
19.2
651
192.
653,
501.
7419
,842
.16
16,1
47.7
7-
36,1
66.1
11,
665.
8333
2.71
1,33
3.12
-
8080
51Ra
jpro
tim S
uppl
y Ch
ain
Solu
tions
Lim
ited
25-J
ul-1
6M
arch
31,
201
7IN
R1.
0000
833.
3358
9.17
2,60
1.48
1,17
8.98
-3,
431.
9118
7.56
65.0
612
2.50
-
7676
# Op
erat
ions
Cea
sed
durin
g th
e ye
ar;
** S
old
durin
g th
e ye
ar;
@ I
nves
tmen
t exc
lude
s in
vest
men
t in
subs
idia
ry
Par
t (B
) Ass
oci
ate
and
its
sub
sid
iary
(` In
Lak
hs)
Sl.
No.
Nam
e of
Com
pany
Date
of
Asso
ciat
ion
Repo
rtin
g Pe
riod/
Late
st A
udite
d
Bala
nce
shee
t dat
e
Shar
es
Held
by
the
Com
pany
Amou
nt o
f
inve
stm
ent
Owne
rshi
p
inte
rest
Bene
ficia
l
inte
rest
Reas
on fo
r
sign
ifica
nt in
fluen
ce
Tota
l
Liab
ilitie
s
Netw
orth
attr
ibut
able
Loss
cons
ider
ed in
cons
olid
atio
n
Loss
not
cons
ider
ed in
cons
olid
atio
n
1Re
ding
ton
(Indi
a) In
vest
men
ts L
imite
d an
d its
Sub
sidi
ary*
28-J
un-9
531
-Mar
-17
1000
0010
.00
47.6
247
.62
Shar
e ho
ldin
g m
ore
than
20%
4,71
6.70
(10.
00)
-(3
80.2
3)
* In
clud
es it
s Su
bsid
iary
Cur
rent
s Te
chno
logy
Ret
ail (
Indi
a) L
imite
d
The
belo
w m
entio
ned
com
pani
es a
re y
et to
com
men
ce o
pera
tion:
Ensu
re T
echn
ical
Ser
vices
(PTY
) LTD
,Sou
th A
frica
; Re
ding
ton
Gulf
FZE
Co, I
raq;
Ens
ure
Mid
dle
East
Tec
hnol
ogy
Solu
tions
LLC
, UAE
; Pr
ocon
nect
Sau
di L
LC,S
audi
Ara
bia;
Red
serv
Bus
ines
s So
lutio
ns P
rivat
e Li
mite
d, In
dia
Redi
ngnt
on D
istri
butio
n Co
mpa
ny L
LC, E
gypt
Abbr
evia
tion:
INR–
Indi
an R
upee
; AED
–UAE
Dirh
am; Q
AR–Q
atar
i Riya
l; OM
R–Om
ani R
iyal;
USD–
US D
olla
r; NG
N–Ni
geria
n Na
ira; K
ES–K
enya
n Sh
illing
; SAR
–Sau
di R
iyal;
EGP–
Egyp
tian
Poun
d;
BHD–
Bahr
ain
Dina
r; GH
S–Gh
anai
an C
edi;
UGX–
Ugan
da S
hillin
g; L
YD–L
ibya
n Di
nar;
MAD
–Mor
occa
n Di
rham
; XAF
–Cen
tral A
frica
n Fr
anc;
BDT
–Ban
glad
esh
Taka
; TZS
–Tan
zani
a Sh
illing
; ZAR
–So
uth
Afric
an R
and;
RW
F–Rw
anda
n Fr
anc;
KZT
–Kaz
haks
tani
teng
e; A
OA–A
ngol
an K
wan
za; L
KR–S
rilan
kan
Rupe
e; T
RY–T
urki
sh L
ira.
For a
nd o
n be
half
of th
e Bo
ard
of D
irect
ors
Raj S
hank
arE
H Ka
stur
i Ran
gan
Man
agin
g Di
rect
orW
hole
-tim
e Di
rect
or(D
IN-0
0238
790)
(DIN
-018
1408
9)
S V
Kris
hnan
M M
uthu
kum
aras
amy
Chie
f Fin
anci
al O
ffice
rCo
mpa
ny S
ecre
tary
Plac
e: C
henn
aiDa
te: M
ay 2
5, 2
017
REDINGTON (INDIA) LIMITED
Regd. Office: SPL Guindy House, 95, Mount Road, Guindy, Chennai 600 032
NOTICE is hereby given that the TWENTYFOURTHANNUALGENERALMEETINGof theCompanywill be held on Friday,28th July2017at10.00A.M.attheMiniHall,NaradaGanaSabha,No.314,T.T.K.Road,Alwarpet,Chennai-600018,totransactthe following business:
ORDINARY BUSINESS:
1. To receive, consider and adopt the Standalone audited Balance Sheet as at 31st March 2017, the Statement of Profit and Loss, Statement of Changes in Equity and Cash Flow Statement for the financial year ended on that date and the Report of Auditors and Directors thereon.
2. To receive, consider and adopt the Consolidated audited Balance Sheet as at 31st March 2017, the Statement of Profit and Loss, Statement of Changes in Equity and Cash Flow Statement for the financial year ended on that date and the Report of Auditors thereon.
3. To confirm the payment of Special (Interim) Dividend on Equity Shares and to declare a Final Dividend on Equity Shares for the financial year 2016-17.
4. To appoint Mr. B. Ramaratnam (DIN 07525213) as Director, who retires by rotation and being eligible, offers himself for re-appointment.
5. To appoint Mr. Tu, Shu-Chyuan (DIN 02336015) as Director, who retires by rotation and being eligible, offers himself for re-appointment.
6. To consider and, if thought fit, to pass the following resolution as an Ordinary Resolution:
"RESOLVED THAT pursuant to the provisions of Section 139 and other applicable provisions, if any, of the Companies Act, 2013 ("Act") and the Companies (Audit and Auditors) Rules, 2014, as amended from time to time, B S R & Co. LLP, Chartered Accountants (Firm Registration No. 101248W/W - 100022), be and is hereby appointed as the Statutory Auditors of the Company, to hold office from the conclusion of this Annual General Meeting ("AGM") till the conclusion of the twenty ninth AGM,subjecttoratificationoftheirappointmentateveryAGMifsorequiredundertheAct,atsuchremuneration,asmaybemutually agreed between the Board of Directors of the Company and the Auditors."
SPECIAL BUSINESS:
7. To consider and if thought fit, to pass, the following as an Ordinary Resolution:
"RESOLVED THAT pursuant to recommendation of the Nomination and Remuneration Committee and approval of the Board andsubjecttotheprovisionsofSection152andanyotherapplicableprovisionsoftheCompaniesAct,2013("theAct")andthe Companies (Appointment and Qualification of Directors) Rules, 2014 as amended from time to time, Mr. Udai Dhawan ( DIN 03048040), who was appointed as an Additional Director of the Company by the Board of Directors w.e.f. 10th January, 2017, be and is hereby appointed as Director of the Company and his term of appointment is liable to retire by rotation."
8. To consider and if thought fit, to pass, the following as an Ordinary Resolution:
"RESOLVED THAT pursuant to the provisions of Sections 196, 197, 203 and other applicable provisions of the Companies Act, 2013 and the rules made thereunder (including any statutory modification(s) or re-enactment thereof for the time being inforce),readwithScheduleVtotheCompaniesAct,2013andsubjecttoapprovaloftheCentralGovernment,theconsent
oftheCompanybeandisherebyaccordedtore-appointMr.RajShankar(DIN-00238790)asManagingDirectoroftheCompany for a period of five years with effect from 26th July 2017 without payment of remuneration except reimbursement of expenses incurred by him in connection with the business of the company and on the terms contained in the Agreement enteredbetweenMr.RajShankarandtheCompany".
9. To consider and if thought fit, to pass, the following as an Ordinary Resolution:
"RESOLVED THAT pursuant to the provisions of Section 143(8) and any other applicable provisions of the Companies Act, 2013 and the rules made thereunder, as amended from time to time, approval of the Company be and is hereby accorded to appoint M/s Ernst & Young LLP, Singapore as Auditor(s) for the Branch Office of the Company at Singapore for the financial year 2017-18, on such terms and conditions as may be fixed by the Board of Directors in consultation with the Audit Committee".
By Order of the Board For Redington (India) Limited
Place : Chennai M. Muthukumarasamy Date : May 25, 2017 Company Secretary
Notes:
1. The related explanatory statement, pursuant to Section 102 of the Companies Act, 2013 in respect of the business under items 6 to 9 is attached hereto.
2. AMEMBERENTITLEDTOATTENDANDVOTEATTHEMEETINGISENTITLEDTOAPPOINTAPROXYTOATTENDANDVOTE INSTEADOFHIMSELF/HERSELFANDSUCHPROXYNEEDNOTBEAMEMBER. ABLANKPROXY FORM ISENCLOSEDFORUSEBYMEMBERS, IFREQUIRED.THISMUSTBESUBMITTEDATTHECOMPANY'SREGISTEREDOFFICEATLEAST48HOURSBEFORETHECOMMENCEMENTOFTHEMEETING.APERSONCANACTASPROXYONBEHALFOFNOTEXCEEDINGFIFTY(50)MEMBERSANDHOLDINGINTHEAGGREGATENOTMORETHANTENPERCENT(10%)OFTHETOTALSHARECAPITALOFTHECOMPANY.
3. The Register of Members and Share Transfer Books of the Company will remain closed from Saturday, 22nd July 2017 to Friday, 28th July 2017 (both days inclusive) for the purpose of payment of Dividend.
4. The Dividend as recommended by Board of Directors, if approved at the meeting, will be paid as under:
• toallmembersinrespectofsharesheldinphysicalformaftergivingeffecttovalidtransfersinrespectoftransferrequestslodged with the Company on or before the close of business hours on 21st July 2017.
5. All correspondence with regard to share transfers/dividends and matters related therewith may be addressed directly to the Company'sRegistrarandShareTransferAgentsatM/s.CameoCorporateServicesLimited,'SubramanianBuilding',No.1,ClubHouseRoad,Chennai-600002.
6. The members are requested to lodge/notify the transfer deeds, communication for change of address, Bank details, ECS details, wherever applicable, mandates (if any) with the Company's Registrar and Share Transfer Agents, M/s. CameoCorporate Services Ltd., for shares held in physical mode.
7. The members / beneficial owners holding shares in electronic form are requested to lodge the above details to their depository participants and not to the Company or to the Registrar and Share Transfer Agents of the Company, as the Company is obliged to use only the data provided by the Depositories while making payment of dividend.
9. The Companies Act, 2013 authorizes the Company to send all statutory communications via email to the members who have registered their email ID. The Company, therefore, requests
a. The members who are holding shares in Physical mode to submit their valid E-mail ID to M/s. Cameo Corporate Services Limited, the Registrar and Share Transfer Agents, by quoting their folio number and also any change therein from time to time
and
b. The members / beneficial owners holding shares in dematerialized form are requested to inform/update their valid E-mail ID to their respective depository participants from time to time.
10. Members/Proxy holders are requested to produce the admission slip duly completed and signed at the venue.
11. Thedetailed informationofUnclaimedDividend is uploaded in theCompany'swebsitewww.redingtonindia.com for thebenefit of members.
12. The members whose Shares in respect of which dividend entitlements have remained unclaimed or unpaid for seven consecutive years or more, are required to be transferred by the Company to the Investor Education and Protection Fund (IEPF)oftheGovernmentofIndia.ThemembersarerequestedtocontacttheCompany'sRegistrar&ShareTransferAgentM/s. Cameo Corporate Services Limited at Unit: Redington (India) Limited, Subramanian Building, 5thFloor,No.1,ClubHouseRoad, Chennai - 600 002. Contact no: 044 28460390. Email Id: [email protected].
In case the Company does not receive any communication from the concerned shareholders, the Company shall, in order to adhere with the requirements of the lnvestor Education and Protection Fund Authority (Accounting, Audit, Transfer and Refund) Rules, 2016, transfer the shares to the IEPF suspense account by the due date as per the procedure set out in the aforesaid rules.
13. SEBIhasmandatedallCompaniestoprintthebankaccountdetailsoftheinvestorsonthepaymentinstruments.Hence,while making revalidation requests the Members are requested to give their bank account details to print the same in the dividend payment instruments.
14. Brief profiles of the Directors seeking appointment/re-appointment at the Annual General Meeting are provided in Annexure A to this notice.
15. Electronic copies of the Annual Report and Notice are being sent to all the members whose email IDs are registered with the Company/Depository Participants for communication purposes unless any member has requested for a hard copy of the same. For members who have not registered their email address, physical copy of the Annual Report and Notice are being sent in the permitted mode.
Voting through Electronic means:
In compliance with the provisions of Section 108 of the Companies Act, 2013 and Rule 20 of the Companies (Management and Administration) Rules, 2014, the Company offers remote e-voting facility (e-voting from a place other than venue of the AGM) to all the members of the Company to cast their votes electronically on all the resolutions set forth in the notice. The Company has availed the facilities with National Securities Depositories Limited (NSDL) for facilitating e-voting. The Notice to the Meeting, inter alia, explains the process and manner of e-voting.
The facility for voting shall also be made available at the venue of the AGM. The members attending the meeting, who have not already cast their vote through e-voting shall be able to exercise their voting rights at the meeting. The members who have already cast their vote through remote e-voting may attend the meeting but shall not be entitled to cast their vote again at the AGM.
TheCompanyhasappointedMsCSRBhuvana,PracticingCompanySecretary,asthe'Scrutiniser'forconductingtheE-Votingprocess in a fair and transparent manner.
The Board of Directors has appointed Mr. S. V. Krishnan, Chief Financial Officer and Mr. M. Muthukumarasamy, Secretary of the Company as the persons severally responsible for the entire e-voting process.
The Scrutiniser shall immediately after the conclusion of the General Meeting, unblock the votes in the presence of at least two (2) witnessesnotintheemploymentoftheCompanyandshallmakeaconsolidatedScrutinizer'sReportofthevotescastinfavoror against, if any, forthwith to the Chairman within a period not exceeding 48 hours from the conclusion of the General Meeting.
The results would be declared at or after the date of AGM of the Company by the Chairman or the person authorised by him. The ResultsdeclaredalongwiththeScrutinizer'sReportshallbeplacedontheCompany'swebsitewww.redingtonindia.comandonthe website of NSDL and shall be forwarded to the Stock Exchanges.
The Instructions for members for e-voting are as under
A. In case of members receiving e-mail from NSDL:
i. (a) For members whose e-mail addresses have been registered: Open the attached PDF file "Redingtonevoting.pdf" by giving your "Client ID" (in case you are holding shares in demat mode) or Folio No. (In case you are holding shares in physical mode) as default password. This contains your "User ID" and "Password" for e-voting.
(b) For members who have not registered their email address: please refer to the "User-Id" and "Password" printed on the notice.
ii. Please note that the Password is an initial password.
iii. Open internet browser and enter the URL: http//www.evoting.nsdl.com.
iv. Click on "Shareholders Login".
v. Enter User Id and Password as initial password as mentioned in step (i) (a) or (b) above and click Login.
vi. Password Change Menu appears. Change the password with the new password of your choice with minimum 8 digits/ characters or combination thereof.
vii. Please note your new password. We strongly recommend that you do not share your new password and take utmost care to keep your password confidential.
viii. In case you are already registered with NSDL, you can use your existing User ID and Password for casting your e-vote.
ix. Homepageof"e-voting"opens.Clickon"e-voting-ActiveVotingCycles".
x. Select "EVEN" of Redington (India) Limited.
xi. Now you are ready for "e-voting" as "Cast Vote" page opens.
xii. Cast your vote by selecting appropriate option and click "Submit" and also "Confirm" when prompted.
xiii. Upon confirmation, the message, "Vote cast successfully" will be displayed. Once you have voted on the resolution, you will not be allowed to modify your vote.
xiv. InstitutionalShareholders(i.e.otherthanIndividuals,HUF,NRI,etc.)arerequiredtosendscannedcopy(PDF/JPGformat)of the relevant Board Resolution / Authority Letter, etc. together with attested specimen signature of the duly authorised signatory (ies) who is/are authorized to vote, to the Scrutiniser through email on [email protected] with a copy marked to [email protected].
xv. The e-voting period commences on 25th July 2017 (9:00 am) and ends on 27th July 2017 (5:00 pm). The e-voting module will be disabled by NSDL for voting thereafter.
xvi. In case of any queries, you may refer the Frequently Asked Questions (FAQs) for Members and remote e-voting user manual for Members available at the downloads section of www.evoting.nsdl.com or call on toll free no.: 1800-222-990.
xvii. You can also update your mobile number and e-mail id in the user profile details of the folio which may be used for sending future communication(s).
xviii. The voting rights of members shall be in proportion to their shares of the paid up equity share capital of the Company as on the cut-off date i.e. 21st July 2017.
xix. Any person, who acquires shares of the Company and become member of the Company after dispatch of the notice and holding shares as of the cut-off date i.e. 21st July 2017, may obtain the login ID and password by sending a request at [email protected] or [email protected].
Note:However, if youarealready registeredwithNSDL for remotee-voting thenyoucanuseyourexistinguser IDandpassword for casting your vote. If you forgot your password, you can reset your password by using "Forgot User Details/Password" option available on www.evoting.nsdl.com or contact NSDL at the following toll free no.: 1800-222-990.
xx. A person, whose name is recorded in the register of members or in the register of beneficial owners maintained by the depositories as on the cut-off date only shall be entitled to avail the facility of remote e-voting as well as voting at the AGM through ballot paper.
B. In case a Member receives physical copy of the Notice of AGM [for members whose email IDs are not registered with the Company/ Depository Participants or requesting physical copy], the initial password is provided as below at the bottom of the Attendance Slip
EVEN (E-Voting Event Number) USER ID PASSWORD
Explanatory Statement to the NoticeItem No. 6
The below explanatory statement is given although not mandated under Section 102 of Companies Act, 2013.
Under Section 139 of the Indian Companies Act, 2013 (Act) and the Rules made thereunder, it is mandatory for the Company to rotate the current statutory auditors on completion of the maximum term permitted under the said Section.
To comply with the provisions of the Act, it is proposed to go in for rotation of the Statutory Auditors at the ensuing Annual General Meeting through the appointment of a new firm of Chartered Accountants to act as the Statutory Auditors of the Company.
M/s. BSR & Co. LLP, Chartered Accountants, (ICAI Firm Registration No. 101248W/W-100022) a firm of long standing and reputation, has been identified for appointment as the Statutory Auditors of the Company.
Being eligible for appointment under the provisions of the Act, they have furnished their consent to act as the Statutory Auditors, in terms of the provisions of the Act and also provided a certificate to the effect that their appointment, if made, shall be in accordance with the conditions laid down and that they satisfy the criteria prescribed under Section 141 of the Act. M/s BSR & Co.LLP,CharteredAccountantsissubjectedtothepeerreviewprocessoftheInstituteofCharteredAccountantsofIndia(ICAI)and holds a valid certificate issued by the Peer Review Board of the ICAI.
The Board of Directors, on the recommendation of the Audit Committee, at the meeting held on 25th May, 2017, proposed the appointment of M/s. BSR & Co. LLP, Chartered Accountants, Chennai as the Statutory Auditors of the Company for a period of 5 years from the conclusion of this Annual General Meeting.
None of the Directors and Key Managerial Personnel of the Company and their relatives is concerned or interested, financially or otherwise, in the aforesaid Ordinary Resolution.
Item No. 7
The Board of Directors vide circular resolution dated 9th January 2017, appointed Mr. Udai Dhawan (DIN 03048040) as an Additional Director under Section 161(1) of the Companies Act, 2013 ("The Act") and Article 26(b) of the Articles of Association of theCompanyandasNon-ExecutiveDirectoroftheCompanywhosetermofofficeissubjecttoretirementbyrotation.
The Company has received a notice under Section 160(1) of the Act from a member along with the requisite deposit amount proposing Mr. Udai Dhawan (DIN 03048040) for the office of Director.
None of the Directors except Mr. Udai Dhawan, Key Managerial Personnel of the Company or their relatives are concerned or interested in the resolution set out in item No.7 to this Notice.
A Brief profile of Mr. Udai Dhawan is provided at Annexure A to this Notice
Item No. 8
Mr.RajShankar(DIN00238790)wasappointedastheDeputyManagingDirectorwitheffectfromJuly26,2012foraperiodoffiveyears and his appointment was approved by the members at the Annual General Meeting held on July 31, 2012. Subsequently he was elevated and designated as the Managing Director at the Board Meeting w.e.f. October 17, 2014. The tenure of his appointment is until July 25, 2017.
ConsideringMr.RajShankar'svastexperienceinthefieldofInformationTechnologyandhiscontributiontotheCompany,theBoard of Directors at their meeting held on 25th May 2017, based on the recommendation of the Nomination and Remuneration Committeeapproved the re-appointmentofMr.RajShankarasManagingDirectorof theCompany,subject to theapprovalof members, for a further period of five years with effect from 26th July 2017 without payment of remuneration excepting reimbursement of the expenses incurred by him in connection with the business of the Company and on the terms and conditions containedintheagreementasenteredintobetweenMr.RajShankarandtheCompany.
NoneoftheDirectorsexceptMr.RajShankar,KeyManagerialPersonneloftheCompanyandtheirrelativesareconcernedorinterested in the resolution set out in item No.8 to this Notice.
To meet the increasing demand for software products among certain Indian customers to be billed from Singapore in Dollar terms, the Company incorporated a Branch office in Singapore. Provisions of the Companies Act, 2013 provides that the branch office of the Company should be audited either by the statutory auditor of the Company or by any other qualified person.
To comply with the requirements of the Companies Act, 2013, it is proposed to appoint M/s. Ernst & Young LLP, Singapore as Auditors for the Branch office at Singapore.
Your Directors recommend the resolution set out in the notice above, for the approval of members.
None of the Directors, Key Managerial Personnel of the Company or their relatives are concerned or interested in the resolution set out in item No. 9 to this Notice.
DP Id Client ID:(Applicable to investors holding Shares in demat form)
No. of Shares Held:
I certify that I am a member/ proxy for the member of the company
I hereby record my presence at the Twenty Fourth Annual General Meeting of the Company at the Mini Hall, Narada Gana Sabha, No. 314, T.T.K Road, Alwarpet, Chennai- 600 018 on Friday, the 28th July 2017 at 10.00 A.M.
Name of the member/proxy Signature of the Member/Proxy
Note: Please fill up this attendance slip and hand it over at the entrance of the meeting hall.
EVOTING PARTICULARS
EVEN (E-Voting Event Number) USER ID PASSWORD
The e-voting facility will be available during the following period
PROXY FORM[Pursuant to section 105(6) of the Companies Act, 2013 and rule 19(3) of the
Companies (Management and Administration) Rules, 2014]
Name of the member(s):
Registered address:
E-mail Id:
Folio No/ Client Id:
DP ID:
I/We, being the member(s) of shares of the above named company, hereby appoint
Name:
Address:
E-mail Id:
Signature: or failing him / her
Name:
Address:
E-mail Id:
Signature:
as my/our proxy to attend and vote (on a poll) for me/us and on my/our behalf at the Twenty Fourth Annual general meeting of the Company, to be held on the Friday, the 28thJuly2017at10.00.a.m.attheMiniHall,NaradaGanaSabha,No.314,T.T.KRoad,Alwarpet,Chennai–600018andatanyadjournmentthereofinrespectofsuchresolutionsasareindicatedbelow:
S.No. Resolution Particulars
1. Adoption of Standalone Financial Statements for the year ended 31st March, 2017
2. Adoption of Consolidated Financial Statements for the year ended 31st March, 2017
3. Confirmation on payment of Special (Interim) Dividend and to declare Final Dividend on equity shares.
4. Re-appointment of Mr. B. Ramaratnam (DIN: 07525213), who retires by rotation
5. Re-appointment of Mr. Tu, Shu-Chyuan (DIN: 02336015), who retires by rotation
6. Appointment of BSR & Co. LLP, Chartered Accountants as Statutory Auditors
7. Appointment of Mr. Udai Dhawan (DIN: 03048040) as a Director
9. Appointment of Ernst & Young LLP, Singapore as Branch Auditors
Signed this day of 2017.
Signature of Member Signature of Proxy holder(s)
Note: This form of proxy in order to be effective should be duly completed and deposited at the Registered Office of the Company, not less than 48 hours before the commencement of the Meeting.