31
Point and Click Microbiome Analysis Tools from the BioHPC and BICF

Point and Click Microbiome Analysis
Tools from the BioHPC and BICF

Allows groups to give easy-access to their analysis pipelines via the web
Astrocyte – BioHPC Workflow Platform
Standardized Workflows
Simple Web Forms
Online documentation & results visualization*
Workflows run on HPC cluster without developer or user needing cluster knowledge
Slide contribution: David Trudgian@BioHPC
astrocyte.biohpc.swmed.edu

https://astrocyte.biohpc.swmed.edu/brand/bicf/browse/
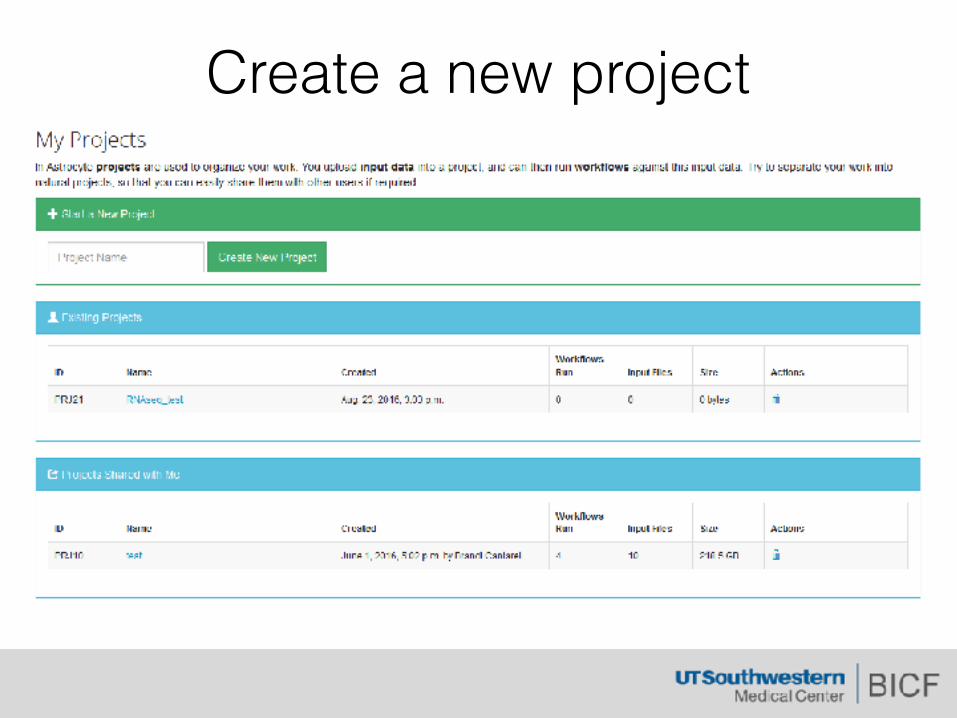
Create a new project

Add data to your project
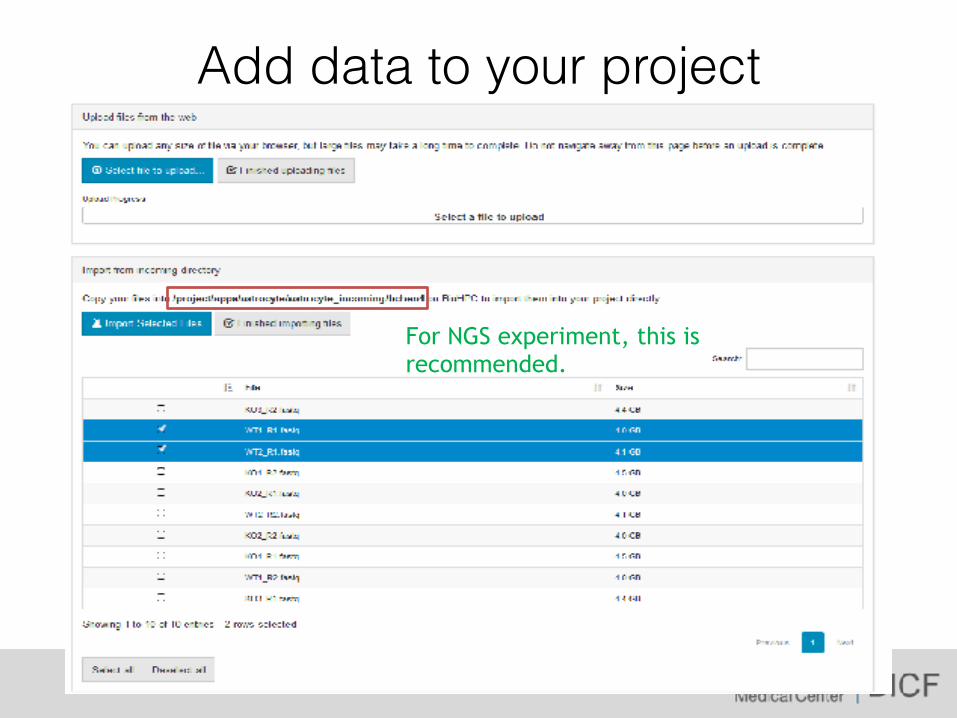
Add data to your project
For NGS experiment, this is recommended.
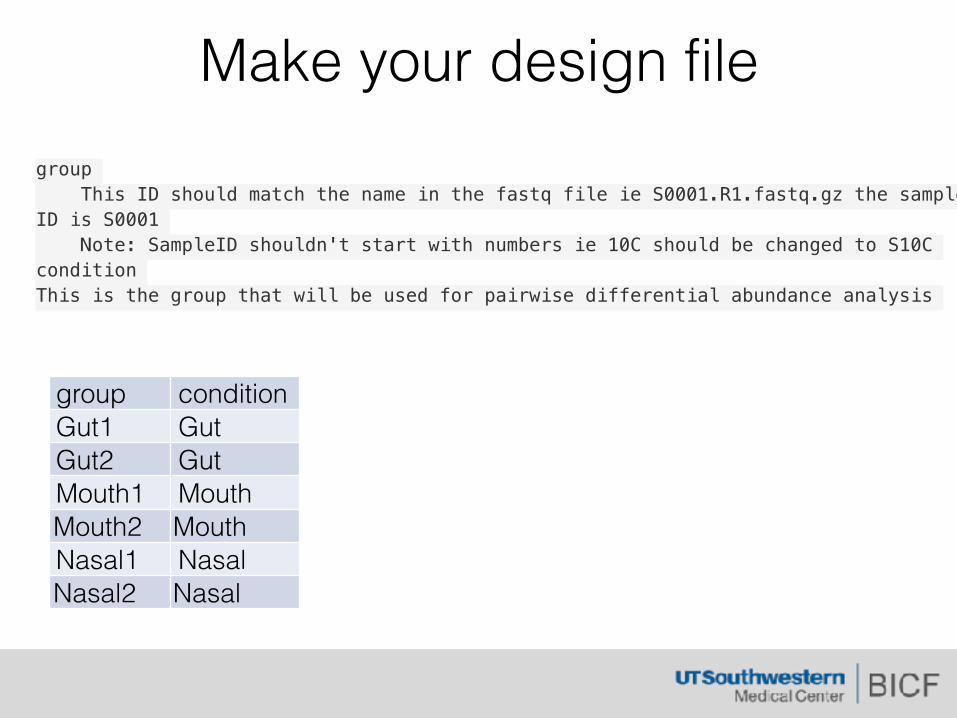
Make your design filegroup This ID should match the name in the fastq file ie S0001.R1.fastq.gz the sample ID is S0001 Note: SampleID shouldn't start with numbers ie 10C should be changed to S10C condition This is the group that will be used for pairwise differential abundance analysis
group conditionGut1 GutGut2 GutMouth1 MouthMouth2 MouthNasal1 NasalNasal2 Nasal

Make your design file• Use tab as delimiter – Excel save as “Text (tab delimited)”
• For all contents, no “-” • For all contents, no spaces • Columns names MUST be exactly the same as
documented
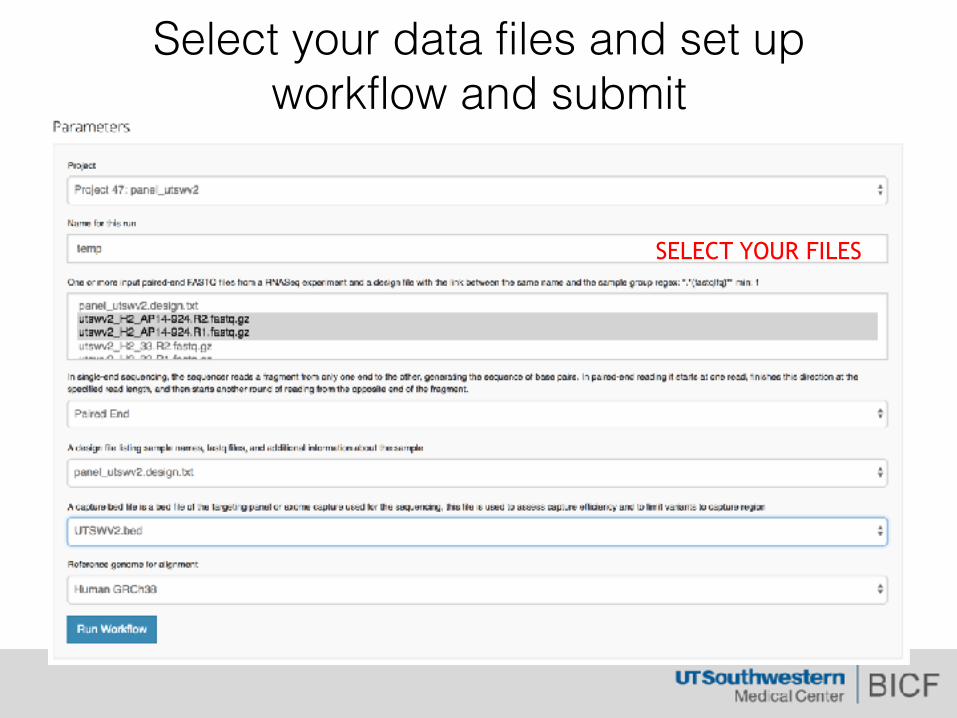
Select your data files and set up workflow and submit
SELECT YOUR FILES
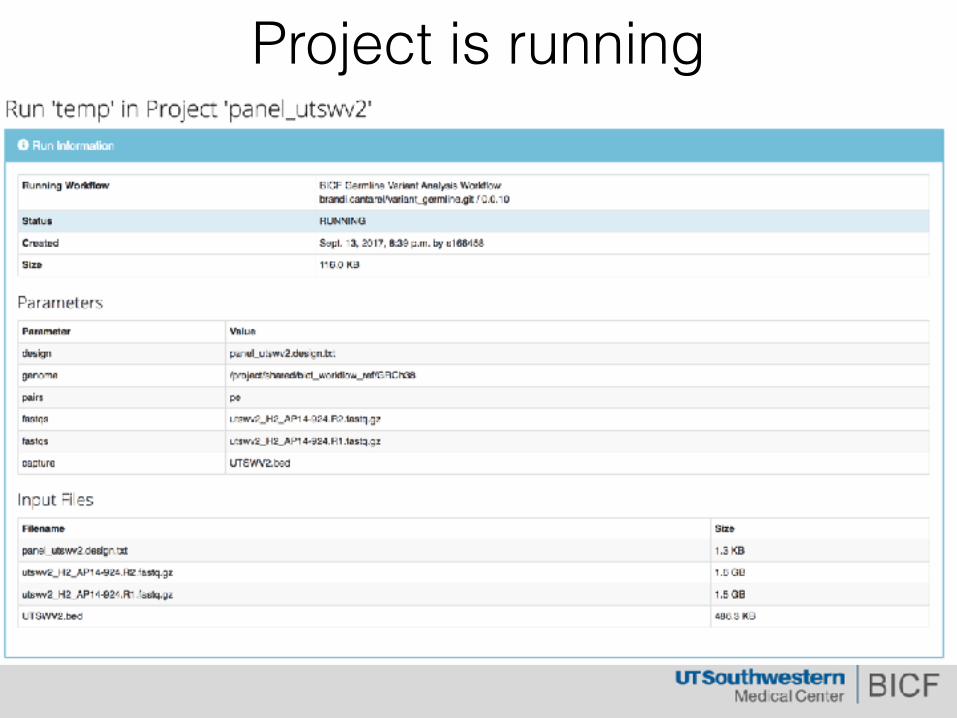
Project is running

Timeline of the whole run
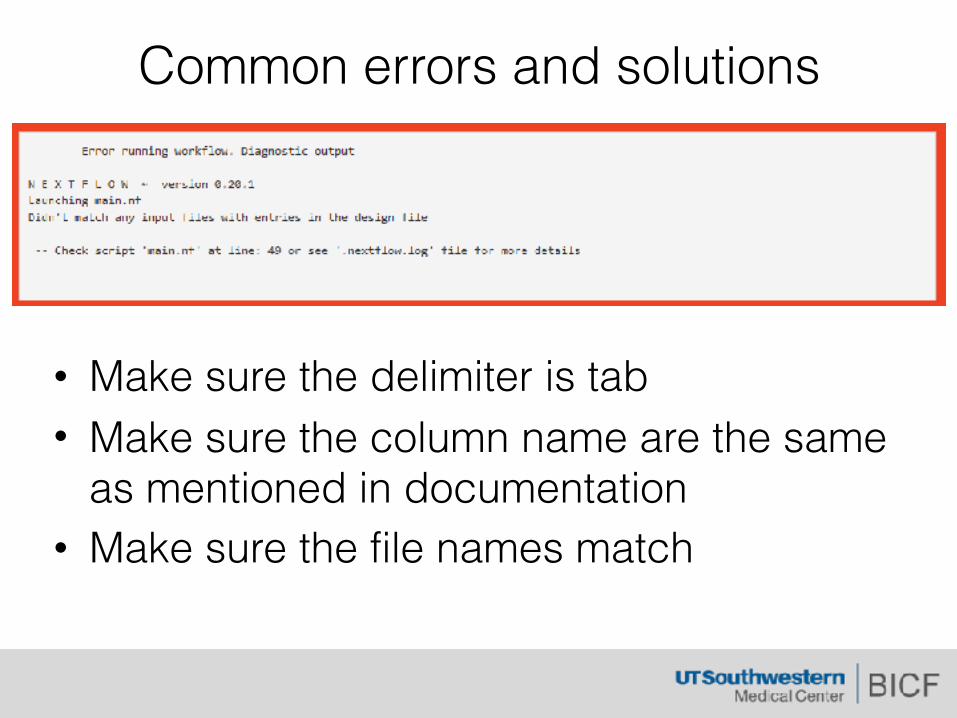
Common errors and solutions
• Make sure the delimiter is tab • Make sure the column name are the same
as mentioned in documentation • Make sure the file names match

Common errors and solutions
• Not all files are uploaded
• It’s about the proxy setting
• Use auto-detect proxy

Marker Genes Allow For Taxonomic Profiling

Marker Genes Allow For Taxonomic Profiling
• Should be present in all prokaryotic organisms compared
• Vertically and slowly evolving • Amplify-able with small set of “universal
primers” • Has an established database of reference
sequences
rRNAs as phylogenetic markers• Ribosomal RNAs are present in all living organisms
– 16S present in all prokaryotes – 18S present in all eukaryotes
• rRNAs are vertically and slowly evolving – Play a critical role in protein translation – rRNAs are relatively conserved and rarely acquired
horizontally – rRNAs are amplify-able with small set of “universal
primers” • rRNAs has an established reference database
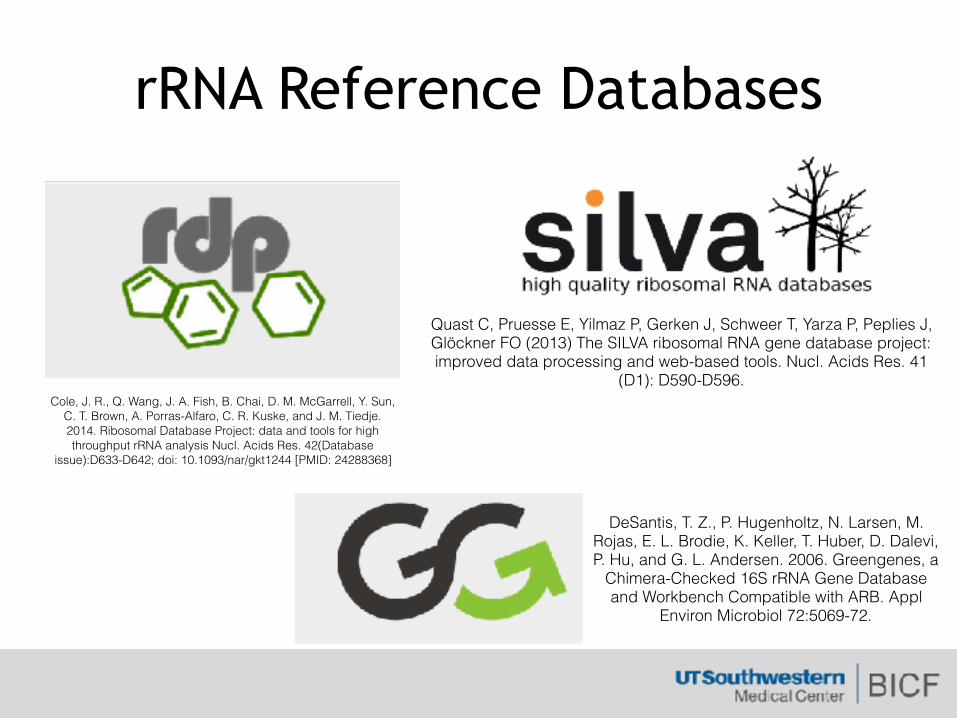
rRNA Reference Databases
Cole, J. R., Q. Wang, J. A. Fish, B. Chai, D. M. McGarrell, Y. Sun, C. T. Brown, A. Porras-Alfaro, C. R. Kuske, and J. M. Tiedje. 2014. Ribosomal Database Project: data and tools for high throughput rRNA analysis Nucl. Acids Res. 42(Database
issue):D633-D642; doi: 10.1093/nar/gkt1244 [PMID: 24288368]
Quast C, Pruesse E, Yilmaz P, Gerken J, Schweer T, Yarza P, Peplies J, Glöckner FO (2013) The SILVA ribosomal RNA gene database project: improved data processing and web-based tools. Nucl. Acids Res. 41
(D1): D590-D596.
DeSantis, T. Z., P. Hugenholtz, N. Larsen, M. Rojas, E. L. Brodie, K. Keller, T. Huber, D. Dalevi, P. Hu, and G. L. Andersen. 2006. Greengenes, a
Chimera-Checked 16S rRNA Gene Database and Workbench Compatible with ARB. Appl
Environ Microbiol 72:5069-72.
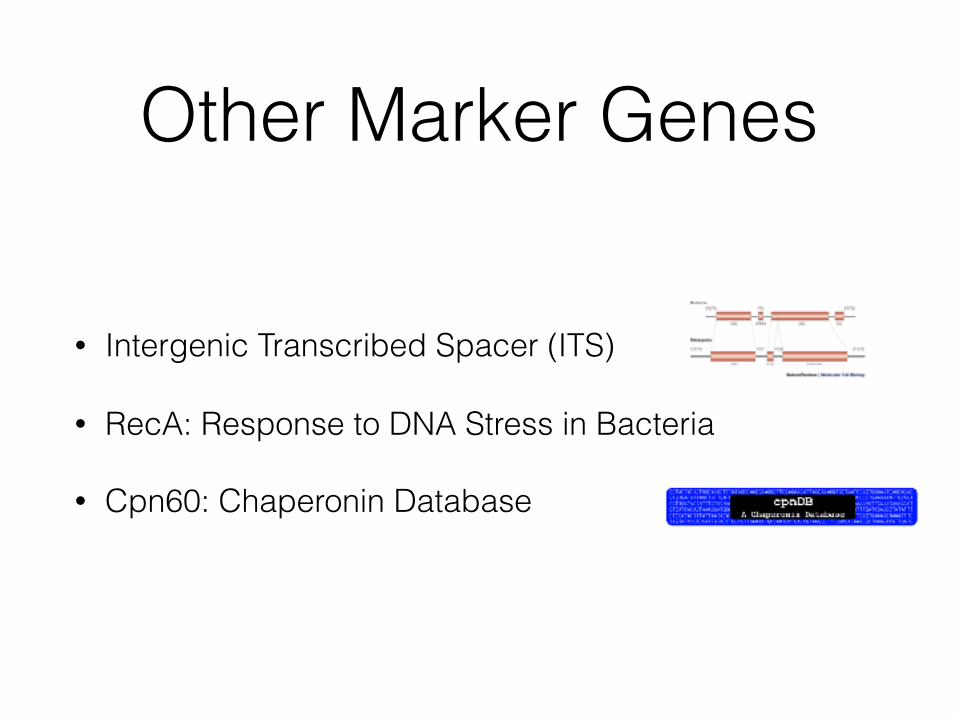
Other Marker Genes
• Intergenic Transcribed Spacer (ITS)
• RecA: Response to DNA Stress in Bacteria
• Cpn60: Chaperonin Database
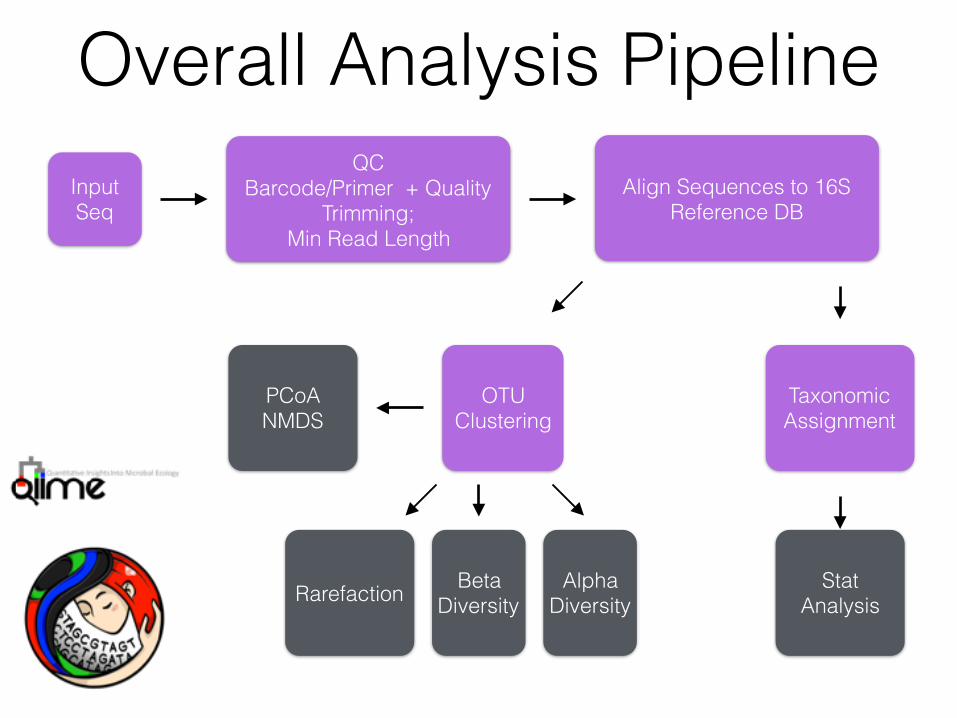
Overall Analysis PipelineInput Seq
QC Barcode/Primer + Quality
Trimming; Min Read Length
Align Sequences to 16S Reference DB
Taxonomic Assignment
OTU Clustering
Alpha Diversity
Beta DiversityRarefaction
PCoA NMDS
Stat Analysis
Alpha Diversity
• Species richness is a survey of the number of distinct organism in a community
• Rarefaction is a method to assess species richness • Species evenness measures how equal the
community ie 2 taxa each at 50% abundance vs 9 to 1 ratio.
• Alpha diversity is a measurement composed of richness and evenness.
Beta-Diversity
• Beta-diversity measures including absolute or relative overlap describe how many taxa are shared between habitats
• Beta diversity acts like a similarity score between populations, allowing analysis by sample clustering or, again, by dimensionality reductions such as PCA
• Beta diversity can be measured by simple taxa overlap such as Bray-Curtis dissimilarity
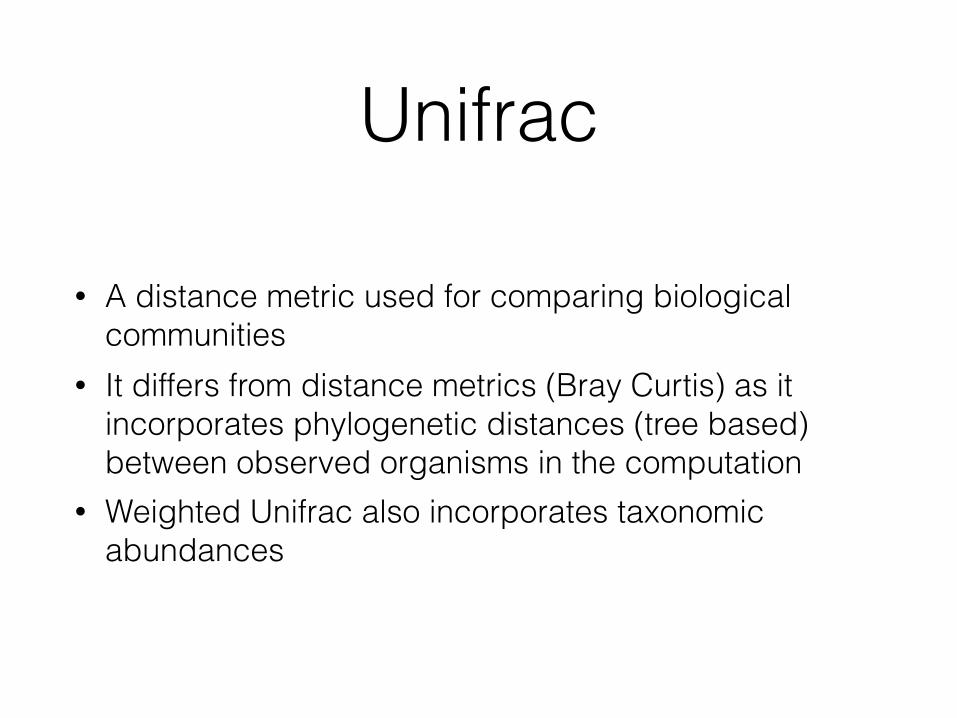
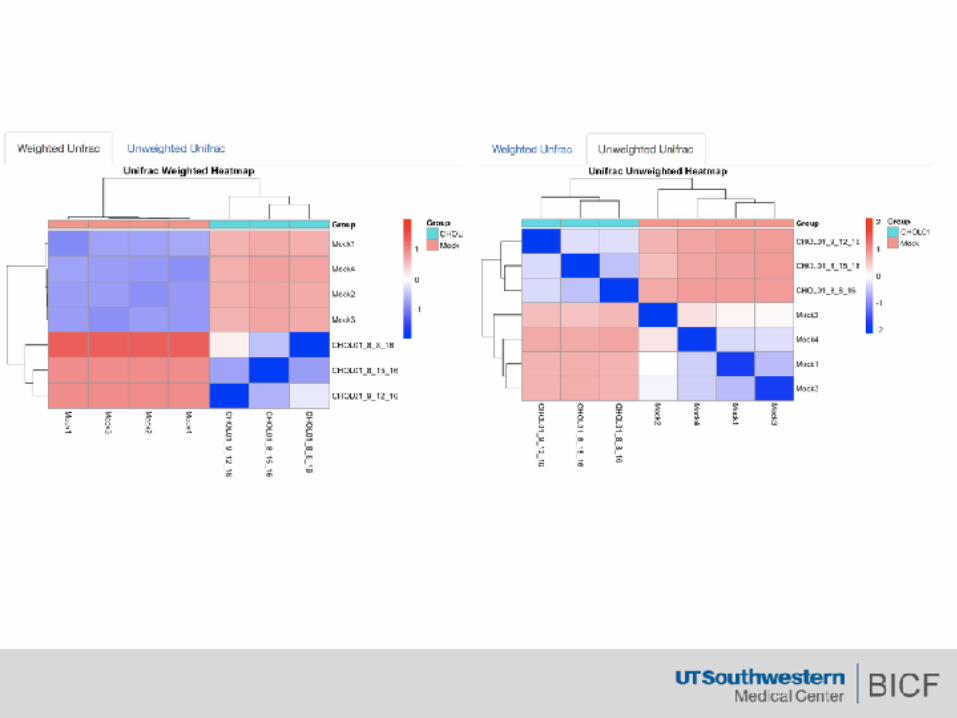
Unifrac
• A distance metric used for comparing biological communities
• It differs from distance metrics (Bray Curtis) as it incorporates phylogenetic distances (tree based) between observed organisms in the computation
• Weighted Unifrac also incorporates taxonomic abundances

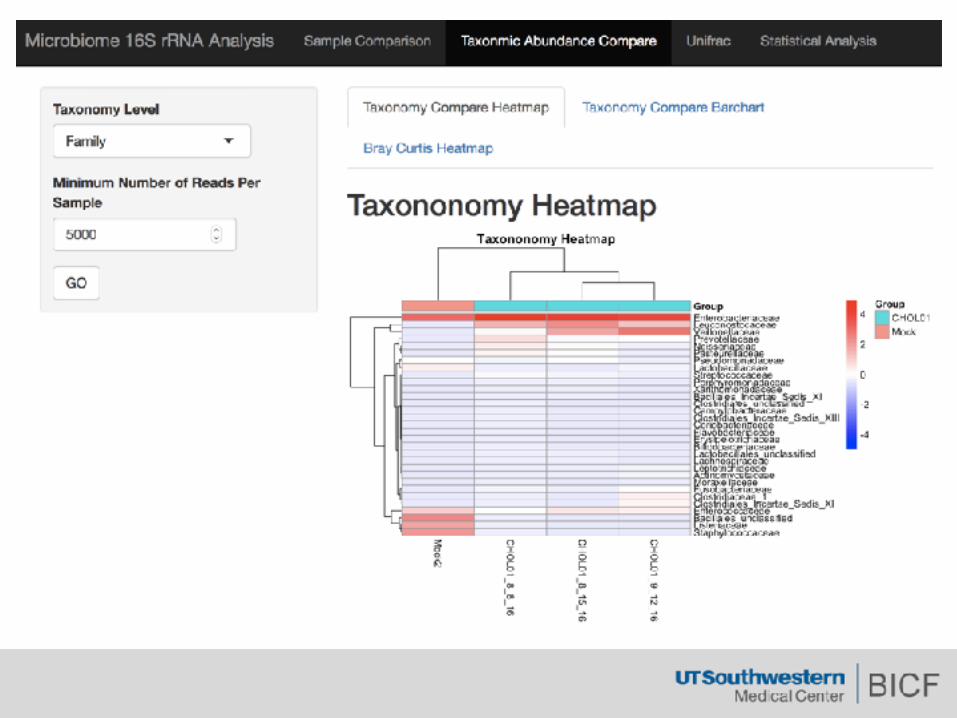
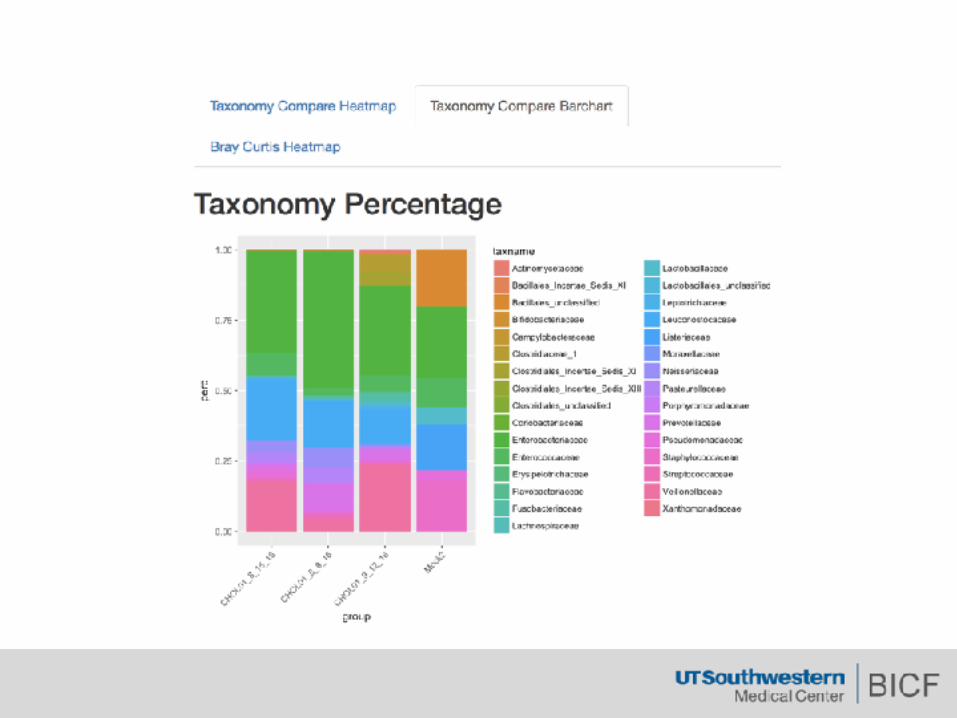
Sample Comparison based on OTU Composition
PCoA

Astrocyte Workflow• Uses Mothur’s MiSeq SOP • https://www.mothur.org/wiki/MiSeq_SOP
• Reference Database and Taxonomy • Silva • GreenGenes
• Allows users to visualize results (VizApp)


Alpha Diversity
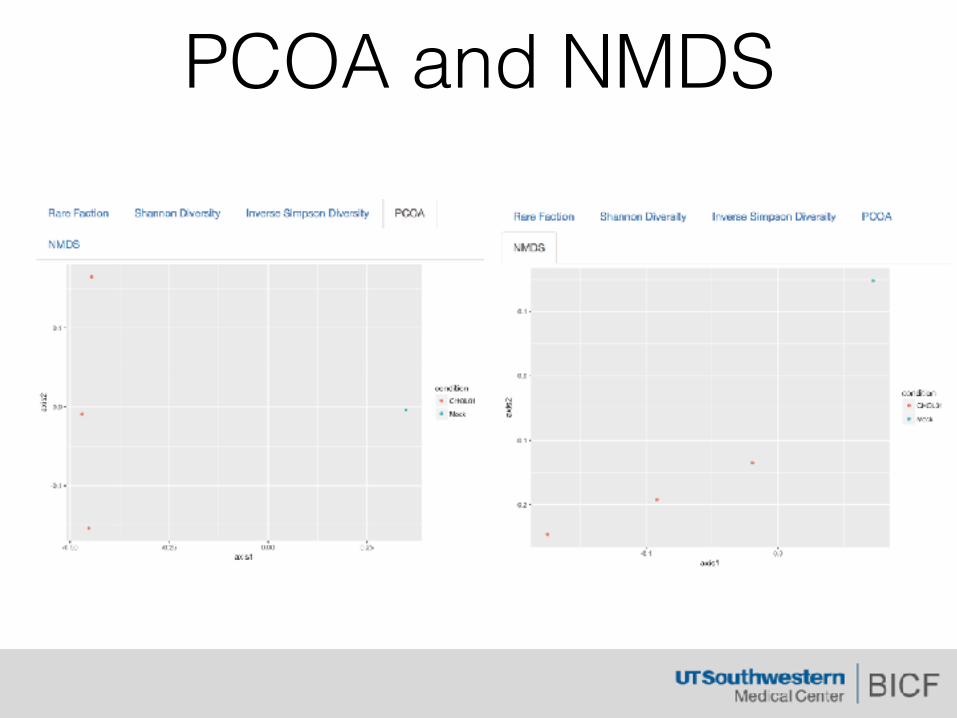
PCOA and NMDS


![Introduction to BioHPC · 1 Updated for 2016-09-07 [web] portal.biohpc.swmed.edu [email] biohpc-help@utsouthwestern.edu. ... is the use of parallel processing for running advanced](https://static.documents.pub/doc/80x56/6012d6fc5ce75843063eaf6b/introduction-to-biohpc-1-updated-for-2016-09-07-web-email-biohpc-helputsouthwesternedu.jpg)


![Using Docker in BioHPC Cloud Docker in BioHPC Cloud v2.0... · docker.io/biohpc/cowsay latest 195f168235c9 3 years ago 337 MB [jarekp@cbsum1c1b009 ~]$ docker.io/ part may be omitted,](https://static.documents.pub/doc/80x56/5f1b489f8d90ff5a4173bd77/using-docker-in-biohpc-cloud-docker-in-biohpc-cloud-v20-dockeriobiohpccowsay.jpg)
![Parallel Programming in MATLAB on BioHPC › media › filer_public › 8d › d7 › ... · 2019-06-27 · Parallel Programming in MATLAB on BioHPC 1 [web] portal.biohpc.swmed.edu](https://static.documents.pub/doc/80x56/5f0b875a7e708231d430f6ad/parallel-programming-in-matlab-on-biohpc-a-media-a-filerpublic-a-8d-a-d7.jpg)


![Keeping Big Projects Under Control - BioHPC Portal Home · Keeping Big Projects Under Control 1 Updated for 2017-02-15 [web] portal.biohpc.swmed.edu [email] biohpc-help@utsouthwestern.edu.](https://static.documents.pub/doc/80x56/5ec7e5f79b761d7a4112a936/keeping-big-projects-under-control-biohpc-portal-home-keeping-big-projects-under.jpg)


![The Linux Command Line & Shell Scripting - BioHPC … Linux Command Line & Shell Scripting 1 Updated for 2016-04-13 [web] portal.biohpc.swmed.edu [email] biohpc-help@utsouthwestern.edu](https://static.documents.pub/doc/80x56/5aaab9877f8b9a95188e7013/the-linux-command-line-shell-scripting-biohpc-linux-command-line-shell-scripting.jpg)


