82
Point and Click SAS: Getting Started with SAS ™ Enterprise Guide™ 4.1 Raymond R. Balise, PhD Stanford University Department of Health Research and Policy
| Date post: | 20-Dec-2015 |
| Category: |
Documents |
| View: | 220 times |
| Download: | 0 times |
Point and Click SAS:Getting Started with SAS ™
Enterprise Guide™ 4.1Raymond R. Balise, PhD
Stanford University
Department of Health Research and Policy
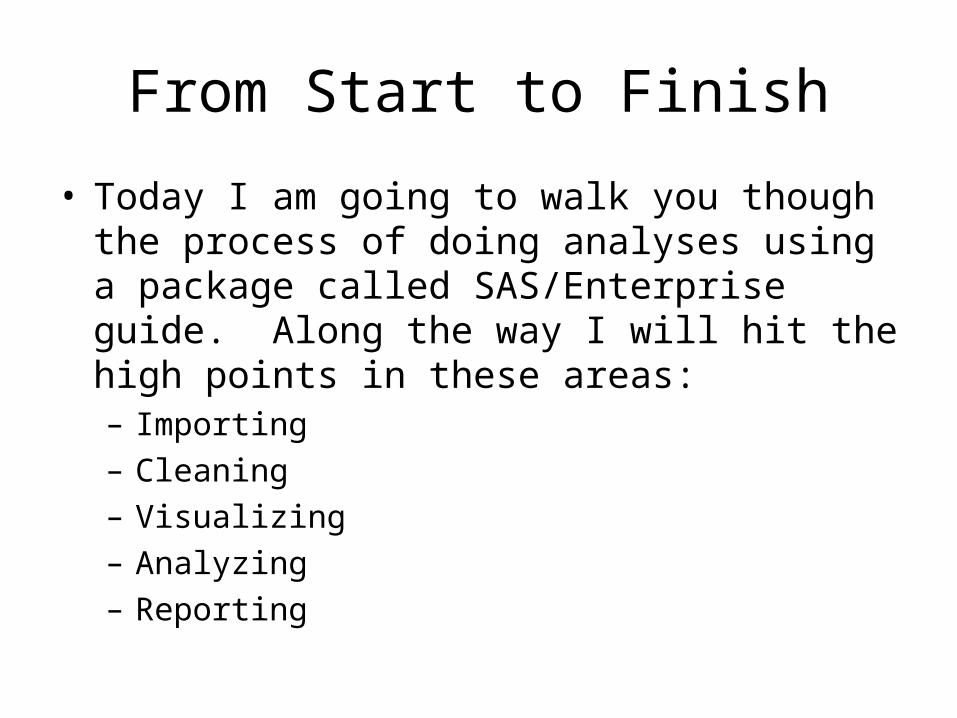
From Start to Finish
• Today I am going to walk you though the process of doing analyses using a package called SAS/Enterprise guide. Along the way I will hit the high points in these areas:– Importing– Cleaning– Visualizing– Analyzing– Reporting
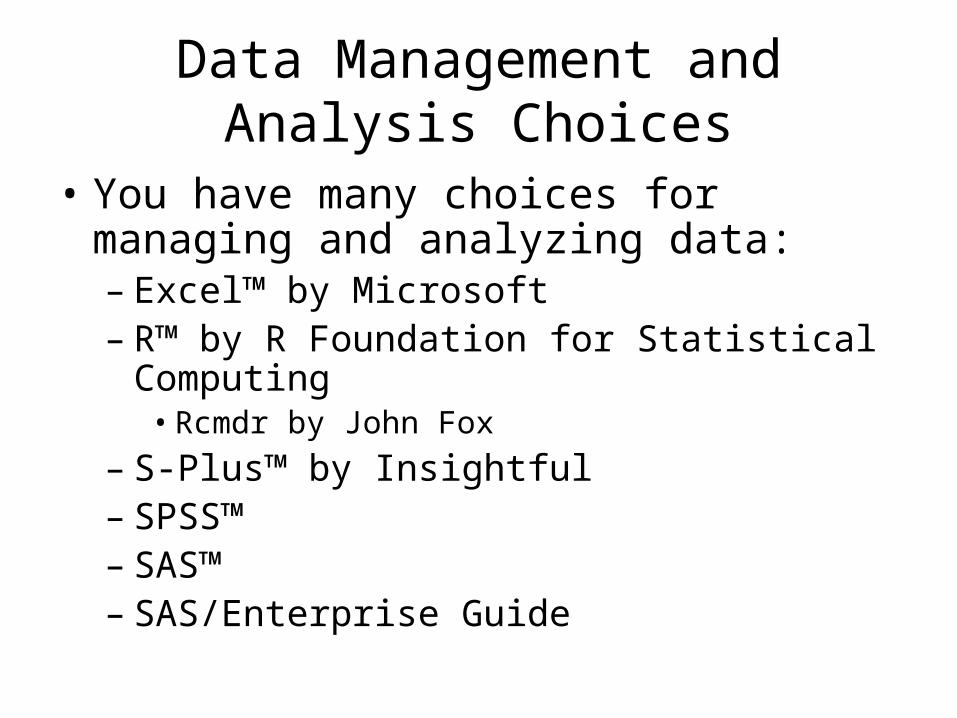
Data Management and Analysis Choices
• You have many choices for managing and analyzing data:– Excel™ by Microsoft– R™ by R Foundation for Statistical Computing
• Rcmdr by John Fox
– S-Plus™ by Insightful – SPSS™– SAS™– SAS/Enterprise Guide
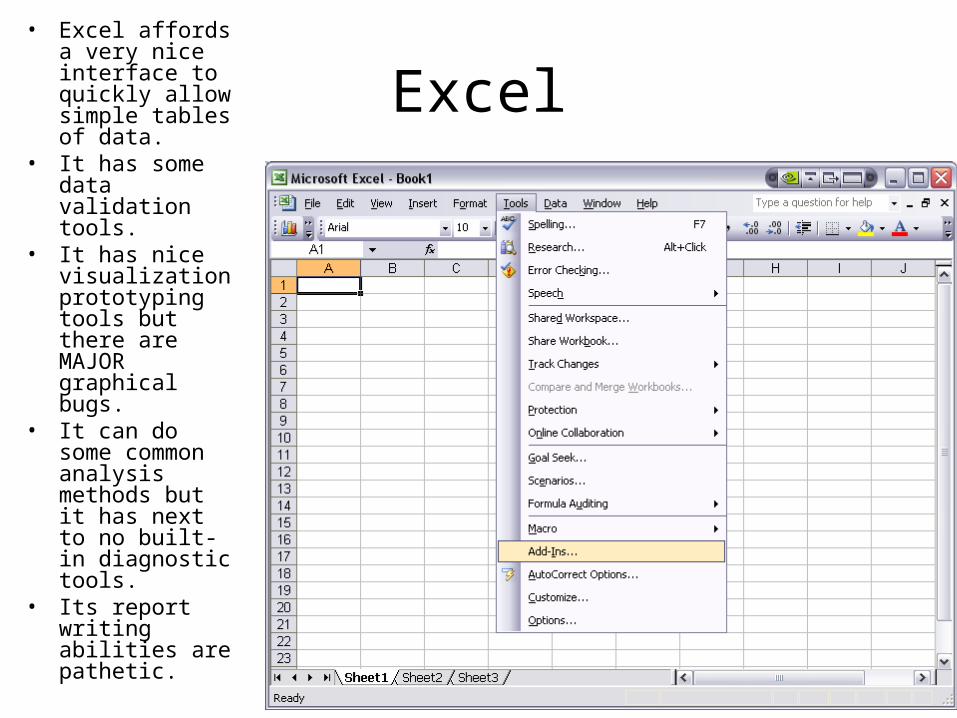
Excel• Excel affords a
very nice interface to quickly allow simple tables of data.
• It has some data validation tools.
• It has nice visualization prototyping tools but there are MAJOR graphical bugs.
• It can do some common analysis methods but it has next to no built-in diagnostic tools.
• Its report writing abilities are pathetic.
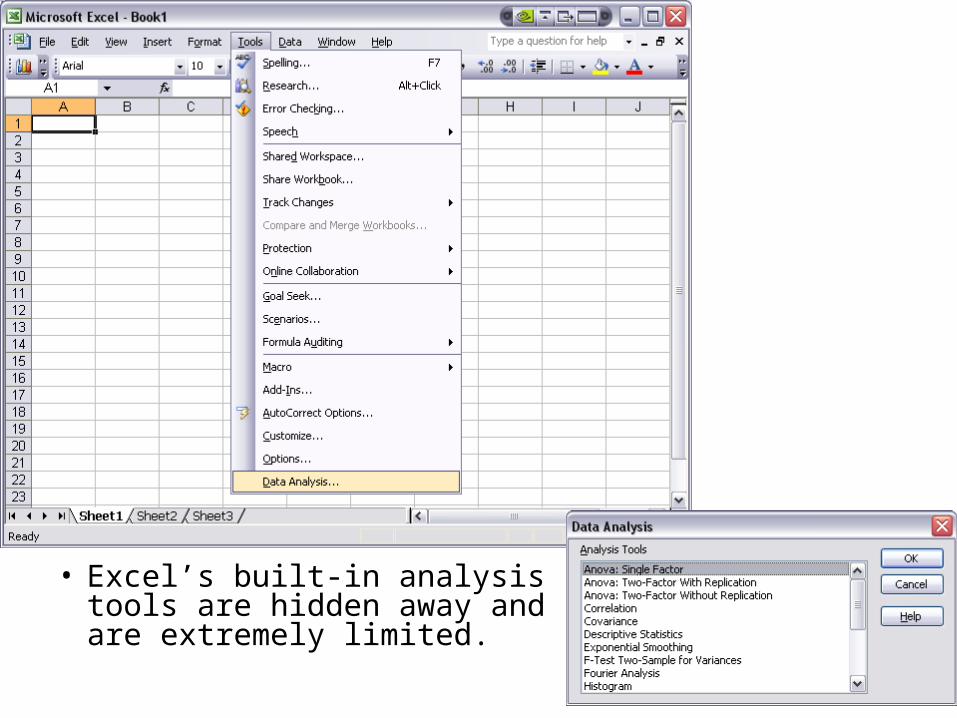
• Excel’s built-in analysis tools are hidden away and are extremely limited.
R
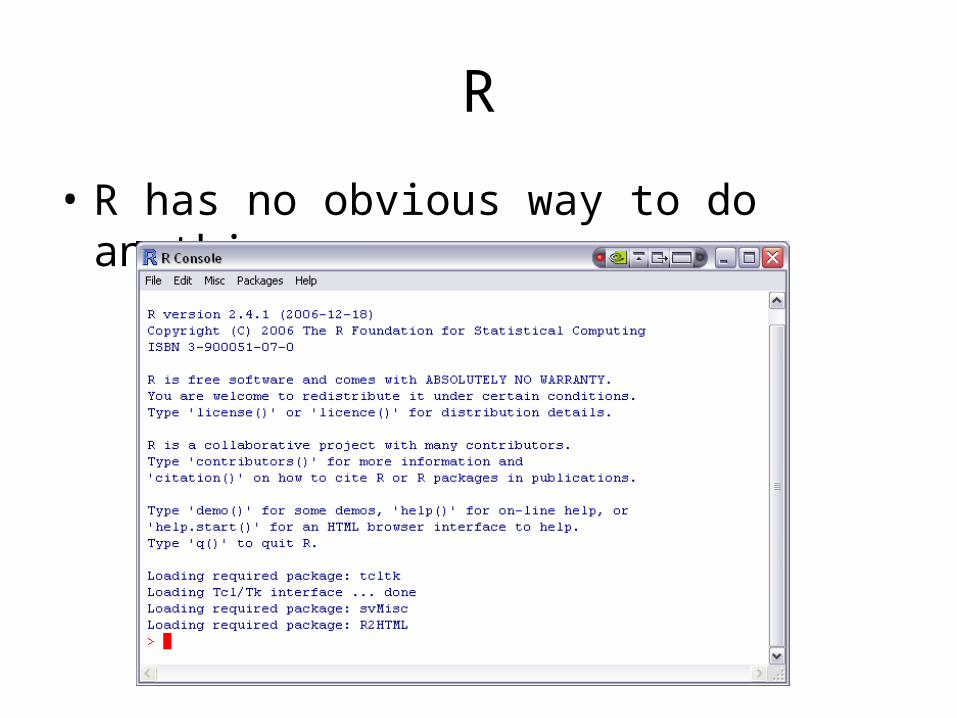
• R has no obvious way to do anything.
R with Rcmdr
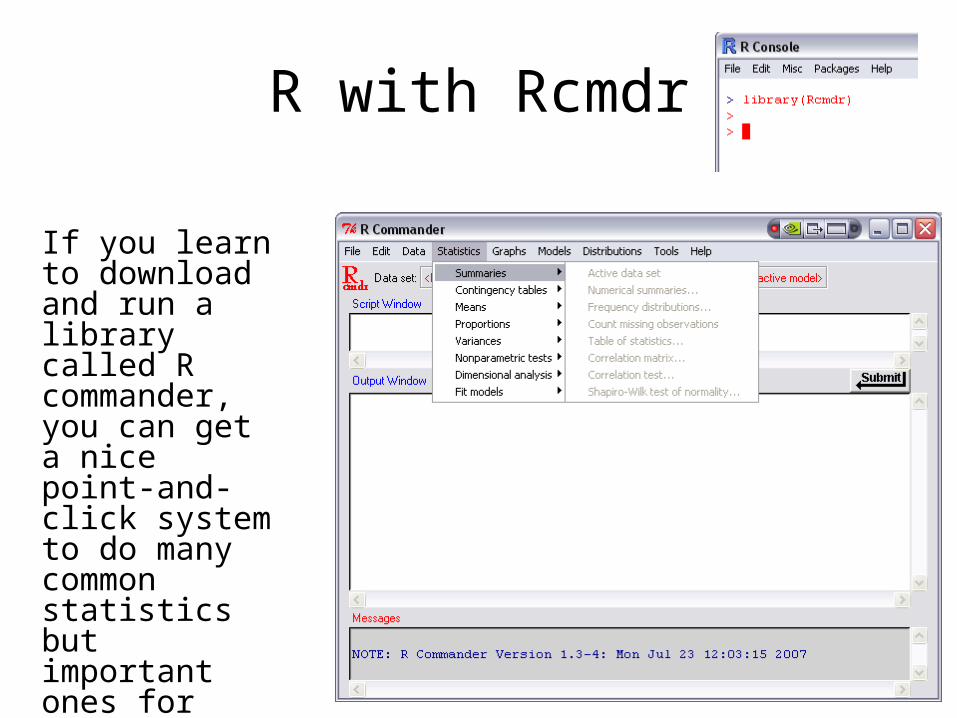
If you learn to download and run a library called R commander, you can get a nice point-and-click system to do many common statistics but important ones for medicine (like survival analysis) are missing.
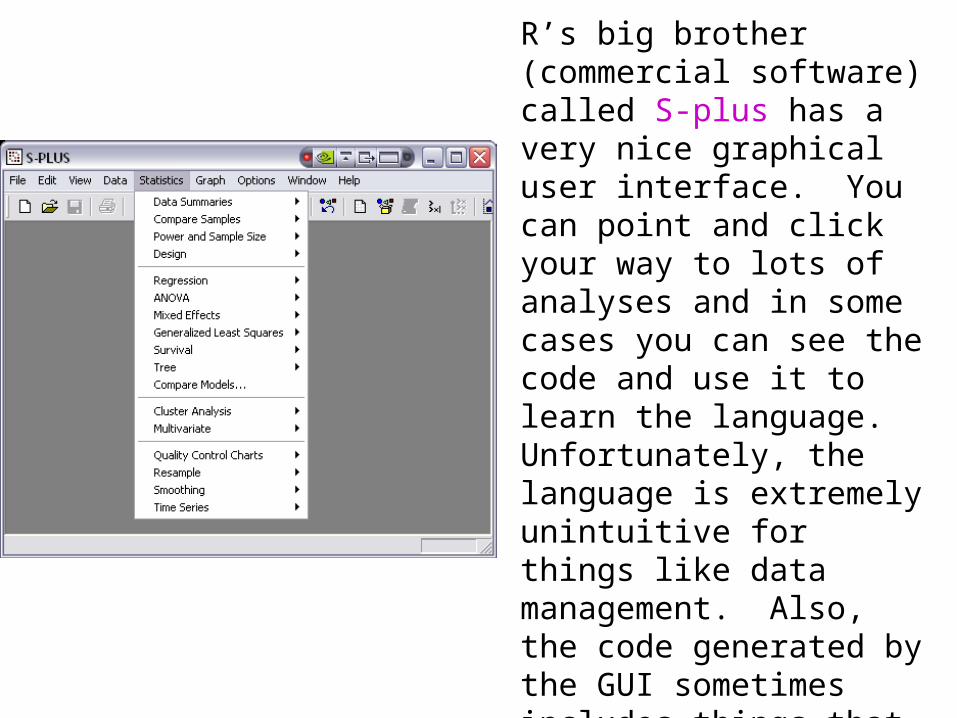
R’s big brother (commercial software) called S-plus has a very nice graphical user interface. You can point and click your way to lots of analyses and in some cases you can see the code and use it to learn the language. Unfortunately, the language is extremely unintuitive for things like data management. Also, the code generated by the GUI sometimes includes things that amount to “you clicked on a menu to do the task.”
SPSS
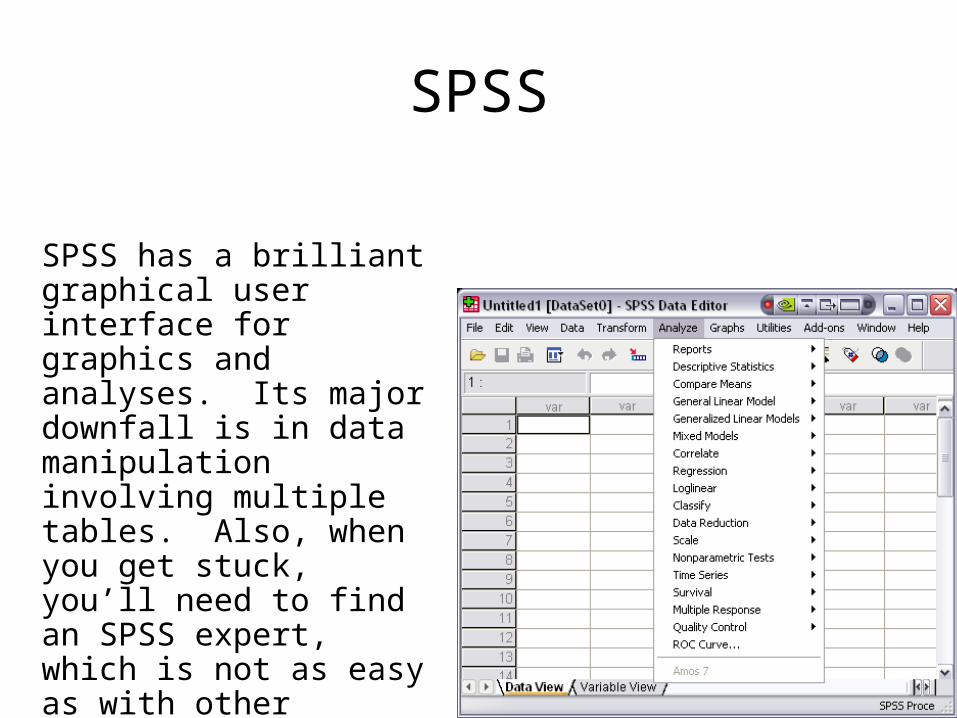
SPSS has a brilliant graphical user interface for graphics and analyses. Its major downfall is in data manipulation involving multiple tables. Also, when you get stuck, you’ll need to find an SPSS expert, which is not as easy as with other packages (within the medical school).
SAS
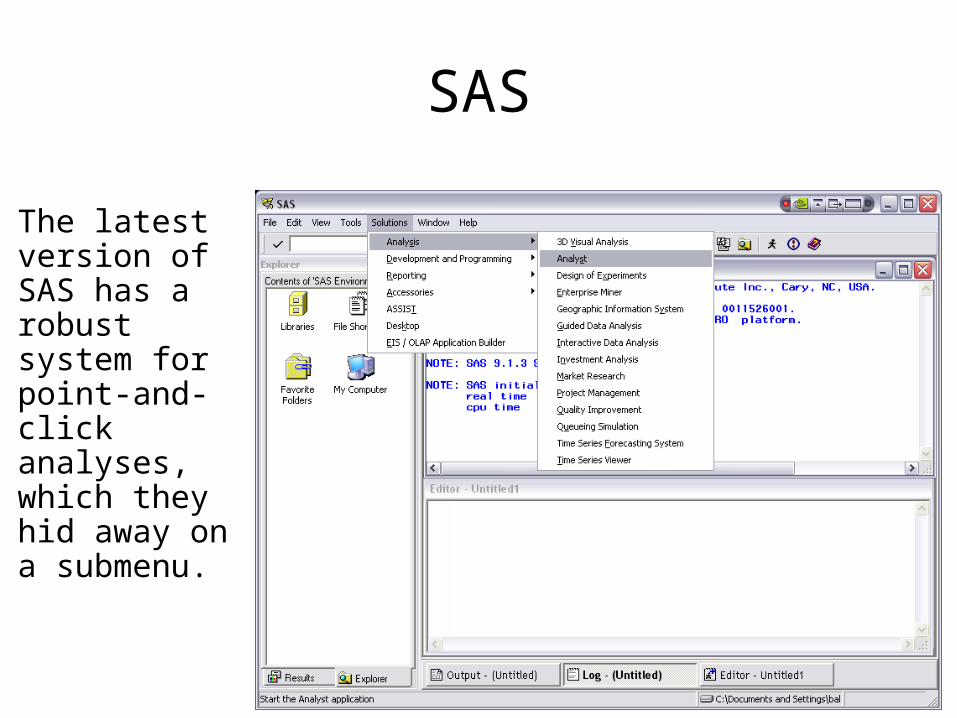
The latest version of SAS has a robust system for point-and-click analyses, which they hid away on a submenu.
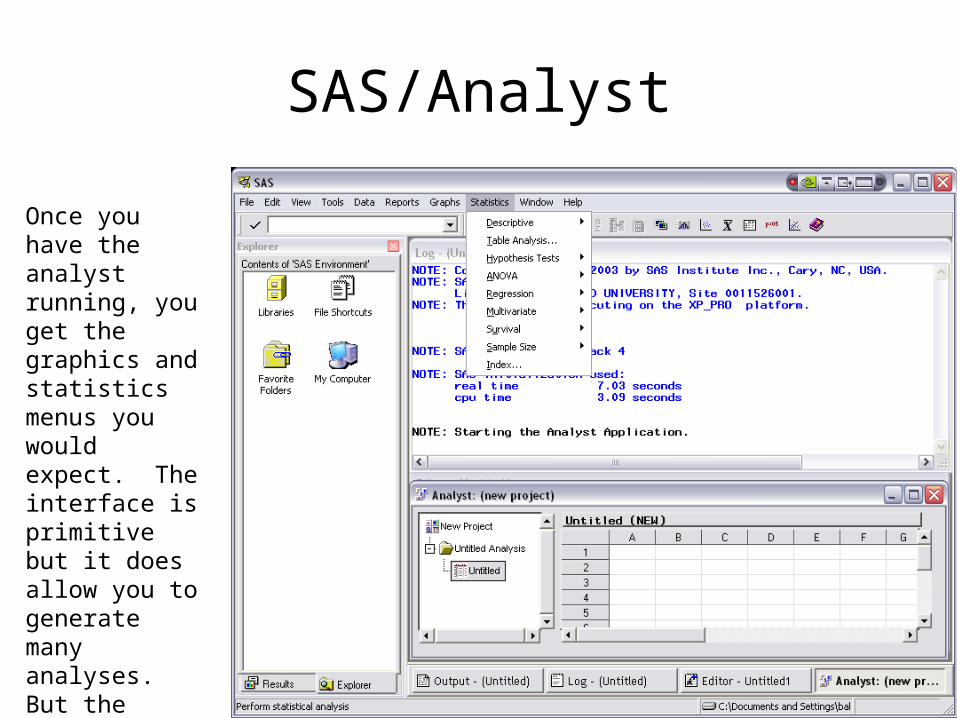
Once you have the analyst running, you get the graphics and statistics menus you would expect. The interface is primitive but it does allow you to generate many analyses. But the format of the output (especially the graphics) is substandard.
SAS/Analyst

SAS/Enterprise Guide
SAS/Enterprise Guide
• Getting EG– If you have a SAS 9.1.3 license though Stanford, you
can Get EG for free by contacting software licensing software.stanford.edu
• Using EG– Project explorer shows a “tree” view of the different
things in the project. – Project Designer shows flowcharts of the tasks you
have done.– Task List gives you hyperlinks to common tasks like
analyses and graphics.– Task Status shows what EG is working on.– Notice the pushpins. A “pushed in” pin keeps the
window displayed. A sideways pin says the window can retract to the edge of the screen.
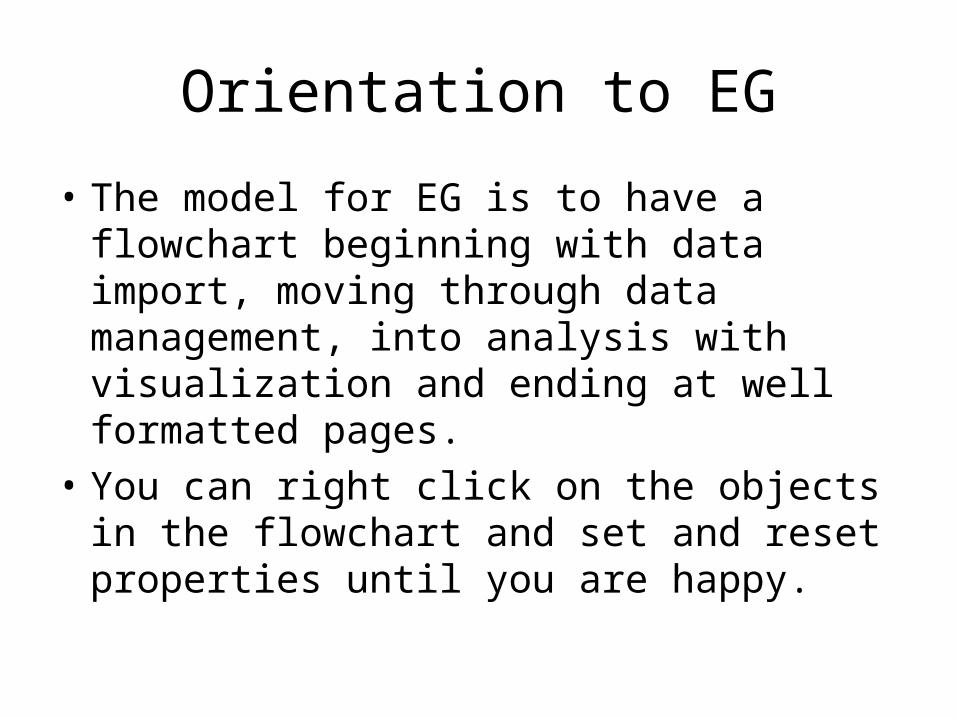
Orientation to EG
• The model for EG is to have a flowchart beginning with data import, moving through data management, into analysis with visualization and ending at well formatted pages.
• You can right click on the objects in the flowchart and set and reset properties until you are happy.
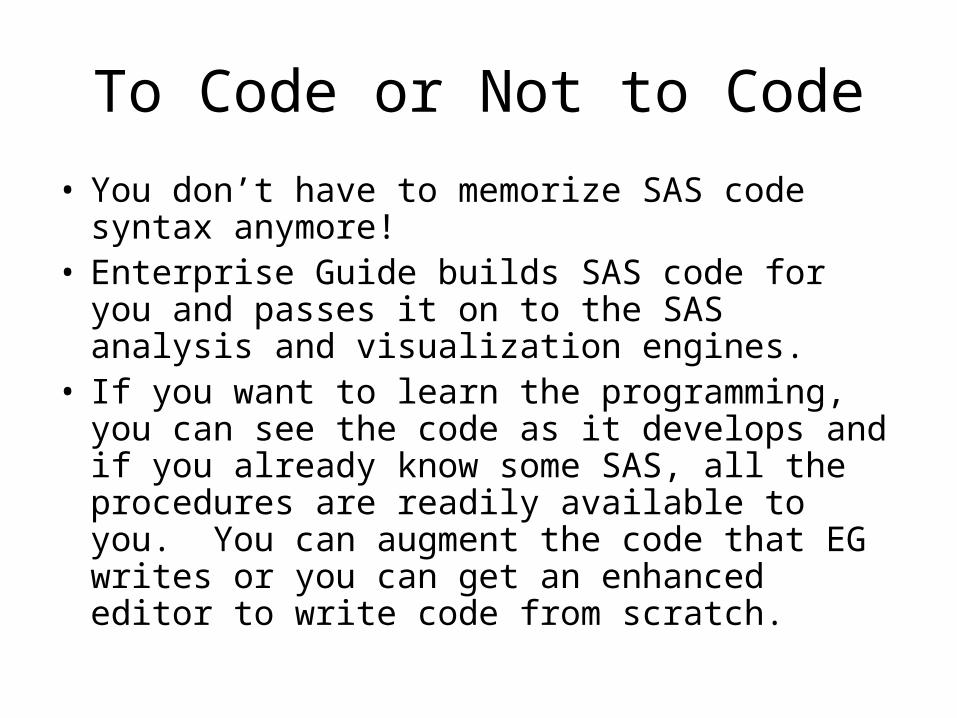
To Code or Not to Code
• You don’t have to memorize SAS code syntax anymore!
• Enterprise Guide builds SAS code for you and passes it on to the SAS analysis and visualization engines.
• If you want to learn the programming, you can see the code as it develops and if you already know some SAS, all the procedures are readily available to you. You can augment the code that EG writes or you can get an enhanced editor to write code from scratch.
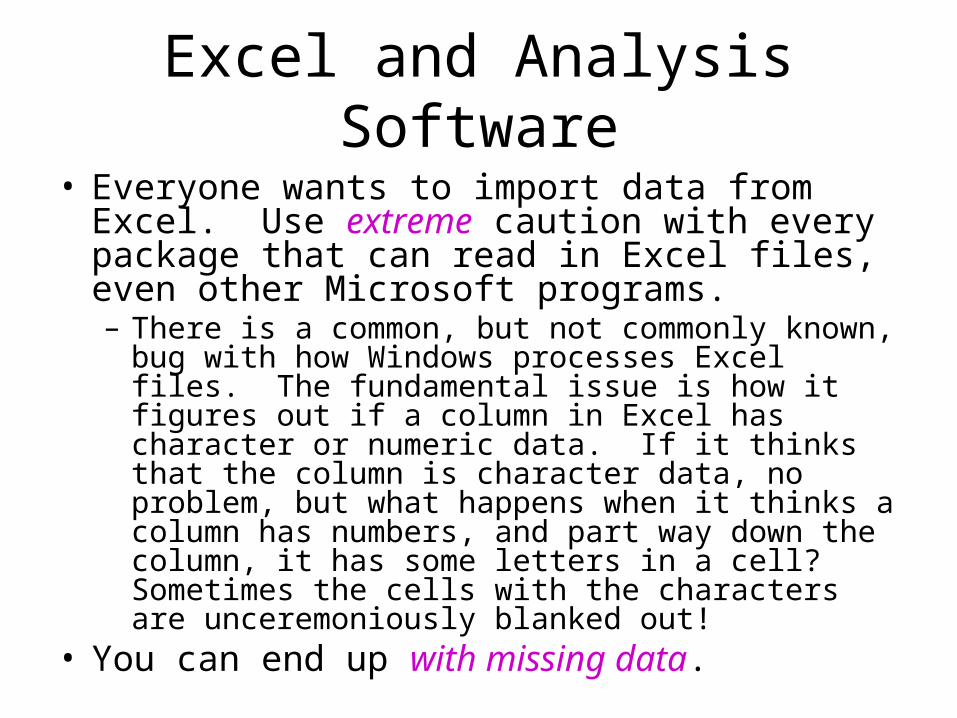
Excel and Analysis Software
• Everyone wants to import data from Excel. Use extreme caution with every package that can read in Excel files, even other Microsoft programs.– There is a common, but not commonly known, bug
with how Windows processes Excel files. The fundamental issue is how it figures out if a column in Excel has character or numeric data. If it thinks that the column is character data, no problem, but what happens when it thinks a column has numbers, and part way down the column, it has some letters in a cell? Sometimes the cells with the characters are unceremoniously blanked out!
• You can end up with missing data.
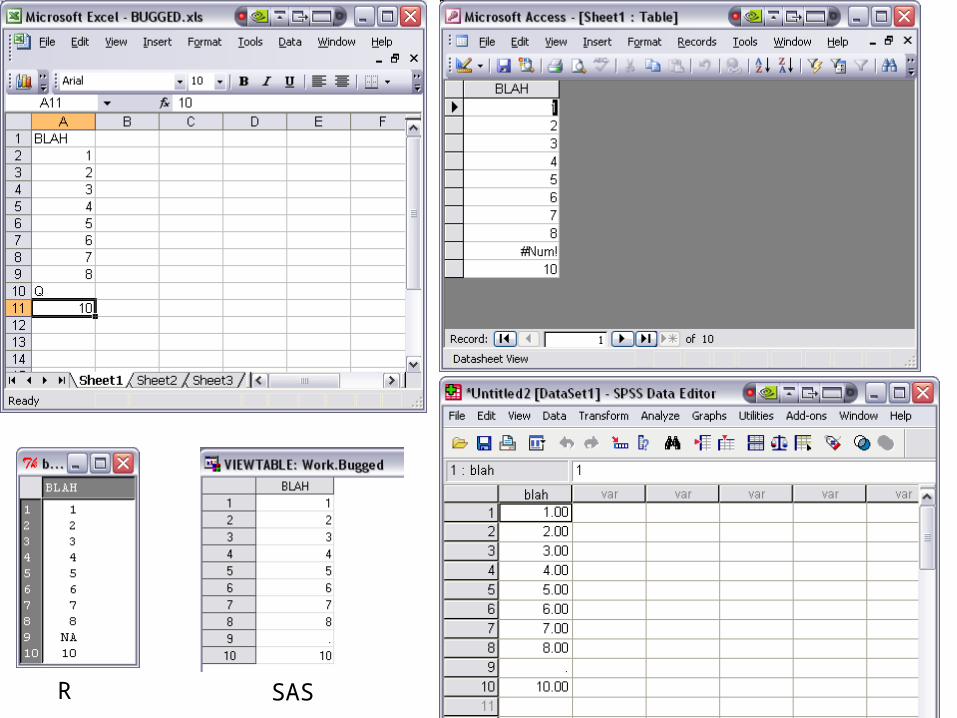
SASR
The Registry
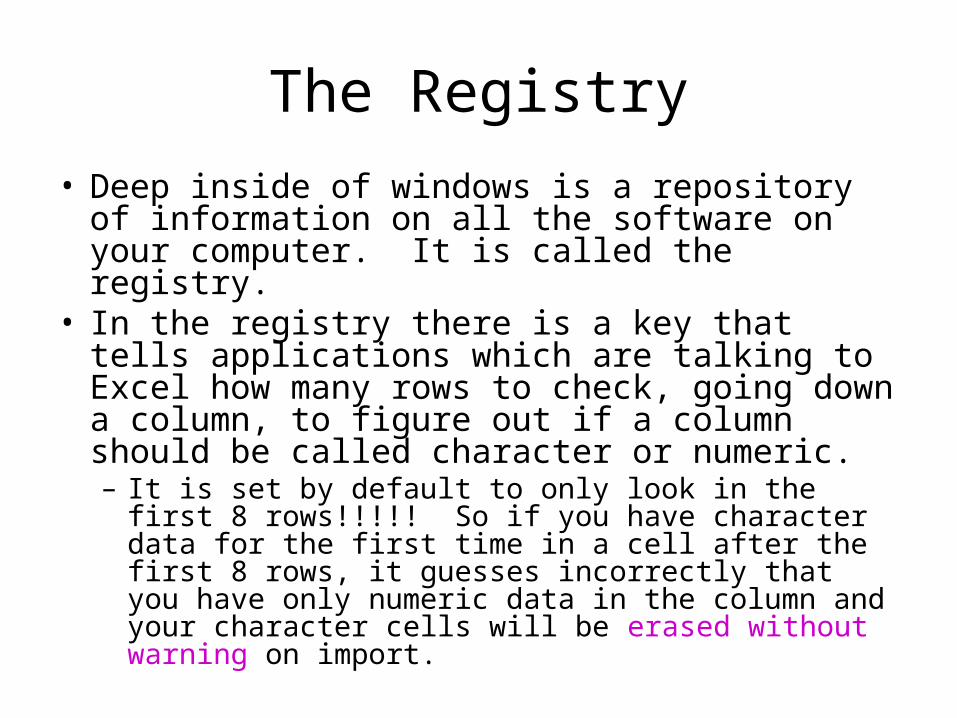
• Deep inside of windows is a repository of information on all the software on your computer. It is called the registry.
• In the registry there is a key that tells applications which are talking to Excel how many rows to check, going down a column, to figure out if a column should be called character or numeric. – It is set by default to only look in the first 8 rows!!!!!
So if you have character data for the first time in a cell after the first 8 rows, it guesses incorrectly that you have only numeric data in the column and your character cells will be erased without warning on import.
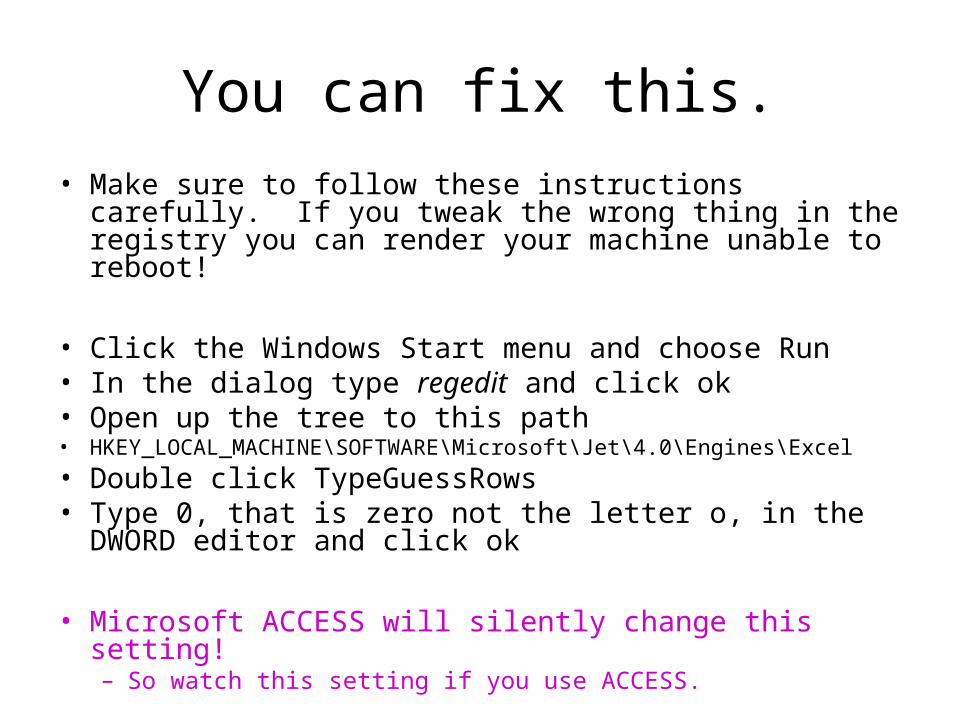
You can fix this.
• Make sure to follow these instructions carefully. If you tweak the wrong thing in the registry you can render your machine unable to reboot!
• Click the Windows Start menu and choose Run• In the dialog type regedit and click ok• Open up the tree to this path• HKEY_LOCAL_MACHINE\SOFTWARE\Microsoft\Jet\4.0\Engines\Excel
• Double click TypeGuessRows• Type 0, that is zero not the letter o, in the DWORD editor
and click ok
• Microsoft ACCESS will silently change this setting!– So watch this setting if you use ACCESS.
After the Tweak…Back to EG
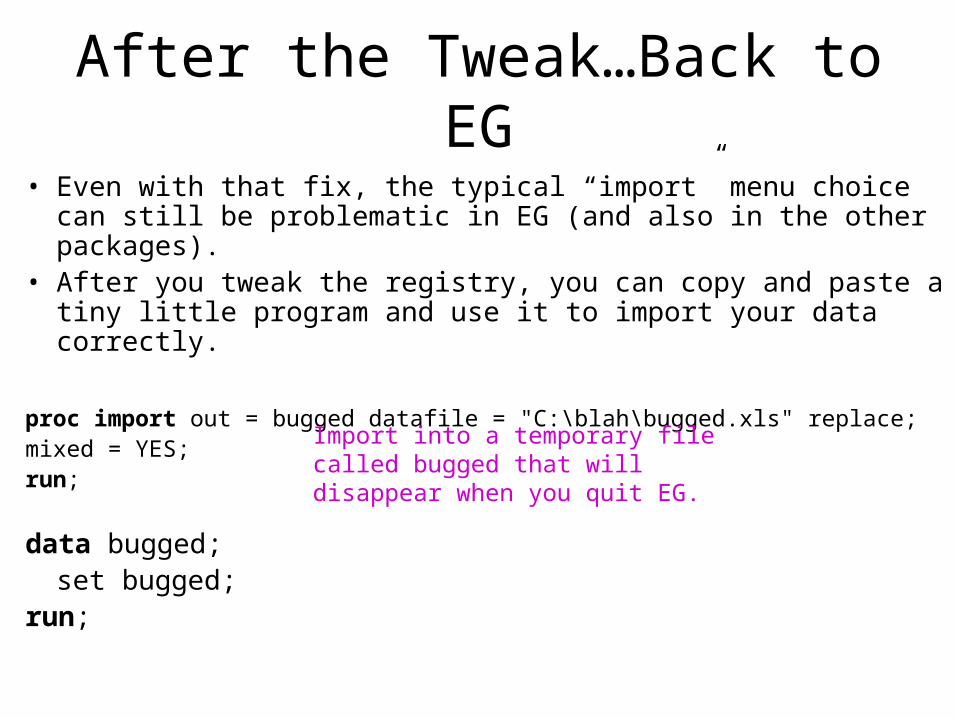
• Even with that fix, the typical “import” menu choice can still be problematic in EG (and also in the other packages).
• After you tweak the registry, you can copy and paste a tiny little program and use it to import your data correctly.
proc import out = bugged datafile = "C:\blah\bugged.xls" replace;mixed = YES;run;
data bugged;set bugged;
run;
Import into a temporary file called bugged that will disappear when you quit EG.
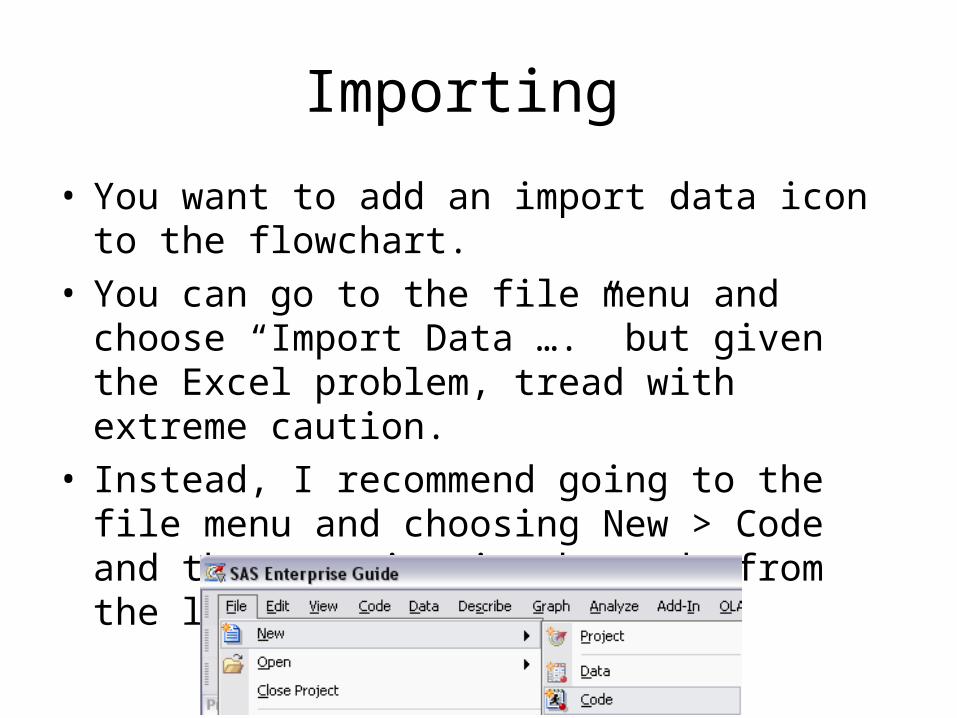
Importing
• You want to add an import data icon to the flowchart.
• You can go to the file menu and choose “Import Data ….” but given the Excel problem, tread with extreme caution.
• Instead, I recommend going to the file menu and choosing New > Code and then pasting in the code from the last slide:
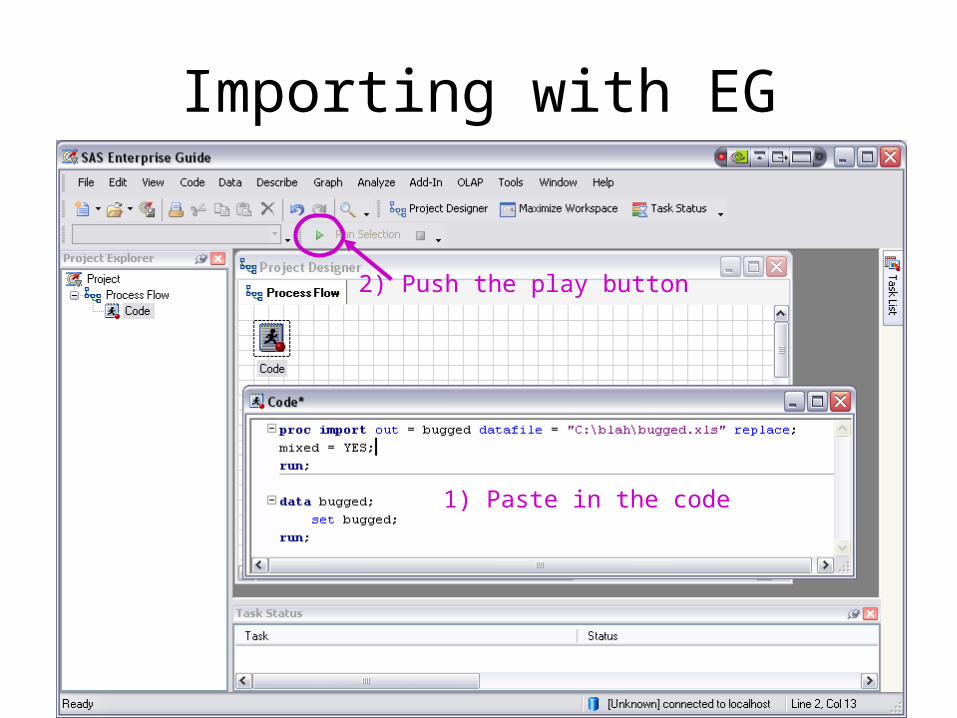
Importing with EG
2) Push the play button
1) Paste in the code
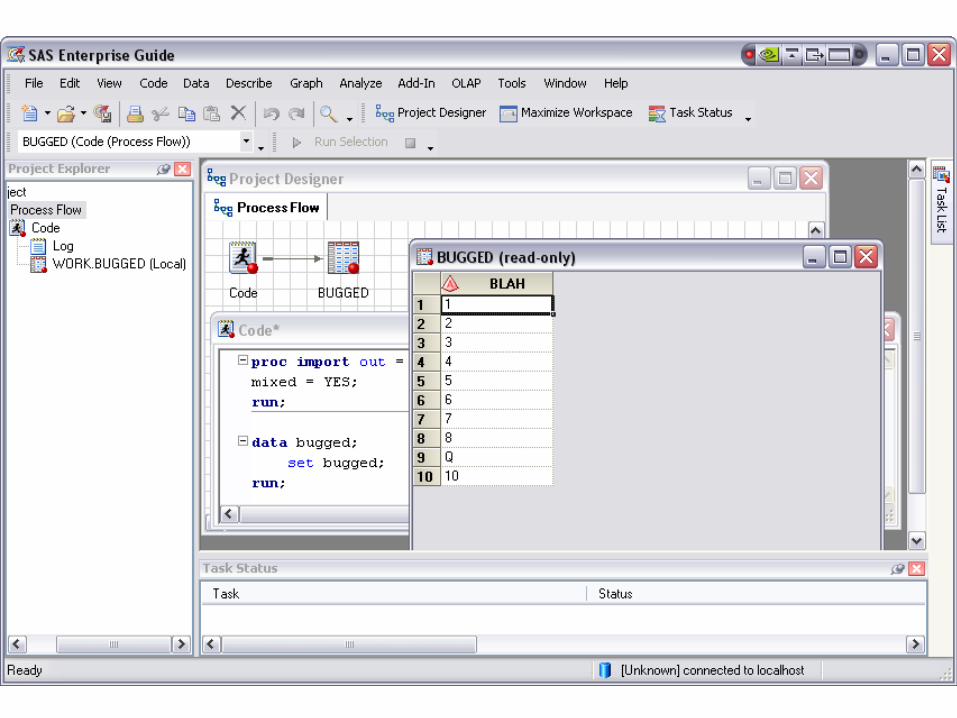
Imported
• There are many things to notice when you play (aka run) the code.
• A view table opens. • The red letter A in the column heading means
that the data imported as a column of character data. The fact that this is character data will prevent you from doing numeric statistics on this column.
• The Project Explorer gets a log entry and a data object added to the “tree”. The Process Flow gets a dataset item. The selected dataset now shows up on the task/button bar.
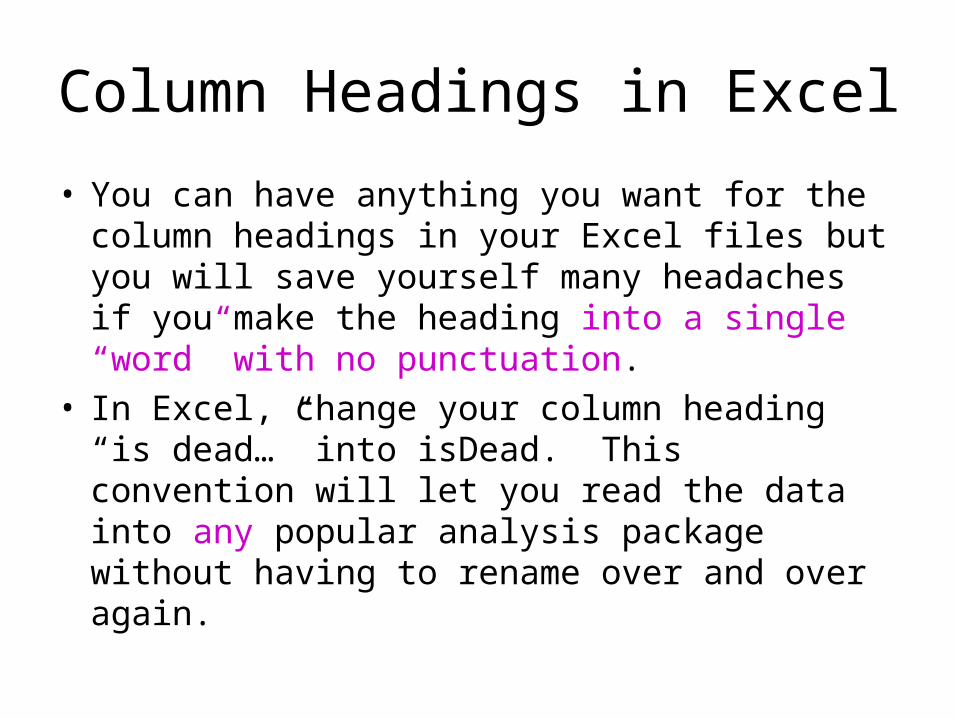
Column Headings in Excel
• You can have anything you want for the column headings in your Excel files but you will save yourself many headaches if you make the heading into a single “word” with no punctuation.
• In Excel, change your column heading “is dead…” into isDead. This convention will let you read the data into any popular analysis package without having to rename over and over again.
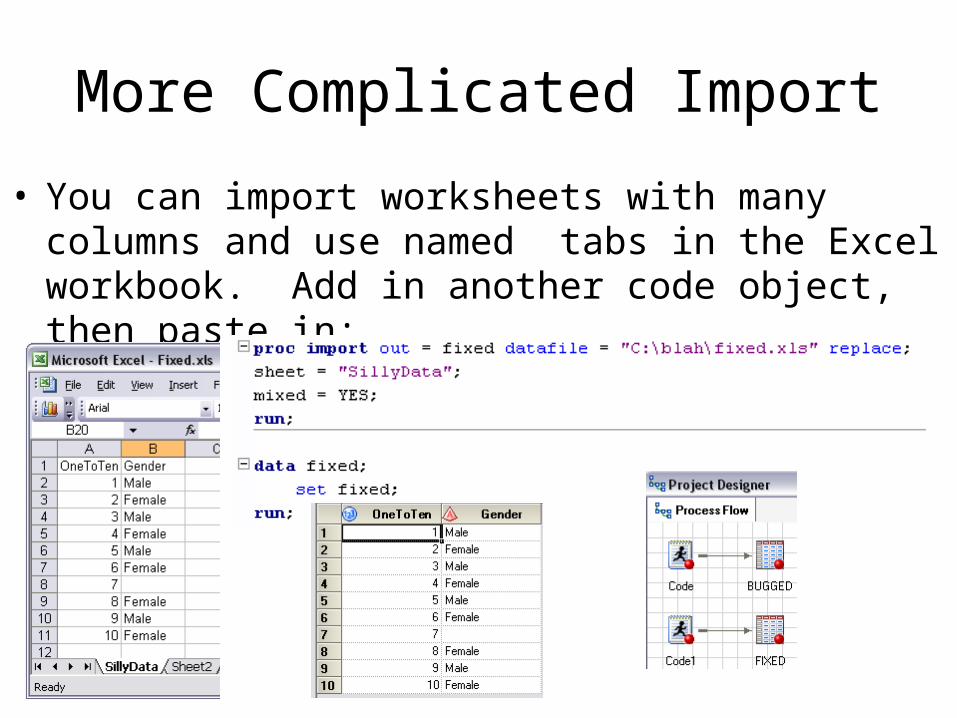
More Complicated Import
• You can import worksheets with many columns and use named tabs in the Excel workbook. Add in another code object, then paste in:
Storing Data with the Project
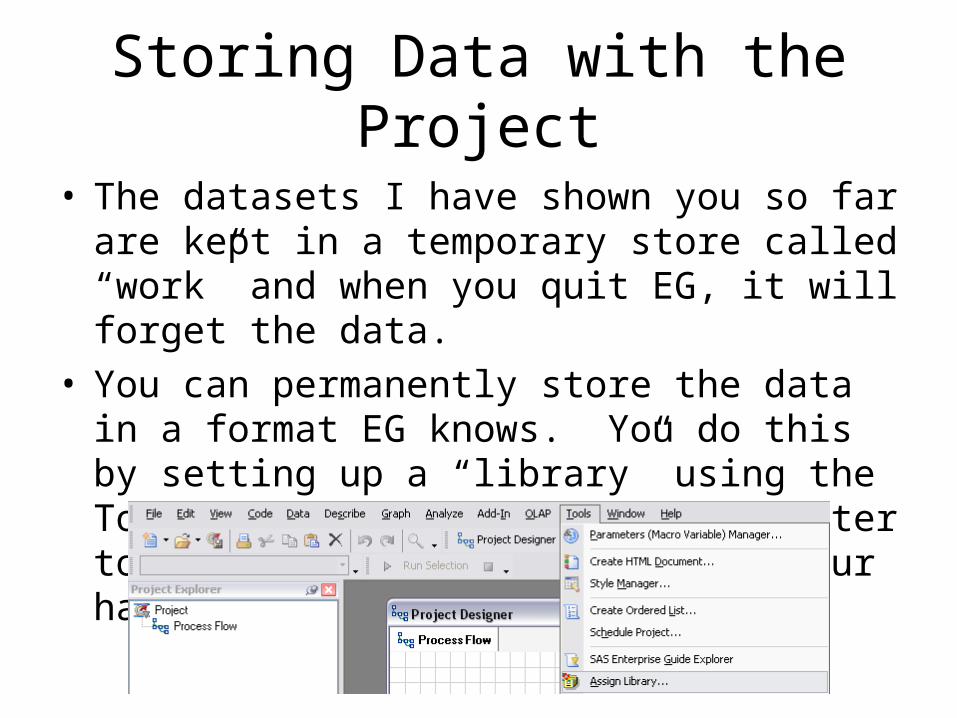
• The datasets I have shown you so far are kept in a temporary store called “work” and when you quit EG, it will forget the data.
• You can permanently store the data in a format EG knows. You do this by setting up a “library” using the Tools menu. This is just a “pointer to” or “alias for” a folder on your hard drive.
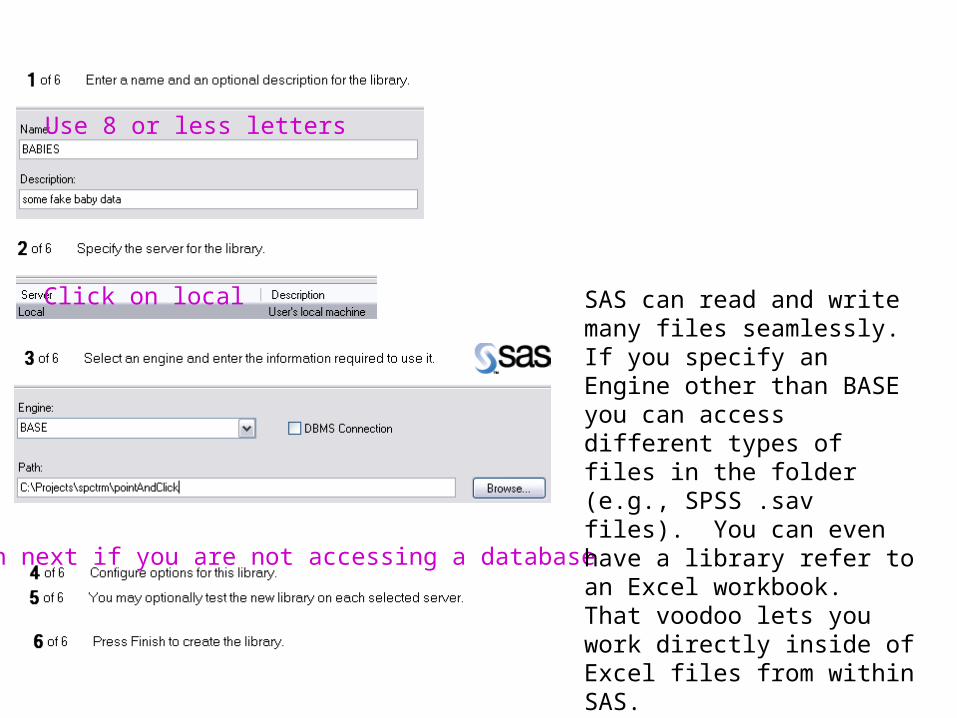
Use 8 or less letters
Click on local
Push next if you are not accessing a database
SAS can read and write many files seamlessly. If you specify an Engine other than BASE you can access different types of files in the folder (e.g., SPSS .sav files). You can even have a library refer to an Excel workbook. That voodoo lets you work directly inside of Excel files from within SAS.
Name it something!
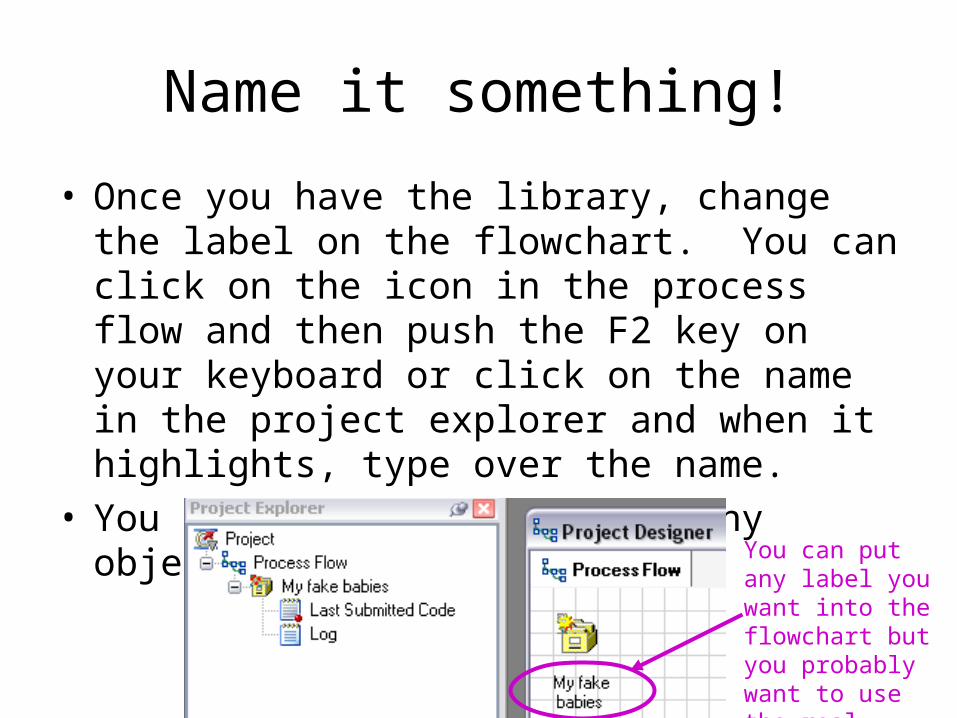
• Once you have the library, change the label on the flowchart. You can click on the icon in the process flow and then push the F2 key on your keyboard or click on the name in the project explorer and when it highlights, type over the name.
• You can change the name on any object like this.
You can put any label you want into the flowchart but you probably want to use the real library name.
Libraries
• Once the library is set, SAS is aware that there is a place that can hold data, but you still need to tell it to move the data to the permanent store.
• Next is an example where the data gets stored in a permanent library on your hard drive.
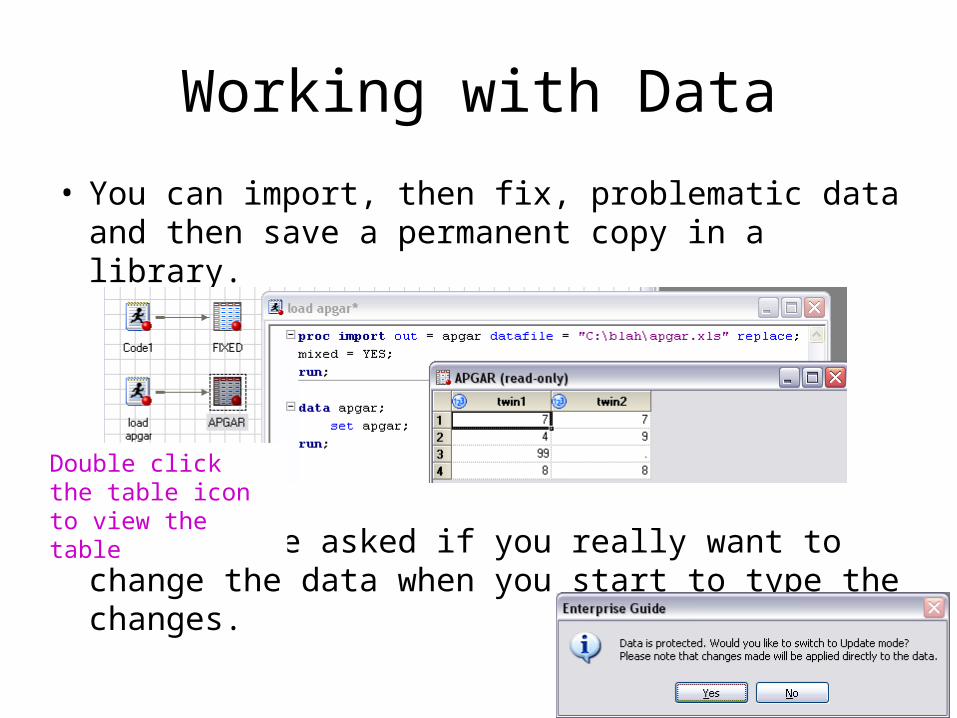
Working with Data
• You can import, then fix, problematic data and then save a permanent copy in a library.
• You will be asked if you really want to change the data when you start to type the changes.
Double click the table icon to view the table
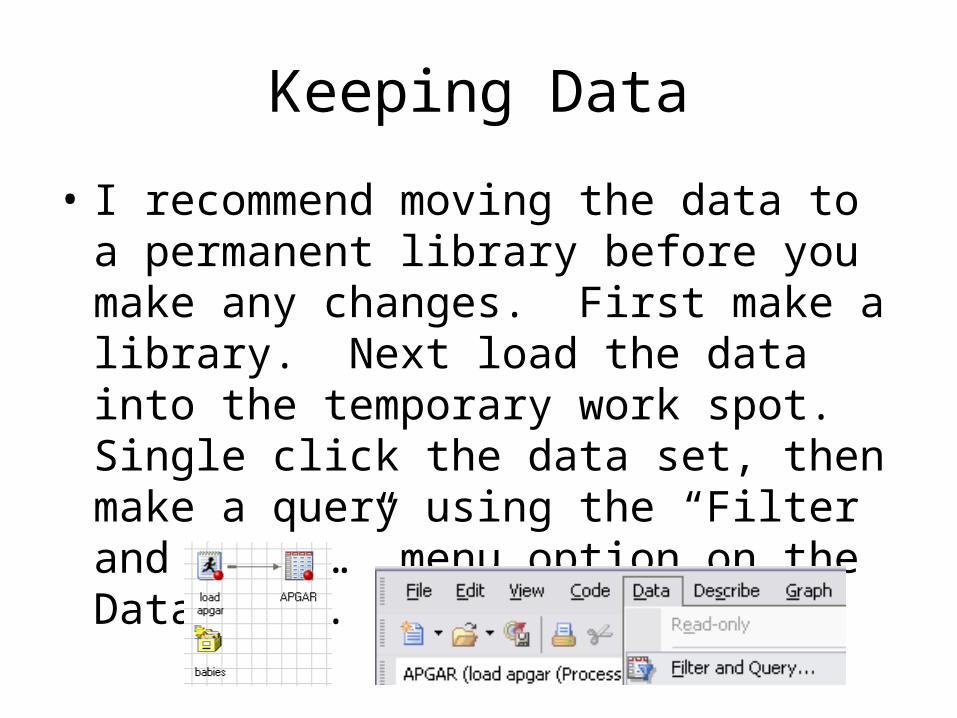
Keeping Data
• I recommend moving the data to a permanent library before you make any changes. First make a library. Next load the data into the temporary work spot. Single click the data set, then make a query using the “Filter and Query…” menu option on the Data menu.
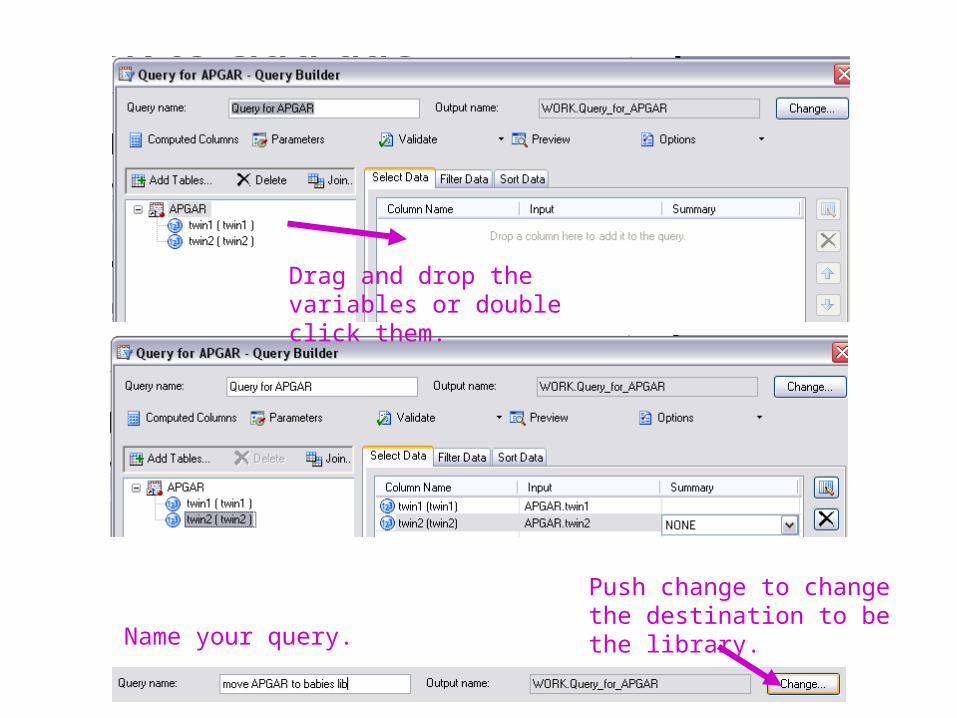
Drag and drop the variables or double click them.
Name your query.
Push change to change the destination to be the library.
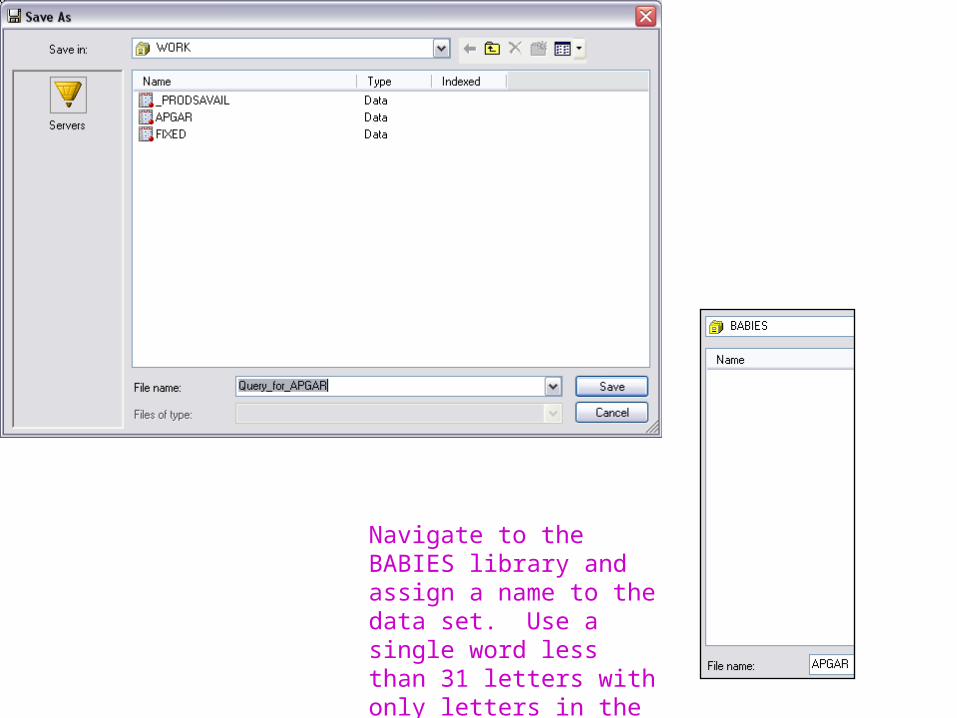
Navigate to the BABIES library and assign a name to the data set. Use a single word less than 31 letters with only letters in the name.
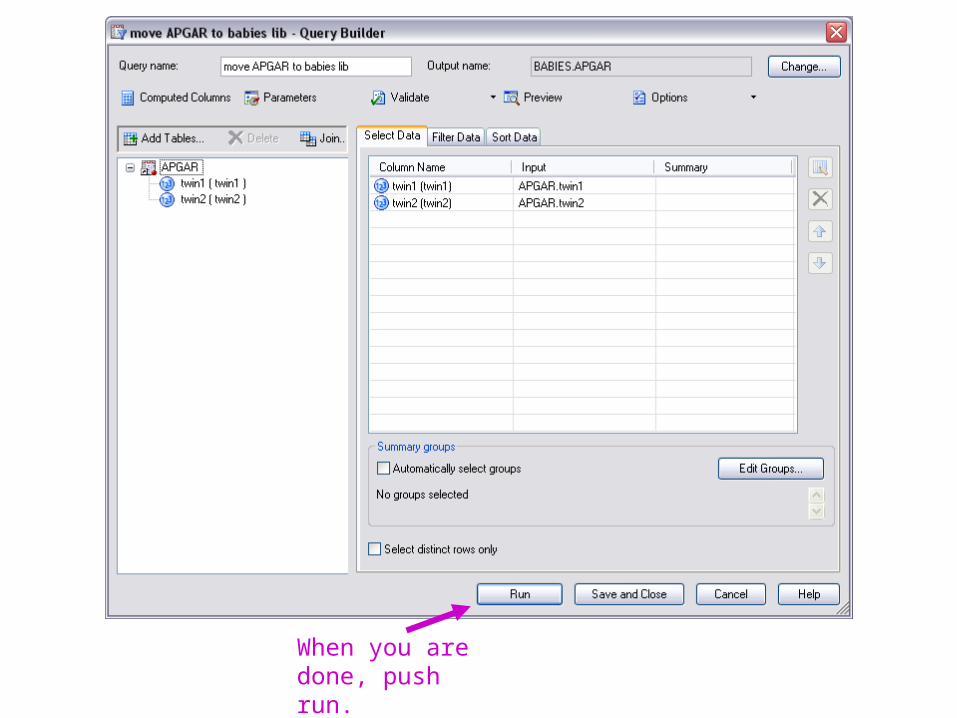
When you are done, push run.
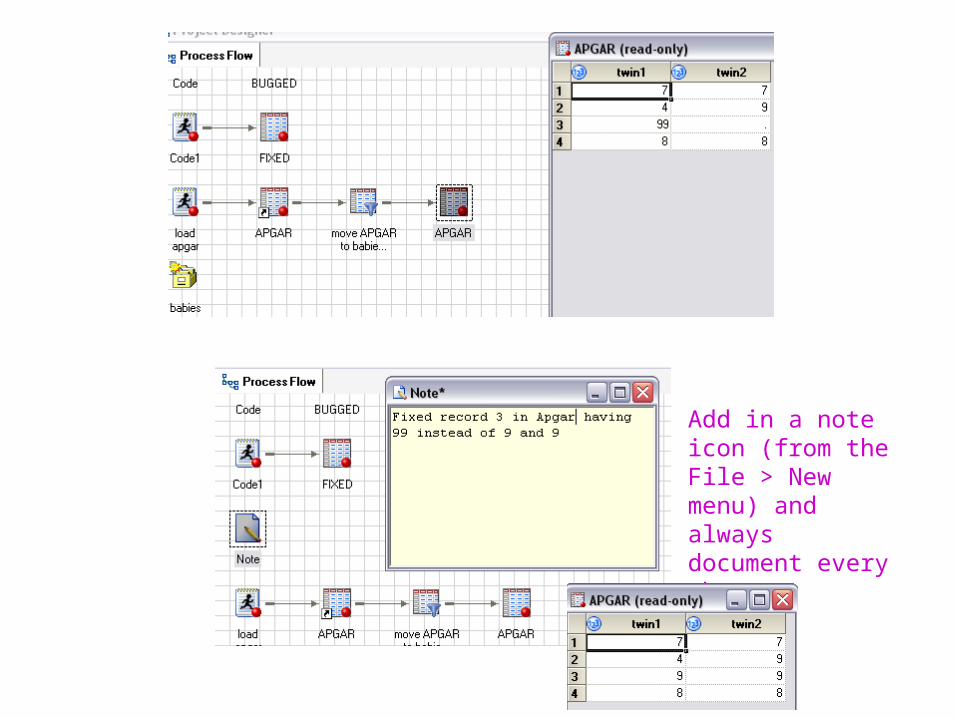
Add in a note icon (from the File > New menu) and always document every change.
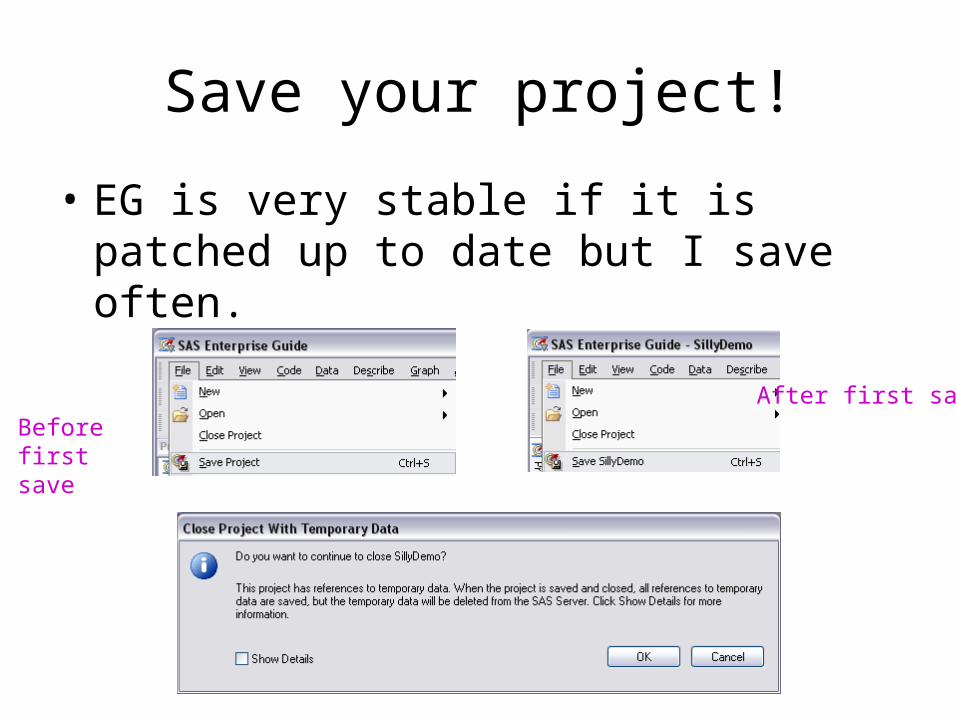
Save your project!
• EG is very stable if it is patched up to date but I save often.
After first saveBefore first save
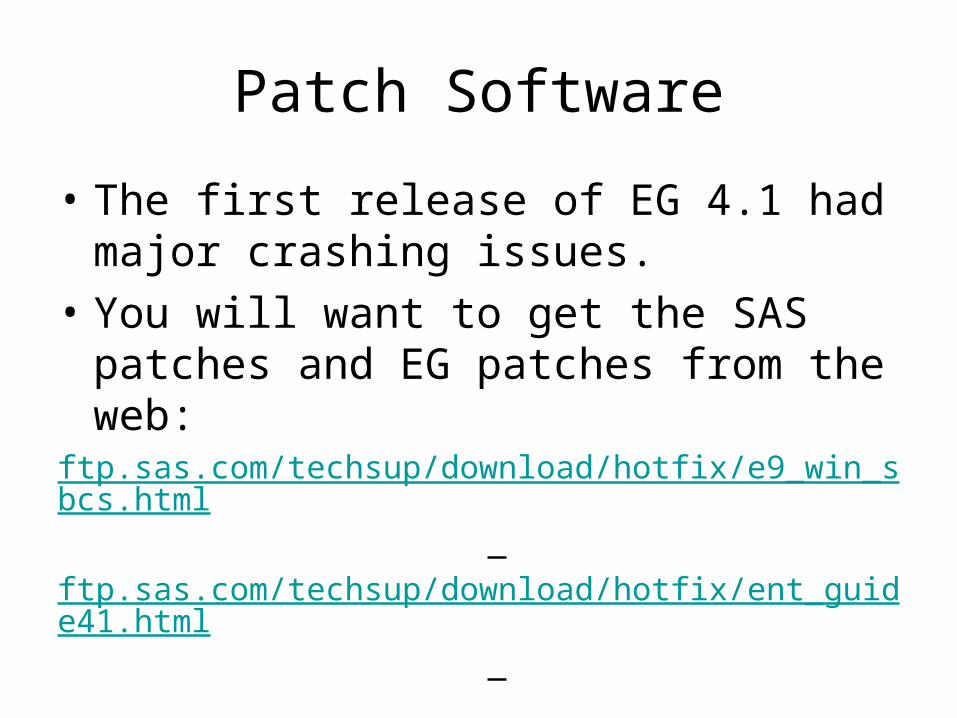
Patch Software
• The first release of EG 4.1 had major crashing issues.
• You will want to get the SAS patches and EG patches from the web:ftp.sas.com/techsup/download/hotfix/e9_win_sbcs.html
ftp.sas.com/techsup/download/hotfix/ent_guide41.html
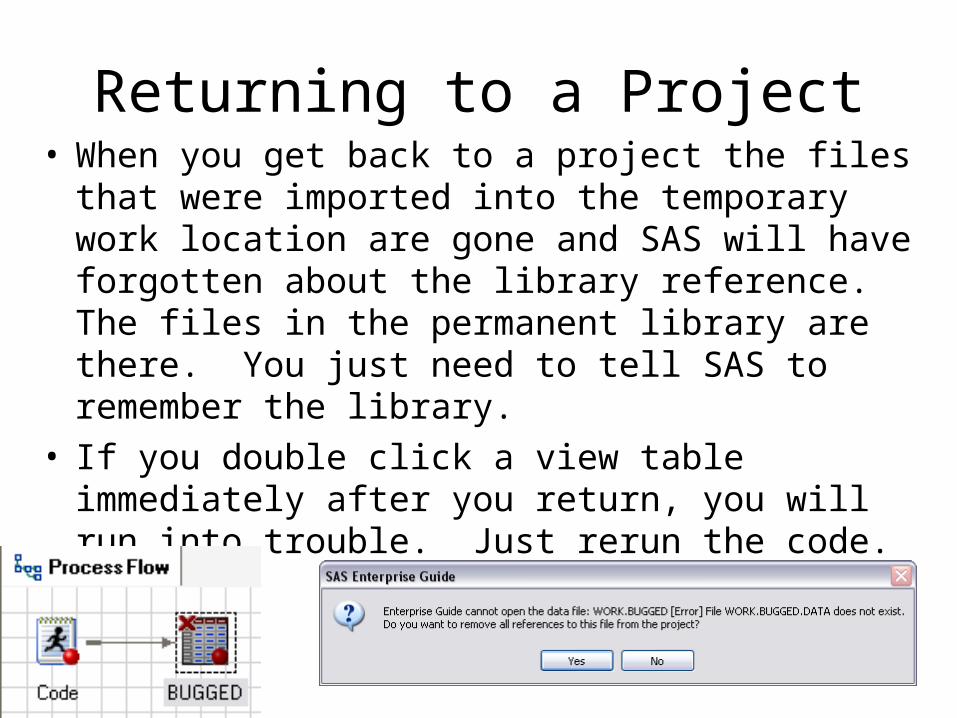
Returning to a Project• When you get back to a project the files that were
imported into the temporary work location are gone and SAS will have forgotten about the library reference. The files in the permanent library are there. You just need to tell SAS to remember the library.
• If you double click a view table immediately after you return, you will run into trouble. Just rerun the code.
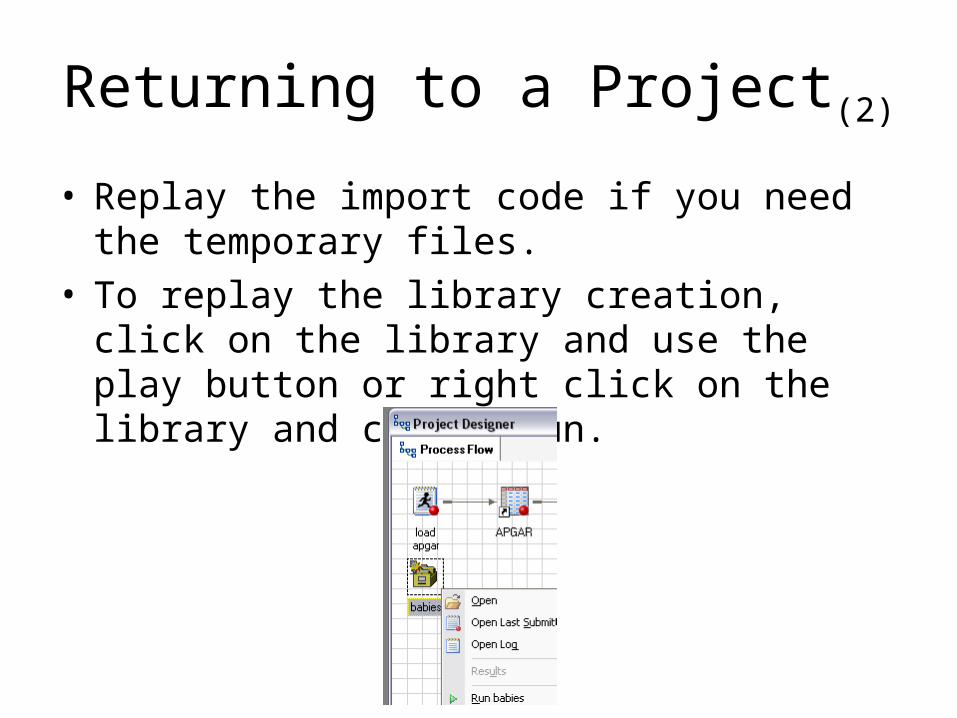
Returning to a Project(2)
• Replay the import code if you need the temporary files.
• To replay the library creation, click on the library and use the play button or right click on the library and choose Run.
So far…
• That is the process for importing, cleaning and saving your data.
• Next you will want to visualize and do statistics on the data.
For the Old Timers
• If you were exposed to SAS prior to EG you were told a LOT about data steps (keyword DATA) and analysis procedures (keyword PROC). Everything you learned still works in a code object in the flowchart. The EG-created code for data step manipulation is now done mostly with SQL (what is called PROC SQL in SAS 9.1.3) and the procs are now nicely hidden away in the menus.
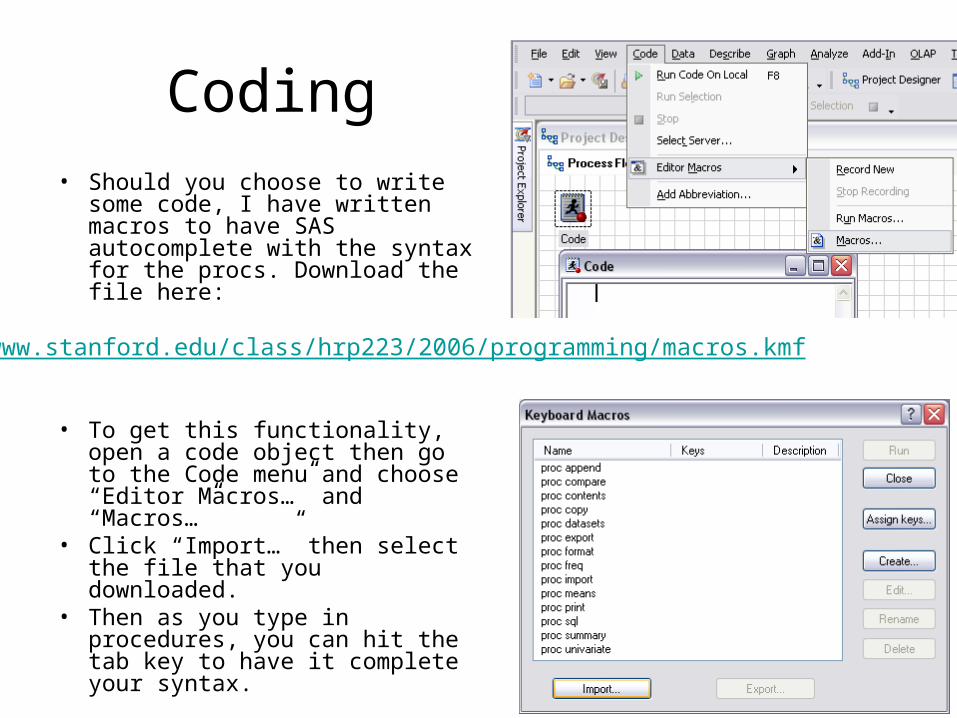
Coding• Should you choose to write
some code, I have written macros to have SAS autocomplete with the syntax for the procs. Download the file here:
• To get this functionality, open a code object then go to the Code menu and choose “Editor Macros…” and “Macros…”
• Click “Import…” then select the file that you downloaded.
• Then as you type in procedures, you can hit the tab key to have it complete your syntax.
www.stanford.edu/class/hrp223/2006/programming/macros.kmf
Why would you code?
• You need tools to do data validation and to fix systematic problems. You can manually change your dataset like you would in Excel by changing one cell at a time or you can learn to write basic data step code. The right way to clean data is with code.– You want to have an audit trail of every change to
your data.
• Check out HRP 223 if you need to do real data management with validation.
www.stanford.edu/class/hrp223/
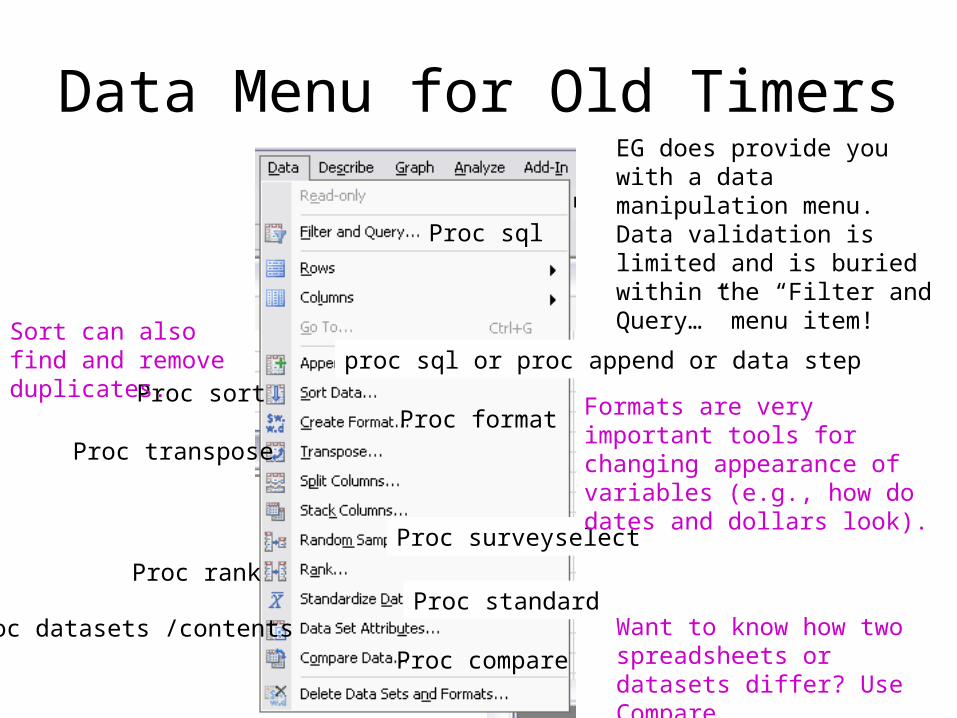
Data Menu for Old Timers
Proc sql
proc sql or proc append or data stepProc sort
Proc format
Proc surveyselect
Proc transpose
Proc rankProc standard
Proc datasets /contentsProc compare
Formats are very important tools for changing appearance of variables (e.g., how do dates and dollars look).
Sort can also find and remove duplicates.
Want to know how two spreadsheets or datasets differ? Use Compare.
EG does provide you with a data manipulation menu. Data validation is limited and is buried within the “Filter and Query…” menu item!
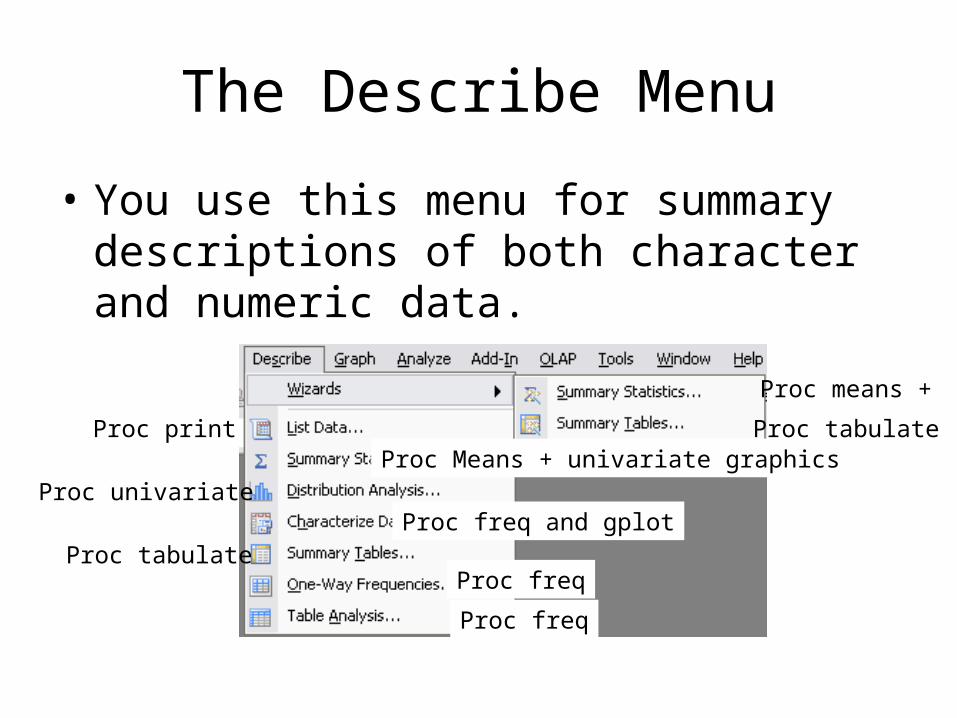
The Describe Menu
Proc means +
Proc tabulateProc printProc Means + univariate graphics
Proc univariateProc freq and gplot
Proc tabulateProc freq
Proc freq
• You use this menu for summary descriptions of both character and numeric data.
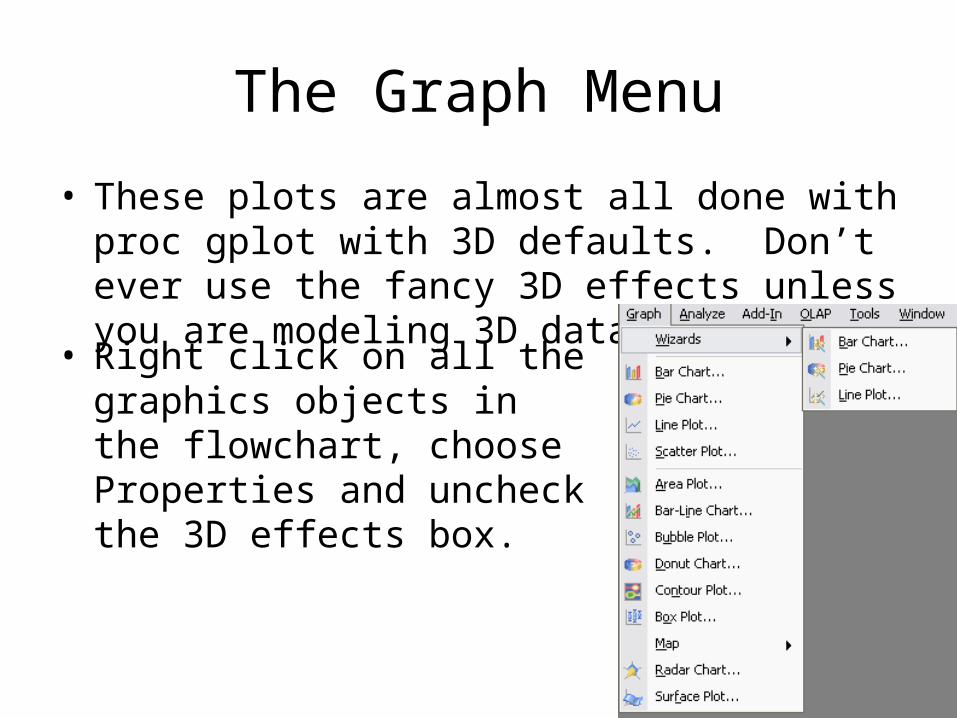
The Graph Menu
• These plots are almost all done with proc gplot with 3D defaults. Don’t ever use the fancy 3D effects unless you are modeling 3D data!
• Right click on all the graphics objects in the flowchart, choose Properties and uncheck the 3D effects box.
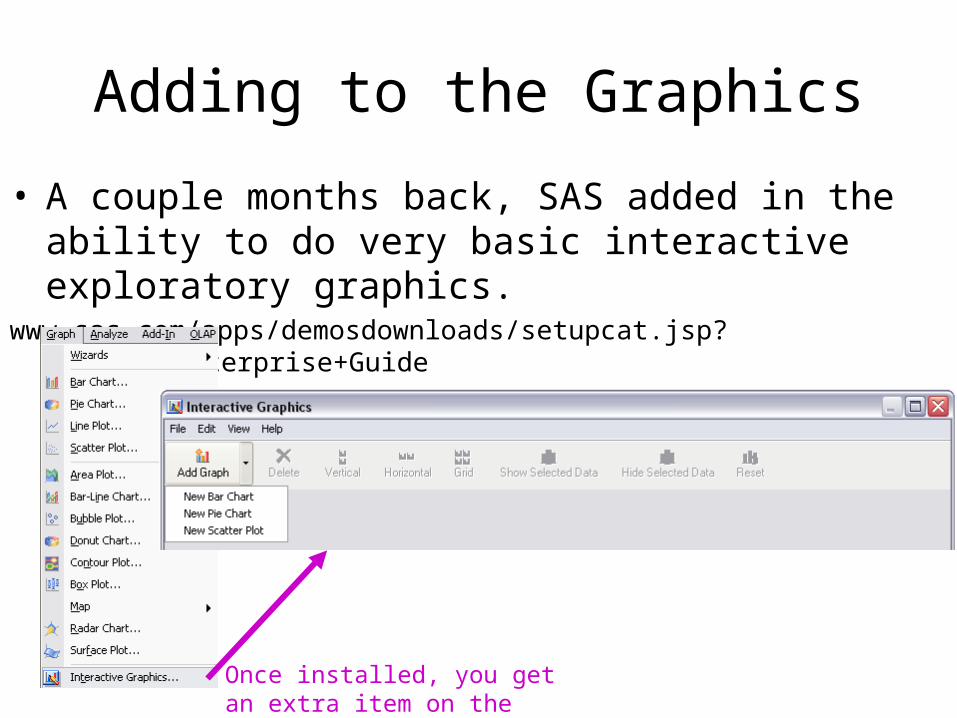
Adding to the Graphics
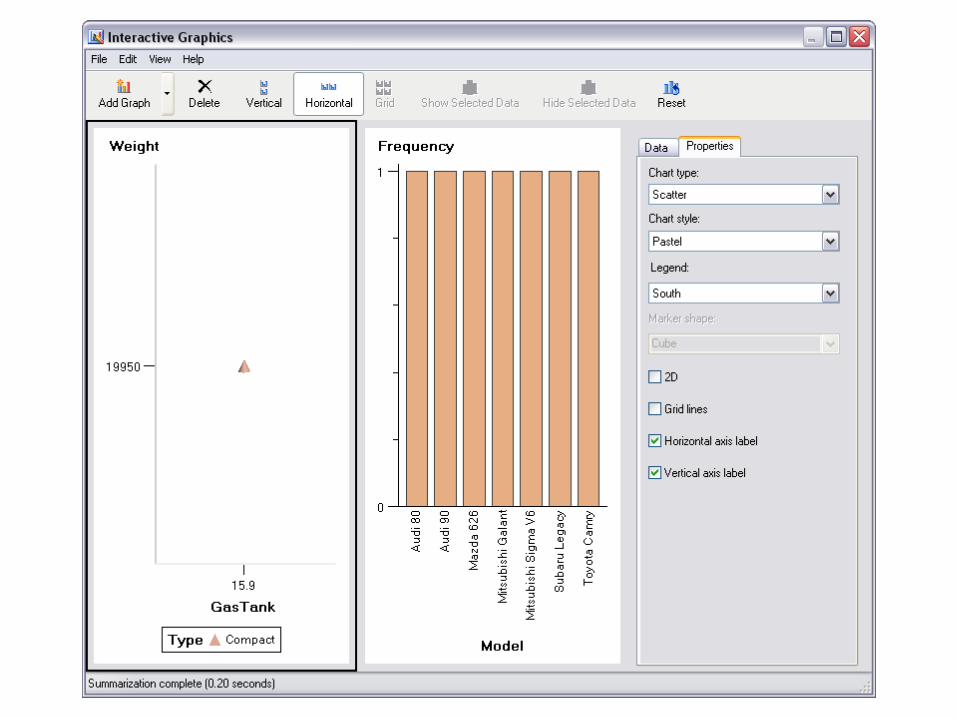
• A couple months back, SAS added in the ability to do very basic interactive exploratory graphics.
www.sas.com/apps/demosdownloads/setupcat.jsp?cat=SAS+Enterprise+Guide
Once installed, you get an extra item on the Graph menu.
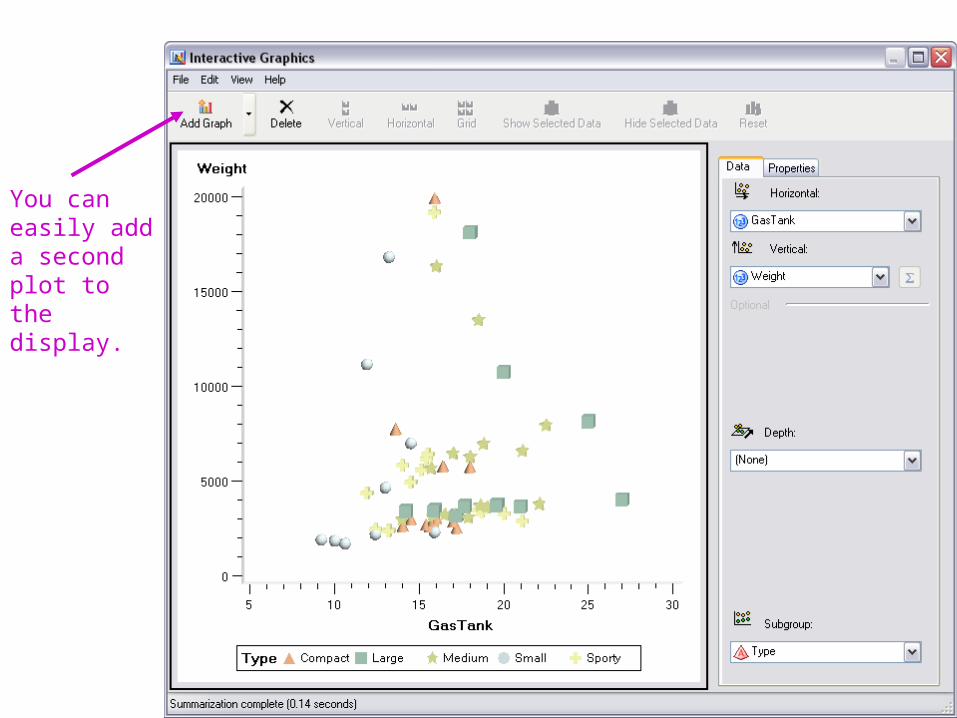
You can easily add a second plot to the display.
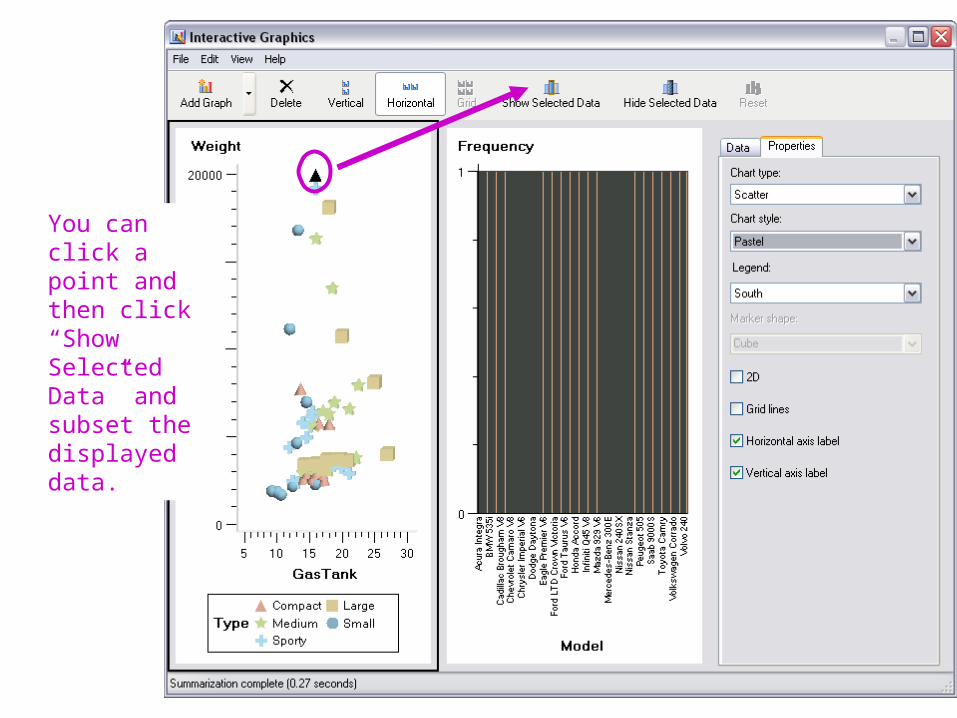
You can click a point and then click “Show Selected Data” and subset the displayed data.
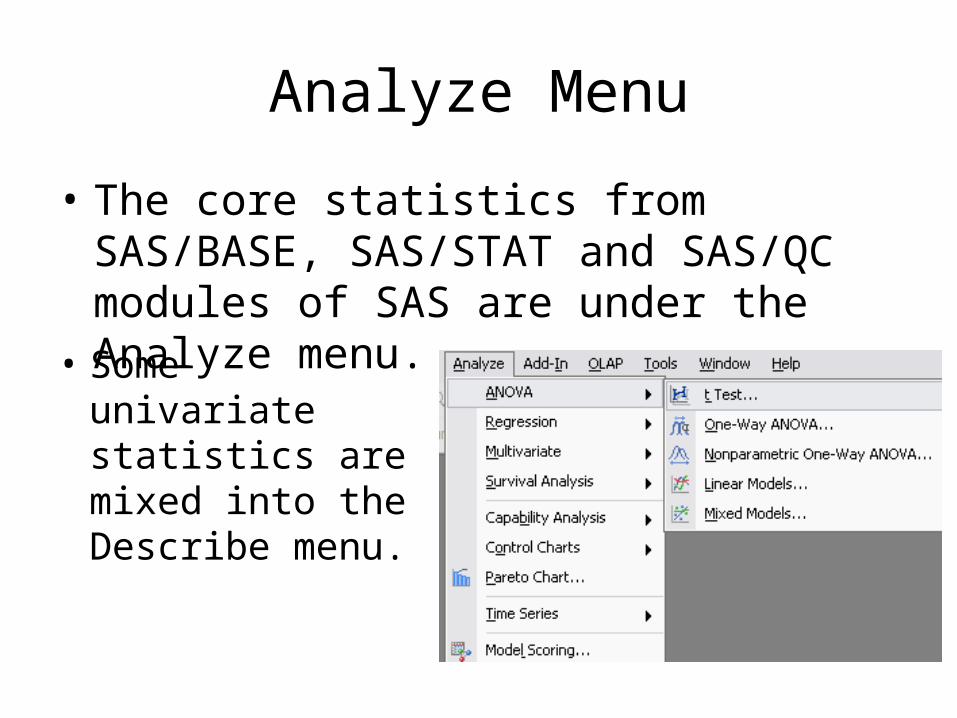
Analyze Menu
• The core statistics from SAS/BASE, SAS/STAT and SAS/QC modules of SAS are under the Analyze menu.
• Some univariate statistics are mixed into the Describe menu.
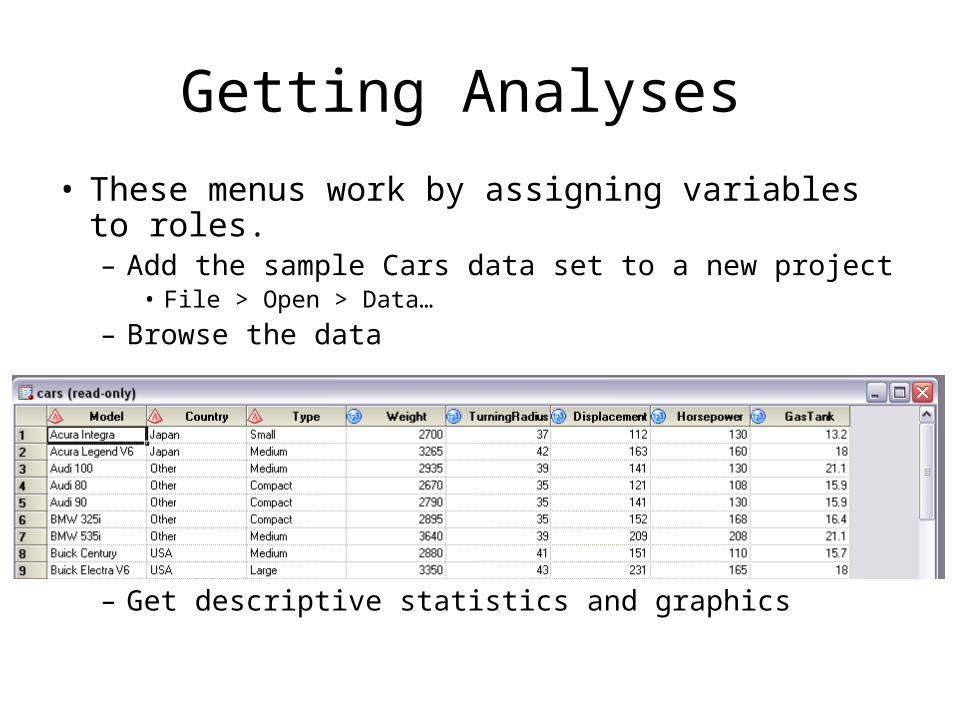
Getting Analyses
• These menus work by assigning variables to roles. – Add the sample Cars data set to a new project
• File > Open > Data…
– Browse the data
– Get descriptive statistics and graphics
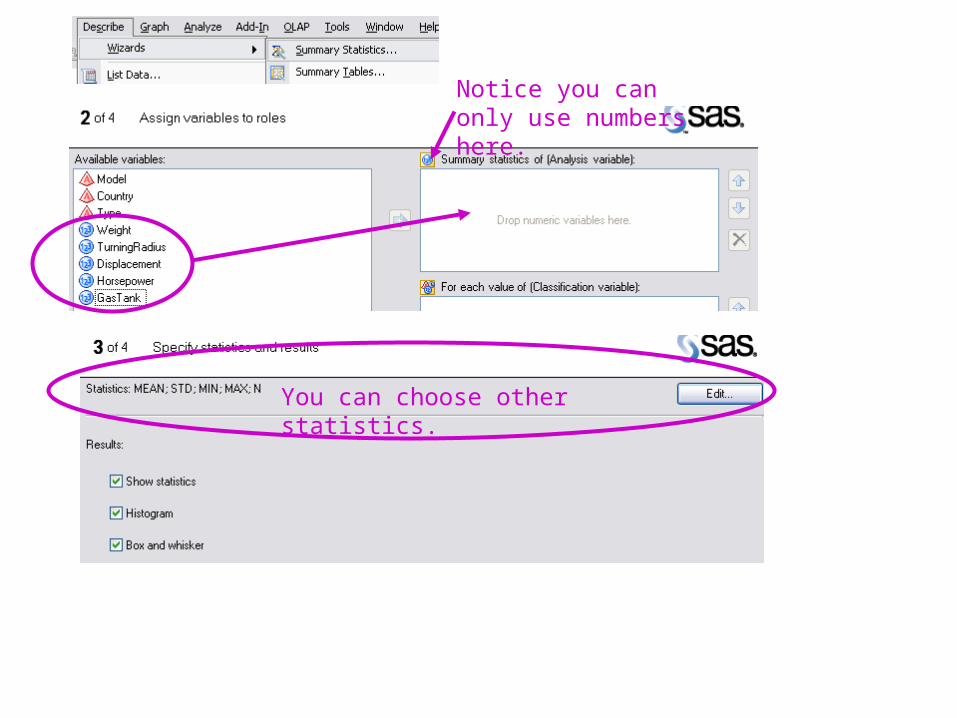
You can choose other statistics.
Notice you can only use numbers here.
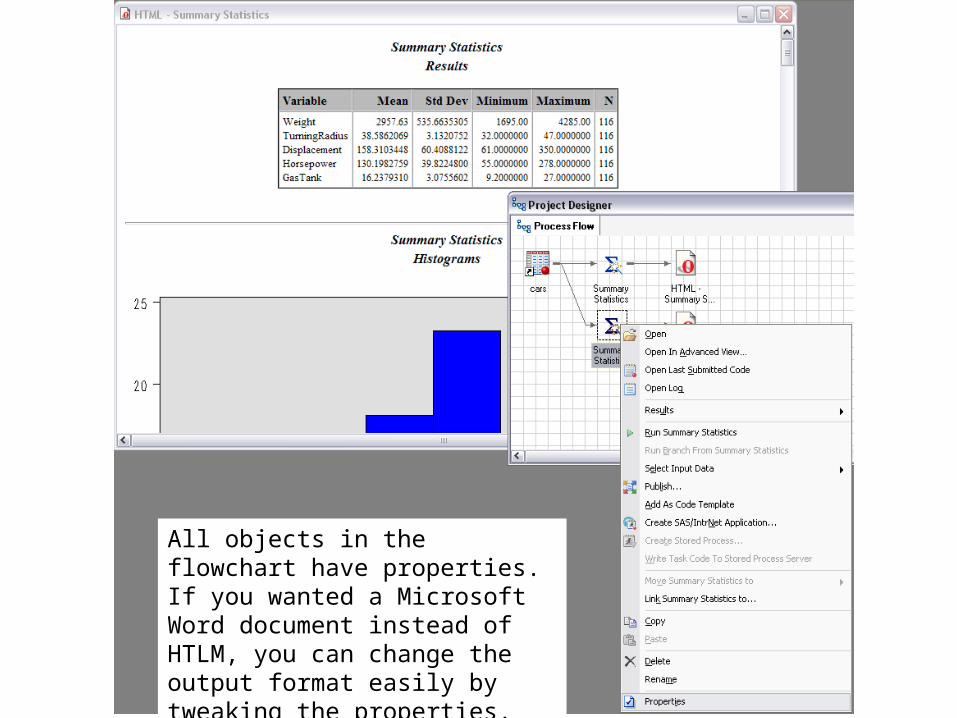
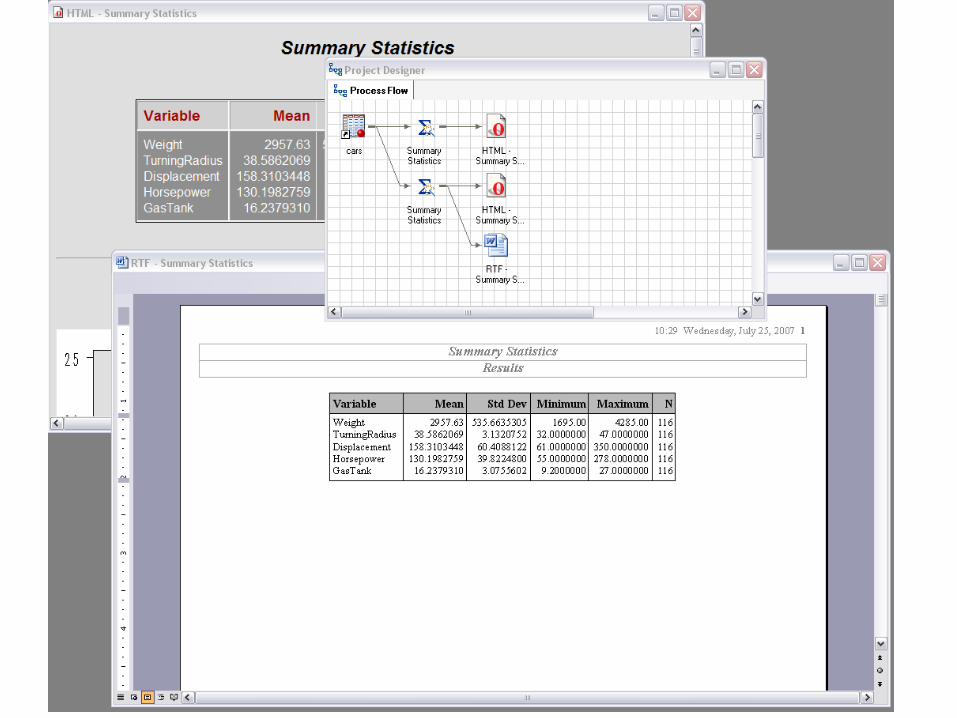
All objects in the flowchart have properties.If you wanted a Microsoft Word document instead of HTLM, you can change the output format easily by tweaking the properties.
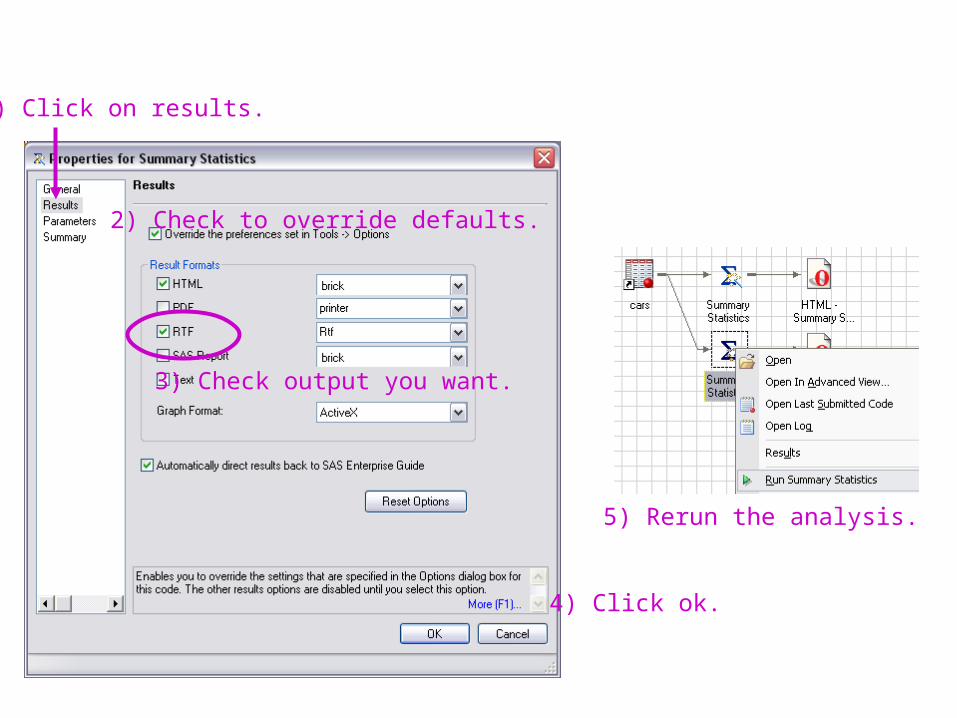
1) Click on results.
2) Check to override defaults.
3) Check output you want.
4) Click ok.
5) Rerun the analysis.
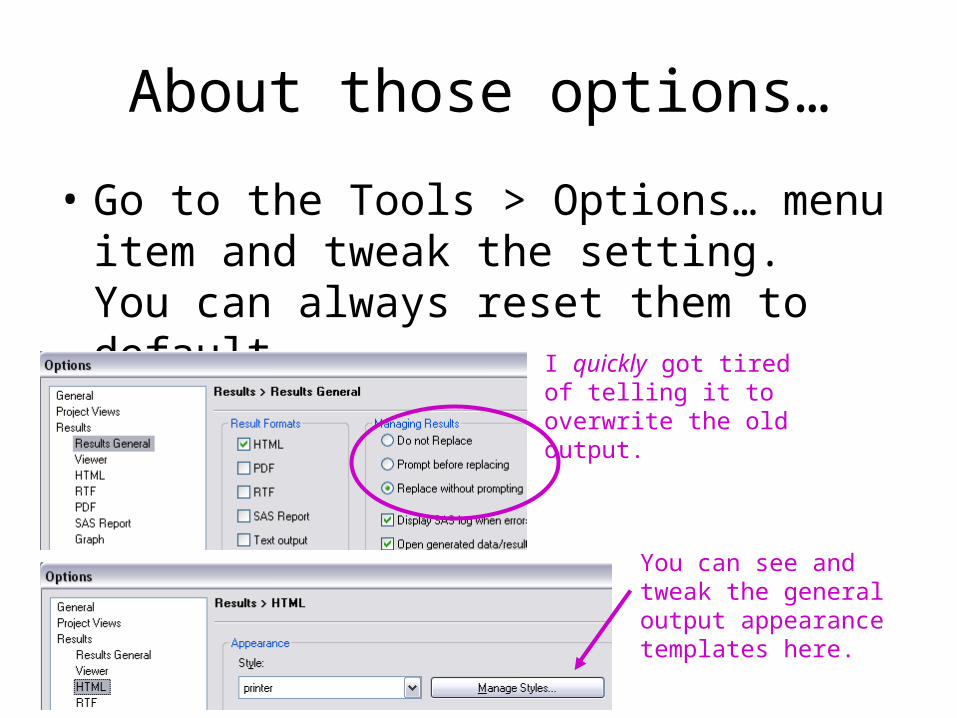
About those options…
• Go to the Tools > Options… menu item and tweak the setting. You can always reset them to default.
You can see and tweak the general output appearance templates here.
I quickly got tired of telling it to overwrite the old output.
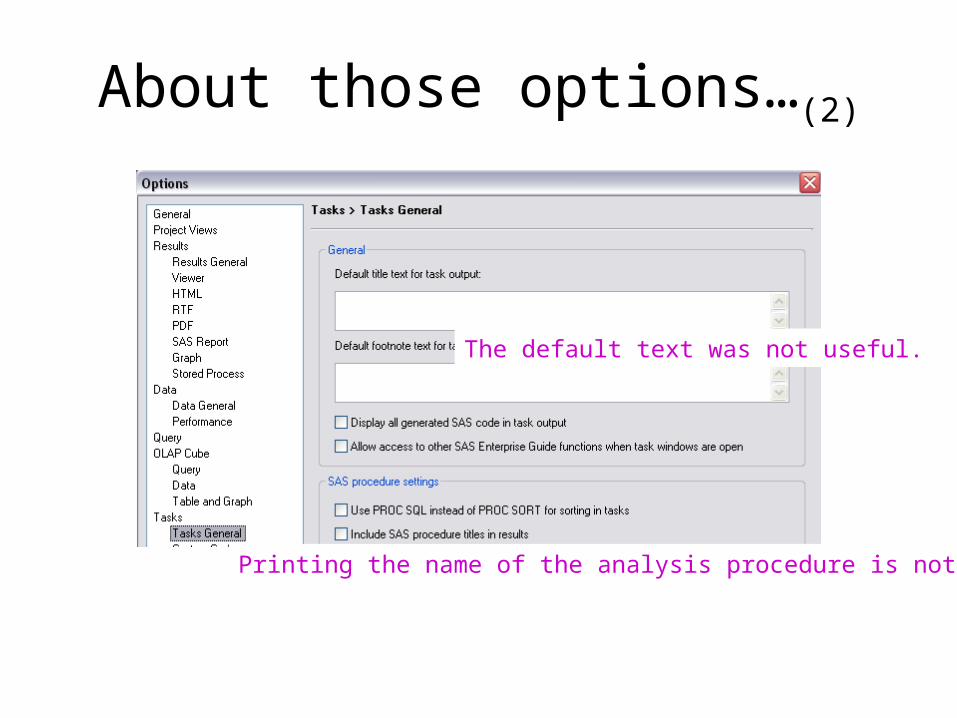
About those options…(2)
The default text was not useful.
Printing the name of the analysis procedure is not useful.
Roles in Analyses
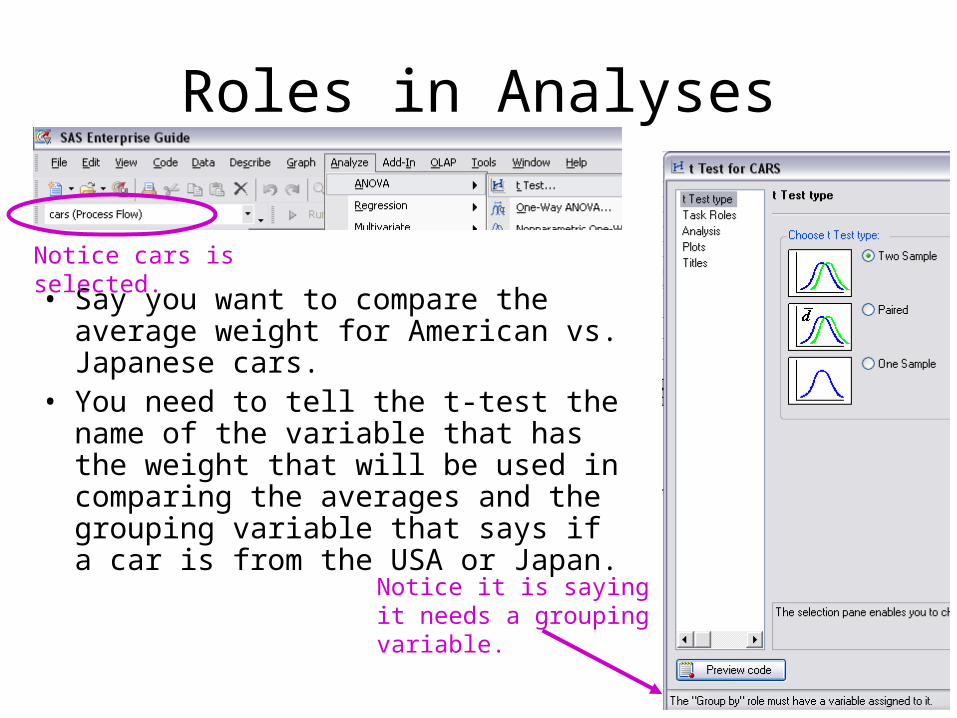
• Say you want to compare the average weight for American vs. Japanese cars.
• You need to tell the t-test the name of the variable that has the weight that will be used in comparing the averages and the grouping variable that says if a car is from the USA or Japan.
Notice cars is selected.
Notice it is saying it needs a grouping variable.
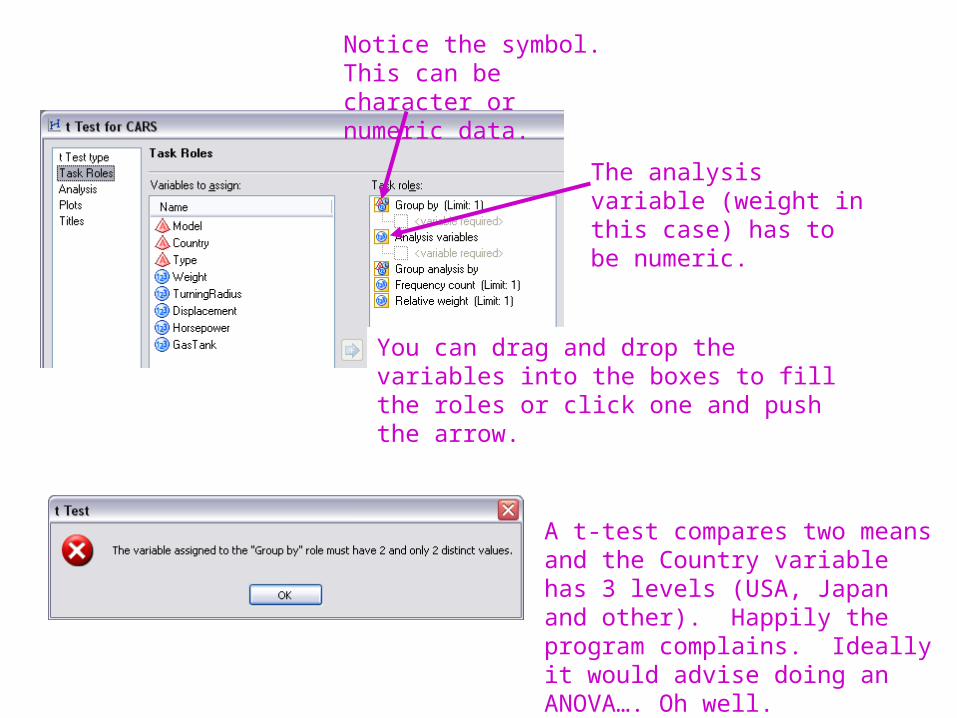
Notice the symbol. This can be character or numeric data.
The analysis variable (weight in this case) has to be numeric.
You can drag and drop the variables into the boxes to fill the roles or click one and push the arrow.
A t-test compares two means and the Country variable has 3 levels (USA, Japan and other). Happily the program complains. Ideally it would advise doing an ANOVA…. Oh well.
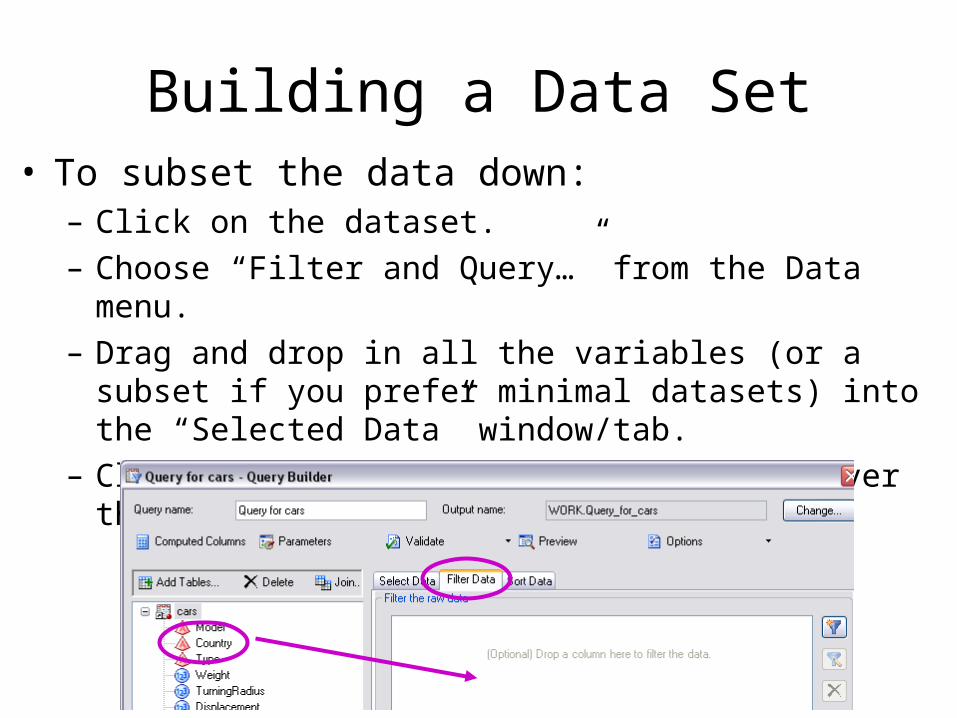
Building a Data Set• To subset the data down:
– Click on the dataset.– Choose “Filter and Query…” from the Data menu.– Drag and drop in all the variables (or a subset if you prefer
minimal datasets) into the “Selected Data” window/tab.– Click on the filter data tab and move over the country
variable.
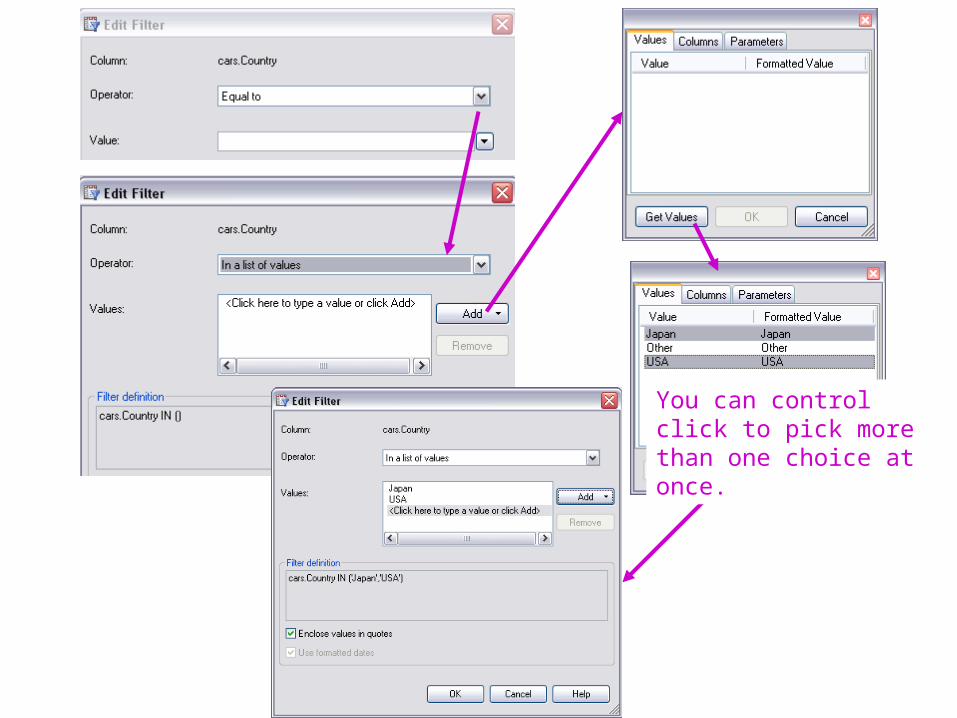
You can control click to pick more than one choice at once.
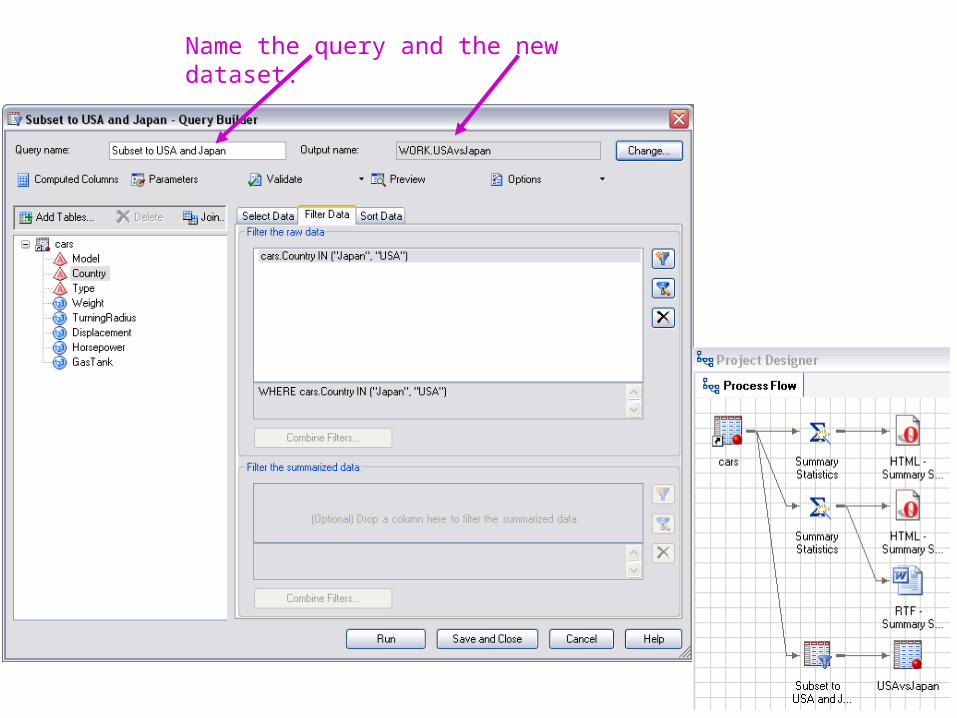
Name the query and the new dataset.
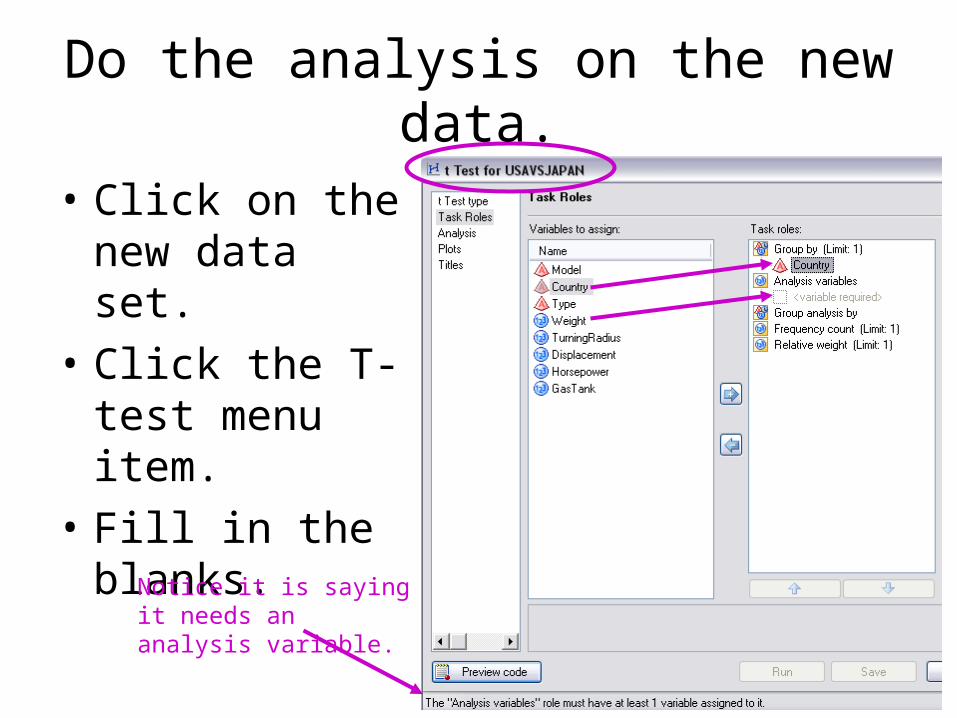
• Click on the new data set.
• Click the T-test menu item.
• Fill in the blanks.
Notice it is saying it needs an analysis variable.
Do the analysis on the new data.
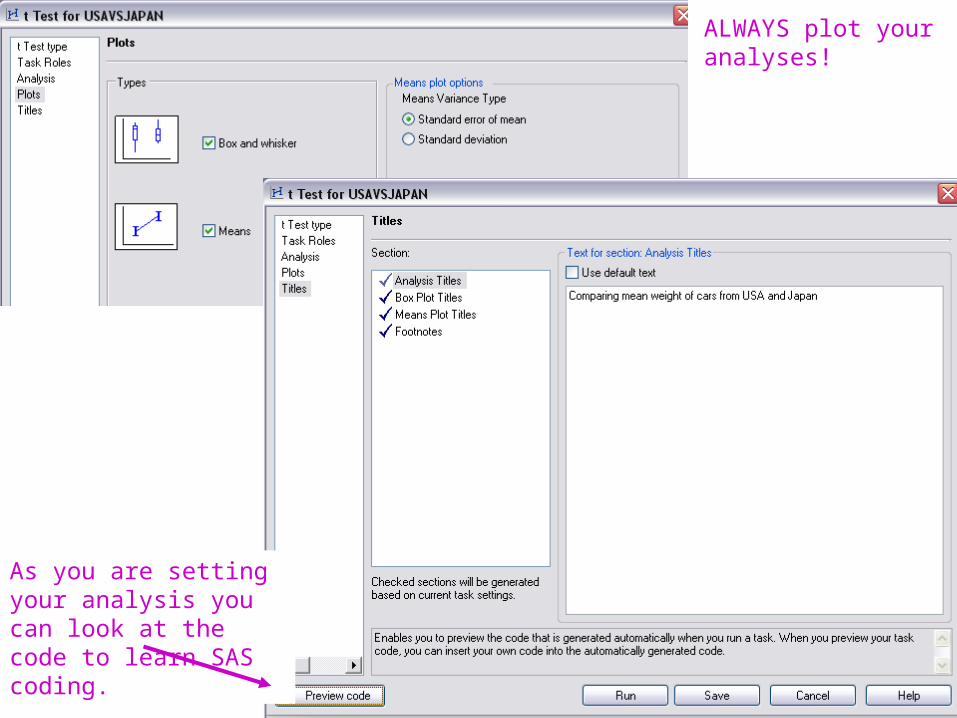
ALWAYS plot your analyses!
As you are setting your analysis you can look at the code to learn SAS coding.
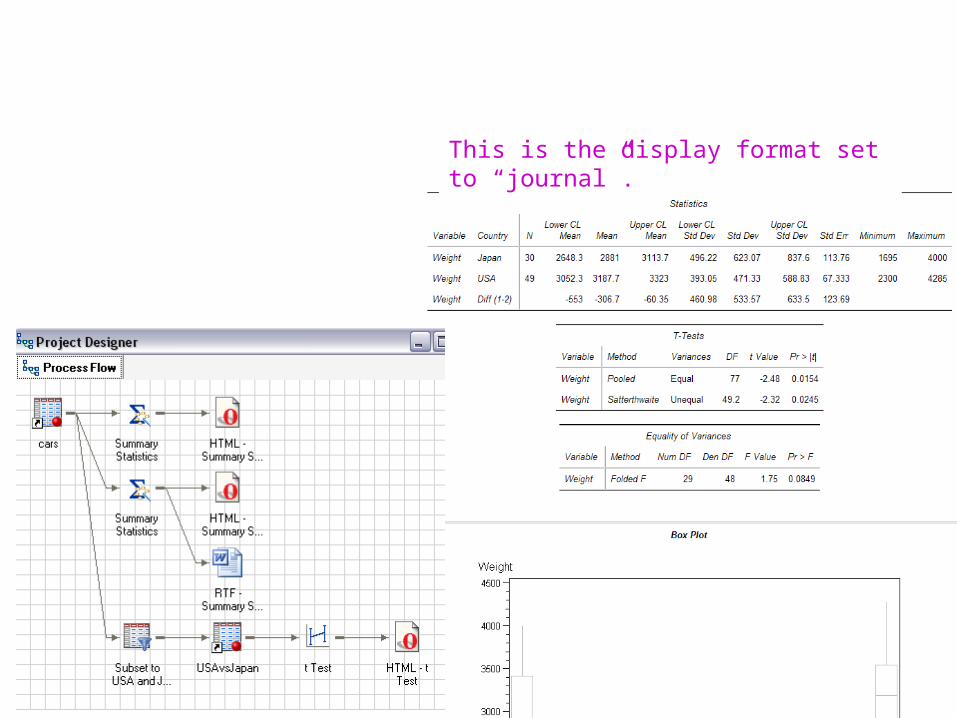
This is the display format set to “journal”.
The rest…
• The rest of the analyses work as easily as the t-test.
• Be sure to look at the data visualization options that go with every test.
• There is a very nice graphical user interface for working with multiple tables accessible from the “Filter and Query…” tool. See the “Cow” bonus material.
Learning More
• The Little SAS Book for Enterprise Guide 4.1 by Slaugher and Delwiche is a nice friendly introduction.
• There is a free tutorial at SAS:www.sas.com/apps/elearning/elearning_courses.jsp?cat=Free+Tutorials
• There are fairly inexpensive additional online tutorials:www.sas.com/apps/elearning/elearning_courses.jsp?cat=SAS+Enterprise+Guide
• There are many “course notes” through SAS but they usually are written EG 3 not 4. Ask me before you spend the money.
• The only beyond-the-basics book for EG 4 is Statistics Using SAS Enterprise Guide by James Davis:
www.sas.com/apps/pubscat/bookdetails.jsp?catid=1&pc=57255
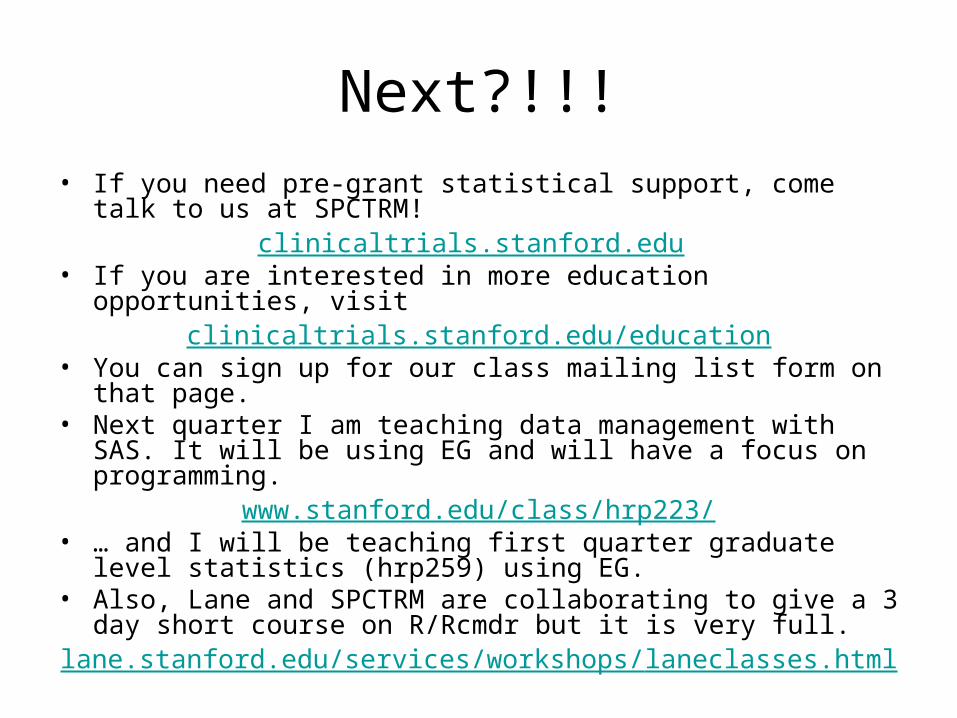
Next?!!!• If you need pre-grant statistical support, come talk to us at
SPCTRM!clinicaltrials.stanford.edu
• If you are interested in more education opportunities, visit clinicaltrials.stanford.edu/education
• You can sign up for our class mailing list form on that page.• Next quarter I am teaching data management with SAS. It will be
using EG and will have a focus on programming.www.stanford.edu/class/hrp223/
• … and I will be teaching first quarter graduate level statistics (hrp259) using EG.
• Also, Lane and SPCTRM are collaborating to give a 3 day short course on R/Rcmdr but it is very full.
lane.stanford.edu/services/workshops/laneclasses.html

Cows…
The bonus level!
The Task
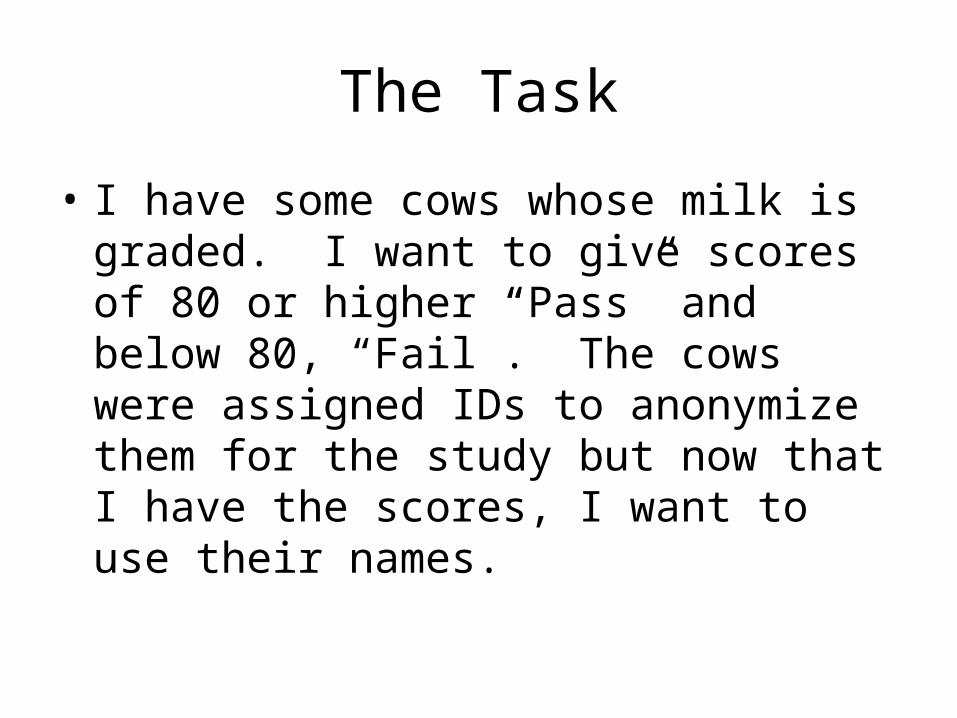
• I have some cows whose milk is graded. I want to give scores of 80 or higher “Pass” and below 80, “Fail”. The cows were assigned IDs to anonymize them for the study but now that I have the scores, I want to use their names.
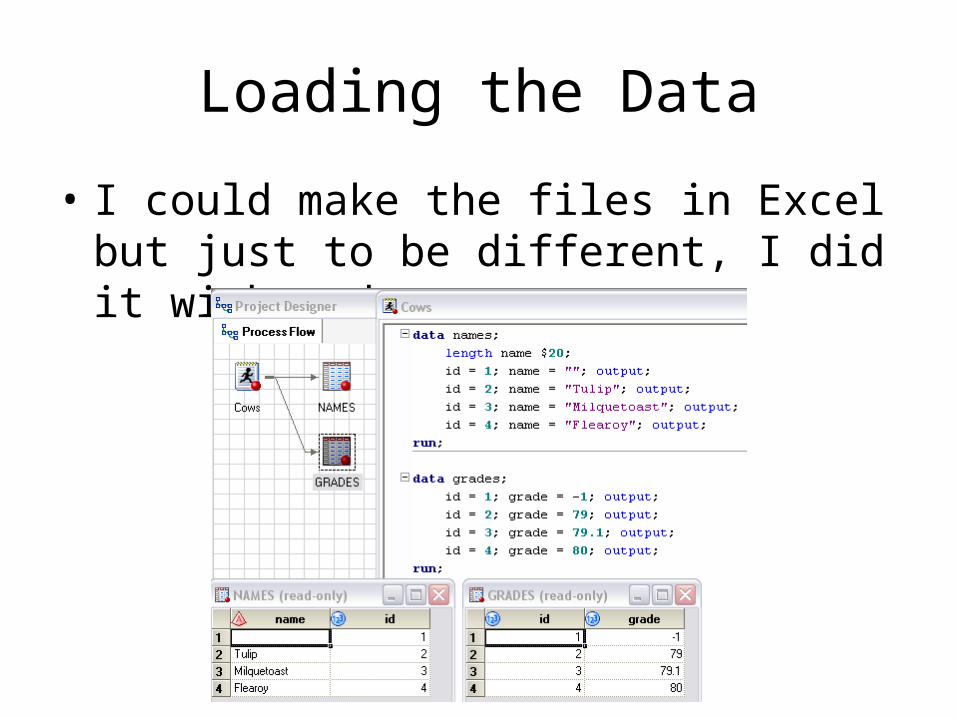
Loading the Data
• I could make the files in Excel but just to be different, I did it with code.
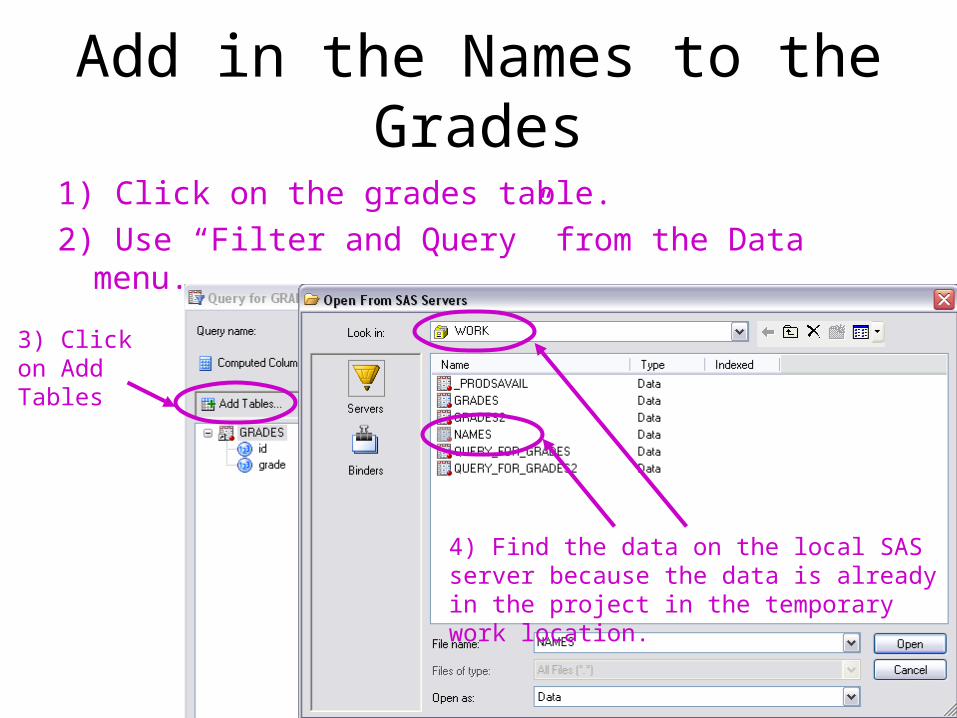
Add in the Names to the Grades
1) Click on the grades table.
2) Use “Filter and Query” from the Data menu.
3) Click on Add Tables
4) Find the data on the local SAS server because the data is already in the project in the temporary work location.
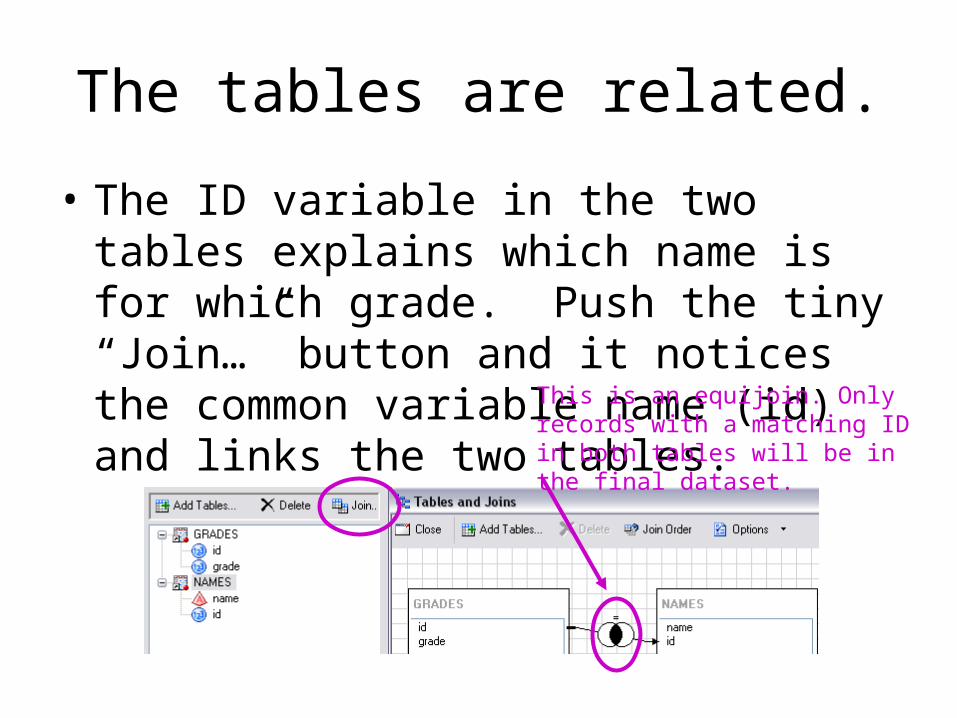
The tables are related.
• The ID variable in the two tables explains which name is for which grade. Push the tiny “Join…” button and it notices the common variable name (id) and links the two tables. This is an equijoin. Only records
with a matching ID in both tables will be in the final dataset.
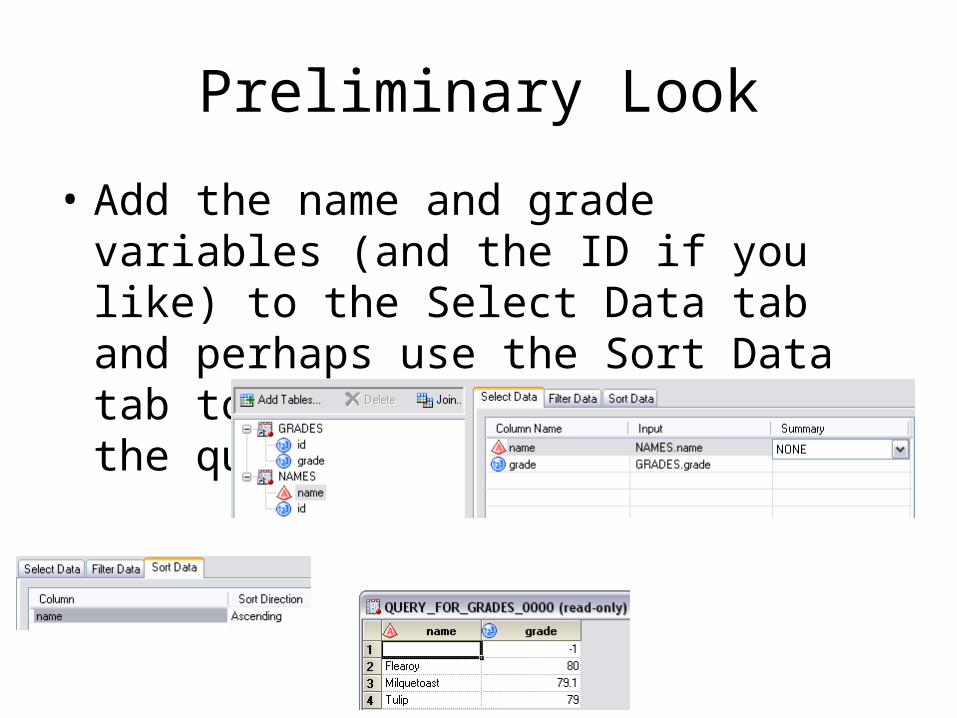
Preliminary Look
• Add the name and grade variables (and the ID if you like) to the Select Data tab and perhaps use the Sort Data tab to order by name. Then run the query.
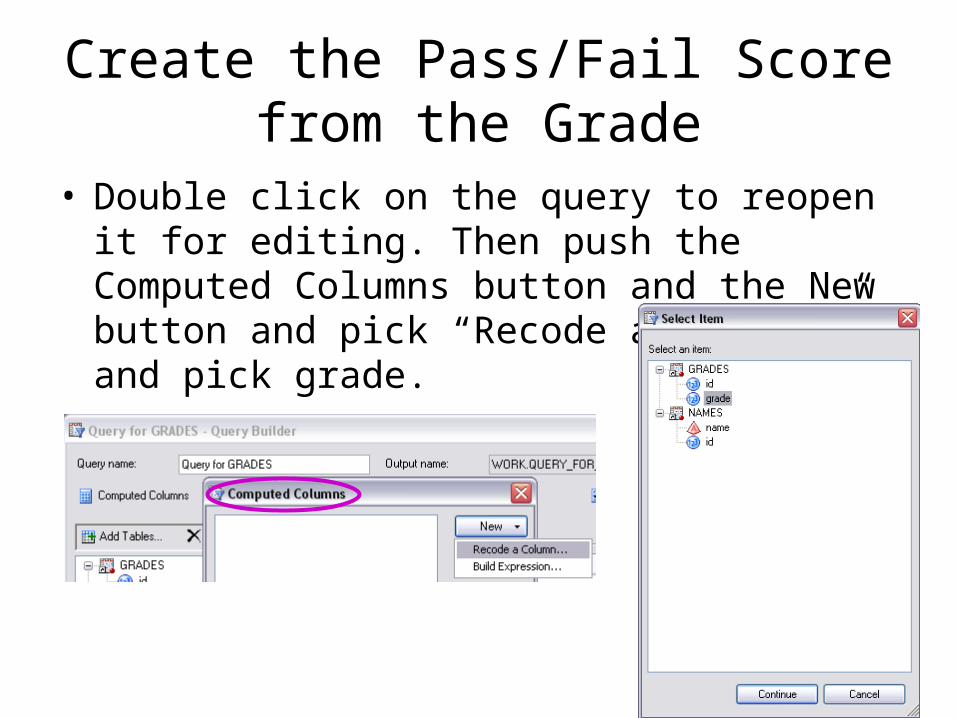
Create the Pass/Fail Score from the Grade
• Double click on the query to reopen it for editing. Then push the Computed Columns button and the New button and pick “Recode a Column…” and pick grade.
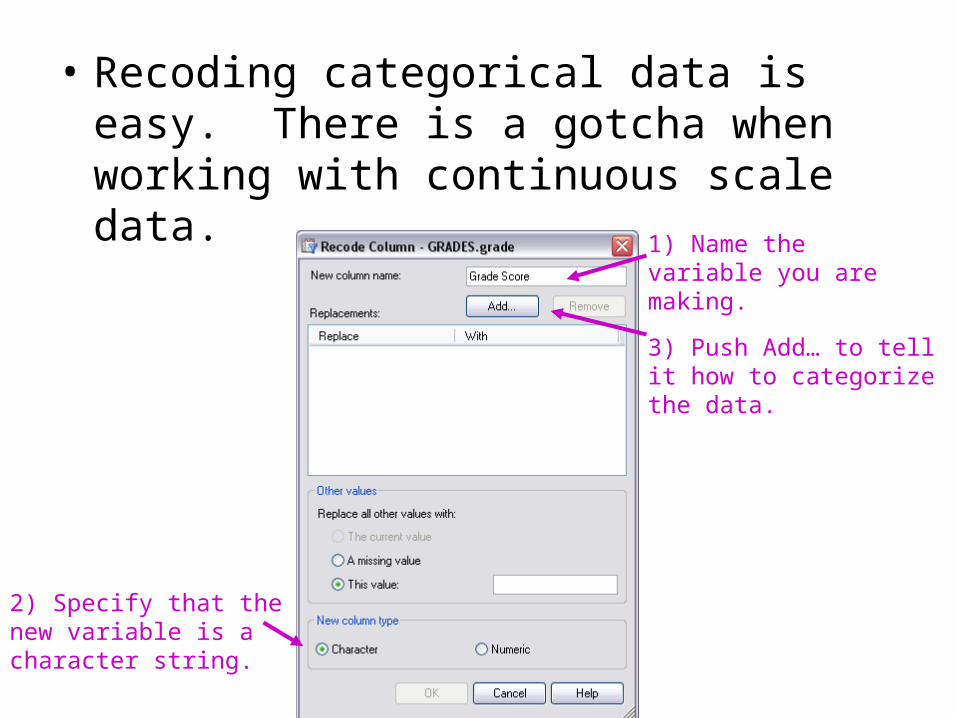
• Recoding categorical data is easy. There is a gotcha when working with continuous scale data.
1) Name the variable you are making.
2) Specify that the new variable is a character string.
3) Push Add… to tell it how to categorize the data.
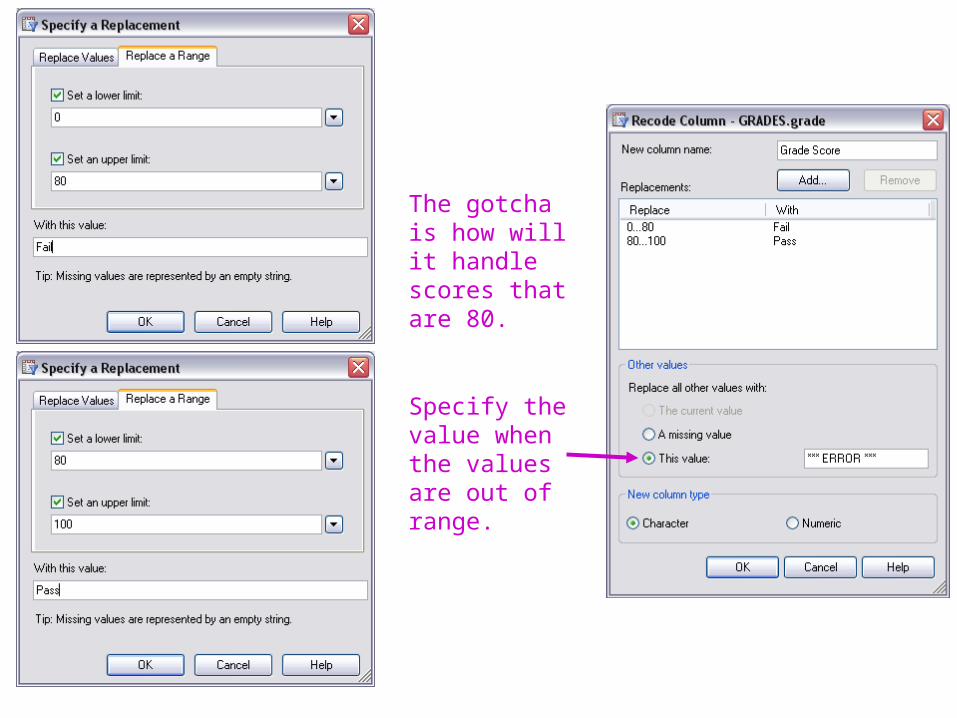
The gotcha is how will it handle scores that are 80.
Specify the value when the values are out of range.
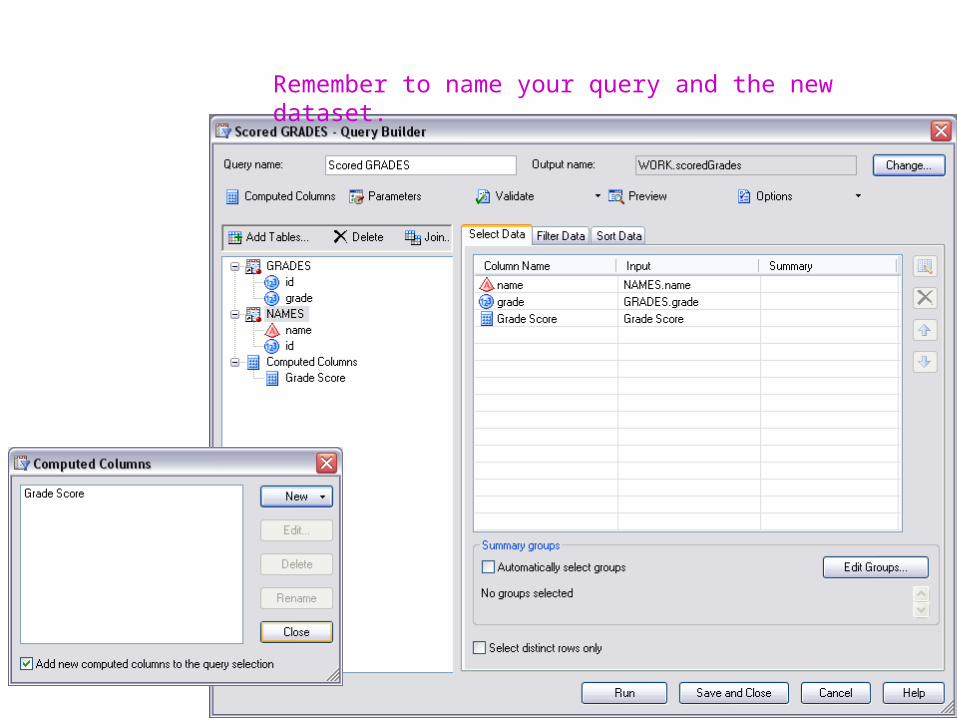
Remember to name your query and the new dataset.
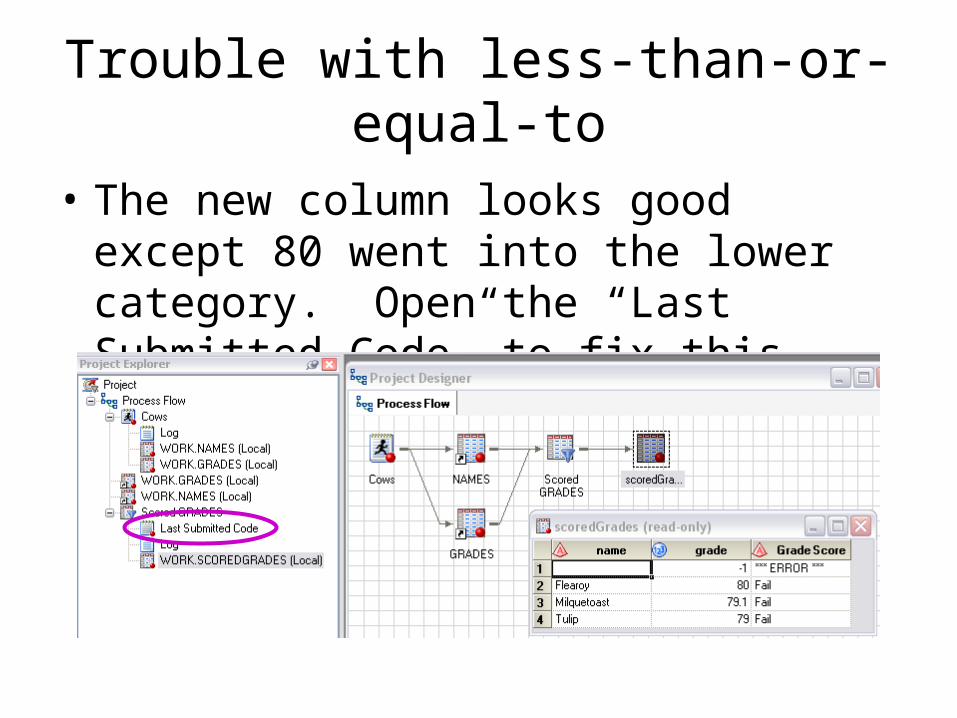
Trouble with less-than-or-equal-to
• The new column looks good except 80 went into the lower category. Open the “Last Submitted Code” to fix this.
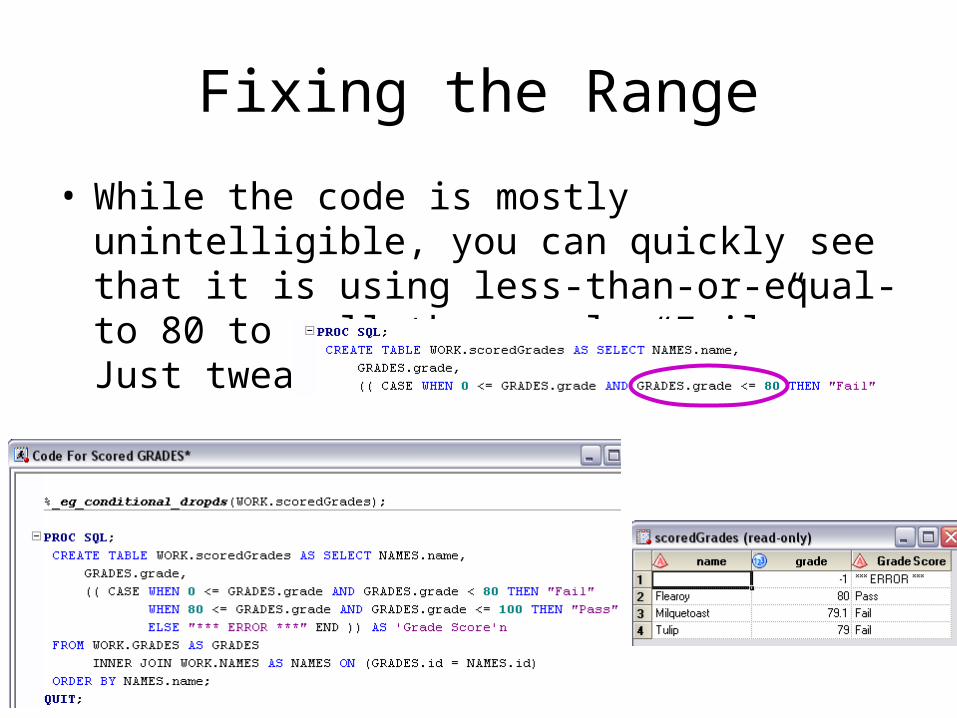
Fixing the Range
• While the code is mostly unintelligible, you can quickly see that it is using less-than-or-equal-to 80 to call the sample “Fail”. Just tweak it to less-than.


