Point Nasa Shopping Center Retail For Lease [email protected][email protected]713.568.5500 713.568.5500 For more Information: Simon Ha Daniel Hollek 5 9 0 9 W E S T L O O P S O U T H S T E . 6 8 0 • B E L L A I R E , T E X A S 7 7 4 0 1 • 7 1 3 . 5 6 8 . 5 5 0 0 1020 W Nasa Rd 1 Webster, Texas 77598 $24 PSF NNNs - $5.50 PSF
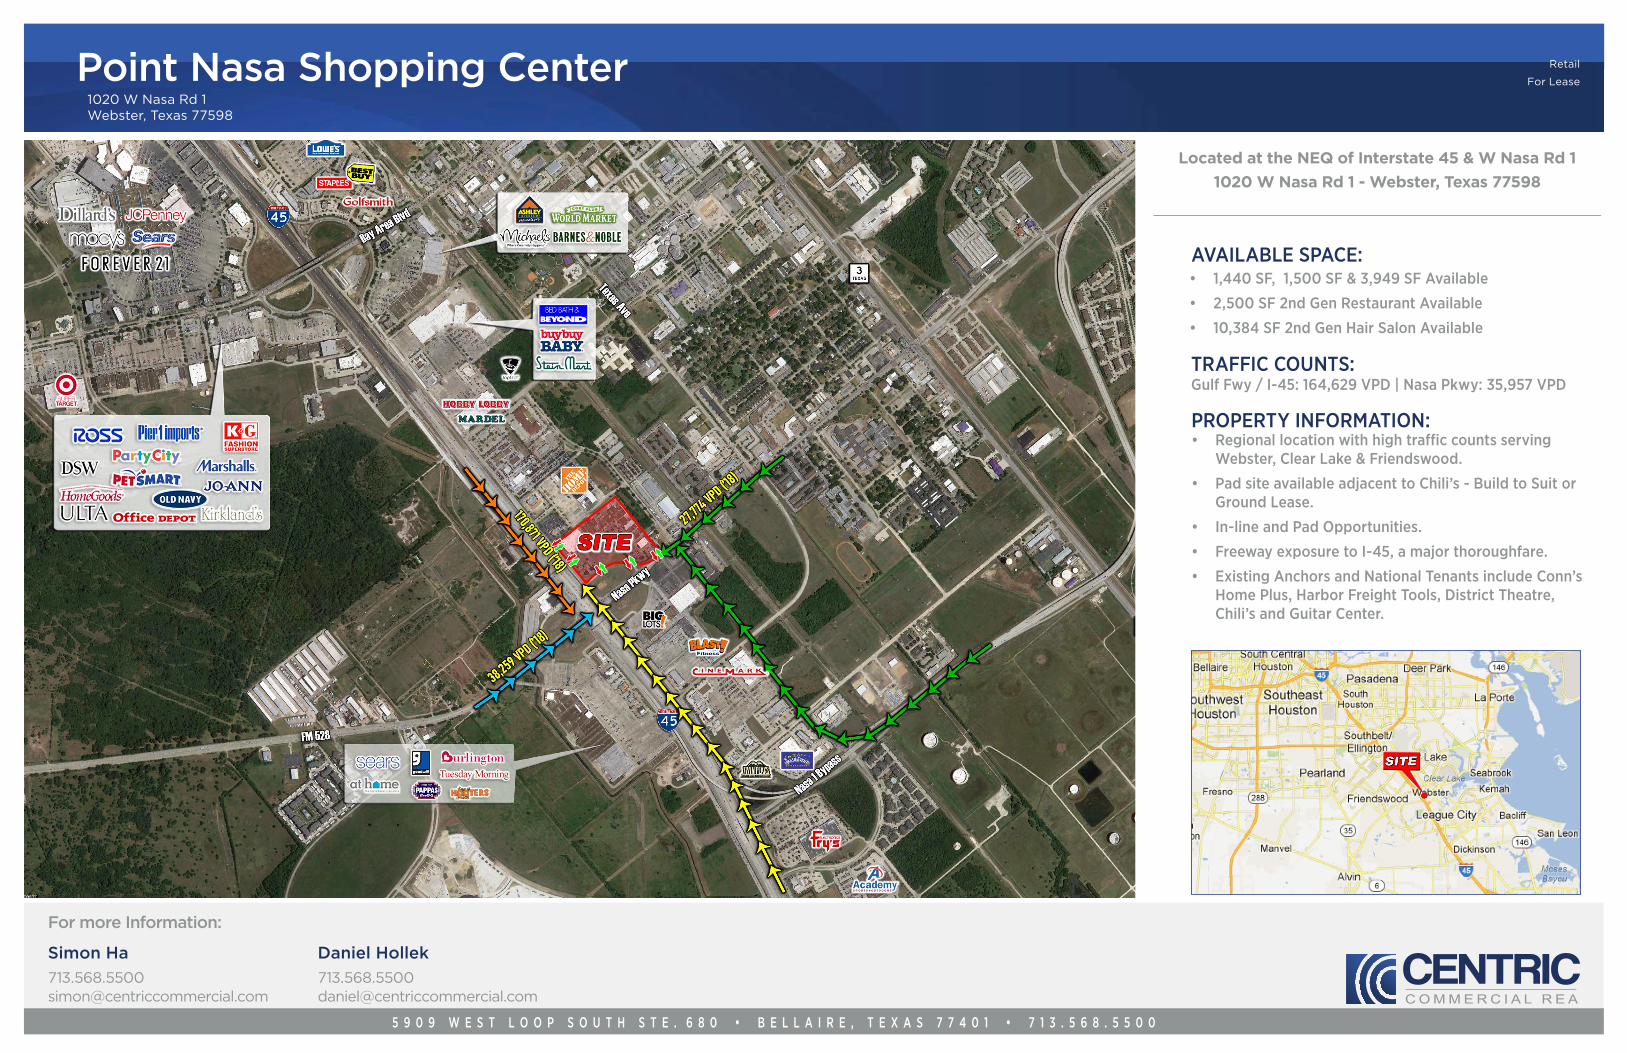
For LeasePoint Nasa Shopping Center1020 W Nasa Rd 1Webster, Texas 77598
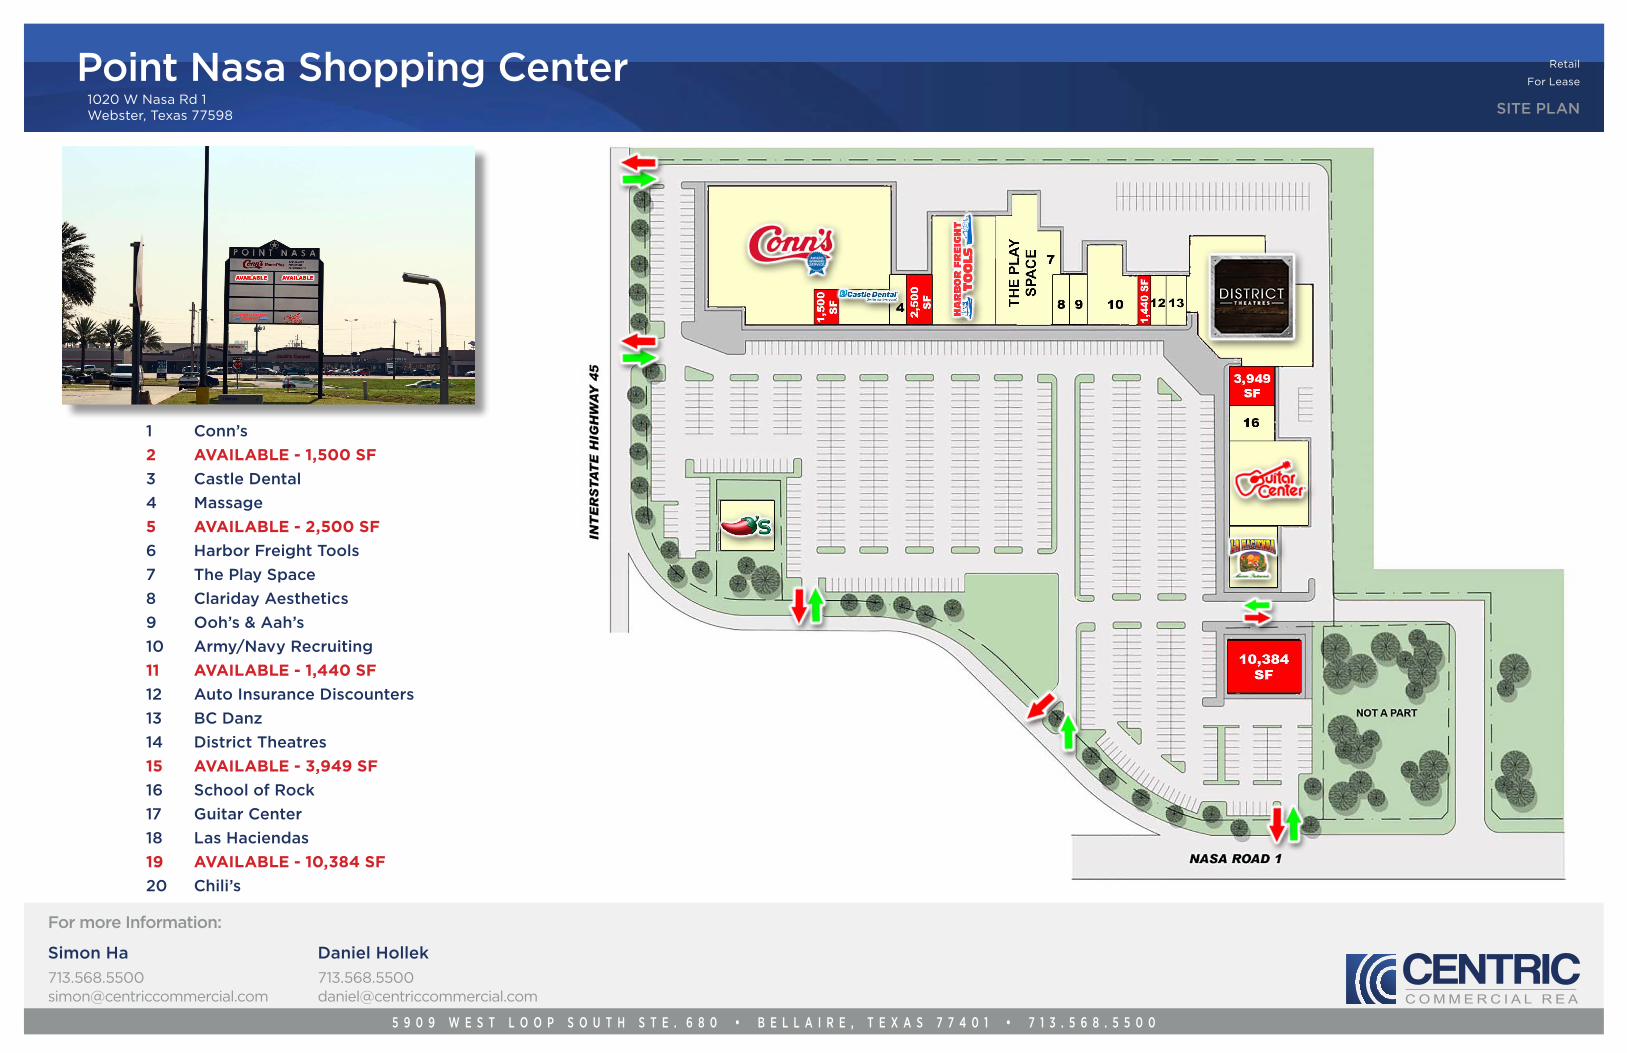
1 Conn’s2 AVAILABLE - 1,500 SF3 Castle Dental4 Massage5 AVAILABLE - 2,500 SF6 Harbor Freight Tools7 The Play Space8 Clariday Aesthetics9 Ooh’s & Aah’s10 Army/Navy Recruiting11 AVAILABLE - 1,440 SF12 Auto Insurance Discounters13 BC Danz14 District Theatres15 AVAILABLE - 3,949 SF16 School of Rock17 Guitar Center18 Las Haciendas19 AVAILABLE - 10,384 SF20 Chili’s
Data Note: Household population includes persons not residing in group quarters. Average Household Size is the household population divided by total households. Persons in families include the householder and persons related to the householder by birth, marriage, or adoption. Per Capita Income represents the income received by all persons aged 15 years and over divided by the total population.Source: U.S. Census Bureau, Census 2010 Summary File 1. Esri forecasts for 2019 and 2024 Esri converted Census 2000 data into 2010 geography.
Data Note: Household population includes persons not residing in group quarters. Average Household Size is the household population divided by total households. Persons in families include the householder and persons related to the householder by birth, marriage, or adoption. Per Capita Income represents the income received by all persons aged 15 years and over divided by the total population.Source: U.S. Census Bureau, Census 2010 Summary File 1. Esri forecasts for 2019 and 2024 Esri converted Census 2000 data into 2010 geography.
Data Note: Income represents the preceding year, expressed in current dollars. Household income includes wage and salary earnings, interest dividends, net rents, pensions, SSI and welfare payments, child support, and alimony. Source: U.S. Census Bureau, Census 2010 Summary File 1. Esri forecasts for 2019 and 2024 Esri converted Census 2000 data into 2010 geography.
Data Note: Income represents the preceding year, expressed in current dollars. Household income includes wage and salary earnings, interest dividends, net rents, pensions, SSI and welfare payments, child support, and alimony. Source: U.S. Census Bureau, Census 2010 Summary File 1. Esri forecasts for 2019 and 2024 Esri converted Census 2000 data into 2010 geography.
Data Note: Household population includes persons not residing in group quarters. Average Household Size is the household population divided by total households. Persons in families include the householder and persons related to the householder by birth, marriage, or adoption. Per Capita Income represents the income received by all persons aged 15 years and over divided by the total population.Source: U.S. Census Bureau, Census 2010 Summary File 1. Esri forecasts for 2019 and 2024 Esri converted Census 2000 data into 2010 geography.
Data Note: Income represents the preceding year, expressed in current dollars. Household income includes wage and salary earnings, interest dividends, net rents, pensions, SSI and welfare payments, child support, and alimony. Source: U.S. Census Bureau, Census 2010 Summary File 1. Esri forecasts for 2019 and 2024 Esri converted Census 2000 data into 2010 geography.
Information About Brokerage ServicesTexas law requires all real estate license holders to give the following informaƟon about
brokerage services to prospecƟve buyers, tenants, sellers and landlords.
TYPES OF REAL ESTATE LICENSE HOLDERS: .• A BROKER is responsible for all brokerage acƟviƟes, including acts performed by sales agents sponsored by the broker. • A SALES AGENT must be sponsored by a broker and works with clients on behalf of the broker.
A BROKER’S MINIMUM DUTIES REQUIRED BY LAW (A client is the person or party that the broker represents): • Put the interests of the client above all others, including the broker’s own interests; • Inform the client of any material informaƟon about the property or transacƟon received by the broker; • Answer the client’s quesƟons and present any offer to or counter-offer from the client; and • Treat all parƟes to a real estate transacƟon honestly and fairly.
A LICENSE HOLDER CAN REPRESENT A PARTY IN A REAL ESTATE TRANSACTION:
AS AGENT FOR OWNER (SELLER/LANDLORD): The broker becomes the property owner's agent through an agreement with the owner, usually in a wriƩen lisƟng to sell or property management agreement. An owner's agent must perform the broker’s minimum duƟes above and must inform the owner of any material informaƟon about the property or transacƟon known by the agent, including informaƟon disclosed to the agent or subagent by the buyer or buyer’s agent.
AS AGENT FOR BUYER/TENANT: The broker becomes the buyer/tenant's agent by agreeing to represent the buyer, usually through a wriƩen representaƟon agreement. A buyer's agent must perform the broker’s minimum duƟes above and must inform the buyer of any material informaƟon about the property or transacƟon known by the agent, including informaƟon disclosed to the agent by the seller or seller’s agent.
AS AGENT FOR BOTH - INTERMEDIARY: To act as an intermediary between the parƟes the broker must first obtain the wriƩen agreement of each party to the transacƟon. The wriƩen agreement must state who will pay the broker and, in conspicuous bold or underlined print, set forth the broker's obligaƟons as an intermediary. A broker who acts as an intermediary:
• Must treat all parƟes to the transacƟon imparƟally and fairly; • May, with the parƟes' wriƩen consent, appoint a different license holder associated with the broker to each party (owner and
buyer) to communicate with, provide opinions and advice to, and carry out the instrucƟons of each party to the transacƟon. • Must not, unless specifically authorized in wriƟng to do so by the party, disclose:
ᴑ that the owner will accept a price less than the wriƩen asking price; ᴑ that the buyer/tenant will pay a price greater than the price submiƩed in a wriƩen offer; and ᴑ any confidenƟal informaƟon or any other informaƟon that a party specifically instructs the broker in wriƟng not to
disclose, unless required to do so by law.
AS SUBAGENT: A license holder acts as a subagent when aiding a buyer in a transacƟon without an agreement to represent the buyer. A subagent can assist the buyer but does not represent the buyer and must place the interests of the owner first.
TO AVOID DISPUTES, ALL AGREEMENTS BETWEEN YOU AND A BROKER SHOULD BE IN WRITING AND CLEARLY ESTABLISH: • The broker’s duƟes and responsibiliƟes to you, and your obligaƟons under the representaƟon agreement. • Who will pay the broker for services provided to you, when payment will be made and how the payment will be calculated.
LICENSE HOLDER CONTACT INFORMATION: This noƟce is being provided for informaƟon purposes. It does not create an obligaƟon for you to use the broker’s services. Please acknowledge receipt of this noƟce below and retain a copy for your records.
Licensed Broker /Broker Firm Name or Primary Assumed Business Name
License No. Email Phone
Designated Broker of Firm License No. Email Phone
Licensed Supervisor of Sales Agent/Associate
License No. Email Phone
Sales Agent/Associate’s Name License No. Email Phone
Regulated by the Texas Real Estate Commission
Buyer/Tenant/Seller/Landlord Initials
InformaƟon available at www.trec.texas.gov IABS 1-0