Ontario Health Technology Assessment Series 2009; Vol. 9 No. 12 Point-of-Care International Normalized Ratio (INR) Monitoring Devices for Patients on Long-term Oral Anticoagulation Therapy An Evidence-Based Analysis September 2009 Medical Advisory Secretariat Ministry of Health and Long-Term Care Presented to the Ontario Health Technology Advisory Committee June 26, 2009
Transcript
Ontario Health Technology Assessment Series 2009; Vol. 9 No. 12
Point-of-Care International Normalized Ratio (INR) Monitoring Devices for Patients on Long-term Oral Anticoagulation Therapy
An Evidence-Based Analysis
September 2009
Medical Advisory Secretariat Ministry of Health and Long-Term Care
Presented to the Ontario Health Technology Advisory Committee June 26, 2009
Suggested Citation
This report should be cited as follows: Medical Advisory Secretariat. Point-of-care international normalized ratio (INR) monitoring devices for patients on long-term oral anticoagulation therapy: an evidence-based analysis. Ontario Health Technology Assessment Series 2009; 9(12). Permission Requests All inquiries regarding permission to reproduce any content in the Ontario Health Technology Assessment Series should be directed to [email protected] How to Obtain Issues in the Ontario Health Technology Assessment Series All reports in the Ontario Health Technology Assessment Series are freely available in PDF format at the following URL: www.health.gov.on.ca/ohtas Print copies can be obtained by contacting [email protected] Conflict of Interest Statement All analyses in the Ontario Health Technology Assessment Series are impartial and subject to a systematic evidence-based assessment process. There are no competing interests or conflicts of interest to declare. Peer Review All Medical Advisory Secretariat analyses are subject to external expert peer review. Additionally, the public consultation process is also available to individuals wishing to comment on an analysis prior to finalization. For more information, please visit http://www.health.gov.on.ca/english/providers/program/ohtac/public_engage_overview.html Contact Information The Medical Advisory Secretariat Ministry of Health and Long-Term Care 20 Dundas Street West, 10th floor Toronto, Ontario CANADA M5G 2N6 Email: [email protected] Telephone: 416-314-1092 ISSN 1915-7398 (Online)
Point-of-Care INR Monitoring - Ontario Health Technology Assessment Series 2009; 9 (12) 2
About the Medical Advisory Secretariat The Medical Advisory Secretariat is part of the Ontario Ministry of Health and Long-Term Care. The mandate of the Medical Advisory Secretariat is to provide evidence-based policy advice on the coordinated uptake of health services and new health technologies in Ontario to the Ministry of Health and Long-Term Care and to the healthcare system. The aim is to ensure that residents of Ontario have access to the best available new health technologies that will improve patient outcomes. The Medical Advisory Secretariat also provides a secretariat function and evidence-based health technology policy analysis for review by the Ontario Health Technology Advisory Committee (OHTAC). The Medical Advisory Secretariat conducts systematic reviews of scientific evidence and consultations with experts in the health care services community to produce the Ontario Health Technology Assessment Series. About the Ontario Health Technology Assessment Series To conduct its comprehensive analyses, the Medical Advisory Secretariat systematically reviews available scientific literature, collaborates with partners across relevant government branches, and consults with clinical and other external experts and manufacturers, and solicits any necessary advice to gather information. The Medical Advisory Secretariat makes every effort to ensure that all relevant research, nationally and internationally, is included in the systematic literature reviews conducted. The information gathered is the foundation of the evidence to determine if a technology is effective and safe for use in a particular clinical population or setting. Information is collected to understand how a new technology fits within current practice and treatment alternatives. Details of the technology’s diffusion into current practice and information from practicing medical experts and industry, adds important information to the review of the provision and delivery of the health technology in Ontario. Information concerning the health benefits; economic and human resources; and ethical, regulatory, social and legal issues relating to the technology assist policy makers to make timely and relevant decisions to maximize patient outcomes. If you are aware of any current additional evidence to inform an existing Evidence-Based Analysis, please contact the Medical Advisory Secretariat: [email protected]. The public consultation process is also available to individuals wishing to comment on an analysis prior to publication. For more information, please visit http://www.health.gov.on.ca/english/providers/program/ohtac/public_engage_overview.html Disclaimer
Point-of-Care INR Monitoring - Ontario Health Technology Assessment Series 2009; 9 (12) 3
This evidence-based analysis was prepared by the Medical Advisory Secretariat, Ontario Ministry of Health and Long-Term Care, for the Ontario Health Technology Advisory Committee and developed from analysis, interpretation and comparison of scientific research and/or technology assessments conducted by other organizations. It also incorporates, when available, Ontario data, and information provided by experts and applicants to the Medical Advisory Secretariat to inform the analysis. While every effort has been made to do so, this document may not fully reflect all scientific research available. Additionally, other relevant scientific findings may have been reported since completion of the review. This evidence-based analysis is current to the date of publication. This analysis may be superseded by an updated publication on the same topic. Please check the Medical Advisory Secretariat Website for a list of all evidence-based analyses: http://www.health.gov.on.ca/ohtas
Table of Contents LIST OF ABBREVIATIONS ..............................................................................................................................................6 EXECUTIVE SUMMARY .................................................................................................................................................7 SUBJECT OF THE EVIDENCE-BASED ANALYSIS..........................................................................................................14 CLINICAL NEED: TARGET POPULATION AND CONDITION ........................................................................................14
Burden of the Condition ..........................................................................................................................................15 CURRENT STANDARD OF CARE ..................................................................................................................................18
Patient Management ................................................................................................................................................19 DESCRIPTION OF TECHNOLOGY.................................................................................................................................19 REGULATORY STATUS ................................................................................................................................................21 EVIDENCE-BASED ANALYSIS OF EFFECTIVENESS .....................................................................................................23
Research Questions .................................................................................................................................................23 Methods...................................................................................................................................................................23
Inclusion Criteria ................................................................................................................................................23 Exclusion criteria ................................................................................................................................................24 Method of Review ..............................................................................................................................................24
Assessment of Quality of Evidence.........................................................................................................................24 RESULTS OF EVIDENCE-BASED ANALYSIS.................................................................................................................26
Summary of Existing Evidence ...............................................................................................................................27 Results of the MAS Systematic Review..................................................................................................................27
Quality Assessment of Included Studies.............................................................................................................31 Studies on POC INR Monitoring: Patient Eligibility and Participation..............................................................31 Studies on POC INR Monitoring: INR Testing Frequency and Patient Training...............................................31 Anticoagulation Control .....................................................................................................................................36 Major Complications and Deaths........................................................................................................................39 Survival...............................................................................................................................................................46 Results of Subgroup Analyses ............................................................................................................................46
Patient Satisfaction and Quality of Life ..................................................................................................................47 Ontario-based Evidence on Patient Reported Outcomes ....................................................................................48
Summary of Findings of Literature Review............................................................................................................52 Quality of the Evidence...........................................................................................................................................54
GRADE Quality of Evidence .............................................................................................................................54 ECONOMIC ANALYSIS.................................................................................................................................................56
Objective .................................................................................................................................................................56 Review of Economic Literature...............................................................................................................................56 Evaluation ...............................................................................................................................................................58
Comparators........................................................................................................................................................58 Target Population................................................................................................................................................58 Perspective & Time Horizon ..............................................................................................................................60
Modelling ................................................................................................................................................................60 Valuing Outcomes ..............................................................................................................................................63 Resource Use and Costs......................................................................................................................................63
Point-of-Care INR Monitoring - Ontario Health Technology Assessment Series 2009; 9 (12) 4
Conclusions .............................................................................................................................................................68 Health Systems Impact............................................................................................................................................68 Acknowledgments ...................................................................................................................................................69
EXISTING GUIDELINES................................................................................................................................................70 Consensus Guidelines for PST/PSM:......................................................................................................................72
ADDITIONAL CONSIDERATIONS .................................................................................................................................74 Frequency of INR monitoring and Patient Education .............................................................................................74
ONTARIO HEALTH SYSTEM IMPACT ANALYSIS ........................................................................................................76 Eligibility and Selection of Patients for PST/PSM Strategies .................................................................................76 Diffusion of the Technology ...................................................................................................................................76 Implementation Considerations...............................................................................................................................79
List of Abbreviations ACC anticoagulation clinic AF atrial fibrillation CI confidence interval HCP health care practitioner ICER incremental cost effectiveness ratio INR international normalized ratio ITT intention to treat MHV mechanical heart valve OAT oral anticoagulation therapy OR odds ratio POC point of care PSM patient self-management PST patient self-test PT prothrombin time QALY quality-adjusted life-year QoL quality of life RCT randomized controlled trial RR relative risk
Point-of-Care INR Monitoring - Ontario Health Technology Assessment Series 2009; 9 (12) 6
Executive Summary Subject of the Evidence-Based Analysis The purpose of this evidence based analysis report is to examine the safety and effectiveness of point-of-care (POC) international normalized ratio (INR) monitoring devices for patients on long-term oral anticoagulation therapy (OAT).
Clinical Need: Target Population and Condition Long-term OAT is typically required by patients with mechanical heart valves, chronic atrial fibrillation, venous thromboembolism, myocardial infarction, stroke, and/or peripheral arterial occlusion. It is estimated that approximately 1% of the population receives anticoagulation treatment and, by applying this value to Ontario, there are an estimated 132,000 patients on OAT in the province, a figure that is expected to increase with the aging population. Patients on OAT are regularly monitored and their medications adjusted to ensure that their INR scores remain in the therapeutic range. This can be challenging due to the narrow therapeutic window of warfarin and variation in individual responses. Optimal INR scores depend on the underlying indication for treatment and patient level characteristics, but for most patients the therapeutic range is an INR score of between 2.0 and 3.0. The current standard of care in Ontario for patients on long-term OAT is laboratory-based INR determination with management carried out by primary care physicians or anticoagulation clinics (ACCs). Patients also regularly visit a hospital or community-based facility to provide a venous blood samples (venipuncture) that are then sent to a laboratory for INR analysis. Experts, however, have commented that there may be under-utilization of OAT due to patient factors, physician factors, or regional practice variations and that sub-optimal patient management may also occur. There is currently no population-based Ontario data to permit the assessment of patient care, but recent systematic reviews have estimated that less that 50% of patients receive OAT on a routine basis and that patients are in the therapeutic range only 64% of the time.
Overview of POC INR Devices POC INR devices offer an alternative to laboratory-based testing and venipuncture, enabling INR determination from a fingerstick sample of whole blood. Independent evaluations have shown POC devices to have an acceptable level of precision. They permit INR results to be determined immediately, allowing for more rapid medication adjustments. POC devices can be used in a variety of settings including physician offices, ACCs, long-term care facilities, pharmacies, or by the patients themselves through self-testing (PST) or self-management (PSM) techniques. With PST, patients measure their INR values and then contact their physician for instructions on dose adjustment, whereas with PSM, patients adjust the medication themselves based on pre-set algorithms. These models are not suitable for all patients and require the identification and education of suitable candidates.
Point-of-Care INR Monitoring - Ontario Health Technology Assessment Series 2009; 9 (12) 7
Potential advantages of POC devices include improved convenience to patients, better treatment compliance and satisfaction, more frequent monitoring and fewer thromboembolic and hemorrhagic complications. Potential disadvantages of the device include the tendency to underestimate high INR values and overestimate low INR values, low thromboplastin sensitivity, inability to calculate a mean normal PT, and errors in INR determination in patients with antiphospholipid antibodies with certain instruments. Although treatment satisfaction and quality of life (QoL) may improve with POC INR monitoring, some patients may experience increased anxiety or preoccupation with their disease with these strategies.
Evidence-Based Analysis Methods Research Questions 1. Effectiveness
Does POC INR monitoring improve clinical outcomes in various settings compared to standard laboratory-based testing?
Does POC INR monitoring impact patient satisfaction, QoL, compliance, acceptability, convenience compared to standard laboratory-based INR determination?
Settings include primary care settings with use of POC INR devices by general practitioners or nurses, ACCs, pharmacies, long-term care homes, and use by the patient either for PST or PSM. 2. Cost-effectiveness
What is the cost-effectiveness of POC INR monitoring devices in various settings compared to standard laboratory-based INR determination?
Inclusion Criteria
• English-language RCTs, systematic reviews, and meta-analyses • Publication dates: 1996 to November 25, 2008 • Population: patients on OAT • Intervention: anticoagulation monitoring by POC INR device in any setting including anticoagulation
clinic, primary care (general practitioner or nurse), pharmacy, long-term care facility, PST, PSM or any other POC INR strategy
• Minimum sample size: 50 patients Minimum follow-up period: 3 months • Comparator: usual care defined as venipuncture blood draw for an INR laboratory test and
management provided by an ACC or individual practitioner • Outcomes: Hemorrhagic events, thromboembolic events, all-cause mortality, anticoagulation control
as assessed by proportion of time or values in the therapeutic range, patient reported outcomes including satisfaction, QoL, compliance, acceptability, convenience
• Studies where POC INR devices were compared to laboratory testing to assess test accuracy
Point-of-Care INR Monitoring - Ontario Health Technology Assessment Series 2009; 9 (12) 8
• Studies where the POC INR results were not used to guide patient management
Method of Review A search of electronic databases (OVID MEDLINE, MEDLINE In-Process & Other Non-Indexed Citations, EMBASE, The Cochrane Library, and the International Agency for Health Technology Assessment [INAHTA] database) was undertaken to identify evidence published from January 1, 1998 to November 25, 2008. Studies meeting the inclusion criteria were selected from the search results. Reference lists of selected articles were also checked for relevant studies.
Summary of Findings Five existing reviews and 22 articles describing 17 unique RCTs met the inclusion criteria. Three RCTs examined POC INR monitoring devices with PST strategies, 11 RCTs examined PSM strategies, one RCT included both PST and PSM strategies and two RCTs examined the use of POC INR monitoring devices by health care professionals. Anticoagulation Control Anticoagulation control is measured by the percentage of time INR is within the therapeutic range or by the percentage of INR values in the therapeutic range. Due to the differing methodologies and reporting structures used, it was deemed inappropriate to combine the data and estimate whether the difference between groups would be significant. Instead, the results of individual studies were weighted by the number of person-years of observation and then pooled to calculate a summary measure. Across most studies, patients in the intervention groups tended to have a higher percentage of time and values in the therapeutic target range in comparison to control patients. When the percentage of time in the therapeutic range was pooled across studies and weighted by the number of person-years of observation, the difference between the intervention and control groups was 4.2% for PSM, 7.2% for PST and 6.1% for POC use by health care practitioners. Overall, intervention patients were in the target range 69% of the time and control patients were in the therapeutic target range 64% of the time leading to an overall difference between groups of roughly 5%. Major Complications and Deaths There was no statistically significant difference in the number of major hemorrhagic events between patients managed with POC INR monitoring devices and patients managed with standard laboratory testing (OR =0.74; 95% CI: 0.52- 1.04). This difference was non-significant for all POC strategies (PSM, PST, health care practitioner). Patients managed with POC INR monitoring devices had significantly fewer thromboembolic events than usual care patients (OR =0.52; 95% CI: 0.37 – 0.74). When divided by POC strategy, PSM resulted in significantly fewer thromboembolic events than usual care (OR =0.46.; 95% CI: 0.29 – 0.72). The observed difference in thromboembolic events for PSM remained significant when the analysis was limited to major thromboembolic events (OR =0.40; 95% CI: 0.17 – 0.93), but was non-significant when the analysis was limited to minor thromboembolic events (OR =0.73; 95% CI: 0.08 – 7.01). PST and GP/Nurse strategies did not result in significant differences in thromboembolic events, however there were only a limited number of studies examining these interventions.
Point-of-Care INR Monitoring - Ontario Health Technology Assessment Series 2009; 9 (12) 9
No statistically significant difference was observed in the number of deaths between POC intervention and usual care control groups (OR =0.67; 95% CI: 0.41 – 1.10). This difference was non-significant for all POC strategies. Only one study reported on survival with 10-year survival rate of 76.1% in the usual care control group compared to 84.5% in the PSM group (P=0.05).
Point-of-Care INR Monitoring - Ontario Health Technology Assessment Series 2009; 9 (12) 10
ES Table 1: Summary Results of Meta-Analyses of Major Complications and Deaths in POC INR Monitoring Studies
Event No. of trials (patients)
OR (M-H, Random Effects) 95% CI
Major Haemorrhages 16 (5057) 0.74 0.52 to 1.04
Thromboembolic events 16 (5057) 0.52 0.37 to 0.74
Deaths
11 (2906) 0.67 0.41 to 1.10
Patient Satisfaction and Quality of Life Quality of life measures were reported in eight studies comparing POC INR monitoring to standard laboratory testing using a variety of measurement tools. It was thus not possible to calculate a quantitative summary measure. The majority of studies reported favourable impacts of POC INR monitoring on QoL and found better treatment satisfaction with POC monitoring. Results from a pre-analysis patient and caregiver focus group conducted in Ontario also indicated improved patient QoL with POC monitoring.
Quality of the Evidence Studies varied with regard to patient eligibility, baseline patient characteristics, follow-up duration, and withdrawal rates. Differential drop-out rates were observed such that the POC intervention groups tended to have a larger number of patients who withdrew. There was a lack of consistency in the definitions and reporting for OAT control and definitions of adverse events. In most studies, the intervention group received more education on the use of warfarin and performed more frequent INR testing, which may have overestimated the effect of the POC intervention. Patient selection and eligibility criteria were not always fully described and it is likely that the majority of the PST/PSM trials included a highly motivated patient population. Lastly, a large number of trials were also sponsored by industry. Despite the observed heterogeneity among studies, there was a general consensus in findings that POC INR monitoring devices have beneficial impacts on the risk of thromboembolic events, anticoagulation control and patient satisfaction and QoL (ES Table 2).
ES Table 2: GRADE Quality of the Evidence on POC INR Monitoring Studies
Summary of Findings Quality Assessment No. of Patients
Outcome No. of
Studies Design Quality Consistency Directness Other Interv Control
Effect, OR
[95% CI] Quality
Major Hemorrhages 17 RCT Serious limitations
Consistent Direct None 2371 2686 0.74 [0.52-1.04]
Moderate
Thromboembolic Events 17 RCT Serious limitations
Consistent Direct None 2371 2686 0.52 [0.37-0.74]
Moderate
All-cause mortality 11 RCT Serious limitations
Consistent Direct None 1423 1483 0.67 [0.41–1.10]
Moderate
Anticoagulation Control (time or values in range)
13 (time in range)
12
(values in range)
RCT Serious limitations
Consistent Direct Imprecise data
When % time in therapeutic range was pooled across studies and weighted by the number of person-years of observation: Intervention patients in the target range 69% of time; control patients 64% of time, 5% overall difference
Low
QoL, self-perceived quality of care, patient satisfaction
8 RCT Serious limitations
Some inconsistencies
Direct None Appears to be beneficial impact on QoL, self-perceived quality of care and patient satisfaction with POC INR monitoring.
Low
* CI refers to confidence interval; Interv, intervention; OR, odds ratio; RCT, randomized controlled trial.
Point-of-Care INR Monitoring - Ontario Health Technology Assessment Series 2009; 9 (12) 11
Economic Analysis Using a 5-year Markov model, the health and economic outcomes associated with four different anticoagulation management approaches were evaluated:
1. Standard care: consisting of a laboratory test with a venipuncture blood draw for an INR;
2. Healthcare staff testing: consisting of a test with a POC INR device in a medical clinic comprised of healthcare staff such as pharmacists, nurses, and physicians following protocol to manage OAT;
3. PST: patient self-testing using a POC INR device and phoning in results to an ACC or family physician; and
4. PSM: patient self-managing using a POC INR device and self-adjustment of OAT according to a standardized protocol. Patients may also phone in to a medical office for guidance.
The primary analytic perspective was that of the MOHLTC. Only direct medical costs were considered and the time horizon of the model was five years - the serviceable life of a POC device. From the results of the economic analysis, it was found that POC strategies are cost-effective compared to traditional INR laboratory testing. In particular, the healthcare staff testing strategy can derive potential cost savings from the use of one device for multiple patients. The PSM strategy, however, seems to be the most cost-effective method i.e. patients are more inclined to adjust their INRs more readily (as opposed to allowing INRs to fall out of range).
Considerations for Ontario Health System Although the use of POC devices continues to diffuse throughout Ontario, not all OAT patients are suitable or have the ability to practice PST/PSM. The use of POC is currently concentrated at the institutional setting, including hospitals, ACCs, long-term care facilities, physician offices and pharmacies, and is much less commonly used at the patient level. It is, however, estimated that 24% of OAT patients (representing approximately 32,000 patients in Ontario), would be suitable candidates for PST/PSM strategies and willing to use a POC device. There are several barriers to the use and implementation of POC INR monitoring devices, including factors such as lack of physician familiarity with the devices, resistance to changing established laboratory-based methods, lack of an approach for identifying suitable patients and inadequate resources for effective patient education and training. Issues of cost and insufficient reimbursement strategies may also hinder implementation and effective quality assurance programs would need to be developed to ensure that INR measurements are accurate and precise.
Conclusions
Point-of-Care INR Monitoring - Ontario Health Technology Assessment Series 2009; 9 (12) 12
For a select group of patients who are highly motivated and trained, PSM resulted in significantly fewer thromboembolic events compared to conventional laboratory-based INR testing. No significant differences were observed for major hemorrhages or all-cause mortality. PST and GP/Nurse use of POC strategies are just as effective as conventional laboratory-based INR testing for thromboembolic events, major hemorrhages, and all-cause mortality. POC strategies may also result in better OAT control as measured by the proportion of time INR is in the therapeutic range and there appears to be beneficial impacts on patient satisfaction and QoL. The use of POC devices should factor in patient suitability, patient education and training, health system constraints, and affordability.
Keywords anticoagulants, International Normalized Ratio, point-of-care, self-monitoring, warfarin.
Point-of-Care INR Monitoring - Ontario Health Technology Assessment Series 2009; 9 (12) 13
Subject of the Evidence-Based Analysis The purpose of this evidence based analysis report is to examine the safety and effectiveness of point-of-care (POC) international normalized ratio (INR) monitoring devices for patients on long-term oral anticoagulation therapy (OAT).
Clinical Need: Target Population and Condition A number of clinical conditions are linked to an increased risk of thrombosis and require long-term OAT with coumarin derivatives. Typically, long-term OAT is required for patients with mechanical heart valves (MHV), chronic atrial fibrillation (AF), venous thromboembolism, acute myocardial infarction, stroke, and/or peripheral arterial occlusion. While long-term treatment is commonly defined as a period of at least 3 months, the majority of these patients are maintained on OAT for the rest of their lives. Warfarin, a vitamin K antagonist, is the most commonly prescribed oral anticoagulant in North America. (1) Another vitamin K antagonist, nicoumalone, is also available in Canada, but used much less frequently. Phenprocoumon and acenocoumarol are common oral anticoagulants used in Europe. Vitamin K antagonists function by inhibiting the synthesis of several vitamin K dependent clotting factors (II, VII, IX and X) and by blocking the synthesis of coagulation inhibitors (Proteins C and S). This ultimately leads to a decreased formation of thrombin and fibrin. (2-4) Patients taking oral anticoagulants are frequently monitored and medications are adjusted to ensure that the ‘prothrombin time’ (PT) remains in the correct therapeutic range, which is measured in terms of an INR score. Prothrombin time is the time, in seconds, taken for blood to clot when it is mixed with a fixed amount of thromboplastin and calcium. Optimizing the patient’s time in the correct INR therapeutic range can be a challenge due to the narrow therapeutic range of coumarin derivates, variation in individual responses to OAT, and variation within an individual over time due to factors such as changes in co-morbid conditions, medications. and diet. (3;5),(6) OAT management is thus a labour intensive process involving frequent monitoring and patient-physician contact. In making the decision to initiate OAT, the tradeoffs of benefits and risks must be considered. The major side effect of OAT is the risk of bleeding, which must be assessed against the potential benefit of clot prevention on a patient by patient basis. (6) Other disadvantages associated with OAT include numerous drug and diet interactions, the need for frequent venipuncture for monitoring INR, and complex dose adjustments for patients undergoing surgery. (2) Recent research has indicated that genetic factors also play a role in individual responses to OAT. Some genetic polymorphisms are associated with an increased risk of hemorrhage, while other mutations are likely to be the cause of hereditary warfarin resistance. These mutations occur in various ethnic populations with different frequencies and partially account for the difference in OAT doses required to maintain a therapeutic INR. (2)
Point-of-Care INR Monitoring - Ontario Health Technology Assessment Series 2009; 9 (12) 14
Optimal INR scores depend on the underlying treatment indications and patient level characteristics. (6) For most patients on OAT, such as those with AF, venous thrombosis or pulmonary embolism, the therapeutic INR range is between 2.0 and 3.0. A higher range of 2.5 to 3.5 INR units is typically recommended for MHV patients, however, there is no universal agreement on the optimal range for the various indications since data are incomplete. European experts, for example, usually recommend higher ranges for patients with MHV than do experts from North America. (2;7) According to the recent
guidelines by the American College of Chest Physicians (2), a lower INR (1.5 – 2.0) may be preferable in the primary prevention of myocardial infarction in high risk patients and in the treatment of patients with venous thrombosis who have received 6 months of full-dose treatment. The group also commented that the optimal range for patients with MHV has yet to be determined, although there is evidence that such patients do not require the high INR thresholds (2.5 – 3.5) previously used. (2) The benefits of OAT are not always achieved because of poor patient compliance and dose management. Several studies have reported that the INR values of patients on OAT fall outside the therapeutic range up to 80% of the time. (8) Generally, an INR score less than 2.0 increases the risk of thromboembolic events, while an INR score greater than 4.5 increases the risk of hemorrhagic events. (9) A recent meta-analysis reported that at INR values of 3 to 5, the relative risk of hemorrhage was 2.7 (95% C.I. 1.8-3.9; p < 0.01) and at ratios greater than 5, the risk of hemorrhage was 21.8 (95% C.I. 12.1-39.4; p < 0.01). The risk of thromboembolic events increased significantly at ratios of less than 2, with a relative risk of 3.5 (95% C.I. 2.8-4.4; p < 0.01). (10) Another study by van Walraven et al. (11), estimated the burden of potentially avoidable anticoagulant-associated hemorrhagic and thromboembolic events in the elderly using administrative databases in Eastern Ontario. They reported that critically high anticoagulation intensity explained 25.5% of all serious complications and that subtherapeutic INR values were responsible for 11% of all thromboembolic events in the anticoagulated population. This means that if subtherapeutic INRs were eradicated in this population, 1 of every 10 anticoagulation-associated thromboembolic events could be avoided. As mentioned, evidence concerning the optimal range for patients with MHV is lacking. Evidence also remains weak in the fields of pediatric thrombosis and thrombosis in pregnancy. (3;12) Although new OAT medications are currently being developed that will not require regular INR monitoring, some unintended adverse effects have arisen during clinical trials. (13) It is, therefore, unlikely that current oral anticoagulants will be replaced by new drugs in the near future.
Burden of the Condition Clinical experts have estimated that approximately 1% of the population receives anticoagulation treatment for prophylaxis and treatment of thrombosis. (14) If this estimate is applied to Ontario, this equates to approximately 132,000 patients. Drug benefit claims data from the Ontario Public Drugs Program has also shown a trend towards an increase in the number of claims for OAT. Although this data source only captures information on patients who are eligible to receive drug benefits which includes people 65 years of age and older, residents of long-term care homes, residents of Homes for Special Care, people receiving professional services under the Home Care program, Trillium Drug Program registrants and recipients of social assistance, it further illustrates the burden of this health state. In Ontario, in fiscal year 2007/08, there were over 176,000 claims for OAT, most of which were for warfarin, and over the last five years, the average number of claims for OAT was over 163,000 (Figure 1). Further, in fiscal year 2007/08, there were roughly 70,000 claims for long-term use of anticoagulants1 by patients covered under the Ontario Public Drugs Program (Figure 2). An aging population, combined with newer indications for long term OAT, particularly AF, as well as the primary prevention of ischemic heart disease and long-term prevention of recurrent venous thromboembolism are expected to increase these estimates significantly. A recent UK study estimated that the growth rate of patients on OAT was 11% per annum. The authors also predicted that the number of OAT patients would eventually double. (15)
Point-of-Care INR Monitoring - Ontario Health Technology Assessment Series 2009; 9 (12) 15
1 This estimate also includes a small number of claims for parenteral drugs such as heparin.
129,255
204,982
176,442154,588
152,636
0
50000
100000
150000
200000
250000
FY 03/04 FY 04/05 FY 05/06 FY 06/07 FY 07/08
num
ber o
f cla
ims
Five Year Average of OVKA claims - 163,581
Source: Ontario Public Drug Programs, Ontario Ministry of Health and Long-term Care, January 2009 *Data limitation: only includes claims submitted by pharmacies for patients eligible to receive drug benefits
Point-of-Care INR Monitoring - Ontario Health Technology Assessment Series 2009; 9 (12) 16
Figure 1: Ontario Public Drug Programs: Claims Data for Oral Vitamin K Antagonists, FY03/04 to FY07/08
Point-of-Care INR Monitoring - Ontario Health Technology Assessment Series 2009; 9 (12) 17
53,116
84,106
61,092
69,770
62,573
0
10,000
20,000
30,000
40,000
50,000
60,000
70,000
80,000
90,000
FY 03/04 FY 04/05 FY 05/06 FY 06/07 FY 07/08
num
ber o
f cla
ims
Five Year Average of Long-Term Anticoagulant Claims -66,131
Source: Ontario Public Drug Programs, Ontario Ministry of Health and Long-term Care, January 2009 *Long-term refers to a period of greater than or equal to 90 days † Data limitation: only includes claims submitted by pharmacies for patients eligible to receive drug benefits, not limited to OVKA (includes small number of parenteral drugs) Figure 2 – Ontario Public Drug Programs – Long-term* Claims Data for Anticoagulants, FY 03/04 to FY 07/08
Current Standard of Care The current standard of care in Ontario for patients on long-term OAT is laboratory-based INR determination wherein patients visit a hospital or community-based facility to provide venous blood samples (venipuncture) that are then sent to a laboratory for analysis. In fiscal year 2006/07, approximately 2.97 million INR tests were performed in hospital laboratories and 2.49 million in community-based facilities in Ontario, at a cost of $6.20 each (code L445). As in the rest of Canada, patients on OAT in Ontario are traditionally managed by their primary care physician. With this model of care, patients must regularly visit a laboratory for INR determination. There is thus a time delay between the collection of blood samples and the availability of results to the physician who then contacts the patient for adjustments in medication dose. Anticoagulation clinics (ACC) constitute a second model of care for OAT management. These clinics are designed to coordinate and optimize the delivery of OAT, an approach that has been well established in several countries though only a few ACCs operate in Ontario. Patients on OAT may also be managed by a pharmacist, but this model of care is much less common. All of the above models may be inconvenient and time-consuming for the patient. Further, information that is conveyed to the patient by the health care professional may be prone to misinterpretation, especially since instructions on dose adjustments are frequently discussed over the phone. (16) The potential inconvenience could result in decreased compliance by patients with scheduled INR testing, which may, in turn, result in prolonged periods of time where INR values fall outside the therapeutic range. (17) A recent systematic review including 67 randomized and cohort studies examined the effect of study setting on anticoagulation control. Through metaregression modeling, the authors found that study setting had the greatest effect on anticoagulation control with studies in community practices having significantly lower control than either anticoagulation clinics or clinical trials (-12.2%; 95% CI, -19.5 to -4.8; p < 0.0001). (18) A Canadian RCT by Wilson et al. (19) found similar results when comparing OAT management by family physicians to ACCs, but reported that the differences in OAT management were relatively modest. The long-term care setting also has a large number of patients on OAT. Based on an informal survey of 9 Ontarian facilities, approximately 14% of long-term care residents are on OAT (range 10% – 21%). In this setting, the facility and laboratory establish a contract and a laboratory technician is sent to perform blood draws. Most facilities only have laboratory services one day per week and there may be problems in obtaining results in a timely fashion, but there is a wide range of services across the province. Venipuncture in elderly residents is not always possible and some residents refuse venipuncture (e.g. dementia patients or resistive patients). The rechecking of high INR values or missing INR tests usually has to wait until the next laboratory visit. The current system is also problematic when new residents on OAT are admitted to long-term facility on weekends when laboratory services are not available. Within these traditional models for OAT patient management, computerized algorithms have been developed to assist and guide warfarin dosing. Different programs are available, but a common element is the basic function of calculating whether a dose adjustment is necessary from a user-defined table of trend rules for each therapeutic range. Programs are also commonly used to calculate the time to the next INR test by using a set of variables comparing the current INR, the interval from the last test, the number of previous changes, and the number of previous INR values within the target range. (2)
Point-of-Care INR Monitoring - Ontario Health Technology Assessment Series 2009; 9 (12) 18
Patient Management Ontario experts have commented that there may be under-utilization of OAT in Ontario due to patient factors, physician factors, and regional practice variations. For example, there may be a fear of bleeding complications or patients may see the need for frequent blood sampling to monitor INR as a major inconvenience. Nevertheless, no reliable Ontario data presently exists to assess the magnitude of this phenomenon or to explore its underlying causes. A second theme that arises when examining the current standard of care for patients on OAT in Ontario is related to suboptimal patient management. Although there is no population-based Ontario data on the proportion of OAT patients who are within the therapeutic INR range, some studies have attempted to quantify this proportion in defined populations. Gladstone et al. (20) analyzed data from the Registry of the Canadian Stroke Network, which includes 12 designated stroke centers in Ontario. The authors examined patients admitted with acute ischemic stroke and who have a known history of AF from 2003 to 2007. Among patients admitted with a first-ever stroke with known AF, 29% were not taking any antithrombotic medications prior to admission. Of the 40% of patients taking warfarin preadmission, 72% had a subtherapeutic INR at the time of stroke admission. In stroke patients with a history of AF and a previous transient ischemic attack or ischemic stroke, 15% were not taking any antithrombotic medications prior to admission. Of the 57% of patients taking warfarin preadmission, 68% had a subtherapeutic INR at the time of stroke admission. The authors concluded that most high-risk patients with AF admitted with a stroke and who were candidates for OAT were either not taking warfarin or were subtherapeutic at the time of stroke. Another study conducted a chart review of long-term care residents in the Hamilton area. (21) The authors found that INR values were in therapeutic range 54% of time, subtherapeutic 35% of time, and above the therapeutic range 11% of the time. The authors concluded that anticoagulation control was not optimal in this population. The findings from these Ontario studies are consistent with what has been reported in the literature. Voller et al. (22) estimated that less that 50% of patients receive OAT on a routine basis. Further, a systematic review of 67 studies conducted by van Walvaren et al. (18) found that OAT patients were in the therapeutic range only 63.6% of the time.
Description of Technology POC devices are now available for monitoring the INR values of patients on OAT. These portable devices allow for the determination of INR results from a fingerstick sample of whole blood. Operation of the devices involves placing a drop of blood on a test strip, which is inserted into the monitor; the results are then displayed on-screen. In this manner, POC devices permit INR results to be determined immediately without a visit to a laboratory and without the need for venipuncture. This enables the immediate adjustment of OAT following testing. The device works by measuring thromboplastin-mediated clotting time, which is then converted to a plasma PT equivalent by a microprocessor and expressed as a PT or INR value. The devices have shown satisfactory evaluations with acceptable precision and comparable INR values across the therapeutic range. Such evaluations of POC INR devices have also demonstrated good performance in terms of accuracy, reproducibility, and long term reliability. (1;2;23)
Point-of-Care INR Monitoring - Ontario Health Technology Assessment Series 2009; 9 (12) 19
POC devices can be used in a variety of settings including physician offices, ACCs, long-term care facilities, pharmacies or patients’ homes. Devices that are intended for use by health care professionals are generally more complex and have larger data storage capacities allowing patients’ identification characteristics to be entered and stored with the result. The devices also typically have an interface that permits connection to a computer or printer, anticoagulant dosing program, data management packages, or institutional information systems. In comparison, devices that are intended for patient use have a smaller data storage capacity and fewer operator dependent steps (Table 1). With patient POC devices, patients can measure their INR values at home and then contact their physician to obtain instructions for medication dose adjustment. This strategy is termed patient self-testing (PST). Patients can also measure their INR values and then adjust their medication dose themselves based on pre-set algorithms, a strategy termed patient self-management (PSM). Nevertheless, these two patient centered strategies are not suitable for all patients on OAT and require the identification and education of suitable candidates. (23) In terms of INR testing frequency, weekly INR testing is often encouraged with the patient POC models in comparison to a monthly testing schedule with standard laboratory INR determination. More frequent testing may occur in long-term care settings. As mentioned, although education and training are integral components of PST and PSM strategies, there are no standardized programs. There are, however, some consensus guidelines such as the International Self-Monitoring Association for Oral Anticoagulation, which has noted that the content of the training program is dependent on whether the patient is self-testing or self-monitoring. (5) For PST, patient education is focused on practical skills that enable patients to achieve accurate INR results, including operation of the monitoring device and the finger-pricking technique. For PSM, more in-depth patient training is needed since patients must learn to test and report INR data, as well as to respond appropriately to required dose changes. Medical supervision of the patient must be continued by regular consultation with the training centre or physician, even when there are no complications. Potential advantages of POC devices include improved convenience to patients, better treatment compliance and satisfaction, more frequent monitoring, and fewer thromboembolic and hemorrhagic events. (9) POC devices may also prevent dosing errors resulting from misinterpretation of information conveyed by the physician or delays in contacting the patient. POC devices may be particularly useful for patients without ready access to laboratories, frequent travelers and those with difficulties with venous blood collection. (16) Venipuncture is frequently difficult in children and studies have demonstrated that POC devices can be used in this population. (12) Lastly, POC INR monitoring allows consistency of testing as INR is determined by a single system. The major limitations of POC devices are that they tend to underestimate high INR values and overestimate low INR values, have low thromboplastin sensitivity, are unable to calculate a mean normal PT, and certain instruments result in errors in patients with antiphospholipid antibodies. (1),(2) Another potential disadvantage with PST or PSM strategies is that less professional guidance may result in poorer regulation of OAT. (24) Although treatment satisfaction and quality of life (QoL) may improve with POC INR monitoring, some patients may experience increased anxiety or preoccupation with their disease with these strategies. (24),(25) It should also be noted that quality assurance for POC INR devices is necessary to ensure that INR results are reliable. This may be in the form of an internal quality control (normally supplied by the manufacturer) where the patient performs a test with a known value. Alternatively, external quality controls provided by independent organizations can be used to collect results in order to compare the performance of POC INR devices with other users.
Point-of-Care INR Monitoring - Ontario Health Technology Assessment Series 2009; 9 (12) 20
Point-of-Care INR Monitoring - Ontario Health Technology Assessment Series 2009; 9 (12) 21
Regulatory Status The CoaguChek S and XS Systems, the ProTime Microcoagulation System, and the INRatio Monitor are licensed by Health Canada as Class 3 medical devices for the quantitative determination of prothrombin time from fingerstick whole blood or untreated venous whole blood and are intended for the management of patients treated with oral anticoagulants. Details of the license numbers and issue dates for these devices are listed below and their operating characteristics are summarized in Table 1. (26) COAGUCHEK S SYSTEM, License # 2361 Roche Diagnostics GMBH First issued in April 1999 Monitor sales have been discontinued, but test strips are still available. COAGUCHEK XS SYSTEM, License # 2686 Roche Diagnostics GMBH First issued in April 2006 COAGUCHEK XS PLUS SYSTEM, License # 73487 Roche Diagnostics GMBH First issued in February 2007 PROTIME 3 MICROCOAGULATION SYSTEM, License # 10919 International Technidyne Corp. First issued in August 1999 INRATIO PROTHROMBIN TIME/INR, License # 73019 Hemosense Inc. First issued in January 2007
Table 1: Characteristics of Point-of-Care INR Devices Licensed for Use in Canada
Device
CoaguChek S Roche Diagnostics GMBH
CoaguChek XS Roche Diagnostics GMBH
CoaguChek XS Plus Roche Diagnostics GMBH
ProTime 3 International Technidyne Corp
INRatio Hemosense Inc.
Target Group Patient or professional use
Patient or professional use
Professional use only
Patient or professional use
Patient or professional use
Approximate cost of monitor
n/a Device is no longer available but the manufacturer continues to supply test strips
$499 $1499 $1800 $600
Approximate cost of test strips/cuvettes
6 test strips: $50.25 24 test strips: $200.88
6 test strips: $50.25 24 test strips: $200.88
6 test strips: $50.25 24 test strips: $200.88
Box of 25 cuvettes: $145.00
12 test strips: $80.00 48 test strips: $298.00
Blood sample 10 µl of whole blood (venous or capillary)
10 µl of whole blood (venous or capillary)
10 µl of whole blood (venous or capillary)
27 µl of whole blood (venous or capillary)
15 µl of whole blood (capillary only)
Detection principle iron oxide particles/ photoreflection
30 tests with time, date, and quality control results
60 tests with time, date, and quality control results
Quality control Liquid quality control Strip integrity check Liquid, strip integrity check
Internal (2 levels) and liquid
Internal (2 levels) only
References (13;26-28)
Point-of-Care INR Monitoring - Ontario Health Technology Assessment Series 2009; 9 (12) 22
Evidence-Based Analysis of Effectiveness Research Questions 1. Effectiveness
Does POC INR monitoring improve clinical outcomes in various settings compared to standard laboratory-based testing?
Does POC INR monitoring impact patient satisfaction, QoL, compliance, acceptability, and/or convenience compared to standard laboratory-based INR determination?
2. Cost-effectiveness
What is the cost-effectiveness of POC INR monitoring devices in various settings compared to standard laboratory-based INR determination?
Note: The settings included in the analysis were primary care settings with use of POC INR devices by general practitioners or nurses, ACCs, pharmacies, long-term care facilities, and use by the patient either for PST or PSM.
Methods Inclusion Criteria Design: RCTs, systematic reviews, and meta-analyses Report: full reports only, English-language Publication Date: 1996 to November 25, 2008 Population: patients on OAT such as warfarin or other coumarin derivatives (ex., nicoumalone,
acenocoumarol or phenoprocoumon) Intervention: anticoagulation monitoring by POC INR device in any setting including:
- Anticoagulation clinic - Primary care (general practitioner or nurse) - Pharmacy - Long-term care facility - PST - PSM - or any other POC INR strategy
Minimum sample size: 50 patients Minimum follow-up period: 3 months Comparator: usual care defined as venipuncture blood draw for an INR laboratory test and
management provided by an ACC or individual practitioner Outcomes:
- Hemorrhagic events (major and minor) - Thromboembolic events (major and minor) - All-cause mortality - Anticoagulation control as assessed by proportion of time or values in the therapeutic range
Point-of-Care INR Monitoring - Ontario Health Technology Assessment Series 2009; 9 (12) 23 - Patient reported outcomes including satisfaction, QoL, compliance, acceptability, convenience
Exclusion criteria Studies that were duplicate publications (outdated by another publication by the same investigators
with the same objectives and data) Non-English articles Non-RCTs, before-after studies, quasi-experimental studies, observational studies, case reports, case
series, editorials, letters, non-systematic reviews, conference proceedings, abstracts Animal and in-vitro studies Studies where POC INR devices were compared to laboratory testing to assess test accuracy Studies where the INR results from the POC device were not used to guide patient management Studies with follow-up duration less than 3 months Studies that did not examine the outcomes of interest
Planned a priori subgroup analyses included: Setting / strategy of POC INR use Definition of usual care (ACCs, general practitioner) Indication for OAT Study quality (allocation concealment, blinded outcome assessor, Intention to treat analysis, drop out
rates, sample size) Follow-up duration Study participants’ duration on oral anticoagulation therapy Industry sponsored Country of study Device manufacturer Intensity of patient training and education Frequency of INR testing
Method of Review A search of electronic databases (OVID MEDLINE, MEDLINE In-Process & Other Non-Indexed Citations, EMBASE, The Cochrane Library, and the International Agency for Health Technology Assessment [INAHTA] database) was undertaken to identify evidence published from January 1, 1998 to November 25, 2008. The search strategy is detailed in Appendix 1. Studies meeting the inclusion criteria were selected from the search results. Data on the study characteristics, patient characteristics, details of the intervention and primary and secondary treatment outcomes were abstracted. Reference lists of selected articles were also checked for relevant studies.
Assessment of Quality of Evidence
Point-of-Care INR Monitoring - Ontario Health Technology Assessment Series 2009; 9 (12) 24
The quality of individual RCTs was assessed using a modified version of the CONSORT statement and the overall quality of the trials was examined according to the GRADE Working Group criteria. (29;29;30) According to the criteria, quality refers to factors such as the adequacy of allocation concealment, blinding and follow-up; consistency refers to the similarity of estimates of effect across studies. If there is important unexplained inconsistency in the results, confidence in the estimate of effect for that outcome decreases. Differences in the direction of effect, the size of the differences in effect and the significance of the differences, guide the decision about whether important inconsistency exists. Directness refers to the extent to which the intervention and outcome measures are similar to those of
Point-of-Care INR Monitoring - Ontario Health Technology Assessment Series 2009; 9 (12) 25
interest.
As stated by the GRADE Working Group, the following definitions were used in grading the quality of the evidence. High Further research is very unlikely to change confidence in the estimate of effect. Moderate Further research is likely to have an important impact on confidence in the estimate of effect
and may change the estimate. Low Further research is very likely to have an important impact on confidence in the estimate of
effect and is likely to change the estimate. Very Low Any estimate of effect is very uncertain
Results of Evidence-Based Analysis The search identified 460 articles published from January 1, 1996 to November 25, 2008. Of the 460 citations identified, five existing reviews and 22 articles describing 17 unique RCTs met the inclusion criteria. Three RCTs examined POC INR monitoring devices with PST strategies, 11 RCTs examined PSM strategies, one RCT included both PST and PSM strategies and two RCTs examined the use of POC INR monitoring devices by health care professionals. Table 2 lists the level of evidence for individual studies and the number of studies identified. Excluded full text clinical studies are described in Appendix 2. Table 2: Quality of Evidence of Included Studies*
Study Design Level of Evidence
Number of Eligible Studies
Large RCT, systematic review of RCTs 1 5 systematic reviews, 4 large RCTs
Large RCT unpublished but reported to an international scientific meeting 1(g) 0
Small RCT 2 13 small RCTs
Small RCT unpublished but reported to an international scientific meeting 2(g) 0
Non-RCT with contemporaneous controls 3a 0
Non-RCT with historical controls 3b 0
Non-RCT presented at international conference 3(g) 0
Surveillance (database or register) 4a 0
Case series (multisite) 4b 0
Case series (single site) 4c 0
Retrospective review, modeling 4d 0
Case series presented at international conference 4(g) 0
* g refers to grey literature; RCT, randomized controlled trial.
Point-of-Care INR Monitoring - Ontario Health Technology Assessment Series 2009; 9 (12) 26
Point-of-Care INR Monitoring - Ontario Health Technology Assessment Series 2009; 9 (12) 27
Summary of Existing Evidence Five existing systematic reviews and health technology assessments comparing POC INR monitoring devices to standard laboratory INR determination in patients on long-term OAT were included in the analysis (Table 3). Four existing reviews focused on specific POC strategies, whereas the review by the Canadian Agency for Drugs and Technologies in Health (27) included all POC strategies. The results of their meta-analysis, which included 15 RCTs, indicated that using POC devices resulted in significantly fewer deaths and thromboembolic events with no significant difference in hemorrhagic events compared to conventional laboratory testing. They also stated that the use of POC devices resulted in better INR control than conventional testing, as defined by a greater percentage of time in the therapeutic range. Nevertheless, CADTH concludes that definitive conclusions about the clinical benefits of self-testing and self-management with POC devices cannot be made without more rigorously designed randomized trials. A future initiative by Perera et al. (31) is to conduct an individual patient data meta-analysis in order to explore whether a reduction in major adverse events with POC INR monitoring, as reported in previous systematic reviews, is associated with a longer time spent in the therapeutic. Results are expected in 2010.
Results of the MAS Systematic Review Seventeen RCTs examining the effectiveness of POC INR monitoring devices versus laboratory INR testing met the inclusion criteria (Table 4). Three RCTs examined PST strategies with POC INR monitoring devices, 11 RCTs examined PSM strategies, one RCT included both PST and PSM, and two RCTs examined health care professionals’ use of POC INR devices. The definition of usual care varied across studies such that in six studies the control group received laboratory INR monitoring by a general practitioner in a primary care setting, by an ACC six separate studies, and either by a general practitioner in a primary care setting or by an ACC in five studies. In three studies, there were multiple comparison groups with a separate control arm that received some patient education on managing OAT. (25;32-34) For the purposes of this analysis, these usual care plus patient education groups were treated as usual care. While the majority of studies were conducted in Europe (five in the United Kingdom, six in Germany, two in the Netherlands, one in Denmark, and one in Spain), the trial by Sunderji et al. (16) was conducted in Canada and the study by Beyth et al. (35) was conducted in the United States. Study follow-up duration ranged from 3 months to 3 years and sample size ranged from 46 to 1155 patients. The mean age of patients ranged from 42 to 75 years and the percentage of male patients ranged from 43% to 71%. Most studies only included patients that had been on OAT for at least 3 months and thus were considered stable; however two studies only included new patients (35;36) and two also included patients who had been on OAT for only 1 month (16;32). Thirteen trials included patients with mixed indications, of which MHV replacement and AF were the most common indications for long-term OAT, three trials included only patients with MHV replacement, and two trials limited to patients with AF. In five of the 15 studies examining PST and/or PSM strategies, the inclusion or exclusion criteria specified that patients were evaluated for their ability to conduct PST or PSM prior to study initiation. The remaining 10 studies did not provide information on whether patients were assessed for their ability to carry out PST or PSM. The CoaguChek (Roche) POC INR device was used in 14 studies, the ProTime (ITC) in two studies, and the Thrombotrack (Nycomed) device in one study. Warfarin was used in seven of the 14 trials reporting information on the type of OAT medication used. In seven trials, acenocoumarol or phenoprocoumon was used and in one trial any of the three medications was used. Since the half-lives of acenocoumarol or phenoprocoumon are different from that of warfarin, the results of certain trials may have limited applicability to the Ontario setting where warfarin is the most commonly used OAT.
Table 3: Existing Systematic Reviews on POC INR Monitoring*
Systematic Review
POC Strategy Included/Inclusion Criteria Dates of search
Number of eligible studies Conclusions
Brown et al., 2007 (27) Canadian Agency for Drugs and Technologies in Health
Any POC strategy to August 2006 15 RCTs Definitive conclusions about the clinical benefits of self-testing and self-management with POC devices cannot be made without more rigorously designed randomized trials.
Using POC devices to manage OAT results in significantly fewer deaths and thromboembolic events and better INR control than conventional laboratory testing. The impact of POC devices on hemorrhagic events is similar to that of conventional testing.
Christensen et al., 2006 (37) PSM to Dec 2005 10 RCTs A majority of existing trials have various methodological problems. However, self-management of OAT appeared at least as good, and possibly better than, conventional management in highly selected patients.
Connock et al., 2007 (13) Health Technology Assessment, NHS R&D HTA Programme
Primary care, PST, PSM
to September 2005
16 RCTs, 8 non-randomized studies
For select patients who are successfully trained, self-monitoring is effective and safe for long-term OAT.
Patient self-monitoring is unlikely to be more cost-effective than the current high quality care provided by anticoagulation clinics in the United Kingdom.
Heneghan et al., 2006 (9) PST, PSM to April 2005 14 RCTs Results indicate significant reductions in thromboembolic events and all-cause mortality while there was no significant difference in major hemorrhages.
Self-management improves the quality of oral anticoagulation.
Medical Services Advisory Committee (MSAC), 2005 (38)
General practice to October 2004 1 RCT, 1 case series
After consideration of safety, effectiveness and cost-effectiveness, there is insufficient evidence to support the use of INR POC testing in general practice at this stage.
Point-of-Care INR Monitoring - Ontario Health Technology Assessment Series 2009; 9 (12) 28
* INR refers to international normalized ratio; POC, point of care; OAT, oral anticoagulation therapy; RCT, randomized controlled trial.
Table 4: Characteristics of Included Studies on POC INR Monitoring
Point-of-Care INR Monitoring - Ontario Health Technology Assessment Series 2009; 9 (12) 29
Study, Year
Study Design Country
Duration (months)
Sample Size (n) Control Intervention
Indication for OAT / Major Diagnosis
% of patients
with MHV
Use of OAT at baseline
OAT drug
Mean age (years) % Male Device
Funding Source
Beyth et al, 2000 (35)
RCT USA 6 325 GP PST Mixed 0.11 New (unstable)
Wfn 75 43 ProTime Public
Christensen et al., 2006
RCT Denmark 6 100 GP or ACC
PSM Mixed 0.35 OAT ≥ 8 months
Wfn or Phpcmn
Int: 51.6, Ctrl: 45.5
67 CoaguChek Private
Claes et al., 2005 (32)
RCT - Cluster
Belgium 6 834 GP (PEd)
PST Mixed 0.16 OAT ≥ 28 days
Phpcmn, Accml or Wfn
70.2 55 CoaguChek Partially industry
Cromheecke et al., 2000 (24)
RCT – Crossover
Netherlands 3 50 ACC PSM Mixed 0.49 Int OAT mean: 3.9 years Ctrl OAT mean: 4.1 years
Phpcmn or Accml
42 59 CoaguChek NR
Fitzmaurice et al., 2000 (39;39)
RCT - Cluster
UK 12 367 GP or ACC
nurse Mixed 0.16 NR Wfn NR NR Thrombotrak Public
Fitzmaurice et al., 2005 (40)
RCT UK 12 617 ACC PSM Mixed NR OAT ≥ 6 months
Wfn 65 65 CoaguChek Public
Gadisseur et al., 2003, 2004 (25;33)
RCT Netherlands 6 312 ACC (PEd)
PST, PSM Mixed 0.2 OAT ≥ 3 months
Accml or Phpcmn
Int: 54 Ctrl: 62
Overall: 57
71 CoaguChek Industry
Horstkotte et al., 1998 (41)
RCT Germany 18 150 GP PSM MHV 1 NR NR NR N/A CoaguChek NR
Quality Assessment of Included Studies The quality of the individual RCTs was assessed using a modified version of the CONSORT statement, the results of which are shown in Table 5 below. (49) To summarize:
Study quality varied across the studies: six studies were rated as low quality, six as moderate, and five as high.
In terms of study design, two RCTs were cluster randomized and two RCTs were crossover trials.
The trial by Voller et al. (22) was terminated prematurely due to issues with patient recruitment.
Information pertaining to patient withdrawal was available in 12 studies. In most trials, a higher proportion of patients dropped out of the intervention group.
Overall, there was differential withdrawal such that a higher proportion of patients from the POC intervention groups dropped out of studies (mean 18%, range 2.0 – 41.5%) in comparison to control groups (mean 8%, range 0 – 22.9%).
The most commonly reported reasons for study withdrawal were difficulties with blood sampling, operation of the POC device, lack of confidence in ability to carry out PST/PSM, or preference to return to usual laboratory-based INR management.
Studies on POC INR Monitoring: Patient Eligibility and Participation Information on the number of patients eligible to participate in the studies and the number of patients who agreed to participate was available in 11 of the 17 RCTs. The proportion of patients who agreed to participate in the studies (of those that were eligible or screened) ranged from 24% to 93%, with most studies reporting that roughly 50% of patients were in agreement (Table 6). However, there was a large degree of variation in these estimates due to different inclusion criteria across the studies. For the POC intervention group, 12 RCTs provided information of the number of patients who were randomized to the POC intervention group and able to conduct POC testing. This ranged from 72% to 98%, with most studies reporting that approximately 80% of patients randomized to the intervention group were able to conduct INR testing with the POC device. Of the patients able to conduct INR testing, over 75% of patients completed the study (Table 6). Studies on POC INR Monitoring: INR Testing Frequency and Patient Training
Point-of-Care INR Monitoring - Ontario Health Technology Assessment Series 2009; 9 (12) 31
Of the studies reporting planned and actual INR testing frequencies, most studies planned that the intervention group would test more frequently than the control group with the exception of the studies done by Claes et al. (32) and by Cromheecke et al.(24). In these two studies, both the intervention and control groups had similar testing intervals (Table 7). Overall, intervention patients tested every 0.91 to 1.8 weeks, whereas control patients tested every 2.5 to 5.4 weeks. In most studies, patients had education and training to perform PSM or PST in two sessions lasting 1 to 2 hours.
Table 5: Quality Assessment of Included Studies on POC INR Monitoring
Point-of-Care INR Monitoring - Ontario Health Technology Assessment Series 2009; 9 (12) 32
Total dropouts (%)
Study, Year Study Design Randomization
Allocation concealment Blinding
Intention to Treat Analysis
Power calculation
Difference at baseline Int Ctrl
Overall Study Quality
Beyth et al, 2000 (35)
RCT Not clear No/not clear Yes - Data abstractor
Yes Yes Similar 41.1 0 moderate
Christensen et al., 2006 (37)
RCT Computer coding
No Yes - complication assessors
Yes No Similar 6 2 moderate
Claes et al., 2005 (32)
RCT - Cluster
Stratified block randomization
Yes No No? Yes ? NR NR low
Cromheecke et al., 2000 (24)
RCT - Crossover
Sealed envelopes
No/not clear No No? Yes Similar 2 0 moderate
Fitzmaurice et al., 2000 (39;39)
RCT - Cluster
Computer coding
No/not clear No Yes Yes Similar 18.9 13.1 moderate
Fitzmaurice et al., 2005 (40)
RCT Central telephone
Yes No Yes Yes Age 41.5 10 high
Gadisseur et al., 2003, 2004 (25;33)
RCT Random numbers
Yes Dosing physician
No Yes Age, gender NR NR moderate
Horstkotte et al., 1998 (41)
RCT Not clear No/not clear No No No Not clear NR NR low
Khan et al., 2004 (34)
RCT Random numbers
No/not clear No No Yes Similar 9.1 4.9 moderate
Koertke et al., 2000, 2001, 2007 (50) (36;42)
RCT Masters random list
No/Not clear No No No Similar NR NR low
Menendez-Jandula et al., 2005 (43)
RCT Central telephone
Yes Complication assessor
Yes Yes previous thromboemb-olic events
21.5 2.4 high
Sawicki et al., 1999 (44)
RCT Computer coding
Yes Laboratory & documents assistant
No? Yes Similar 10 15.7 high
Total dropouts (%)
Study, Year Study Design Randomization
Allocation concealment Blinding
Intention to Treat Analysis
Power calculation
Difference at baseline Int Ctl
Overall Study Quality
Shiach et al., 2002 (45)
RCT - Crossover
Random number table
No/not clear No No No Not clear 15.2% total drop out rate
low
Sidhu et al., 2001 (46)
RCT Random numbers
No/not clear No No No Not clear 31.4 2 low
Siebenhofer et al., 2007, 2008 (47;48)
RCT Computer coding
Yes Yes - complication assessors
No Yes Similar 16.2 22.9 high
Sunderji et al., 2004(16)
RCT Computer coding
Yes No Yes Yes Age 24.6 4.3 high
Voller et al., 2005 (22)
RCT Not clear No/not clear No No Yes Not clear NR NR low
* RCT refers to randomized controlled trial.
Point-of-Care INR Monitoring - Ontario Health Technology Assessment Series 2009; 9 (12) 33
Point-of-Care INR Monitoring - Ontario Health Technology Assessment Series 2009; 9 (12) 34
Table 6: Description of Eligibility and Participation Reported in Studies on POC INR Monitoring
Table 7: Planned and Actual Testing Frequency and Patient Education and Training Reported in Studies
Actual INR Testing Frequency (weeks)
Study, Year Planned INR Testing Frequency Control Intervention
Patient Training (number of sessions x duration in hours)
Beyth et al, 2000 (35) Intervention patients: 3 times during first week after discharge, weekly for the remainder of the first month and then monthly depending on results. Control: NR
NR NR 2 x 1
Christensen et al., 2006 (37) Intervention patients: weekly Control patients: 2.8 0.91 4 x ?
Fitzmaurice et al., 2005 (40) Intervention patients: twice weekly 5.4 1.8 2 x 1-2
Gadisseur et al., 2003, 2004 (25;33) NR Avg 3.2 [3.3 (Ped)/3.0 (UC)]
1 for both PSM and PST
3 x 1.5-2
Horstkotte et al., 1998 (41) NR 2.7 0.6 NR
Khan et al., 2004 (34) Intervention patients: weekly ; Control patients: NR NR NR 2 x 2
Koertke et al., 2000, 2001, 2007 (50) (36;42)
Intervention patients: every 2 weeks Control patients: every 10 weeks
NR NR NR
Menendez-Jandula et al., 2005 (43) Intervention patients: weekly ; Control patients: every 4 weeks (or 1 to 2 weeks when INR out of range)
NR NR 2 x 2
Sawicki et al., 1999 (44) Intervention patients: 1-2 times per week Control patients: biweekly
NR NR 3 x 1-1.5
Shiach et al., 2002 (45) NR NR - # tests in intervention and control patients similar
NA
Sidhu et al., 2001 (46) Intervention patients: Frequency changed throughout study: At 3 months; 5.2days; 6 months; 6.6days; 12 months: 7.3days; 24 months: 7.8days. Control every
4 0.9 2 x 3
Siebenhofer et al., 2007, 2008 (47;48) NR 3.7 1.2 4 x 1.5-2
Sunderji et al., 2004 (16) NR 2.5 1.3 2 x 2-3
Voller et al., 2005 (22) NR 2.6 0.93 3 x ?
* NA refers to not applicable; NR, not reported; Ped, patient education; UC, usual care.
Point-of-Care INR Monitoring - Ontario Health Technology Assessment Series 2009; 9 (12) 35
Anticoagulation Control The relationship between anticoagulation control and both hemorrhagic or thromboembolic events is well established. (2;51) Improved INR control results in lower rates of complications on OAT. Table 8 shows the results of anticoagulation control as measured by the percentage of time INR is within the therapeutic range or by the percentage of INR values in the therapeutic range. The latter can be calculated either as the percentage of tests of each individual patient in range, or as the proportion of overall tests in range. Some studies also report the percentage of time or percentage of values above, in or below the therapeutic range. These various methods of calculating and reporting anticoagulation control are problematic. As described by Ansell et al.(2008): “the results of all of these methods depend on whether an exact or an expanded therapeutic range is used, whether warfarin-naive patients (those just beginning therapy) are included or only patients already on established therapy, whether INRs obtained during invasive procedures when warfarin therapy might be interrupted are included, and whether different oral anticoagulant preparations (e.g. warfarin, phenprocoumon, or acenocoumarol) are included.” (2) The target range varied across studies and across indications with a lower boundary of 2.0 and an upper boundary of 4.5. The most commonly reported target range was 2.0 to 3.0 for AF patients and 2.5 to 3.5 for MHV patients. Due to the differing methodologies and reporting structures for proportion of time or values in the therapeutic range, it was deemed that it would be inappropriate to combine the data and estimates, whether the difference between groups was significant. Instead, a pooled estimate of INR % time in range was calculated. For pooled estimates, the results of each individual study were weighted by the number of person-years of observation. Across most studies, patients in the intervention groups tended to exhibit a higher percentage of time and a higher percentage of values in the therapeutic target range in comparison to patients in the control groups (Figures 3a, 3b). The percentage of time in the therapeutic target range varied from 59% to 71% in intervention patients compared to 34% to 64% in control patients in studies evaluating PST. In studies evaluating PSM, time in the therapeutic range varied from 64% to 79% among intervention patients, compared to 63% to 69% among control patients. In those studies in which the POC device was utilized by a health care practitioner, time in the therapeutic range varied 61% to 69% among intervention patients, compared to 62% to 63% among control patients (Table 9). When the percentage of time in the therapeutic range was pooled across studies and weighted by the number of person-years of observation, the difference between intervention and control groups was 4.2% for PSM, 7.2% for PST and 6.1% for POC use by health care practitioners. Overall, intervention patients were in the target range 69% of the time and control patients were in the therapeutic target range 64% of the time leading to an overall difference between groups of approximately roughly 5% (Table 9). Nevertheless, readers are cautioned when interpreting these differences due to the methodological issues previously stated.
Point-of-Care INR Monitoring - Ontario Health Technology Assessment Series 2009; 9 (12) 36
Another proposed measure of anticoagulation control is the variability of the INR values. Greater fluctuations in INR results are associated with a higher risk of complications. (52) However, this outcome is infrequently reported in studies examining POC INR monitoring. The study by Christensen et al. (52) examined PSM versus usual care and found that PSM was associated was a statistically significant smaller variance in INR values (P=0.046), whereas there was no significant difference in variance among the INR values of the usual care group (P=0.228).
Table 8: Time in the Therapeutic Range and Values in the Therapeutic Range Reported in Studies
Patient years of observation Percentage of Time in
Therapeutic Range Percentage of INR Values in
Therapeutic Range Study, Year
POC Strategy Control Intervention Control Intervention Control Intervention
Point-of-Care INR Monitoring - Ontario Health Technology Assessment Series 2009; 9 (12) 37
* HCP refers to health care practitioner; PEd, patient education; PST, patient self-test; PSM, patient self-management; RCT, randomized controlled trial; UC, usual care.
Figure 3a – Proportion of Time INR remains in Therapeutic Range, POC versus Usual Care
Point-of-Care INR Monitoring - Ontario Health Technology Assessment Series 2009; 9 (12) 38
Figure 3b - Proportion of INR Values remains in Therapeutic Range, POC versus Usual Care
Point-of-Care INR Monitoring - Ontario Health Technology Assessment Series 2009; 9 (12) 39
Table 9: Summary: Time in the Therapeutic Range Weighted by Patient-Years of Observation by POC Strategy*
Intervention
(% time in range) Control
(% time in range) Difference Between Groups
(% time in range)
PSM (n=12) 69.72 65.52 4.20
PST (n=4) 63.81 56.58 7.23
Health Care Practitioner (n=2) 68.16 62.08 6.09
ALL (n=17) † 69.23 64.37 4.86
* PST refers to patient self-test; PSM, patient self-management. † Gaddiseur et al.,(25;33) broken down into PSM and PST intervention arms. Major Complications and Deaths The number of reported complication events, including thromboembolic events and deaths, reported by the individual studies is displayed in Table 10. The outcome statistic used for the meta-analyses on major complications and deaths was the Mantel -Haenszel OR. Peto’s OR, a recommended statistic for meta-analyses of rare events, was also calculated, but the results of the meta-analyses did not differ between the summary statistics. A random effects model was used to generate a more conservative estimate due to the underlying heterogeneity between studies in patient characteristics, definition of usual care, OAT drug, intensity of training/education, and frequency of testing. The Q and I2 statistics were also examined as indicators of heterogeneity. No statistically significant differences were found in the number of major hemorrhagic events between patients managed with POC INR monitoring devices and patients managed with standard laboratory testing (OR =0.74; 95% CI: 0.52- 1.04), however, the upper limit of the confidence interval did approach significance. The difference in major hemorrhagic events was insignificant for all POC strategies (PSM, PST, GP/Nurse) (Figure 4). Overall, patients managed with POC INR monitoring devices exhibited significantly fewer thromboembolic events than usual care patients (OR =0.52; 95% CI: 0.37 – 0.74). As displayed in Figure 5, when subdivided by POC strategy, PSM resulted in significantly fewer thromboembolic events than usual care (OR =0.46.; 95% CI: 0.29 – 0.72). The observed difference in thromboembolic events for PSM remained significant when the analysis was limited to major thromboembolic events (OR =0.40; 95% CI: 0.17 – 0.93) (Figure 6), but did not remain statistically significant when the analysis was limited to minor thromboembolic events (OR =0.73; 95% CI: 0.08 – 7.01) (Figure 7). PST and GP/Nurse strategies did not result in significant differences in the number of thromboembolic events [(PST OR =0.69; 95% CI: 0.38 – 1.27) (GP/Nurse OR =0.39; 95% CI: 0.08 – 1.82)] (Figure 5); however, there were only four studies on PST and one study on POC use by a GP/Nurse. PST and GP/Nurse strategies also did not result in significant differences in major or minor thromboembolic events (Figures 6 and 7). No statistically significant difference was observed in the number of deaths between the POC intervention and usual care control groups (OR =0.67; 95% CI: 0.41 – 1.10), however the upper limit of the confidence interval did approach significance. The difference in the number of deaths was non-significant for all POC strategies (Figure 8).
Table 10: Major Complications Reported in Studies on POC INR Monitoring*†
Thromboembolic events Major Hemorrhage Major Minor Total Death
Study, Year Sample
size Control Intervention Ctrl Int Ctrl Int Ctrl Int Ctrl Int Ctrl Int
Beyth et al, 2000 (35) 325 GP PST 17 8 20 13 1 1 21 14 26 21
Christensen et al., 2006 (37) 100 GP or ACC PSM 0 0 0 0 NR NR 0 0 0 0
Claes et al., 2005 (32) 834 GP (PEd) PST 9 5 13 4 NR NR 13 4 NR NR
Intervention Control Odds Ratio Odds RatioM-H, Random, 95% CI
0.005 0.1 1 10 200Favours experimental Favours control
Figure 7: Minor Thromboembolic Events – POC INR Monitoring Strategies versus Usual Care
Point-of-Care INR Monitoring - Ontario Health Technology Assessment Series 2009; 9 (12) 44
Study or Subgroup3.1.1 PSMFitzmaurice 2005Gadisseur 2003 (PSM)Menendez-Jandula 2005Sawicki 1999Sunderji 2004Voller 2005Subtotal (95% CI)Total eventsHeterogeneity: Tau² = 2.00; Chi² = 3.96, df = 2 (P = 0.14); I² = 49%Test for overall effect: Z = 0.28 (P = 0.78)
3.1.2 PSTBeyth 2000Gadisseur 2003 (PST)Khan 2004Subtotal (95% CI)Total eventsHeterogeneity: Not applicableTest for overall effect: Z = 0.00 (P = 1.00)
3.1.3 HCPFitzmaurice 2000Subtotal (95% CI)Total eventsHeterogeneity: Not applicableTest for overall effect: Z = 1.02 (P = 0.31)
Total (95% CI)Total eventsHeterogeneity: Tau² = 0.26; Chi² = 4.52, df = 4 (P = 0.34); I² = 11%Test for overall effect: Z = 0.96 (P = 0.34)Test for subgroup differences: Not applicable
Events
101100
3
100
1
0
0
4
Total
33747
3689070
1011013
1635244
259
122122
1394
Events
008000
8
100
1
4
4
13
Total
280110369
8970
1011019
162110
41313
245245
1577
Weight
15.2%
32.1%15.1%
62.5%
19.6%
19.6%
17.9%17.9%
100.0%
M-H, Random, 95% CI
2.50 [0.10, 61.63]Not estimable
0.12 [0.02, 0.99]3.00 [0.12, 74.63]
Not estimableNot estimable
0.73 [0.08, 7.01]
0.99 [0.06, 16.03]Not estimableNot estimable
0.99 [0.06, 16.03]
0.22 [0.01, 4.10]0.22 [0.01, 4.10]
0.53 [0.14, 1.95]
Intervention Control Odds Ratio Odds RatioM-H, Random, 95% CI
0.01 0.1 1 10 100Favours experimental Favours control
Figure 8: Deaths – POC INR Monitoring Strategies versus Usual Care
Point-of-Care INR Monitoring - Ontario Health Technology Assessment Series 2009; 9 (12) 45
Study or Subgroup5.3.1 PSMChristensen 2006Cromheecke 2000Fitzmaurice 2005Menendez-Jandula 2005Sawicki 1999Sidhu 2001Siebenhofer 2008Sunderji 2004Subtotal (95% CI)Total eventsHeterogeneity: Tau² = 0.33; Chi² = 6.84, df = 4 (P = 0.14); I² = 42%Test for overall effect: Z = 1.37 (P = 0.17)
5.3.2 PSTBeyth 2000Subtotal (95% CI)Total eventsHeterogeneity: Not applicableTest for overall effect: Z = 0.81 (P = 0.42)
5.3.3 Health PractitionerFitzmaurice 2000Shiach 2002Subtotal (95% CI)Total eventsHeterogeneity: Not applicableTest for overall effect: Z = 0.01 (P = 1.00)
Total (95% CI)Total eventsHeterogeneity: Tau² = 0.09; Chi² = 7.61, df = 6 (P = 0.27); I² = 21%Test for overall effect: Z = 1.59 (P = 0.11)
Intervention Control Odds Ratio Odds RatioM-H, Random, 95% CI
0.01 0.1 1 10 100Favours experimental Favours control
Point-of-Care INR Monitoring - Ontario Health Technology Assessment Series 2009; 9 (12) 46
Table 11: Summary Results of Meta-Analyses of Major Complications and Deaths in POC INR Monitoring Studies
Event No. of trials*
(patients) OR
(M-H, Random Effects) 95% CI Heterogeneity I2
Major Hemorrhages 16 (5057) 0.74 0.52 to 1.04 0% (P = 0.79)
Thromboembolic events
16 (5057) 0.52 0.37 to 0.74 0% (P = 0.81)
Deaths 11 (2906) 0.67 0.41 to 1.10 21% (P = 0.27)
* In the trial by Gadisseur et al. (25;33) results for PSM and PST were separated. Survival As a follow-up to the Early Self-Controlled Anticoagulation Trial (ESCAT) by Koertke et al. (50) the authors published long-term survival data in 2007. (42) Data on 12-year survival was available from 930 of the original 1,155 patients and over the follow-up period, 236 patients died. Ten-year survival was 76.1% in the usual care control group compared to 84.5% in the PSM group. Thus, long-term survival increased by 23% (P=0.05) in the PSM group compared to conventional management by general practitioners. Results of Subgroup Analyses In order to estimate differences between subgroups, interaction p-values were calculated using the fixed-effect inverse variance method (Appendix 3). No statistically significant subgroup interactions were observed when trials were separated according to POC strategy, country, type of usual care, proportion of patients with an indication of MHV, whether the trial was sponsored by industry, POC device, study quality (e.g. allocation concealment and ITT analysis), follow-up duration, patients’ duration on OAT at study initiation, length of patient training, or INR testing frequency. The estimated effect of POC INR management versus usual care on deaths was greater in the two largest trials compared to the other nine smaller trials reporting this outcome. The interaction between subgroups had a borderline statistical significance (p = 0.05). For thromboembolic complications, trials with a higher proportion of drop-outs had a higher risk of complications compared with trials with a lower proportion of drop-outs. This interaction was, however, not statistically significant (interaction p = 0.07). Although these subgroups were planned a priori, the results should only be considered exploratory. This is due to the small number of trials included and it is unlikely that the different subgroups analysed were independent, especially since the results were dominated by a few large trials. In addition, it is likely that a few statistically significant interactions could be observed purely by chance because of the large number of subgroup analyses conducted.
Patient Satisfaction and Quality of Life Quality of life measures were reported in seven studies and one study claimed to have collected QoL measures but these were not reported in the publication (Table 12). (47;48) A variety of measurement tools were used to assess QoL, preventing interstudy comparison of QoL scores or the computation of a quantitative summary measure. The measurement tools used included a self-perceived assessment of care quality using a structured questionnaire developed by Sawicki et al. (44), the European Quality of Life questionnaire (Euroqol/EQ-5D), and the Short Form 36 (SF-36). Specific information relating to patient satisfaction was also assessed. Three studies reported self-perceived assessments of the quality of care by patients using a structured questionnaire. (24;25;33;44) originally developed by Sawicki et al. (44). Briefly, the questionnaire consisted of 32 items encompassing five treatment-related topics including medical treatment satisfaction, self-efficacy (patient’s belief in being able to perform self-care activities), strained social network, daily hassles (minor stressful events that add to the burden of having to cope with a chronic medical condition) and general psychological distress. Patients estimated the impact of every item on their self-perceived treatment-related QoL using a graded scale ranging from a minimum of 1 (total disagreement) to a maximum of 6 (total agreement). Sawicki et al. (44) reported that PSM resulted in improved treatment-related QoL measures. General treatment satisfaction and daily hassles scores improved in the PSM group and remained unchanged in the usual care control group. Scores of self-efficacy and distress improved in both groups, but improved significantly more in the PSM group (self-efficacy P=0.003, distress P=0.008). Overall, the most pronounced improvement was in general treatment satisfaction scores (P<0.001). There was no significant effect of PSM on strained social network scores (P = 0.19). Using the questionnaire developed by Sawicki et al. (44), Cromheecke et al. (24) found significant differences in all five categories of the questionnaire in favour of the PSM group compared to the usual care control group. The PSM group had significantly greater improvements in scores for general treatment satisfaction, self-efficacy, daily anxieties, distress and strain were significantly lower. Gadisseur et al. (25;33) also used the Sawicki questionnaire, adapting it for use in the Netherlands. Compared to baseline, there was a trend towards a slight decrease in general treatment satisfaction among control group patients who received education alone, as well as an increase in distress (P=0.03) and strain on the social network (P=0.02). In the PST group, there was an increase in patients’ feelings of self efficacy (P<0.01) and a trend towards an increase in general treatment satisfaction (P=0.10). PSM resulted in a clear increase in general treatment satisfaction (P=0.01) and in feelings of self-efficacy (P=0.014) and a significant decrease in the perception of daily hassles (P<0.01) and distress (P<0.001) and less strain on the social network (P=0.07). Although differences between PST and PSM groups were small, there was a trend towards a further increase in general satisfaction by allowing the patients full PSM (P=0.14) and especially a further significant decrease in the feelings of distress (P<0.001). Fitzmaurice et al. (40;53) reported on QoL measures with the Euroqol/EQ-5D, a tool that measures broad aspects of quality of life across five dimensions: mobility, self-care, usual activities, pain/discomfort and anxiety/depression. The observed difference in mean total quality adjusted life years (QALYs) between PSM and usual care groups was in favour of PSM but this difference was not statistically significant (95% CI; -0.027 to 0.032). The EQ-5D results showed no statistically significant difference in the anxiety/ depression dimension between the PSM and usual care groups. (40;53)
Point-of-Care INR Monitoring - Ontario Health Technology Assessment Series 2009; 9 (12) 47
Khan et al. (34) also reported QoL measures using the Euroqol score, as well as the UK SF-36. Results from the UK SF-36 showed no significant differences in scores for bodily pain, social function, mental health, emotional function or physical function between the education-only and PSM groups. Emotional
Point-of-Care INR Monitoring - Ontario Health Technology Assessment Series 2009; 9 (12) 48
role limitation in the PSM group was the only variable that changed significantly from baseline (P=0.04). Euroqol scores were similar between the two groups and did not change during the study. Perceived benefits and barriers to anticoagulation were not significantly different between the two patient groups. Shiach et al. (45) and Sunderji et al. (16) both captured information pertaining to patient satisfaction. Shiach found that with POC community-based monitoring, patients expressed even greater satisfaction than with monitoring at the ACC (usual care) such that 98% of patients expressed a preference for this care model. In the study by Sunderji et al.(16), PSM patients were satisfied with using the POC monitor for INR testing, were comfortable adjusting their own warfarin doses, and preferred to continue with self-management. All found the normogram easy to use and felt that they had received adequate training to enable PSM and six patients subsequently purchased a POC monitor after study completion. In sum, the majority of studies that captured information on patient satisfaction and QoL reported favourable impacts for POC INR monitoring. These studies also tended to report favourable results of POC INR monitoring on clinical outcomes. Ontario-based Evidence on Patient Reported Outcomes Due to the small number of studies reporting QoL measures, the search was expanded to examine studies that were conducted in Ontario. One study by Woods et al. (17) was identified. It was an Ontario-based cross-sectional survey examining patient preference for capillary versus venous INR determination in an ACC setting. Sixty patients were randomized to undergo standard venous testing or capillary POC testing performed by an experienced nurse clinician. Overall, patients expressed a preference for POC testing over venous testing (P<0.001), reported less pain due to blood sampling with POC testing (P=0.004), and time spent in clinic was significantly shorter with POC testing compared to venous testing (42 mins versus 75 mins, P<0.001). As part of the pre-analysis public engagement strategy, MAS conducted a focus group with patients and caregivers in order to gather input on the research question and to ensure that the research questions incorporated important patient-centered outcomes. (54)Although the primary aim of the focus group was to obtain input on the research questions, several themes relating to QoL also arose. In general, all focus group participants reported that the POC INR monitoring devices would be very helpful in managing their conditions. Roughly half of the participants were self-testing using a POC INR device. They highlighted several reasons that motivated their desire to use these device including physical and psychological impacts of long-term venous testing, lack of access to testing facilities, risk of complications, control and empowerment, and work constraints. When taken together, these motivations generally suggest that the use of POC INR monitoring devices increased participants’ quality of life. The levels of pain (bruising), discomfort, and stress participants experience with the current standard of laboratory-based INR testing were particularly difficult and important motivators of their interest in (or use of) the POC INR devices. Limited access to testing facilities was another reason underlying their interest in POC INR monitoring devices. Participants believed that limited access to, and reliance on, testing facilities impacted their life negatively, especially with regard to employment and balancing familial obligations. They also stressed that the lack of convenience and limited access to testing facilities put them at risk for complications. Conversely, participants felt that PST would reduce these unnecessary risks. Further, those that had used the device suggested that PST was important because it allowed them to better understand and manage their conditions. Finally, there are patient sub-populations, such as children or people with small or inaccessible veins, for which the current standard of testing is simply unfeasible. Few participants raised concerns with POC INR monitoring devices, but those that did focused on the potential difficulty of using the device and the desire for continued support.
Table 12: Information on Quality of Life from Randomized Controlled Studies – POC INR Monitoring versus Usual Care
Point-of-Care INR Monitoring - Ontario Health Technology Assessment Series 2009; 9 (12) 49
Study, Year POC Strategy Method Results Conclusions
Cromheecke et al., 2000 (24) PSM
Self-perceived quality of care assessment by questionnaire of 32 items covering 5 categories (Sawicki's questionnaire). Each category scored from 1 (total dissatisfaction) to 6 (complete satisfaction).
Mean scores from Sawicki questionnaire at 3 month follow-up
Control PSM P-value General treatment satisfaction
European Quality of Life questionnaire (Euroqol) through postal questionnaires
The observed difference in mean total QALYs between groups was in favour of PSM but this difference was very small and not statistically significant (mean QALY control 0.738, mean QALY PSM 0.739; 95% CI =0.027 - 0.032). EQ-5D dimensions at 12 month follow-up (% with problems in that dimension)
No significant difference in mean QALYs/QoL between PSM and usual care
Sunderji et al., 2004 (16) PSM
Patient satisfaction with PSM Method of data collection not reported.
PSM patients stated that they were satisfied with the POC monitor for INR testing, were comfortable adjusting their own warfarin doses, and would continue self-managed therapy. Six patients purchased a POC monitor after study completion.
All PSM patients were satisfied and preferred using the POC device
Shiach et al., 2002 (45) Community-based physician
Patient satisfaction questionnaire At baseline, most patients indicated that they had been very satisfied with the previous ACC experience. Only 12% found the clinic inconvenient. With the POC community-based monitoring, patients expressed even greater satisfaction with 98% of patients expressed a preference for this model of care.
Greater satisfaction with community POC monitoring
Point-of-Care INR Monitoring - Ontario Health Technology Assessment Series 2009; 9 (12) 50
Study, Year POC Strategy Method Results Conclusions
Gadisseur et al., 2003 (25;33) PST/PSM
Self-perceived quality of care assessment by questionnaire of 32 items covering 5 categories (Sawicki's questionnaire, marginally adapted to the situation in Netherlands). Each category scored from 1 (total dissatisfaction) to 6 (complete satisfaction).
Mean scores from Sawicki questionnaire and differences from baseline at 6 month follow-up
PST and PSM have beneficial effects on quality of life
Khan et al., 2004 (34) PST
UK SF-36 and European Quality of Life questionnaire (Euroqol)
Mean UK SF-36 and Euroqol scores at 6 month follow-up
Control (PEd) PSM Physical functioning 53 57 Physical role limitation 52 45 Bodily pain 65 65 General health perceptions 56 53 Vitality 52 53 Social functioning 72 71 Emotional role limitation 63 63 Mental health 76 78 Euroqol 5 dimension score 0.70 0.75 Euroqol percentage 66 67
QoL measurements were unchanged with education (control group) or PSM
Sawicki et al., 1999 (44) PSM
Self-perceived quality of care assessment by questionnaire of 32 items covering 5 categories. Each category scored from 1 (total dissatisfaction) to 6 (complete satisfaction).
Mean scores from Sawicki questionnaire and differences from baseline at 6 month follow-up
* P<0.05 for all dimensions except strained social network
PSM resulted in improved treatment-related QoL measures
* PE refers to patient education; PST, patient self-test; PSM, patient self-management; QALY, quality-adjusted life-years; QoL, quality of life.
Figure 9: Results from the Medical Advisory Secretariat’s Focus Group - Patients’ Motivations to Use POC INR Monitoring Devices
Figure 10: Results from the Medical Advisory Secretariat’s Focus Group - Patients’ Concerns to Use POC INR Monitoring Devices
Point-of-Care INR Monitoring - Ontario Health Technology Assessment Series 2009; 9 (12) 51
Summary of Findings of Literature Review Overall, POC strategies may result in improved OAT control as measured by the proportion of time INR remains in the therapeutic range. For a select group of patients who are highly motivated and trained, PSM resulted in significantly fewer thromboembolic events compared to conventional laboratory-based INR testing. No significant differences were observed for major hemorrhages or all-cause mortality. No significant differences in complications and mortality were observed for the strategies of PST and GP/Nurse use of POC, which indicates that they are just as effective as conventional laboratory-based INR testing. POC devices also appear to have a beneficial impact on patient satisfaction and QoL.
Point-of-Care INR Monitoring - Ontario Health Technology Assessment Series 2009; 9 (12) 52
The findings on thromboembolic and hemorrhagic events are consistent with the findings of previous systematic reviews (Table 13). For deaths, previous systematic reviews have reported significant differences in the number of deaths, which is contrary to the current findings. However, in previous reviews, the upper limit of the confidence intervals did approach non-significance. A potential explanation for the difference in results between the present and existing systematic reviews is that the MAS’ meta-analyses incorporated new findings from two studies. (37;47) Further, the study by Siebenhofer et al. (47) was conducted in an older population.
Table 13: Comparison of Present Results to Existing Systematic Reviews – Complications and Deaths in POC INR Monitoring Studies
Major Hemorrhage All Thromboembolic events Deaths Systematic Review†
POC Strategy Included
Summary Statistic Estimate CI Estimate CI Estimate CI
Point-of-Care INR Monitoring - Ontario Health Technology Assessment Series 2009; 9 (12) 53
†The systematic review by the Medical Services Advisory Committee (MSAC), 2005 (38) was omitted since only 2 studies were included in their analysis.
Quality of the Evidence Studies varied with regard to patient eligibility, baseline patient characteristics, follow-up duration and withdrawal rates. Some trials were conducted exclusively among MHV patients while others included patients with mixed indications for long-term OAT. The inclusion criteria for most trials specified that patients had to be stable and on OAT for a required time frame of usually 3 months. Some trials also included new patients who may have required some time to regulate warfarin dose; fluctuations in INR might, therefore be common. Further, differential drop-out rates were observed such that the POC intervention groups had a larger number of patients who withdrew. Since no information was presented on the patients’ baseline INR values at study initiation, it cannot be determined with certainty whether these patients were adequately managed at baseline with values within the therapeutic range. The study by Siebenhofer et al. (47) was the only study to provide baseline INR values, reporting that 60% of patients in the PSM group and 50% of patients in the UC group were out of the therapeutic range at baseline. There was also heterogeneity in study methodology. There was also a lack of consistency in the definitions and reporting for anticoagulation control and definitions of adverse events. Some studies reported anticoagulation control as the time in the therapeutic range, while others reported values in the therapeutic range. Lack of standardization in methodology to calculate this measure was noted and has been previously discussed. Trials reported the number of events and no data was presented on time to event. Perera et al. (31) are aiming to overcome this limitation by undertaking an individual patient data analysis that is expected to be published in late 2009. They are also hoping to generate predictive models from this analysis to assist with the determination of which patients are most likely to benefit from PSM. Lastly, there is limited data on the long-term effects of POC INR monitoring devices; only one study was identified that examined survival. (42) In most studies, the intervention group received more training and education on warfarin and their health condition. These patients also performed more frequent INR testing, which may have overestimated the effect of the POC intervention. In addition to these factors, other major variables were likewise not adequately controlled for, such as patient compliance and consistency of reagent and instrumentation use. Lastly, a large number of trials were also sponsored by industry, which may result in publication bias due to clinical experience or other unmeasured factors. In terms of generalizability, it may be inappropriate to extrapolate the rates of complication to the general population since patient selection and eligibility criteria were not always fully described and it is likely that the majority of the PST/PSM trials included a highly motivated patient population. Likewise, patients at higher risk of adverse events may have been excluded from the trials. Patient care and monitoring are also often more coordinated in clinical trials than in practice. Additional limitations of the evidence are that the majority of studies examined PST/PSM strategies and only two studies examined the use of POC devices by a nurse or physician. No studies that were conducted in long-term care or pharmacy settings were identified that met inclusion criteria. GRADE Quality of Evidence
Point-of-Care INR Monitoring - Ontario Health Technology Assessment Series 2009; 9 (12) 54
Despite the observed heterogeneity among studies, there was a general consensus in findings that POC INR monitoring devices have beneficial impacts on the risk of thromboembolic events, anticoagulation control as measured by time or values in the therapeutic range and patient QoL (Table 14).
Table 14: GRADE Quality of the Evidence on POC INR Monitoring Studies
Summary of Findings Quality Assessment No. of Patients
Outcome No. of
Studies Design Quality Consistency Directness Other Interv Control Effect, OR [95% CI] Quality
Major Hemorrhages
17 RCT
High
Serious limitations†
Moderate
Consistent
Moderate
Direct
Moderate
None
Moderate
2371 2686 0.74 [0.52-1.04]
Moderate
Thromboembolic Events
17 RCT
High
Serious limitations†
Moderate
Consistent
Moderate
Direct
Moderate
None
Moderate
2371 2686 0.52 [0.37-0.74]
Moderate
Death 11 RCT
High
Serious limitations‡
Moderate
Consistent
Moderate
Direct
Moderate
None
Moderate
1423 1483 0.67 [0.41–1.10]
Moderate
10-year survival 1 RCT
High
Serious limitations§
Moderate
?
Low
Direct
Low
Sparse data
Very low
488 442 PSM increased long-term survival by 23% (P=0.05) vs. conventional management
Very Low
Outcomes not summarized quantitatively
Anticoagulation Control (time or values in range)
Time in range: 13
Values in range: 12
RCT
High
Serious limitations║
Moderate
Consistent
Moderate
Direct
Moderate
Imprecise data¶
Low
When the % time therapeutic target range was pooled across studies and weighted by the number of person-years of observation, intervention patients were in the target range 69% of the time and control patients 64% of the time (5% overall difference).
Low
Quality of Life, self-perceived quality of care, patient satisfaction
8 RCT
High
Serious limitations #
Moderate
Some inconsistencies (2 of the studies reported no difference between groups)
Low
Direct
Low
None
Low
Appears to be beneficial impact on quality of life, self-perceived quality of care and patient satisfaction with POC INR monitoring.
Low
* RR refers to relative risk; CI, confidence interval; Interv, intervention; RCT, randomized controlled trial; † Unclear method of randomization in 3 studies (22;35;41), unclear/no allocation concealment in 8 studies (22;24;34-36;41;46;55), outcome assessor blinded in only 6 studies (25;35;37;43;44;47) and clear adherence to an intention to treat analysis in only 6 studies (16;35;37;40;43;55). ‡ Unclear method of randomization in 2 studies (22;35), unclear/no allocation concealment in 5 studies (24;35;36;46;55), outcome assessor blinded in only 5 studies (35;37;43;44;47) and clear adherence to an intention to treat analysis in only 6 studies (16;35;37;40;43;55). § Unclear/no allocation concealment, no blinded outcome assessor and no intention to treat analysis (42). ║ Unclear method of randomization in 3 studies (22;35;41), unclear/no allocation concealment in 8 studies (22;24;34-36;41;45;46;55), outcome assessor blinded in only 6 studies (25;35;37;43;44;47) and clear adherence to an intention to treat analysis in only 6 studies (16;35;37;40;43;55).
Point-of-Care INR Monitoring - Ontario Health Technology Assessment Series 2009; 9 (12) 55
¶ Estimate calculated across studies using different methods and reporting structures. # Unclear method of randomization in 1 study(22), unclear/no allocation concealment in 3 studies (22;24;34), outcome assessor blinded in only 2 studies (25;44) and clear adherence to an intention to treat analysis in only 2 studies (16;40).
Economic Analysis
Objective The Programs for Assessment of Technology in Health (PATH) was commissioned by MAS to develop an economic model to assess the cost-effectiveness and predict the long-term costs associated with Point of Care (POC) INR monitoring devices for patients on long-term (>3 months) OAT.
Review of Economic Literature The economic literature search process is outlined in Figure 11, including the number of abstracts identified and screened for eligibility, as well as the number of full text articles reviewed and analyzed. The following databases were used for the economic literature search (see Appendix 1 for details): 1. OVID MEDLINE 2. MEDLINE In-Process and Other Non-Index Citations 3. OVID EMBASE 4. OVID Cochrane Library 5. INAHTA/CRD 6. EconLit
Point-of-Care INR Monitoring - Ontario Health Technology Assessment Series 2009; 9 (12) 56
Disclaimer: The Medical Advisory Secretariat uses a standardized costing methodology for all of its economic analyses of technologies. The main cost categories and the associated methods from the province’s perspective are as follows:
Hospital: Ontario Case Costing Initiative cost data are used for all in-hospital stay costs for the designated International Classification of Diseases-10 (ICD-10) diagnosis codes and Canadian Classification of Health Interventions procedure codes. Adjustments may need to be made to ensure the relevant case mix group is reflective of the diagnosis and procedures under consideration. Due to the difficulties of estimating indirect costs in hospitals associated with a particular diagnosis or procedure, the secretariat normally defaults to considering direct treatment costs only.
Nonhospital: These include physician services costs obtained from the Ontario Schedule of Benefits for physician fees, laboratory fees from the Ontario Laboratory Schedule of Fees, device costs from the perspective of local health care institutions, and drug costs from the Ontario Drug Benefit formulary list price.
Discounting: For all cost-effectiveness analyses, a discount rate of 5% is used as per the Canadian Agency for Drugs and Technologies in Health.
Downstream costs: All costs reported are based on assumptions of utilization, care patterns, funding, and other factors. These may or may not be realized by the system or individual institutions and are often based on evidence from the medical literature. In cases where a deviation from this standard is used, an explanation has been given as to the reasons, the assumptions, and the revised approach. The economic analysis represents an estimate only, based on assumptions and costing methods that have been explicitly stated above. These estimates will change if different assumptions and costing methods are applied for the purpose of developing implementation plans for the technology.
The inclusion criteria for analysis were as follows: Full economic evaluations (cost-effectiveness analysis [CEA], cost-utility analysis [CUA], cost-benefit
analysis [CBA])
Economic evaluations reporting Incremental Cost-Effectiveness Ratios (ICER) i.e. cost per quality adjusted life year (QALY)/life years gained (LYG) or cost per event avoided
Studies among patients using OAT on a chronic basis Studies reporting on POC devices to manage INRs
Studies in English Figure 11: Literature Search Strategy for Economic Evaluations of POC devices for INR Monitoring
As noted in Figure 11, six economic evaluations were identified in the literature that fit the inclusion criteria: 1. Lafatta et al. (56) conducted a cost-effectiveness analysis of Anti-Coagulation Clinic (ACC) care and
self-testing for the management of patients on chronic warfarin therapy. Using a 5-year Markov model, the authors evaluated three different strategies: usual care, ACC testing with a capillary monitor, and patient self-testing (PST) with a capillary monitor. Over the lifetime of the model, ACC testing resulted in a total of 1.7 fewer thromboembolic events and 2.0 less hemorrhagic events per 100 patients versus usual care. PST resulted in 4.0 less thromboembolic events and 0.8 less hemorrhagic events compared to ACC testing. It was concluded that PST is the most cost-effective alternative for providing overall cost savings.
2. Müller et al. (57) conducted an economic analysis of patient self-management (PSM) of
anticoagulation following heart valve replacement. Their evaluation yielded a cost-effectiveness ratio of 105,000 Deutsche Mark per LYG. The authors concluded that the incidence of lethal strokes may be reduced by PSM at an acceptable cost-effectiveness ratio.
Point-of-Care INR Monitoring - Ontario Health Technology Assessment Series 2009; 9 (12) 57
Literature Search (n= 185)
Full-text articles reviewed (n=24)
Citations excluded based on title and abstract (n=161)
Full-text citations included (n=8) •2 Reviews (CADTH, NHS R&D) •1 cost per event avoided •1 cost per LYG •2 cost per QALY
Citations excluded from review (n=16)
•1 inappropriate language i.e. Spanish •1 inappropriate patient population i.e. GPs being assessed •2 inappropriate comparator i.e. no POC device •4 inappropriate article i.e. not economic evaluations •8 inappropriate outcome i.e. total costs reported, no ICER
Point-of-Care INR Monitoring - Ontario Health Technology Assessment Series 2009; 9 (12) 58
3. Jowett et al. (53) conducted a cost-utility analysis (CUA) alongside a randomized controlled trial (RCT) of PSM of OAT versus routine clinic-based care for patients receiving long-term OAT. The results showed that there was no difference in QALYs gained between the treatment groups but cost in the PSM group was higher than that of the control. They concluded that PSM of anticoagulation does not appear to be cost-effective, although it may have other benefits such as relieving pressure on clinic-based care, an advantage that should be explored further.
4. Regier et al (58) assessed the cost-effectiveness of self-managed versus physician-managed OAT.
Using a 5-year Markov model, the ICER was found to be $14,129 per QALY. The authors concluded that PSM is a cost-effective strategy for those receiving long-term OAT for atrial fibrillation as well as for those with a mechanical heart valve.
5. The NHS R&D HTA Programme (13) found that the cost per QALY gained by PSM was £122,365
over 5 years and £63,655 over 10 years. They concluded that PSM is unlikely to be more cost-effective than current usual care practices in the UK.
6. The Canadian Agency for Drugs and Technologies in Health (CADTH) (27) found that, from a
publicly funded health care perspective, POC monitors in ACCs are cost-saving compared to conventional laboratory testing. Using the same perspective to compare PST with traditional laboratory tests, the cost per additional QALY gained was $57,595, which was deemed not to be cost-effective, based on a willingness to pay threshold of $50,000 per QALY. However, when a societal perspective was adopted and patient travel and time costs (as well as those of their caregivers) were included, PST was determined to be cost-saving.
Please refer to the individual studies for further details and discussions of outcomes and consequences.
Evaluation A CUA was conducted in order to evaluate cost per QALY between POC strategies at different settings to manage INR values. A CEA was ruled out because utilities were identified that allowed comparisons among decision options. As costs varied amongst the interventions, a cost-minimization analysis (CMA) was also ruled out. CUA was, therefore, deemed appropriate for this economic evaluation. Comparators The four decision options were available: 1. Standard care: laboratory testing with a venipuncture blood draw for an INR 2. Healthcare staff testing: use of a POC device for INR measurement in a medical clinic with staff
such as pharmacists, nurses, and physicians following protocol for OAT management. 3. PST: patient self-testing using a POC device and phoning results into an ACC or family physician. 4. PSM: patient self-management through the use of a POC device and self-adjustment of OAT
following a standardized protocol. Patients may phone into a medical office for guidance. Table 15 summarizes the comparators and their respective summary estimates from the MAS review used in the economic analysis. Target Population The target population of this CUA was patients on long-term (> 3 months) OAT.
Table 15: Summary Estimates by Strategy Used in the POC Economic Model
Strategy Target Population
Major Hemorrhagic Events, Odds Ratio
(95% CI)
Major Thromboembolic Events, Odds Ratio
(95% CI)
All-Cause Mortality Odds Ratio
(95% CI) Reference
Healthcare staff testing Patients on long-term (> 3 months) OAT
0.74 (0.52-1.04)*
0.66 (0.13-3.34)
1 (0.25-4.09)
MAS review
Patient self-testing Patients on long-term (> 3 months) OAT
0.82 (0.33-2.01)
0.68 (0.37-1.27)
0.77 (0.42-1.44)
MAS review
Patient self-management Patients on long-term (> 3 months) OAT
0.71 (0.48-1.07)
0.4 (0.17-0.93)
0.56 (0.25-1.28)
MAS review
MAS = Medical Advisory Secretariat; POC = point of care; CI = confidence interval. *Summary estimate from one study was 6.06 (0.25-149.9) – therefore used pooled estimates in the analysis.
Point-of-Care INR Monitoring - Ontario Health Technology Assessment Series 2009; 9 (12) 59
Perspective & Time Horizon The primary analytic perspective was that of the Ministry of Health and Long-Term Care. Only direct medical costs were considered. The time horizon of the model was five years - the serviceable life of a POC device, with annual cycles.
Modelling A Markov decision analytic model using TreeAge Pro 2009 was built to assess POC strategies that reduced the frequency of adverse events in patients on OAT versus standard care (Figure 12). The model compared the costs and QALYs accrued among patients treated via a self-testing, self-management, or healthcare staff management strategy over a period of 5 years. Hypothetical patient cohorts were followed for five years after commencing OAT. With each one-year cycle of the model, patients could move through the health states of: no event, major hemorrhages, major thromboembolic events, and death. Those who experienced a hemorrhagic or thromboembolic event were at risk for either temporary or permanent disability. Among those patients who became permanently disabled, there was a risk of discontinuing OAT and being at increased risk for subsequent events. Transitions between states were defined using event probabilities drawn from the MAS systematic review, the published literature, and expert opinion. The likelihood of patients changing from one health state to another depended on the time spent in and outside of therapeutic INR range, which was estimated using results from the MAS review. Table 16 summarizes the average time spent in therapeutic range weighted by patient-years of observations. Table 17 describes the model parameters and sources in the economic analysis. Table 16: Time Spent in Therapeutic Range by Strategy in the POC Economic Model
Strategy Value Assumptions Reference
Standard care
Within INR range 64.37% Time spent in therapeutic range weighted by patient-years of observation MAS review
Outside INR range 35.63% Time spent in therapeutic range weighted by patient-years of observation MAS review
Healthcare staff testing
Within INR range 68.16% Time spent in therapeutic range weighted by patient-years of observation MAS review
Outside INR range 31.88% Time spent in therapeutic range weighted by patient-years of observation MAS review
Patient self-testing
Within INR range 63.81% Time spent in therapeutic range weighted by patient-years of observation MAS review
Outside INR range 36.19% Time spent in therapeutic range weighted by patient-years of observation MAS review
Patient self-management
Within INR range 69.72% Time spent in therapeutic range weighted by patient-years of observation MAS review
Outside INR range 30.28% Time spent in therapeutic range weighted by patient-years of observation MAS review
Point-of-Care INR Monitoring - Ontario Health Technology Assessment Series 2009; 9 (12) 60
MAS = Medical Advisory Secretariat; POC = point of care; INR = international normalized ratio
Figure 12: Point of Care Device – Economic Model Structure
Point-of-Care INR Monitoring - Ontario Health Technology Assessment Series 2009; 9 (12) 61
Table 17: Model Parameters Used in the POC Economic Model
Parameter Value Assumptions Reference
Major Hemorrhagic Events
No medical attention 80% Assumed 80% of hemorrhages do not require medical attention i.e. nose bleeds, etc
Personal communication, clinical expert*
General practitioner's assistance 15% Assumed 15% of bleeds see a family physician Personal communication, clinical expert*
Hospital assistance 5% Assumed 5% of bleeds visit a hospital Personal communication, clinical expert*
Gastro-intestinal (GI) bleeding 95% Assumed all hospital bleeds are 95% GI bleeds and 5% IC bleeds Personal communication, clinical expert*
GI bleeding deaths 20% Assumed 20% of GI bleeds are fatal Personal communication, clinical expert*
Intracerebral (IC) bleeding 5% Assumed all hospital bleeds are 95% GI bleeds and 5% IC bleeds Personal communication, clinical expert*
IC bleeding deaths 50% Assumed 50% of IC bleeds are fatal Personal communication, clinical expert*
Hemorrhagic deaths 14% Assumed 14% of hemorrhages are fatal (58)
Permanent disability after hemorrhage
10% Assumed 10% of hemorrhages lead to permanent disability Assumed all other events lead to temporary disability for 30 days
(56)
Hemorrhage after permanent disability off therapy
1% Assumed 1% will experience hemorrhages after coming off therapy after becoming permanently disabled
(56)
Major Thromboembolic Events (TE)
Deep vein thrombosis (DVT) 80% Assumed 80% of TEs are DVTs and require emergency department visits
Personal communication, clinical expert*
DVT deaths 0% Assumed 0% of DVTs are fatal Personal communication, clinical expert*
Pulmonary embolism (PE) 20% Assumed 20% of TEs are PEs and require hospitalization Personal communication, clinical expert*
PE deaths 20% Assumed 20% of PEs are fatal Personal communication, clinical expert*
TE death 21% Assumed 14% of TEs are fatal (58)
Permanent disability after TE 60% Assumed 60% of TEs lead to permanent disability - Assumed all other events lead to temporary disability for 30 days
(56)
TE after permanent disability off therapy
17% Assumed 17% will experience TEs after coming off therapy after becoming permanently disabled
(56)
Discontinue therapy after permanent disability
50% Assumed 50% will discontinue therapy after becoming permanently disabled
(56)
POC = point of care.
Point-of-Care INR Monitoring - Ontario Health Technology Assessment Series 2009; 9 (12) 62 *Personal communication with a clinical expert, May 2009
Valuing Outcomes Cost per QALY was estimated for each POC strategy using data from published articles that have assigned utilities to the adverse events associated with OAT. Table 18 describes the utility values and sources used in the economic analysis. In addition to determining the ICER associated with each strategy as compared to standard care, total costs (in 2008 Canadian dollars) and outcomes (QALYs) per patient were reported (see Results section for details). Table 18: Utility Values Used in the POC Economic Model
Parameter Value Assumptions Reference
General population 0.93 0.93 +/- 0.079 (59)
Temporary disability 0.75 Assumed a utility of 0.75 once experience a temporary disability for 30 days after the event
(27)
Permanent disability 0.5 Assumed a utility of 0.5 once experience a permanent disability from the time of the event until death
(27)
POC = point of care. Resource Use and Costs All medical visit (specialist and General Practitioner (GP)) costs and medical procedures were obtained from the Ontario Schedule of Physician Benefits (OSB). Drug costs were obtained from the Ontario Drug Benefits Formulary (ODBF). Laboratory fees were obtained from the Ontario Schedule of Laboratory Fees (OSLF). Rehabilitation and Long-Term Care (LTC) costs were obtained from ministry reports (Personal communication, Ministry of Health and Long-Term Care, July 2008). All other costs were obtained from published literature or published websites. All of the resources, assumptions, and references used in the POC model are summarized in Table 19. Table 20 describes the assumptions made regarding resource utilization for each strategy and Table 21 describes the annual cost incurred for each strategy. Discounting Costs and outcomes were discounted at a 5% annual rate as recommended by the Canadian Agency for Drugs and Technologies in Health (CADTH) guidelines. The model is based on an annual cycle. Variability and Uncertainty
Point-of-Care INR Monitoring - Ontario Health Technology Assessment Series 2009; 9 (12) 63
One-way sensitivity analyses were conducted to address variability and uncertainty.
Table 19: Resource Use in the POC Economic Model
Point-of-Care INR Monitoring - Ontario Health Technology Assessment Series 2009; 9 (12) 64
Parameter Unit Value Assumptions Reference
Medical Visits
Gastroenterologist consult per consult $132.50 A415 - assumed a consult in hospital for GI bleeds (60)
Hematologist consult per consult $132.50 A615 - assumed a consult in hospital for GI bleeds, IC bleeds and TEs
(60)
Neurosurgeon consult per consult $107.00 A045 - assumed a consult in hospital for IC bleeds (60)
GP visit per visit $29.20 C002 - assumed two additional visits after hospital (60)
Anti-coagulation supervision per month $10.60 G271 - assumed telephone advice per month if on long-term anti-coagulant therapy
(60)
Drugs
Omeprazole per year $803.00 Assumed after GI bleed - patient goes on proton pump inhibitor for life. Standard dose of 20 mg BID at $1.1 per 10mg tablet
Personal communication, clinical expert, May 2009; (61)
Warfarin per year $87.53 Assumed a standard dose of 7.5 mg/day at $0.12/5 mg tab and $0.1198/2.5mg tab
(61)
Laboratory Tests
Laboratory INR test per test $6.20 L445 – assumed a test every 3 weeks in the standard care group
(62)
Number of tests in standard care group
per year 17.3 Assumed patients test every 3 weeks Personal communication, clinical expert, May 2009
Number of tests in healthcare staff testing group
per year 52 Assumed patients test every week Personal communication, clinical expert, May 2009
Number of tests in patient self-test group
per year 17.3 Assumed patients test every 3 weeks Personal communication, clinical expert, May 2009
Number of tests in patient self-management group
per year 52 Assumed patients test every week Personal communication, clinical expert, May 2009
Self-management group guidance
90% Assumed 90% of patients who self-manage require guidance
Personal communication, clinical expert, May 2009
Number of patients per year per clinic
500 Assumed 500 patients per clinic per year Personal communication, clinical expert, May 2009
Point-of-Care INR Monitoring Devices - Ontario Health Technology Assessment Series 2009; 9 (12) 65
Parameter Unit Value Assumptions Reference
Medical Procedures
Endoscopy for active bleeding per procedure $125.10 Z400 - assumed one additional procedure after hospital (60)
Anaesthesia 6 units $79.44 (60)
Hospitalizations
Emergency department visit per visit $468.00 Assumed all DVTs require ED visits (27)
Hemorraghic hospitalization per hospitalization
$14,805 Cost included office visits, emergency department, and hospital administration for non-fatal hemorrhage. Cost converted to 2009 CAD.
(27)
Thromboembolic hospitalization
per hospitalization
$18,407 Cost included office visits, emergency department, and hospital administration for non-fatal hemorrhage. Cost converted to 2009 CAD.
(27)
Fatal hemorraghic hospitalization
per hospitalization
$6,923 Cost included office visits, emergency department, and hospital administration for non-fatal hemorrhage. Cost converted to 2009 CAD.
(27)
Fatal thromboembolic hospitalization
per hospitalization
$3,208 Cost included office visits, emergency department, and hospital administration for non-fatal hemorrhage. Cost converted to 2009 CAD.
(27)
Device and Supplies
POC device per device $499.00 Assumed 1 patient per device MAS review – table 1
POC device for anticoagulant clinics (ACC)
per device $1,499.00 Assumed 500 patients per year per clinic MAS review – table 1
Strips per strip $8.37 CoaguChek XS and XS Plus Roche Diagnostics GMBH6 test strips - $50.25; 24 test strips - $200.88
MAS review – table 1
Rehabilitation program per day $571.00 Assumed a daily cost for temporary disability for 30 days
Assumption from personal communication, clinical expert, May 2009; Cost from personal communication, Ministry of Health and Long-Term Care, July 2008
Long term care per day $133.75 Assumed a daily cost after a permanent disability for the remainder of the life
Assumption from personal communication, clinical expert, May 2009; Cost from personal communication, Ministry of Health and Long-Term Care, July 2008
POC = point of care.
Table 20: Assumptions on Resource Consumption in each Strategy Analyzed in the POC Economic Model
Strategy INR Test POC Device Test Strip Clinic Visit Phone Medical Counselling
General population
Venipuncture every 3 weeks
No No No Monthly fee
Temporary disability
POC every 3 weeks in a clinic
500 patients/ACC clinic* Every 3 weeks
Every 3 weeks
Monthly fee
Permanent disability
POC every week
One per patient Every week No Monthly fee
Patient self-managing
POC every week
One per patient Every week No 90% Monthly fee
POC = point of care. *Assumed 500 patients per ACC clinic as per expert opinion however a GP’s office will see less patients – please see Appendix 4 for one-way sensitivity analysis. Table 21: Annual Cost of Individual Strategies Analyzed in the POC Economic Model
POC = point of care. All costs are presented in 2008 Canadian dollars (CAD).
Point-of-Care INR Monitoring - Ontario Health Technology Assessment Series 2009; 9 (12) 66
Results The results achieved from the economic model are summarized in Table 22. Total cost and QALYs are reported over the 5-year time horizon of the model. Table 22: Total Cost and QALYs per Patient – Results from the POC Economic Model
1. Compared to standard care. 2. Compared to self-managing. Sensitivity Analyses The following parameters were varied in a one-way sensitivity analysis:
1. Frequency of testing
2. Number of patients per clinic
3. Odds ratio estimates
4. Discounting rate
5. Utility values These analyses did not change the overall direction of the results (see Appendix 4 results details). Limitations There were several limitations to this analysis, specifically: 1. Patient level data was not available and the probabilities used in the model were driven by literature
findings and expert opinion. 2. It was not possible to meta-analyze time in therapeutic range, recurrent events, or event specific
mortality as there were either methodological flaws in or improper reporting of data by the included studies.
3. Hemorrhage estimate for the PSM strategy was based on only one study and the point estimate was 6.06 (0.25-149.9) as the control arm had no events. A value from pooled estimates was, therefore, used for all POC strategies.
4. Pharmacy and LTC settings were not analyzed due to lack of data. 5. Patient education and its effect on outcomes could not be analyzed . 6. The societal perspective was not examined
Point-of-Care INR Monitoring Devices - Ontario Health Technology Assessment Series 2009; 9 (12) 67
7. The costs of quality assurance programs was not included.
Conclusions 1. POC strategies are cost-effective versus traditional INR laboratory testing.
2. The healthcare staff testing strategy has potential cost savings because of one device per multiple patients.
3. The PSM strategy appears to be the most cost-effective method i.e. this population may be more inclined to adjust their INRs more readily, thereby keeping INR values within target ranges.
Health Systems Impact Clinical experts have estimated that approximately 1% of the population receives OAT for prophylaxis and/or treatment of thrombosis. (14;14) Applying this estimate to Ontario, this equates to approximately 132,000 users that could potentially be affected if POC devices were made widely available. Table 23 displays a projection of the potential savings for the Ontario public health system, based on the potential market estimated above. Figure 13 illustrates the potential savings for Ontario if the uptake rate of the PSM strategy (the strategy with the most potential for cost-savings) is varied. Expert opinion has estimated a POC uptake rate of 24% (Personal communication, clinical expert, May 2009). As expected, savings increase with the rate of device uptake. Table 23: Potential Savings in Ontario Estimated from a 5-year POC Economic Model
Strategy Total Cost per
Patient ($) Cost Avoided per
Patient ($) N* Maximum Potential
Ontario Savings
Standard Care 24K - - -
Healthcare Staff Testing 19K (5K) 132,000 ($638M)
Self Testing 20K (4K) 132,000 ($472M)
Self Managing 15K (8K) 132,000 ($1.1B)
*Assumed all patients are potentially affected by each strategy.
Point-of-Care INR Monitoring Devices - Ontario Health Technology Assessment Series 2009; 9 (12) 68
Note: Saving estimates will change depending on annual market and population changes.
Point-of-Care INR Monitoring Devices - Ontario Health Technology Assessment Series 2009; 9 (12) 69
Figure 13: Ontario Healthcare System Savings Over 5 Years by Rate of POC Device Uptake Using PSM Strategy
Acknowledgments The following individuals contributed to the production of the economic analysis: Kiran Chandra, PATH Tanya Khan, MAS Gord Blackhouse, PATH Ilia Ferrusi, PATH Kellee Kaulback, MAS Christian Taylor, MAS Donna Wilcockson, PATH Ron Goeree, PATH
Ontario Savings Over 5 Years
100%
75%
50%
25%
$-
$200,000,000
$400,000,000
$600,000,000
$800,000,000
$1,000,000,000
$1,200,000,000
Uptake Rate of Patient Self-Management with Point of Care Devices
Tota
l Cos
t (5
Yea
rs)
Existing Guidelines Several guidelines for the management of patients on long-term OAT exist, including recommendations on the use of POC INR monitoring devices. Below is a brief summary of some of the most commonly cited guidelines.
1. Pharmacology and Management of the Vitamin K Antagonists: American College of Chest Physicians Evidence-Based Clinical Practice Guidelines, 8th Edition Ansell et al., 2008(2)
“In patients who are suitably selected and trained, patient self-testing or patient self-management of dosing are effective alternative treatment models that result in improved quality of anticoagulation management, with greater time in the therapeutic range and fewer adverse events. Patient self-monitoring or self-management. However, is a choice made by patients and physicians that depends on many factors. We suggest that such therapeutic management be implemented where suitable”.
This was graded as level 2B evidence which is defined as the trade-off between benefits and risk is less certain and that the individual patient values may lead to different choices. The methodological quality was assigned a grade of B as its recommendations are based on randomized trials with inconsistent results or with substantial methodological weaknesses.
2. The National Academy of Clinical Biochemistry Laboratory Medicine Practice Guideline: Evidence-
based practice for point-of care testing, 2007 Nichols et al., 2007 (63)
We recommend that the use of POC PT be considered a safe and effective alternative to laboratory PT testing for hemostasis monitoring in the hospital setting [Strength B, Level I and II].
We strongly recommend that critical ranges, workflow patterns and cost analyses be evaluated, and where necessary altered, during the implementation of POC PT testing to ensure optimization of patient treatment protocols [Strength A, Level II].
We recommend that the use of POC PT be considered a safe and effective alternative to laboratory PT testing for oral anticoagulation monitoring and management in a clinic setting [Strength B, Levels II and III].
We recommend the use of POC PT as a safe and effective method for oral anticoagulation monitoring by patient self-testers for appropriately trained and capable individuals [Strength B, Levels I, II and III].
3. Guidelines of oral anticoagulation (warfarin): Third edition – 2005 update. British Committee for
Standards in Haematology. Baglin et al., 2006 (7)
For either NPT or PSM programmes:
Patients should conduct PST, with or without PSM, within a managed programme.
The same standards of total quality management as practiced in hospital-based clinics should be adhered to.
Patients should be assessed for capability; only those considered competent to follow total quality management procedures should complete training and undertake PST, with or without PSM.
Point-of-Care INR Monitoring - Ontario Health Technology Assessment Series 2009; 9 (12) 70
PST and PSM programmes should be reviewed and audited at regular intervals for both technical and clinical utility. Controls assurance procedures should include regular review of proportion of INRs in range and the incidence of over anticoagulation, bleeding and thrombotic adverse events.
4. Guidelines for implementation of patient self-testing and patient self-management of oral anticoagulation. International consensus guidelines prepared by International Self-Monitoring Association for Oral Anticoagulation (ISMAA) Ansell et al., 2005 (5)
Summary of consensus:
A significant number of patients undergoing lifelong OAT are eligible for PST/PSM. After structured training by trained health care professionals, suitable patients are in a position to determine their anticoagulation intensity accurately and reliably. Selected patients are also able to adjust their dosages accordingly.
Recent technical developments have produced high-precision, user-friendly coagulometers. Patients are able to achieve a stable anticoagulant level with weekly testing, or more frequently if required, thereby significantly reducing the number of complications.
PSM may be more cost-effective than usual care or anticoagulant clinic care and, above all, can considerably improve quality of life by giving the patient greater independence.
Summary of ISMAA recommendations:
Patient self-testing/self-management is an effective method of monitoring OAT, providing outcomes are at least as good as, and possibly better than, those achieved through a clinic.
Available self-testing/self-management devices provide INR results that are comparable with those obtained in laboratory testing.
The most common testing frequency is weekly but lower testing frequency can be justified by institutional or patient conditions.
Patients must be appropriately selected and trained.
Patient self-testing/management is the most patient friendly method for long-term, high frequency monitoring of oral anticoagulation.
5. British Society for Haematology Guidelines, 2005
An evidence-based review and guidelines for patient self-testing and management of oral anticoagulation. Fitzmaurice et al., 2005 (23)
Summary Statement:
There is grade A [Level Ib] evidence of the effectiveness of patient self-management.
There is grade C [Level IV] evidence of the effectiveness of patient self-testing.
Only patients with long-term (>1 year) indications for warfarin therapy should be considered for self-testing or -management.
There is no additional evidence to guide the selection of patients or the intensity of training and support (including quality control testing) for patients being offered self-testing or -management.
There is grade B [Level II] evidence of the cost-effectiveness of self-management within the US and German healthcare systems. This is founded on improved therapeutic control compared with routine care. However, routine care results are poor compared with reported UK clinical data. No published evidence exists for cost-effectiveness within the UK healthcare system.
No data is provided regarding the nature of patient interpretation of INR and no formal dosing algorithms have been published.
Point-of-Care INR Monitoring Devices - Ontario Health Technology Assessment Series 2009; 9 (12) 71
Consensus Guidelines for PST/PSM: 1. Only patients with long-term indications for warfarin therapy should be considered for self-testing or
-management. In exceptional circumstances, patients with short-term indications (e.g. first deep vein thrombosis) may be considered for self-testing. It should be noted that it can take 2–3 months before a patient becomes fully accustomed to this method of therapy management.
2. Only conforming European-marked devices that have undergone acceptable evaluations by an expert, independent body (e.g. the MHRA in the UK) subject to external peer-review, are to be used for self-testing. Discussions should be held with the local hematologist and Trust POC committee before initiating patient self-testing. Local guidelines and procurement rules should also be checked.
3. Patients (or patient carers) must give informed consent to undertake patient self-management. This will include an agreement to attend clinic regularly and to record results accurately.
4. Competence for INR reading must be assessed by a trained healthcare professional prior to allowing home testing.
5. Competence to correctly interpret an INR result must be assessed by a healthcare professional prior to allowing self management. This must be based on an individualized patient algorithm.
6. Previous stability of INR is not a prerequisite to home testing as unstable patients may benefit from increased autonomy and the possibility of increased frequency of testing.
7. Patients considered for self-testing or -management must have a documented INR target in line with accepted guidelines and clinical practice.
8. Contraindications for patient self-testing or -management will include previous non-compliance, in terms of either attendance at clinic or taking of medication.
9. Patients undertaking self-testing or -management must retain contact with a named clinician. In most cases, this will be a consultant hematologist who will be clinically responsible. In all cases the patient’s GP and the clinician who initiated the warfarin therapy must be informed.
10. Self-managed patients must be reviewed at least every 6 months by the responsible clinician.
11. Electronic QC where available should be used each time the monitor is used.
12. The internal quality control material should be analysed when introducing a new batch/lot number of test strips or when commencing use of newly delivered test strips (even when they are the same lot number as used previously).
13. The IQC material should be re-tested if an unexpectedly high or low result occurs.
14. The IQC should be tested every 1 and 3 months, or with each testing intervals exceed 12 weeks.
15. Self-testing patients should participate in at least one form of EQA (i.e. one of a, b or c below). If a patient has persistent problems, the monitor should be assessed in a centre that participates satisfactorily in a formal EQA programme and self-testing should be suspended if persistent problems are unresolved (this is the case whichever option is employed).
a) Patients may participate in a formal EQA programme, such as UK NEQAS, Common External Quality Assessment System (CEQAS) or other accredited programme.
b) The patients’ monitor may be assessed in a centre that participates satisfactorily in an accredited EQA programme, such as NEQAS. In this case, the patient should test their own blood on their own monitor/test strips and the monitor/test strips routinely used in the clinic; the INR results should be within 0.5 INR units of each other.
Point-of-Care INR Monitoring Devices - Ontario Health Technology Assessment Series 2009; 9 (12) 72
c) A venous sample may be collected at the same time as the POC test and sent to an appropriate hospital laboratory for analysis. This can be carried out every 6 months for stabilised patients.
Point-of-Care INR Monitoring Devices - Ontario Health Technology Assessment Series 2009; 9 (12) 73
In this case, INR results are acceptable if within 0.5 INR units of each other.
16. Any INR result between 4.0and 8.0 should be repeated with the POC device to ensure that the prolonged result is not a consequence of poor sample quality. Repeat analysis should be within 0.5.
17. If an INR of >8.0 or sample error is obtained, a venous sample should be collected and analysed by an appropriate hospital laboratory.
Additional Considerations Frequency of INR monitoring and Patient Education The frequency of INR monitoring by the standard practice of laboratory-based testing is limited by the availability and accessibility of testing facilities, the direct and indirect costs of testing, and the time constraints of the patient. (64) According to clinical experts, stable patients are typically monitored once a month in Ontario. POC INR monitoring devices allow for more frequent INR monitoring yet, at present, there are no formal guidelines relating to the optimal frequency of testing for PST and PSM. In the majority of studies included in this review, patients in the POC intervention group tested INR more frequently than the control group patients. This increased frequency of testing may be a contributing factor to the observed differences in complications and anticoagulation control between POC and usual care. This can be explained by the fact that more frequent testing allows the patient or health care provider to adjust the OAT dosage before the INR deviates too much from the therapeutic target range. Testing frequency depends on many factors relating to health system feasibility, as well as patient level factors such as patient stability, stage of treatment, compliance and changes in co-morbid conditions, medications and diet. (5) Testing frequency also has cost implications as more frequent testing requires additional testing strips. With PSM/PST strategies, however, with this increased cost may be offset over time by a cost-saving reduction in professional support. A large ongoing prospective RCT by Matchar et al. is hoping to be able to provide more information as to whether or not the frequency of testing is an independent predictor of time in the therapeutic target range. (65) The simple explanation that the increased frequency of INR monitoring correlates to an improvement in anticoagulation control (and a subsequent decrease in major complications) likely does not completely explain the observed differences between POC intervention and control groups. For instance, the studies performed by Claes et al. (32) and by Cromheecke et al. (24) had similar INR testing frequencies in POC intervention and control groups, yet the results indicated a decreased risk of complications with POC INR monitoring, while the study by Menendez-Jandula et al. (43) showed better clinical outcomes without improving INR control. Many other factors potentially play a role in the beneficial impact of POC INR monitoring such as greater patient empowerment through education and training, increased patient compliance, and an improvement in self-awareness of health status. (43) Patient education may also play an important role in the observed differences between PST/PSM strategies and usual care. For example, a comprehensive and intense education program may lead to enhanced compliance with medication and monitoring regimes. Khan et al. (34) noted that “evidence suggests that patients having a good contact with health care professionals and more knowledge about their disease and treatment adhere better to their therapy”. Among the reviewed RCTs, information on patient compliance was limited. It’s hoped that additional information on patient compliance with medication regime will be available once the results of two ongoing studies are published. An Australian study by Laurence et al. (66) is assessing medication compliance through a self-administered questionnaire and the Medication Adherence Reporting Scale (MARS-5) and an American study by Matchar et al. (65) is also assessing medication compliance based on cuvette counts, device memory download and automated INR follow-up.
Point-of-Care INR Monitoring - Ontario Health Technology Assessment Series 2009; 9 (12) 74
Currently, there is no uniform training program nor are their standards for the content or duration of training programs. However, some consensus guidelines, such as those from the ISMAA, have noted that patient education programs should include some basic minimums of information. In particular, training programs should provide information on:
blood coagulation,
theoretical principles of individual anticoagulation
information on drug interactions with oral anticoagulants,
practical information on coagulation monitoring with POC devices,
details on the evaluation of INR measurements and, if necessary, dose adjustment, signs of bleeding or thromboembolic events,
information on testing frequency,
advice on keeping a patient diary/quality control record, and
advice on other patient characteristics such as travel and nutrition. (5)
In addition to training patients, the German Association of Self Management of Anticoagulation (ASA) organizes seminars to train health care professionals. The content of the health care professional program covers theoretical and pharmaceutical aspects of anticoagulation, outlines how to demonstrate the equipment to be used by patients, and a practical session using the POC testing systems. (23)
Point-of-Care INR Monitoring Devices - Ontario Health Technology Assessment Series 2009; 9 (12) 75
Point-of-Care INR Monitoring Devices - Ontario Health Technology Assessment Series 2009; 9 (12) 76
Ontario Health System Impact Analysis Eligibility and Selection of Patients for PST/PSM Strategies Not all patients on long-term OAT have the ability to practice PSM or PST and accordingly may be unsuitable candidates for these strategies. For example, a patient who has recently begun OAT may need time to regulate OAT dosage and experience large fluctuations in INR, making them less than ideal candidates at that time. In Ontario, no set criteria for patient eligibility for PST/PSM have been established. Considerations might include the ability to understand the concept of OAT and its potential risks, willingness to actively participate in managing condition, sufficient manual dexterity, and acuity of vision. Age, underlying indication for OAT and existing comorbidities might also impact patient suitability for POC strategies. Caregivers may also undertake PST/PSM strategies if patients are not in a position to perform testing themselves. In relating this to diabetes management where PST/PSM is quite a common component of disease management, various studies examining insulin-dependent diabetes, PST, and PSM have found that most patients who are able to lead an independent and self-supporting life are capable of these POC strategies in principle, irrespective of education or social status. (5) The Canadian Agency for Drugs and Technologies in Health (27) estimated that 24% of OAT patients would be suitable candidates for PST/PSM strategies and be willing to use the POC device. This proportion was estimated as the upper boundary for the uptake of PST/PSM in Canada, which can be applied to the Ontario setting. The estimate was derived from a UK study conducted in 48 general practices where unselected patients were invited to participate in PST/PSM. In addition, an Ontario expert confirmed that 24% is a reliable estimate for the uptake of POC devices by patients. By applying this percentage to the Ontario setting, approximately 32,000 patients would be eligible for PST/PSM strategies in Ontario. These numbers are expected to increase with the aging population and the associated increase in the prevalence of atrial fibrillation and venous thromboembolism.
Diffusion of the Technology The use of POC devices for INR monitoring has been diffusing in Ontario. According to clinical experts, the diffusion of this technology is currently concentrated at the institutional setting, including hospitals, ACCs, long-term care facilities, physician offices and pharmacies and is much less commonly used at the patient level. There are pockets of usage throughout the province. According to the manufacturer of CoaguChek (Roche), their POC device is being used in ACCs, in major hospitals and in pharmacies across Ontario. There are over 80 pharmacies in Ontario that are currently certified by the manufacturer to provide patient training on the CoaguChek meter, including how to take INR readings. From 2002-2007, Roche estimated that there were 59 Coaguchek meters (S, XS and XS Plus) in pharmacies, 327 meters for patient use, and 103 in institutions where the majority of these units were provided to patients for PST/PSM via ACCs. In April 2007, the Laboratories Branch of the Ontario Ministry of Health and Long-Term Care released a policy on all POC testing and issued guidelines for hospitals with a licensed laboratory, for hospitals without a licensed laboratory and for long-term care facilities. However, there are currently no guidelines for other settings such as physicians’ offices. Tables 24 and 25 below illustrate the diffusion of POC INR devices in other Canadian jurisdictions and in the United States.
Table 24: Survey of Provinces/Territories* Province/Territory Funding Status
Newfoundland There is no reference to the point of care devices in our Medical Payment Schedule. There is no information on their use and cost coverage.
If a patient obtained his or her INR readings using such a device and adjusted their anticoagulant dose under the supervision of a physician there is no rule in the schedule which would prohibit the physician from billing code 54226 Anticoagulant Supervision (monthly).
These devices are not publicly funded in Newfoundland and Labrador
New Brunswick These services are not available in New Brunswick.
Nova Scotia The Coagucheck machine is currently undergoing research trials at the QEII in Halifax. If a physician chooses to use this device in his office, he would either have to absorb the cost of the machine, strips etc or charge the
patient privately. He could not charge for an office visit if the visit were purely for the purposes of getting the test done.
Prince Edward Island There are no fee codes for POC devices and do not pay for anything except telephone advice. INR testing at the "point of care " is not covered in P.E.I. We are aware that it is being offered in several "Drug Stores" on PEI but it is NOT an insured service.
Quebec No reply to date.
Manitoba Not insured in Manitoba Not covered by Insured Benefits Branch of Manitoba Health and Healthy Living.
Saskatchewan We do not have access to INR assessments other than through hospital labs. Not insured.
Alberta Such devices are not covered in the fee schedule, nor is there any funding of the test strips. This topic is currently under review by the Alberta Health Technologies Decision Process, and the results will likely be sent out for
stakeholder consultation within the next few months.
British Columbia The testing with point of care monitoring devices for OAT is not an insured benefit in BC.
Yukon There is no listing in the Physician Payment Schedule specifically for oral anticoagulant therapy.
Northwest Territories No reply to date.
Nunavut We have a number of POC machines for INR measurement because of the difficulties associated with transporting serum samples for measurement in the regional labs. Since the testing is exclusively done by the Community Health Nurses and all the family docs are on contract, billing is not an issue.
* As of May 2009 with the exception of Yukon and Nunavut that were updated in November 2008.
Point-of-Care INR Monitoring - Ontario Health Technology Assessment Series 2009; 9 (12) 77
Point-of-Care INR Monitoring Devices - Ontario Health Technology Assessment Series 2009; 9 (12) 78
Table 25: Survey of Insurers in United States* Insurer Funding Status
Aetna Aetna considers prothrombin time home testing units (home INR testing) medically necessary durable medical equipment for persons who require chronic oral anticoagulation with warfarin for a mechanical heart valve, chronic atrial fibrillation, deep venous thrombosis, or venous embolism and thrombosis of deep vessels of lower extremity, where both of the following criteria are met: 1. The patient must have been anticoagulated for at least three months prior to use of the home INR devices; and 2. The expected need for home INR testing is 6 or more months.
Aetna considers prothrombin time home testing units experimental and investigational for all other indications.
Cigna Medically necessary for patients receiving long-term OAT (i.e., six months or longer) who are suitable candidates for self-management.
Regence At home monitoring of chronic warfarin therapy may be considered medically necessary when all of the following criteria are met: 1. The patient has a mechanical heart valve or similarly requires anticoagulation to a targeted INR level of greater than 3 2. The patient has undergone anticoagulation management for at least 3 months
Testing more frequently than once per week is generally considered not medically necessary.
Centers for Medicare and Medicaid
Covered for the use of home prothrombin time INR monitoring for anticoagulation management for patients taking warfarin for a mechanical heart valve, chronic atrial fibrillation and venous thromboembolism. The monitor and the home testing must be prescribed by a treating physician and the following requirements must be met: 1. The patients must have been anticoagulated for at least 3 months proper to use of the home INR device 2. The patients must undergo a face-to-face educational program on anticoagulation management and demonstrate the correct
use of the device prior to its use in the home 3. The patients continue to correctly use the device in the context of the management of the anticoagulation therapy following
initiation of home monitoring 4. Self-testing with the device should not occur more frequently than once a week
*As of March 2009
Implementation Considerations There are several barriers to the use and implementation of POC INR monitoring devices. According to clinical experts, these include such factors as a lack of physician familiarity with POC devices, the lack of an approach to identifying eligible patients and inadequate resources for effective patient education and training. There is also some resistance to changing the established laboratory-based method of INR monitoring. Issues of cost and insufficient reimbursement strategies may also form a hindrance to implementation of POC devices. Currently, POC INR testing is more costly due to the cost of the test strips than standard laboratory-based INR methods. A recent survey of anticoagulation specialists in the United States revealed that the top 3 barriers to implementing a PST POC strategy were cost of instrument, cost of test strips, and fear that PST might lead to unintended self management. Additional barriers included loss of clinic revenue, perceived inability of patients to perform PST, inability to fit PST into clinic workflow, and lack of time to set up guidelines and recruit patients. (67) Another major consideration for implementation is the development of effective quality assurance programs. Quality assurance of POC devices is required to ensure that INR results are accurate and precise. There are both internal and external quality assurance (EQA) methods. Internal quality control (IQC) checks whether the POC device is working well on the day of use. External quality control checks whether the test result with the POC device corresponds with that of other monitors. As described in a previous section, POC devices have IQC that can either be electronic and/or liquid based controls that are provided by the manufacturer. Some devices also have IQC built into the test strips. There is no evidence on the optimal frequency of performing IQC but recent guidelines have suggested that IQC should be conducted when a new batch/lot of test strips is introduced, when there is any doubt about the storage conditions of test strips, if an unexpectedly high or low result INR occurs or if all is normal, testing should ICQ should be performed every 1 to 3 months. (23) Recent guidelines have also suggested that results should not differ by more than 0.5 units. (23) External quality assurance programs can be composed of 2 approaches. The first option is to compare results from the POC device with results from another POC device based at a health care facility, such as an anticoagulation clinic or doctor’s office. The second approach is to compare results from the POC device with results from a venous blood sample sent to a laboratory for INR determination. None of the studies included in the present review included information on whether patients should regularly employ some form of EQA to test the reliability of their INR results with POC devices and according to guidelines from the UK the whole issue of both internal and external quality control for POC strategies of PST and PSM does not seem to have been addressed. (23) In the United Kingdom, the National External Quality Assessment Scheme (NEQAS) provides an EQA program for POC devices using a combination of the aforementioned approaches and it is recommended that EQA is performed every 6 months. (8) (23)With the NEQAS program, the accepted range is for INR results to be within 0.5 units of each other. The European Concerted Action on Thrombosis (ECAT) foundation is also involved in quality control programs and it recommends performing EQA at least once a year. (68)
Point-of-Care INR Monitoring - Ontario Health Technology Assessment Series 2009; 9 (12) 79
Point-of-Care INR Monitoring Devices - Ontario Health Technology Assessment Series 2009; 9 (12) 80
Conclusions For a select group of patients who are highly motivated and trained, PSM resulted in significantly fewer thromboembolic events compared to conventional laboratory-based INR testing. No significant differences were observed for major hemorrhages or all-cause mortality. PST and GP/Nurse use of POC strategies are just as effective as conventional laboratory-based INR testing for thromboembolic events, major hemorrhages and all-cause mortality. POC strategies may also result in better OAT control as measured by the proportion of time INR is in the therapeutic range and there appears to be beneficial impacts on patient satisfaction and QoL. The use of POC devices should factor patient suitability, patient education and training, health system constraints, and affordability.
Appendices Appendix 1: Literature Search Strategies Revised POC Search – November 2008 Search date: November 25, 2008 Database: Ovid MEDLINE(R) <1996 to November Week 2 2008> Search Strategy: -------------------------------------------------------------------------------- 1 exp Anticoagulants/ (55148) 2 (anticoagul$ or anti-coagul$).mp. [mp=title, original title, abstract, name of substance word, subject heading word] (35768) 3 exp Vitamin K/ai [Antagonists & Inhibitors] (436) 4 (warfarin or aldocumar or marevan or coumadin$ or tedicumar or warfant).mp. [mp=title, original title, abstract, name of substance word, subject heading word] (8227) 5 exp International Normalized Ratio/ or inr.mp. or International Normalized Ratio.mp. [mp=title, original title, abstract, name of substance word, subject heading word] (4009) 6 or/1-5 (67214) 7 exp Drug Monitoring/ (7466) 8 exp Blood Coagulation Tests/ (8401) 9 exp Reagent Kits, Diagnostic/ (6754) 10 exp Point-of-Care Systems/ or exp Self Care/ or self manage*.mp. or self monitor*.mp. or self test*.mp. or self care.mp. [mp=title, original title, abstract, name of substance word, subject heading word] (24649) 11 ((bedside or bed-side or point of care) adj10 (test$ or monitor$)).mp. [mp=title, original title, abstract, name of substance word, subject heading word] (2268) 12 exp Self Administration/ (3815) 13 (Hemochron or avocet or act ii or coumatrak or RapidPointCoag or ProTime or Pro Time or CoaguChek or INRatio or thrombolytic assessment systems or TAS or coagulometer*).mp. [mp=title, original title, abstract, name of substance word, subject heading word] (1555) 14 or/7-13 (48088) 15 6 and 14 (5933) 16 limit 15 to (humans and english language and yr="2006 - 2008") (1187) 17 limit 16 to (controlled clinical trial or meta analysis or randomized controlled trial) (142) 18 exp Technology Assessment, Biomedical/ or exp Evidence-based Medicine/ (34826) 19 (health technology adj2 assess$).mp. [mp=title, original title, abstract, name of substance word, subject heading word] (633) 20 (meta analy$ or metaanaly$ or pooled analysis or (systematic$ adj2 review$)).mp. or (published studies or published literature or medline or embase or data synthesis or data extraction or cochrane).ab. (65814) 21 exp Random Allocation/ or random$.mp. [mp=title, original title, abstract, name of substance word, subject heading word] (373474) 22 exp Double-Blind Method/ (53294) 23 exp Control Groups/ (772) 24 exp Placebos/ (9302) 25 (RCT or placebo? or sham?).mp. [mp=title, original title, abstract, name of substance word, subject heading word] (94588) 26 or/17-25 (480697) 27 16 and 26 (222) Database: EMBASE <1980 to 2008 Week 47> Search Strategy: -------------------------------------------------------------------------------- 1 exp Anticoagulant Agent/ (261555) 2 exp anticoagulant therapy/ (11789) 3 (anticoagul$ or anti-coagul$).mp. [mp=title, abstract, subject headings, heading word, drug trade name, original title, device manufacturer, drug manufacturer name] (67673) 4 (warfarin or aldocumar or marevan or coumadin$ or tedicumar or warfant).mp. [mp=title, abstract, subject headings, heading word, drug trade name, original title, device manufacturer, drug manufacturer name] (34602) 5 exp International Normalized Ratio/ or inr.mp. or International Normalized Ratio.mp. [mp=title, abstract, subject headings, heading word, drug trade name, original title, device manufacturer, drug manufacturer name] (5030)
Point-of-Care INR Monitoring - Ontario Health Technology Assessment Series 2009; 9 (12) 81
6 or/1-5 (274808)
7 exp Blood Clotting Test/ (2224) 8 exp drug monitoring/ (27385) 9 exp "Point of Care Testing"/ (754) 10 ((bedside or bed-side or point of care) adj10 (test$ or monitor$ or measure$)).mp. [mp=title, abstract, subject headings, heading word, drug trade name, original title, device manufacturer, drug manufacturer name] (3467) 11 exp Self Care/ (14097) 12 exp Self Monitoring/ or exp Home Monitoring/ or self manage*.mp. or self monitor*.mp. or self test*.mp. or self care*.mp. [mp=title, abstract, subject headings, heading word, drug trade name, original title, device manufacturer, drug manufacturer name] (14387) 13 (Hemochron or avocet or act ii or coumatrak or RapidPointCoag or ProTime or Pro Time or CoaguChek or INRatio or thrombolytic assessment systems or TAS or coagulometer*).mp. [mp=title, abstract, subject headings, heading word, drug trade name, original title, device manufacturer, drug manufacturer name] (2030) 14 or/7-13 (56075) 15 6 and 14 (5022) 16 limit 15 to (human and english language and yr="2006 - 2008") (900) 17 Randomized Controlled Trial/ (163066) 18 exp Randomization/ (26318) 19 exp RANDOM SAMPLE/ (1324) 20 exp Biomedical Technology Assessment/ or exp Evidence Based Medicine/ (294280) 21 (health technology adj2 assess$).mp. [mp=title, abstract, subject headings, heading word, drug trade name, original title, device manufacturer, drug manufacturer name] (663) 22 (meta analy$ or metaanaly$ or pooled analysis or (systematic$ adj2 review$) or published studies or published literature or medline or embase or data synthesis or data extraction or cochrane).ti,ab. (63066) 23 Double Blind Procedure/ (70553) 24 exp Triple Blind Procedure/ (12) 25 exp Control Group/ (2488) 26 exp PLACEBO/ or placebo$.mp. or sham$.mp. [mp=title, abstract, subject headings, heading word, drug trade name, original title, device manufacturer, drug manufacturer name] (209509) 27 (random$ or RCT).mp. [mp=title, abstract, subject headings, heading word, drug trade name, original title, device manufacturer, drug manufacturer name] (424099) 28 (control$ adj2 clinical trial$).mp. [mp=title, abstract, subject headings, heading word, drug trade name, original title, device manufacturer, drug manufacturer name] (280028) 29 or/17-28 (784977) 30 29 and 16 (266) # Query Limiters/Expanders Last Run Via Results S30 (S29 and S17) Limiters - Published Date from: 200601-200912 Search modes - Boolean/Phrase Interface - EBSCOhost Search Screen - Advanced Search Database - CINAHL;Pre-CINAHL 95 S29 (S28 or S27 or S26 or S25 or S24 or S23 or S22 or S21 or S20 or S19 or S18) Search modes - Boolean/Phrase Interface - EBSCOhost Search Screen - Advanced Search Database - CINAHL;Pre-CINAHL 108114 S28 (MH "Control (Research)+") Search modes - Boolean/Phrase Interface - EBSCOhost Search Screen - Advanced Search Database - CINAHL;Pre-CINAHL 2474 S27 (MH "Control (Research)+") Search modes - Boolean/Phrase Interface - EBSCOhost Search Screen - Advanced Search Database - CINAHL;Pre-CINAHL 2474 S26 (MH "Placebos") Search modes - Boolean/Phrase Interface - EBSCOhost Search Screen - Advanced Search Database - CINAHL;Pre-CINAHL 4799 S25 (MH "Double-Blind Studies") or (MH "Single-Blind Studies") or (MH "Triple-Blind Studies") Search modes - Boolean/Phrase Interface - EBSCOhost Search Screen - Advanced Search Database - CINAHL;Pre-CINAHL 15393 S24 meta analy* or metaanaly* or pooled analysis or systematic* N2 review* or published studies or medline or embase or data synthesis or data extraction or cochrane Search modes - Boolean/Phrase Interface - EBSCOhost
Point-of-Care INR Monitoring Devices - Ontario Health Technology Assessment Series 2009; 9 (12) 82
Search Screen - Advanced Search
Point-of-Care INR Monitoring Devices - Ontario Health Technology Assessment Series 2009; 9 (12) 83
Database - CINAHL;Pre-CINAHL 26870 S23 (MH "Systematic Review") Search modes - Boolean/Phrase Interface - EBSCOhost Search Screen - Advanced Search Database - CINAHL;Pre-CINAHL 4106 S22 (MH "Meta Analysis") Search modes - Boolean/Phrase Interface - EBSCOhost Search Screen - Advanced Search Database - CINAHL;Pre-CINAHL 7156 S21 RCT or RCTs Search modes - Boolean/Phrase Interface - EBSCOhost Search Screen - Advanced Search Database - CINAHL;Pre-CINAHL 2334 S20 health technology N5 assess* Search modes - Boolean/Phrase Interface - EBSCOhost Search Screen - Advanced Search Database - CINAHL;Pre-CINAHL 172 S19 random* or sham* Search modes - Boolean/Phrase Interface - EBSCOhost Search Screen - Advanced Search Database - CINAHL;Pre-CINAHL 81437 S18 (MH "Random Assignment") or (MH "Random Sample+") Search modes - Boolean/Phrase Search Screen - Advanced Search Database - CINAHL;Pre-CINAHL 36280 S17 (S16 and S7) Search modes - Boolean/Phrase Search Screen - Advanced Search Database - CINAHL;Pre-CINAHL 1777 S16 (S15 or S14 or S13 or S12 or S11 or S10 or S9 or S8) Database - CINAHL;Pre-CINAHL 23412 S15 Hemochron or avocet or act ii or coumatrak or RapidPointCoag or ProTime or Pro Time or CoaguChek or INRatio or thrombolytic assessment systems or TAS OR coagulometer* Database - CINAHL;Pre-CINAHL 168 S14 bedside N10 test* or bed-side N10 test* or point of care N10 test* or bedside N10 monitor* or bed-side N10 monitor* or point of care N10 monitor* Database - CINAHL;Pre-CINAHL 1278 S13 self-manage* or self-care or self-monitor* or self-test* Database - CINAHL;Pre-CINAHL 15649 S12 (MH "Self Care+") Database - CINAHL;Pre-CINAHL 13821 S11 (MH "Point-of-Care Testing") Database - CINAHL;Pre-CINAHL 852 S10 (MH "Reagent Kits, Diagnostic+") Database - CINAHL;Pre-CINAHL 595 S9 (MH "Blood Coagulation Tests+") Database - CINAHL;Pre-CINAHL 1550 S8 (MH "Drug Monitoring") Database - CINAHL;Pre-CINAHL 2323 S7 (S6 or S5 or S4 or S3 or S2 or S1) Database - CINAHL;Pre-CINAHL 8900 S6 International Normalized Ratio or INR Database - CINAHL;Pre-CINAHL 875 S5 (MH International Normalized Ratio+) Database - CINAHL;Pre-CINAHL 628 S4 (MH "Blood Coagulation Tests+") Database - CINAHL;Pre-CINAHL Display S3 (MH "Vitamin K/AI") Database - CINAHL;Pre-CINAHL Display S2 anticoagul* or anti-coagul* Database - CINAHL;Pre-CINAHL Display S1 (MH "Anticoagulants+") Database - CINAHL;Pre-CINAHL Display
By patients' duration on OAT at study initiation 0.71 Duration on OAT >= 3 months 9 2332 0.79 [0.43, 1.44]
Duration on OAT < 3months 4 1906 0.69 [0.40, 1.18]
By rank order of trial size (# of participants) 0.72 largest studies 4 2795 0.78 [0.49, 1.26]
All other studies 13 2262 0.69 [0.42, 1.14]
By total hours of patient training 0.51 Total hours of patient training< =4hours 6 2043 0.59 [0.32, 1.08] Total hours of patient training >4 hours 5 754 0.83 [0.37, 1.85]
By ratio of INR testing interval (control/intervention) 0.25 Ratio of testing interval > 2 10 3575 0.71 [0.47, 1.07]
Ratio of testing interval <= 2 4 705 1.34 [0.49, 3.61]
* For the estimate of effect, the Odds Ratio (Inverse Variance, Fixed, 95% CI) was used in order to calculate the interaction p-value.
Point-of-Care INR Monitoring Devices - Ontario Health Technology Assessment Series 2009; 9 (12) 86
Table A3: Results of Subgroup Analyses – All Thromboembolic Events
Point-of-Care INR Monitoring Devices - Ontario Health Technology Assessment Series 2009; 9 (12) 87
All Thromboembolic Events
Subgroup Studies Participants Effect Estimate,
Odds Ratio (95% CI) Interaction
p-value By strategy
PST/PSM 16 4690 0.53 [0.37, 0.76] 0.71 Health Care Practitioner 1 367 0.39 [0.08, 1.82]
By strategy 2 PSM 12 3832 0.46 [0.29, 0.72] 0.52 PST 4 858 0.69 [0.38, 1.27] Health Care Practitioner 1 367 0.39 [0.08, 1.82]
By country North America 2 465 0.58 [0.29, 1.16] 0.60 Europe - UK 4 1169 0.74 [0.29, 1.91] Europe - Other 11 3423 0.44 [0.28, 0.68]
By definition of usual care ACC 7 2225 0.34 [0.17, 0.68] 0.23 Primary Care Physician 6 2258 0.60 [0.38, 0.94]
By proportion of patients with a MHV indication MHV > 50% 5 1724 0.56 [0.30, 1.04] 0.65 MHV < 50% 11 2716 0.45 [0.29, 0.69]
By study sponsor Industry Sponsored (any funding) 8 1963 0.39 [0.20, 0.76] 0.37 Not Industry Sponsored 5 1494 0.63 [0.35, 1.13]
By patients' duration on OAT at study initiation Duration on OAT >= 3 months 9 2332 0.36 [0.20, 0.66] 0.20 Duration on OAT < 3months 4 1906 0.62 [0.39, 0.99]
By rank order of trial size (# of participants) largest studies 4 2795 0.50 [0.31, 0.82] 0.88 All other studies 13 2262 0.50 [0.31, 0.81]
By total hours of patient training Total hours of patient training< =4hours 6 2043 0.46 [0.28, 0.77] 0.87 Total hours of patient training >4 hours 5 754 0.46 [0.19, 1.10]
By ratio of INR testing interval (control/intervention) Ratio of testing interval > 2 10 3575 0.45 [0.29, 0.71] 0.55 Ratio of testing interval <= 2 4 705 0.62 [0.24, 1.57]
*For the estimate of effect, the Odds Ratio (Inverse Variance, Fixed, 95% CI) was used in order to calculate the interaction p-value.
Table A4: Results of Subgroup Analyses – Deaths
Point-of-Care INR Monitoring - Ontario Health Technology Assessment Series 2009; 9 (12) 89
By patients' duration on OAT at study initiation 0.61 Duration on OAT >= 3 months 6 1928 0.64 [0.28, 1.46] Duration on OAT < 3months 2 465 0.77 [0.42, 1.44]
By rank order of trial size (# of participants) 0.05 largest studies 2 1354 0.38 [0.19, 0.78] All other studies 9 1552 0.90 [0.55, 1.46]
By total hours of patient training 0.18 Total hours of patient training< =4hours 5 1958 0.58 [0.36, 0.92] Total hours of patient training >4 hours 3 435 0.56 [0.03, 9.29]
By ratio of INR testing interval (control/intervention) 0.70 Ratio of testing interval > 2 5 1749 0.53 [0.21, 1.35] Ratio of testing interval <= 2 3 419 0.99 [0.06, 16.06]
* For the estimate of effect, the Odds Ratio (Inverse Variance, Fixed, 95% CI) was used in order to calculate the interaction p-value.
Appendix 4: One-Way Sensitivity Analyses Table A5: One-way sensitivity analysis of INR test frequency in the patient self-testing strategy.
Tests (n) Strategy Cost
Effectiveness (QALY) Cost per QALY ICER
13 Patient self-management with POC $13,545.08 4.613 2936.582 $/QALY
Patient self-testing with POC $18,747.81 4.179 4486.353 $/QALY (Dominated)
Healthcare testing with POC $18,988.84 4.041 4699.616 $/QALY (Dominated)
Standard care $23,825.92 3.955 6024.665 $/QALY (Dominated)
22.75 Patient self-management with POC $13,545.08 4.613 2936.582 $/QALY
Healthcare testing with POC $18,988.84 4.041 4699.616 $/QALY (Dominated)
Patient self-testing with POC $19,122.89 4.179 4576.110 $/QALY (Dominated)
Standard care $23,825.92 3.955 6024.665 $/QALY (Dominated)
32.5 Patient self-management with POC $13,545.08 4.613 2936.582 $/QALY
Healthcare testing with POC $18,988.84 4.041 4699.616 $/QALY (Dominated)
Patient self-testing with POC $19,497.97 4.179 4665.867 $/QALY (Dominated)
Standard care $23,825.92 3.955 6024.665 $/QALY (Dominated)
42.25 Patient self-management with POC $13,545.08 4.613 2936.582 $/QALY
Healthcare testing with POC $18,988.84 4.041 4699.616 $/QALY (Dominated)
Patient self-testing with POC $19,873.05 4.179 4755.624 $/QALY (Dominated)
Standard care $23,825.92 3.955 6024.665 $/QALY (Dominated)
52 Patient self-management with POC $13,545.08 4.613 2936.582 $/QALY
Healthcare testing with POC $18,988.84 4.041 4699.616 $/QALY (Dominated)
Patient self-testing with POC $20,248.14 4.179 4845.381 $/QALY (Dominated)
Standard care $23,825.92 3.955 6024.665 $/QALY (Dominated)
Point-of-Care INR Monitoring - Ontario Health Technology Assessment Series 2009; 9 (12) 91
QALY: Quality Adjusted Life Year; ICER: Incremental cost-effectiveness ratio
Table A6: One-way sensitivity analysis of frequency of INR tests in the standard care strategy
Tests (n) Strategy Cost
Effectiveness (QALY) Cost per QALY ICER
13 Patient self-management with POC $13,545.08 4.613 2936.582 $/QALY
Healthcare testing with POC $18,988.84 4.041 4699.616 $/QALY (Dominated)
Patient self-testing with POC $20,248.14 4.179 4845.381 $/QALY (Dominated)
Standard care $23,707.22 3.955 5994.650 $/QALY (Dominated)
22.75 Patient self-management with POC $13,545.08 4.613 2936.582 $/QALY
Healthcare testing with POC $18,988.84 4.041 4699.616 $/QALY (Dominated)
Patient self-testing with POC $20,248.14 4.179 4845.381 $/QALY (Dominated)
Standard care $23,974.30 3.955 6062.184 $/QALY (Dominated)
32.5 Patient self-management with POC $13,545.08 4.613 2936.582 $/QALY
Healthcare testing with POC $18,988.84 4.041 4699.616 $/QALY (Dominated)
Patient self-testing with POC $20,248.14 4.179 4845.381 $/QALY (Dominated)
Standard care $24,241.38 3.955 6129.719 $/QALY (Dominated)
42.25 Patient self-management with POC $13,545.08 4.613 2936.582 $/QALY
Healthcare testing with POC $18,988.84 4.041 4699.616 $/QALY (Dominated)
Patient self-testing with POC $20,248.14 4.179 4845.381 $/QALY (Dominated)
Standard care $24,508.46 3.955 6197.253 $/QALY (Dominated)
52 Patient self-management with POC $13,545.08 4.613 2936.582 $/QALY
Healthcare testing with POC $18,988.84 4.041 4699.616 $/QALY (Dominated)
Patient self-testing with POC $20,248.14 4.179 4845.381 $/QALY (Dominated)
Standard care $24,775.54 3.955 6264.788 $/QALY (Dominated)
Point-of-Care INR Monitoring Devices - Ontario Health Technology Assessment Series 2009; 9 (12) 92
QALY: Quality Adjusted Life Year; ICER: Incremental cost-effectiveness ratio
Table A7: One-way sensitivity analysis of number of patients per clinic in the healthcare staff testing strategy
Patients (n) Strategy Cost
Effectiveness (QALY) Cost per QALY ICER
1 Patient self-management with POC $13,545.08 4.613 2936.582 $/QALY
Patient self-testing with POC $20,248.14 4.179 4845.381 $/QALY (Dominated)
Healthcare testing with POC $20,323.57 4.041 5029.953 $/QALY (Dominated)
Standard care $23,825.92 3.955 6024.665 $/QALY (Dominated)
250.75 Patient self-management with POC $13,545.08 4.613 2936.582 $/QALY
Healthcare testing with POC $18,991.50 4.041 4700.274 $/QALY (Dominated)
Patient self-testing with POC $20,248.14 4.179 4845.381 $/QALY (Dominated)
Standard care $23,825.92 3.955 6024.665 $/QALY (Dominated)
500.5 Patient self-management with POC $13,545.08 4.613 2936.582 $/QALY
Healthcare testing with POC $18,988.84 4.041 4699.615 $/QALY (Dominated)
Patient self-testing with POC $20,248.14 4.179 4845.381 $/QALY (Dominated)
Standard care $23,825.92 3.955 6024.665 $/QALY (Dominated)
750.25 Patient self-management with POC $13,545.08 4.613 2936.582 $/QALY
Healthcare testing with POC $18,987.95 4.041 4699.395 $/QALY (Dominated)
Patient self-testing with POC $20,248.14 4.179 4845.381 $/QALY (Dominated)
Standard care $23,825.92 3.955 6024.665 $/QALY (Dominated)
1000 Patient self-management with POC $13,545.08 4.613 2936.582 $/QALY
Healthcare testing with POC $18,987.50 4.041 4699.285 $/QALY (Dominated)
Patient self-testing with POC $20,248.14 4.179 4845.381 $/QALY (Dominated)
Standard care $23,825.92 3.955 6024.665 $/QALY (Dominated)
QALY: Quality Adjusted Life Year; ICER: Incremental cost-effectiveness ratio
Point-of-Care INR Monitoring Devices - Ontario Health Technology Assessment Series 2009; 9 (12) 93
Table A8: One-way sensitivity analysis of frequency of INR tests in the patient self-management strategy
Tests (n) Strategy Cost
Effectiveness (QALY) Cost per QALY ICER
13 Patient self-management with POC $11,929.89 4.613 2586.408 $/QALY
Healthcare testing with POC $18,988.84 4.041 4699.616 $/QALY (Dominated)
Patient self-testing with POC $20,248.14 4.179 4845.381 $/QALY (Dominated)
Standard care $23,825.92 3.955 6024.665 $/QALY (Dominated)
22.75 Patient self-management with POC $12,333.69 4.613 2673.952 $/QALY
Healthcare testing with POC $18,988.84 4.041 4699.616 $/QALY (Dominated)
Patient self-testing with POC $20,248.14 4.179 4845.381 $/QALY (Dominated)
Standard care $23,825.92 3.955 6024.665 $/QALY (Dominated)
32.5 Patient self-management with POC $12,737.49 4.613 2761.495 $/QALY
Healthcare testing with POC $18,988.84 4.041 4699.616 $/QALY (Dominated)
Patient self-testing with POC $20,248.14 4.179 4845.381 $/QALY (Dominated)
Standard care $23,825.92 3.955 6024.665 $/QALY (Dominated)
42.25 Patient self-management with POC $13,141.28 4.613 2849.038 $/QALY
Healthcare testing with POC $18,988.84 4.041 4699.616 $/QALY (Dominated)
Patient self-testing with POC $20,248.14 4.179 4845.381 $/QALY (Dominated)
Standard care $23,825.92 3.955 6024.665 $/QALY (Dominated)
52 Patient self-management with POC $13,545.08 4.613 2936.582 $/QALY
Healthcare testing with POC $18,988.84 4.041 4699.616 $/QALY (Dominated)
Patient self-testing with POC $20,248.14 4.179 4845.381 $/QALY (Dominated)
Standard care $23,825.92 3.955 6024.665 $/QALY (Dominated)
QALY: Quality Adjusted Life Year; ICER: Incremental cost-effectiveness ratio
Point-of-Care INR Monitoring Devices - Ontario Health Technology Assessment Series 2009; 9 (12) 94
Table A9: One-way sensitivity analysis INR test frequency in the healthcare staff testing strategy
Tests (n) Strategy Cost
Effectiveness (QALY) Cost per QALY ICER
13 Patient self-management with POC $13,545.08 4.613 2936.582 $/QALY
Healthcare testing with POC $18,262.38 4.041 4519.823 $/QALY (Dominated)
Patient self-testing with POC $20,248.14 4.179 4845.381 $/QALY (Dominated)
Standard care $23,825.92 3.955 6024.665 $/QALY (Dominated)
22.75 Patient self-management with POC $13,545.08 4.613 2936.582 $/QALY
Healthcare testing with POC $19,896.91 4.041 4924.358 $/QALY (Dominated)
Patient self-testing with POC $20,248.14 4.179 4845.381 $/QALY (Dominated)
Standard care $23,825.92 3.955 6024.665 $/QALY (Dominated)
32.5 Patient self-management with POC $13,545.08 4.613 2936.582 $/QALY
Patient self-testing with POC $20,248.14 4.179 4845.381 $/QALY (Dominated)
Healthcare testing with POC $21,531.43 4.041 5328.892 $/QALY (Dominated)
Standard care $23,825.92 3.955 6024.665 $/QALY (Dominated)
42.25 Patient self-management with POC $13,545.08 4.613 2936.582 $/QALY
Patient self-testing with POC $20,248.14 4.179 4845.381 $/QALY (Dominated)
Healthcare testing with POC $23,165.96 4.041 5733.427 $/QALY (Dominated)
Standard care $23,825.92 3.955 6024.665 $/QALY (Dominated)
52 Patient self-management with POC $13,545.08 4.613 2936.582 $/QALY
Patient self-testing with POC $20,248.14 4.179 4845.381 $/QALY (Dominated)
Standard care $23,825.92 3.955 6024.665 $/QALY (Dominated)
Healthcare testing with POC $24,800.49 4.041 6137.962 $/QALY (Dominated)
Point-of-Care INR Monitoring Devices - Ontario Health Technology Assessment Series 2009; 9 (12) 95
QALY: Quality Adjusted Life Year; ICER: Incremental cost-effectiveness ratio
Table A10: One-way sensitivity analysis of odds ratio estimate for major thromboembolic events in the patient self-testing strategy
OR (Summary Estimate) Strategy Cost
Effectiveness (QALY) Cost per QALY ICER
0.37 Patient self-management with POC $13,545.08 4.613 2936.582 $/QALY
Patient self-testing with POC $14,850.18 4.239 3503.486 $/QALY (Dominated)
Healthcare testing with POC $18,988.84 4.041 4699.616 $/QALY (Dominated)
Standard care $23,825.92 3.955 6024.665 $/QALY (Dominated)
0.595 Patient self-management with POC $13,545.08 4.613 2936.582 $/QALY
Patient self-testing with POC $18,783.18 4.195 4477.401 $/QALY (Dominated)
Healthcare testing with POC $18,988.84 4.041 4699.616 $/QALY (Dominated)
Standard care $23,825.92 3.955 6024.665 $/QALY (Dominated)
0.82 Patient self-management with POC $13,545.08 4.613 2936.582 $/QALY
Healthcare testing with POC $18,988.84 4.041 4699.616 $/QALY (Dominated)
Patient self-testing with POC $22,636.41 4.152 5451.497 $/QALY (Dominated)
Standard care $23,825.92 3.955 6024.665 $/QALY (Dominated)
1.045 Patient self-management with POC $13,545.08 4.613 2936.582 $/QALY
Healthcare testing with POC $18,988.84 4.041 4699.616 $/QALY (Dominated)
Standard care $23,825.92 3.955 6024.665 $/QALY (Dominated)
Patient self-testing with POC $26,411.38 4.110 6425.600 $/QALY (Dominated)
1.27 Patient self-management with POC $13,545.08 4.613 2936.582 $/QALY
Healthcare testing with POC $18,988.84 4.041 4699.616 $/QALY (Dominated)
Standard care $23,825.92 3.955 6024.665 $/QALY (Dominated)
Patient self-testing with POC $30,109.59 4.069 7399.534 $/QALY (Dominated)
OR: Odds Ratio; QALY: Quality Adjusted Life Year; ICER: Incremental cost-effectiveness ratio
Point-of-Care INR Monitoring Devices - Ontario Health Technology Assessment Series 2009; 9 (12) 96
Table A11: One-way sensitivity analysis of odds ratio estimate for major hemorrhagic events in the patient self-testing strategy
OR (Summary Estimate) Strategy Cost
Effectiveness (QALY) Cost per QALY ICER
0.33 Patient self-management with POC $13,545.08 4.613 2936.582 $/QALY
Patient self-testing with POC $17,408.96 4.220 4125.169 $/QALY (Dominated)
Healthcare testing with POC $18,988.84 4.041 4699.616 $/QALY (Dominated)
Standard care $23,825.92 3.955 6024.665 $/QALY (Dominated)
0.75 Patient self-management with POC $13,545.08 4.613 2936.582 $/QALY
Healthcare testing with POC $18,988.84 4.041 4699.616 $/QALY (Dominated)
Patient self-testing with POC $19,845.33 4.185 4742.326 $/QALY (Dominated)
Standard care $23,825.92 3.955 6024.665 $/QALY (Dominated)
1.17 Patient self-management with POC $13,545.08 4.613 2936.582 $/QALY
Healthcare testing with POC $18,988.84 4.041 4699.616 $/QALY (Dominated)
Patient self-testing with POC $22,248.31 4.150 5361.485 $/QALY (Dominated)
Standard care $23,825.92 3.955 6024.665 $/QALY (Dominated)
1.59 Patient self-management with POC $13,545.08 4.613 2936.582 $/QALY
Healthcare testing with POC $18,988.84 4.041 4699.616 $/QALY (Dominated)
Standard care $23,825.92 3.955 6024.665 $/QALY (Dominated)
Patient self-testing with POC $24,618.32 4.115 5982.630 $/QALY (Dominated)
2.01 Patient self-management with POC $13,545.08 4.613 2936.582 $/QALY
Healthcare testing with POC $18,988.84 4.041 4699.616 $/QALY (Dominated)
Standard care $23,825.92 3.955 6024.665 $/QALY (Dominated)
Patient self-testing with POC $26,955.75 4.081 6605.741 $/QALY (Dominated)
OR: Odds Ratio; QALY: Quality Adjusted Life Year; ICER: Incremental cost-effectiveness ratio
Point-of-Care INR Monitoring Devices - Ontario Health Technology Assessment Series 2009; 9 (12) 97
Table A12: One-way sensitivity analysis of odds ratio estimate for all-cause mortality in the patient self-testing strategy
OR (Summary Estimate) Strategy Cost
Effectiveness (QALY) Cost per QALY ICER
0.42 Patient self-management with POC $13,545.08 4.613 2936.582 $/QALY
Healthcare testing with POC $18,988.84 4.041 4699.616 $/QALY (Dominated)
Patient self-testing with POC $20,912.15 4.415 4736.595 $/QALY (Dominated)
Standard care $23,825.92 3.955 6024.665 $/QALY (Dominated)
0.675 Patient self-management with POC $13,545.08 4.613 2936.582 $/QALY
Healthcare testing with POC $18,988.84 4.041 4699.616 $/QALY (Dominated)
Patient self-testing with POC $20,425.78 4.242 4815.464 $/QALY (Dominated)
Standard care $23,825.92 3.955 6024.665 $/QALY (Dominated)
0.93 Patient self-management with POC $13,545.08 4.613 2936.582 $/QALY
Healthcare testing with POC $18,988.84 4.041 4699.616 $/QALY (Dominated)
Patient self-testing with POC $19,953.23 4.075 4896.436 $/QALY (Dominated)
Standard care $23,825.92 3.955 6024.665 $/QALY (Dominated)
1.185 Patient self-management with POC $13,545.08 4.613 2936.582 $/QALY
Healthcare testing with POC $18,988.84 4.041 4699.616 $/QALY (Dominated)
Patient self-testing with POC $19,494.12 3.915 4979.576 $/QALY (Dominated)
Standard care $23,825.92 3.955 6024.665 $/QALY (Dominated)
1.44 Patient self-management with POC $13,545.08 4.613 2936.582 $/QALY
Healthcare testing with POC $18,988.84 4.041 4699.616 $/QALY (Dominated)
Patient self-testing with POC $19,048.10 3.761 5064.954 $/QALY (Dominated)
Standard care $23,825.92 3.955 6024.665 $/QALY (Dominated)
OR: Odds Ratio; QALY: Quality Adjusted Life Year; ICER: Incremental cost-effectiveness ratio
Point-of-Care INR Monitoring Devices - Ontario Health Technology Assessment Series 2009; 9 (12) 98
Table A13: One-way sensitivity analysis of odds ratio estimate for major thromboembolic events in the patient self-management strategy
OR (Summary Estimate) Strategy Cost
Effectiveness (QALY) Cost per QALY ICER
0.11 Patient self-management with POC $9,986.60 4.655 2145.521 $/QALY
Healthcare testing with POC $18,988.84 4.041 4699.616 $/QALY (Dominated)
Patient self-testing with POC $20,248.14 4.179 4845.381 $/QALY (Dominated)
Standard care $23,825.92 3.955 6024.665 $/QALY (Dominated)
0.285 Patient self-management with POC $13,266.40 4.616 2874.107 $/QALY
Healthcare testing with POC $18,988.84 4.041 4699.616 $/QALY (Dominated)
Patient self-testing with POC $20,248.14 4.179 4845.381 $/QALY (Dominated)
Standard care $23,825.92 3.955 6024.665 $/QALY (Dominated)
0.46 Patient self-management with POC $16,493.93 4.578 3603.196 $/QALY
Healthcare testing with POC $18,988.84 4.041 4699.616 $/QALY (Dominated)
Patient self-testing with POC $20,248.14 4.179 4845.381 $/QALY (Dominated)
Standard care $23,825.92 3.955 6024.665 $/QALY (Dominated)
0.635 Healthcare testing with POC $18,988.84 4.041 4699.616 $/QALY
Patient self-management with POC $19,669.97 4.540 4332.713 $/QALY 1363.993
$/QALY
Patient self-testing with POC $20,248.14 4.179 4845.381 $/QALY (Dominated)
Standard care $23,825.92 3.955 6024.665 $/QALY (Dominated)
0.81 Healthcare testing with POC $18,988.84 4.041 4699.616 $/QALY
Patient self-testing with POC $20,248.14 4.179 4845.381 $/QALY (Ext Dom)
Patient self-management with POC $22,795.26 4.503 5062.582 $/QALY 8235.693
$/QALY
Standard care $23,825.92 3.955 6024.665 $/QALY (Dominated)
OR: Odds Ratio; QALY: Quality Adjusted Life Year; ICER: Incremental cost-effectiveness ratio
Point-of-Care INR Monitoring Devices - Ontario Health Technology Assessment Series 2009; 9 (12) 99
Table A14: One-way sensitivity analysis of odds ratio estimate for major hemorrhagic events in the patient self-management strategy
OR (Summary Estimate) Strategy Cost
Effectiveness (QALY) Cost per QALY ICER
0.48 Patient self-management with POC $12,096.97 4.634 2610.313 $/QALY
Healthcare testing with POC $18,988.84 4.041 4699.616 $/QALY (Dominated)
Patient self-testing with POC $20,248.14 4.179 4845.381 $/QALY (Dominated)
Standard care $23,825.92 3.955 6024.665 $/QALY (Dominated)
0.6275 Patient self-management with POC $13,026.92 4.620 2819.480 $/QALY
Healthcare testing with POC $18,988.84 4.041 4699.616 $/QALY (Dominated)
Patient self-testing with POC $20,248.14 4.179 4845.381 $/QALY (Dominated)
Standard care $23,825.92 3.955 6024.665 $/QALY (Dominated)
0.775 Patient self-management with POC $13,952.34 4.606 3028.899 $/QALY
Healthcare testing with POC $18,988.84 4.041 4699.616 $/QALY (Dominated)
Patient self-testing with POC $20,248.14 4.179 4845.381 $/QALY (Dominated)
Standard care $23,825.92 3.955 6024.665 $/QALY (Dominated)
0.9225 Patient self-management with POC $14,873.26 4.593 3238.571 $/QALY
Healthcare testing with POC $18,988.84 4.041 4699.616 $/QALY (Dominated)
Patient self-testing with POC $20,248.14 4.179 4845.381 $/QALY (Dominated)
Standard care $23,825.92 3.955 6024.665 $/QALY (Dominated)
1.07 Patient self-management with POC $15,789.70 4.579 3448.495 $/QALY
Healthcare testing with POC $18,988.84 4.041 4699.616 $/QALY (Dominated)
Patient self-testing with POC $20,248.14 4.179 4845.381 $/QALY (Dominated)
Standard care $23,825.92 3.955 6024.665 $/QALY (Dominated)
OR: Odds Ratio; QALY: Quality Adjusted Life Year; ICER: Incremental cost-effectiveness ratio
Point-of-Care INR Monitoring Devices - Ontario Health Technology Assessment Series 2009; 9 (12) 100
Table A15: One-way sensitivity analysis of odds ratio estimate for all-cause mortality in the patient self-management strategy
OR (Summary Estimate) Strategy Cost
Effectiveness (QALY) Cost per QALY ICER
0.04 Patient self-management with POC $13,857.42 4.783 2897.185 $/QALY
Healthcare testing with POC $18,988.84 4.041 4699.616 $/QALY (Dominated)
Patient self-testing with POC $20,248.14 4.179 4845.381 $/QALY (Dominated)
Standard care $23,825.92 3.955 6024.665 $/QALY (Dominated)
0.5375 Patient self-management with POC $13,192.27 4.422 2983.597 $/QALY
Healthcare testing with POC $18,988.84 4.041 4699.616 $/QALY (Dominated)
Patient self-testing with POC $20,248.14 4.179 4845.381 $/QALY (Dominated)
Standard care $23,825.92 3.955 6024.665 $/QALY (Dominated)
1.035 Patient self-management with POC $12,564.97 4.087 3074.601 $/QALY
Healthcare testing with POC $18,988.84 4.041 4699.616 $/QALY (Dominated)
Patient self-testing with POC $20,248.14 4.179 4845.381 $/QALY 83373.482 $/QALY
Standard care $23,825.92 3.955 6024.665 $/QALY (Dominated)
1.5325 Patient self-management with POC $11,973.51 3.777 3170.497 $/QALY
Healthcare testing with POC $18,988.84 4.041 4699.616 $/QALY (Ext Dom)
Patient self-testing with POC $20,248.14 4.179 4845.381 $/QALY 20567.639 $/QALY
Standard care $23,825.92 3.955 6024.665 $/QALY (Dominated)
2.03 Patient self-management with POC $11,415.97 3.489 3271.608 $/QALY
Healthcare testing with POC $18,988.84 4.041 4699.616 $/QALY (Ext Dom)
Patient self-testing with POC $20,248.14 4.179 4845.381 $/QALY 12810.485 $/QALY
Standard care $23,825.92 3.955 6024.665 $/QALY (Dominated)
OR: Odds Ratio; QALY: Quality Adjusted Life Year; ICER: Incremental cost-effectiveness ratio
Point-of-Care INR Monitoring Devices - Ontario Health Technology Assessment Series 2009; 9 (12) 101
Table A16: One-way sensitivity analysis of odds ratio estimate for major thromboembolic events in the healthcare staff testing strategy
OR (Summary Estimate) Strategy Cost
Effectiveness (QALY) Cost per QALY ICER
0.13 Healthcare testing with POC $9,795.04 4.139 2366.515 $/QALY
Patient self-management with POC
$13,545.08 4.613 2936.582 $/QALY 7919.534 $/QALY
Patient self-testing with POC $20,248.14 4.179 4845.381 $/QALY (Dominated)
Standard care $23,825.92 3.955 6024.665 $/QALY (Dominated)
0.9325 Patient self-management with POC
$13,545.08 4.613 2936.582 $/QALY
Patient self-testing with POC $20,248.14 4.179 4845.381 $/QALY (Dominated)
Healthcare testing with POC $23,546.80 3.992 5899.199 $/QALY (Dominated)
Standard care $23,825.92 3.955 6024.665 $/QALY (Dominated)
1.735 Patient self-management with POC
$13,545.08 4.613 2936.582 $/QALY
Patient self-testing with POC $20,248.14 4.179 4845.381 $/QALY (Dominated)
Standard care $23,825.92 3.955 6024.665 $/QALY (Dominated)
Healthcare testing with POC $36,332.64 3.854 9428.308 $/QALY (Dominated)
2.5375 Patient self-management with POC
$13,545.08 4.613 2936.582 $/QALY
Patient self-testing with POC $20,248.14 4.179 4845.381 $/QALY (Dominated)
Standard care $23,825.92 3.955 6024.665 $/QALY (Dominated)
Healthcare testing with POC $48,216.99 3.725 12945.634 $/QALY
(Dominated)
3.34 Patient self-management with POC
$13,545.08 4.613 2936.582 $/QALY
Patient self-testing with POC $20,248.14 4.179 4845.381 $/QALY (Dominated)
Standard care $23,825.92 3.955 6024.665 $/QALY (Dominated)
Healthcare testing with POC $59,260.68 3.604 16443.052 $/QALY
(Dominated)
OR: Odds Ratio; QALY: Quality Adjusted Life Year; ICER: Incremental cost-effectiveness ratio
Point-of-Care INR Monitoring Devices - Ontario Health Technology Assessment Series 2009; 9 (12) 102
Table A17: One-way sensitivity analysis of odds ratio estimate for major hemorrhagic events in the healthcare staff testing strategy
OR (Summary Estimate) Strategy Cost
Effectiveness (QALY) Cost per QALY ICER
0.52 Patient self-management with POC $13,545.08 4.613 2936.582 $/QALY
Healthcare testing with POC $17,741.05 4.058 4371.534 $/QALY (Dominated)
Patient self-testing with POC $20,248.14 4.179 4845.381 $/QALY (Dominated)
Standard care $23,825.92 3.955 6024.665 $/QALY (Dominated)
0.65 Patient self-management with POC $13,545.08 4.613 2936.582 $/QALY
Healthcare testing with POC $18,479.46 4.048 4565.333 $/QALY (Dominated)
Patient self-testing with POC $20,248.14 4.179 4845.381 $/QALY (Dominated)
Standard care $23,825.92 3.955 6024.665 $/QALY (Dominated)
0.78 Patient self-management with POC $13,545.08 4.613 2936.582 $/QALY
Healthcare testing with POC $19,214.75 4.037 4759.327 $/QALY (Dominated)
Patient self-testing with POC $20,248.14 4.179 4845.381 $/QALY (Dominated)
Standard care $23,825.92 3.955 6024.665 $/QALY (Dominated)
0.91 Patient self-management with POC $13,545.08 4.613 2936.582 $/QALY
Healthcare testing with POC $19,946.91 4.027 4953.514 $/QALY (Dominated)
Patient self-testing with POC $20,248.14 4.179 4845.381 $/QALY (Dominated)
Standard care $23,825.92 3.955 6024.665 $/QALY (Dominated)
1.04 Patient self-management with POC $13,545.08 4.613 2936.582 $/QALY
Patient self-testing with POC $20,248.14 4.179 4845.381 $/QALY (Dominated)
Healthcare testing with POC $20,675.97 4.016 5147.893 $/QALY (Dominated)
Standard care $23,825.92 3.955 6024.665 $/QALY (Dominated)
OR: Odds Ratio; QALY: Quality Adjusted Life Year; ICER: Incremental cost-effectiveness ratio
Point-of-Care INR Monitoring Devices - Ontario Health Technology Assessment Series 2009; 9 (12) 103
Table A18: One-way sensitivity analysis of odds ratio estimate for all-cause mortality in the healthcare staff testing strategy
OR (Summary Estimate) Strategy Cost
Effectiveness (QALY) Cost per QALY ICER
0.25 Patient self-management with POC $13,545.08 4.613 2936.582 $/QALY
Patient self-testing with POC $20,248.14 4.179 4845.381 $/QALY (Dominated)
Healthcare testing with POC $20,348.55 4.546 4476.125 $/QALY (Dominated)
Standard care $23,825.92 3.955 6024.665 $/QALY (Dominated)
1.21 Patient self-management with POC $13,545.08 4.613 2936.582 $/QALY
Healthcare testing with POC $18,628.34 3.909 4765.370 $/QALY (Dominated)
Patient self-testing with POC $20,248.14 4.179 4845.381 $/QALY (Dominated)
Standard care $23,825.92 3.955 6024.665 $/QALY (Dominated)
2.17 Patient self-management with POC $13,545.08 4.613 2936.582 $/QALY
Healthcare testing with POC $17,085.67 3.360 5085.117 $/QALY (Dominated)
Patient self-testing with POC $20,248.14 4.179 4845.381 $/QALY (Dominated)
Standard care $23,825.92 3.955 6024.665 $/QALY (Dominated)
3.13 Patient self-management with POC $13,545.08 4.613 2936.582 $/QALY
Healthcare testing with POC $15,703.15 2.887 5439.287 $/QALY (Dominated)
Patient self-testing with POC $20,248.14 4.179 4845.381 $/QALY (Dominated)
Standard care $23,825.92 3.955 6024.665 $/QALY (Dominated)
4.09 Patient self-management with POC $13,545.08 4.613 2936.582 $/QALY
Healthcare testing with POC $14,464.77 2.480 5832.540 $/QALY (Dominated)
Patient self-testing with POC $20,248.14 4.179 4845.381 $/QALY (Dominated)
Standard care $23,825.92 3.955 6024.665 $/QALY (Dominated)
Point-of-Care INR Monitoring Devices - Ontario Health Technology Assessment Series 2009; 9 (12) 104
OR: Odds Ratio; QALY: Quality Adjusted Life Year; ICER: Incremental cost-effectiveness ratio
Table A19: One-way sensitivity analysis of discount rate
Discount Rate Strategy Cost
Effectiveness (QALY) Cost per QALY ICER
0 Patient self-management with POC $15,796.93 5.178 3050.488 $/QALY
Healthcare testing with POC $22,186.58 4.512 4917.471 $/QALY (Dominated)
Patient self-testing with POC $23,671.09 4.673 5065.323 $/QALY (Dominated)
Standard care $27,874.89 4.413 6316.659 $/QALY (Dominated)
0.015 Patient self-management with POC $15,060.78 4.995 3015.110 $/QALY
Healthcare testing with POC $21,140.83 4.359 4849.695 $/QALY (Dominated)
Patient self-testing with POC $22,551.58 4.513 4996.935 $/QALY (Dominated)
Standard care $26,550.57 4.265 6225.836 $/QALY (Dominated)
0.03 Patient self-management with POC $14,378.74 4.824 2980.780 $/QALY
Healthcare testing with POC $20,172.26 4.217 4784.022 $/QALY (Dominated)
Patient self-testing with POC $21,514.79 4.363 4930.637 $/QALY (Dominated)
Standard care $25,324.15 4.126 6137.815 $/QALY (Dominated)
0.045 Patient self-management with POC $13,745.88 4.664 2947.466 $/QALY
Healthcare testing with POC $19,273.83 4.083 4720.386 $/QALY (Dominated)
Patient self-testing with POC $20,553.16 4.224 4866.365 $/QALY (Dominated)
Standard care $24,186.71 3.996 6052.510 $/QALY (Dominated)
0.06 Patient self-management with POC $13,157.80 4.514 2915.136 $/QALY
Healthcare testing with POC $18,439.25 3.958 4658.723 $/QALY (Dominated)
Patient self-testing with POC $19,659.94 4.092 4804.057 $/QALY (Dominated)
Standard care $23,130.24 3.875 5969.841 $/QALY (Dominated)
QALY: Quality Adjusted Life Year; ICER: Incremental cost-effectiveness ratio
Point-of-Care INR Monitoring Devices - Ontario Health Technology Assessment Series 2009; 9 (12) 105
Table A20: One-way sensitivity analysis of utility estimate for a health individual in the general population
Utility Value Strategy Cost
Effectiveness (QALY) Cost per QALY ICER
0.851 Patient self-management with POC $13,545.08 4.227 3204.194 $/QALY
Healthcare testing with POC $18,988.84 3.709 5120.117 $/QALY (Dominated)
Patient self-testing with POC $20,248.14 3.836 5278.520 $/QALY (Dominated)
Standard care $23,825.92 3.635 6554.474 $/QALY (Dominated)
0.8905 Patient self-management with POC $13,545.08 4.420 3064.557 $/QALY
Healthcare testing with POC $18,988.84 3.875 4900.863 $/QALY (Dominated)
Patient self-testing with POC $20,248.14 4.007 5052.685 $/QALY (Dominated)
Standard care $23,825.92 3.795 6278.412 $/QALY (Dominated)
0.93 Patient self-management with POC $13,545.08 4.613 2936.582 $/QALY
Healthcare testing with POC $18,988.84 4.041 4699.616 $/QALY (Dominated)
Patient self-testing with POC $20,248.14 4.179 4845.381 $/QALY (Dominated)
Standard care $23,825.92 3.955 6024.665 $/QALY (Dominated)
0.9695 Patient self-management with POC $13,545.08 4.805 2818.867 $/QALY
Healthcare testing with POC $18,988.84 4.206 4514.245 $/QALY (Dominated)
Patient self-testing with POC $20,248.14 4.350 4654.417 $/QALY (Dominated)
Standard care $23,825.92 4.115 5790.632 $/QALY (Dominated)
1.009 Patient self-management with POC $13,545.08 4.998 2710.225 $/QALY
Healthcare testing with POC $18,988.84 4.372 4342.942 $/QALY (Dominated)
Patient self-testing with POC $20,248.14 4.522 4477.935 $/QALY (Dominated)
Standard care $23,825.92 4.274 5574.102 $/QALY (Dominated)
QALY: Quality Adjusted Life Year; ICER: Incremental cost-effectiveness ratio
Point-of-Care INR Monitoring Devices - Ontario Health Technology Assessment Series 2009; 9 (12) 106
Table A21: One-way sensitivity analysis of utility estimate for an individual with a permanent disability
Utility Value Strategy Cost
Effectiveness (QALY) Cost per QALY ICER
0 Patient self-management with POC $13,545.08 4.535 2986.746 $/QALY
Healthcare testing with POC $18,988.84 3.906 4860.929 $/QALY (Dominated)
Patient self-testing with POC $20,248.14 4.037 5015.988 $/QALY (Dominated)
Standard care $23,825.92 3.763 6331.346 $/QALY (Dominated)
0.175 Patient self-management with POC $13,545.08 4.562 2968.995 $/QALY
Healthcare testing with POC $18,988.84 3.953 4803.224 $/QALY (Dominated)
Patient self-testing with POC $20,248.14 4.086 4954.926 $/QALY (Dominated)
Standard care $23,825.92 3.830 6220.519 $/QALY (Dominated)
0.35 Patient self-management with POC $13,545.08 4.589 2951.453 $/QALY
Healthcare testing with POC $18,988.84 4.000 4746.874 $/QALY (Dominated)
Patient self-testing with POC $20,248.14 4.136 4895.332 $/QALY (Dominated)
Standard care $23,825.92 3.897 6113.504 $/QALY (Dominated)
0.525 Patient self-management with POC $13,545.08 4.616 2934.118 $/QALY
Healthcare testing with POC $18,988.84 4.047 4691.831 $/QALY (Dominated)
Patient self-testing with POC $20,248.14 4.186 4837.155 $/QALY (Dominated)
Standard care $23,825.92 3.964 6010.109 $/QALY (Dominated)
0.7 Patient self-management with POC $13,545.08 4.644 2916.985 $/QALY
Healthcare testing with POC $18,988.84 4.094 4638.050 $/QALY (Dominated)
Patient self-testing with POC $20,248.14 4.236 4780.344 $/QALY (Dominated)
Standard care $23,825.92 4.031 5910.154 $/QALY (Dominated)
QALY: Quality Adjusted Life Year; ICER: Incremental cost-effectiveness ratio
Point-of-Care INR Monitoring Devices - Ontario Health Technology Assessment Series 2009; 9 (12) 107
Point-of-Care INR Monitoring Devices - Ontario Health Technology Assessment Series 2009; 9 (12) 108
Table A22: One-way sensitivity analysis of utility estimate for an individual with a temporary disability
Utility Value Strategy Cost
Effectiveness (QALY) Cost per QALY ICER
0.7 Patient self-management with POC $13,545.08 4.612 2936.824 $/QALY
Healthcare testing with POC $18,988.84 4.040 4700.075 $/QALY (Dominated)
Patient self-testing with POC $20,248.14 4.178 4845.893 $/QALY (Dominated)
Standard care $23,825.92 3.954 6025.474 $/QALY (Dominated)
0.75 Patient self-management with POC $13,545.08 4.613 2936.582 $/QALY
Healthcare testing with POC $18,988.84 4.041 4699.616 $/QALY (Dominated)
Patient self-testing with POC $20,248.14 4.179 4845.381 $/QALY (Dominated)
Standard care $23,825.92 3.955 6024.665 $/QALY (Dominated)
0.8 Patient self-management with POC $13,545.08 4.613 2936.340 $/QALY
Healthcare testing with POC $18,988.84 4.041 4699.157 $/QALY (Dominated)
Patient self-testing with POC $20,248.14 4.179 4844.869 $/QALY (Dominated)
Standard care $23,825.92 3.955 6023.857 $/QALY (Dominated)
0.85 Patient self-management with POC $13,545.08 4.613 2936.098 $/QALY
Healthcare testing with POC $18,988.84 4.041 4698.699 $/QALY (Dominated)
Patient self-testing with POC $20,248.14 4.180 4844.358 $/QALY (Dominated)
Standard care $23,825.92 3.956 6023.049 $/QALY (Dominated)
0.9 Patient self-management with POC $13,545.08 4.614 2935.856 $/QALY
Healthcare testing with POC $18,988.84 4.042 4698.240 $/QALY (Dominated)
Patient self-testing with POC $20,248.14 4.180 4843.846 $/QALY (Dominated)
Standard care $23,825.92 3.956 6022.241 $/QALY (Dominated)
QALY: Quality Adjusted Life Year; ICER: Incremental cost-effectiveness ratio
References (1) Ansell J, Hirsh J, Dalen J, Bussey H, Anderson D, Poller L et al. Managing oral anticoagulant
therapy. Chest 2001; 119(1 Suppl):22S-38S.
(2) Ansell J, Hirsh J, Hylek E, Jacobson A, Crowther M, Palareti G et al. Pharmacology and management of the vitamin K antagonists. American College of Chest Physicians Evidence-Based Clinical Practice Guidelines (8th Edition). Chest 2008; 133(6 Suppl):160S-98S.
(3) Hirsh J, Dalen J, Anderson DR, Poller L, Bussey H, Ansell J et al. Oral anticoagulants: mechanism of action, clinical effectiveness, and optimal therapeutic range. Chest 2001; 119(1 Suppl):8S-21S.
(4) Hirsh J, Fuster V, Ansell J, Halperin JL. American Heart Association/American College of Cardiology Foundation guide to warfarin therapy. Circulation 2003; 107(12):1692-711.
(5) Ansell J, Jacobson A, Levy J, Voller H, Hasenkam JM. Guidelines for implementation of patient self-testing and patient self-management of oral anticoagulation. International consensus guidelines prepared by International Self-Monitoring Association for Oral Anticoagulation. Int J Cardiol 2005; 99(1):37-45.
(6) Gage BF, Fihn SD, White RH. Management and dosing of warfarin therapy. Am J Med 2000; 109(6):481-8.
(7) Baglin TP, Keeling DM, Watson HG. Guidelines on oral anticoagulation (warfarin): third edition--2005 update. Br J Haematol 2006; 132(3):277-85.
(8) Ryan F, Byrne S, O'Shea S. Managing oral anticoagulation therapy: improving clinical outcomes. A review. J Clin Pharm Ther 2008; 33(6):581-90.
(9) Heneghan C, onso-Coello P, Garcia-Alamino JM, Perera R, Meats E, Glasziou P. Self-monitoring of oral anticoagulation: a systematic review and meta-analysis. Lancet 2006; 367(9508):404-11.
(10) Oake N, Jennings A, Forster AJ, Fergusson D, Doucette S, van WC. Anticoagulation intensity and outcomes among patients prescribed oral anticoagulant therapy: a systematic review and meta-analysis. Can Med Assoc J 2008; 179(3):235-44.
(11) van Walraven C, Oake N, Wells PS, Forster AJ. Burden of potentially avoidable anticoagulant-associated hemorrhagic and thromobembolic events in the elderly. Chest 2007; 131(5):1508-15.
(12) Newall F, Bauman M. Point-of-care antithrombotic monitoring in children. Thromb Res 2006; 118(1):113-21.
(13) Connock M, Stevens C, Fry-Smith A, Jowett S, Fitzmaurice D, Moore D et al. Clinical effectiveness and cost-effectiveness of different models of managing long-term oral anticoagulation therapy: a systematic review and economic modelling. Health Technol Assess 2007; 11(38):iii-50.
Point-of-Care INR Monitoring Devices - Ontario Health Technology Assessment Series 2009; 9 (12) 109
(14) Murray ET, Greaves M. INRs and point of care testing. BMJ 2003; 327(7405):5-6.
(15) Murray ET, Fitzmaurice DA, McCahon D. Point of care testing for INR monitoring: where are we now? Br J Haematol 2004; 127(4):373-8.
(16) Sunderji R, Gin K, Shalansky K, Carter C, Chambers K, Davies C et al. A randomized trial of patient self-managed versus physician-managed oral anticoagulation. Can J Cardiol 2004; 20(11):1117-23.
(17) Woods K, Douketis JD, Schnurr T, Kinnon K, Powers P, Crowther MA. Patient preferences for capillary vs. venous INR determination in an anticoagulation clinic: a randomized controlled trial. Thromb Res 2004; 114(3):161-5.
(18) van WC, Jennings A, Oake N, Fergusson D, Forster AJ. Effect of study setting on anticoagulation control: A systematic review and metaregression. Chest 2006; 129(5):1155-66.
(19) Wilson SJ, Wells PS, Kovacs MJ, Lewis GM, Martin J, Burton E et al. Comparing the quality of oral anticoagulant management by anticoagulation clinics and by family physicians: a randomized controlled trial. CMAJ 2003; 169(4):293-8.
(20) Gladstone DJ, Bui E, Fang J, Laupacis A, Lindsay MP, Tu JV et al. Potentially preventable strokes in high-risk patients with atrial fibrillation who are not adequately anticoagulated. Stroke 2009; 40(1):235-40.
(21) Verhovsek M, Motlagh B, Crowther MA, Kennedy C, Dolovich L, Campbell G et al. Quality of anticoagulation and use of warfarin-interacting medications in long-term care: a chart review. BMC Geriatr 2008; Jul 3(8):13.
(22) Voller H, Glatz J, Taborski U, Bernardo A, Dovifat C, Heidinger K. Self-management of oral anticoagulation in nonvalvular atrial fibrillation (SMAAF study). Z Kardiol 2005; 94(3):182-6.
(23) Fitzmaurice DA, Gardiner C, Kitchen S, Mackie I, Murray ET, Machin SJ. An evidence-based review and guidelines for patient self-testing and management of oral anticoagulation. Br J Haematol 2005; 131(2):156-65.
(24) Cromheecke ME, Levi M, Colly LP, de Mol BJ, Prins MH, Hutten BA et al. Oral anticoagulation self-management and management by a specialist anticoagulation clinic: a randomised cross-over comparison. Lancet 2000; 356(9224):97-102.
(25) Gadisseur AP, Breukink-Engbers WG, van der Meer FJ, van den Besselaar AM, Sturk A, Rosendaal FR. Comparison of the quality of oral anticoagulant therapy through patient self-management and management by specialized anticoagulation clinics in the Netherlands: a randomized clinical trial. Arch Intern Med 2003; 163(21):2639-46.
(26) Health Canada. Medical devices active license listing [Internet]. [updated 2006; cited 2008 Dec 1]. Available from: http://www.hc-sc.gc.ca/dhp-mps/md-im/licen/mdlic-eng.php
Point-of-Care INR Monitoring Devices - Ontario Health Technology Assessment Series 2009; 9 (12) 110
(27) Brown, A., Wells, P., Jaffey, J., McGahan, L., Poon, M.-C., Cimon, K.et al. Point-of-care monitoring devices for long-term oral anticoagulation therapy: clinical and cost effectiveness [Internet]. Ottawa, ON: Canadian Agency for Drugs and Technologies in Health. 2007. [cited: 2009 Mar 3]. Technology Report No. 72. Available from: http://www.cadth.ca/media/pdf/H0299_anticoagulation-therapy_tr_e.pdf
(28) NHS Purchasing and Supply Agency. Buyer's Guide, Point of care coagulometers for monitoring oral anticoagulation [Internet]. London: Centre for Evidence-Based Purchasing. 2008 Jan 1. [cited: 2009 Mar 3]. CEP 07026. Available from: http://www.pasa.nhs.uk/pasa/Doc.aspx?Path=%5BMN%5D%5BSP%5D/NHSprocurement/CEP/POC/CEP07026.pdf
(29) Grade Working Group. Grade [Internet]. [updated 2006 Jun 15; cited 2008 May 1]. Available from: http://www.gradeworkinggroup.org/index.htm
(30) Atkins D, Best D, Briss PA, Eccles M, Falck-Ytter Y, Flottorp S et al. Grading quality of evidence and strength of recommendations. BMJ 2004; 328(7454):1490.
(31) Perera R, Heneghan C, Fitzmaurice D, Self Monitoring Trialists (SMT) collaboration. Individual patient meta-analysis of self-monitoring of an oral anticoagulation protocol. J Heart Valve Dis 2008; 17(2):233-8.
(32) Claes N, Buntinx F, Vijgen J, Arnout J, Vermylen J, Fieuws S et al. The Belgian Improvement Study on Oral Anticoagulation Therapy: a randomized clinical trial. Eur Heart J 2005; 26(20):2159-65.
(33) Gadisseur AP, Kaptein AA, Breukink-Engbers WG, van der Meer FJ, Rosendaal FR. Patient self-management of oral anticoagulant care vs. management by specialized anticoagulation clinics: positive effects on quality of life. J Thromb Haemost 2004; 2(4):584-91.
(34) Khan TI, Kamali F, Kesteven P, Avery P, Wynne H. The value of education and self-monitoring in the management of warfarin therapy in older patients with unstable control of anticoagulation. Br J Haematol 2004; 126(4):557-64.
(35) Beyth RJ, Quinn L, Landefeld CS. A multicomponent intervention to prevent major bleeding complications in older patients receiving warfarin. A randomized, controlled trial. Ann Intern Med 2000; 133(9):687-95.
(36) Kortke H, Korfer R. International normalized ratio self-management after mechanical heart valve replacement: is an early start advantageous? Ann Thorac Surg 2001; 72(1):44-8.
(37) Christensen TD, Maegaard M, S°rensen HT, Hjortdal VE, Hasenkam JM. Self-management versus conventional management of oral anticoagulant therapy: A randomized, controlled trial. European Journal of Internal Medicine 2006; 17(4):260-6.
(38) Medical Services Advisory Committee. The use of INR point-of-care testing in general practice [Internet]. Canberra, Australia: Commonwealth of Australia. 2005 May 1. [cited: 2008 Dec 1]. 52 p. MSAC application 1071. Available from: http://www.msac.gov.au/internet/msac/publishing.nsf/Content/BCDC2A9D05A33761CA2575AD0082FD32/$File/1071%20-%20INR%20point-of-care%20testing%20in%20general%20practice%20Report.pdf
(39) Fitzmaurice DA. Oral anticoagulation control: The European perspective. J Thromb Thrombolysis 2006; 21(1):95-100.
Point-of-Care INR Monitoring Devices - Ontario Health Technology Assessment Series 2009; 9 (12) 111
(40) Fitzmaurice DA, Murray ET, McCahon D, Holder R, Raftery JP, Hussain S et al. Self management of oral anticoagulation: randomised trial. BMJ 2005; 331(7524):1057.
(41) Horstkotte D, Piper C, Wiemer M. Optimal Frequency of Patient Monitoring and Intensity of Oral Anticoagulation Therapy in Valvular Heart Disease. J Thromb Thrombolysis 1998; 5 Suppl 1(3):19-24.
(42) Koertke H, Zittermann A, Wagner O, Koerfer R. Self-management of oral anticoagulation therapy improves long-term survival in patients with mechanical heart valve replacement. Ann Thorac Surg 2007; 83(1):24-9.
(43) Menendez-Jandula B, Souto JC, Oliver A, Montserrat I, Quintana M, Gich I et al. Comparing self-management of oral anticoagulant therapy with clinic management: a randomized trial. Ann Intern Med 2005; 142(1):1-10.
(44) Sawicki PT. A structured teaching and self-management program for patients receiving oral anticoagulation: a randomized controlled trial. Working Group for the Study of Patient Self-Management of Oral Anticoagulation. JAMA 1999; 281(2):145-50.
(45) Shiach CR, Campbell B, Poller L, Keown M, Chauhan N. Reliability of point-of-care prothrombin time testing in a community clinic: a randomized crossover comparison with hospital laboratory testing. Br J Haematol 2002; 119(2):370-5.
(46) Sidhu P, O'Kane HO. Self-managed anticoagulation: results from a two-year prospective randomized trial with heart valve patients. Ann Thorac Surg 2001; 72(5):1523-7.
(47) Siebenhofer A, Rakovac I, Kleespies C, Piso B, Didjurgeit U. Self-management of oral anticoagulation in the elderly: rationale, design, baselines and oral anticoagulation control after one year of follow-up. A randomized controlled trial. Thromb Haemost 2007; 97(3):408-16.
(48) Siebenhofer A, Rakovac I, Kleespies C, Piso B, Didjurgeit U. Self-management of oral anticoagulation reduces major outcomes in the elderly. A randomized controlled trial. Thromb Haemost 2008; 100(6):1089-98.
(49) Altman DG, Schulz KF, Moher D, Egger M, Davidoff F, Elbourne D et al. The revised CONSORT statement for reporting randomized trials: explanation and elaboration. Ann Intern Med 2001; 134(8):663-94.
(50) Koertke H, Minami K, Bairaktaris A, Wagner O, Koerfer R. INR self-management following mechanical heart valve replacement. J Thromb Thrombolysis 2000; 9(Suppl 1):S41-S45.
(51) Hylek EM, Skates SJ, Sheehan MA, Singer DE. An analysis of the lowest effective intensity of prophylactic anticoagulation for patients with nonrheumatic atrial fibrillation. N Engl J Med 1996; 335(8):540-6.
(52) Christensen TD, Maegaard M, Sorensen HT, Hjortdal VE, Hasenkam JM. Self- versus conventional management of oral anticoagulant therapy: effects on INR variability and coumarin dose in a randomized controlled trial. Am J Cardiovasc Drugs 2007; 7(3):191-7.
(53) Jowett S, Bryan S, Murray E, McCahon D, Raftery J, Hobbs FD et al. Patient self-management of anticoagulation therapy: a trial-based cost-effectiveness analysis. Br J Haematol 2006; 134(6):632-9.
Point-of-Care INR Monitoring Devices - Ontario Health Technology Assessment Series 2009; 9 (12) 112
(54) Bombard, Y. Public Engagement Pilot Study on Point-of-Care International Normalized Ratio
(INR) Monitoring Devices. Final Report to the Medical Advisory Secretariat, Ontario Ministry of Health and Long Term Care. Medical Advisory Secretariat, Ontario Ministry of Health and Long Term Care. 2009 July 2009. 29 p.
(55) Fitzmaurice DA, Hobbs FD, Murray ET, Holder RL, Allan TF, Rose PE. Oral anticoagulation management in primary care with the use of computerized decision support and near-patient testing: a randomized, controlled trial. Arch Intern Med 2000; 160(15):2343-8.
(56) Lafata JE, Martin SA, Kaatz S, Ward RE. Anticoagulation clinics and patient self-testing for patients on chronic warfarin therapy: a cost-effectiveness analysis. J Thromb Thrombolysis 2000; 9(SUPPL. 1):S13-S19.
(57) Muller E, Bergemann R. Economic analysis of bleeding and thromboembolic sequelae after heart valve replacement (GELIA 7). Eur Heart J 2001; 3(Q):Q65-Q69.
(58) Regier DA, Sunderji R, Lynd LD, Gin K, Marra CA. Cost-effectiveness of self-managed versus physician-managed oral anticoagulation therapy. Can Med Assoc J 2006; 174(13):1847-52.
(59) Mittmann N, Trakas K, Risebrough N, Liu BA. Utility scores for chronic conditions in a community-dwelling population. Pharmacoeconomics 1999; 15(4):369-76.
(60) Ministry of Health and Long-term Care. Schedule of benefits: physician services under the health insurance act [Internet]. [updated 2008 Jun 3; cited 2009 May 29]. Available from: http://www.health.gov.on.ca/english/providers/program/ohip/sob/physserv/physserv_mn.html
(61) Ministry of Health and Long-term Care. Ontario drug benefit formulary/comparative drug index [Internet]. [updated 2009 Apr 13; cited 2009 Apr]. Available from: https://www.healthinfo.moh.gov.on.ca/formulary/
(62) Ministry of Health and Long-term Care. Ontario schedule of laboratory fees [Internet]. [updated 2006 Sep 13; cited 2009 Apr]. Available from: http://www.health.gov.on.ca/english/providers/program/ohip/sob/lab/labfhem.html
(63) Nichols JH, Christenson RH, Clarke W, Gronowski A, Hammett-Stabler CA, Jacobs E et al. Executive summary. The National Academy of Clinical Biochemistry Laboratory Medicine Practice Guideline: Evidence-based practice for point-of-care testing. Clin Chim Acta 2007; 379(1-2):14-28.
(64) Watzke HH, Forberg E, Svolba G, Jimenez-Boj E, Krinninger B. A prospective controlled trial comparing weekly self-testing and self-dosing with the standard management of patients on stable oral anticoagulation. Thromb Haemost 2000; 83(5):661-5.
(65) Matchar DB, Jacobson AK, Edson RG, Lavori PW, Ansell JE, Ezekowitz MD et al. The impact of patient self-testing of prothrombin time for managing anticoagulation: rationale and design of VA Cooperative Study #481--the Home INR Study (THINRS). J Thromb Thrombolysis 2005; 19(3):163-72.
Point-of-Care INR Monitoring Devices - Ontario Health Technology Assessment Series 2009; 9 (12) 113
(66) Laurence C, Gialamas A, Yelland L, Bubner T, Ryan P, Willson K et al. A pragmatic cluster randomised controlled trial to evaluate the safety, clinical effectiveness, cost effectiveness and satisfaction with point of care testing in a general practice setting - Rationale, design and baseline characteristics. Trials 2008; 9: 50.
Point-of-Care INR Monitoring Devices - Ontario Health Technology Assessment Series 2009; 9 (12) 114
(67) Wittkowsky AK, Sekreta CM, Nutescu EA, Ansell J. Barriers to patient self-testing of prothrombin time: national survey of anticoagulation practitioners. Pharmacotherapy 2005; 25(2):265-9.
(68) Meijer P, Kluft C, Poller L, van der Meer FJ, Keown M, Ibrahim S et al. A national field study of quality assessment of CoaguChek point-of-care testing prothrombin time monitors. Am J Clin Pathol 2006; 126(5):756-61.
(69) Eitz T, Schenk S, Fritzsche D, Bairaktaris A, Wagner O, Koertke H et al. International normalized ratio self-management lowers the risk of thromboembolic events after prosthetic heart valve replacement. Ann Thorac Surg 2008; 85(3):949-54.
(70) Fitzmaurice DA, Murray ET, Gee KM, Allan TF, Hobbs FD. A randomised controlled trial of patient self management of oral anticoagulation treatment compared with primary care management. J Clin Pathol 2002; 55(11):845-9.
(71) Gardiner C, Williams K, Mackie IJ, Machin SJ, Cohen H. Patient self-testing is a reliable and acceptable alternative to laboratory INR monitoring. Br J Haematol 2005; 128(2):242-7.
(72) Gardiner C, Williams K, Longair I, Mackie IJ, Machin SJ, Cohen H. A randomised control trial of patient self-management of oral anticoagulation compared with patient self-testing. Br J Haematol 2006; 132(5):598-603.
(73) Matchar DB, Samsa GP, Cohen SJ, Oddone EZ, Jurgelski AE. Improving the quality of anticoagulation of patients with atrial fibrillation in managed care organizations: results of the managing anticoagulation services trial. Am J Med 2002; 113(1):42-51.
(74) McCahon D, Murray ET, Jowett S, Sandhar HS, Holder RL, Hussain S et al. Patient self management of oral anticoagulation in routine care in the UK. J Clin Path 2007; 60(11):1263-7.
(75) O'Shea SI, Arcasoy MO, Samsa G, Cummings SE, Thames EH, Surwit RS et al. Direct-to-patient expert system and home INR monitoring improves control of oral anticoagulation. J Thromb Thrombolysis 2008; 26(1):14-21.
(76) Quin J, Rogers LQ, Markwell S, Butler T, III, McClafferty R, Hazelrigg S. Home-anticoagulation testing: accuracy of patient-reported values. J Surg Res 2007; 140(2):189-93.
(77) Voller H, Taborski U, Dovifat C, Hartwig I, Kadar JG, Wegscheider K et al. ProTime self-management yielding improvement of fluency and quality of life. Thromb Haemost 2007; 98(4):889-95.
(78) White RH, McCurdy SA, von MH, Woodruff DE, Jr., Leftgoff L. Home prothrombin time monitoring after the initiation of warfarin therapy. A randomized, prospective study. Ann Intern Med 1989; 111(9):730-7.


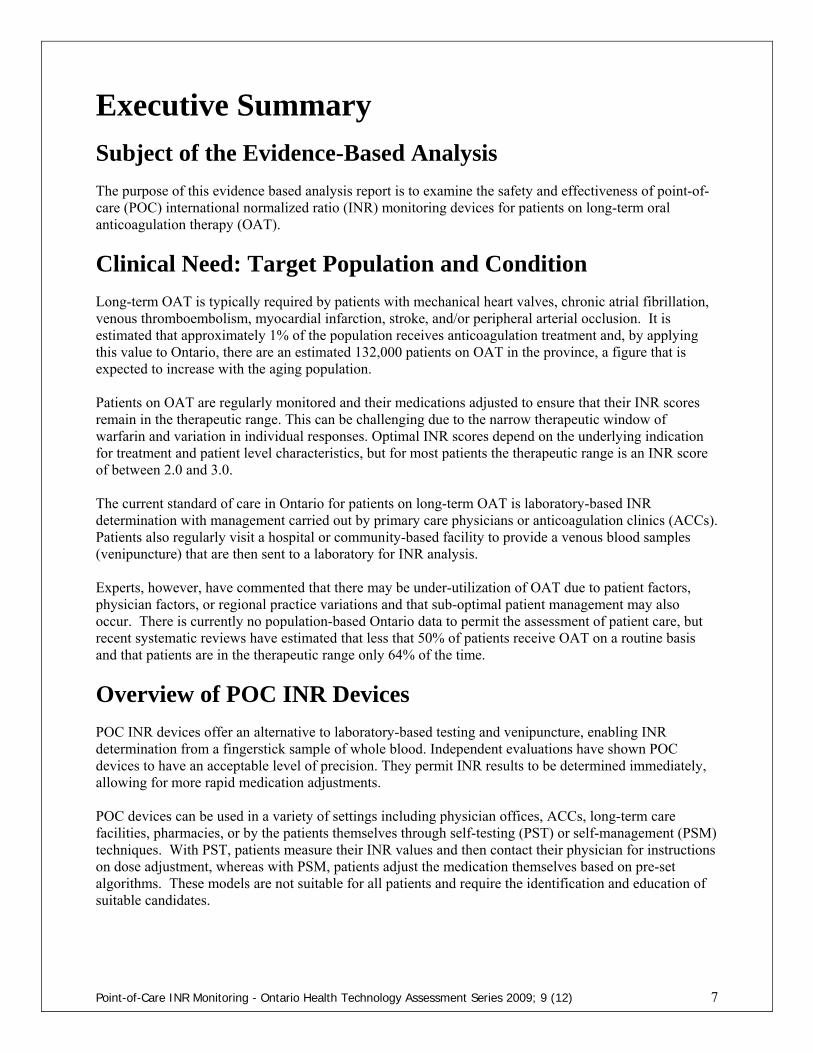


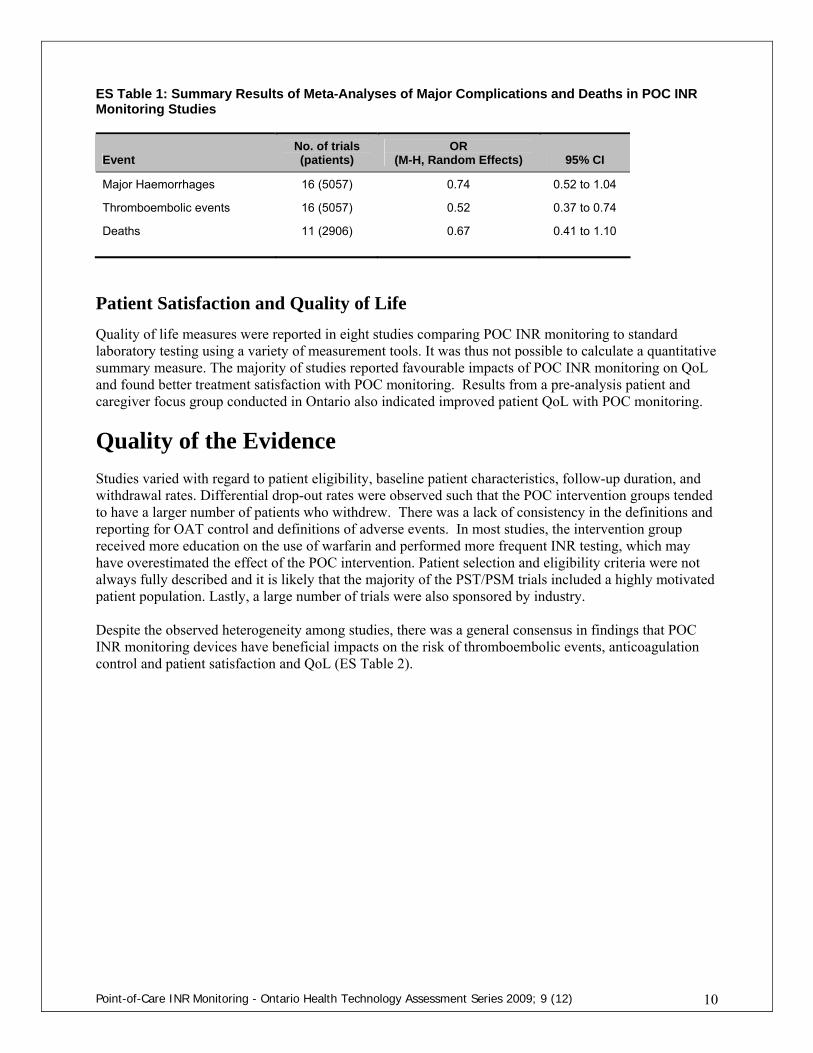
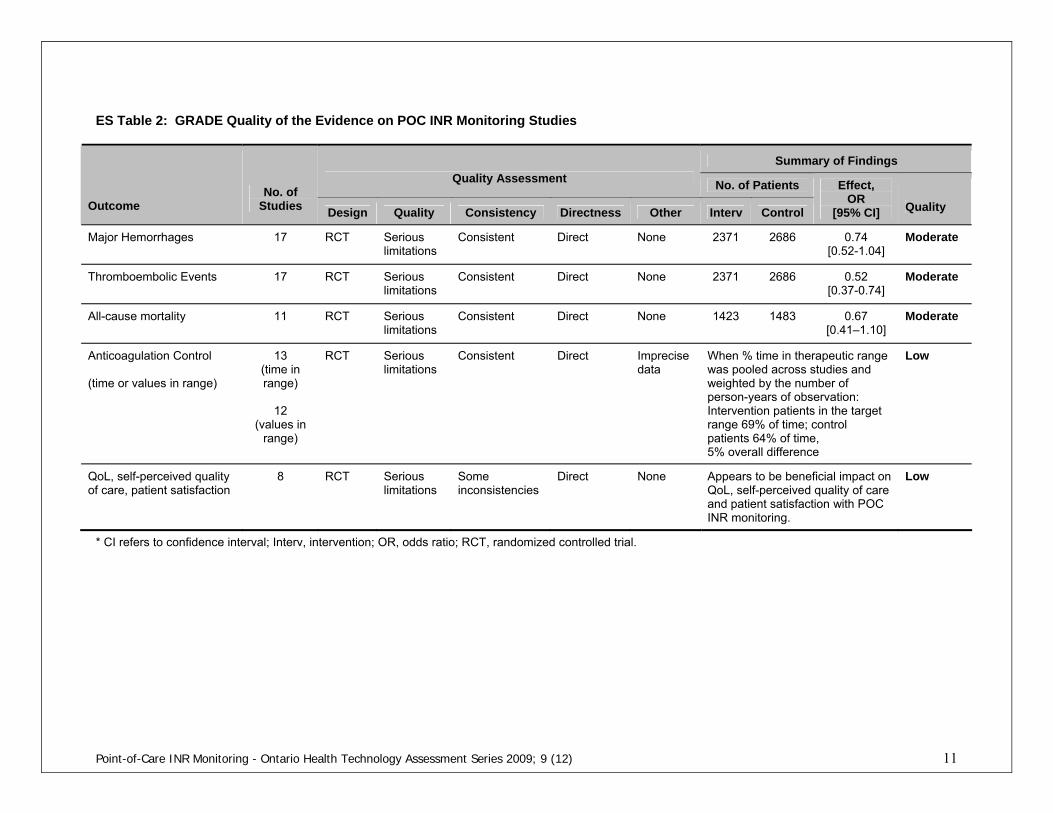


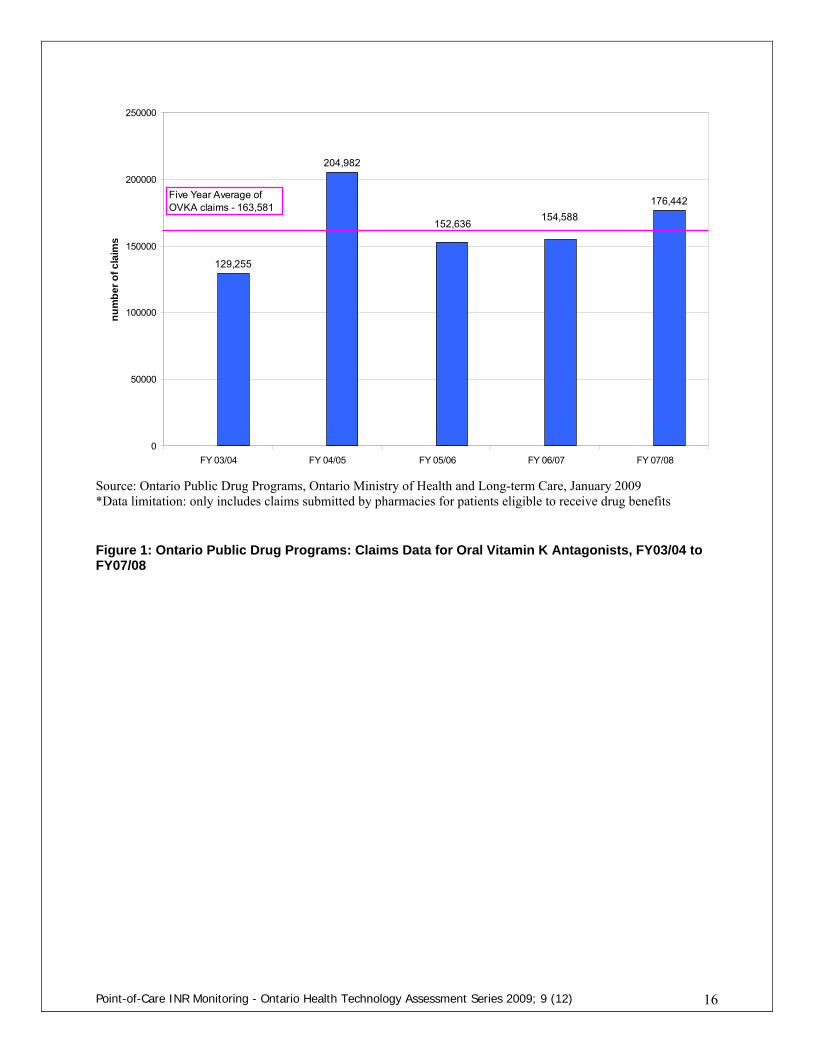

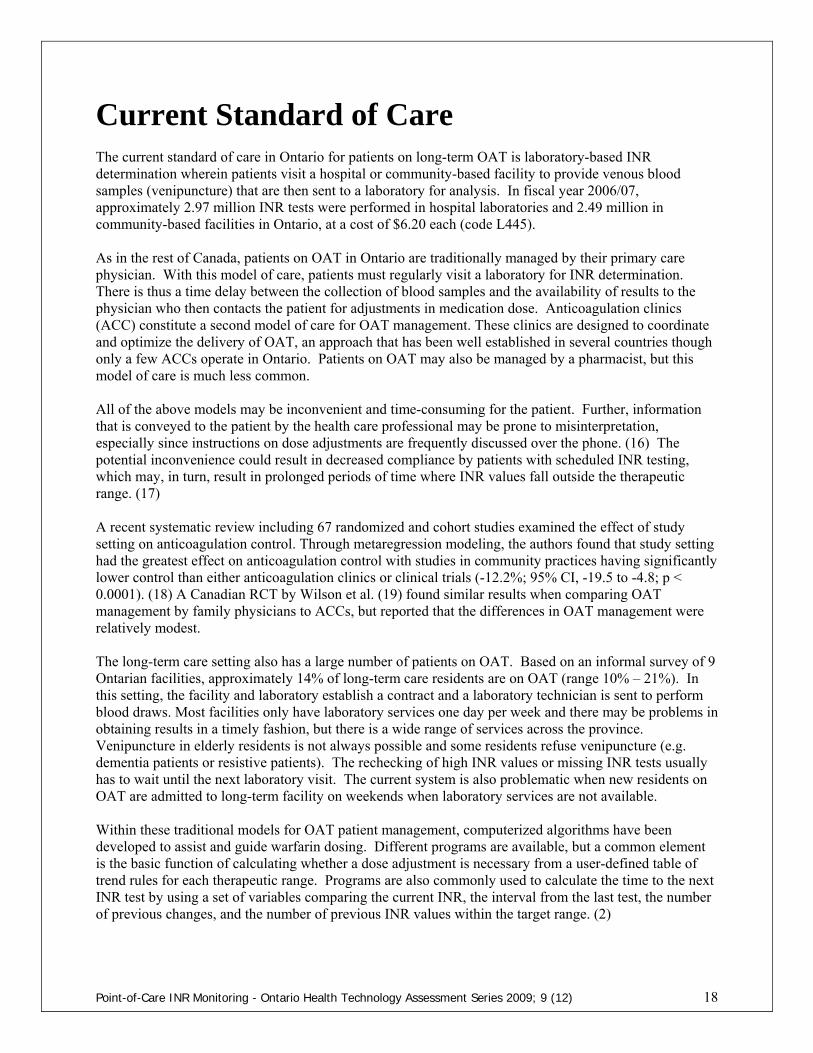


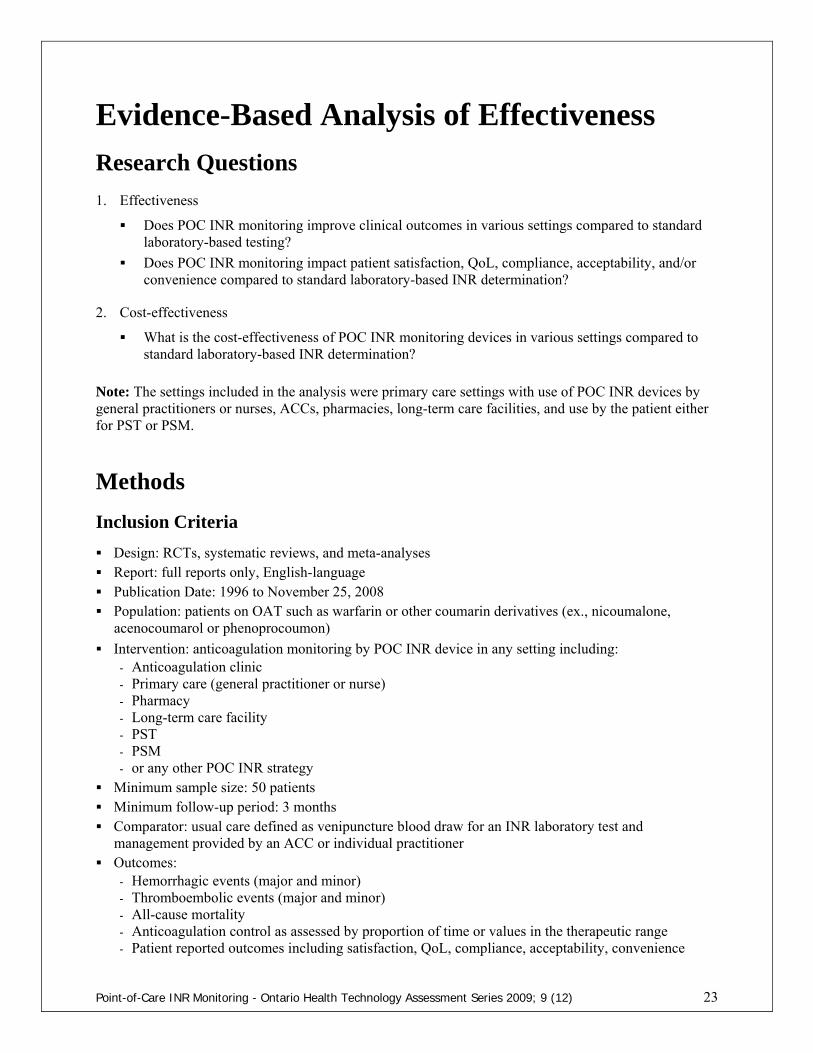
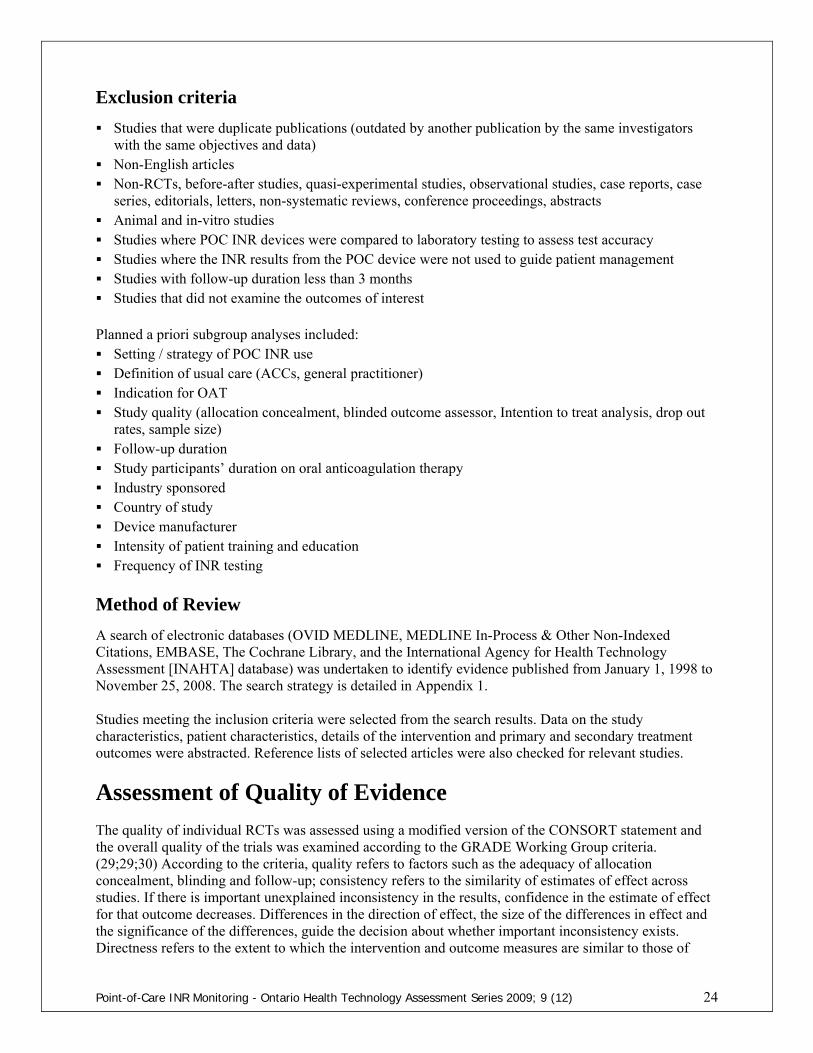

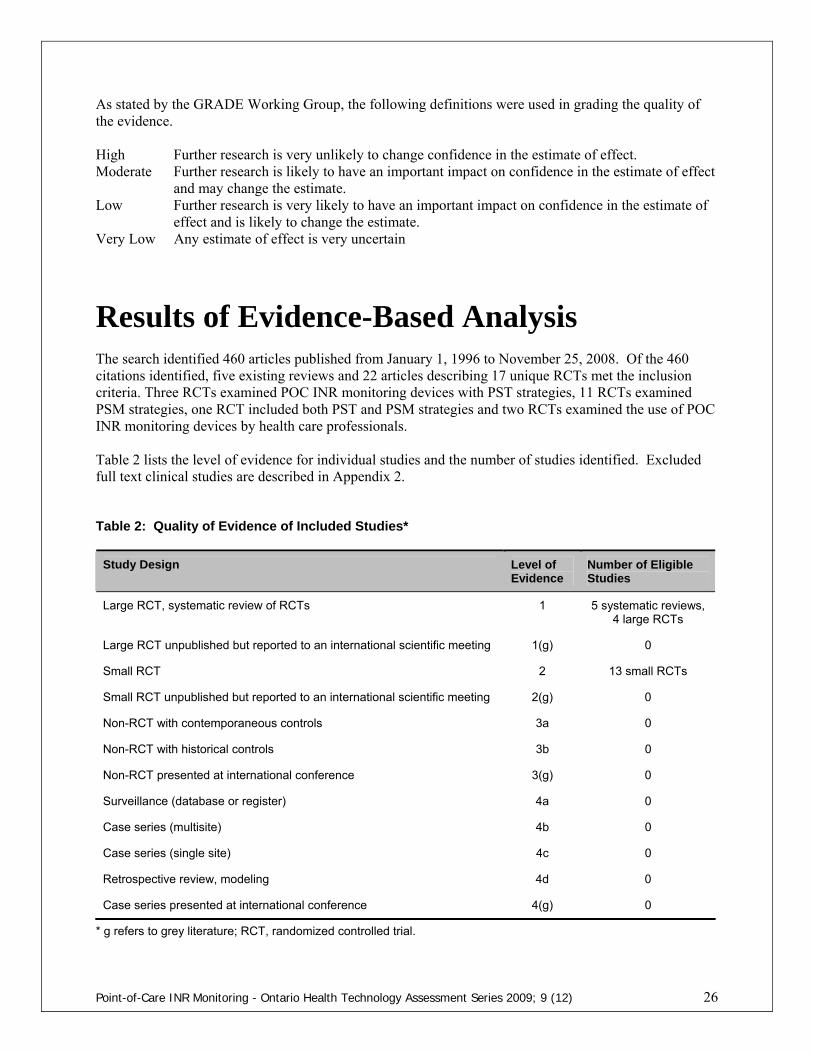
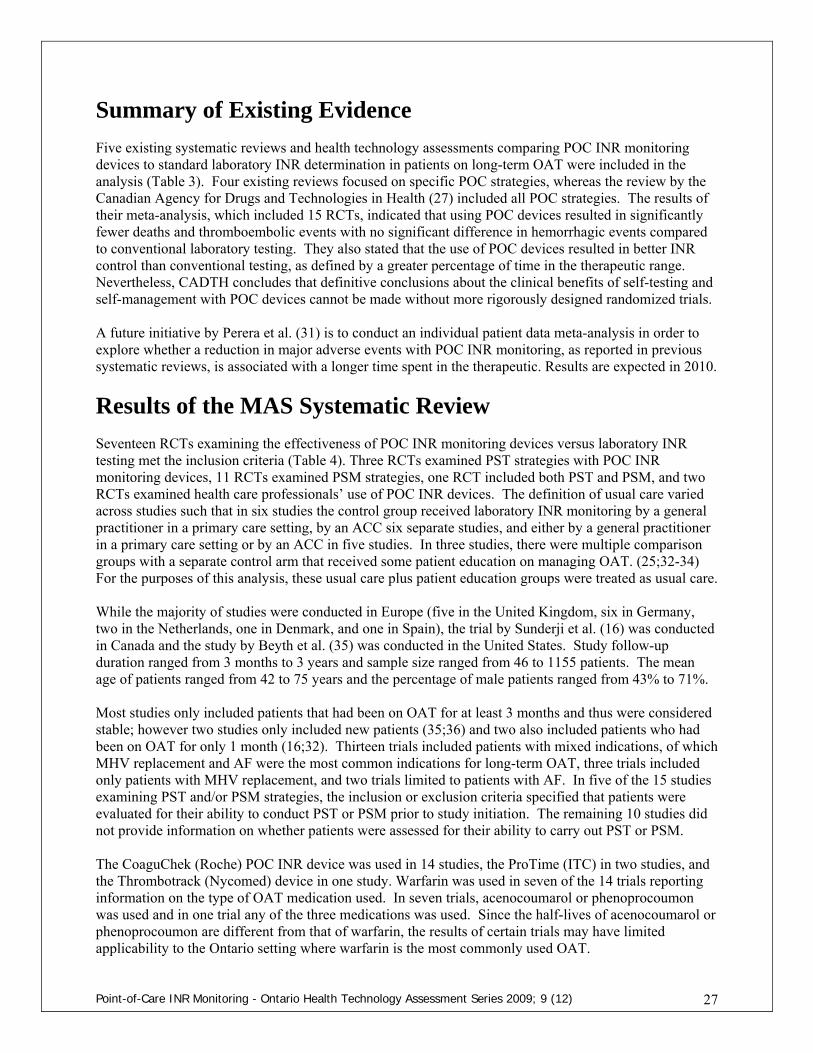

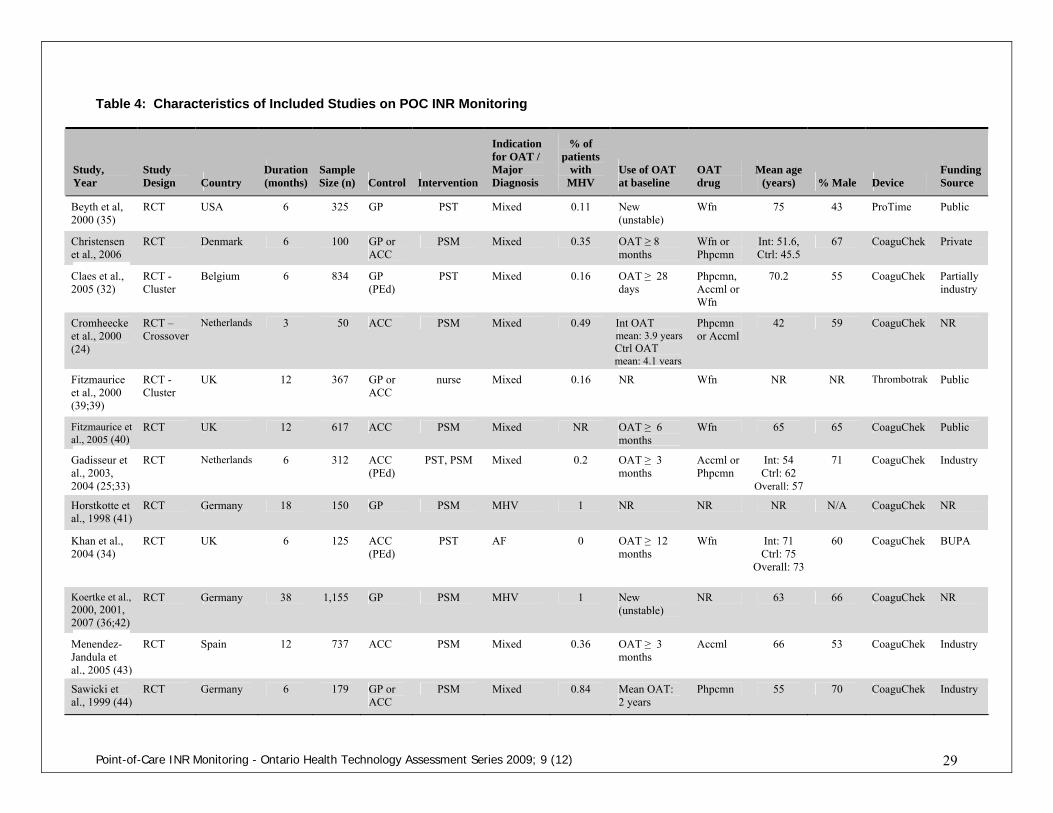
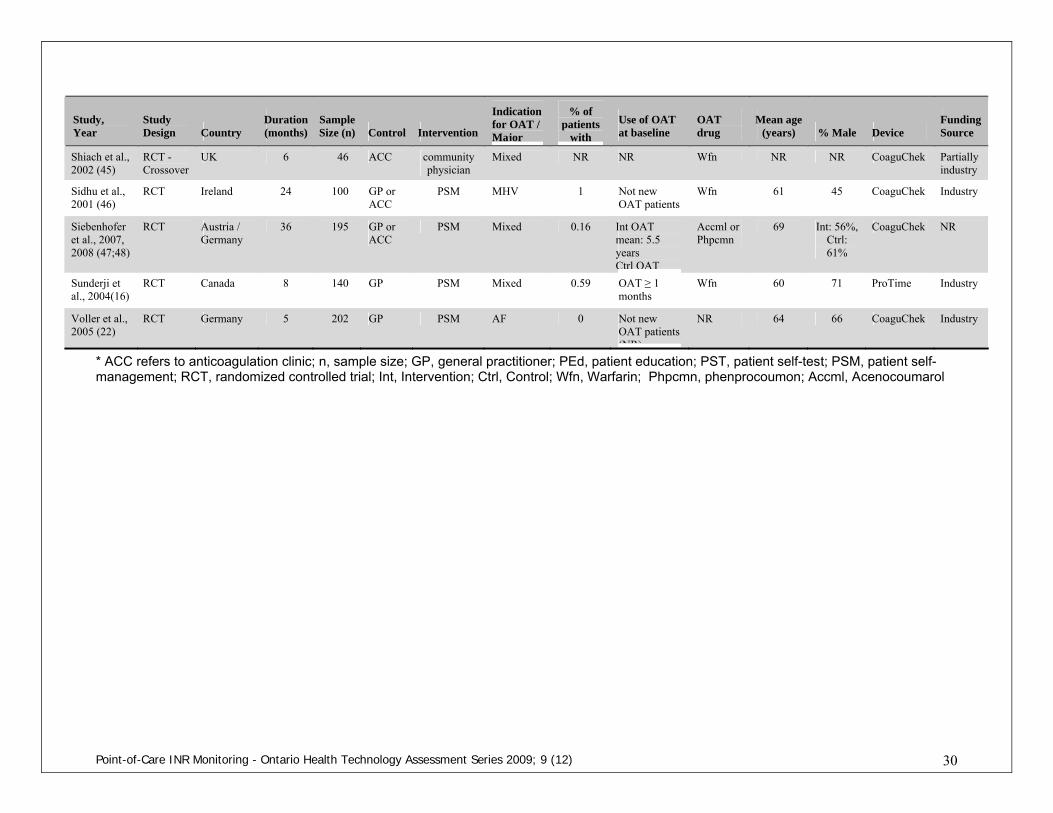

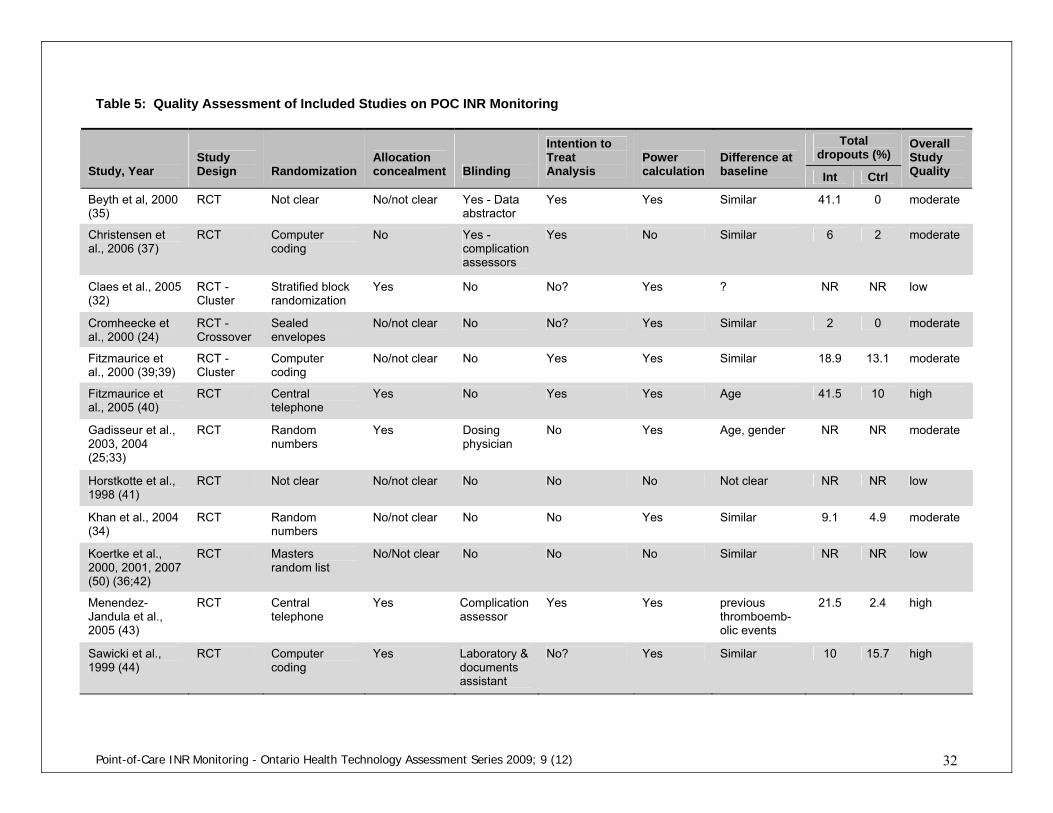
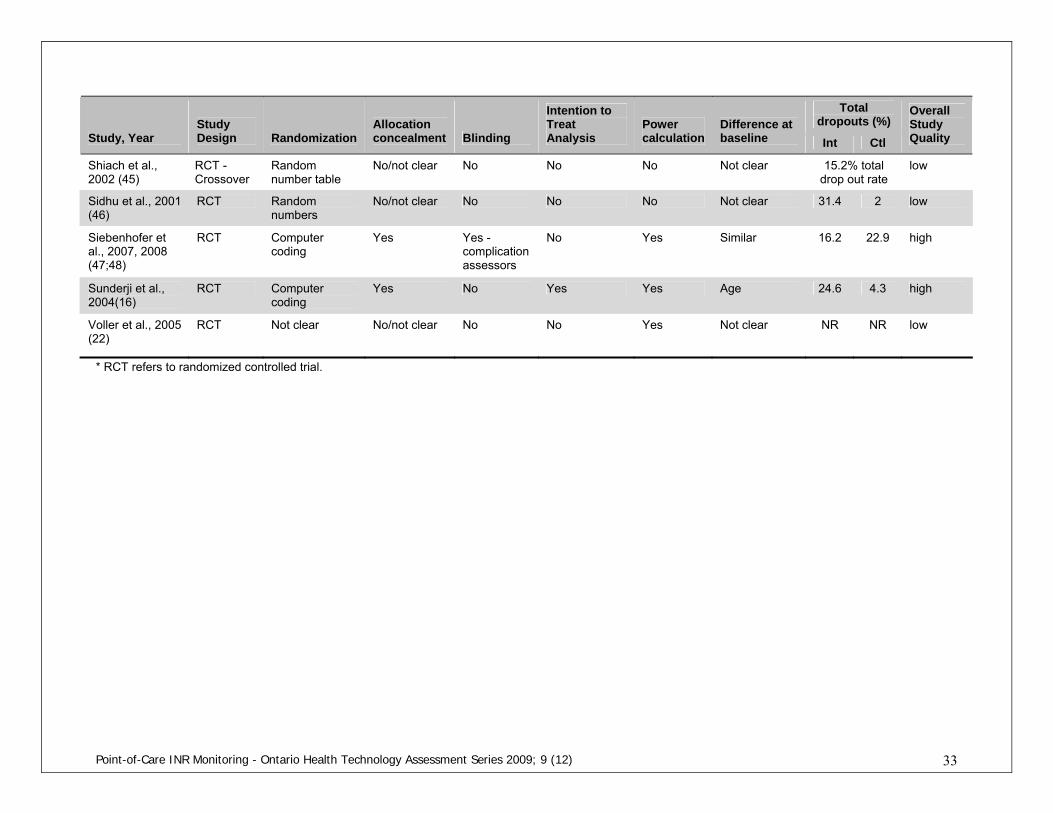


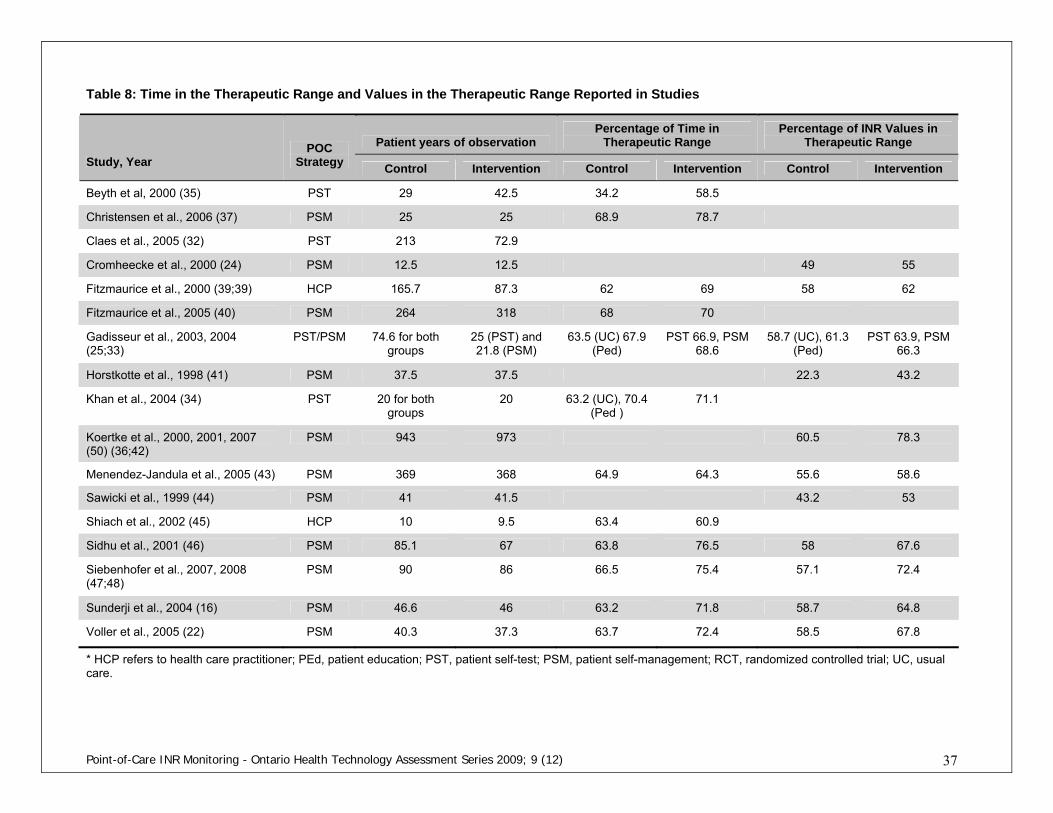
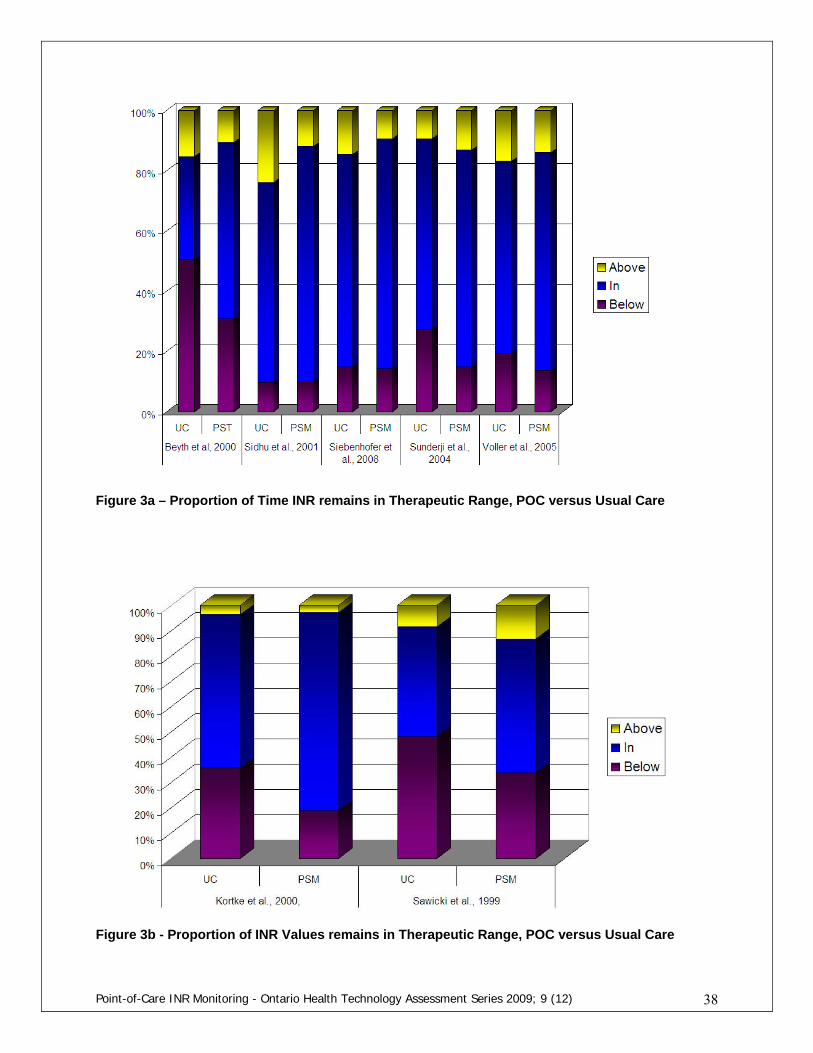
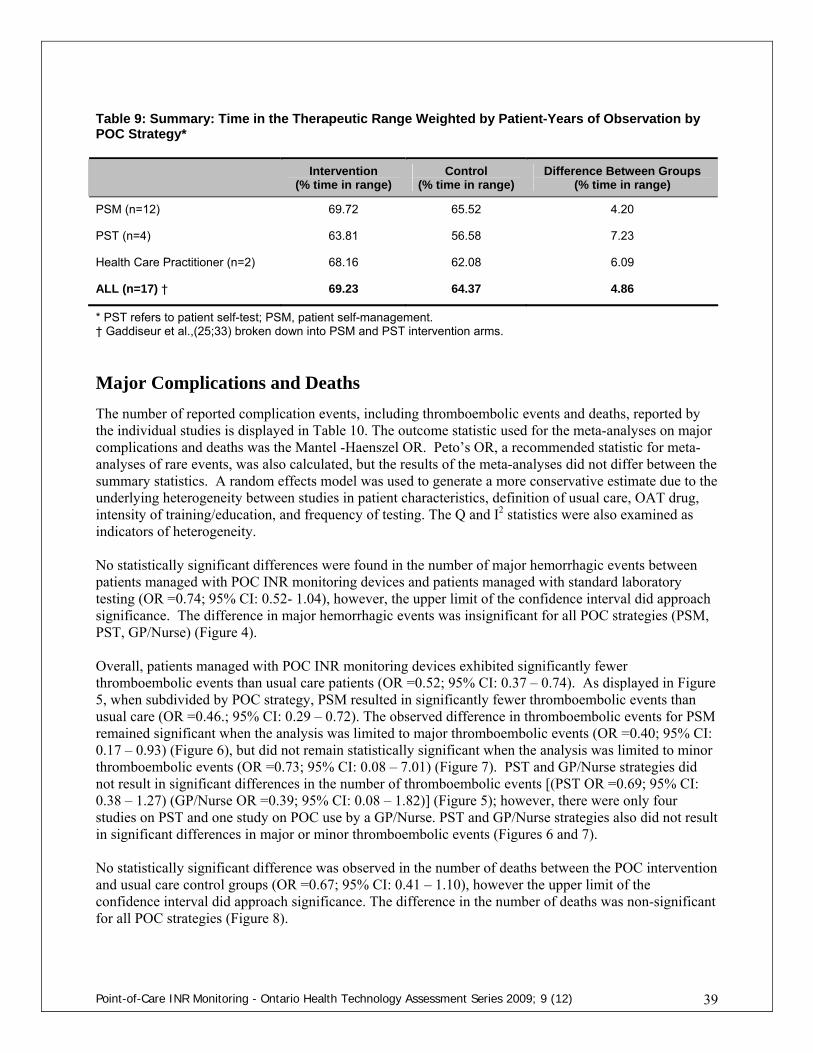

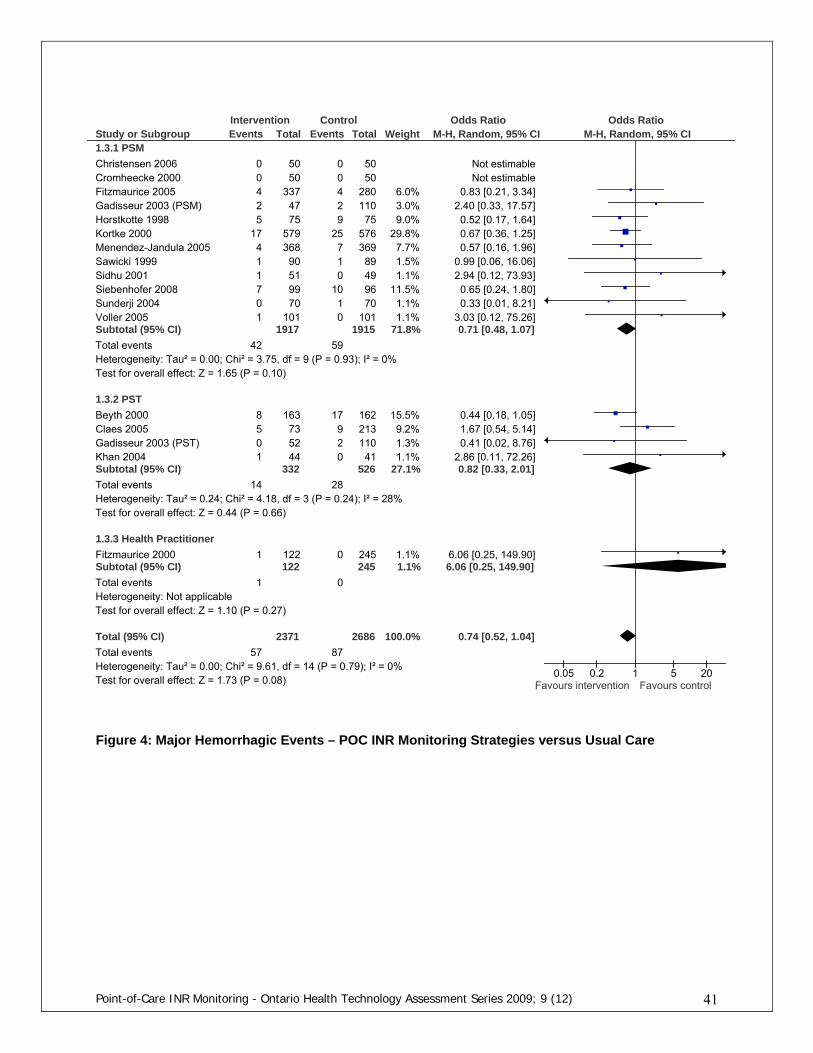
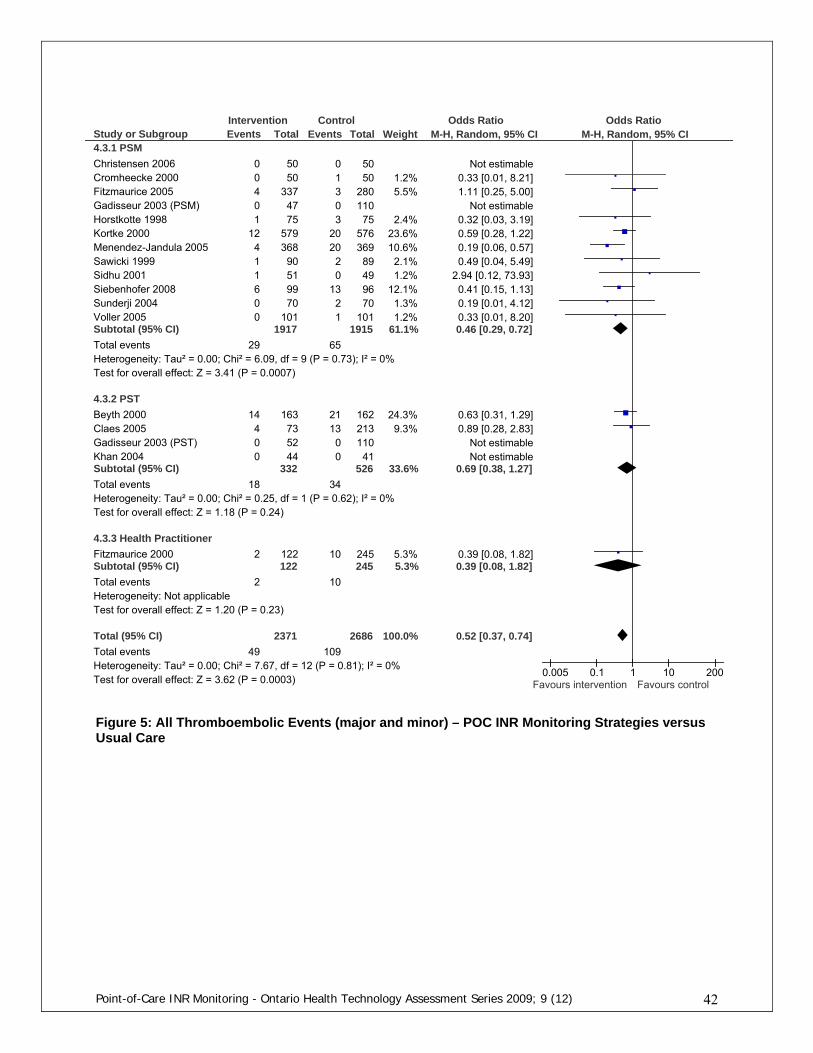
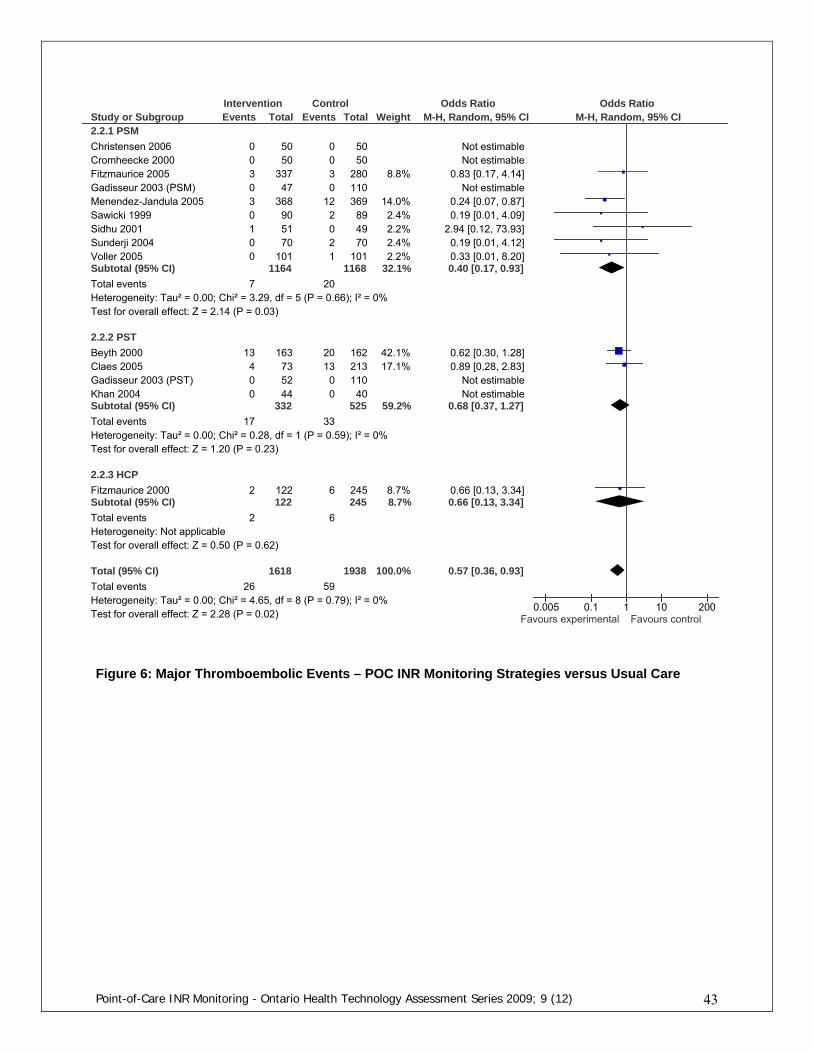
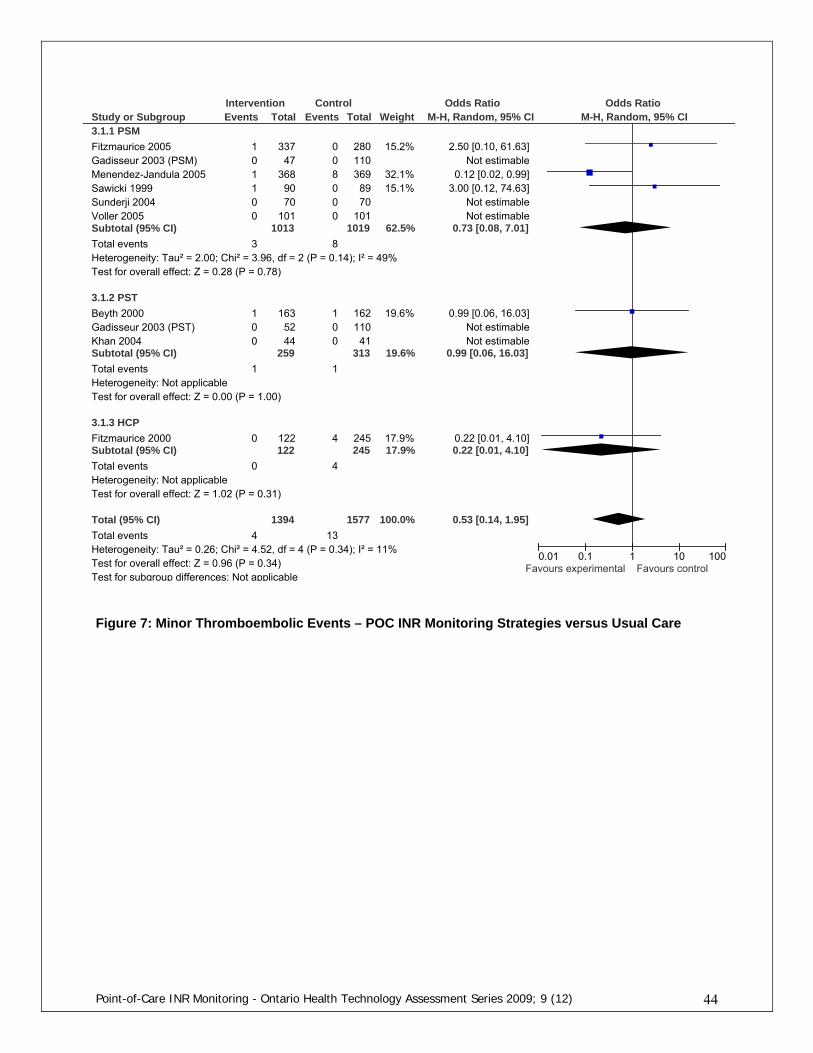
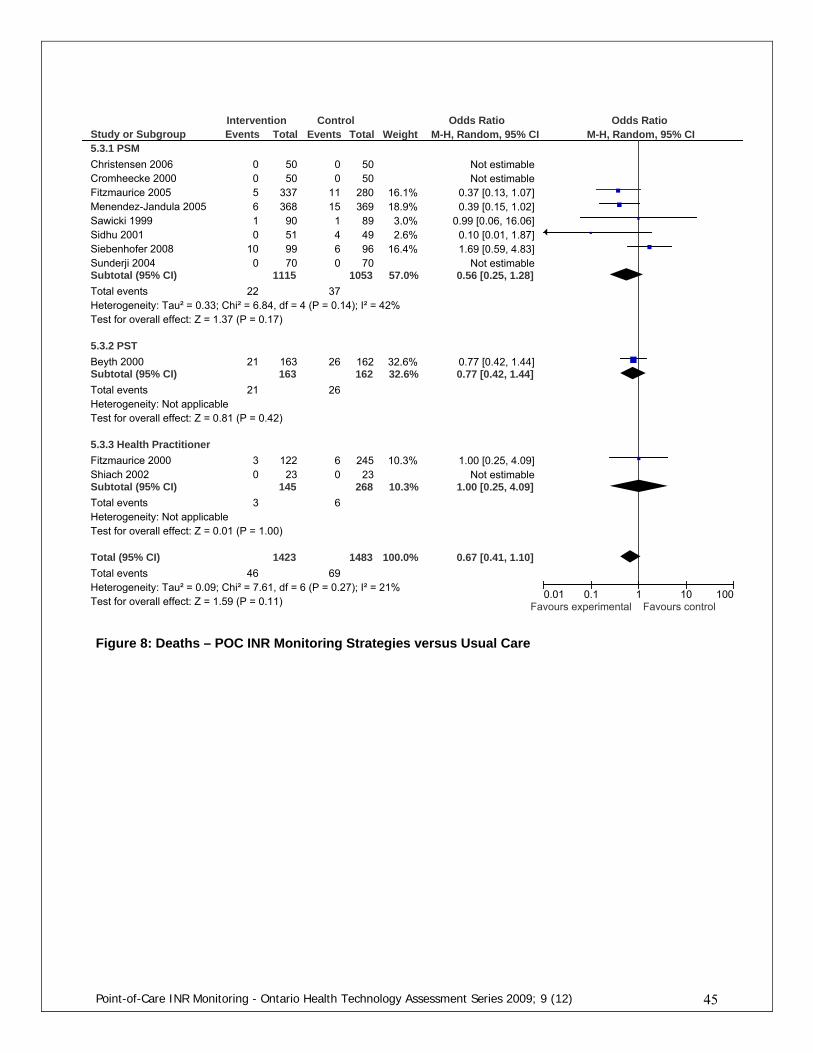

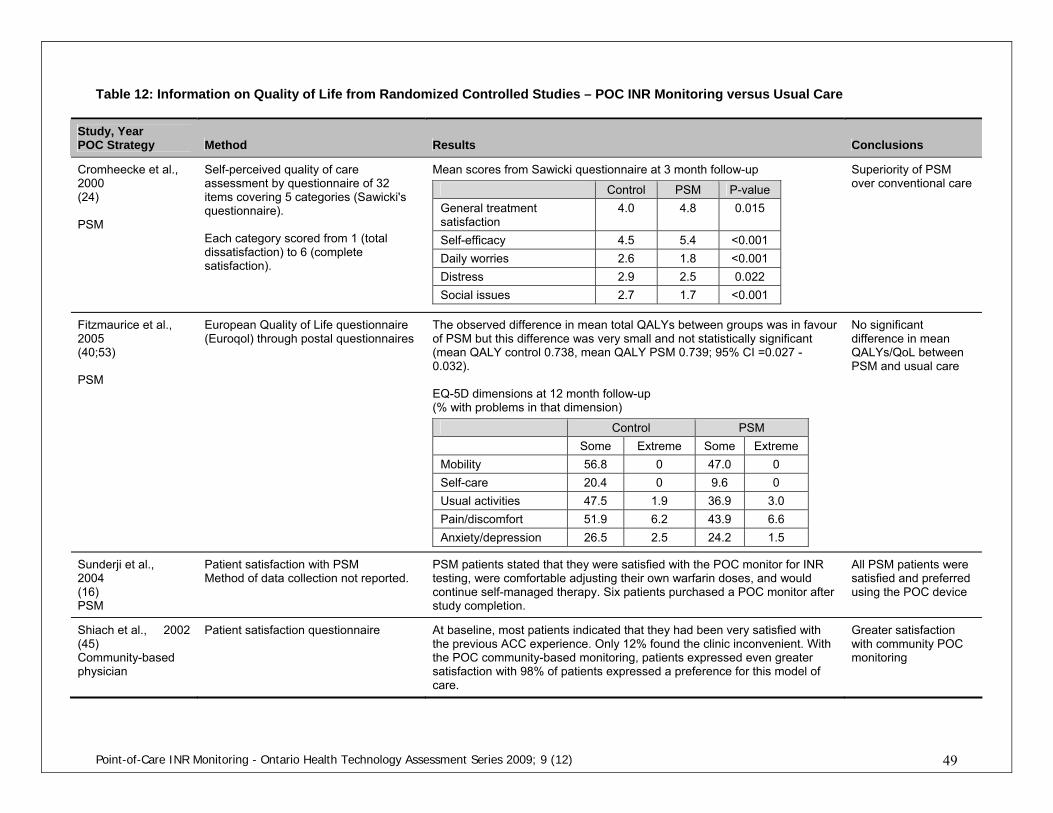
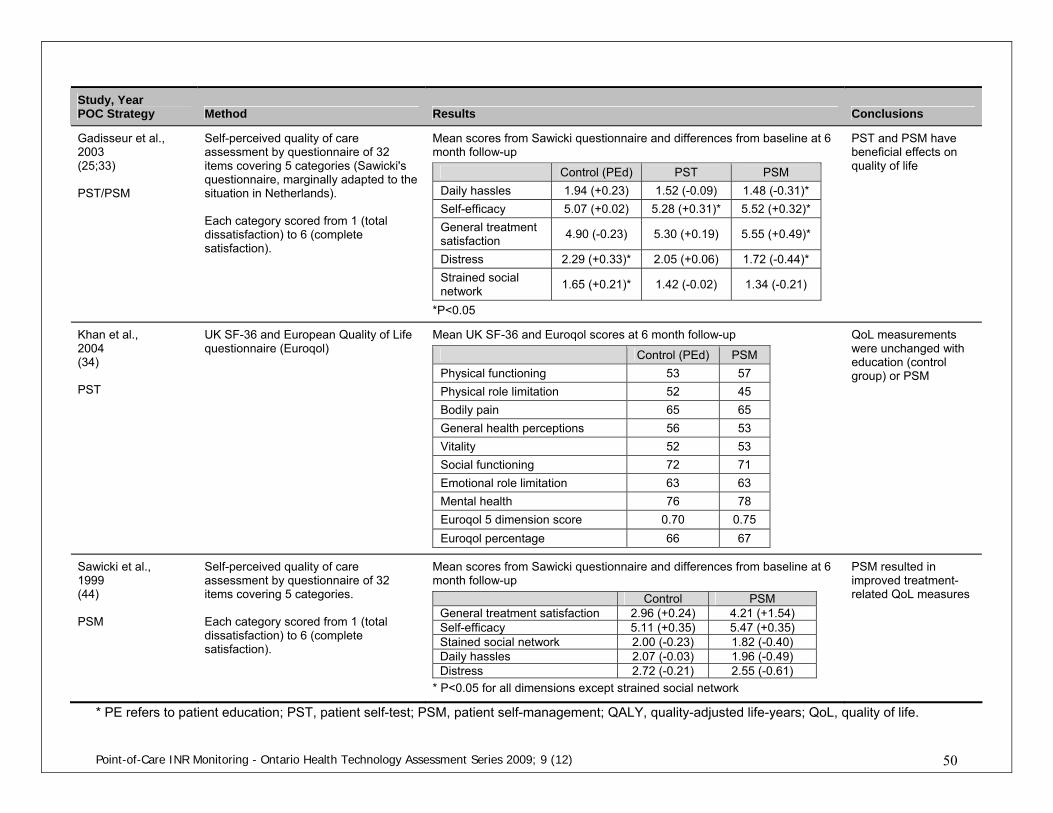


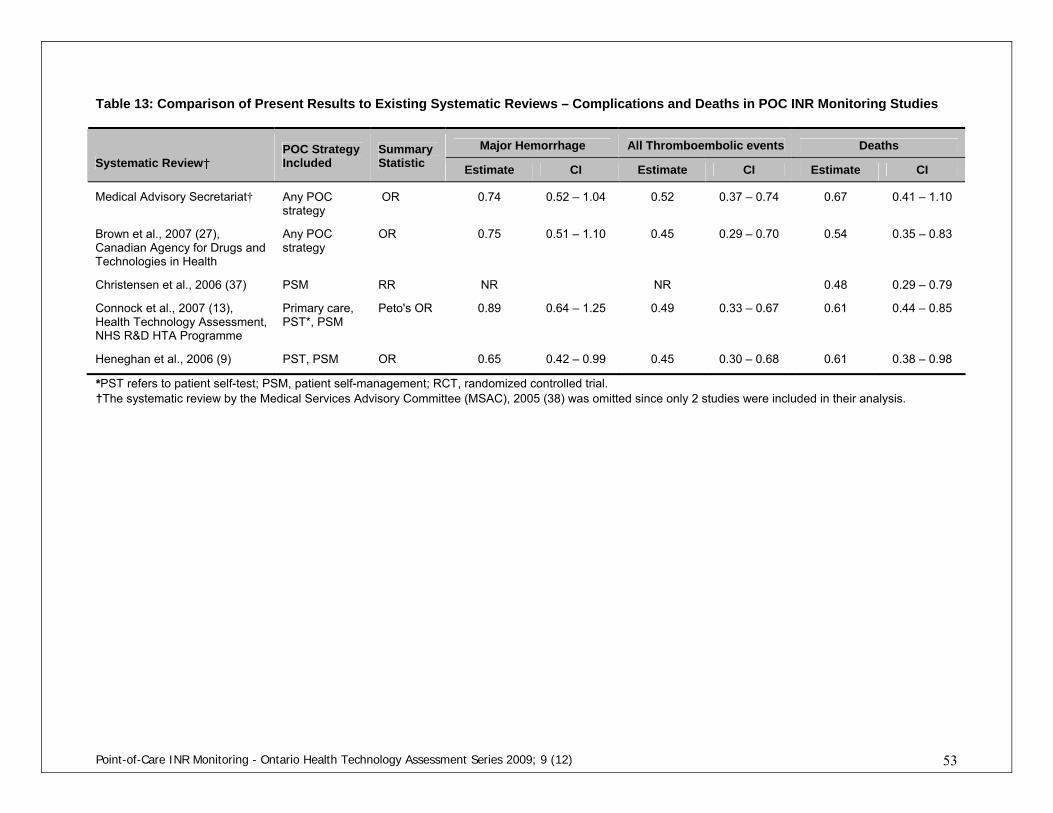

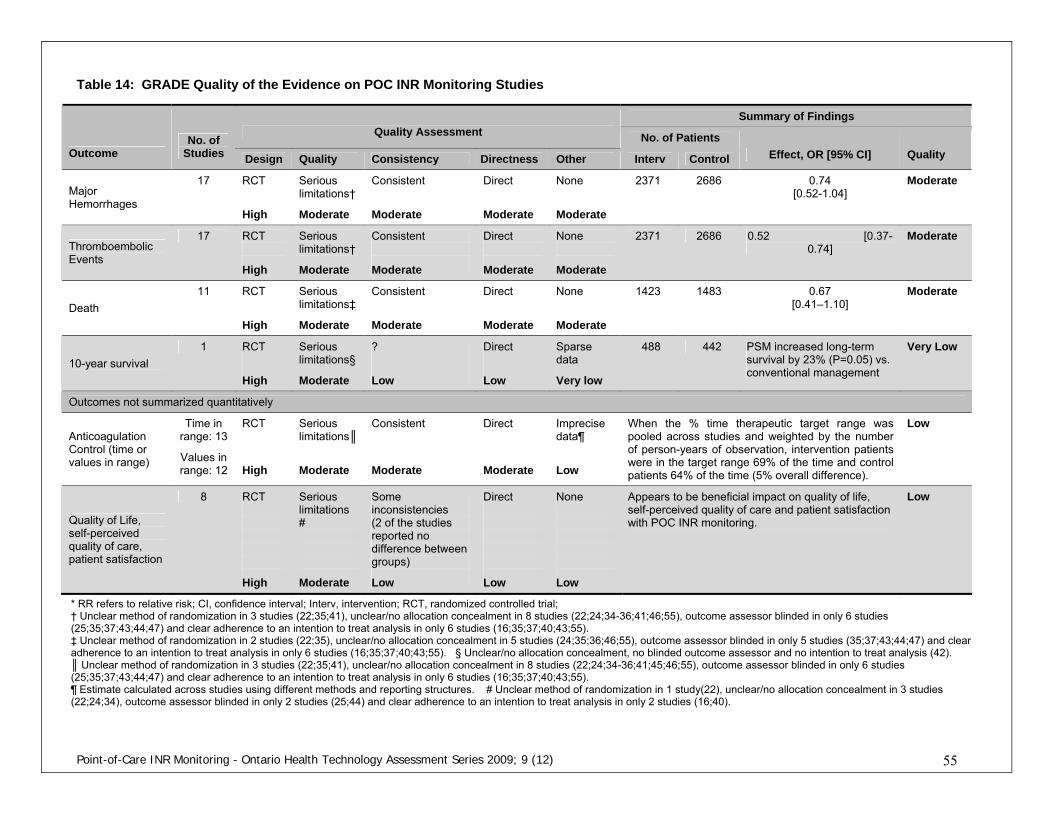


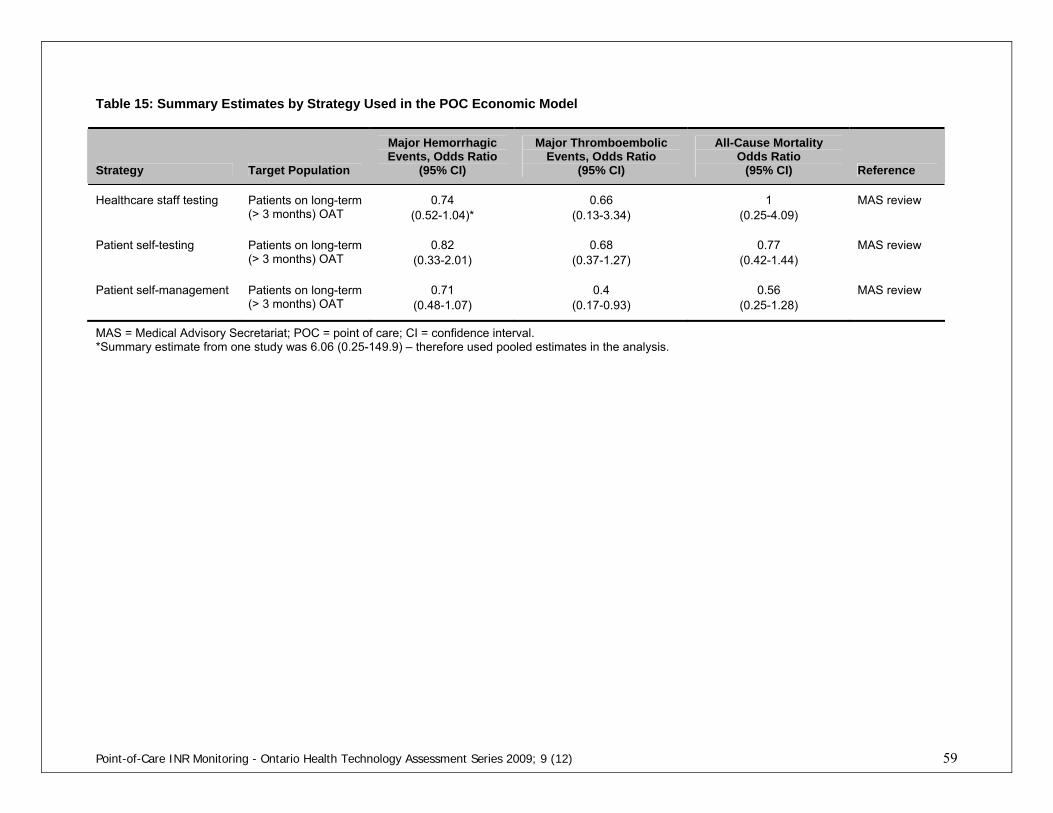
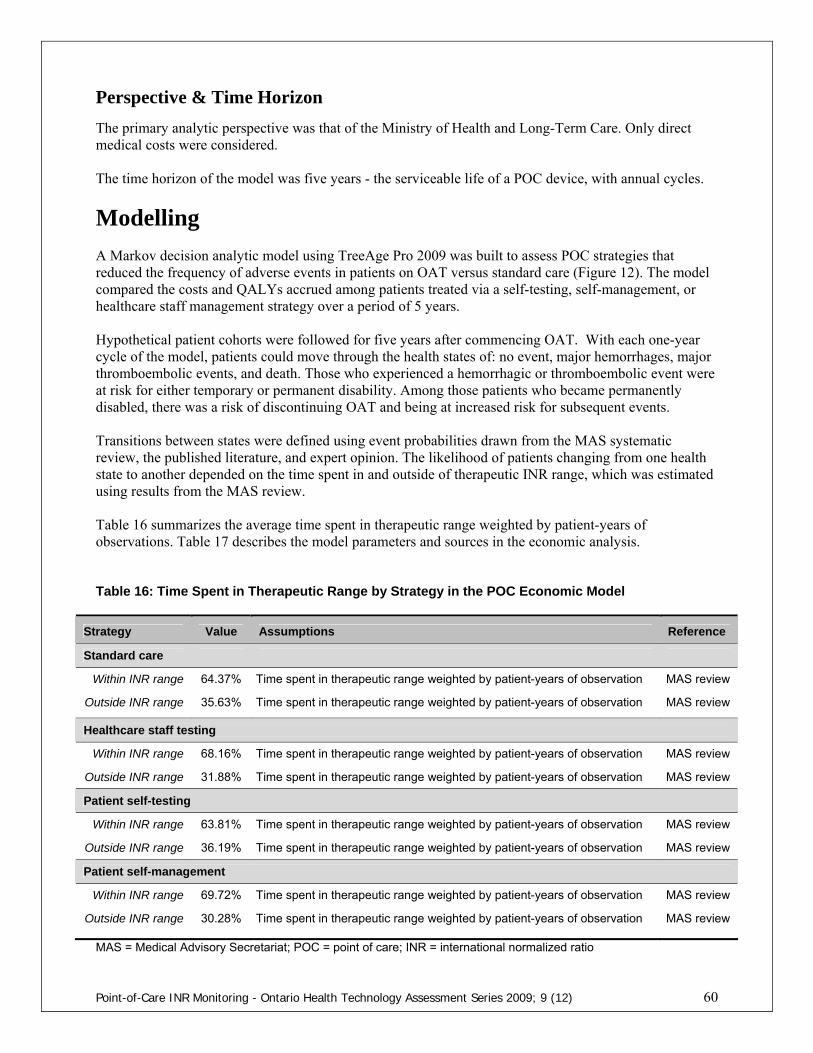


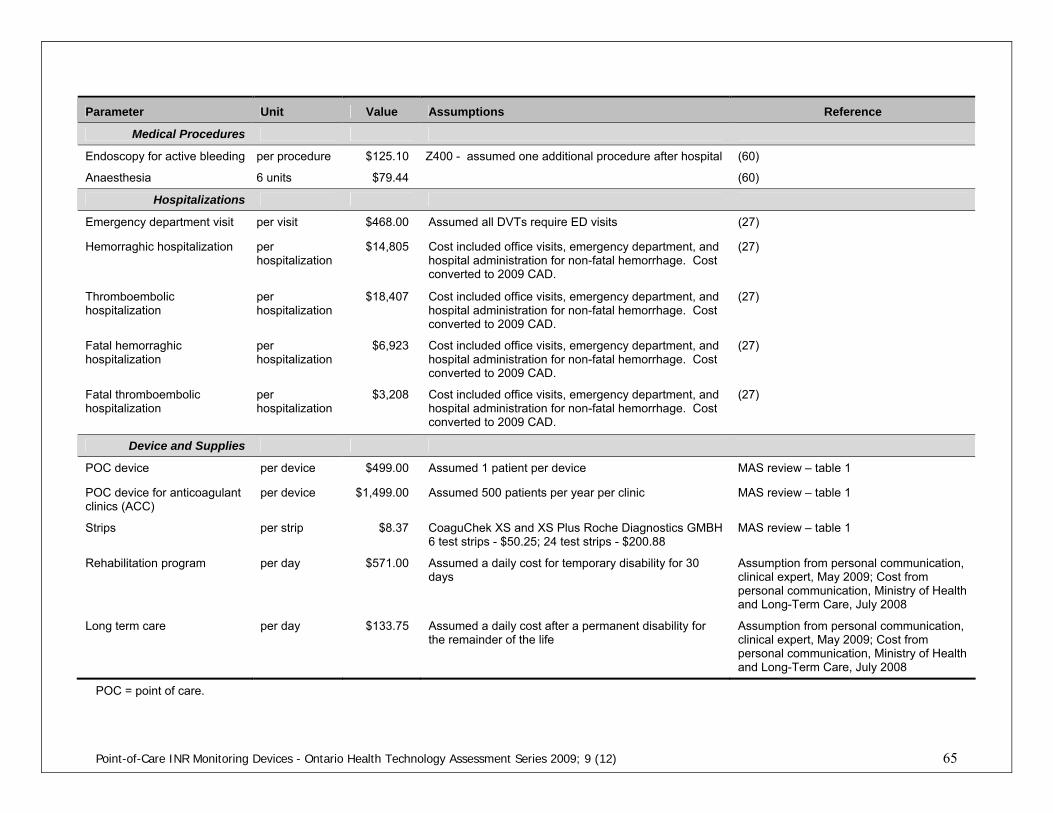
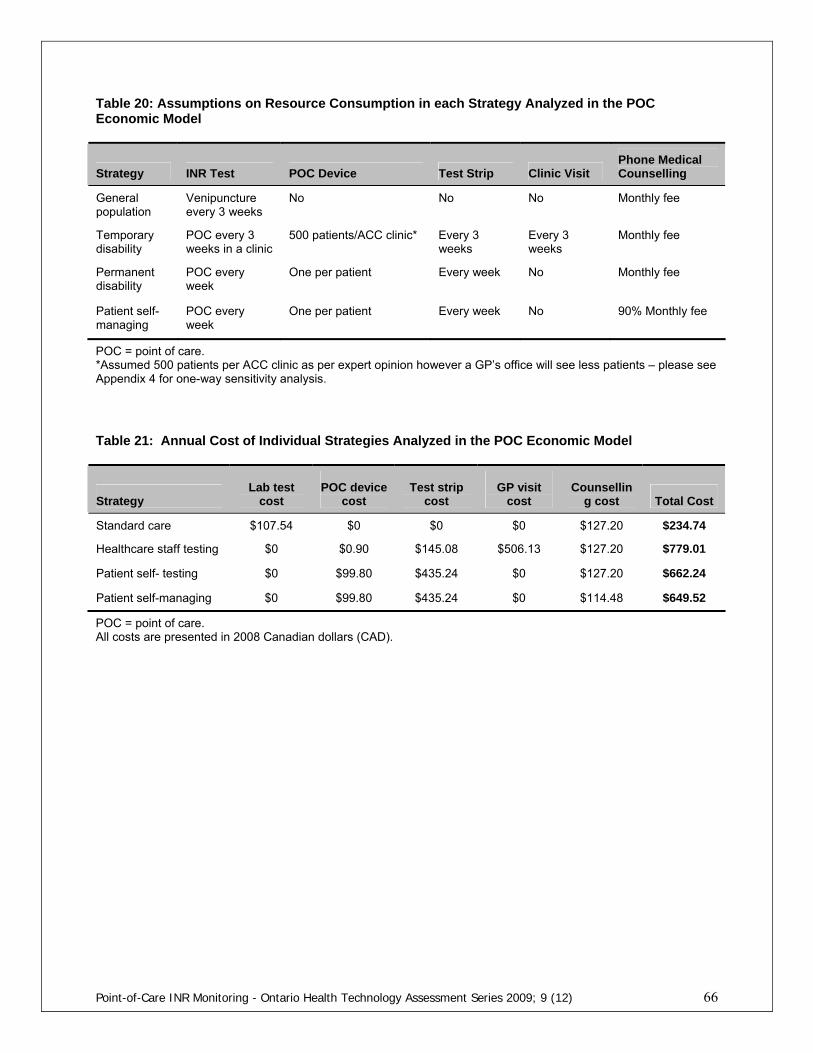
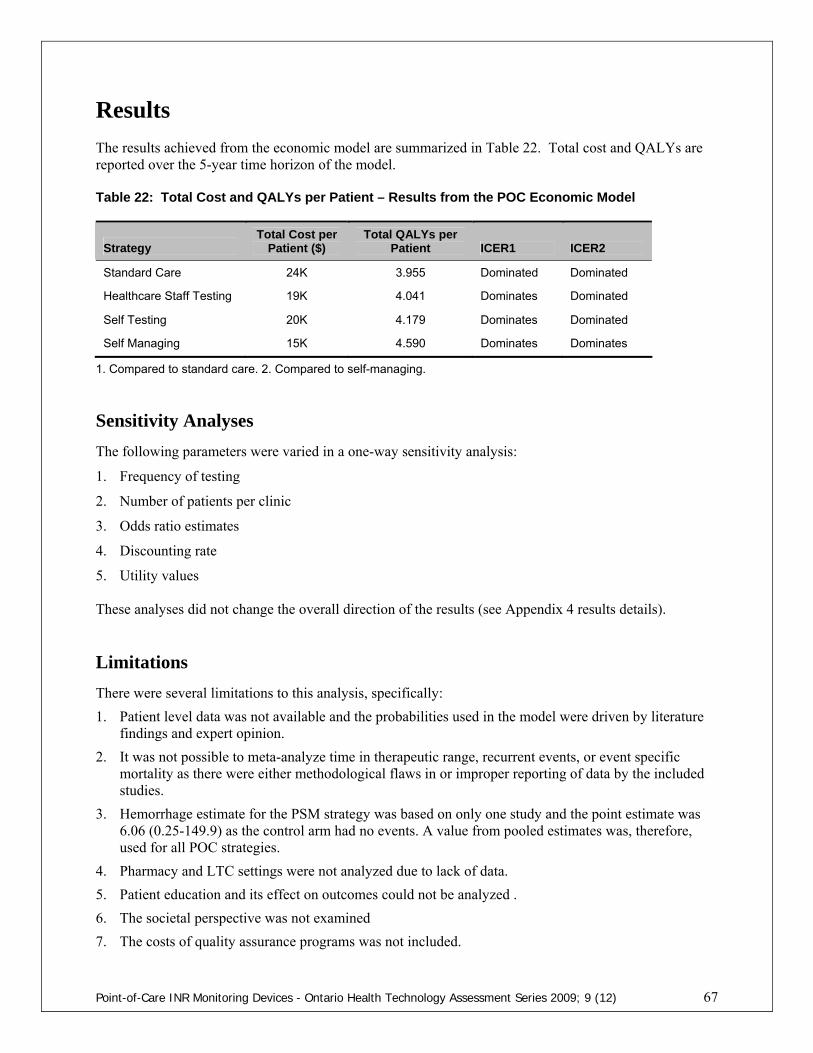

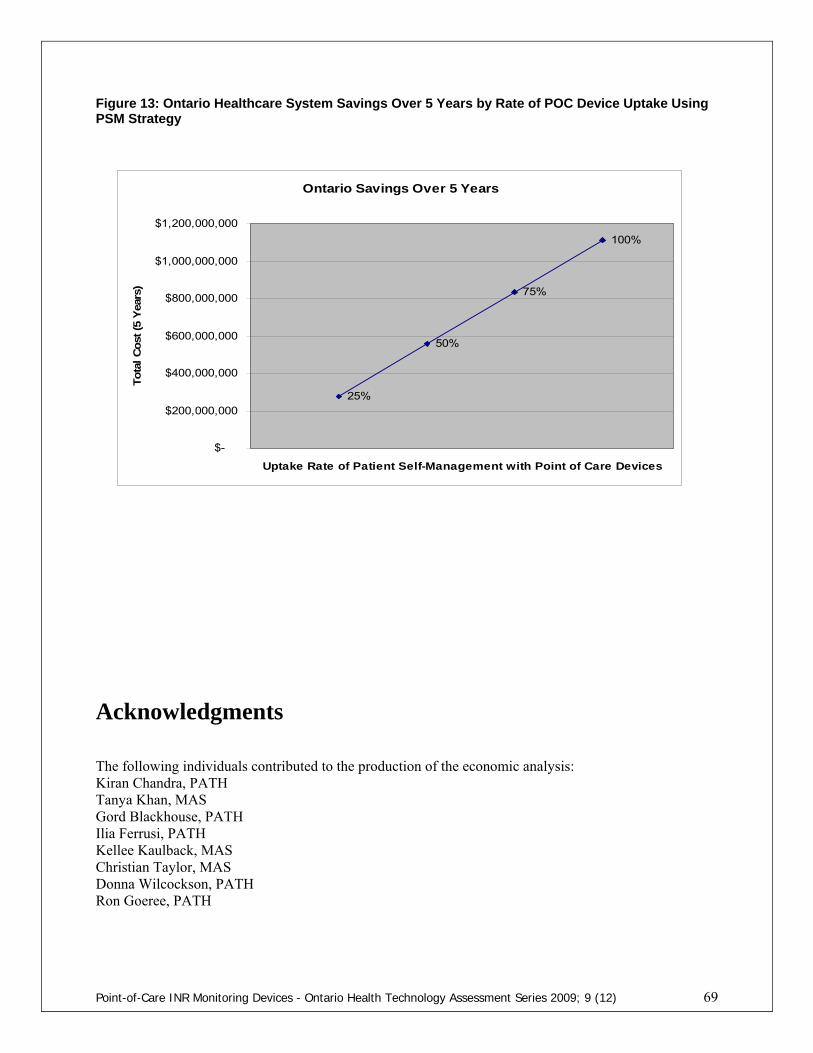
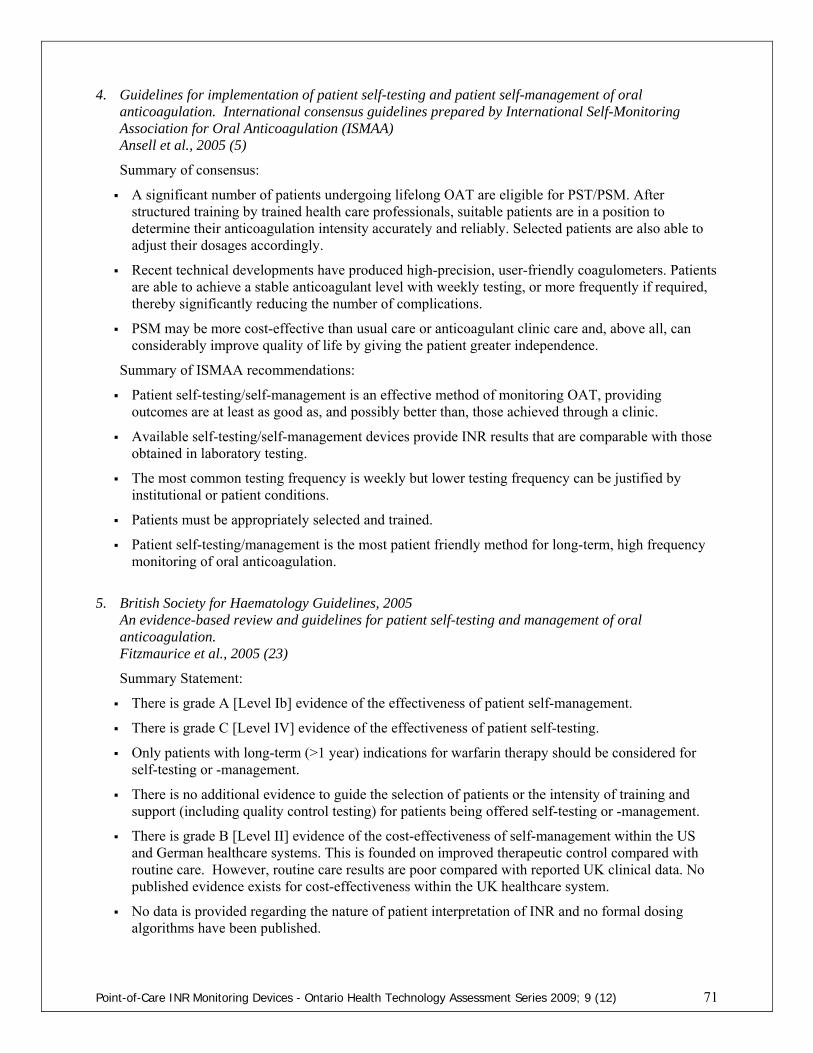
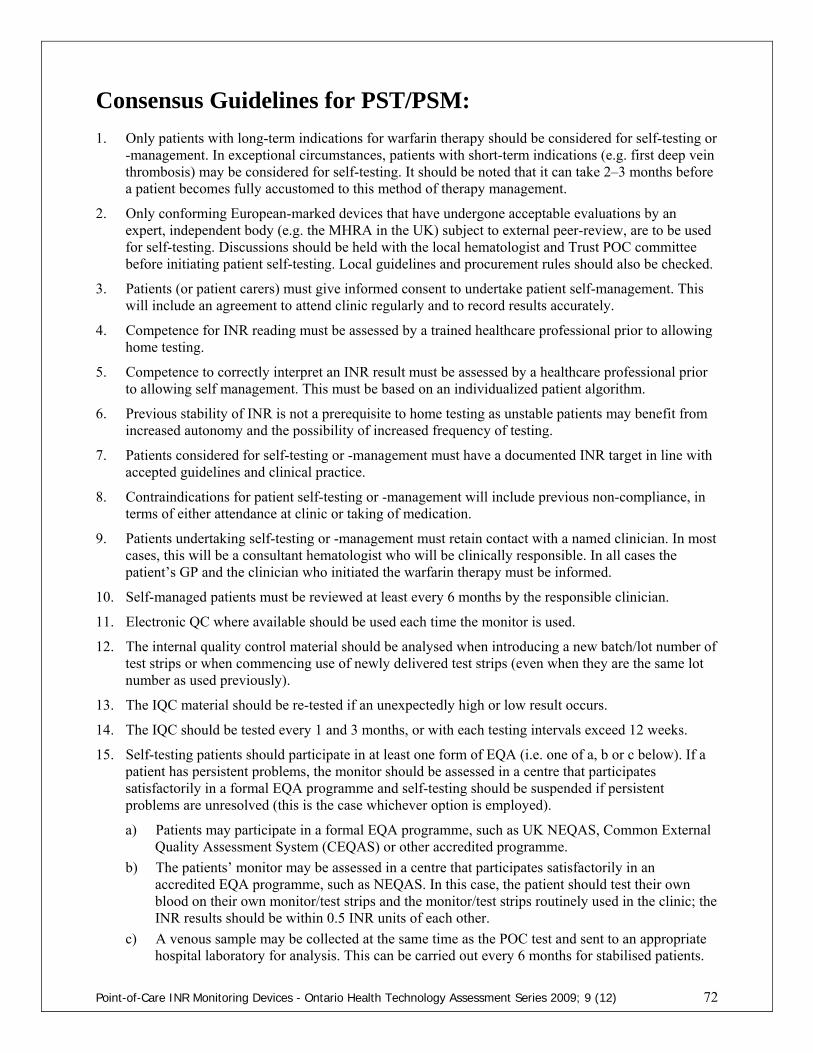


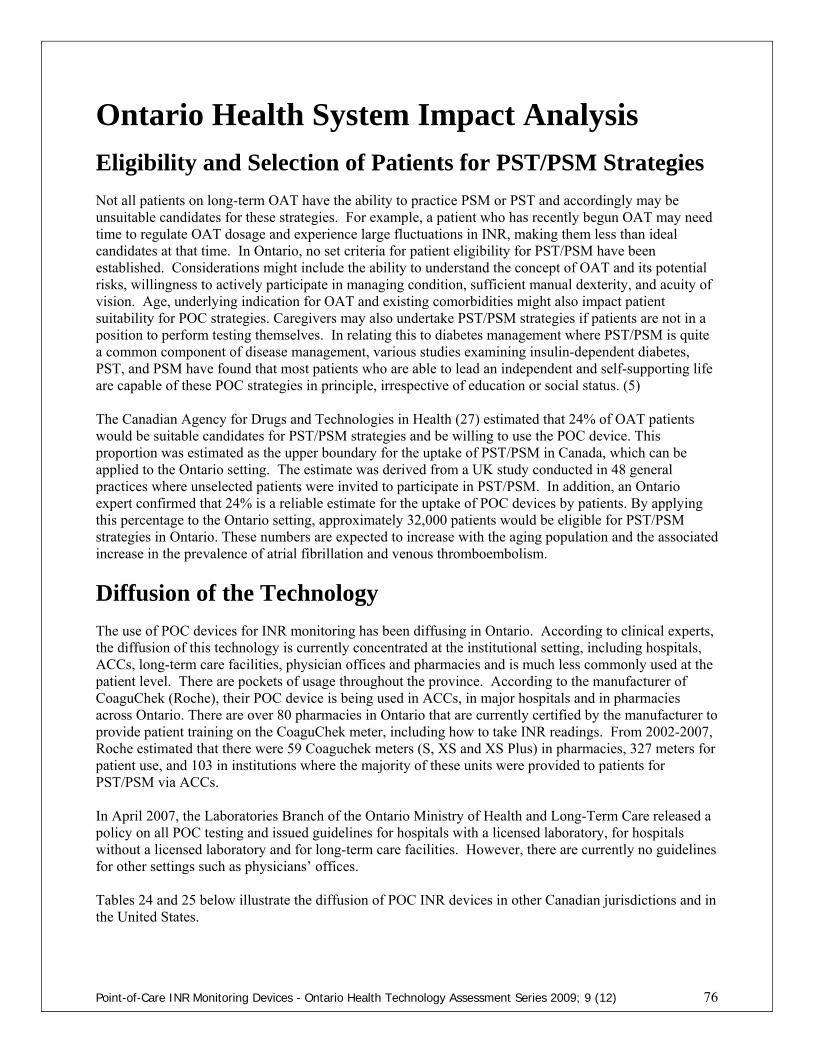

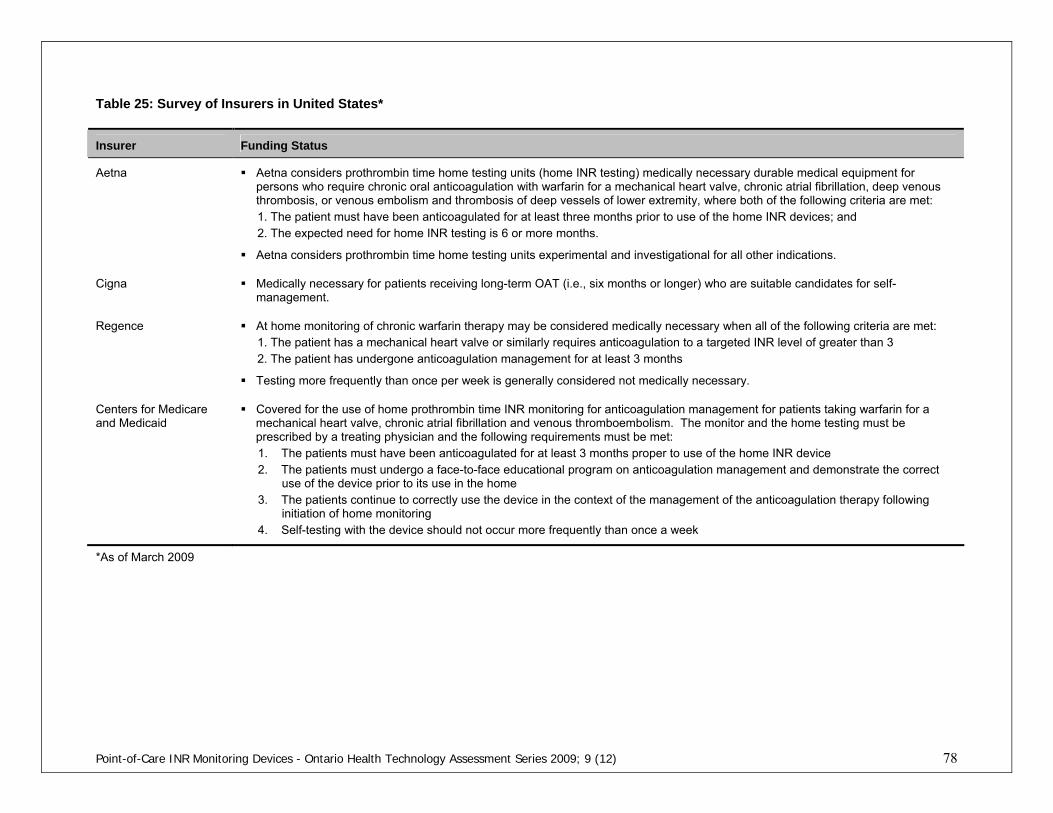


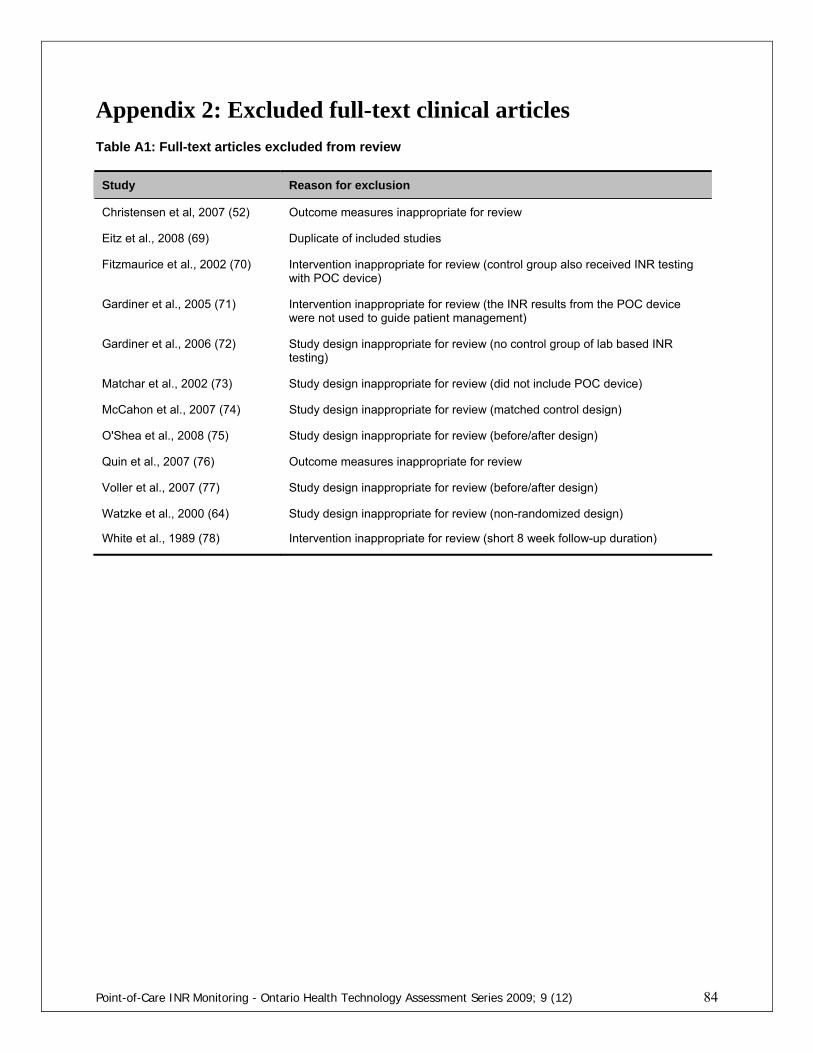

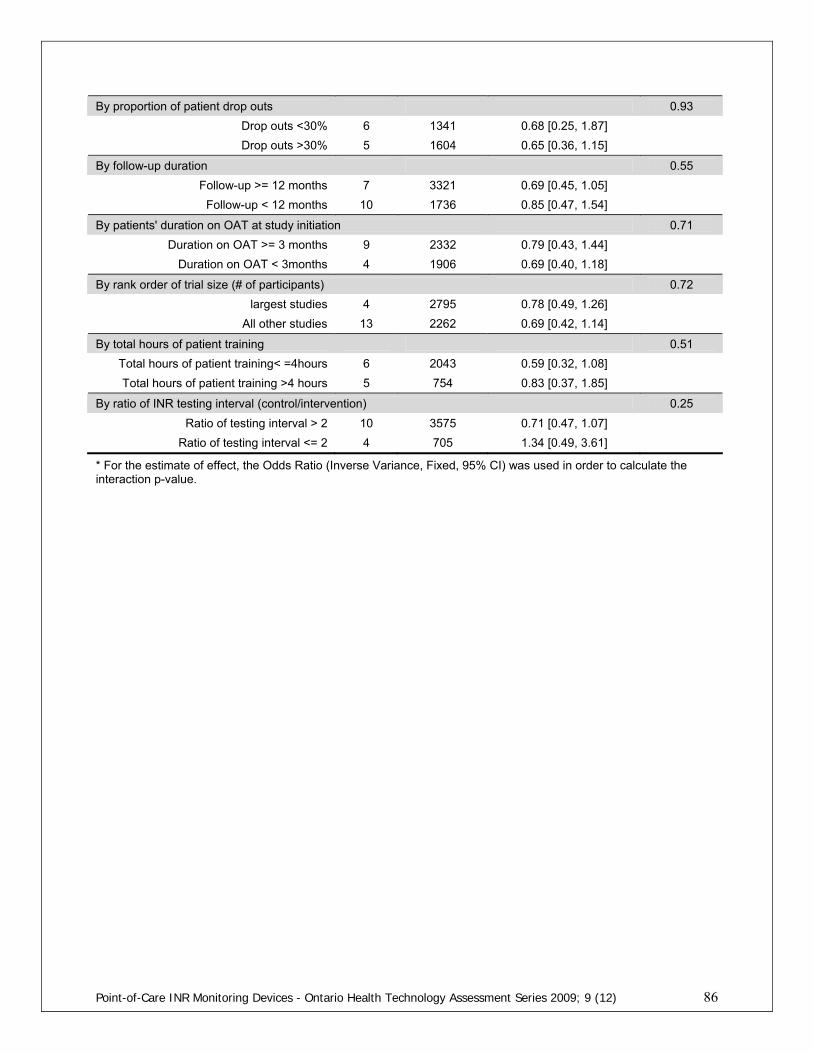

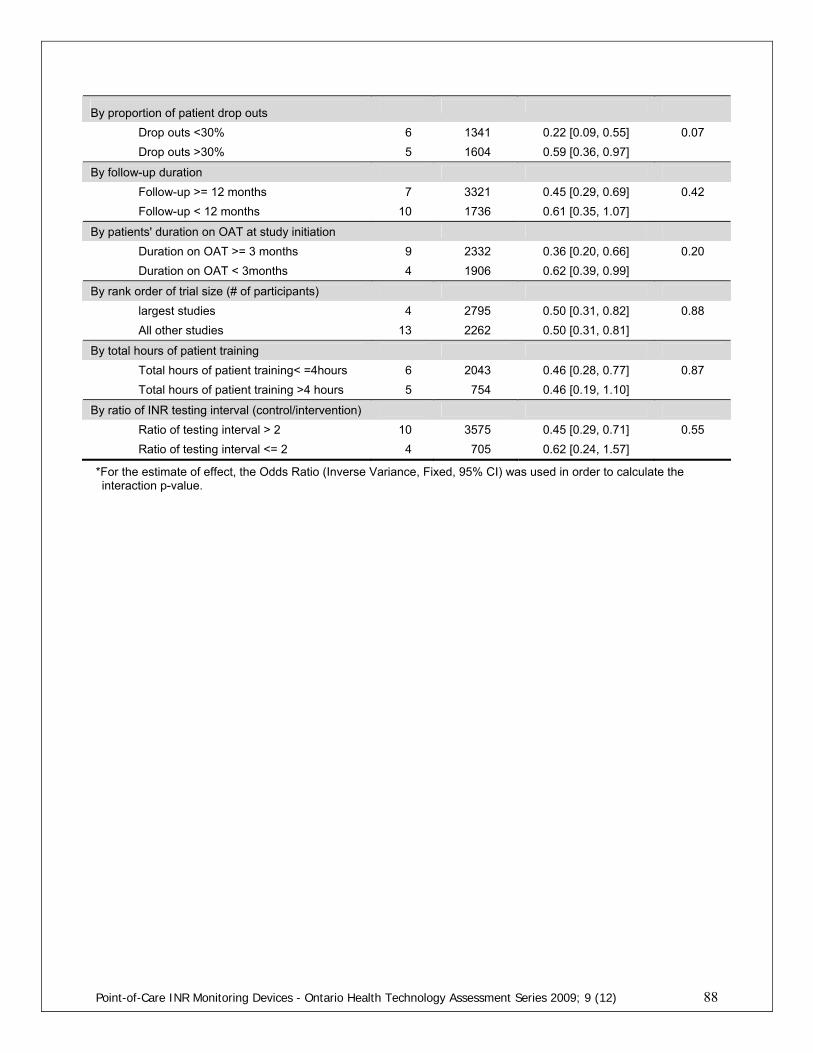
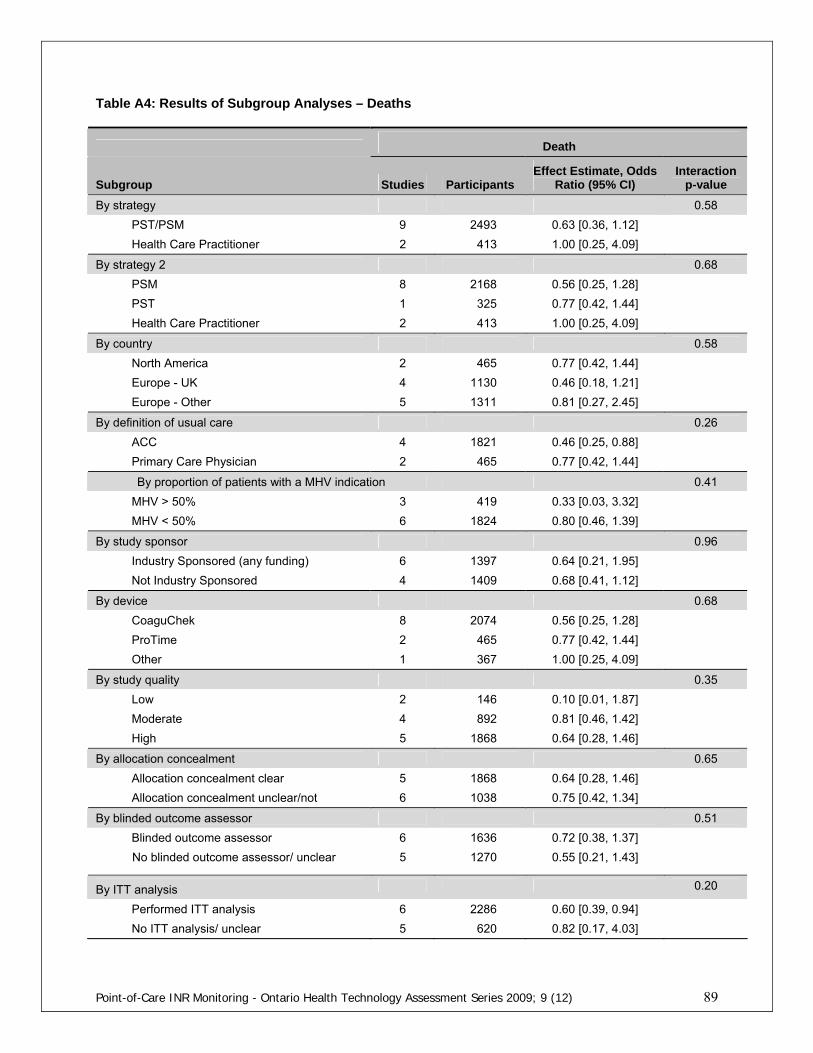
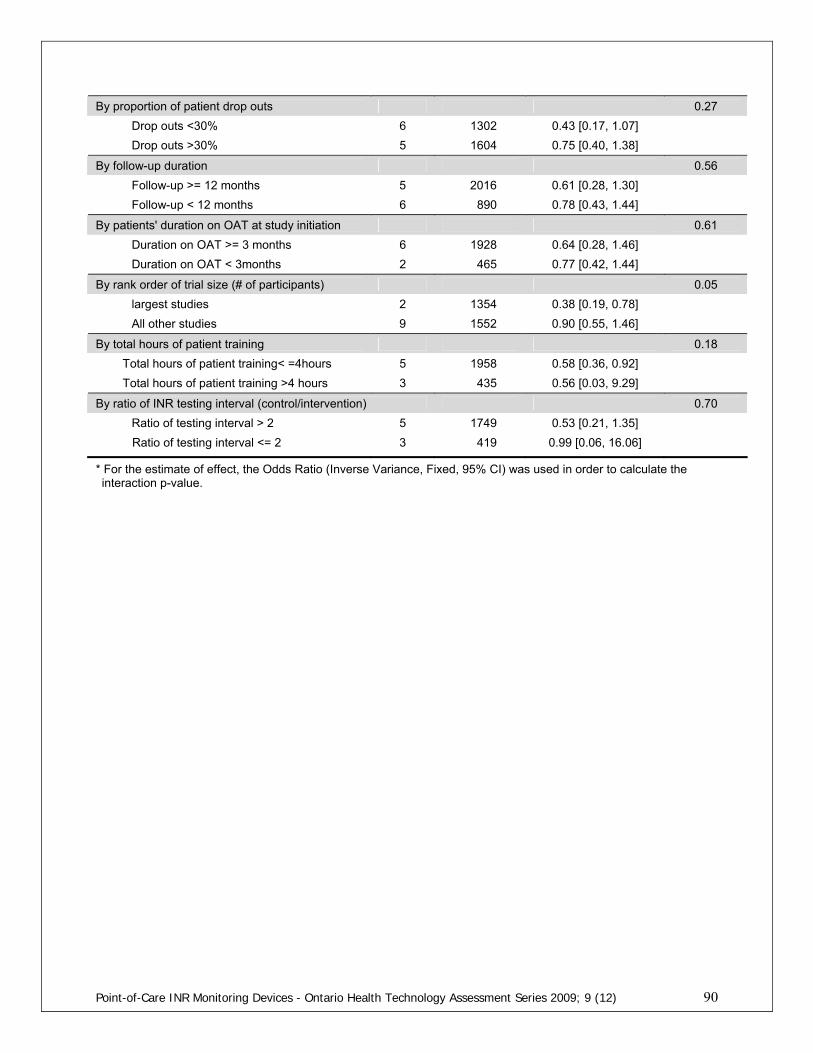
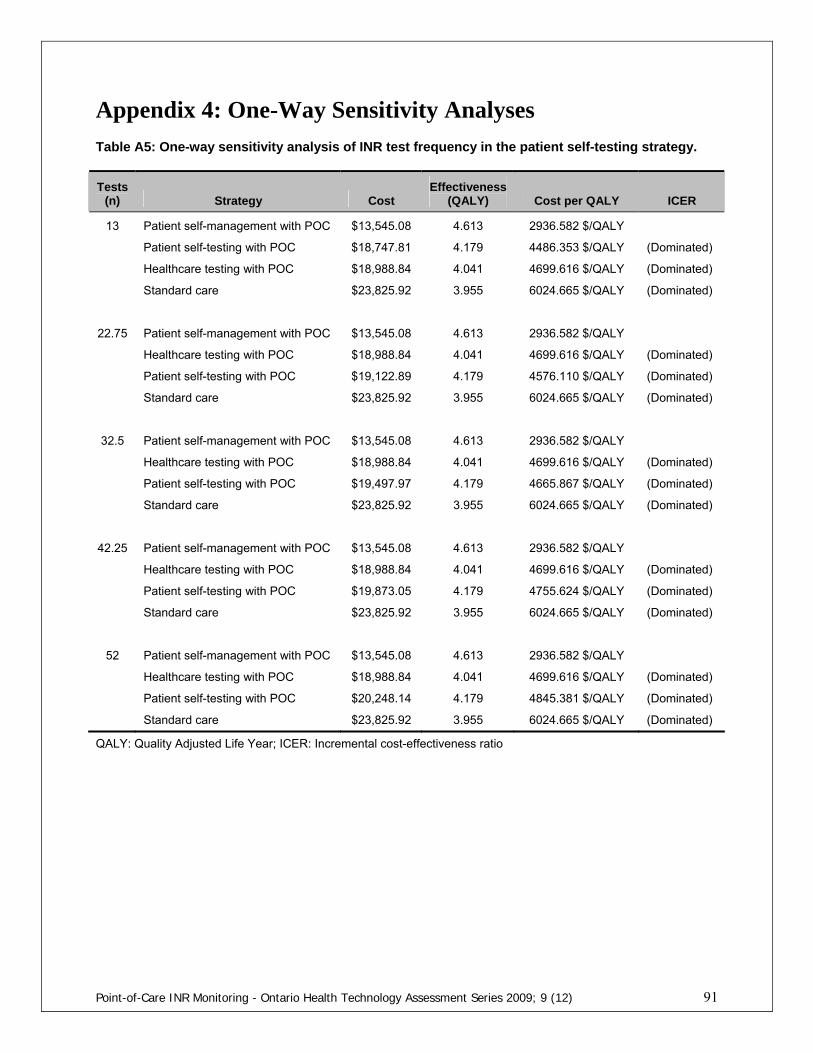

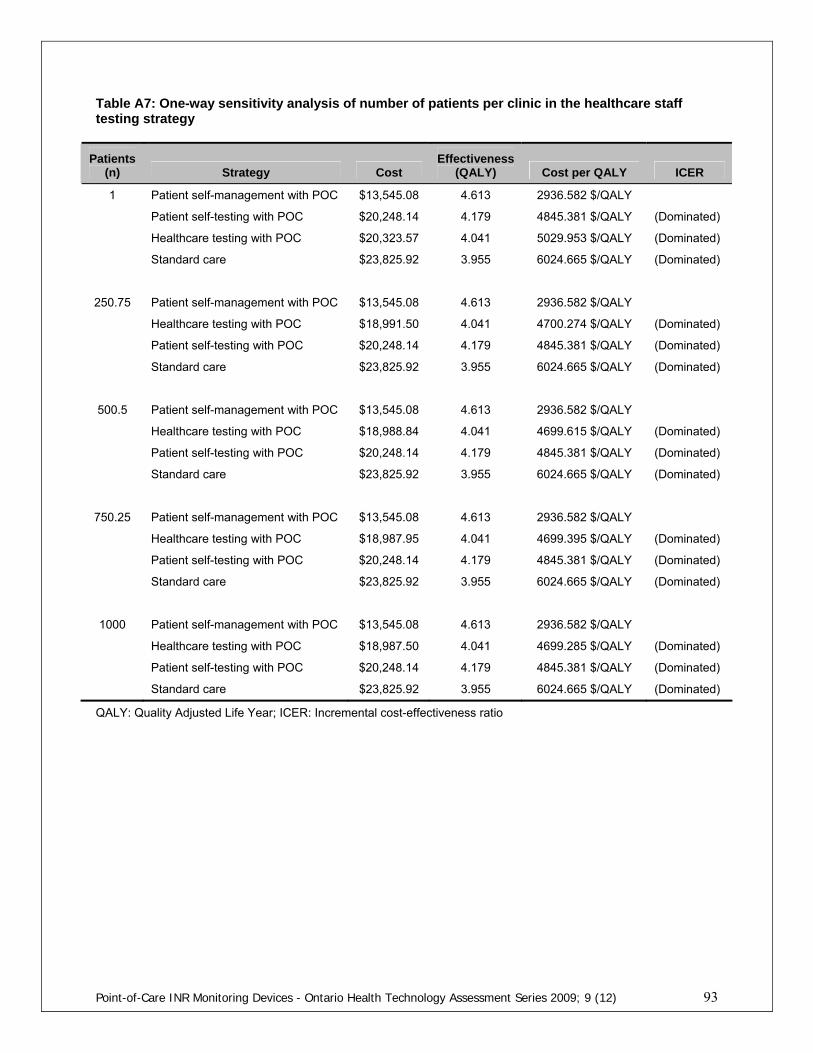

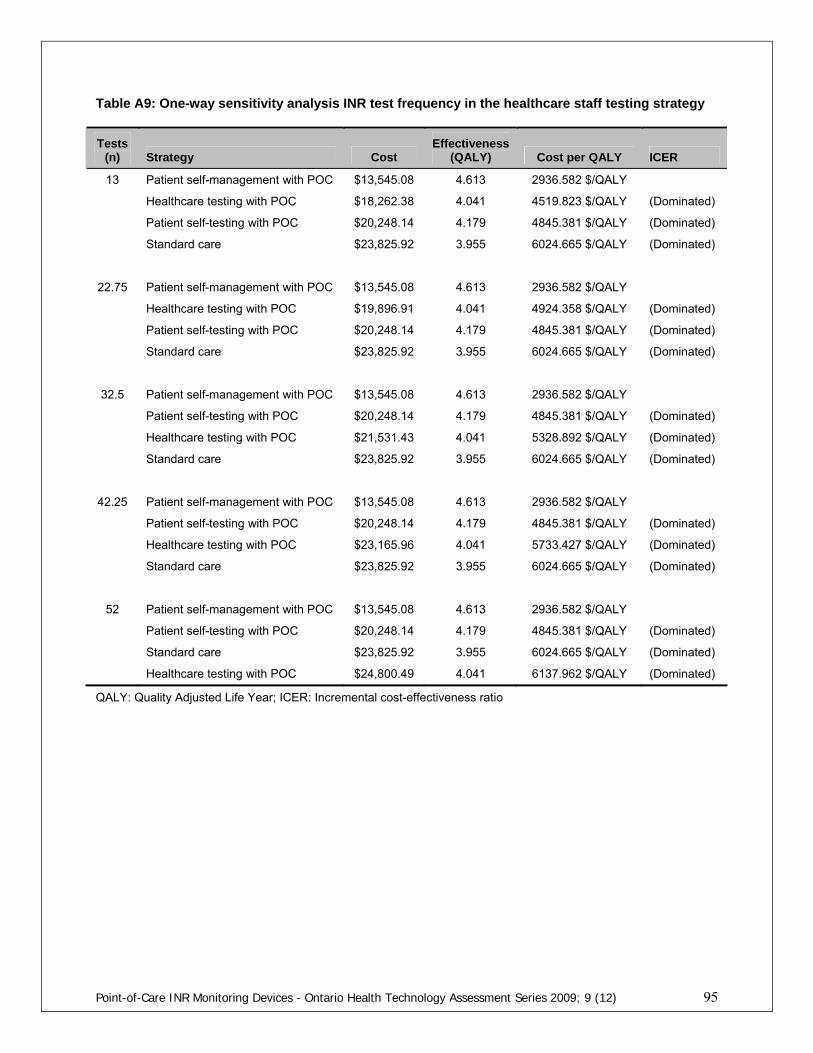
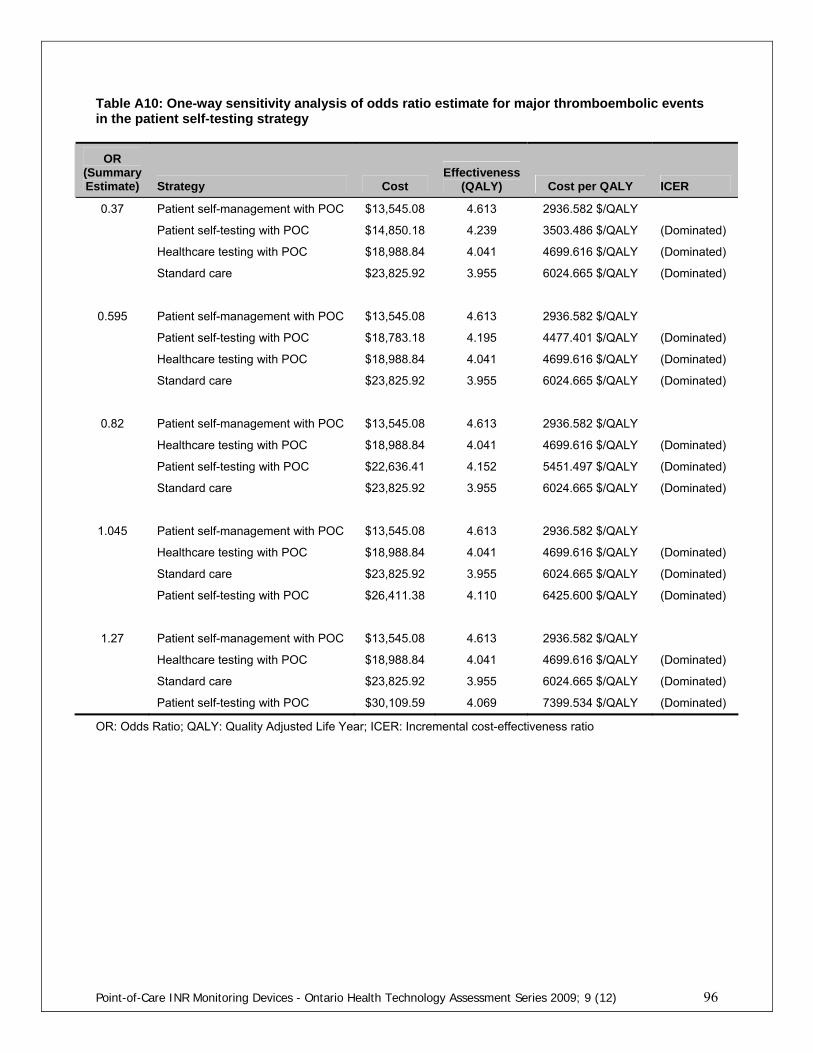

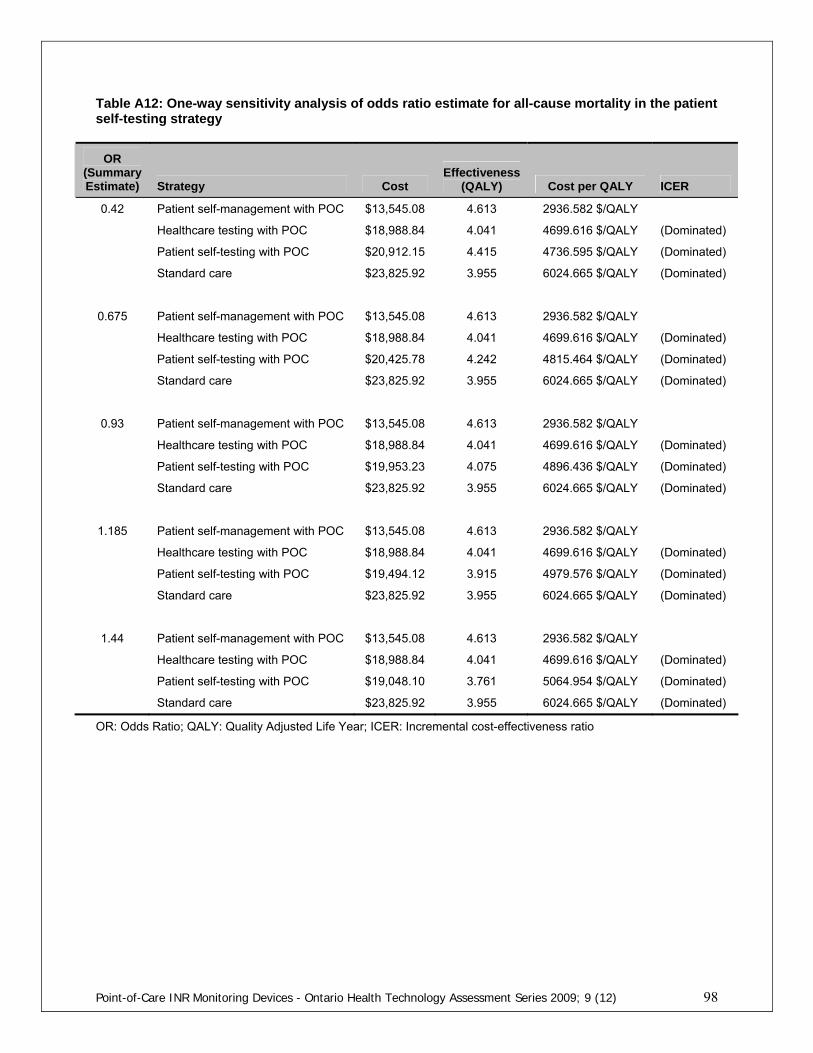


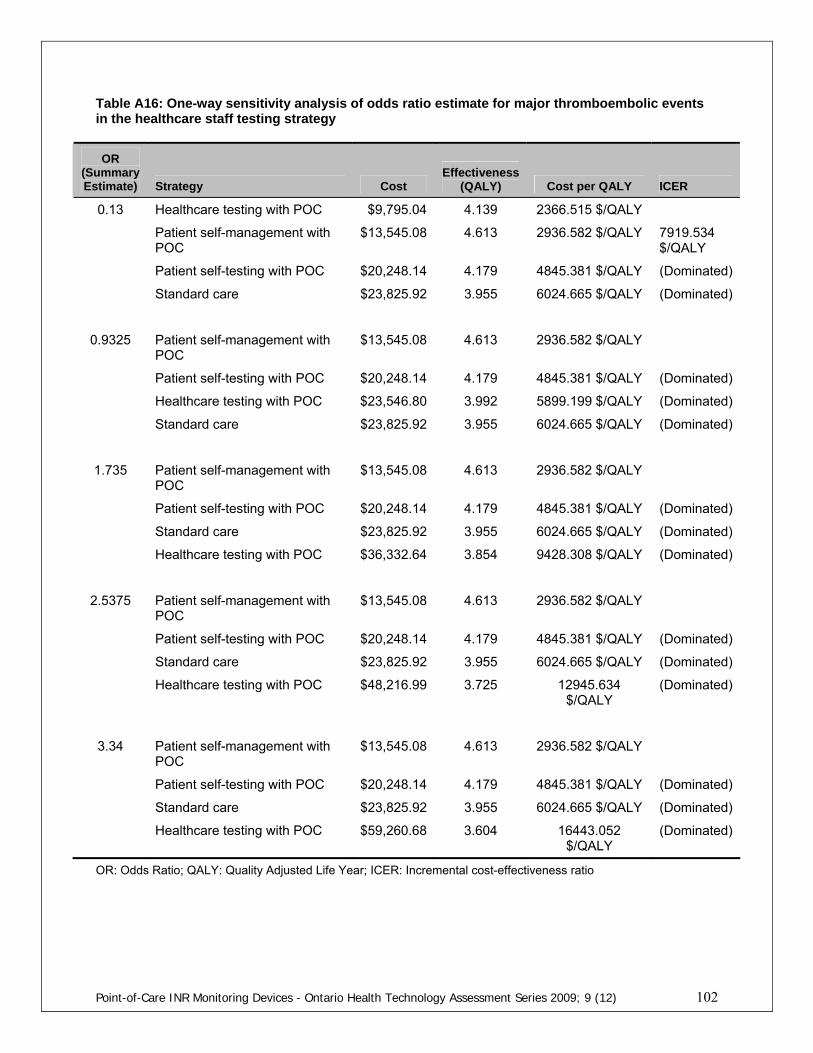

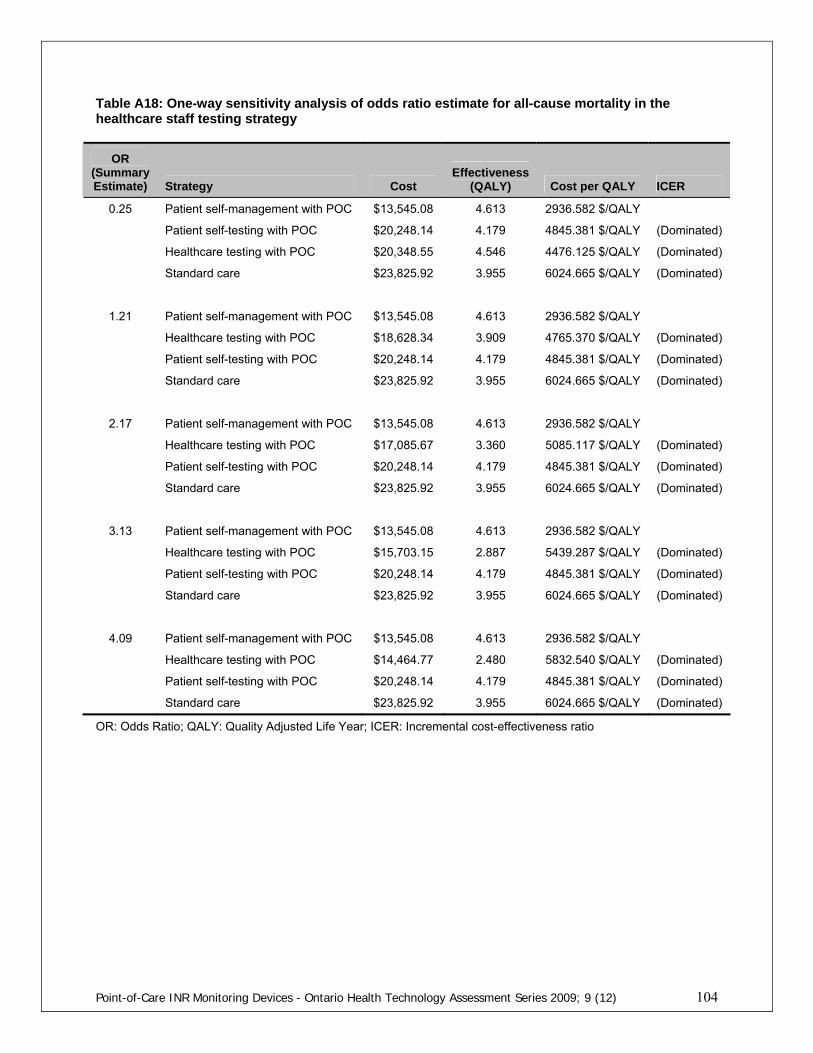
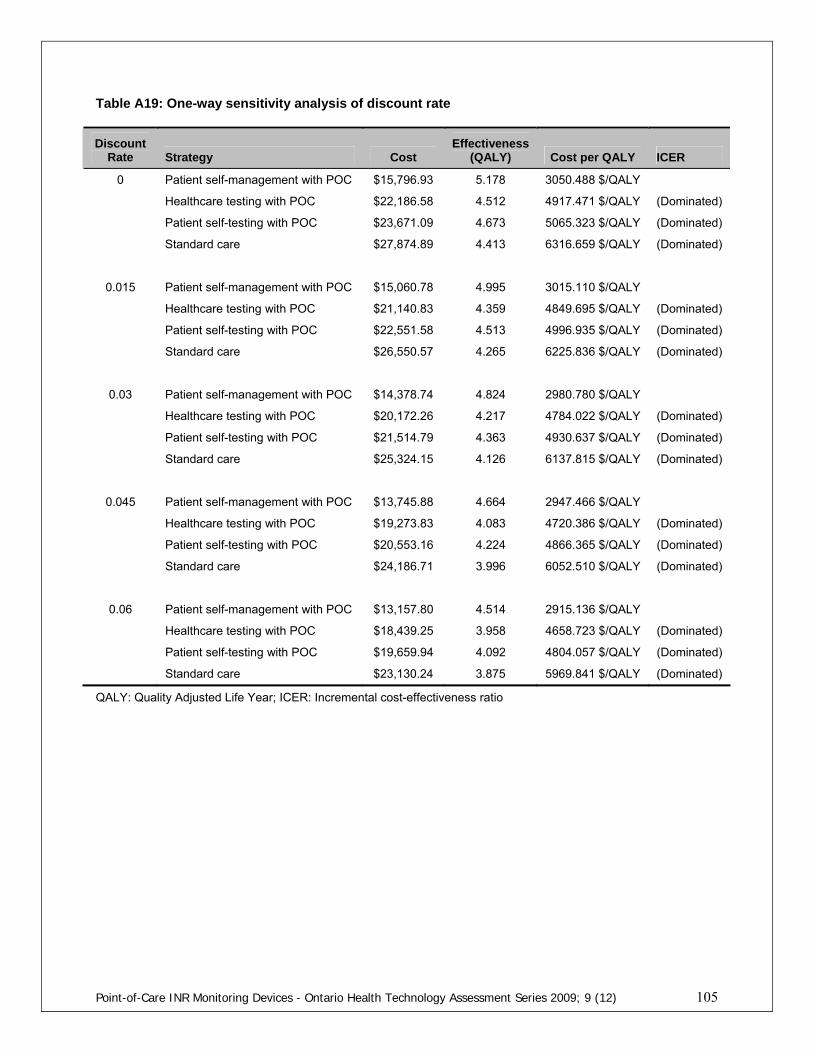
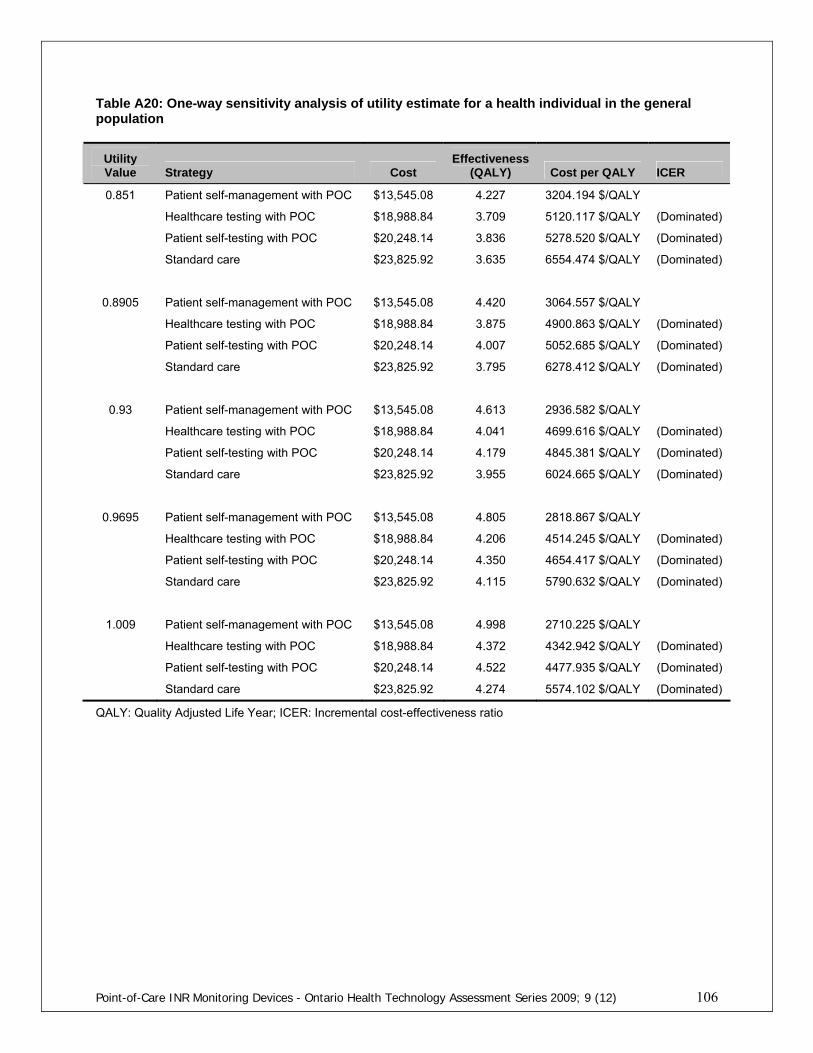


![arXiv:1705.03260v1 [cs.AI] 9 May 2017 · 2018. 10. 14. · Vegetables2 Normalized Log Size Vehicles1 Normalized Log Size Vehicles2 Normalized Log Size Weapons1 Normalized Log Size](https://static.documents.pub/doc/80x56/5ff2638300ded74c7a39596f/arxiv170503260v1-csai-9-may-2017-2018-10-14-vegetables2-normalized-log.jpg)


