142
POINT PARK UNIVERSITY FACTBOOK 2012-13 PREPARED BY THE OFFICE OF INSTITUTIONAL RESEARCH AND PLANNING

POINT PARK UNIVERSITYFACTBOOK 2012-13PREPARED BY THE OFFICE OF INSTITUTIONAL RESEARCH AND PLANNING

Table of Contents
TABLE OF CONTENTS Introduction ..................................................................................................................... i Foreword from the Office of Institutional Research and Planning ............................. i University Organization ............................................................................................. ii Organization Chart - Executive Office ..................................................................... iii General Information .......................................................................................................1 History of the University ............................................................................................1 University Profile ........................................................................................................2 Athletics ......................................................................................................................4 Point Park University Diversity Statement .................................................................5 Mission of Point Park University ................................................................................5 Vision of Point Park University ..................................................................................5 Values of Point Park University .................................................................................6 Strategic Initiatives .....................................................................................................7 Regional and Professional Accreditations and Approval ...........................................8 Facts and Figures Summary, Fall 2012.......................................................................9 Campus Map .............................................................................................................10 Admissions and Financial Aid .....................................................................................11 Admissions Summary and Trends ............................................................................12 New Enrollees by Demographic Characteristics, Fall 2012 .....................................14 New Enrollees by Academic Division, Fall 2012 .....................................................15 Full-time Undergraduate Transfers, Fall 2012 ..........................................................16 Student Financial Aid ...............................................................................................17 Enrollment .....................................................................................................................19 Trends of Fall Headcount and FTE by Division .......................................................20 Enrollment Trends, Fall 2008 to Fall 2012, by: .................................................. 21-32 Student Type ...................................................................................................21 Course Load and Division ..............................................................................22 Gender and Division .......................................................................................23 An important note about recent changes to race/ethnicity coding ..................24 Race/Ethnicity and Division ...........................................................................25 Minority Status and Division ..........................................................................28 Age and Division ............................................................................................29 Average Age by Student Type ........................................................................30 Residency and Division ..................................................................................31 Undergraduate Students in Residence Halls ...................................................32

Table of Contents
Enrollment (continued) Enrollment by Classification, Fall 2008-2012 ..........................................................33 Enrollment by School/Department and Division, Fall 2012 .....................................34 Enrollment Trends by Type, School/Dept, Major and Course Load ........................36 Enrollment Trends by Sch/Dept/Type/Major, New/Returning, Course Load ..........44 Student Enrollment by School/Dept/Major & Demographics, Fall 2012 .................67 Enrollment of Residents/Commuters by School/Division, Fall 2012 .......................72 Enrollment Trends of International Students by Country of Origin .........................73 Enrollment Map with a focus on Southwestern PA Counties, Fall 2012 .................74 Enrollment Trends of Counties by School/Department ............................................75 Enrollment Map of Counties, Net Changes, SW-PA Focus .....................................78 Enrollment Trends of W-PA Counties vs Other Counties & States .........................79 Enrollment, City of Pittsburgh vs Other Locations, Fall 2012 .................................80 Retention and Graduation Rates .................................................................................81 Overall Fall to Fall Retention Rates by Student Type: .............................................82 First-time, Full-time Freshmen .......................................................................82 New Regular Part-time Undergraduates .........................................................82 New Accelerated Undergraduates ...................................................................82 New Full-time Undergraduate Transfers ........................................................82 New Graduate Students...................................................................................82 First-year Retention Rates by School/Dept, Fall 2007 to Fall 2011: .................. 84-88 First-time, Full-time Freshmen .......................................................................84 New Regular Part-time Undergraduates .........................................................85 New Accelerated Undergraduates ...................................................................86 New Full-time Undergraduate Transfers ........................................................87 New Graduate Students...................................................................................88 Four-year and Six-year Graduation Rates by School/Dept .......................................89 Retention Rate of Freshmen by Housing Status .......................................................90 Retention Rate of Accelerated Undergraduates by Course Load .............................90 Retention Rate of Graduate Students by Course Load .............................................90 Retention Rate by Minority Status ............................................................................91 Retention Rate by Race .............................................................................................91 Retention Rate by Gender .........................................................................................91 Retention Rate by Age ..............................................................................................91 Academic Programs and Degrees Conferred .............................................................92 Trends in Degrees Conferred ....................................................................................93 Degrees and Certificates Conferred by Academic School/Department ....................94 Degrees and Certificates Awarded by Gender and Race/Ethnicity ..........................95 Trends in Degrees Conferred by School/Dept/Major and Degree ............................98 Degrees Offered ......................................................................................................111 Total University Degree Programs Offered ............................................................114

Table of Contents
Faculty and Staff .........................................................................................................115 Summary of Full-time Faculty and Staff ................................................................116 Gender Distribution of Full-time University Personnel ..........................................117 Race/Ethnicity Distribution of Full-time University Personnel ..............................118 Full-time Faculty by School/Department, Gender and Race/Ethnicity ..................119 Full-time Faculty Salary by Rank ...........................................................................119 Tenure Status of Full-time Faculty by School/Department ....................................120 Full-time Faculty by Rank and Years of Service ....................................................121 Budget ..........................................................................................................................122 Total University Budget, FY12 – Revenue.............................................................123 Total University Budget, FY12 – Expenditures .....................................................124 Endowment Values over Five Years .......................................................................125 Student Tuition and Fees by Year ...........................................................................126

INTRODUCTION

Introduction
INTRODUCTION Foreword from the Office of Institutional Research and Planning Recognizing that information is a key institutional resource, the Office of Institutional
Research and Planning is responsible for providing the university management with
information that supports institutional planning, university assessment, policy formation
and decision making; for coordinating responses to inquiries for university-related
information and serving as a comprehensive source for information about the institution.
To that end, the purpose of this factbook is to provide accurate and timely information
about significant aspects of the university and its operations. The 2012-13 Factbook is the
eighth annual comprehensive report of data and information collected at Point Park
University. It includes the most current information available for an academic or fiscal
year, as well as pertinent historical information.
Most of the information contained in the factbook is extracted from administrative reports
produced on an annual basis by various university offices. The expert assistance and
cooperation received from individuals in offices supplying factbook data is sincerely
appreciated.
We hope that you find this factbook both informative and useful. Any questions,
comments, or concerns regarding this document may be directed to the Office of
Institutional Research. Thank you for your interest in Point Park University and the
information contained in this report.
2012-13 Point Park University Factbook i
Introduction
2012-13 Point Park University Factbook ii
University Organization
Point Park University is organized into two operational divisions: The Office of
Academic and Student Affairs and the Office of Finance and Operations. Each division
is led by a senior vice president who reports to the president, Dr. Paul Hennigan.
The Office of Academic and Student Affairs includes all academic programs, faculty and
academic support staff, as well as the Office of Students Affairs, the Office of the
Registrar, the Office of Institutional Research and Planning, and the Library. This
division is led by Dr. Karen S. McIntyre, the Senior Vice President for Academic and
Student Affairs, Chief Academic Officer and Dean of Faculty.
The Office of Finance and Operations includes the Office of Human Resources, the
Office of Business Services, the Office of Finance, Information Technology Services,
Public Safety, which includes environmental, health and safety, Operations, which
includes facilities, transportation and conferences/events, and the University
Architect/Planner. This division is led by Bridget Mancosh, the Senior Vice President for
Finance and Operations.
Other key functions that report directly to the President include: Development and
Alumni Affairs, led by Vice President, Rick Haskins; External Affairs, including
Marketing and Communications, led by Vice President, Mariann Geyer; Admissions,
including Full-time Admissions, Graduate and Adult Enrollment, and International
Student Services and Enrollment, led by Assistant Vice President, Trudy Williams; and
Office of Legal Affairs, led by Vice President, Clare Ann Fitzgerald.
Please refer to the Executive Office Organization Chart on the following page.

Introduction
2012-13 Point Park University Factbook iii

GENERAL INFORMATION

General Information
2012-13 Point Park University Factbook * 1
GENERAL INFORMATION History of the University Throughout its history, Point Park University has taken pride in its urban roots and contributions to the vitality of downtown Pittsburgh. The University began as the Business Training College (BTC), which was founded in 1933 by Dr. Dorothy and L. Herbert Finkelhor as a proprietary school that prepared students for careers in the business world. BTC was located in downtown Pittsburgh. In 1960, the state of Pennsylvania chartered BTC as Point Park Junior College, a tax-exempt institution of higher education. The College was re-chartered as Point Park College in 1966 and began awarding bachelor’s degrees. Its first graduate program (journalism and communications) was established in 1981. Point Park was granted university status by the Pennsylvania Department of Education in October 2003. Point Park University acquired The Pittsburgh Playhouse (now Point Park University’s Pittsburgh Playhouse) in 1968. Its main campus remains in downtown Pittsburgh and includes more than 16 properties, including academic, administrative and residence halls. To meet its growing needs, the University has acquired various downtown properties during the past several years. As one of the largest property owners in downtown Pittsburgh, Point Park’s footprint extends down the Wood Street corridor from the Monongahela River to Forbes Avenue. Approximately 4,000 students are enrolled at the University. The University’s presidents and their years of service: Dr. Dorothy C. Finkelhor 1960-1967 Arthur Blum 1967-1973 Dr. John V. Hopkins 1973-1986 Dr. J. Matthew Simon 1986-1995 Dr. James Oliver Hunter 1995-1997 Dr. Katherine Usher Henderson 1997-2006
Dr. Paul Hennigan 2006-
General Information
2 * 2012-13 Point Park University Factbook
University Profile Located in Downtown Pittsburgh, Point Park University is a comprehensive master’s level university with a strong liberal arts tradition. Point Park enrolls approximately 4,000 full and part-time students in more than 90 majors and concentrations offered through its four schools. Its students represent 48 states and 42 countries. Point Park offers bachelor’s and associate’s degrees in a number of majors, including accounting, allied health, behavioral sciences, biological sciences, biotechnology, broadcast production and programming, broadcasting reporting, business, business management, cinema production, civil engineering technology, criminal justice, dance (with concentrations in ballet, modern and jazz), dance pedagogy, digital arts, economics and finance, early childhood education (transfer students only), education (pre-K–4th grade), education (4th-8th grade), elementary education (transfer students only), elementary education (with concentration in theatre arts), English, English/creative writing, environmental health science and protection, electrical engineering technology, forensic science, global cultural studies, health services, history, human resource management, information technology, instructional studies, integrated marketing communications, intelligence and national security, interdisciplinary studies, journalism, leadership and public service, legal studies, liberal studies, management services, mass communication, mechanical engineering technology, multimedia, organizational leadership, photography, photojournalism, political science, premedical and preprofessional studies, psychology, public administration, public relations and advertising, screenwriting, secondary education (biological science, citizenship, English, mass communication, mathematics), funeral service, sport, arts and entertainment management, theater arts (with concentrations in acting, musical theater, stage management, technical theater/design). The University has earned national distinction in a number of fields, including dance, theater, journalism and mass communication, and sport, arts and entertainment management. The University also awards thirteen graduate degrees: the master of arts degree includes the following majors: curriculum and instruction, educational administration, journalism and mass communication, organizational leadership; the master of education degree includes: secondary education certification grades 7-12, special education grades 7-12, special education prek-grade8, teaching and leadership; the master of fine arts in acting; the master of business administration degree; and the master of science degree includes: criminal justice administration, engineering management, environmental studies.
Learning is an interactive process at Point Park where the average class size is between 15-20 students. University facilities include engineering technology, science and computer labs; a television studio; photo labs; dance studios; and a radio station. Performing arts majors gain practical experience at Point Park University’s Pittsburgh Playhouse.

General Information
2012-13 Point Park University Factbook * 3
In recent years, the University launched the Academic Village at Point Park University, a multi-block living and learning hub that is transforming the University campus and the Downtown neighborhood it inhabits. It is redefining the student experience, campus life and Point Park’s connection to the community. As part of the Academic Village, expect to see:
• Students, city residents and businesspeople interact in a new green urban park • World-class speakers, spirited performances, and athletic activities inform and delight
students in a new Student and Convocation Center • 40,000 theatergoers attend performances at the Pittsburgh Playhouse, soon-to-be located
in the heart of Downtown Pittsburgh • A green roof and other environmentally friendly building techniques create sustainable
additions to a revitalized Downtown district and campus • The energy and vitality of the 24/7 Academic Village pulse across Downtown
neighborhoods and unite the Market Square and Cultural Districts Central Campus Development Project Point Park’s vision is to be one of the most dynamic private, urban universities in America. The vision begins with facilities that give students, faculty, and staff the environment they need to excel. In 2011, Point Park completed the Urban Park at the Academic Village. Located at Wood Street and Boulevard of the Allies, the new 12,000 square “Village Park” features a canopy of trees, colorful plantings, a stunning glass stair tower, a dramatic water feature and a colonnade structure that will house a lively restaurant featuring indoor and outdoor dining areas. In addition, the University completed Wood Street streetscape enhancements that include new sidewalks, pedestrian-friendly traffic signals and street resurfacing, in the fall of 2012. Future projects include the Student and Convocation Center, which will incorporate a multipurpose student lounge, advanced computer labs, a fully equipped fitness center, and a 1,000-seat auditorium that transforms into an 1,800 seat space for convocation and community events. Point Park University’s Pittsburgh Playhouse In 1968, Point Park breathed new life into the Pittsburgh Playhouse by converting it into the University’s performing arts center. Now, Point Park will reinvigorate the Pittsburgh arts scene once again with the construction of a new Pittsburgh Playhouse on Forbes Avenue in Downtown Pittsburgh. This premier performance and teaching venue will provide world-class professional spaces for both unconventional and classical presentations developed by the faculty, students and visiting artists of the Conservatory of Performing Arts. Students will benefit from a truly professional theater experience provided by three new performance spaces. An adjacent 10,000 square foot production area, costume and prop shops, and chorus and dressing rooms will allow backstage and production students to study and learn in a real-world environment.

General Information
4 * 2012-13 Point Park University Factbook
George Rowland White Performance Center Point Park University is an institution that utilizes green principles as it renovates. The George Rowland White Performance Center, which opened in August 2007, was awarded Leadership in Energy and Environmental Design or LEED Gold, one of the highest levels of certification in the U.S. Green Building Council’s building performance program. The building is the first of its kind to receive LEED-NC Gold for new construction, according to USGBC statistics. The George Rowland White Performance Center is a 44,000 square foot space featuring cushioned, non-slip floor, glare-free lighting and the latest audio and visual equipment. It contains the Performance Studio, Hilda Willis Tap Studio, and three Dance Studios. Residence Halls The University’s residence halls include Conestoga, Lawrence, Pioneer and Thayer, as well as the Boulevard Apartments. Point Park University is recognized as a leader in the economic development of downtown Pittsburgh. Its students, faculty and staff contribute more than $73 million annually to the regional economy. The University’s residence halls comprise the largest residential complex in downtown Pittsburgh. Athletics Point Park University, which fields eleven varsity sports teams, is a member of the National Association of Intercollegiate Athletics (NAIA). The teams include men’s and women’s golf, men’s and women’s soccer, men’s and women’s cross country, men’s and women’s basketball, volleyball, softball and baseball, all of which compete in the Kentucky Intercollegiate Athletic Conference. Point Park’s teams are known as the Pioneers.

General Information
2012-13 Point Park University Factbook * 5
Point Park University Diversity Statement As an institution of higher education, Point Park University recognizes its responsibility to create and maintain an environment that affirms the diversity of people and ideas. Point Park University embraces, supports and actively pursues a policy of inclusiveness that recognizes, values and reflects the diversity of the community we serve and the world in which we live.
To thrive as an academic institution, we believe we must foster a learning and working environment that encourages multiple perspectives and the open exchange of ideas in an unbiased and non-prejudicial way. Our commitment to diversity will make Point Park a welcoming place providing students, faculty, and staff with many opportunities to learn from each other.
To this end we strive to attract students, develop curriculum, diversify our faculty and staff, and offer support services. We are consciously guided by our quest to achieve broad inclusiveness and afford equal opportunity to all without regard to gender, race, ethnicity, national origin, religion, age, socioeconomic background, sexual orientation or physical ability.
Point Park University will vigorously pursue its diversity goals. As an institution, we are committed to accountability in our progress in making Point Park University a more diverse and inclusive community.
Mission Statement
Point Park University educates students in a diverse environment and prepares graduates to apply knowledge to achieve their goals, advance their professions and serve their communities.
Vision Statement Point Park University will be one of the most dynamic private, urban universities in America.

General Information
6 * 2012-13 Point Park University Factbook
Values Promoting academic excellence Point Park University inspires students to become life-long learners through its strong liberal arts core and diversity of majors. We are dedicated to continuously improving our programs and providing resources for our faculty and staff to remain leaders in their fields. Our highly qualified faculty, consisting of scholars with terminal degrees and practicing professionals, are central to maintaining academic excellence. Focusing on student needs Point Park University provides students with a career-focused education in a personalized, urban university environment. Our programs meet the needs of undergraduate students, graduate students, and working professionals. We are committed to providing the support services, facilities, and technology that ensure a quality student experience. Fostering a community of mutual respect and diversity Point Park University believes that a culture of mutual respect and diversity creates the optimal environment for learning. We encourage a culture of creativity and intellectual inquiry where ideas are openly discussed and debated. Point Park affords equal opportunity to all without regard to gender, race, ethnicity, national origin, religion, age, socioeconomic background, sexual orientation, or physical ability. Encouraging innovation Point Park University develops and adapts its innovative programs to ensure alignment with current business, industry, and government needs. We support new ideas and urge our students, faculty, and staff to become pioneers in their fields. Ensuring integrity and ethics in our actions Point Park University expects students, faculty, staff, and administrators to demonstrate the highest level of social responsibility, academic integrity, and professional ethics. Our values guide our decisions. Responding to our stakeholders Point Park University engages its internal and external stakeholders in key decision-making processes. We value opinions of our students, alumni, faculty, staff, and board members, and we recognize the mutual benefits of seeking partnerships with our business, government, nonprofit, and educational leaders in charting Point Park’s future. Facilitating civic engagement Point Park University embraces its unique role in the revitalization of downtown Pittsburgh and encourages students, faculty, and staff to become active community members. We promote involvement in service learning opportunities, professional associations, and internships.

General Information
Strategic Initiatives
Academic Excellence Quality Student Experience
Managed Growth Community Engagement
Strategic Initiatives and Goals Academic Excellence • Measures of baseline effectiveness will be identified and objectives will be set for
achieving distinctive academic programs at both graduate and undergraduate levels. • Strategic investments will be made in faculty development to ensure distinctive
programs. • Resources and plans will be developed for continuous improvement of programs,
curricula, and facilities. Quality Student Experience • Measures of overall effectiveness will be established and objectives will be set for
continuous improvement of the student experience. • Practical experiences in the major programs of study will be integrated into
students’ learning experiences. • Retention and graduation rates will be improved for all academic programs. • Students who graduate from Point Park University have developed the life skills
necessary to become responsible citizens. Managed Growth • Investment in human resources will be a key competitive advantage to our growth
and success. • A sound fiscal position will be maintained through appropriate financial measures
and controls. • Enrollment and program objectives will be set to meet the strategic growth of the
University. • Capital development will be achieved to support the needs of a dynamic, urban university. • Strategic opportunities will be developed for additional sources of revenue.
Community Engagement
• Relationships with the external community will be established using a focused, mission-driven approach.
• The alumni will play a vital role in the continuous development of the University. • The University will engage key stakeholders to advance its mission. • Our students, faculty, and staff will benefit the Pittsburgh region through our
commitment to serving the community.
2012-13 Point Park University Factbook * 7

General Information
8 * 2012-13 Point Park University Factbook
Regional and Professional Accreditation and Approval POINT PARK UNIVERSITY is an independent, four-year, coeducational university accredited by the Commission on Higher Education of the Middle States Association of Universities and Schools, 3624 Market Street, Philadelphia, Pa. 19104, 215-662-5606. Point Park University is also approved by the Pennsylvania Department of Education, 333 Market Street, Harrisburg, Pa. 17126-0333, 717-787-7572. In the School of Business, programs leading to a Master of Business Administration degree, to a Bachelor of Science Post Baccalaureate degree in Accounting, Business Management and Human Resource Management, to a Bachelor of Science degree in Accounting, Business Management, Business, Economics and Finance, Human Resource Management, Information Technology & Management (accelerated) and Sport, Arts and Entertainment Management, to a Bachelor of Science Capstone in Human Resource Management with concentrations in compliance/legal or strategic planning/management, to a Bachelor of Science Capstone in Management Services, to an Associate in Science degree in Accounting and Business Management are accredited by the International Assembly of Collegiate Business Education (IACBE), P.O. Box 25217, Overland park, KS, 66225, 913-631-3009. The programs in the School of Arts & Sciences leading to the Bachelor of Arts and the Bachelor of Sciences in Early Childhood Education, Elementary, and Secondary Education, as well as the programs leading to the Master of Arts in Curriculum and Instruction and the Master of Arts in Educational Administration, are approved by the Pennsylvania Department of Education, 333 Market Street, Harrisburg, PA 17126-0333, 717-787-7572. Programs in the Conservatory leading to the Bachelor of Arts and Bachelor of Fine Arts in Dance, and to the Bachelor of Arts and Post-Baccalaureate Bachelor of Arts in Dance Pedagogy, are accredited by the National Association of Schools of Dance, 11250 Roger Bacon Drive, Suite 21, Reston, VA 20190, 703-437-0700. In the School of Arts & Sciences, the Bachelor of Science programs in Civil Engineering Technology, Electrical Engineering Technology and Mechanical Engineering Technology are accredited by the Engineering Technology Accreditation Commission of ABET (www.abet.org), 111 Market Place, Suite 1050, Baltimore, MD 21202-4012, 410-347-7700.

General Information
2012-13 Point Park University Factbook * 9
Facts and Figures Summary, Fall 2012 Physical Plant Consists of 17 Campus Properties Academic Divisions (and headcount) School of Arts and Sciences 1,377 Dept of Crim Justice&IntelStd 336 Dept of Education 312 Dept of Humanities&Human Sci 299 Dept of Nat Sci & Engr Tech 342 Misc (other programs) 88 School of Business 1,088 Dept of Acct,Fin&Econ,InfoTch 160 Dept of Management 558 Dept of Global Mgt & Org 370 School of Communication 545 Conservatory of Performing Arts 817 Dept of Cinema & Digital Arts 250 Dept of Dance 253 Dept of Theatre 314 Degree Programs Offered Undergraduate 103 Graduate 13 Total 116 Total Operating Budget (FY12-13) $97 million Tuition and Fees (2012-13) Non-conservatory Undergraduate ($682/cr.hr.) $25,190/year Conservatory Undergraduate ($860/cr.hr.) $31,490/year Graduate $761/cr.hr. Room and Board Room (average per year) $4,720 Board (14 meal plan) $5,200 Financial Aid Profile (Final 2011-12) Students Receiving Aid 93% Average Grants (for freshmen) $13,928 Average Loans (for freshmen) $5,314 Average Work-study $2,260 Range of awards $500 to $14,000 Total Student Aid $81,950,578 Total Veterans Enrolled (Fall 2012) 126 Student to Faculty Ratio 13 to 1 Fresh. To Soph. Retention Rate 74% 6-Year Graduation Rate 50% Total Alumni (w/degrees conferred) 24,585
Fall 2012 Admissions First-time, Full-time Freshman 516 Full-time Transfers/Readmits 279 Part-time Undergraduate 182 New Accelerated Undergraduate 107 New Graduate 287 Total New 1,371 Students Fall 2012 Enrollment Regular Undergraduate 2,911 Accelerated Undergraduate 274 Graduate 574 Professional Development-UG 40 Professional Development-GR 28 Total Enrollment 3,827 Course Load Full-time Undergrad Enrollment 2,537 Part-time Undergrad Enrollment 688 Full-time Graduate Enrollment 230 Part-time Graduate Enrollment 372 Enrollment, Race/Ethnicity & Gender American Indian/Alaska Native 5 Asian 30 Black or African American 655 Hispanic of any race 123 Native Hawaiian/Pacific Islander 0 Non-resident Alien 107 White 2,763 Two or more races 119 Unknown 25 Female 2,224 Male 1,603 Domicile In-state Enrollment 3,056 Out-of-state Enrollment 771 Residential Population All Students Living On Campus 978 Faculty and Staff Full-time Instructional Faculty 136 Part-time Instructional Faculty 309 Graduate Assistants 26 Full-time Staff 288 Part-time Staff 161 Work-studies 429 Total Faculty and Staff 1,349

General Information
10 * 2012-13 Point Park University Factbook

ADMISSIONS and FINANCIAL AID

Admissions and Financial Aid
ADMISSIONS Overall, applications for admissions to Point Park University decreased slightly from fall 2011 to fall 2012 (-0.04%). At the undergraduate level, fall 2012 applications decreased by 1.84% (from 4,957 to 4,866) over the prior year. The largest decrease in applications was found with new accelerated undergraduates which demonstrated a 11.1% decrease in applications from the prior year. Point Park University has about a 73% acceptance rate for full-time freshmen (table 3.2). The fall 2012 acceptance rate for graduate programs is 68% (table 3.2). Of all the 1,371 newly enrolled students, 60% (822) are female and 18% (248) are Black or African-American (table 3.6). The average age for full-time freshmen is 18 (table 3.7). For full-time transfers/readmits, the average age is 22 while the average age for new part-time undergraduates, accelerated undergraduates and graduate students is 33, 32 and 30, respectively (table 3.7). Of all the new students, 77% (1,061) come from Pennsylvania (table 3.7). The School of Arts & Sciences enrolls the majority of the new undergraduates at 39%; the Conservatory of Performing Arts enrolls 25%; the School of Business enrolls 22% of the new undergraduates while the School of Communication enrolls 15% (table 3.8). The School of Business enrolls 53% of the new graduate students; the School of Arts & Sciences enrolls 32% while the School of Communication enrolls 15% of the new graduate students. More detailed information of fall 2012 admissions data can be found on the following pages.
2012-13 Point Park University Factbook * 11

Admissions and Financial Aid
Table 3.1. Trends of Admissions Summary Chg from % chg2008 2009 2010 2011 2012 11 to 12 11 to 12
AppliedUndergraduate
Full-time Freshmen 2,904 2,790 2,954 3,166 3,153 -13 -0.41%Transfers/Readmits 1,100 1,150 1,130 1,216 1,157 -59 -4.85%Part-time 463 427 415 357 362 5 1.40%Accelerated 351 299 212 218 194 -24 -11.01%Undergraduate Total 4,818 4,666 4,711 4,957 4,866 -91 -1.84%
Graduate 497 594 597 601 690 89 14.81%Total 5,315 5,260 5,308 5,558 5,556 -2 -0.04%
AcceptedUndergraduate
Full-time Freshmen 2,280 2,177 2,200 2,325 2,293 -32 -1.38%Transfers/Readmits 654 728 704 736 717 -19 -2.58%Part-time 355 303 320 255 252 -3 -1.18%Accelerated 257 223 179 169 151 -18 -10.65%Undergraduate Total 3,546 3,431 3,403 3,485 3,413 -72 -2.07%
Graduate 325 414 416 384 471 87 22.66%Total 3,871 3,845 3,819 3,869 3,884 15 0.39%
Enrolled (per census)Undergraduate
Full-time Freshmen 521 521 536 488 516 28 5.74%Transfers/Readmits 289 315 283 328 279 -49 -14.94%Part-time 250 209 240 195 182 -13 -6.67%Accelerated 165 157 135 122 107 -15 -12.30%Undergraduate Total 1,225 1,202 1,194 1,133 1,084 -49 -4.32%
Graduate 233 289 258 238 287 49 20.59%Total 1,458 1,491 1,452 1,371 1,371 0 0.00%
The following Tables, 3.2, 3.3, 3.4 and 3.5 give a detailed summary and comparison of fall 2012, fall 2011, fall 2010, and fall 2009 admissions data. Tables 3.6, 3.7 and 3.8 highlight various statistics of the newly enrolled students in fall 2012 and finally, Table 3.9 shows new transfer student data.
12 * 2012-13 Point Park University Factbook

Admissions and Financial Aid
2012-13 Point Park University Factbook * 13
Table 3.2. Trends of Admissions Summary, Fall 2012Applied Accepted Enrolled (per census)Number Number % of Applied Number % of Accepted
Full-time Freshmen 3,153 2,293 73% 516 23%Transfers/Readmits 1,157 717 62% 279 39%Part-time 362 252 70% 182 72%Accelerated 194 151 78% 107 71%Undergraduate Total 4,866 3,413 70% 1,084 32%Graduate Total 690 471 68% 287 61%University Total 5,556 3,884 70% 1,371 35%
Table 3.3. Trends of Admissions Summary, Fall 2011Applied Accepted Enrolled (per census)Number Number % of Applied Number % of Accepted
Full-time Freshmen 3,166 2,325 73% 488 21%Transfers/Readmits 1,216 736 61% 328 45%Part-time 357 255 71% 195 76%Accelerated 218 169 78% 122 72%Undergraduate Total 4,957 3,485 70% 1,133 33%Graduate Total 601 384 64% 238 62%University Total 5,558 3,869 70% 1,371 35%
Table 3.4. Trends of Admissions Summary, Fall 2010 Applied Accepted Enrolled (per census)Number Number % of Applied Number % of Accepted
Full-time Freshmen 2,954 2,200 74% 536 24%Transfers/Readmits 1,130 704 62% 283 40%Part-time 415 320 77% 240 75%Accelerated 212 179 84% 135 75%Undergraduate Total 4,711 3,403 72% 1,194 35%Graduate Total 597 416 70% 258 62%University Total 5,308 3,819 72% 1,452 38%
Table 3.5. Trends of Admissions Summary, Fall 2009Applied Accepted Enrolled (per census)Number Number % of Applied Number % of Accepted
Full-time Freshmen 2,790 2,177 78% 521 24%Transfers/Readmits 1,150 728 63% 315 43%Part-time 427 303 71% 209 69%Accelerated 299 223 75% 157 70%Undergraduate Total 4,666 3,431 74% 1,202 35%Graduate Total 594 414 70% 289 70%University Total 5,260 3,845 73% 1,491 39%

Admissions and Financial Aid
Table 3.6. New Enrollees by Gender and Ethnicity, Fall 2012
Am.Indian/ Black or Hispanics Nat Hawaiian Non-res. Two or more Un-Total Female Male Alaska Nat. Asian Afri.Am. any race /Pacific Isl. Alien White races known
UndergraduateFull-time Freshmen 516 327 189 1 6 54 23 0 12 397 23 0Transfers/Readmits 279 150 129 0 4 39 11 0 21 193 11 0Part-time 182 117 65 0 0 67 4 0 0 87 3 21Accelerated 107 64 43 1 0 42 3 0 0 56 5 0Graduate Total 287 164 123 0 3 46 10 0 16 206 4 2University Total 1371 822 549 2 13 248 51 0 49 939 46 23
Gender Ethnicity
Table 3.7 New Enrollees by Age and Residency, Fall 2012
Non- Mean Residence In-Total Traditional Traditional Unknown Age Halls Commuter State
UndergraduateFull-time Freshmen 488 508 5 3 18 406 110 312Transfers/Readmits 328 231 47 1 22 89 190 201Part-time 195 52 120 10 33 3 179 177Accelerated 122 26 80 1 32 0 107 107Graduate Total 238 90 192 5 30 2 285 264University Total 1371 907 444 20 27 500 871 1061
Traditional (18-24 years old)Non-Traditional (25 years or older)
Age Residency
14 * 2012-13 Point Park University Factbook

Admissions and Financial Aid
2012-13 Point Park University Factbook * 15
Table 3.8. New Enrollees by Academic Division, Fall 2012
CommunicationTotal CJIS EDUC HUMA NSET UND AFEI MGT GMO COMM CINE DANC THEA
UndergraduateFull-time Freshmen 516 30 20 41 20 32 8 67 0 85 58 76 79Transfers/Readmits 279 20 22 25 38 7 11 49 0 54 25 14 14Part-time 182 18 43 17 32 20 18 27 0 6 1 0 0Accelerated 107 34 0 0 0 0 18 43 0 12 0 0 0Undergrad Total 1084 102 85 83 90 59 55 186 0 157 84 90 93
14.5%
Graduate Total 287 13 61 0 17 2 0 0 152 42 0 0 014.6%
University Total 1371 115 146 83 107 61 55 186 152 199 84 90 93
Fall 2012 Total% of Total (Dept) 100.0% 8.4% 10.6% 6.1% 7.8% 4.4% 4.0% 13.6% 11.1% 14.5% 6.1% 6.6% 6.8%% of Total (School) 100.0% 14.5%
List of Academic Division Abbreviations:CJIS: Criminal Justice & Intelligence Studies (within the School of Arts & Sciences)EDUC: Education (within the School of Arts & Sciences)HUMA: Humanities & Human Sciences (within the School of Arts & Sciences)NSET: Natural Sciences & Engineering Technology (within the School of Arts & Sciences)UND: Undecided or Non-Degree (within the School of Arts & Sciences)AFEI: Accounting, Economics & Finance, Information Technology (within the School of Business)MGT: Management (within the School of Business)GMO: Global Management & Organization (within the School of Business)COMM: School of CommunicationCINE: Cinema & Digital Arts (within the Conservatory of Performing Arts)DANC: Dance (within the Conservatory of Performing Arts)THEA: Theatre (within the Conservatory of Performing Arts)
28.7%37.3% 19.5%
38.7% 22.2% 24.6%
32.4% 53.0% 0.0%
% of UG Total (School)
% of GR Total (School)
Arts & Sciences Business Conservatory of Perf. Arts

Admissions and Financial Aid
Table 3.9. New Full-time Undergraduate Transfers, Fall 2012Four-Year Institutions Number of Transfers
Penn State University 6California University of PA 5Slippery Rock University 5Edinboro University 4Indiana University of PA 4Kent State University 4Dean College 2Duquesne University 2La Roche College 2Ohio University 2Seton Hill University 2University of Kansas 2University of Pittsburgh Bradford 2University of Pittsburgh Johnstown 2University of Pittsburgh Main 2Waynesburg University 2West Virginia University 2Total Four-Year Institutions (with two or more registrants) 50
Two-Year InstitutionsComm. Coll of Allegheny County (C.C.A.C) - Main Campus 67Westmoreland County Community College 1Pittsbur
0gh Institute of Mortuary Science 7
Art Institute of Pittsburgh 4Butler County Community College 4Kaplan Career Institute ICM Campus 4Sanford Brown Institute 4Community College of Beaver County 3Everest Institute 3Harrisburg Area Community College 3Pittsburgh Technical Institute 3Bucks County Community College 2CCAC Boyce Campus 2County College of Morris 2Cuyahoga Community College Eastern 2Western Nebraska Community College 2Total Two-Year Institutions (with two or more registrants) 122
16 * 2012-13 Point Park University Factbook

Admissions and Financial Aid
Student Financial Aid Table 3.10 shows undergraduates receiving financial aid has increased slightly (90% to94%) over the last several fall semesters while graduates receiving financial aid has increased (80% to 86%) from fall 2010 to fall 2011. The total amount of financial aid received by Point Park University’s students in academic year
2011-2012 represents a 2% crease over academic year 2010-2011, from $80,734,064 to $81,950,578. The average
ward total increased from $18,628 to $19,563 (table 3.11).
ina
Table 3.10. Percent of Students Receiving Financial Aid (reporting Fall numbers only)
Fall 2007 Fall 2008 Fall 2009 Fall 2010 Fall 2011Undergraduate 90% 90% 91% 92% 94%Graduate 78% 67% 71% 80% 86%
Table 3.11. Student Financial Aid By Award Type (reporting Final Academic Year numbers)
2007-2008 2008-2009 2009-2010 2010-2011 2011-2012Student Aid Grand Total $59,839,894 $69,343,207 $79,057,063 $80,734,064 $81,950,578Number of Students 3958 4008 4282 4334 4189Average Award $15,118.72 $17,301.20 $18,462.65 $18,628.07 $19,563.28
Federal Aid TotalPell Grant
Total Aid Awarded $3,318,306 $3,770,628 $5,669,499 $6,159,668 $5,764,366Number of Awards 1245 1277 1516 1675 1616Average Awards $2,665.31 $2,952.72 $3,739.78 $3,677 $3,567
Federal Perkins LoanTotal Aid Awarded $248,855 $125,269 $122,500 $159,128 $166,380Number of Awards 202 75 76 100 167Average Awards $1,231.96 $1,670.25 $1,611.84 $1,591.28 $996.29
Supplemental Grants (FSEOG)Total Aid Awarded $499,182 $340,324 $497,996 $454,400 $392,633Number of Awards 356 224 283 185 324Average Awards $1,402.20 $1,519.30 $1,759.70 $2,456.22 $1,211.83
Federal Work-StudyTotal Aid Awarded $343,511 $345,660 $459,109 $414,057 $380,488Number of Awards 257 262 321 303 273Average Awards $1,336.62 $1,319.31 $1,430.25 $1,366.52 $1,393.73
2012-13 Point Park University Factbook * 17

Admissions and Financial Aid
18 * 2012-13 Point Park University Factbook
Table 3.11. Student Financial Aid By Award Type (continued)
2007-2008 2008-2009 2009-2010 2010-2011 2011-2012Federal Stafford/Direct Subsidized Loan
Total Aid Awarded $12,221,827 $12,840,381 $14,398,282 $13,978,597 $13,231,601Number of Awards 2679 2855 3155 2951 2862Average Awards $4,562.09 $4,497.51 $4,563.64 $4,736.90 $4,623.20
Parent LoanTotal Aid Awarded $4,466,075 $4,874,378 $4,904,547 $6,021,597 $6,342,117Number of Awards 399 410 419 514 489Average Awards $11,193.17 $11,888.73 $11,705.36 $11,715.17 $12,969.56
Federal Graduate PLUS LoanTotal Aid Awarded $3,540 $17,130 $32,427 $49,023 $23,000Number of Awards 3 5 7 10 6Average Awards $1,180.00 $3,426.00 $4,632.43 $4,902.30 $3,833.33
Federal Stafford/Direct Unsubsidized LoansTotal Aid Awarded $12,032,106 $16,622,462 $19,498,789 $17,652,387 $16,904,457Number of Awards 2264 3177 3661 3357 3256Average Awards $5,314.53 $5,232.13 $5,326.08 $5,258.38 $5,191.79
Other Aid TotalInstitutional Scholarships
Total Aid Awarded $11,745,585 $14,660,477 $17,205,049 $19,185,450 $23,894,500Other Grants & Scholarships
Total Aid Awarded $9,548,914 $9,734,785 $10,845,488 $11,355,644 $9,400,020Other Loan Programs
Total Aid Awarded $4,847,283 $4,798,013 $4,150,642 $3,999,269 $4,603,266Other Work Programs
Total Aid Awarded $568,250 $1,230,830 $1,305,162 $1,353,867 $847,750

ENROLLMENT

Enrollment
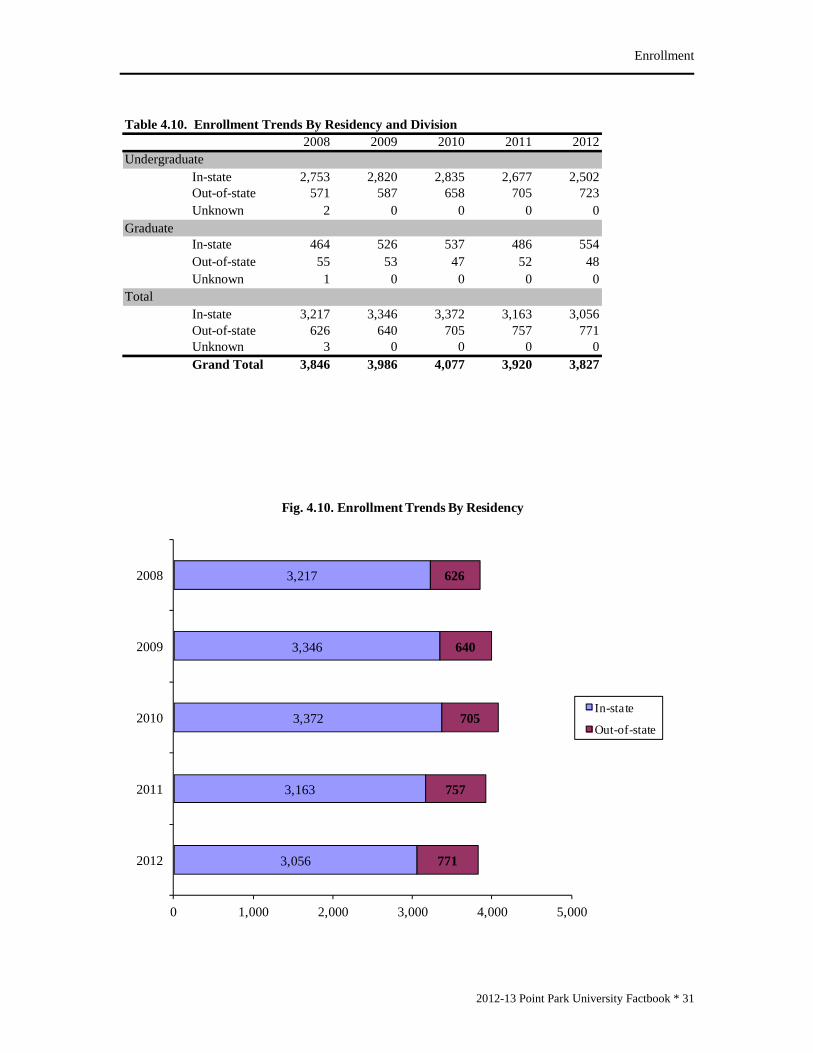
ENROLLMENT Enrollment decreased over last year by 2% (from 3,920 to 3,827) (table 4.1). Of the 3,827 students enrolled, 84% (3,225 headcount) are undergraduate students and 16% (602 headcount) are graduate students (table 4.1). Some other highlights include the fact that approximately 79% of undergraduate students are full-time, while only 38% of graduate students are full-time (table 4.3). The majority (80%) of Point Park’s students come from Pennsylvania, (table 4.10). Also, the number of students living on campus in student housing increased slightly. There are now 975 undergraduate students living on campus as compared to 960 last year (table 4.11). This represents 30% of the entire undergraduate student body. Further, 79% of all full-time freshmen are living in campus housing. Point Park remains an ethnically diverse university and its international student population represents 41 different countries (table 4.18). Overall, 73 percent (2,797 headcount) of our students are from Southwestern PA counties (fig. 4.15). Within each school, 87% of Business, 84% of Arts & Sciences, 74% of Communication, and 36% of the Conservatory of Performing Arts are from southwest PA (table 4.19). From fall 2011 to fall 2012 the biggest increases in enrollment occurred in Fayette and Butler counties while the biggest decreases occurred in Allegheny and Beaver (fig. 4.16). Southwest PA enrollment has increased 9% since fall 2003 (table 4.20). This section includes a glance at fall 2012 enrollment data, as well as a detailed account of student enrollment trends over the past five years by various demographic features. For clarification purposes, some enrollment definitions are listed below.
Enrollment Definitions: Student enrollment in higher education is described in terms of both headcount and FTE (Full-time Equivalence). Student headcount is the count of individual students whose administrative records indicate that they were registered in a credit-bearing course as of the university’s enrollment census date for each semester.
Student FTE is calculated using two different methods: Method 1: Undergraduate FTE = FT headcount + (PT Credit Hours/15)
Graduate FTE = FT headcount + (PT Credit Hours/10) Method 2: Undergraduate and Graduate FTE = FT headcount + (1/3 PT headcount)
Full-time Status - An individual student is classified as full-time if he or she maintains at least 12 undergraduate credits or 9 graduate credits.
2012-13 Point Park University Factbook * 19

Enrollment
Table 4.1. Trends of Fall Headcount And FTE by Division
2008 2009 2010 2011 2012 2008 2009 2010 2011 2012 2008 2009 2010 2011 2012Undergraduate 3,326 3,407 3,493 3,382 3,225 2,860 2,947 3,022 2,961 2,839 2,809 2,870 2,942 2,887 2,766Graduate 520 579 584 538 602 381 419 414 380 422 317 348 334 313 354Total 3,846 3,986 4,077 3,920 3,827 3,241 3,366 3,436 3,341 3,261 3,126 3,218 3,276 3,200 3,120
* Fall headcount and FTE are based on census data.
Fall Headcount* Full-time Equivelancy (FTE)* (using CrHrs) Full-time Equivelancy (FTE)* (using FT-PT)
UG = FT Headcount + PT CrHrs/15GR = FT Headcount + PT CrHrs/10
UG = FT + (1/3 PT)GR = FT + (1/3 PT)
3,8463,986 4,077
3,920 3,827
3,2413,366 3,436 3,341 3,261
3,126 3,218 3,276 3,200 3,120
0
500
1,000
1,500
2,000
2,500
3,000
3,500
4,000
4,500
2008 2009 2010 2011 2012
Fig. 4.1. Student Enrollment Trends 2008 through 2012
Fall Headcount*Fall FTE* (CrHrs)Fall FTE* (FT-PT)
20 * 2012-13 Point Park University Factbook

Enrollment
Enrollment Trends
Table 4.2. Enrollment Trend By Student Type% of % increase
2008 2009 2010 2011 2012 Total '12 Over fall '11Regular Undergraduate
Full-time 2,206 2,307 2,388 2,411 2,359 60.2 -2.16%Part-time 654 650 649 593 552 14.1 -6.91%
Accelerated UndergraduateFull-time 344 295 278 228 178 4.5 -21.93%Part-time 122 124 118 98 96 2.4 -2.04%
Professional Development-UGFull-time 0 0 0 0 0 0.0Part-time 0 31 60 52 40 1.0 -23.08%
Professional Development-GRFull-time 0 0 0 0 0 0.0Part-time 0 9 4 5 28 0.7 460.00%
GraduateFull-time 215 233 209 201 230 5.9 14.43%Part-time 305 337 371 332 344 8.8 3.61%
TotalFull-time 2765 2835 2875 2840 2767 72.3 -2.57%Part-time 1081 1151 1202 1080 1060 27.7 -1.85%Grand Total 3,846 3,986 4,077 3,920 3,827 100.0 -2.37%
na
na
0
500
1000
1500
2000
2500
3000
3500
2008 2009 2010 2011 2012
Fig. 4.2. Enrollment Trends by Student Type
Regular Undergraduate
Accelerated Undergraduate
Professional Development-UG
Professional Development-GR
Graduate
2012-13 Point Park University Factbook * 21

Enrollment
Table 4.3. Enrollment Trends By Course Load and Division2008 2009 2010 2011 2012
UndergraduateFull-time 2,550 2,602 2,666 2,639 2,537Part-time 776 805 827 743 688
GraduateFull-time 215 233 209 201 230Part-time 305 346 375 337 372
TotalFull-time 2,765 2,835 2,875 2,840 2,767Part-time 1,081 1,151 1,202 1,080 1,060Grand Total 3,846 3,986 4,077 3,920 3,827
2550 2602 2666 26392537
215 233 209 201 230
776 805 827743 688
305 346 375 337 372
0
500
1000
1500
2000
2500
3000
2008 2009 2010 2011 2012 2008 2009 2010 2011 2012
Undergraduate Graduate
Fig. 4.3. Enrollment Trends by Course Load and Division
Full-time
Part-time
22 * 2012-13 Point Park University Factbook

Enrollment
2012-13 Point Park University Factbook * 23
Table 4.4. Enrollment Trend By Gender and Division2008 2009 2010 2011 2012
UndergraduateFemale 2,008 2,055 2,116 1,964 1,877Male 1,318 1,352 1,377 1,418 1,348
GraduateFemale 322 321 346 325 347Male 198 258 238 213 255
TotalFemale 2,330 2,376 2,462 2,289 2,224Male 1,516 1,610 1,615 1,631 1,603Grand Total 3,846 3,986 4,077 3,920 3,827
2330 2376 24622289 2224
15161610 1615 1631 1603
0
500
1000
1500
2000
2500
3000
2008 2009 2010 2011 2012
Fig. 4.4. Enrollment Trends by Gender (all students)
Female
Male

Enrollment
An important note about recent changes to race and ethnicity coding The U.S. Office of Management and Budget (OMB) determined in 1997 that new race and ethnicity codes would be implemented for collecting all data reported to the federal government. They stated that these new codes allow data on ethnicity and race to reflect the growing diversity of our nation. In 2007, the U.S. Department of Education posted to the Federal Register the “Final Guidance on Maintaining, Collecting, and Reporting Racial and Ethnic Data to the U.S. Department of Education” to implement OMB’s 1997 Standards. The guidance issued by the Department covers two issues: 1) the collection of race and ethnicity data by institutions, and 2) the reporting of aggregate data to the Department. Point Park University, in compliance with the Federal mandate, will now report race and ethnicity data that reflects students’ ability to differentiate between race and ethnicity, as well as choose more than one race. Thus, Point Park University will report the following new categories in all publically available periodic reports starting in the fall 2010 semester in order to be consistent with the proposed “single field” race/ethnicity codes:
1. American Indian/Alaska Native 2. Asian 3. Black or African American 4. Hispanic of any race 5. Native Hawaiian or Other Pacific Islander 6. Non-resident Alien 7. White 8. Two or more races 9. Unknown
Since these new codes differ significantly from the old method of collecting and reporting race/ethnicity data, it is necessary to revise the tables in recent factbooks that reflect this change in methodology. Since it is nearly impossible to match old race/ethnicity codes with the new ones, trend data prior to 2010 will remain in the old reporting format. Beginning with the Fall 2010 semester, all data pertaining to race/ethnicity will show the new codes. Unfortunately, this means that direct comparisons of race/ethnicity between 2010 and any semester prior to 2010 will be difficult at best.
24 * 2012-13 Point Park University Factbook
Enrollment
2012-13 Point Park University Factbook * 25
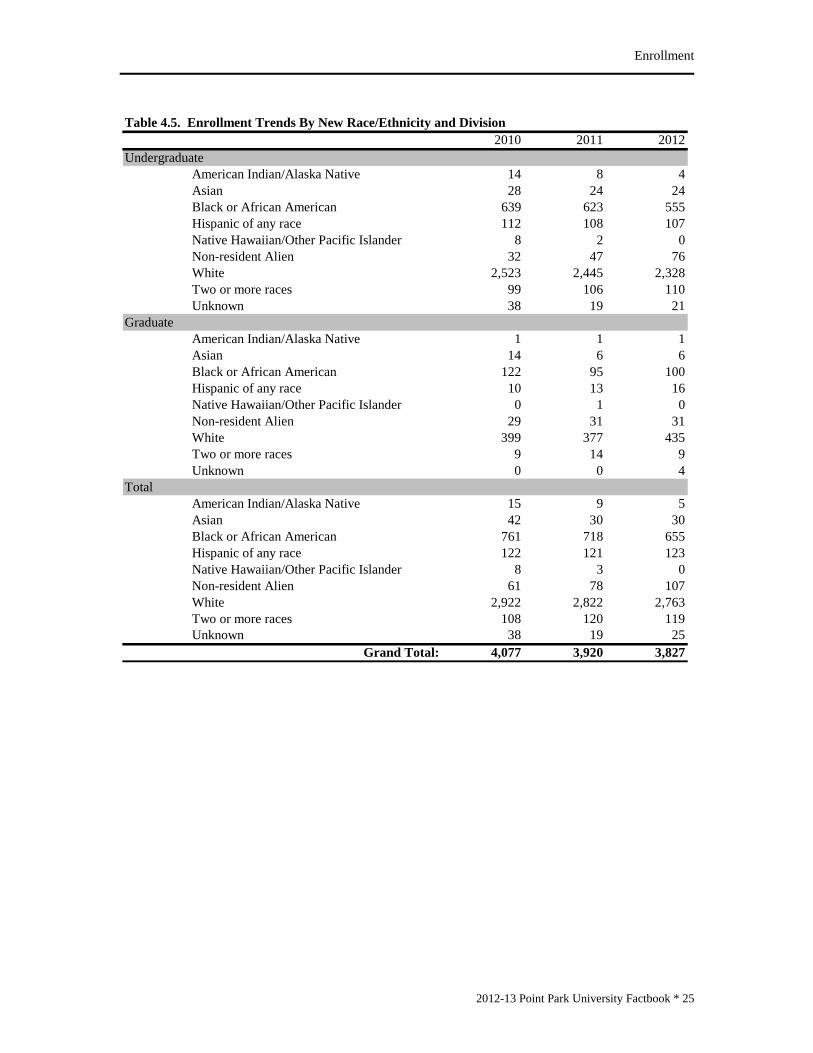
Table 4.5. Enrollment Trends By New Race/Ethnicity and Division
2010 2011 2012Undergraduate
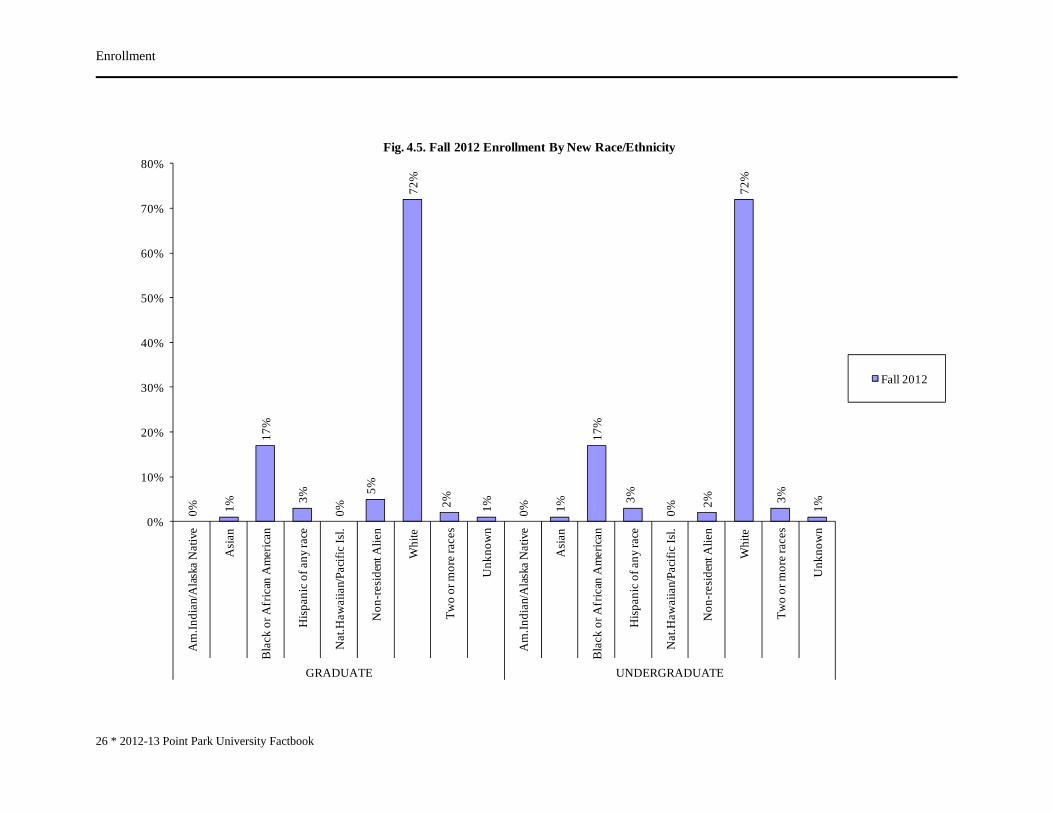
American Indian/Alaska Native 14 8 4Asian 28 24 24Black or African American 639 623 555Hispanic of any race 112 108 107Native Hawaiian/Other Pacific Islander 8 2 0Non-resident Alien 32 47 7White 2,523 2,445 2,328Two or more races 99 106 110Unknown 38 19 2
GraduateAmerican Indian/Alaska Native 1 1 1Asian 14 6 6Black or African American 122 95 100Hispanic of any race 10 13 16Native Hawaiian/Other Pacific Islander 0 1 0Non-resident Alien 29 31 3White 399 377 435Two or more races 9 14 9Unknown 0 0 4
TotalAmerican Indian/Alaska Native 15 9 5Asian 42 30 30Black or African American 761 718 655Hispanic of any race 122 121 123Native Hawaiian/Other Pacific Islander 8 3 0Non-resident Alien 61 78 107White 2,922 2,822 2,763Two or more races 108 120 119Unknow
6
1
1
n 38 19 25Grand Total: 4,077 3,920 3,827
Enrollment
0% 1%
17%
3%
0%
5%
72%
2% 1% 0% 1%
17%
3%
0%
2%
72%
3%
1%
0%
10%
20%
30%
40%
50%
60%
70%
80%
Am
.Indi
an/A
lask
a N
ativ
e
Asi
an
Bla
ck o
r Afr
ican
Am
eric
an
His
pani
c of
any
race
Nat
.Haw
aiia
n/Pa
cific
Isl.
Non
-res
iden
t Alie
n
Whi
te
Two
or m
ore
race
s
Unk
now
n
Am
.Indi
an/A
lask
a N
ativ
e
Asi
an
Bla
ck o
r Afr
ican
Am
eric
an
His
pani
c of
any
race
Nat
.Haw
aiia
n/Pa
cific
Isl.
Non
-res
iden
t Alie
n
Whi
te
Two
or m
ore
race
s
Unk
now
n
GRADUATE UNDERGRADUATE
Fig. 4.5. Fall 2012 Enrollment By New Race/Ethnicity
Fall 2012
26 * 2012-13 Point Park University Factbook

Enrollment
Table 4.6. Enrollment Trend (2005-2009) By Race/Ethnicity and Division2005 2006 2007 2008 2009
UndergraduateAfrican American 525 569 577 654 676Asian 19 26 31 29Hispanic 45 61 52 61 66Native American 7 6 12 10 11Non-Res. Alien 32 36 37 24White 2,271 2,364 2,391 2,518 2,580Unknown 63 10 9 30 18
GraduateAfrican American 81 94 102 127 136Asian 2 4 7 7 12Hispanic 3 3 3 3Native American 1 2 1 3 2Non-Res. Alien 27 29 33 41White 322 337 336 332 383Unknown 9 5 1 7 5
TotalAfrican American 606 663 679 781 812Asian 21 30 38 36Hispanic 48 64 55 64 68Native American 8 8 13 13 13Non-Res. Alien 59 65 70 65White 2,593 2,701 2,727 2,850 2,963Unknown 72 15 10 37 23
33
23
2
39
45
62
24%
7%
66%
1%
20%
76%
1%
18%
6%
72%
2%
18%
77%
2%
0%
10%
20%
30%
40%
50%
60%
70%
80%
90%
Afr
ican
-Am
.
Asi
an
His
pani
c
Am
. Ind
ian
Non
-res
Alie
n
Whi
te
Unk
now
n
Afr
ican
-Am
.
Asi
an
His
pani
c
Am
. Ind
ian
Non
-res
Alie
n
Whi
te
Unk
now
n
Graduate Undergraduate
Fig. 4.6. Enrollment By Race/Ethnicity comparing Fall 2005 to Fall 2009
Fall 2009
Fall 2005
2012-13 Point Park University Factbook * 27

Enrollment
Table 4.7. Enrollment Trend By Minority Status and Division
2008 2009 2010 2011 2012Undergraduate
Minority 754 786 900 871 800White 2,518 2,580 2,523 2,445 2,328Non-Res. Alien 24 23 32 47 7Unknown 30 18 38 19 2
GraduateMinorit
61
y 140 152 156 130 132White 332 383 399 377 435Non-Res. Alien 41 39 29 31 3Unknown 7 5 0 0 4
TotalMinorit
1
y 894 938 1,056 1,001 932White 2,850 2,963 2,922 2,822 2,763Non-Res. Alien 65 62 61 78Unknow
107n 37 23 38 19 25
Grand Total 3,846 3,986 4,077 3,920 3,827
23.0%
24.0%
22.4%
22.6%
22.8%
23.0%
23.2%
23.4%
23.6%
23.8%
24.0%
24.2%
Fall 2008 Fall 2012
Fig. 4.7. Enrollment by Minority Status For ALL Students
28 * 2012-13 Point Park University Factbook

Enrollment
Table 4.8. Enrollment Trends By Age and Division
2008 2009 2010 2011 2012Undergraduate
Traditional 2,257 2,352 2,400 2,400 2,352Non-traditional 1,063 1,041 1,059 946 846Unknown 6 14 34 36 2
GraduateTraditional 115 108 125 129 143Non-traditional 402 461 453 396 448Unknow
7
n 3 10 6 13Total
Traditional 2,372 2,460 2,525 2,529 2,495Non-traditional 1,465 1,502 1,512 1,342 1,294Unknow
11
n 9 24 40 49 3Grand Total 3,846 3,986 4,077 3,920 3,827
Traditional (18-24 years old)Non-traditional (25 years or older)
8
68%73%
22% 24%
32%26%
77%74%
0% 1% 1% 2%0%
10%
20%
30%
40%
50%
60%
70%
80%
90%
Fall 2008 Fall 2012 Fall 2008 Fall 2012
Undergraduate Graduate
Fig. 4.8. Enrollment by Age, Comparing Fall 2008 to Fall 2012
Traditional
Non-traditional
Unknown
2012-13 Point Park University Factbook * 29
Enrollment
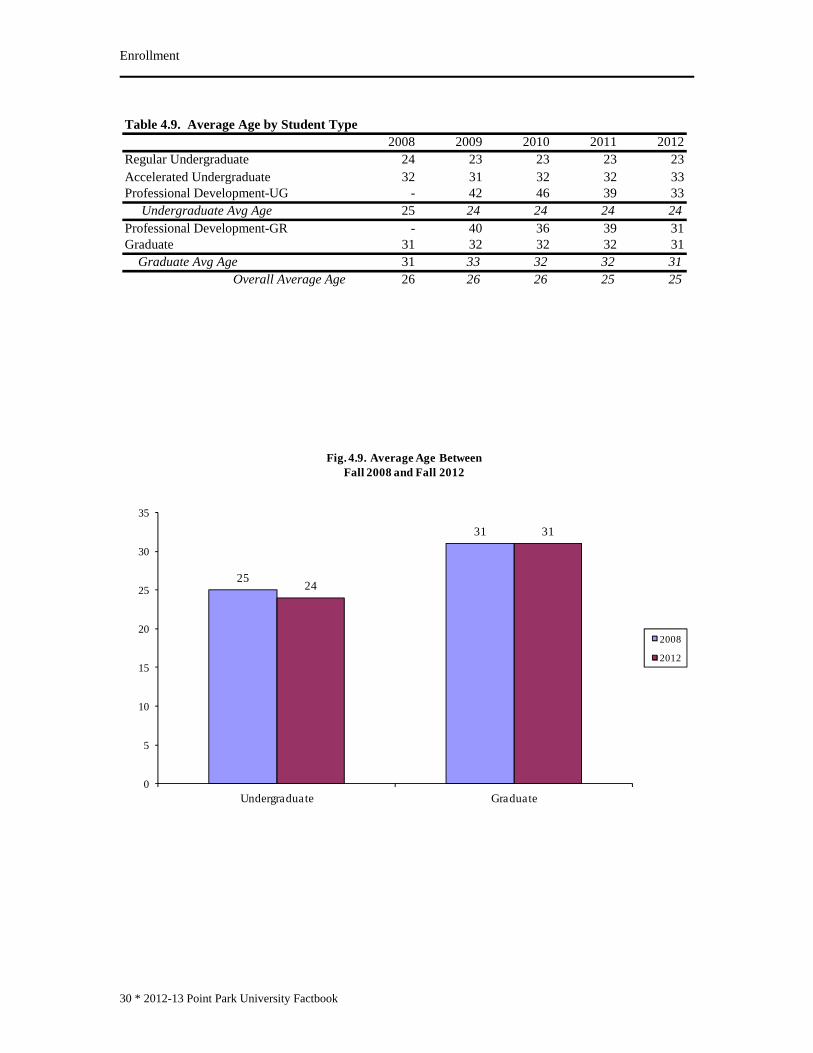
Table 4.9. Average Age by Student Type
2008 2009 2010 2011 2012Regular Undergraduate 24 23 23 23 23Accelerated Undergraduate 32 31 32 32 33Professional Development-UG - 42 46 39 33 Undergraduate Avg Age 25 24 24 24 24Professional Development-GR - 40 36 39 31Graduate 31 32 32 32 31 Graduate Avg Age 31 33 32 32 31
Overall Average Age 26 26 26 25 25
25
31
24
31
0
5
10
15
20
25
30
35
Undergraduate Graduate
Fig. 4.9. Average Age Between Fall 2008 and Fall 2012
2008
2012
30 * 2012-13 Point Park University Factbook
Enrollment
Table 4.10. Enrollment Trends By Residency and Division2008 2009 2010 2011 2012
UndergraduateIn-state 2,753 2,820 2,835 2,677 2,502Out-of-state 571 587 658 705 723Unknown 2 0 0 0 0
GraduateIn-state 464 526 537 486 554Out-of-state 55 53 47 52 48Unknown 1 0 0 0 0
TotalIn-state 3,217 3,346 3,372 3,163 3,056Out-of-state 626 640 705 757 771Unknown 3 0 0 0 0Grand Total 3,846 3,986 4,077 3,920 3,827
3,056
3,163
3,372
3,346
3,217
771
757
705
640
626
0 1,000 2,000 3,000 4,000 5,000
2012
2011
2010
2009
2008
Fig. 4.10. Enrollment Trends By Residency
In-state
Out-of-state
2012-13 Point Park University Factbook * 31

Enrollment
Table 4.11. Number of Undergraduate Students in Residence Halls2008 2009 2010 2011 2012
Full-time Freshmen 405 391 445 401 406All Undergraduates 807 868 983 960 975
405
807
391
868
445
983
401
960
406
975
0
200
400
600
800
1000
1200
Freshmen All Undergraduates
Fig. 4.11. Undergraduate Students in Residence Halls
Fall 2008
Fall 2009
Fall 2010
Fall 2011
Fall 2012
32 * 2012-13 Point Park University Factbook
Enrollment
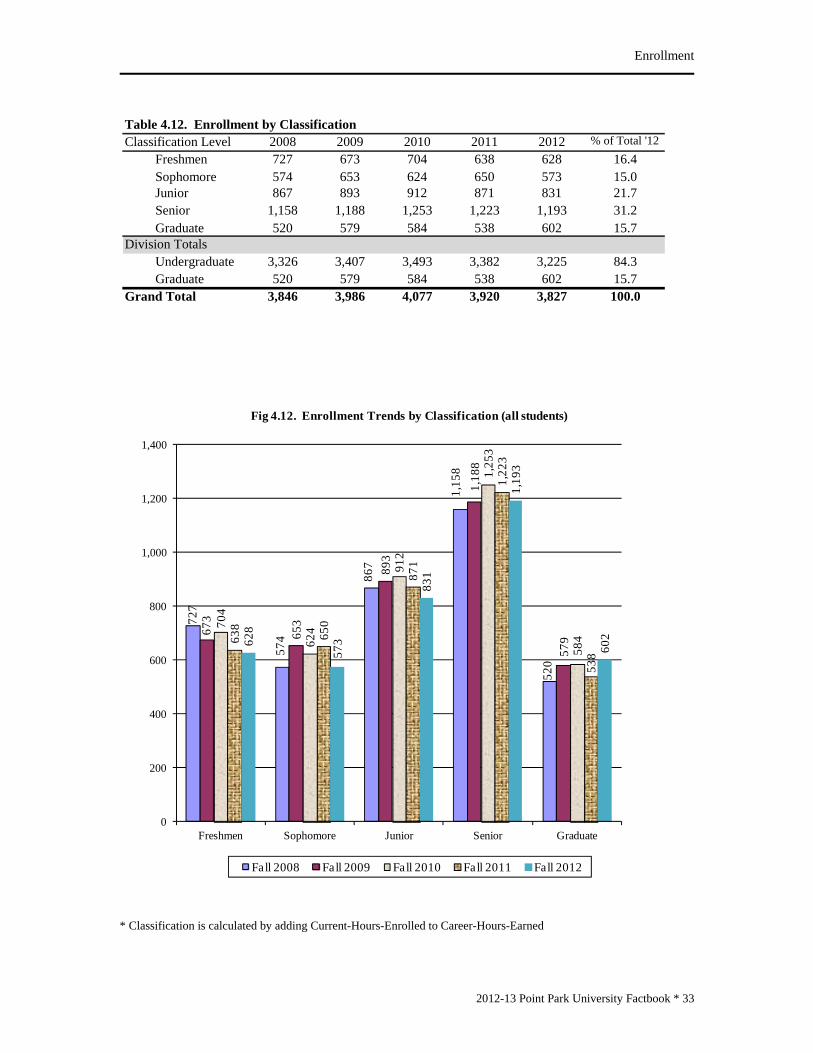
Table 4.12. Enrollment by ClassificationClassification Level 2008 2009 2010 2011 2012 % of Total '12
Freshmen 727 673 704 638 628 16.4Sophomore 574 653 624 650 573 15.0Junior 867 893 912 871 831 21.7Senior 1,158 1,188 1,253 1,223 1,193 31.2Graduate 520 579 584 538 602 15.7
Division TotalsUndergraduate 3,326 3,407 3,493 3,382 3,225 84.3Graduate 520 579 584 538 602 15.7
Grand Total 3,846 3,986 4,077 3,920 3,827 100.0
727
574
867
1,15
8
520
673
653
893
1,18
8
579
704
624
912
1,25
3
58463
8
650
871
1,22
3
538
628
573
831
1,19
3
602
0
200
400
600
800
1,000
1,200
1,400
Freshmen Sophomore Junior Senior Graduate
Fig 4.12. Enrollment Trends by Classification (all students)
Fall 2008 Fall 2009 Fall 2010 Fall 2011 Fall 2012
* Classification is calculated by adding Current-Hours-Enrolled to Career-Hours-Earned
2012-13 Point Park University Factbook * 33

Enrollment
34 * 2012-13 Point Park University Factbook
Table 4.13. Fall 2012 Enrollment by Academic School/Department and DivisionUndergraduate Graduate Total
School of Arts & SciencesCriminal Justice & Intel Studies 308 28 336Education 232 80 312Humanities & Human Sciences 299 0 299Natural Sciences & Engr Tech 314 28 342Miscellaneous 86 2 88
Total: 1239 138 1377
School of BusinessAcct, Fin&Econ, Info Tech 160 0 160Management 558 0 558Global Mgt & Organization 0 370 370
Total: 718 370 1088
School of Communication 456 89 545Total: 456 89 545
Conservatory of Performing ArtsCinema & Digital Arts 250 0 250Dance 253 0 253Theatre 309 5 314
Total: 812 5 817
Grand Total: 3225 602 3827
1239
718
456
812
138
370
89
5
0
200
400
600
800
1000
1200
1400
1600
Arts & Sciences Business Communication Conservatory
Fig. 4.13. Enrollment by Academic School, Fall '12
Graduate
Undergraduate

Enrollment
308232
299 314
86160
558
456
250 253309
2880
28
2
370
89
5
0
100
200
300
400
500
600C
rimin
al J
ustic
e &
Inte
l St
udie
s
Educ
atio
n
Hum
aniti
es &
Hum
an S
cien
ces
Nat
Sci
ence
s &
Eng
r Te
ch
Mis
c
Acc
t, Fi
n&Ec
on,
Info
Tec
h
Man
agem
ent
Glo
bal M
gt &
Org
aniz
atio
n
Com
mun
icat
ion
Cin
ema
& D
igita
l A
rts
Dan
ce
Thea
tre
Arts & Sciences Business Communication Conservatory
Fig. 4.14. Enrollment by Academic Department, Fall '12
Graduate Undergraduate
2012-13 Point Park University Factbook * 35

Enrollment
Student-TypeFA08 FA09 FA10 FA11 FA12 Var. FA08 FA09 FA10 FA11 FA12 Var. FA08 FA09 FA10 FA11 FA12 Var.
Regular Undergraduate
School of Arts & Sciences
Dept. of Criminal Justice & Intel.StudiesCriminal Justice 32 38 38 45 46 1 6 8 13 12 7 -5 38 46 51 57 53 -4Criminal Justice (Capstone) 30 23 18 18 17 -1 11 9 10 13 21 8 41 32 28 31 38 7Forensic Science 2 12 23 29 32 3 0 0 0 3 3 0 2 12 23 32 35 3Intelligence & National Security-Cert. 0 0 0 0 0 0 3 3 1 0 1 1 3 3 1 0 1 1Intelligence & National Security 60 51 75 80 77 -3 5 5 5 4 6 2 65 56 80 84 83 -1
CrimJustice&Intel.Studies Total 124 124 154 172 172 0 25 25 29 32 38 6 149 149 183 204 210 6
Dept.of EducationBio Sci/Secondary Ed 0 1 1 0 1 1 0 1 0 0 0 0 0 2 1 0 1 1Citizenship/Secondary Ed 1 5 3 2 3 1 0 2 3 1 0 -1 1 7 6 3 3 0Early Childhood Education 5 3 13 10 4 -6 9 11 30 11 9 -2 14 14 43 21 13 -8Education/Undeclared 106 117 102 108 90 -18 86 86 66 42 23 -19 192 203 168 150 113 -37Elementary Education 39 45 38 27 17 -10 14 10 4 5 1 -4 53 55 42 32 18 -14Elementary Education Theatre Arts 1 1 0 0 0 0 0 0 0 0 0 0 1 1 0 0 0 0English/Secondary Ed 15 12 10 10 2 -8 1 1 4 2 0 -2 16 13 14 12 2 -10English Sec Ed/Spec Ed 7th-12th 0 0 0 0 1 1 0 0 0 0 0 0 0 0 0 0 1 1ESL Program Specialist 0 0 0 0 0 0 0 0 3 2 2 0 0 0 3 2 2 0Instructional Studies 5 6 4 5 9 4 2 5 9 2 7 5 7 11 13 7 16 9Mass Comm/Secondary Ed 0 1 1 0 0 0 0 0 0 0 0 0 0 1 1 0 0 0Mathematics/Secondary Ed 3 3 3 2 4 2 3 1 2 2 0 -2 6 4 5 4 4 0PA Cert English 4th-8th Spec Educ 0 0 0 1 2 1 0 0 0 0 0 0 0 0 0 1 2 1PA Cert Math 4th-8th 0 0 1 0 0 0 0 0 0 0 0 0 0 0 1 0 0 0PA Cert PreK-4th 0 0 0 1 4 3 0 0 2 0 1 1 0 0 2 1 5 4PA Cert PreK-4th Spec Educ 0 0 1 5 11 6 0 0 1 0 1 1 0 0 2 5 12 7School Principal K-12 0 0 0 0 0 0 0 0 0 1 0 -1 0 0 0 1 0 -1
Education Total 175 194 177 171 148 -23 115 117 124 68 44 -24 290 311 301 239 192 -47
Full-time Part-time TotalTable 4.14. Enrollment Trends with Variance by Student-Type, School/Department/Major
36 * 2012-13 Point Park University Factbook

Enrollment
Student-TypeFA08 FA09 FA10 FA11 FA12 Var. FA08 FA09 FA10 FA11 FA12 Var. FA08 FA09 FA10 FA11 FA12 Var.
Regular Undergraduate (cont.)
School of Arts & Sciences (cont.)
Dept.of Humanities & Human SciencesApplied History 12 14 22 14 8 -6 7 6 6 4 3 -1 19 20 28 18 11 -7Behavioral Sciences 14 19 18 14 20 6 12 13 18 17 16 -1 26 32 36 31 36 5English 34 36 45 31 24 -7 3 5 2 7 5 -2 37 41 47 38 29 -9English/Creative Writing 0 0 5 22 23 1 0 0 0 2 1 -1 0 0 5 24 24 0General Studies 3 1 1 0 0 0 7 2 0 0 0 0 10 3 1 0 0 0Global Cultural Studies 12 15 19 16 20 4 1 1 0 3 3 0 13 16 19 19 23 4History 0 0 0 0 3 3 0 0 0 0 0 0 0 0 0 0 3 3Interdisciplinary Design 0 1 4 5 3 -2 0 1 0 4 1 -3 0 2 4 9 4 -5Legal Studies 0 0 0 6 7 1 0 0 0 2 6 4 0 0 0 8 13 5Legal Studies (Capstone) 15 15 19 7 4 -3 20 20 23 15 16 1 35 35 42 22 20 -2Liberal Studies 1 6 10 9 8 -1 0 4 6 4 4 0 1 10 16 13 12 -1Liberal Studies (Capstone) 1 2 2 2 2 0 0 0 1 3 4 1 1 2 3 5 6 1Political Science 19 18 18 15 8 -7 3 5 2 3 3 0 22 23 20 18 11 -7Psychology 69 89 94 87 90 3 23 28 29 26 17 -9 92 117 123 113 107 -6
Humanities & Human Sciences Total 180 216 257 228 220 -8 76 85 87 90 79 -11 256 301 344 318 299 -19
Dept.of Natural Sciences & Engineering TechAllied Health 0 0 0 0 1 1 0 0 3 3 1 -2 0 0 3 3 2 -1Biological Sciences 30 23 26 29 30 1 3 9 9 8 9 1 33 32 35 37 39 2Biotechnology 6 6 3 4 4 0 2 4 0 4 2 -2 8 10 3 8 6 -2Biotechnology (Capstone) 5 4 3 1 3 2 4 6 4 4 6 2 9 10 7 5 9 4Civil Eng Technology 19 21 21 25 23 -2 32 35 42 42 37 -5 51 56 63 67 60 -7Electrical Eng Technology 22 23 24 23 29 6 63 71 71 70 74 4 85 94 95 93 103 10Env Health Sci and Protection 4 4 4 3 1 -2 0 0 1 1 0 -1 4 4 5 4 1 -3Funeral Services 4 7 14 14 9 -5 1 1 0 2 0 -2 5 8 14 16 9 -7Funeral Services (Capstone) 6 10 6 6 7 1 2 0 4 2 1 -1 8 10 10 8 8 0Health Services 8 9 10 4 5 1 9 13 8 14 10 -4 17 22 18 18 15 -3Mechanical Eng Technology 12 16 16 21 18 -3 39 36 34 34 33 -1 51 52 50 55 51 -4Premedical & Preprofessional Studies 0 0 0 1 11 10 0 0 0 1 0 -1 0 0 0 2 11 9
Natural Sciences & Engr Tech Total 116 123 127 131 141 10 155 175 176 185 173 -12 271 298 303 316 314 -2
Table 4.14. (Continued)Full-time Part-time Total
2012-13 Point Park University Factbook * 37
Enrollment
Student-TypeFA08 FA09 FA10 FA11 FA12 Var. FA08 FA09 FA10 FA11 FA12 Var. FA08 FA09 FA10 FA11 FA12 Var.
Regular Undergraduate (cont.)
School of Arts & Sciences (cont.)
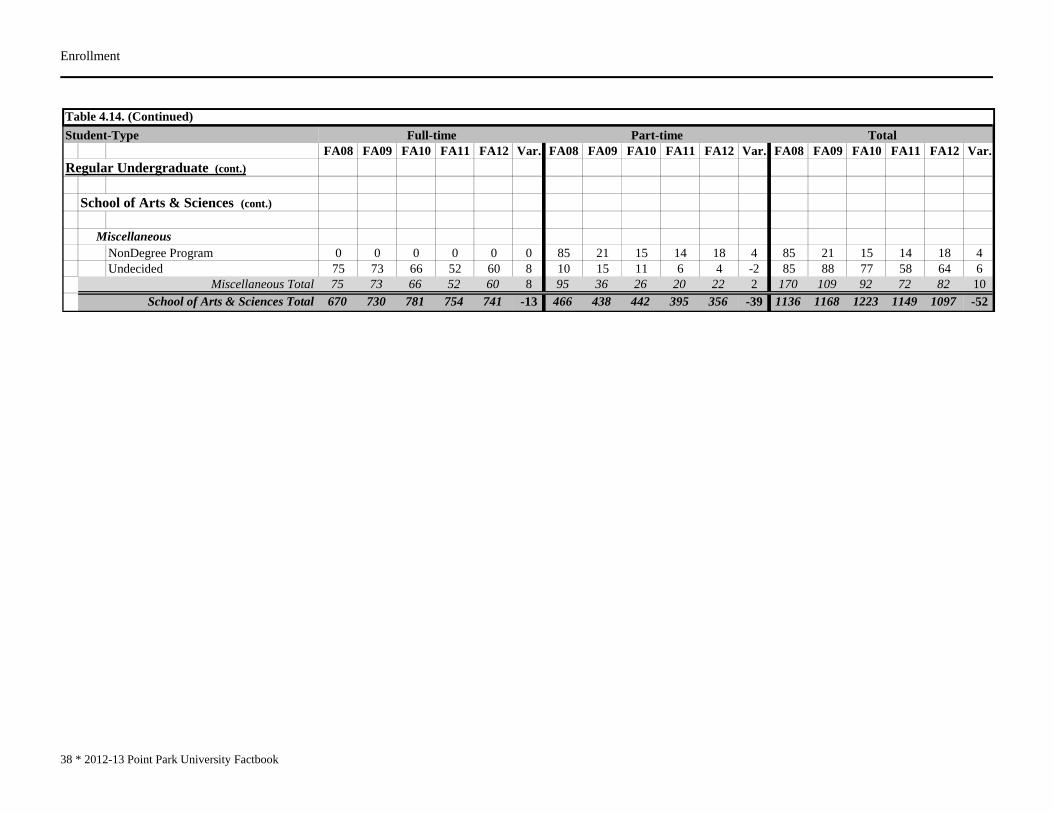
MiscellaneousNonDegree Program 0 0 0 0 0 0 85 21 15 14 18 4 85 21 15 14 18 4Undecided 75 73 66 52 60 8 10 15 11 6 4 -2 85 88 77 58 64 6
Miscellaneous Total 75 73 66 52 60 8 95 36 26 20 22 2 170 109 92 72 82 10School of Arts & Sciences Total 670 730 781 754 741 -13 466 438 442 395 356 -39 1136 1168 1223 1149 1097 -52
Table 4.14. (Continued)Full-time Part-time Total
38 * 2012-13 Point Park University Factbook

Enrollment
Student-TypeFA08 FA09 FA10 FA11 FA12 Var. FA08 FA09 FA10 FA11 FA12 Var. FA08 FA09 FA10 FA11 FA12 Var.
Regular Undergraduate (cont.)
School of Business
Dept. of Acct, Fin&Econ, InfoTechAccounting 38 40 39 39 37 -2 46 49 43 32 37 5 84 89 82 71 74 3Economics and Finance 9 8 9 12 11 -1 4 6 9 5 3 -2 13 14 18 17 14 -3Information Technology 12 21 26 30 16 -14 18 18 20 24 19 -5 30 39 46 54 35 -19
Acct, Fin&Econ, InfoTech Total 59 69 74 81 64 -17 68 73 72 61 59 -2 127 142 146 142 123 -19
Dept. of ManagementBusiness Mgmt 107 107 99 112 104 -8 30 32 29 31 34 3 137 139 128 143 138 -5Human Resources Mgmt 5 6 8 7 8 1 7 9 8 8 10 2 12 15 16 15 18 3Human Resources Mgmt (Capstone) 6 5 10 7 11 4 15 19 23 20 21 1 21 24 33 27 32 5Leadership & Public Service 0 7 5 1 0 -1 0 4 8 4 1 -3 0 11 13 5 1 -4Management Services 4 5 3 5 5 0 10 13 7 8 9 1 14 18 10 13 14 1Public Administration - Cert. 0 0 0 0 0 0 0 0 0 1 0 -1 0 0 0 1 0 -1Public Administration 3 3 1 3 2 -1 22 11 12 12 7 -5 25 14 13 15 9 -6Sport, Arts and Entertainment Mgmt 122 144 149 195 215 20 7 11 8 8 11 3 129 155 157 203 226 23
Management Total 247 277 275 330 345 15 91 99 95 92 93 1 338 376 370 422 438 16School of Business Total 306 346 349 411 409 -2 159 172 167 153 152 -1 465 518 516 564 561 -3
Table 4.14. (Continued)Full-time Part-time Total
2012-13 Point Park University Factbook * 39

Enrollment
Student-TypeFA08 FA09 FA10 FA11 FA12 Var. FA08 FA09 FA10 FA11 FA12 Var. FA08 FA09 FA10 FA11 FA12 Var.
Regular Undergraduate (cont.)
School of CommunicationAdvertising 0 0 0 13 9 -4 0 0 0 0 0 0 0 0 0 13 9 -4Advertising and Public Relations 89 104 93 57 25 -32 2 1 3 1 3 2 91 105 96 58 28 -30Broadcast Production & Programming 0 0 0 11 26 15 0 0 0 1 2 1 0 0 0 12 28 16Broadcasting - On Camera 0 0 0 31 28 -3 0 0 0 1 1 0 0 0 0 32 29 -3Broadcasting - Radio/TV 0 0 0 0 0 0 0 0 0 1 1 0 0 0 0 1 1 0Broadcasting 127 129 120 71 34 -37 4 7 8 7 6 -1 131 136 128 78 40 -38Broadcasting Reporting 0 0 0 0 29 29 0 0 0 0 0 0 0 0 0 0 29 29Digital Media 0 5 11 6 3 -3 0 2 2 1 1 0 0 7 13 7 4 -3Journalism 0 0 0 29 52 23 0 0 0 1 0 -1 0 0 0 30 52 22Jour and Mass Communication 96 103 93 40 19 -21 5 7 8 5 5 0 101 110 101 45 24 -21Journalism/Photojournalism 63 48 55 30 14 -16 2 2 0 0 0 0 65 50 55 30 14 -16Mass Communication 23 16 9 23 29 6 1 1 1 2 3 1 24 17 10 25 32 7Multimedia 0 0 8 20 31 11 0 0 1 0 0 0 0 0 9 20 31 11Photography (BFA) 48 54 57 53 48 -5 5 4 6 5 5 0 53 58 63 58 53 -5Photojournalism 0 0 0 10 19 9 0 0 0 0 1 1 0 0 0 10 20 10Public Relations 0 0 0 29 29 0 0 0 0 1 1 0 0 0 0 30 30 0Public Relations and Advertising 0 0 0 0 17 17 0 0 0 0 0 0 0 0 0 0 17 17
School of Communication Total 446 459 446 423 412 -11 19 24 29 26 29 3 465 483 475 449 441 -8
Full-time Part-time TotalTable 4.14. (Continued)
40 * 2012-13 Point Park University Factbook
Enrollment
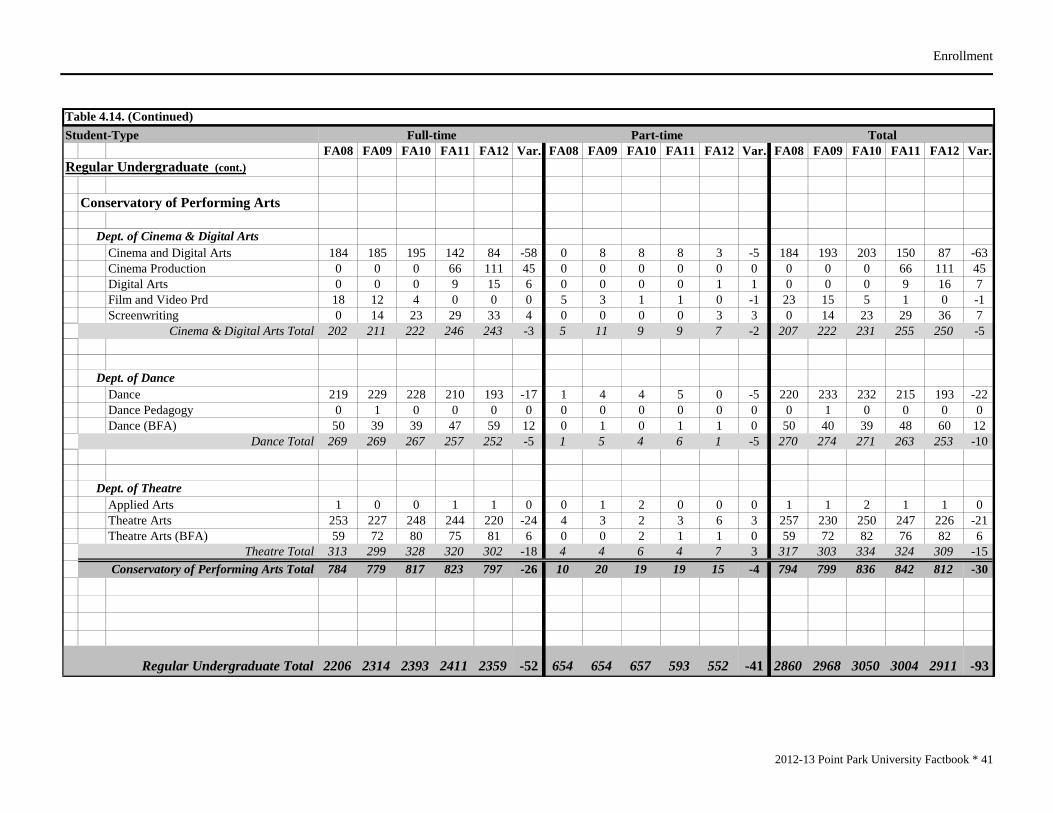
Student-TypeFA08 FA09 FA10 FA11 FA12 Var. FA08 FA09 FA10 FA11 FA12 Var. FA08 FA09 FA10 FA11 FA12 Var.
Regular Undergraduate (cont.)
Conservatory of Performing Arts
Dept. of Cinema & Digital ArtsCinema and Digital Arts 184 185 195 142 84 -58 0 8 8 8 3 -5 184 193 203 150 87 -63Cinema Production 0 0 0 66 111 45 0 0 0 0 0 0 0 0 0 66 111 45Digital Arts 0 0 0 9 15 6 0 0 0 0 1 1 0 0 0 9 16 7Film and Video Prd 18 12 4 0 0 0 5 3 1 1 0 -1 23 15 5 1 0 -1Screenwriting 0 14 23 29 33 4 0 0 0 0 3 3 0 14 23 29 36 7
Cinema & Digital Arts Total 202 211 222 246 243 -3 5 11 9 9 7 -2 207 222 231 255 250 -5
Dept. of DanceDance 219 229 228 210 193 -17 1 4 4 5 0 -5 220 233 232 215 193 -22Dance Pedagogy 0 1 0 0 0 0 0 0 0 0 0 0 0 1 0 0 0 0Dance (BFA) 50 39 39 47 59 12 0 1 0 1 1 0 50 40 39 48 60 12
Dance Total 269 269 267 257 252 -5 1 5 4 6 1 -5 270 274 271 263 253 -10
Dept. of TheatreApplied Arts 1 0 0 1 1 0 0 1 2 0 0 0 1 1 2 1 1 0Theatre Arts 253 227 248 244 220 -24 4 3 2 3 6 3 257 230 250 247 226 -21Theatre Arts (BFA) 59 72 80 75 81 6 0 0 2 1 1 0 59 72 82 76 82 6
Theatre Total 313 299 328 320 302 -18 4 4 6 4 7 3 317 303 334 324 309 -15Conservatory of Performing Arts Total 784 779 817 823 797 -26 10 20 19 19 15 -4 794 799 836 842 812 -30
Regular Undergraduate Total 2206 2314 2393 2411 2359 -52 654 654 657 593 552 -41 2860 2968 3050 3004 2911 -93
Table 4.14. (Continued)Full-time Part-time Total
2012-13 Point Park University Factbook * 41

Enrollment
Student-TypeFA08 FA09 FA10 FA11 FA12 Var. FA08 FA09 FA10 FA11 FA12 Var. FA08 FA09 FA10 FA11 FA12 Var.
UG Professional DevelopmentProfessional Development-UG 0 0 0 0 0 0 0 31 60 52 40 -12 0 31 60 52 40 -12
UG Professional Development Total 0 0 0 0 0 0 0 31 60 52 40 -12 0 31 60 52 40 -12
GR Professional DevelopmentProfessional Development-GR 0 0 0 0 0 0 0 9 4 5 28 23 0 9 4 5 28 23
GR Professional Development Total 0 0 0 0 0 0 0 9 4 5 28 23 0 9 4 5 28 23
Table 4.14. (Continued)Full-time Part-time Total
42 * 2012-13 Point Park University Factbook
Enrollment
2012-13 Point Park University Factbook * 43
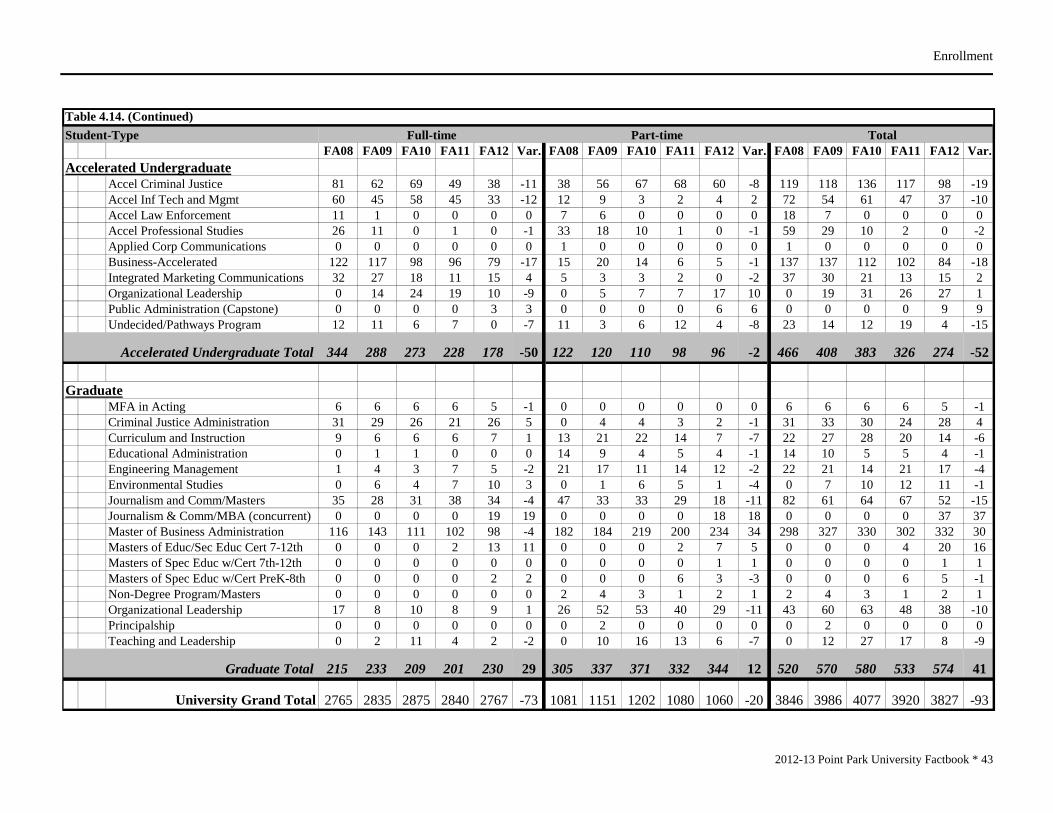
Student-TypeFA08 FA09 FA10 FA11 FA12 Var. FA08 FA09 FA10 FA11 FA12 Var. FA08 FA09 FA10 FA11 FA12 Var.
Accelerated UndergraduateAccel Criminal Justice 81 62 69 49 38 -11 38 56 67 68 60 -8 119 118 136 117 98 -19Accel Inf Tech and Mgmt 60 45 58 45 33 -12 12 9 3 2 4 2 72 54 61 47 37 -10Accel Law Enforcement 11 1 0 0 0 0 7 6 0 0 0 0 18 7 0 0 0 0Accel Professional Studies 26 11 0 1 0 -1 33 18 10 1 0 -1 59 29 10 2 0 -2Applied Corp Communications 0 0 0 0 0 0 1 0 0 0 0 0 1 0 0 0 0 0Business-Accelerated 122 117 98 96 79 -17 15 20 14 6 5 -1 137 137 112 102 84 -18Integrated Marketing Communications 32 27 18 11 15 4 5 3 3 2 0 -2 37 30 21 13 15 2Organizational Leadership 0 14 24 19 10 -9 0 5 7 7 17 10 0 19 31 26 27 1Public Administration (Capstone) 0 0 0 0 3 3 0 0 0 0 6 6 0 0 0 0 9 9Undecided/Pathways Program 12 11 6 7 0 -7 11 3 6 12 4 -8 23 14 12 19 4 -15
Accelerated Undergraduate Total 344 288 273 228 178 -50 122 120 110 98 96 -2 466 408 383 326 274 -52
GraduateMFA in Acting 6 6 6 6 5 -1 0 0 0 0 0 0 6 6 6 6 5 -1Criminal Justice Administration 31 29 26 21 26 5 0 4 4 3 2 -1 31 33 30 24 28 4Curriculum and Instruction 9 6 6 6 7 1 13 21 22 14 7 -7 22 27 28 20 14 -6Educational Administration 0 1 1 0 0 0 14 9 4 5 4 -1 14 10 5 5 4 -1Engineering Management 1 4 3 7 5 -2 21 17 11 14 12 -2 22 21 14 21 17 -4Environmental Studies 0 6 4 7 10 3 0 1 6 5 1 -4 0 7 10 12 11 -1Journalism and Comm/Masters 35 28 31 38 34 -4 47 33 33 29 18 -11 82 61 64 67 52 -15Journalism & Comm/MBA (concurrent) 0 0 0 0 19 19 0 0 0 0 18 18 0 0 0 0 37 37Master of Business Administration 116 143 111 102 98 -4 182 184 219 200 234 34 298 327 330 302 332 30Masters of Educ/Sec Educ Cert 7-12th 0 0 0 2 13 11 0 0 0 2 7 5 0 0 0 4 20 16Masters of Spec Educ w/Cert 7th-12th 0 0 0 0 0 0 0 0 0 0 1 1 0 0 0 0 1 1Masters of Spec Educ w/Cert PreK-8th 0 0 0 0 2 2 0 0 0 6 3 -3 0 0 0 6 5 -1Non-Degree Program/Masters 0 0 0 0 0 0 2 4 3 1 2 1 2 4 3 1 2 1Organizational Leadership 17 8 10 8 9 1 26 52 53 40 29 -11 43 60 63 48 38 -10Principalship 0 0 0 0 0 0 0 2 0 0 0 0 0 2 0 0 0 0Teaching and Leadership 0 2 11 4 2 -2 0 10 16 13 6 -7 0 12 27 17 8 -9
Graduate Total 215 233 209 201 230 29 305 337 371 332 344 12 520 570 580 533 574 41
University Grand Total 2765 2835 2875 2840 2767 -73 1081 1151 1202 1080 1060 -20 3846 3986 4077 3920 3827 -93
Table 4.14. (Continued)Full-time Part-time Total

Enrollment
School / Department / Student-TypeDept. of Criminal Justice & Intelligence Studies (School of Arts & Sciences)
Regular UndergraduateFA08 FA09 FA10 FA11 FA12 Var. FA08 FA09 FA10 FA11 FA12 Var. FA08 FA09 FA10 FA11 FA12 Var.
Criminal Justice 32 38 38 45 46 1 6 8 13 12 7 -5 38 46 51 57 53 -4 New 8 13 17 25 14 -11 3 3 7 6 4 -2 11 16 24 31 18 -13 Returning 24 25 21 20 32 12 3 5 6 6 3 -3 27 30 27 26 35 9Criminal Justice(Capstone) 30 23 18 18 17 -1 11 9 10 13 21 8 41 32 28 31 38 7 New 11 8 5 2 7 5 1 1 2 6 11 5 12 9 7 8 18 10 Returning 19 15 13 16 10 -6 10 8 8 7 10 3 29 23 21 23 20 -3Forensic Science 2 12 23 29 32 3 0 0 0 3 3 0 2 12 23 32 35 3 New 1 9 12 15 11 -4 0 0 0 0 0 0 1 9 12 15 11 -4 Returning 1 3 11 14 21 7 0 0 0 3 3 0 1 3 11 17 24 7Intelligence & National Security-Cert. 0 0 0 0 0 0 3 3 1 0 1 1 3 3 1 0 1 1 New 0 0 0 0 0 0 2 2 0 0 0 0 2 2 0 0 0 0 Returning 0 0 0 0 0 0 1 1 1 0 1 1 1 1 1 0 1 1Intelligence & National Security 60 51 75 80 77 -3 5 5 5 4 6 2 65 56 80 84 83 -1 New 17 11 27 21 18 -3 1 1 1 1 3 2 18 12 28 22 21 -1 Returning 43 40 48 59 59 0 4 4 4 3 3 0 47 44 52 62 62 0
New 37 41 61 63 50 -13 7 7 10 13 18 5 44 48 71 76 68 -8Returning 87 83 93 109 122 13 18 18 19 19 20 1 105 101 112 128 142 14
CrimJustice&IntelStds-Regular UG Total 124 124 154 172 172 0 25 25 29 32 38 6 149 149 183 204 210 6
Accelerated UndergraduateFA08 FA09 FA10 FA11 FA12 Var. FA08 FA09 FA10 FA11 FA12 Var. FA08 FA09 FA10 FA11 FA12 Var.
Accel Criminal Justice 81 62 69 49 38 -11 38 56 67 68 60 -8 119 118 136 117 98 -19 New 15 16 16 12 11 -1 26 29 32 28 23 -5 41 45 48 40 34 -6 Returning 66 46 53 37 27 -10 12 27 35 40 37 -3 78 73 88 77 64 -13Accel Law Enforcement 11 1 0 0 0 0 7 6 0 0 0 0 18 7 0 0 0 0 New 6 1 0 0 0 0 0 0 0 0 0 0 6 1 0 0 0 0 Returning 5 0 0 0 0 0 7 6 0 0 0 0 12 6 0 0 0 0
New 21 17 16 12 11 -1 26 29 32 28 23 -5 47 46 48 40 34 -6Returning 71 46 53 37 27 -10 19 33 35 40 37 -3 90 79 88 77 64 -13
CrimJustice&IntelStds-Accel UG Total 92 63 69 49 38 -11 45 62 67 68 60 -8 137 125 136 117 98 -19
Full-time Part-time Total
Full-time Part-time Total
Table 4.15. Enrollment Trends, 5-Yr Variance, New and Returning by School/Department/Student-Type
44 * 2012-13 Point Park University Factbook

Enrollment
School / Department / Student-TypeDept. of Criminal Justice & Intelligence Studies (School of Arts & Sciences) (con't)
GraduateFA08 FA09 FA10 FA11 FA12 Var. FA08 FA09 FA10 FA11 FA12 Var. FA08 FA09 FA10 FA11 FA12 Var.
Criminal Justice Administration 31 29 26 21 26 5 0 4 4 3 2 -1 31 33 30 24 28 4 New 20 23 16 14 12 -2 0 1 0 0 1 1 20 24 16 14 13 -1 Returning 11 6 10 7 14 7 0 3 4 3 1 -2 11 9 14 10 15 5
New 20 23 16 14 12 -2 0 1 0 0 1 1 20 24 16 14 13 -1Returning 11 6 10 7 14 7 0 3 4 3 1 -2 11 9 14 10 15 5
CrimJustice&IntelStds-Graduate Total 31 29 26 21 26 5 0 4 4 3 2 -1 31 33 30 24 28 4
FA08 FA09 FA10 FA11 FA12 Var. FA08 FA09 FA10 FA11 FA12 Var. FA08 FA09 FA10 FA11 FA12 Var.New 78 81 93 89 73 -16 33 37 42 41 42 1 111 118 135 130 115 -15
Returning 169 135 156 153 163 10 37 54 58 62 58 -4 206 189 214 215 221 6Criminal Justice & Intel Stds - TOTAL 247 216 249 242 236 -6 70 91 100 103 100 -3 317 307 349 345 336 -9
Full-time Part-time Total
Full-time Part-time Total
Table 4.15. (Continued)
2012-13 Point Park University Factbook * 45

Enrollment
School / Department / Student-TypeDept.of Education (School of Arts & Sciences)
Regular UndergraduateFA08 FA09 FA10 FA11 FA12 Var. FA08 FA09 FA10 FA11 FA12 Var. FA08 FA09 FA10 FA11 FA12 Var.
Bio Sci/Secondary Ed 0 1 1 0 1 1 0 1 0 0 0 0 0 2 1 0 1 1 New 0 0 0 0 0 0 0 0 0 0 0 0 0 0 0 0 0 0 Returning 0 1 1 0 1 1 0 1 0 0 0 0 0 2 1 0 1 1Citizenship/Secondary Ed 1 5 3 2 3 1 0 2 3 1 0 -1 1 7 6 3 3 0 New 0 0 2 0 0 0 0 0 0 1 0 -1 0 0 2 1 0 -1 Returning 1 5 1 2 3 1 0 2 3 0 0 0 1 7 4 2 3 1Early Childhood Education 5 3 13 10 4 -6 9 11 30 11 9 -2 14 14 43 21 13 -8 New 0 0 1 0 0 0 6 2 7 0 0 0 6 2 8 0 0 0 Returning 5 3 12 10 4 -6 3 9 23 11 9 -2 8 12 35 21 13 -8Education/Undeclared 106 117 102 108 90 -18 86 86 66 42 23 -19 192 203 168 150 113 -37 New 57 55 39 58 41 -17 51 26 14 11 3 -8 108 81 53 69 44 -25 Returning 49 62 63 50 49 -1 35 60 52 31 20 -11 84 122 115 81 69 -12Elementary Education 39 45 38 27 17 -10 14 10 4 5 1 -4 53 55 42 32 18 -14 New 3 3 0 0 0 0 2 1 0 0 0 0 5 4 0 0 0 0 Returning 36 42 38 27 17 -10 12 9 4 5 1 -4 48 51 42 32 18 -14Elementary Education Theatre Arts 1 1 0 0 0 0 0 0 0 0 0 0 1 1 0 0 0 0 New 0 0 0 0 0 0 0 0 0 0 0 0 0 0 0 0 0 0 Returning 1 1 0 0 0 0 0 0 0 0 0 0 1 1 0 0 0 0English/Secondary Ed 15 12 10 10 2 -8 1 1 4 2 0 -2 16 13 14 12 2 -10 New 0 0 1 0 0 0 0 0 0 0 0 0 0 0 1 0 0 0 Returning 15 12 9 10 2 -8 1 1 4 2 0 -2 16 13 13 12 2 -10English Sec Ed/Spec Ed 7th-12th 0 0 0 0 1 1 0 0 0 0 0 0 0 0 0 0 1 1 New 0 0 0 0 0 0 0 0 0 0 0 0 0 0 0 0 0 0 Returning 0 0 0 0 1 1 0 0 0 0 0 0 0 0 0 0 1 1ESL Program Specialist 0 0 0 0 0 0 0 0 3 2 2 0 0 0 3 2 2 0 New 0 0 0 0 0 0 0 0 2 2 1 -1 0 0 2 2 1 -1 Returning 0 0 0 0 0 0 0 0 1 0 1 1 0 0 1 0 1 1Instructional Studies 5 6 4 5 9 4 2 5 9 2 7 5 7 11 13 7 16 9 New 0 2 0 1 1 0 0 3 3 1 0 -1 0 5 3 2 1 -1 Returning 5 4 4 4 8 4 2 2 6 1 7 6 7 6 10 5 15 10Mass Comm/Secondary Ed 0 1 1 0 0 0 0 0 0 0 0 0 0 1 1 0 0 0 New 0 0 0 0 0 0 0 0 0 0 0 0 0 0 0 0 0 0 Returning 0 1 1 0 0 0 0 0 0 0 0 0 0 1 1 0 0 0
Full-time Part-time Total
Table 4.15. (Continued)
46 * 2012-13 Point Park University Factbook

Enrollment
School / Department / Student-TypeDept.of Education (School of Arts & Sciences) (con't)
Regular Undergraduate (con't)FA08 FA09 FA10 FA11 FA12 Var. FA08 FA09 FA10 FA11 FA12 Var. FA08 FA09 FA10 FA11 FA12 Var.
Mathematics/Secondary Ed 3 3 3 2 4 2 3 1 2 2 0 -2 6 4 5 4 4 0 New 0 0 0 0 0 0 0 0 0 0 0 0 0 0 0 0 0 0 Returning 3 3 3 2 4 2 3 1 2 2 0 -2 6 4 5 4 4 0PA Cert English 4th-8th Spec Educ 0 0 0 1 2 1 0 0 0 0 0 0 0 0 0 1 2 1 New 0 0 0 0 0 0 0 0 0 0 0 0 0 0 0 0 0 0 Returning 0 0 0 1 2 1 0 0 0 0 0 0 0 0 0 1 2 1PA Cert Math 4th-8th 0 0 1 0 0 0 0 0 0 0 0 0 0 0 1 0 0 0 New 0 0 1 0 0 0 0 0 0 0 0 0 0 0 1 0 0 0 Returning 0 0 0 0 0 0 0 0 0 0 0 0 0 0 0 0 0 0PA Cert PreK-4th 0 0 0 1 4 3 0 0 2 0 1 1 0 0 2 1 5 4 New 0 0 0 0 0 0 0 0 0 0 0 0 0 0 0 0 0 0 Returning 0 0 0 1 4 3 0 0 2 0 1 1 0 0 2 1 5 4PA Cert PreK-4th Spec Educ 0 0 1 5 11 6 0 0 1 0 1 1 0 0 2 5 12 7 New 0 0 1 0 0 0 0 0 0 0 0 0 0 0 1 0 0 0 Returning 0 0 0 5 11 6 0 0 1 0 1 1 0 0 1 5 12 7School Principal K-12 0 0 0 0 0 0 0 0 0 1 0 -1 0 0 0 1 0 -1 New 0 0 0 0 0 0 0 0 0 0 0 0 0 0 0 0 0 0 Returning 0 0 0 0 0 0 0 0 0 1 0 -1 0 0 0 1 0 -1
New 60 60 45 59 42 -17 59 32 26 15 4 -11 119 92 71 74 46 -28Returning 115 134 132 112 106 -6 56 85 98 53 40 -13 171 219 230 165 146 -19
Education-Regular UG Total 175 194 177 171 148 -23 115 117 124 68 44 -24 290 311 301 239 192 -47
Table 4.15. (Continued)
Full-time Part-time Total
2012-13 Point Park University Factbook * 47
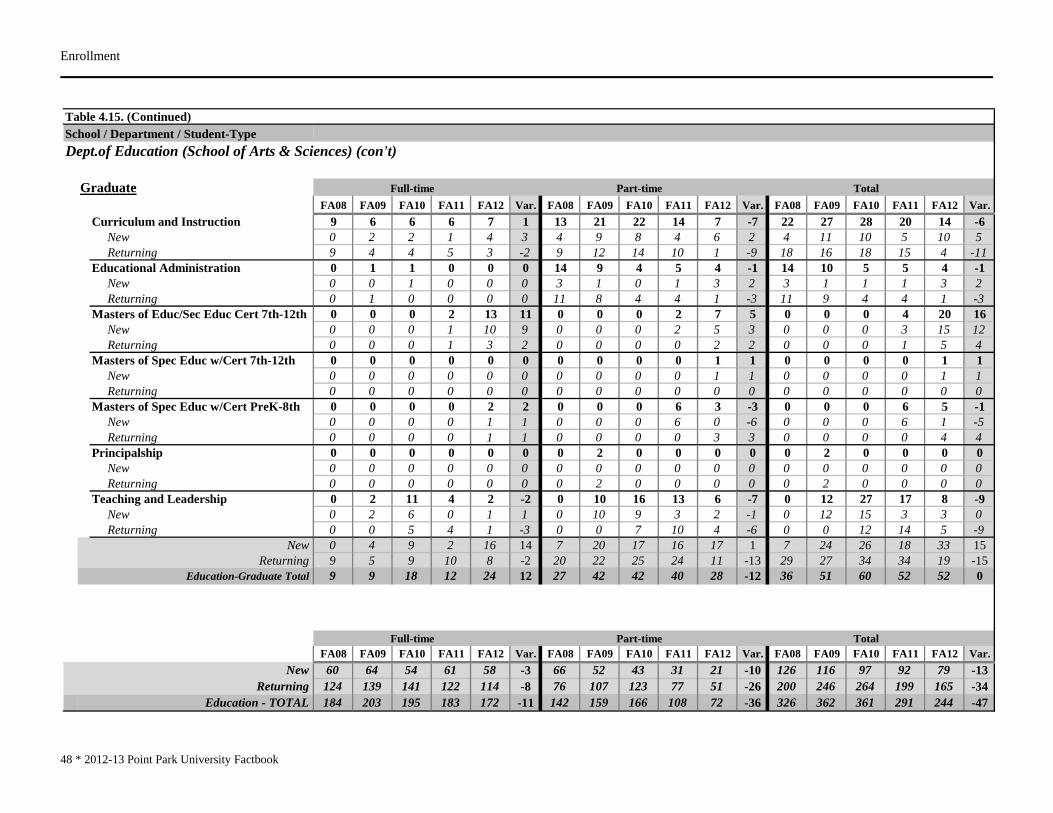
Enrollment
School / Department / Student-TypeDept.of Education (School of Arts & Sciences) (con't)
GraduateFA08 FA09 FA10 FA11 FA12 Var. FA08 FA09 FA10 FA11 FA12 Var. FA08 FA09 FA10 FA11 FA12 Var.
Curriculum and Instruction 9 6 6 6 7 1 13 21 22 14 7 -7 22 27 28 20 14 -6 New 0 2 2 1 4 3 4 9 8 4 6 2 4 11 10 5 10 5 Returning 9 4 4 5 3 -2 9 12 14 10 1 -9 18 16 18 15 4 -11Educational Administration 0 1 1 0 0 0 14 9 4 5 4 -1 14 10 5 5 4 -1 New 0 0 1 0 0 0 3 1 0 1 3 2 3 1 1 1 3 2 Returning 0 1 0 0 0 0 11 8 4 4 1 -3 11 9 4 4 1 -3Masters of Educ/Sec Educ Cert 7th-12th 0 0 0 2 13 11 0 0 0 2 7 5 0 0 0 4 20 16 New 0 0 0 1 10 9 0 0 0 2 5 3 0 0 0 3 15 12 Returning 0 0 0 1 3 2 0 0 0 0 2 2 0 0 0 1 5 4Masters of Spec Educ w/Cert 7th-12th 0 0 0 0 0 0 0 0 0 0 1 1 0 0 0 0 1 1 New 0 0 0 0 0 0 0 0 0 0 1 1 0 0 0 0 1 1 Returning 0 0 0 0 0 0 0 0 0 0 0 0 0 0 0 0 0 0Masters of Spec Educ w/Cert PreK-8th 0 0 0 0 2 2 0 0 0 6 3 -3 0 0 0 6 5 -1 New 0 0 0 0 1 1 0 0 0 6 0 -6 0 0 0 6 1 -5 Returning 0 0 0 0 1 1 0 0 0 0 3 3 0 0 0 0 4 4Principalship 0 0 0 0 0 0 0 2 0 0 0 0 0 2 0 0 0 0 New 0 0 0 0 0 0 0 0 0 0 0 0 0 0 0 0 0 0 Returning 0 0 0 0 0 0 0 2 0 0 0 0 0 2 0 0 0 0Teaching and Leadership 0 2 11 4 2 -2 0 10 16 13 6 -7 0 12 27 17 8 -9 New 0 2 6 0 1 1 0 10 9 3 2 -1 0 12 15 3 3 0 Returning 0 0 5 4 1 -3 0 0 7 10 4 -6 0 0 12 14 5 -9
New 0 4 9 2 16 14 7 20 17 16 17 1 7 24 26 18 33 15Returning 9 5 9 10 8 -2 20 22 25 24 11 -13 29 27 34 34 19 -15
Education-Graduate Total 9 9 18 12 24 12 27 42 42 40 28 -12 36 51 60 52 52 0
FA08 FA09 FA10 FA11 FA12 Var. FA08 FA09 FA10 FA11 FA12 Var. FA08 FA09 FA10 FA11 FA12 Var.New 60 64 54 61 58 -3 66 52 43 31 21 -10 126 116 97 92 79 -13
Returning 124 139 141 122 114 -8 76 107 123 77 51 -26 200 246 264 199 165 -34Education - TOTAL 184 203 195 183 172 -11 142 159 166 108 72 -36 326 362 361 291 244 -47
Full-time Part-time Total
Table 4.15. (Continued)
Full-time Part-time Total
48 * 2012-13 Point Park University Factbook

Enrollment
School / Department / Student-TypeDept.of Humanities & Human Sciences (School of Arts & Sciences)
Regular UndergraduateFA08 FA09 FA10 FA11 FA12 Var. FA08 FA09 FA10 FA11 FA12 Var. FA08 FA09 FA10 FA11 FA12 Var.
Applied History 12 14 22 14 8 -6 7 6 6 4 3 -1 19 20 28 18 11 -7 New 4 3 5 2 1 -1 3 0 1 1 0 -1 7 3 6 3 1 -2 Returning 8 11 17 12 7 -5 4 6 5 3 3 0 12 17 22 15 10 -5Behavioral Sciences 14 19 18 14 20 6 12 13 18 17 16 -1 26 32 36 31 36 5 New 8 6 5 4 10 6 2 4 9 5 0 -5 10 10 14 9 10 1 Returning 6 13 13 10 10 0 10 9 9 12 16 4 16 22 22 22 26 4English 34 36 45 31 24 -7 3 5 2 7 5 -2 37 41 47 38 29 -9 New 12 16 20 14 5 -9 0 1 1 2 1 -1 12 17 21 16 6 -10 Returning 22 20 25 17 19 2 3 4 1 5 4 -1 25 24 26 22 23 1English/Creative Writing 0 0 5 22 23 1 0 0 0 2 1 -1 0 0 5 24 24 0 New 0 0 0 0 8 8 0 0 0 0 1 1 0 0 0 0 9 9 Returning 0 0 5 22 15 -7 0 0 0 2 0 -2 0 0 5 24 15 -9General Studies 3 1 1 0 0 0 7 2 0 0 0 0 10 3 1 0 0 0 New 0 0 1 0 0 0 6 0 0 0 0 0 6 0 1 0 0 0 Returning 3 1 0 0 0 0 1 2 0 0 0 0 4 3 0 0 0 0Global Cultural Studies 12 15 19 16 20 4 1 1 0 3 3 0 13 16 19 19 23 4 New 5 5 3 3 5 2 1 0 0 0 0 0 6 5 3 3 5 2 Returning 7 10 16 13 15 2 0 1 0 3 3 0 7 11 16 16 18 2History 0 0 0 0 3 3 0 0 0 0 0 0 0 0 0 0 3 3 New 0 0 0 0 3 3 0 0 0 0 0 0 0 0 0 0 3 3 Returning 0 0 0 0 0 0 0 0 0 0 0 0 0 0 0 0 0 0Interdisciplinary Design 0 1 4 5 3 -2 0 1 0 4 1 -3 0 2 4 9 4 -5 New 0 1 1 0 0 0 0 0 0 1 0 -1 0 1 1 1 0 -1 Returning 0 0 3 5 3 -2 0 1 0 3 1 -2 0 1 3 8 4 -4Legal Studies 0 0 0 6 7 1 0 0 0 2 6 4 0 0 0 8 13 5 New 0 0 0 3 2 -1 0 0 0 1 1 0 0 0 0 4 3 -1 Returning 0 0 0 3 5 2 0 0 0 1 5 4 0 0 0 4 10 6Legal Studies (Capstone) 15 15 19 7 4 -3 20 20 23 15 16 1 35 35 42 22 20 -2 New 9 7 6 2 2 0 8 6 7 6 6 0 17 13 13 8 8 0 Returning 6 8 13 5 2 -3 12 14 16 9 10 1 18 22 29 14 12 -2
Table 4.15. (Continued)
Full-time Part-time Total
2012-13 Point Park University Factbook * 49

Enrollment
School / Department / Student-TypeDept.of Humanities & Human Sciences (School of Arts & Sciences) (con't)
Regular Undergraduate (con't)FA08 FA09 FA10 FA11 FA12 Var. FA08 FA09 FA10 FA11 FA12 Var. FA08 FA09 FA10 FA11 FA12 Var.
Liberal Studies 1 6 10 9 8 -1 0 4 6 4 4 0 1 10 16 13 12 -1 New 1 6 5 4 4 0 0 2 4 1 1 0 1 8 9 5 5 0 Returning 0 0 5 5 4 -1 0 2 2 3 3 0 0 2 7 8 7 -1Liberal Studies (Capstone) 1 2 2 2 2 0 0 0 1 3 4 1 1 2 3 5 6 1 New 1 1 0 1 0 -1 0 0 1 0 3 3 1 1 1 1 3 2 Returning 0 1 2 1 2 1 0 0 0 3 1 -2 0 1 2 4 3 -1Political Science 19 18 18 15 8 -7 3 5 2 3 3 0 22 23 20 18 11 -7 New 8 7 4 4 0 -4 1 1 1 1 1 0 9 8 5 5 1 -4 Returning 11 11 14 11 8 -3 2 4 1 2 2 0 13 15 15 13 10 -3Psychology 69 89 94 87 90 3 23 28 29 26 17 -9 92 117 123 113 107 -6 New 24 35 33 23 26 3 3 8 4 4 3 -1 27 43 37 27 29 2 Returning 45 54 61 64 64 0 20 20 25 22 14 -8 65 74 86 86 78 -8
New 72 87 83 60 66 6 24 22 28 22 17 -5 96 109 111 82 83 1Returning 108 129 174 168 154 -14 52 63 59 68 62 -6 160 192 233 236 216 -20
Humanities & Human Sci - TOTAL 180 216 257 228 220 -8 76 85 87 90 79 -11 256 301 344 318 299 -19
Full-time Part-time Total
Table 4.15. (Continued)
50 * 2012-13 Point Park University Factbook

Enrollment
School / Department / Student-TypeDept.of Natural Sciences & Engineering Technology (School of Arts & Sciences)
Regular UndergraduateFA08 FA09 FA10 FA11 FA12 Var. FA08 FA09 FA10 FA11 FA12 Var. FA08 FA09 FA10 FA11 FA12 Var.
Allied Health 0 0 0 0 1 1 0 0 3 3 1 -2 0 0 3 3 2 -1 New 0 0 0 0 0 0 0 0 3 1 0 -1 0 0 3 1 0 -1 Returning 0 0 0 0 1 1 0 0 0 2 1 -1 0 0 0 2 2 0Biological Sciences 30 23 26 29 30 1 3 9 9 8 9 1 33 32 35 37 39 2 New 14 9 11 12 12 0 2 4 3 3 1 -2 16 13 14 15 13 -2 Returning 16 14 15 17 18 1 1 5 6 5 8 3 17 19 21 22 26 4Biotechnology 6 6 3 4 4 0 2 4 0 4 2 -2 8 10 3 8 6 -2 New 2 1 0 2 2 0 1 1 0 1 0 -1 3 2 0 3 2 -1 Returning 4 5 3 2 2 0 1 3 0 3 2 -1 5 8 3 5 4 -1Biotechnology (Capstone) 5 4 3 1 3 2 4 6 4 4 6 2 9 10 7 5 9 4 New 0 2 0 0 0 0 1 0 2 1 3 2 1 2 2 1 3 2 Returning 5 2 3 1 3 2 3 6 2 3 3 0 8 8 5 4 6 2Civil Eng Technology 19 21 21 25 23 -2 32 35 42 42 37 -5 51 56 63 67 60 -7 New 3 7 6 8 8 0 7 6 13 11 4 -7 10 13 19 19 12 -7 Returning 16 14 15 17 15 -2 25 29 29 31 33 2 41 43 44 48 48 0Electrical Eng Technology 22 23 24 23 29 6 63 71 71 70 74 4 85 94 95 93 103 10 New 9 11 8 12 13 1 12 22 18 16 13 -3 21 33 26 28 26 -2 Returning 13 12 16 11 16 5 51 49 53 54 61 7 64 61 69 65 77 12Env Health Sci and Protection 4 4 4 3 1 -2 0 0 1 1 0 -1 4 4 5 4 1 -3 New 1 1 3 0 1 1 0 0 1 0 0 0 1 1 4 0 1 1 Returning 3 3 1 3 0 -3 0 0 0 1 0 -1 3 3 1 4 0 -4Funeral Services 4 7 14 14 9 -5 1 1 0 2 0 -2 5 8 14 16 9 -7 New 4 5 11 10 5 -5 0 1 0 0 0 0 4 6 11 10 5 -5 Returning 0 2 3 4 4 0 1 0 0 2 0 -2 1 2 3 6 4 -2Funeral Services (Capstone) 6 10 6 6 7 1 2 0 4 2 1 -1 8 10 10 8 8 0 New 6 8 5 6 5 -1 0 0 2 1 1 0 6 8 7 7 6 -1 Returning 0 2 1 0 2 2 2 0 2 1 0 -1 2 2 3 1 2 1
Table 4.15. (Continued)
Full-time Part-time Total
2012-13 Point Park University Factbook * 51

Enrollment
School / Department / Student-TypeDept.of Natural Sciences & Engineering Technology (School of Arts & Sciences) (con't)
Regular Undergraduate (con't)FA08 FA09 FA10 FA11 FA12 Var. FA08 FA09 FA10 FA11 FA12 Var. FA08 FA09 FA10 FA11 FA12 Var.
Health Services 8 9 10 4 5 1 9 13 8 14 10 -4 17 22 18 18 15 -3 New 7 3 5 1 0 -1 3 2 2 1 3 2 10 5 7 2 3 1 Returning 1 6 5 3 5 2 6 11 6 13 7 -6 7 17 11 16 12 -4Mechanical Eng Technology 12 16 16 21 18 -3 39 36 34 34 33 -1 51 52 50 55 51 -4 New 9 7 3 8 5 -3 8 8 6 4 7 3 17 15 9 12 12 0 Returning 3 9 13 13 13 0 31 28 28 30 26 -4 34 37 41 43 39 -4Premedical & PreProfessional Studies 0 0 0 1 11 10 0 0 0 1 0 -1 0 0 0 2 11 9 New 0 0 0 1 7 6 0 0 0 1 0 -1 0 0 0 2 7 5 Returning 0 0 0 0 4 4 0 0 0 0 0 0 0 0 0 0 4 4
New 55 54 52 60 58 -2 34 44 50 40 32 -8 89 98 102 100 90 -10Returning 61 69 75 71 83 12 121 131 126 145 141 -4 182 200 201 216 224 8
Nat Sci & Engr Tech-Regular UG Total 116 123 127 131 141 10 155 175 176 185 173 -12 271 298 303 316 314 -2
GraduateFA08 FA09 FA10 FA11 FA12 Var. FA08 FA09 FA10 FA11 FA12 Var. FA08 FA09 FA10 FA11 FA12 Var.
Engineering Mgmt 1 4 3 7 5 -2 21 17 11 14 12 -2 22 21 14 21 17 -4 New 1 3 3 3 4 1 9 5 0 5 5 0 10 8 3 8 9 1 Returning 0 1 0 4 1 -3 12 12 11 9 7 -2 12 13 11 13 8 -5Environmental Studies 0 6 4 7 10 3 0 1 6 5 1 -4 0 7 10 12 11 -1 New 0 6 4 5 8 3 0 1 4 1 0 -1 0 7 8 6 8 2 Returning 0 0 0 2 2 0 0 0 2 4 1 -3 0 0 2 6 3 -3
New 1 9 7 8 12 4 9 6 4 6 5 -1 10 15 11 14 17 3Returning 0 1 0 6 3 -3 12 12 13 13 8 -5 12 13 13 19 11 -8
Nat Sci & Engr Tech-Graduate Total 1 10 7 14 15 1 21 18 17 19 13 -6 22 28 24 33 28 -5
FA08 FA09 FA10 FA11 FA12 Var. FA08 FA09 FA10 FA11 FA12 Var. FA08 FA09 FA10 FA11 FA12 Var.New 56 63 59 68 70 2 43 50 54 46 37 -9 99 113 113 114 107 -7
Returning 61 70 75 77 86 9 133 143 139 158 149 -9 194 213 214 235 235 0Natural Sciences & Engr Tech - TOTAL 117 133 134 145 156 11 176 193 193 204 186 -18 293 326 327 349 342 -7
Full-time Part-time Total
Full-time Part-time Total
Full-time Part-time Total
Table 4.15. (Continued)
52 * 2012-13 Point Park University Factbook

Enrollment
School / Department / Student-TypeMiscellaneous (within School of Arts & Sciences)
Regular UndergraduateFA08 FA09 FA10 FA11 FA12 Var. FA08 FA09 FA10 FA11 FA12 Var. FA08 FA09 FA10 FA11 FA12 Var.
NonDegree Program 0 0 0 0 0 0 85 21 15 14 18 4 85 21 15 14 18 4 New 0 0 0 0 0 0 60 15 12 10 17 7 60 15 12 10 17 7 Returning 0 0 0 0 0 0 25 6 3 4 1 -3 25 6 3 4 1 -3Undecided 75 73 66 52 60 8 10 15 11 6 4 -2 85 88 77 58 64 6 New 47 42 40 37 39 2 5 9 6 2 3 1 52 51 46 39 42 3 Returning 28 31 26 15 21 6 5 6 5 4 1 -3 33 37 31 19 22 3
New 47 42 40 37 39 2 65 24 18 12 20 8 112 66 58 49 59 10Returning 28 31 26 15 21 6 30 12 8 8 2 -6 58 43 34 23 23 0
Miscellaneous-Regular UG Total 75 73 66 52 60 8 95 36 26 20 22 2 170 109 92 72 82 10
Accelerated UndergraduateFA08 FA09 FA10 FA11 FA12 Var. FA08 FA09 FA10 FA11 FA12 Var. FA08 FA09 FA10 FA11 FA12 Var.
Undecided/Pathways Program 12 11 6 7 0 -7 11 3 6 12 4 -8 23 14 12 19 4 -15 New 6 3 3 7 0 -7 5 2 3 4 0 -4 11 5 6 11 0 -11 Returning 6 8 3 0 0 0 6 1 3 8 4 -4 12 9 6 8 4 -4
New 6 3 3 7 0 -7 5 2 3 4 0 -4 11 5 6 11 0 -11Returning 6 8 3 0 0 0 6 1 3 8 4 -4 12 9 6 8 4 -4
Miscellaneous-Accel UG Total 12 11 6 7 0 -7 11 3 6 12 4 -8 23 14 12 19 4 -15
Full-time Part-time Total
Full-time Part-time Total
Table 4.15. (Continued)
2012-13 Point Park University Factbook * 53

Enrollment
School / Department / Student-TypeMiscellaneous (within School of Arts & Sciences) (con't)
GraduateFA08 FA09 FA10 FA11 FA12 Var. FA08 FA09 FA10 FA11 FA12 Var. FA08 FA09 FA10 FA11 FA12 Var.
Non-Degree Program/Masters 0 0 0 0 0 0 2 4 3 1 2 1 2 4 3 1 2 1 New 0 0 0 0 0 0 2 4 3 1 2 1 2 4 3 1 2 1 Returning 0 0 0 0 0 0 0 0 0 0 0 0 0 0 0 0 0 0
New 0 0 0 0 0 0 2 4 3 1 2 1 2 4 3 1 2 1Returning 0 0 0 0 0 0 0 0 0 0 0 0 0 0 0 0 0 0
Miscellaneous-Graduate Total 0 0 0 0 0 0 2 4 3 1 2 1 2 4 3 1 2 1
FA08 FA09 FA10 FA11 FA12 Var. FA08 FA09 FA10 FA11 FA12 Var. FA08 FA09 FA10 FA11 FA12 Var.New 53 45 43 44 39 -5 72 30 24 17 22 5 125 75 67 61 61 0
Returning 34 39 29 15 21 6 36 13 11 16 6 -10 70 52 40 31 27 -4Miscellaneous - TOTAL 87 84 72 59 60 1 108 43 35 33 28 -5 195 127 107 92 88 -4
FA08 FA09 FA10 FA11 FA12 Var. FA08 FA09 FA10 FA11 FA12 Var. FA08 FA09 FA10 FA11 FA12 Var.New 319 340 332 322 306 -16 238 191 191 157 139 -18 557 531 523 479 445 -34
Returning 496 512 575 535 538 3 334 380 390 381 326 -55 830 892 965 916 864 -52SCHOOL OF ARTS & SCIENCES - TOTAL 815 852 907 857 844 -13 572 571 581 538 465 -73 1387 1423 1488 1395 1309 -86
Table 4.15. (Continued)
Full-time Part-time Total
Full-time Part-time Total
Full-time Part-time Total
54 * 2012-13 Point Park University Factbook

Enrollment
School / Department / Student-TypeDept. of Accounting, Finance & Economics, Information Technology (School of Business)
Regular UndergraduateFA08 FA09 FA10 FA11 FA12 Var. FA08 FA09 FA10 FA11 FA12 Var. FA08 FA09 FA10 FA11 FA12 Var.
Accounting 38 40 39 39 37 -2 46 49 43 32 37 5 84 89 82 71 74 3 New 11 15 11 17 11 -6 15 16 10 6 13 7 26 31 21 23 24 1 Returning 27 25 28 22 26 4 31 33 33 26 24 -2 58 58 61 48 50 2Economics and Finance 9 8 9 12 11 -1 4 6 9 5 3 -2 13 14 18 17 14 -3 New 5 2 3 3 4 1 3 4 3 1 1 0 8 6 6 4 5 1 Returning 4 6 6 9 7 -2 1 2 6 4 2 -2 5 8 12 13 9 -4Information Technology 12 21 26 30 16 -14 18 18 20 24 19 -5 30 39 46 54 35 -19 New 4 10 12 13 4 -9 6 9 4 9 4 -5 10 19 16 22 8 -14 Returning 8 11 14 17 12 -5 12 9 16 15 15 0 20 20 30 32 27 -5
New 20 27 26 33 19 -14 24 29 17 16 18 2 44 56 43 49 37 -12Returning 39 42 48 48 45 -3 44 44 55 45 41 -4 83 86 103 93 86 -7
Acct,Fin/Econ,InfoTch-Regular UG Total 59 69 74 81 64 -17 68 73 72 61 59 -2 127 142 146 142 123 -19
Accelerated UndergraduateFA08 FA09 FA10 FA11 FA12 Var. FA08 FA09 FA10 FA11 FA12 Var. FA08 FA09 FA10 FA11 FA12 Var.
Accel Inf Tech and Mgmt 60 45 58 45 33 -12 12 9 3 2 4 2 72 54 61 47 37 -10 New 20 23 27 19 17 -2 4 1 0 0 1 1 24 24 27 19 18 -1 Returning 40 22 31 26 16 -10 8 8 3 2 3 1 48 30 34 28 19 -9
New 20 23 27 19 17 -2 4 1 0 0 1 1 24 24 27 19 18 -1Returning 40 22 31 26 16 -10 8 8 3 2 3 1 48 30 34 28 19 -9
Acct,Fin/Econ,InfoTch-Accel UG Total 60 45 58 45 33 -12 12 9 3 2 4 2 72 54 61 47 37 -10
FA08 FA09 FA10 FA11 FA12 Var. FA08 FA09 FA10 FA11 FA12 Var. FA08 FA09 FA10 FA11 FA12 Var.New 40 50 53 52 36 -16 28 30 17 16 19 3 68 80 70 68 55 -13
Returning 79 64 79 74 61 -13 52 52 58 47 44 -3 131 116 137 121 105 -16Acct,Fin/Econ,InfoTech - TOTAL 119 114 132 126 97 -29 80 82 75 63 63 0 199 196 207 189 160 -29
Full-time Part-time Total
Full-time Part-time Total
Table 4.15. (Continued)
Full-time Part-time Total
2012-13 Point Park University Factbook * 55

Enrollment
School / Department / Student-TypeDept. of Global Management & Organization (School of Business)
GraduateFA08 FA09 FA10 FA11 FA12 Var. FA08 FA09 FA10 FA11 FA12 Var. FA08 FA09 FA10 FA11 FA12 Var.
Master of Business Administration 116 143 111 102 98 -4 182 184 219 200 234 34 298 327 330 302 332 30 New 57 82 73 62 52 -10 73 81 65 68 88 20 130 163 138 130 140 10 Returning 59 61 38 40 46 6 109 103 154 132 146 14 168 164 192 172 192 20Organizational Leadership-GR 17 8 10 8 9 1 26 52 53 40 29 -11 43 60 63 48 38 -10 New 12 3 5 6 4 -2 10 30 23 10 8 -2 22 33 28 16 12 -4 Returning 5 5 5 2 5 3 16 22 30 30 21 -9 21 27 35 32 26 -6
New 69 85 78 68 56 -12 83 111 88 78 96 18 152 196 166 146 152 6Returning 64 66 43 42 51 9 125 125 184 162 167 5 189 191 227 204 218 14
Global Mgt & Organization - TOTAL 133 151 121 110 107 -3 208 236 272 240 263 23 341 387 393 350 370 20
Full-time Part-time Total
Table 4.15. (Continued)
56 * 2012-13 Point Park University Factbook

Enrollment
School / Department / Student-TypeDept. of Management (School of Business)
Regular UndergraduateFA08 FA09 FA10 FA11 FA12 Var. FA08 FA09 FA10 FA11 FA12 Var. FA08 FA09 FA10 FA11 FA12 Var.
Business Mgmt 107 107 99 112 104 -8 30 32 29 31 34 3 137 139 128 143 138 -5 New 50 48 24 43 36 -7 11 10 9 9 11 2 61 58 33 52 47 -5 Returning 57 59 75 69 68 -1 19 22 20 22 23 1 76 81 95 91 91 0Human Resources Mgmt 5 6 8 7 8 1 7 9 8 8 10 2 12 15 16 15 18 3 New 3 3 2 4 4 0 5 1 2 1 5 4 8 4 4 5 9 4 Returning 2 3 6 3 4 1 2 8 6 7 5 -2 4 11 12 10 9 -1Human Resources Mgmt (Capstone) 6 5 10 7 11 4 15 19 23 20 21 1 21 24 33 27 32 5 New 3 2 6 2 5 3 1 6 3 5 7 2 4 8 9 7 12 5 Returning 3 3 4 5 6 1 14 13 20 15 14 -1 17 16 24 20 20 0Leadership & Public Service 0 7 5 1 0 -1 0 4 8 4 1 -3 0 11 13 5 1 -4 New 0 7 3 0 0 0 0 4 1 1 0 -1 0 11 4 1 0 -1 Returning 0 0 2 1 0 -1 0 0 7 3 1 -2 0 0 9 4 1 -3Management Services 4 5 3 5 5 0 10 13 7 8 9 1 14 18 10 13 14 1 New 0 1 0 2 0 -2 3 3 0 0 0 0 3 4 0 2 0 -2 Returning 4 4 3 3 5 2 7 10 7 8 9 1 11 14 10 11 14 3Public Administration - Cert. 0 0 0 0 0 0 0 0 0 1 0 -1 0 0 0 1 0 -1 New 0 0 0 0 0 0 0 0 0 1 0 -1 0 0 0 1 0 -1 Returning 0 0 0 0 0 0 0 0 0 0 0 0 0 0 0 0 0 0Public Administration 3 3 1 3 2 -1 22 11 12 12 7 -5 25 14 13 15 9 -6 New 1 0 0 0 1 1 3 2 4 3 2 -1 4 2 4 3 3 0 Returning 2 3 1 3 1 -2 19 9 8 9 5 -4 21 12 9 12 6 -6Sport, Arts and Entertainment 122 144 149 195 215 20 7 11 8 8 11 3 129 155 157 203 226 23 New 26 43 43 66 70 4 2 4 4 3 2 -1 28 47 47 69 72 3 Returning 96 101 106 129 145 16 5 7 4 5 9 4 101 108 110 134 154 20
New 83 104 78 117 116 -1 25 30 23 23 27 4 108 134 101 140 143 3Returning 164 173 197 213 229 16 66 69 72 69 66 -3 230 242 269 282 295 13
Management-Regular UG Total 247 277 275 330 345 15 91 99 95 92 93 1 338 376 370 422 438 16
Full-time Part-time Total
Table 4.15. (Continued)
2012-13 Point Park University Factbook * 57

Enrollment
School / Department / Student-TypeDept. of Management (School of Business) (con't)
Accelerated UndergraduateFA08 FA09 FA10 FA11 FA12 Var. FA08 FA09 FA10 FA11 FA12 Var. FA08 FA09 FA10 FA11 FA12 Var.
Accel Professional Studies 26 11 0 1 0 -1 33 18 10 1 0 -1 59 29 10 2 0 -2 New 14 0 0 0 0 0 9 0 1 0 0 0 23 0 1 0 0 0 Returning 12 11 0 1 0 -1 24 18 9 1 0 -1 36 29 9 2 0 -2Business-Accelerated 122 117 98 96 79 -17 15 20 14 6 5 -1 137 137 112 102 84 -18 New 41 44 29 35 23 -12 7 4 2 1 1 0 48 48 31 36 24 -12 Returning 81 73 69 61 56 -5 8 16 12 5 4 -1 89 89 81 66 60 -6Organizational Leadership 0 14 24 19 10 -9 0 5 7 7 17 10 0 19 31 26 27 1 New 0 9 10 8 3 -5 0 5 1 1 7 6 0 14 11 9 10 1 Returning 0 5 14 11 7 -4 0 0 6 6 10 4 0 5 20 17 17 0Public Administration (Capstone) 0 0 0 0 3 3 0 0 0 0 6 6 0 0 0 0 9 9 New 0 0 0 0 3 3 0 0 0 0 6 6 0 0 0 0 9 9 Returning 0 0 0 0 0 0 0 0 0 0 0 0 0 0 0 0 0 0
New 55 53 39 43 29 -14 16 9 4 2 14 12 71 62 43 45 43 -2Returning 93 89 83 73 63 -10 32 34 27 12 14 2 125 123 110 85 77 -8
Management-Accel UG Total 148 142 122 116 92 -24 48 43 31 14 28 14 196 185 153 130 120 -10
FA08 FA09 FA10 FA11 FA12 Var. FA08 FA09 FA10 FA11 FA12 Var. FA08 FA09 FA10 FA11 FA12 Var.New 138 157 117 160 145 -15 41 39 27 25 41 16 179 196 144 185 186 1
Returning 257 262 280 286 292 6 98 103 99 81 80 -1 355 365 379 367 372 5Management - TOTAL 395 419 397 446 437 -9 139 142 126 106 121 15 534 561 523 552 558 6
FA08 FA09 FA10 FA11 FA12 Var. FA08 FA09 FA10 FA11 FA12 Var. FA08 FA09 FA10 FA11 FA12 Var.New 247 292 248 280 237 -43 152 180 132 119 156 37 399 472 380 399 393 -6
Returning 400 392 402 402 404 2 275 280 341 290 291 1 675 672 743 692 695 3SCHOOL OF BUSINESS - TOTAL 647 684 650 682 641 -41 427 460 473 409 447 38 1074 1144 1123 1091 1088 -3
Table 4.15. (Continued)
Full-time Part-time Total
Full-time Part-time Total
Full-time Part-time Total
58 * 2012-13 Point Park University Factbook

Enrollment
School / Department / Student-TypeSchool of Communication
Regular UndergraduateFA08 FA09 FA10 FA11 FA12 Var. FA08 FA09 FA10 FA11 FA12 Var. FA08 FA09 FA10 FA11 FA12 Var.
Advertising 0 0 0 13 9 -4 0 0 0 0 0 0 0 0 0 13 9 -4 New 0 0 0 9 0 -9 0 0 0 0 0 0 0 0 0 9 0 -9 Returning 0 0 0 4 9 5 0 0 0 0 0 0 0 0 0 4 9 5Advertising and PR 89 104 93 57 25 -32 2 1 3 1 3 2 91 105 96 58 28 -30 New 26 30 22 0 0 0 0 0 0 0 0 0 26 30 22 0 0 0 Returning 63 74 71 57 25 -32 2 1 3 1 3 2 65 75 74 58 28 -30Broadcast Production & Programming 0 0 0 11 26 15 0 0 0 1 2 1 0 0 0 12 28 16 New 0 0 0 10 11 1 0 0 0 1 1 0 0 0 0 11 12 1 Returning 0 0 0 1 15 14 0 0 0 0 1 1 0 0 0 1 16 15Broadcasting - On Camera 0 0 0 31 28 -3 0 0 0 1 1 0 0 0 0 32 29 -3 New 0 0 0 30 0 -30 0 0 0 1 0 -1 0 0 0 31 0 -31 Returning 0 0 0 1 28 27 0 0 0 0 1 1 0 0 0 1 29 28Broadcasting - Radio/TV 0 0 0 0 0 0 0 0 0 1 1 0 0 0 0 1 1 0 New 0 0 0 0 0 0 0 0 0 0 0 0 0 0 0 0 0 0 Returning 0 0 0 0 0 0 0 0 0 1 1 0 0 0 0 1 1 0Broadcasting 127 129 120 71 34 -37 4 7 8 7 6 -1 131 136 128 78 40 -38 New 40 38 38 0 0 0 3 1 4 0 0 0 43 39 42 0 0 0 Returning 87 91 82 71 34 -37 1 6 4 7 6 -1 88 97 86 78 40 -38Broadcasting Reporting 0 0 0 0 29 29 0 0 0 0 0 0 0 0 0 0 29 29 New 0 0 0 0 28 28 0 0 0 0 0 0 0 0 0 0 28 28 Returning 0 0 0 0 1 1 0 0 0 0 0 0 0 0 0 0 1 1Digital Media 0 5 11 6 3 -3 0 2 2 1 1 0 0 7 13 7 4 -3 New 0 1 0 0 0 0 0 2 0 0 0 0 0 3 0 0 0 0 Returning 0 4 11 6 3 -3 0 0 2 1 1 0 0 4 13 7 4 -3
Table 4.15. (Continued)
Full-time Part-time Total
2012-13 Point Park University Factbook * 59

Enrollment
School / Department / Student-TypeSchool of Communication (con't)
Regular Undergraduate (con't)FA08 FA09 FA10 FA11 FA12 Var. FA08 FA09 FA10 FA11 FA12 Var. FA08 FA09 FA10 FA11 FA12 Var.
Journalism 0 0 0 29 52 23 0 0 0 1 0 -1 0 0 0 30 52 22 New 0 0 0 23 31 8 0 0 0 0 0 0 0 0 0 23 31 8 Returning 0 0 0 6 21 15 0 0 0 1 0 -1 0 0 0 7 21 14Jour and Mass Communication 96 103 93 40 19 -21 5 7 8 5 5 0 101 110 101 45 24 -21 New 46 62 44 0 0 0 1 4 3 0 2 2 47 66 47 0 2 2 Returning 50 41 49 40 19 -21 4 3 5 5 3 -2 54 44 54 45 22 -23Journalism/Photojournalism 63 48 55 30 14 -16 2 2 0 0 0 0 65 50 55 30 14 -16 New 24 17 23 1 0 -1 0 1 0 0 0 0 24 18 23 1 0 -1 Returning 39 31 32 29 14 -15 2 1 0 0 0 0 41 32 32 29 14 -15Mass Communication 23 16 9 23 29 6 1 1 1 2 3 1 24 17 10 25 32 7 New 13 0 0 17 15 -2 1 0 0 1 1 0 14 0 0 18 16 -2 Returning 10 16 9 6 14 8 0 1 1 1 2 1 10 17 10 7 16 9Multimedia 0 0 8 20 31 11 0 0 1 0 0 0 0 0 9 20 31 11 New 0 0 7 7 12 5 0 0 1 0 0 0 0 0 8 7 12 5 Returning 0 0 1 13 19 6 0 0 0 0 0 0 0 0 1 13 19 6Photography(BFA) 48 54 57 53 48 -5 5 4 6 5 5 0 53 58 63 58 53 -5 New 18 21 23 17 17 0 1 0 2 1 2 1 19 21 25 18 19 1 Returning 30 33 34 36 31 -5 4 4 4 4 3 -1 34 37 38 40 34 -6Photojournalism 0 0 0 10 19 9 0 0 0 0 1 1 0 0 0 10 20 10 New 0 0 0 7 10 3 0 0 0 0 0 0 0 0 0 7 10 3 Returning 0 0 0 3 9 6 0 0 0 0 1 1 0 0 0 3 10 7Public Relations 0 0 0 29 29 0 0 0 0 1 1 0 0 0 0 30 30 0 New 0 0 0 22 0 -22 0 0 0 0 0 0 0 0 0 22 0 -22 Returning 0 0 0 7 29 22 0 0 0 1 1 0 0 0 0 8 30 22Public Relations and Advertising 0 0 0 0 17 17 0 0 0 0 0 0 0 0 0 0 17 17 New 0 0 0 0 15 15 0 0 0 0 0 0 0 0 0 0 15 15 Returning 0 0 0 0 2 2 0 0 0 0 0 0 0 0 0 0 2 2
New 167 169 157 143 139 -4 6 8 10 4 6 2 173 177 167 147 145 -2Returning 279 290 289 280 273 -7 13 16 19 22 23 1 292 306 308 302 296 -6
Communication-Regular UG Total 446 459 446 423 412 -11 19 24 29 26 29 3 465 483 475 449 441 -8
Table 4.15. (Continued)
Full-time Part-time Total
60 * 2012-13 Point Park University Factbook

Enrollment
School / Department / Student-TypeSchool of Communication (con't)
Accelerated UndergraduateFA08 FA09 FA10 FA11 FA12 Var. FA08 FA09 FA10 FA11 FA12 Var. FA08 FA09 FA10 FA11 FA12 Var.
Applied Corp Communications 0 0 0 0 0 0 1 0 0 0 0 0 1 0 0 0 0 0 New 0 0 0 0 0 0 0 0 0 0 0 0 0 0 0 0 0 0 Returning 0 0 0 0 0 0 1 0 0 0 0 0 1 0 0 0 0 0Integrated Marketing Communications 32 27 18 11 15 4 5 3 3 2 0 -2 37 30 21 13 15 2 New 14 8 7 6 12 6 3 1 0 1 0 -1 17 9 7 7 12 5 Returning 18 19 11 5 3 -2 2 2 3 1 0 -1 20 21 14 6 3 -3
New 14 8 7 6 12 6 3 1 0 1 0 -1 17 9 7 7 12 5Returning 18 19 11 5 3 -2 3 2 3 1 0 -1 21 21 14 6 3 -3
Communication-Accel UG Total 32 27 18 11 15 4 6 3 3 2 0 -2 38 30 21 13 15 2
GraduateFA08 FA09 FA10 FA11 FA12 Var. FA08 FA09 FA10 FA11 FA12 Var. FA08 FA09 FA10 FA11 FA12 Var.
Journalism and Comm/Masters 35 28 31 38 34 -4 47 33 33 29 18 -11 82 61 64 67 52 -15 New 18 12 22 19 21 2 18 5 10 15 9 -6 36 17 32 34 30 -4 Returning 17 16 9 19 13 -6 29 28 23 14 9 -5 46 44 32 33 22 -11Journalism & Comm/MBA (concurrent) 0 0 0 0 19 19 0 0 0 0 18 18 0 0 0 0 37 37 New 0 0 0 0 8 8 0 0 0 0 4 4 0 0 0 0 12 12 Returning 0 0 0 0 11 11 0 0 0 0 14 14 0 0 0 0 25 25
New 18 12 22 19 29 10 18 5 10 15 13 -2 36 17 32 34 42 8Returning 17 16 9 19 24 5 29 28 23 14 23 9 46 44 32 33 47 14
Communication-Graduate Total 35 28 31 38 53 15 47 33 33 29 36 7 82 61 64 67 89 22
FA08 FA09 FA10 FA11 FA12 Var. FA08 FA09 FA10 FA11 FA12 Var. FA08 FA09 FA10 FA11 FA12 Var.New 199 189 186 168 180 12 27 14 20 20 19 -1 226 203 206 188 199 11
Returning 314 325 309 304 300 -4 45 46 45 37 46 9 359 371 354 341 346 5SCHOOL OF COMMUNICATION - TOTAL 513 514 495 472 480 8 72 60 65 57 65 8 585 574 560 529 545 16
Table 4.15. (Continued)
Full-time Part-time Total
Full-time Part-time Total
Full-time Part-time Total
2012-13 Point Park University Factbook * 61

Enrollment
School / Department / Student-TypeCinema & Digital Arts (Conservatory of Performing Arts)
Regular UndergraduateFA08 FA09 FA10 FA11 FA12 Var. FA08 FA09 FA10 FA11 FA12 Var. FA08 FA09 FA10 FA11 FA12 Var.
Cinema and Digital Arts 184 185 195 142 84 -58 0 8 8 8 3 -5 184 193 203 150 87 -63 New 61 61 58 0 2 2 0 0 1 0 0 0 61 61 59 0 2 2 Returning 123 124 137 142 82 -60 0 8 7 8 3 -5 123 132 144 150 85 -65Cinema Production 0 0 0 66 111 45 0 0 0 0 0 0 0 0 0 66 111 45 New 0 0 0 63 60 -3 0 0 0 0 0 0 0 0 0 63 60 -3 Returning 0 0 0 3 51 48 0 0 0 0 0 0 0 0 0 3 51 48Digital Arts 0 0 0 9 15 6 0 0 0 0 1 1 0 0 0 9 16 7 New 0 0 0 9 11 2 0 0 0 0 1 1 0 0 0 9 12 3 Returning 0 0 0 0 4 4 0 0 0 0 0 0 0 0 0 0 4 4Film and Video Prd 18 12 4 0 0 0 5 3 1 1 0 -1 23 15 5 1 0 -1 New 2 0 0 0 0 0 1 0 0 0 0 0 3 0 0 0 0 0 Returning 16 12 4 0 0 0 4 3 1 1 0 -1 20 15 5 1 0 -1Screenwriting 0 14 23 29 33 4 0 0 0 0 3 3 0 14 23 29 36 7 New 0 12 15 13 10 -3 0 0 0 0 0 0 0 12 15 13 10 -3 Returning 0 2 8 16 23 7 0 0 0 0 3 3 0 2 8 16 26 10
New 63 73 73 85 83 -2 1 0 1 0 1 1 64 73 74 85 84 -1Returning 139 138 149 161 160 -1 4 11 8 9 6 -3 143 149 157 170 166 -4
Cinema&Digital Arts - TOTAL 202 211 222 246 243 -3 5 11 9 9 7 -2 207 222 231 255 250 -5
Full-time Part-time Total
Table 4.15. (Continued)
62 * 2012-13 Point Park University Factbook
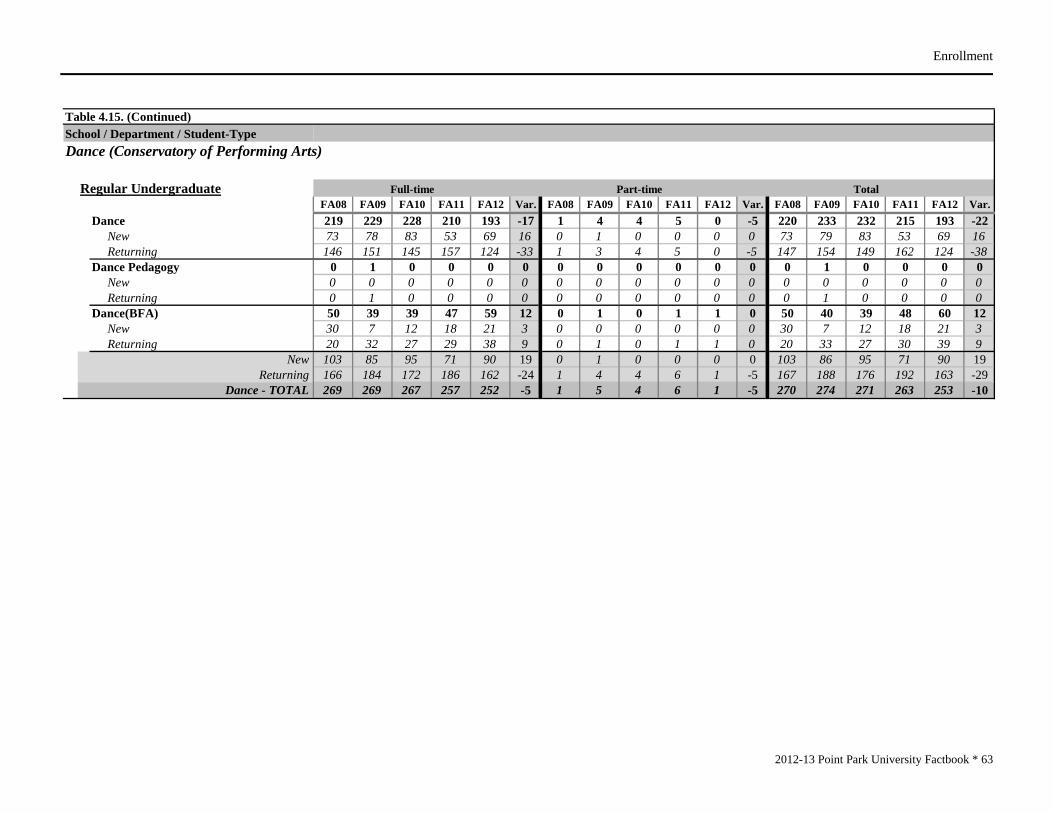
Enrollment
School / Department / Student-TypeDance (Conservatory of Performing Arts)
Regular UndergraduateFA08 FA09 FA10 FA11 FA12 Var. FA08 FA09 FA10 FA11 FA12 Var. FA08 FA09 FA10 FA11 FA12 Var.
Dance 219 229 228 210 193 -17 1 4 4 5 0 -5 220 233 232 215 193 -22 New 73 78 83 53 69 16 0 1 0 0 0 0 73 79 83 53 69 16 Returning 146 151 145 157 124 -33 1 3 4 5 0 -5 147 154 149 162 124 -38Dance Pedagogy 0 1 0 0 0 0 0 0 0 0 0 0 0 1 0 0 0 0 New 0 0 0 0 0 0 0 0 0 0 0 0 0 0 0 0 0 0 Returning 0 1 0 0 0 0 0 0 0 0 0 0 0 1 0 0 0 0Dance(BFA) 50 39 39 47 59 12 0 1 0 1 1 0 50 40 39 48 60 12 New 30 7 12 18 21 3 0 0 0 0 0 0 30 7 12 18 21 3 Returning 20 32 27 29 38 9 0 1 0 1 1 0 20 33 27 30 39 9
New 103 85 95 71 90 19 0 1 0 0 0 0 103 86 95 71 90 19Returning 166 184 172 186 162 -24 1 4 4 6 1 -5 167 188 176 192 163 -29
Dance - TOTAL 269 269 267 257 252 -5 1 5 4 6 1 -5 270 274 271 263 253 -10
Full-time Part-time Total
Table 4.15. (Continued)
2012-13 Point Park University Factbook * 63

Enrollment
School / Department / Student-TypeTheatre (Conservatory of Performing Arts)
Regular UndergraduateFA08 FA09 FA10 FA11 FA12 Var. FA08 FA09 FA10 FA11 FA12 Var. FA08 FA09 FA10 FA11 FA12 Var.
Applied Arts 1 0 0 1 1 0 0 1 2 0 0 0 1 1 2 1 1 0 New 0 0 0 0 0 0 0 0 0 0 0 0 0 0 0 0 0 0 Returning 1 0 0 1 1 0 0 1 2 0 0 0 1 1 2 1 1 0Theatre Arts 253 227 248 244 220 -24 4 3 2 3 6 3 257 230 250 247 226 -21 New 79 89 96 70 77 7 0 2 2 1 0 -1 79 91 98 71 77 6 Returning 174 138 152 174 143 -31 4 1 0 2 6 4 178 139 152 176 149 -27Theatre Arts(BFA) 59 72 80 75 81 6 0 0 2 1 1 0 59 72 82 76 82 6 New 24 12 16 19 16 -3 0 0 0 0 0 0 24 12 16 19 16 -3 Returning 35 60 64 56 65 9 0 0 2 1 1 0 35 60 66 57 66 9
New 103 101 112 89 93 4 0 2 2 1 0 -1 103 103 114 90 93 3Returning 210 198 216 231 209 -22 4 2 4 3 7 4 214 200 220 234 216 -18
Theatre-Regular UG Total 313 299 328 320 302 -18 4 4 6 4 7 3 317 303 334 324 309 -15
Full-time Part-time Total
Table 4.15. (Continued)
64 * 2012-13 Point Park University Factbook

Enrollment
School / Department / Student-TypeTheatre (Conservatory of Performing Arts) (con't)
GraduateFA08 FA09 FA10 FA11 FA12 Var. FA08 FA09 FA10 FA11 FA12 Var. FA08 FA09 FA10 FA11 FA12 Var.
MFA in Acting 6 6 6 6 5 -1 0 0 0 0 0 0 6 6 6 6 5 -1 New 6 0 0 6 0 -6 0 0 0 0 0 0 6 0 0 6 0 -6 Returning 0 6 6 0 5 5 0 0 0 0 0 0 0 6 6 0 5 5
New 6 0 0 6 0 -6 0 0 0 0 0 0 6 0 0 6 0 -6Returning 0 6 6 0 5 5 0 0 0 0 0 0 0 6 6 0 5 5
Theatre-Graduate Total 6 6 6 6 5 -1 0 0 0 0 0 0 6 6 6 6 5 -1
FA08 FA09 FA10 FA11 FA12 Var. FA08 FA09 FA10 FA11 FA12 Var. FA08 FA09 FA10 FA11 FA12 Var.New 109 101 112 95 93 -2 0 2 2 1 0 -1 109 103 114 96 93 -3
Returning 210 204 222 231 214 -17 4 2 4 3 7 4 214 206 226 234 221 -13Theatre - TOTAL 319 305 334 326 307 -19 4 4 6 4 7 3 323 309 340 330 314 -16
FA08 FA09 FA10 FA11 FA12 Var. FA08 FA09 FA10 FA11 FA12 Var. FA08 FA09 FA10 FA11 FA12 Var.New 275 259 280 251 266 15 1 3 3 1 1 0 276 262 283 252 267 15
Returning 515 526 543 578 536 -42 9 17 16 18 14 -4 524 543 559 596 550 -46CONSERV. PERFORMING ARTS - TOTAL 790 785 823 829 802 -27 10 20 19 19 15 -4 800 805 842 848 817 -31
Full-time Part-time Total
Full-time Part-time Total
Full-time Part-time Total
Table 4.15. (Continued)
2012-13 Point Park University Factbook * 65
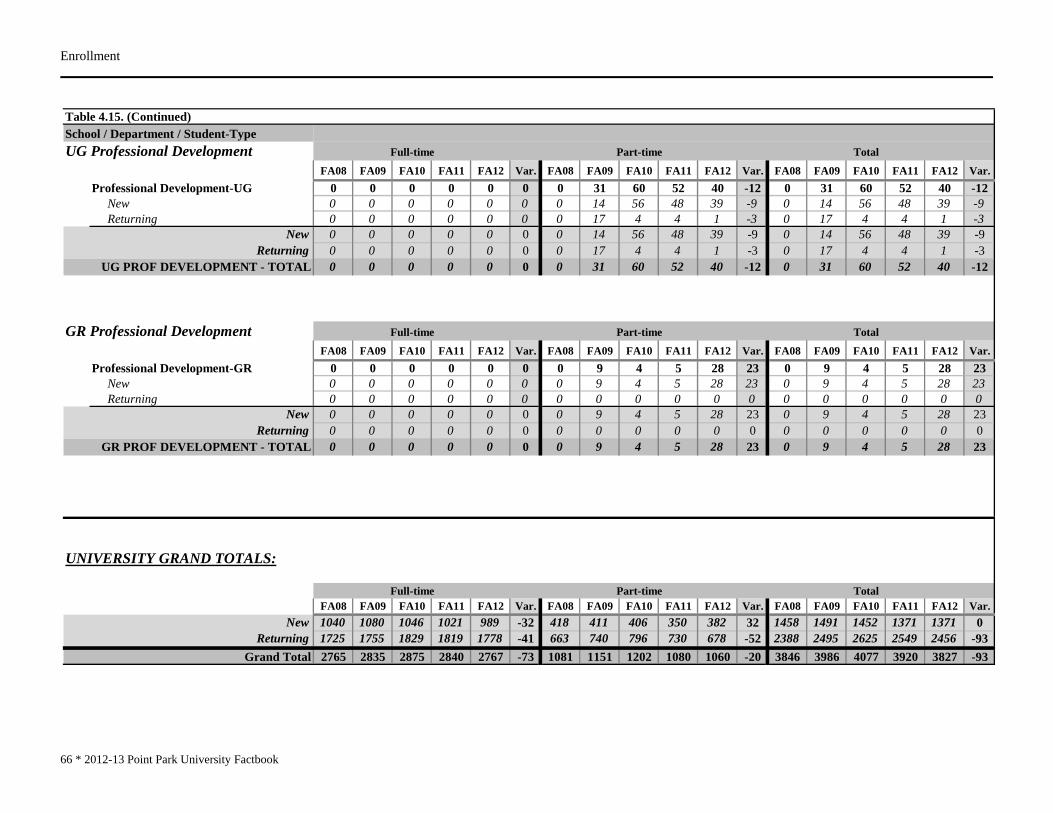
Enrollment
66 * 2012-13 Point Park University Factbook
School / Department / Student-TypeUG Professional Development
FA08 FA09 FA10 FA11 FA12 Var. FA08 FA09 FA10 FA11 FA12 Var. FA08 FA09 FA10 FA11 FA12 Var.Professional Development-UG 0 0 0 0 0 0 0 31 60 52 40 -12 0 31 60 52 40 -12 New 0 0 0 0 0 0 0 14 56 48 39 -9 0 14 56 48 39 -9 Returning 0 0 0 0 0 0 0 17 4 4 1 -3 0 17 4 4 1 -3
New 0 0 0 0 0 0 0 14 56 48 39 -9 0 14 56 48 39 -9Returning 0 0 0 0 0 0 0 17 4 4 1 -3 0 17 4 4 1 -3
UG PROF DEVELOPMENT - TOTAL 0 0 0 0 0 0 0 31 60 52 40 -12 0 31 60 52 40 -12
GR Professional DevelopmentFA08 FA09 FA10 FA11 FA12 Var. FA08 FA09 FA10 FA11 FA12 Var. FA08 FA09 FA10 FA11 FA12 Var.
Professional Development-GR 0 0 0 0 0 0 0 9 4 5 28 23 0 9 4 5 28 23 New 0 0 0 0 0 0 0 9 4 5 28 23 0 9 4 5 28 23 Returning 0 0 0 0 0 0 0 0 0 0 0 0 0 0 0 0 0 0
New 0 0 0 0 0 0 0 9 4 5 28 23 0 9 4 5 28 23Returning 0 0 0 0 0 0 0 0 0 0 0 0 0 0 0 0 0 0
GR PROF DEVELOPMENT - TOTAL 0 0 0 0 0 0 0 9 4 5 28 23 0 9 4 5 28 23
UNIVERSITY GRAND TOTALS:
FA08 FA09 FA10 FA11 FA12 Var. FA08 FA09 FA10 FA11 FA12 Var. FA08 FA09 FA10 FA11 FA12 Var.New 1040 1080 1046 1021 989 -32 418 411 406 350 382 32 1458 1491 1452 1371 1371 0
Returning 1725 1755 1829 1819 1778 -41 663 740 796 730 678 -52 2388 2495 2625 2549 2456 -93Grand Total 2765 2835 2875 2840 2767 -73 1081 1151 1202 1080 1060 -20 3846 3986 4077 3920 3827 -93
Full-time Part-time Total
Full-time Part-time Total
Table 4.15. (Continued)
Full-time Part-time Total

Enrollment
Table 4.16. Student Enrollment by School/Department/Major and Demographics, Fall 2012
Am.Indian/ Black or Hispanic NatHawaiian Non-res Two or more Un- Total Male Female Alaska Nat. Asian Afri.Am. of any race /Pacific Isl. Alien White races known
School of Arts & SciencesDept. of Criminal Justice & Intel. Studies
Accelerated Criminal Justice 98 25 73 1 59 1 1 30 6Criminal Justice 53 33 20 13 5 30 5Criminal Justice - Capstone 38 12 26 22 1 15Criminal Justice Administration 28 11 17 1 14 1 12Forensic Science 35 5 30 7 2 24 2Intelligence and National Security 83 55 28 5 4 70 4Intelligence and National Security (Cert) 1 1 1
Dept. of EducationBiological Sciences Secondary Educ 1 1 1Citizenship Sec Ed - Undeclared 5 3 2 1 4Citizenship/Secondary Education 3 2 1 1 2Curriculum and Instruction 14 3 11 3 10 1Early Childhood Ed - Undeclared 2 1 1 1 1Early Childhood Education 13 13 5 7 1Educational Administration 4 3 1 1 3Elementary Education 18 3 15 3 15English Sec Ed - Undeclared 18 12 6 1 2 1 14English/Secondary Education 2 2 2English Sec Educ/Spec Educ 7-12 1 1 1ESL Program Specialist 2 2 1 1Instructional Studies 16 3 13 8 1 6 1Mass Comm Sec Ed - Undeclared 2 2 2Masters of Educ/Sec Ed Cert 7-12 20 7 13 1 19Masters of Spec Educ w/Cert 7-12 1 1 1Masters of Spec Educ w/Cert PreK-8th 5 5 5Math Sec Ed - Undeclared 8 1 7 2 6Mathematics/Secondary Education 4 4 4PA Cert English 4-8 Spec Educ 2 2 2PA Cert English 4-8 Spec Ed-Undeclared 1 1 1PA Cert Math 4-8 - Undeclared 1 1 1PA Cert Math 4-8 Spec Ed - Undeclared 2 2 1 1
Gender Race/Ethnicity
2012-13 Point Park University Factbook * 67

Enrollment
Am.Indian/ Black or Hispanic NatHawaiian Non-res Two or more Un- Total Male Female Alaska Nat. Asian Afri.Am. of any race /Pacific Isl. Alien White races known
School of Arts & Sciences (cont.)Dept. of Education (cont.)
PA Cert PreK-4 Spec Educ-Undeclared 35 4 31 5 2 26 2PA Cert PreK-4th - Undeclared 28 3 25 1 7 1 19PA Cert PreK-4th 5 5 1 4PA Cert PreK-4th Spec Educ 12 12 1 1 10PA Cert Social Studies 4-8 - Undec 1 1 1PA Cert Social Studies 4-8 SpecEd-Und 1 1 1Professional Development-GR 28 4 24 1 26 1Professional Development-UG 40 5 35 16 4 20SecEdu Citizenship SpecEd 7-12-Und 3 2 1 1 2SecEdu English SpecEd 7-12-Und 3 3 3SecEdu Mass Comm SpecEd 7-12-Und 1 1 1SecEdu Math SpecEd 7-12 - Undeclared 1 1 1Teaching and Leadership 8 6 2 4 1 3Theatre Elementary Ed - Undeclared 1 1 1
Dept. of Humanities & Human SciencesApplied History 11 8 3 10 1Behavioral Sciences 36 7 29 17 1 17 1English 29 11 18 3 26English/Creative Writing 24 8 16 1 3 3 1 16Global Cultural Studies 23 7 16 2 1 1 19History 3 1 2 1 1 1Interdisciplinary Design 4 2 2 4Legal Studies 13 4 9 7 4 2Legal Studies - Capstone 20 6 14 8 10 2Liberal Studies 12 8 4 4 2 5 1Liberal Studies - Capstone 6 3 3 2 4Political Science 11 6 5 3 8Psychology 107 18 89 1 20 4 78 4
Table 4.16. (Continued)Gender Race/Ethnicity
68 * 2012-13 Point Park University Factbook

Enrollment
Am.Indian/ Black or Hispanic NatHawaiian Non-res Two or more Un- Total Male Female Alaska Nat. Asian Afri.Am. of any race /Pacific Isl. Alien White races known
School of Arts & Sciences (cont.)Dept. of Natural Sciences & Engr Tech
Allied Health 2 2 1 1Biological Sciences 39 9 30 2 9 2 3 22 1Biotechnology - Capstone BS 9 3 6 1 8Biotechnology 6 3 3 1 5Civil Engineering Technology 60 48 12 1 5 1 4 47 2Electrical Engineering Technology 103 98 5 2 14 3 6 75 3Engineering Management 17 14 3 4 13Environ. Health Science & Prot. 1 1 1Environmental Studies 11 4 7 2 1 1 6 1Funeral Service 9 4 5 3 6Funeral Service - Capstone 8 1 7 1 1 6Health Services 15 3 12 7 1 6 1Mechanical Engineering Technology 51 50 1 1 4 5 41Premedical & Preprofessional Studies 11 3 8 2 3 5 1
MiscellaneousNon - Degree Program 18 9 9 17 1Non - Degree Program/Masters 2 2 2Undecided 64 30 34 2 9 2 47 4Undecided/Pathways Program 4 1 3 2 2
Gender Race/EthnicityTable 4.16. (Continued)
2012-13 Point Park University Factbook * 69

Enrollment
Am.Indian/ Black or Hispanic NatHawaiian Non-res Two or more Un- Total Male Female Alaska Nat. Asian Afri.Am. of any race /Pacific Isl. Alien White races known
School of BusinessDept. of Acct, Fin & Econ, Info Tech
Accel Information Tech & Mgmt 37 33 4 10 1 26Accounting 74 31 43 2 18 1 6 45 2Economics and Finance 14 8 6 2 1 3 8Information Technology 35 27 8 8 26 1
Dept. of ManagementBusiness 84 39 45 29 2 1 49 3Business Management 138 65 73 24 7 8 97 2Human Resources Management 18 5 13 6 12Human Resources Mgmt - Capstone 32 5 27 12 1 1 17 1Leadership & Public Service 1 1 1Management Services 14 8 6 3 1 10Organizational Leadership (B.A.) 27 8 19 1 13 13Public Administration 9 2 7 2 1 6Public Administration - Capstone 9 8 1 8 1Sport, Arts and Entertainment Mgmt 226 93 133 1 13 7 3 193 9
Dept. of Global Mgmt & OrganizationMaster of Business Admin 332 162 170 1 5 42 8 15 255 4 2Organizational Leadership (M.A.) 38 11 27 18 1 6 12 1
Gender Race/EthnicityTable 4.16. (Continued)
70 * 2012-13 Point Park University Factbook

Enrollment
Am.Indian/ Black or Hispanic NatHawaiian Non-res Two or more Un- Total Male Female Alaska Nat. Asian Afri.Am. of any race /Pacific Isl. Alien White races known
School of CommunicationAdvertising 9 3 6 9Advertising and Public Relations 28 8 20 3 1 1 22 1Broadcast Production & Programming 28 18 10 6 1 21Broadcasting - On Camera 29 11 18 4 25Broadcasting - Radio/TV 1 1 1Broadcasting 40 19 21 4 1 34 1Broadcasting Reporting 29 10 19 5 22 2Digital Media 4 4 1 3Integrated Marketing Communications 15 3 12 4 11Journalism 52 15 37 1 5 1 2 43Journalism & Mass Comm/Masters 52 18 34 8 4 38 2Journalism & Comm/MBA (concurrent) 37 9 28 5 4 27 1Journalism and Mass Communication 24 8 16 6 1 17Journalism/Photojournalism 14 3 11 1 12 1Mass Communication 32 9 23 4 4 23 1Multimedia 31 12 19 3 1 1 25 1Photography 53 12 41 1 5 2 45Photojournalism 20 5 15 1 4 15Public Relations 30 7 23 1 26 3Public Relations and Advertising 17 4 13 17
Conservatory of Performing ArtsDept. of Cinema & Digital Arts
Cinema and Digital Arts 87 64 23 1 1 3 1 77 4Cinema Production 111 82 29 8 4 1 95 3Digital Arts 16 10 6 2 1 12 1Screenwriting 36 23 13 1 5 1 26 3
Dept. of DanceDance 253 36 217 2 16 15 12 199 9
Dept. of TheatreActing 5 2 3 1 1 3Applied Arts 1 1 1Theatre Arts 308 127 181 3 40 13 3 235 14
Table 4.16. (Continued)Gender Race/Ethnicity
2012-13 Point Park University Factbook * 71

Enrollment
Table 4.17. Fall 2012 Enrollment of Residents and Commuters by Academic School and Division
Arts & Sciences Business Communication Conservatory
Residents 231 148 179 417 975
Commuters 1,008 570 277 395 2,250
Undergraduate Total: 1,239 718 456 812 3,225
Residents 0 3 0 0 3
Commuters 138 367 89 5 599
Graduate Total: 138 370 89 5 602
Total UG & GR Residents: 231 151 179 417 978
Total UG & GR Commuters: 1,146 937 366 400 2,849
Grand Total: 1,377 1,088 545 817 3,827
Academic School
Total
Undergraduate
Graduate
72 * 2012-13 Point Park University Factbook

Enrollment
By Country of Origin2008 2009 2010 2011 2012 2008 2009 2010 2011 2012
Argentina 1 Korea 5 1 2Australia 1 Madagascar 1Austria 1 2 2 1 Mexico 1 1Bahamas, The 1 Mongolia 2Benin 1 Nepal 1 1 1 1Brazil 2 1 2 3 Nigeria 2 1 2 2 2British Virgin Islands 1 Pakistan 1 1Bulgaria 1 1 1 Poland 1Canada 6 8 10 12 12 Portugal 1 1 1Chile 1 1 1 1 Russian Federation 2 1 4 4China 3 2 2 1 6 Rwanda 1Colombia 1 1 1 1 Saudi Arabia 8 19Costa Rica 1 1 1 Senegal 1Cyprus 1 Serbia 1 1 1Czech Republic 1 South Africa 1Dominican Republic 1 1 Sri Lanka 1 1Egypt 1 1 St. Lucia, W. Indies 1 1Equatorial Guinea 1 Swaziland 1France 1 1 2 Sweden 1 1Gabon 1 Switzerland 1Germany 2 2 2 Syrian Arab Republic 1 1 1 1Guinea 1 1 Taiwan 3 3Hong Kong 1 Tanzania, United Rep. 1India 8 9 4 6 6 Thailand 1 1 2 2 2Indonesia 2 3 3 1 Turkey 3 5 5 6Iraq 1 Turkmenistan 2Ireland 1 Uganda 1 1Israel 1 1 1 1 1 United Kingdom 1 1 3 6Italy 1 1 1 Uzbekistan 1 1Jamaica 1 1 Venezuela 2 1 1 3 4Japan 7 4 2 2 2 Vietnam 1 2Jordan 1 1 1 Zambia 2 3 1Kazakhstan 1 3 2 Zimbabwe 1Kenya 4 5 5 2 1 TOTAL 65 62 61 78 107
Table 4.18. Enrollment Trends of International Students, Table 4.18. (Continued)
Continued…
2012-13 Point Park University Factbook * 73

Enrollment
Fig. 4.15. FALL 2012 Enrollment - with a focus on Southwestern Pennsylvania Counties
Counties TotalSouthwestern PA:
Allegheny 2,167Armstrong 21
Beaver 105Butler 98
Fayette 43Greene 5Indiana 12
Lawrence 29Washington 117
Westmoreland 200Subtotal SW PA: 2,797
Other Western PA 126All Western PA: 2,923
Other PA counties 183Other States&Countries 721
Total Enrolled: 3,827
29 98
105 21
2,16712
200
117
435
74 * 2012-13 Point Park University Factbook

Enrollment
Chg from % chg % chg % chgFA03 FA08 FA11 FA12 FA11 to FA12 FA11 to FA12 FA08 to FA12 FA03 to FA012
School of Arts & Sciences
Criminal Justice&Intel. StudiesSouthWestern PA Counties 205 290 294 285 -9 -3% -2% 39%Other Western PA Counties 3 5 7 6 -1 -14% 20% 100%Other PA Counties 4 6 9 10 1 11% 67% 150%Not in the state of PA 7 16 35 35 0 0% 119% 400%
Criminal Justice&Intel. Std Total: 219 317 345 336 -9 -3% 6% 53%
EducationSouthWestern PA Counties 284 305 321 281 -40 -12% -8% -1%Other Western PA Counties 2 7 7 8 1 14% 14% 300%Other PA Counties 4 5 6 9 3 50% 80% 125%Not in the state of PA 8 9 14 14 0 0% 56% 75%
Education Total: 298 326 348 312 -36 -10% -4% 5%
Humanities & Human SciencesSouthWestern PA Counties 187 213 259 234 -25 -10% 10% 25%Other Western PA Counties 3 10 15 13 -2 -13% 30% 333%Other PA Counties 9 12 18 19 1 6% 58% 111%Not in the state of PA 11 21 26 33 7 27% 57% 200%
Humanities & Human Sci Total: 210 256 318 299 -19 -6% 17% 42%
Natural Sciences & Engineering TechSouthWestern PA Counties 341 269 304 293 -11 -4% 9% -14%Other Western PA Counties 3 4 12 7 -5 -42% 75% 133%Other PA Counties 0 2 4 6 2 50% 200% naNot in the state of PA 9 18 29 36 7 24% 100% 300%
Nat. Sci. & Engineering Tech Total: 353 293 349 342 -7 -2% 17% -3%
MiscellaneousSouthWestern PA Counties 98 175 77 67 -10 -13% -62% -32%Other Western PA Counties 7 4 4 3 -1 -25% -25% -57%Other PA Counties 4 6 4 9 5 125% 50% 125%Not in the state of PA 15 10 7 9 2 29% -10% -40%
Miscellaneous Total: 124 195 92 88 -4 -4% -55% -29%
Table 4.19. Enrollment Trends of Counties by School and Department
2012-13 Point Park University Factbook * 75

Enrollment
Chg from % chg % chg % chgFA03 FA08 FA11 FA12 FA11 to FA12 FA11 to FA12 FA08 to FA12 FA03 to FA012
School of Business
Accounting, Finance&Economics, Info TechSouthWestern PA Counties 179 193 180 146 -34 -19% -24% -18%Other Western PA Counties 1 3 4 4 0 0% 33% 300%Other PA Counties 1 0 0 1 1 na na 0%Not in the state of PA 8 3 5 9 4 80% 200% 13%
Acct, Finance&Econ, Info Tech Total: 189 199 189 160 -29 -15% -20% -15%
ManagementSouthWestern PA Counties 410 474 455 457 2 0% -4% 11%Other Western PA Counties 5 22 20 24 4 20% 9% 380%Other PA Counties 1 6 16 19 3 19% 217% 1800%Not in the state of PA 23 32 61 58 -3 -5% 81% 152%
Management Total: 439 534 552 558 6 1% 4% 27%
Global Management & OrganizationSouthWestern PA Counties 215 332 329 342 13 4% 3% 59%Other Western PA Counties 2 3 3 2 -1 -33% -33% 0%Other PA Counties 0 1 0 5 5 na 400% naNot in the state of PA 9 5 18 21 3 17% 320% 133%
Global Mgt & Organization Total: 226 341 350 370 20 6% 9% 64%
School of CommunicationSouthWestern PA Counties 363 444 371 402 31 8% -9% 11%Other Western PA Counties 28 32 31 25 -6 -19% -22% -11%Other PA Counties 13 36 45 37 -8 -18% 3% 185%Not in the state of PA 24 73 82 81 -1 -1% 11% 238%
School of Communication Total: 428 585 529 545 16 3% -7% 27%
Table 4.19. (Continued)
76 * 2012-13 Point Park University Factbook

Enrollment
Chg from % chg % chg % chgFA03 FA08 FA11 FA12 FA11 to FA12 FA11 to FA12 FA08 to FA12 FA03 to FA012
Conservatory of Performing Arts
Cinema & Digital ArtsSouthWestern PA Counties 87 118 144 150 6 4% 27% 72%Other Western PA Counties 5 18 18 23 5 28% 28% 360%Other PA Counties 20 28 34 28 -6 -18% 0% 40%Not in the state of PA 44 43 59 49 -10 -17% 14% 11%
Cinema & Digital Arts Total: 156 207 255 250 -5 -2% 21% 60%
DanceSouthWestern PA Counties 42 46 36 29 -7 -19% -37% -31%Other Western PA Counties 4 4 4 3 -1 -25% -25% -25%Other PA Counties 17 19 18 19 1 6% 0% 12%Not in the state of PA 172 201 205 202 -3 -1% 0% 17%
Dance Total: 235 270 263 253 -10 -4% -6% 8%
TheatreSouthWestern PA Counties 154 128 109 111 2 2% -13% -28%Other Western PA Counties 11 13 9 8 -1 -11% -38% -27%Other PA Counties 40 43 31 21 -10 -32% -51% -48%Not in the state of PA 144 139 181 174 -7 -4% 25% 21%
Theatre Total: 349 323 330 314 -16 -5% -3% -10%Grand Total: 3226 3846 3920 3827 -93 -2% 0% 19%
Note: Counties are determined by the students most current address recorded at census.
Table 4.19. (Continued)
2012-13 Point Park University Factbook * 77

Enrollment
Fig. 4.16. NET CHANGE in Enrollment between Fall 2011 and Fall 2012, with a focus on SouthWestern PA Counties
Chg fromCounties FA11 to FA12
SouthWest PA:Allegheny -91Armstrong 1
Beaver -6Butler 7
Fayette 9Greene -3Indiana 2
Lawrence -2Washington 2
Westmoreland -1Subtotal SW PA: -82
Other Western PA -8All Western PA: -90
Other PA counties -2Other States&Countries -1
Total NET CHANGE: -93
-2 +7
-6 +1
-91
+2
-1
+2
+9-3
78 * 2012-13 Point Park University Factbook

Enrollment
Chg from % chg % chg % chgWestern PA County Breakdown FA03 FA04 FA05 FA06 FA07 FA08 FA09 FA10 FA11 FA12 FA11 to FA12 FA11 to FA12 FA08 to FA12 FA03 to FA12 SouthWest PA Counties: Allegheny 1918 2038 2052 2177 2187 2368 2462 2456 2258 2167 -91 -4% -8% 13% Armstrong 32 21 23 20 22 12 21 24 20 21 1 5% 75% -34% Beaver 126 114 112 122 111 102 100 106 111 105 -6 -5% 3% -17% Butler 92 107 99 93 97 115 99 83 91 98 7 8% -15% 7% Fayette 51 47 49 44 53 41 35 38 34 43 9 26% 5% -16% Greene 6 4 4 4 4 5 7 6 8 5 -3 -38% 0% -17% Indiana 14 9 10 11 15 18 11 15 10 12 2 20% -33% -14% Lawrence 28 21 27 28 25 29 32 40 31 29 -2 -6% 0% 4% Washington 109 88 98 92 91 104 100 101 115 117 2 2% 13% 7% Westmoreland 189 163 178 186 194 193 196 223 201 200 -1 0% 4% 6%
Subtotal SW PA: 2565 2612 2652 2777 2799 2987 3063 3092 2879 2797 -82 -3% -6% 9% Other Western PA Counties: Bedford 1 3 3 4 3 3 2 0 2 3 1 50% 0% 200% Blair 11 8 4 5 8 8 8 11 16 13 -3 -19% 63% 18% Cambria 7 9 9 11 19 16 21 17 19 17 -2 -11% 6% 143% Cameron 0 0 1 0 0 0 1 0 0 0 0 na na na Clarion 2 2 2 1 1 2 5 7 6 6 0 0% 200% 200% Clearfield 4 7 6 4 5 8 8 10 8 4 -4 -50% -50% 0% Crawford 5 9 9 7 7 9 9 10 13 14 1 8% 56% 180% Elk 2 3 5 4 5 3 2 3 3 3 0 0% 0% 50% Erie 11 22 24 28 27 25 28 28 23 20 -3 -13% -20% 82% Forest 0 0 0 0 0 0 0 1 0 0 0 na na na Huntingdon 3 2 4 3 1 0 1 0 0 0 0 na na -100% Jefferson 1 2 2 5 4 4 6 5 5 6 1 20% 50% 500% McKean 1 2 1 2 1 1 1 2 3 5 2 67% 400% 400% Mercer 10 11 18 18 15 25 21 24 18 17 -1 -6% -32% 70% Somerset 9 9 6 7 13 10 9 7 10 11 1 10% 10% 22% Venango 5 8 7 9 9 7 5 2 4 3 -1 -25% -57% -40% Warren 2 3 5 4 4 4 4 3 4 4 0 0% 0% 100%
Subtotal Other W-PA: 74 100 106 112 122 125 131 130 134 126 -8 -6% 1% 70%Total All Western PA Counties: 2639 2712 2758 2889 2921 3112 3194 3222 3013 2923 -90 -3% -6% 11%
Total from Other PA Counties: 113 128 155 155 154 164 205 187 185 183 -2 -1% 12% 62%Total Not from the state of PA: 474 452 494 502 517 570 587 668 722 721 -1 0% 26% 52%
Total Enrollment: 3226 3292 3407 3546 3592 3846 3986 4077 3920 3827 -93 -2% 0% 19%
Table 4.20. Enrollment Trends of Western Pennsylvania Counties vs. Other PA Counties vs. Not from the state of PA
2012-13 Point Park University Factbook * 79

80 * 2012-13 Point Park University Factbook
Enrollment
Table 4.21. Fall 2012 Enrollment - Students' Permanent Residency is City of Pittsburgh vs All Other Locations, by School/Department
Count % Count % TotalSchool of Arts & Sciences
Criminal Justice & Intel Stds 161 48% 175 52% 336Education 147 47% 165 53% 312Humanities & Human Sciences 117 39% 182 61% 299Natural Sci &Engineering Tech 116 34% 226 66% 342Miscellaneous 26 30% 62 70% 88
School of Arts & Sciences Total: 567 41% 810 59% 1,377
School of Business Acct, Fin&Econ, Info Tech 76 48% 84 53% 160Management 211 38% 347 62% 558Global Mgt & Organization 168 45% 202 55% 370
School of Business Total: 455 42% 633 58% 1,088
School of Communication 162 30% 383 70% 545School of Communication Total: 162 30% 383 70% 545
Conservatory of Performing ArtsCinema & Digital Arts 41 16% 209 84% 250Dance 15 6% 238 94% 253Theatre 50 16% 264 84% 314
Conservatory of Perf. Arts Total: 106 13% 711 87% 817
Grand Total: 1,290 34% 2,537 66% 3,827
Students' Permanent Residency:
Note: ‘Permanent Residency’ is determined by the students most current zip code recorded at census; PCHE (Pittsburgh Council on Higher Education) has defined which zip codes make-up the geographic boundaries of the City of Pittsburgh.
Is the City of Pittsburgh Is Other than City of Pittsburgh

RETENTION AND
GRADUATION RATES

Retention & Graduation Rates
RETENTION and GRADUATION RATES Over the years, retention and graduation rates for first-time, full-time freshmen at Point Park University have remained relatively stable. This year, the University experienced a slight decline in freshman to sophomore retention (74% from 75%) (table 5.1, fig. 5.1), while the six-year graduation rate remained at 50%. (See table 5.7). Although the overall freshman retention rate has stayed approximately the same, there are some notable differences between schools. Specifically, the School of Arts & Sciences experienced the largest increase in freshman to sophomore retention (from 67% to 77%). The School of Business also experienced a sizeable increase in freshman to sophomore retention (from 62% to 70%). The retention rate for the Conservatory decreased for the first time in a number of years (from 87% to 78%). Finally, the School of Communication had a small decrease in retention over last year (from 73% to 71%). There are also notable differences between academic departments within the schools. (See table 5.2). Part-time undergraduate retention increased slightly over last year (56% to 58%). This cohort continues to be a difficult one to study due to the frequency with which they temporarily withdrawal (i.e., stop out). The retention rate for accelerated undergraduates dropped from 69% to 64%. Full-time transfer undergraduate retention decreased from 72% to 65% and is at its lowest rate in recent years. New graduate student retention increased slightly from 75% to 78% for the entire institution. For more information, refer to tables 5.3 through 5.6. Each year, the Office of Institutional Research and Planning prepares detailed retention reports on the various cohorts for analysis and decision-making. These reports show aggregated data by such variables as gender, race, age, on-campus/commuter, incoming high school grade point average, SAT/ACT scores and many other items. Some of this information is available in tables 5.8 through 5.14.
2012-13 Point Park University Factbook * 81

Retention & Graduation Rates
82 * 2012-13 Point Park University Factbook
Fig. 5.1. Overall Fall to Fall Retention Rates by Student Type
71%77%77%
75%74%
50% 55% 60% 65% 70% 75% 80% 85% 90%
F07 to F08F08 to F09F09 to F10F10 to F11F11 to F12
First-time, Full-time Freshmen
59%59%
63%56%
58%
50% 55% 60% 65% 70% 75% 80% 85% 90%
F07 to F08F08 to F09F09 to F10F10 to F11F11 to F12
Regular Part-time Undergraduates
77%68%
77%69%
64%
50% 55% 60% 65% 70% 75% 80% 85% 90%
F07 to F08F08 to F09F09 to F10F10 to F11F11 to F12
Accelerated Undergraduates
80%78%
70%72%
65%
50% 55% 60% 65% 70% 75% 80% 85% 90%
F07 to F08F08 to F09F09 to F10F10 to F11F11 to F12
Full-time Undergraduate Transfers
80%76%
79%75%
78%
50% 55% 60% 65% 70% 75% 80% 85% 90%
F07 to F08F08 to F09F09 to F10F10 to F11F11 to F12
Graduate Students

Retention & Graduation Rates
Table 5.1. Overall Fall to Fall Retention Rates by Student Type*F07 to F08 F08 to F09 F09 to F10 F10 to F11 F11 to F12
First-time, Full-time Freshmen 71% 77% 77% 75% 74%Regular Part-time Undergraduates 59% 59% 63% 56% 58%Accelerated Undergraduates 77% 68% 77% 69% 64%Full-time Undergraduate Transfers 80% 78% 70% 72% 65%Graduate Students 80% 76% 79% 75% 78%* Includes those who graduated within one year
50%
55%
60%
65%
70%
75%
80%
85%
F07 to F08 F08 to F09 F09 to F10 F10 to F11 F11 to F12
Fig. 5.2. Fall to Fall Retention Rates of New Students
First‐time, Full‐time Freshmen Regular Part‐time UndergraduatesAccelerated Undergraduates Full‐time Undergraduate TransfersGraduate Students
2012-13 Point Park University Factbook * 83

Retention & Graduation Rates
1
23456789101112131415161718192021222324
A B C D E F G H I J K L M N
Table 5.2. First‐time, Full‐time FreshmanFirst Year Retention Rates by School and Academic Department
% DIFF % DIFFEnt. % Ent. % Betw 2010 Ent. % Ent. % Ent. % Betw 2007Cohort Returning Cohort Returning and 2011 Cohort Returning Cohort Returning Cohort Returning and 2011
Arts & Sciences 102 77 113 67 +10 117 71 97 74 95 67 +10
Education 24 92 23 74 +18 35 74 31 77 24 75 +17
Humanities & Human Sci 30 70 48 65 +5 41 56 36 67 30 50 +20
Nat Sci & Eng Tech 19 79 14 50 +29 19 79 17 71 12 50 +29
Crim Justice & Intel Std 29 69 28 75 ‐6 22 86 13 92 29 86 ‐17
Business 71 70 53 62 +8 51 73 47 79 36 78 ‐8
Conservatory 191 78 222 87 ‐9 211 83 232 82 176 80 ‐2
Dance 62 65 84 80 ‐15 74 80 94 82 74 76 ‐11
Cinema and Digital Arts 63 84 48 90 ‐6 56 86 50 84 40 78 +6
Theatre 66 83 90 91 ‐8 81 85 88 82 62 85 ‐2
Communication 95 71 113 73 ‐2 111 75 106 76 100 63 +8
Undecided 29 62 35 60 +2 31 77 38 55 41 56 +6
Total 488 74 536 75 ‐1 521 77 520 77 448 71 +3
Fall 2011 Fall 2009 Fall 2008 Fall 2007Fall 2010
84 * 2012-13 Point Park University Factbook

Retention & Graduation Rates
1
23456789101112131415161718192021222324
A B C D E F G H I J K L M N
Table 5.3. Part‐time UndergraduateFirst Year Retention Rates by School and Academic Department
% DIFF % DIFFEnt. % Ent. % Betw 2010 Ent. % Ent. % Ent. % Betw 2007Cohort Returning Cohort Returning and 2011 Cohort Returning Cohort Returning Cohort Returning and 2011
Arts & Sciences 70 61 86 57 +4 81 64 98 55 67 58 +3
Education 11 55 21 52 +3 25 80 47 47 23 52 +3
Humanities & Human Sci 16 75 20 55 +20 14 50 16 63 12 67 +8
Nat Sci & Eng Tech 32 63 39 54 +9 36 67 30 67 28 57 +6
Crim Justice & Intel Std 11 46 6 100 ‐54 6 17 5 40 4 75 ‐29
Business 33 52 30 53 ‐1 43 65 38 61 33 61 ‐9
Conservatory 0 1 0 1 0 0 ‐ 0 ‐
Dance ‐ ‐ ‐ ‐ ‐ ‐ ‐ ‐ ‐ ‐
Cinema and Digital Arts ‐ ‐ 1 0 ‐ ‐ ‐ ‐ ‐ ‐
Theatre ‐ ‐ ‐ ‐ 1 0 ‐ ‐ ‐ ‐
Communication 3 100 9 67 +33 7 57 5 100 4 75 +25
Undecided 2 0 5 40 ‐40 8 50 5 80 3 33 ‐33
Total 108 58 131 56 +2 140 63 146 59 107 59 ‐1
Fall 2011 Fall 2009 Fall 2008 Fall 2007Fall 2010
2012-13 Point Park University Factbook * 85

Retention & Graduation Rates
1
23456789101112131415161718192021222324
A B C D E F G H I J K L M N
Table 5.4. Accelerated UndergraduateFirst Year Retention Rates by School and Academic Department
% DIFF % DIFF
Ent. % Ent. % Betw 2010 Ent. % Ent. % Ent. % Betw 2007
Cohort Returning Cohort Returning and 2011 Cohort Returning Cohort Returning Cohort Returning and 2011
Arts & Sciences 36 56 48 65 ‐9 35 86 43 60 50 72 ‐16
Education ‐ ‐ ‐ ‐ ‐ ‐ ‐ ‐ ‐ ‐
Humanities & Human Sci ‐ ‐ ‐ ‐ ‐ ‐ ‐ ‐ ‐ ‐
Nat Sci & Eng Tech ‐ ‐ ‐ ‐ ‐ ‐ ‐ ‐ ‐ ‐
Crim Justice & Intel Std 36 56 48 65 ‐9 35 86 43 60 50 72 ‐16
Business 63 70 68 72 ‐2 87 75 88 68 80 79 ‐9
Conservatory 0 ‐ 0 ‐ 0 ‐ 0 ‐ 0 ‐
Dance ‐ ‐ ‐ ‐ ‐ ‐ ‐ ‐ ‐ ‐
Cinema and Digital Arts ‐ ‐ ‐ ‐ ‐ ‐ ‐ ‐ ‐ ‐
Theatre ‐ ‐ ‐ ‐ ‐ ‐ ‐ ‐ ‐ ‐
Communication 6 67 6 67 + 7 86 14 93 11 91 ‐24
Undecided 10 50 5 60 ‐10 4 50 11 64 12 67 ‐17
Total 115 64 127 69 ‐5 133 77 156 68 153 77 ‐13
Fall 2011 Fall 2009 Fall 2008 Fall 2007Fall 2010
86 * 2012-13 Point Park University Factbook

Retention & Graduation Rates
1
23456789101112131415161718192021222324
A B C D E F G H I J K L M N
Table 5.5. Full‐time Undergraduate TransferFirst Year Retention Rates by School and Academic Department
% DIFF % DIFF
Ent. % Ent. % Betw 2010 Ent. % Ent. % Ent. % Betw 2007Cohort Returning Cohort Returning and 2011 Cohort Returning Cohort Returning Cohort Returning and 2011
Arts & Sciences 133 65 116 70 ‐5 113 75 119 80 97 74 ‐9
Education 32 69 20 70 ‐1 21 71 26 88 23 65 +4
Humanities & Human Sci 28 57 29 52 +5 41 88 34 68 24 71 ‐14
Nat Sci & Eng Tech 39 59 36 78 ‐19 33 67 37 89 30 77 ‐18
Crim Justice & Intel Std 34 77 31 77 + 18 67 22 73 20 85 ‐8
Business 74 68 44 73 ‐5 70 66 54 69 47 83 ‐15
Conservatory 51 59 56 75 ‐16 47 68 34 88 55 89 ‐30
Dance 9 67 11 73 ‐6 10 40 9 89 11 73 ‐6
Cinema and Digital Arts 21 57 25 72 ‐15 17 59 12 92 22 91 ‐34
Theatre 21 57 20 80 ‐23 20 90 13 85 22 95 ‐38
Communication 44 73 39 74 ‐1 54 67 59 81 53 79 ‐6
Undecided 8 25 4 50 ‐25 11 73 7 43 11 64 ‐39
Total 310 65 259 72 ‐7 295 70 273 78 263 80 ‐15
Fall 2011 Fall 2009 Fall 2008 Fall 2007Fall 2010
2012-13 Point Park University Factbook * 87

Retention & Graduation Rates
1
23456789101112131415161718192021222324
A B C D E F G H I J K L M N
Table 5.6. Graduate StudentsFirst Year Retention Rates by School and Academic Department
% DIFF % DIFF
Ent. % Ent. % Betw 2010 Ent. % Ent. % Ent. % Betw 2007
Cohort Returning Cohort Returning and 2011 Cohort Returning Cohort Returning Cohort Returning and 2011
Arts & Sciences 45 73 53 76 ‐3 60 68 34 74 44 70 +3
Education 17 71 26 77 ‐6 23 74 7 86 18 61 +10
Humanities & Human Sci ‐ ‐ ‐ ‐ ‐ ‐ ‐ ‐ ‐ ‐ ‐
Nat Sci & Eng Tech 14 79 11 82 ‐3 15 67 9 78 10 70 +9
Crim Justice & Intel Std 14 71 16 69 +2 22 64 18 67 16 81 ‐10
Business 136 79 161 76 +3 188 84 140 80 159 82 ‐3
Conservatory 6 83 0 0 +83 0 0 6 100 0 0 +83
Dance ‐ ‐ ‐ ‐ ‐ ‐ ‐ ‐ ‐ ‐ ‐
Cinema and Digital Arts ‐ ‐ ‐ ‐ ‐ ‐ ‐ ‐ ‐ ‐ ‐
Theatre ‐ ‐ ‐ ‐ ‐ ‐ ‐ 6 100 ‐ ‐
Communication 34 79 31 68 +11 17 71 34 59 27 81 ‐2
Undecided 0 ‐ 0 ‐ 0 ‐ 0 ‐ 0 ‐
Total 221 78 245 75 +3 265 79 214 76 230 80 ‐2
Fall 2011 Fall 2009 Fall 2008 Fall 2007Fall 2010
88 * 2012-13 Point Park University Factbook

Retention & Graduation Rates
2012-13 Point Park University Factbook * 89
Ent. 4-year 6-year Ent. 4-year 6-year Ent. 4-year 6-year Ent. 4-year 6-year Ent. 4-year 6-yearCohort Grad Rate Grad Rate Cohort Grad Rate Grad Rate Cohort Grad Rate Grad Rate Cohort Grad Rate Grad Rate Cohort Grad Rate Grad Rate
Arts & Sciences 71 25% 41% 67 18% 36% 59 20% 36% 56 34% 46% 35 26% 46%Education 18 17% 50% 27 7% 33% 26 23% 46% 24 42% 50% 14 21% 29%Humanities 35 23% 31% 22 23% 27% 18 28% 39% 19 21% 42% 10 30% 50%Nat Sci & Eng Tech 10 40% 50% 5 20% 40% 9 11% 11% 7 29% 43% 9 33% 78%Crim Justice&Intel Std 8 38% 50% 13 31% 54% 6 0% 17% 6 50% 50% 2 0% 0%
Business 53 34% 45% 44 34% 59% 33 42% 52% 35 37% 54% 13 46% 54%Conservatory 206 50% 56% 221 51% 57% 197 47% 55% 231 49% 58% 183 45% 51%
Dance 87 46% 56% 75 52% 57% 58 43% 47% 87 44% 49% 56 39% 43%Cinema & Dig Arts 54 52% 56% 59 44% 51% 46 52% 63% 46 50% 70% 36 28% 36%Theatre 65 54% 55% 87 55% 60% 93 47% 56% 98 53% 59% 91 56% 62%
Communication 106 38% 50% 92 40% 48% 49 45% 53% 66 38% 52% 63 38% 43%Undecided majors 40 15% 40% 34 6% 26% 38 13% 21% 38 24% 34% 34 21% 35%
Total ALL Departments 476 39% 50% 458 39% 50% 376 39% 48% 426 41% 53% 328 39% 47%
First-time, FT Fresh
Table 5.7. Four-year and Six-year Graduation Rates (of first-time, full-time freshmen)
Fall 2004 cohort Fall 2003 cohort Fall 2002 cohortFall 2005 cohortFall 2006 cohortFirst-time, FT Fresh First-time, FT Fresh First-time, FT FreshFirst-time, FT Fresh

Retention & Graduation Rates
Table 5.8. One-Year Persistence By Housing Status, Fall 2007-11 cohorts (Freshmen only)
% % % % %2007 2008 2009 2010 2011
(n=448) (n=520) (n=521) (n=536) (n=488)Living in Residence Halls 74 81 78 77 75Commuter 63 65 76 68 71
Table 5.9. One-Year Persistence By Course Load, Fall 2007-11 cohorts (Accelerated Undergraduates only)
% % % % %2007 2008 2009 2010 2011
(n=153) (n=156) (n=133) (n=126) (n=115)Full-time 79 76 81 71 67Part-time 70 49 68 64 53
Table 5.10. One-Year Persistence By Course Load, Fall 2007-11 cohorts (Graduate Students only)
% % % % %2007 2008 2009 2010 2011
(n=230) (n=214) (n=265) (n=245) (n=221)Full-time 86 81 75 79 80Part-time 71 72 83 70 75
90 * 2012-13 Point Park University Factbook

Retention & Graduation Rates
2012-13 Point Park University Factbook * 91
Table 5.11. One-Year Persistence By Minority Status, Fall 2011 cohort% % % %
First-time Part-time Accel Full-time %Freshmen Undergrad Undergrad Transfer Graduate(n=488) (n=108) (n=115) (n=310) (n=221)
White 76 63 73 70 77Minority* 67 53 57 53 80
*Includes Non-resident Aliens
Table 5.12. One-Year Persistence By Race, Fall 2011 cohort% % % %
First-time Part-time Accel Full-time %Freshmen Undergrad Undergrad Transfer Graduate(n=488) (n=108) (n=115) (n=310) (n=221)
White 76 63 73 70 77African-American 67 50 59 45 83Asian 100 - 100 100 0Hispanic of any race 59 60 0 60 63American Indian - - - 0 -Non-resident Alien 69 - 100 100 87Two or more races 68 100 20 67 78
Table 5.13. One-Year Persistence By Gender, Fall 2011 cohort% % % %
First-time Part-time Accel Full-time %Freshmen Undergrad Undergrad Transfer Graduate(n=488) (n=108) (n=115) (n=310) (n=221)
Female 74 55 54 65 77Male 74 62 76 65 79
Table 5.14. One-Year Persistence By Age, Fall 2011 cohort
% % % %First-time Part-time Accel Full-time %Freshmen Undergrad Undergrad Transfer Graduate(n=488) (n=108) (n=115) (n=310) (n=221)
Traditional (18-24) 74 42 62 67 81Non-traditional (>24) 100 66 63 59 76
ACADEMIC PROGRAMS AND
DEGREES CONFERRED

Academic Programs and Degrees Conferred
ACADEMIC PROGRAMS And DEGREES CONFERRED Degrees and certificates awarded by Point Park University are authorized by the Pennsylvania Department of Education. The university confers degrees at the Certificate, Associate, Baccalaureate and Masters levels. The University offers a total of 116 degree programs of study. This includes 103 degrees at the undergraduate level and 13 graduate programs. For a detailed listing, please see table 6.5. As Point Park’s student enrollment reaches historical highs, so has the number of degrees granted by Point Park. During the 2011-12 academic year, Point Park granted 984 degrees, this number represents an overall increase of 18% from the 2005-06 academic year. Of the 984 degrees granted, 39% were awarded by the School of Business, 12% by the School of Communication, 19% by the Conservatory of Performing Arts, and within the School of Arts & Sciences, 9% by the Department of Criminal Justice and Intelligence Studies, 8% by the Department of Education, 7% by the Department of Humanities & Human Sciences, and 6% by the Department of Natural Sciences and Engineering Technology (table 6.2). The degrees conferred data in this chapter shows the total number of degrees awarded within an academic year. An academic year in this context is defined as beginning July 1 and ending June 30. This definition is consistent with the Pennsylvania Department of Education’s definition and methodology for reporting degrees awarded.
92 * 2012-13 Point Park University Factbook

Academic Programs and Degrees Conferred
Table 6.1 Trends in Degrees Conferred
2005-06 2006-07 2007-08 2008-09 2009-10 2010-11 2011-12 Headcount %Certificates 5 2 4 4 4 2 2 0Associates 7 10 6 3 4 6 3 -3 -5Bachelors 608 640 631 696 660 684 719 35 5.1%Masters 217 238 202 227 239 261 260 -1 -0.4%Total 837 890 843 930 907 953 984 31 3.3%
Changesfrom 10-11 to 11-12
0.0%0.0%
0
100
200
300
400
500
600
700
800
2005-06 2006-07 2007-08 2008-09 2009-10 2010-11 2011-12
Fig. 6.1. Degrees Conferred Trends
Bachelors
Masters
2012-13 Point Park University Factbook * 93

Academic Programs and Degrees Conferred
94 * 2012-13 Point Park University Factbook
Table 6.2. Degrees and Certificates Conferred by Academic School/Department, Academic Year 2011-12% of Total
Certificates Associates Bachelors Masters Total UniversitySchool of Arts & Sciences 2 0 234 62 298 30.3% Criminal Justice & Intel Std 0 0 69 19 88 8.9% Education 2 0 51 27 80 8.1% Humanities & Human Sci 0 0 69 0 69 7.0% Nat Sciences & Engr Tech 0 0 45 16 61 6.2%
School of Business 0 3 209 172 384 39.0% Acct,Fin&Econ,InfoTech 0 0 58 0 58 5.9% Management 0 3 151 0 154 15.7% Global Mgt & Org 0 0 0 172 172 17.5%
School of Communication 0 0 91 26 117 11.9%
Conservatory of Perf. Arts 0 0 185 0 185 18.8% Cinema & Digital Arts 0 0 50 0 50 5.1% Dance 0 0 67 0 67 6.8% Theatre 0 0 68 0 68 6.9%University Total 2 3 719 260 984 100.0%
8880
6961 58
154
172
117
50
67 68
0
20
40
60
80
100
120
140
160
180
200Fig. 6.2. Degrees Conferred by Academic Unit, Academic Year 2011-12

Academic Programs and Degrees Conferred
Table 6.3. Degrees and Certificates Awarded by Gender and Race/Ethnicity, Academic Year 2011-12
Am.Indian/ Black or Hispanic NatHawaiian Non-res Two or more Un-Total Female Male Alaska Nat. Asian Afr.Am. of any race /Pacific Isl. Alien White races known
School of Arts & Sciences
Criminal Justice & Intel.StdBachelor of Science 69 44 25 0 0 22 2 0 0 45 0 0Master of Science 19 15 4 0 0 8 1 0 0 9 1 0
Subtotal 88 59 29 0 0 30 3 0 0 54 1 0
EducationCertificate 2 2 0 0 0 0 0 0 0 2 0 0Bachelor of Arts 48 39 9 0 1 4 1 0 0 39 3 0Bachelor of Science 3 3 0 0 0 1 0 0 0 2 0 0Master of Arts 17 15 2 0 0 6 0 0 0 11 0 0Master of Education 10 7 3 0 0 1 0 0 0 9 0 0
Subtotal 80 66 14 0 1 12 1 0 0 63 3 0
Humanities & Human SciBachelor of Arts 68 43 25 0 0 9 2 0 0 54 3 0Bachelor of Science 1 0 1 0 0 0 0 0 0 1 0 0
Subtotal 69 43 26 0 0 9 2 0 0 55 3 0
Nat Sciences & Engr TechBachelor of Science 45 14 31 0 0 2 0 1 1 41 0 0Master of Science 16 8 8 0 0 3 1 0 1 11 0 0
Subtotal 61 22 39 0 0 5 1 1 2 52 0 0
Gender Race/Ethnicity
2012-13 Point Park University Factbook * 95

Academic Programs and Degrees Conferred
Table 6.3. (Continued)
Am.Indian/ Black or Hispanic NatHawaiian Non-res Two or more Un-Total Female Male Alaska Nat. Asian Afr.Am. of any race /Pacific Isl. Alien White races known
School of Business
Acct,Fin&Econ,InfoTechBachelor of Science 58 13 45 0 1 6 0 0 0 47 4 0
Subtotal 58 13 45 0 1 6 0 0 0 47 4 0
ManagementAssociate of Science 3 3 0 0 0 2 0 0 0 1 0 0Bachelor of Arts 16 13 3 1 0 9 1 0 0 5 0 0Bachelor of Science 135 90 45 0 4 27 1 0 1 94 7 1
Subtotal 154 106 48 1 4 38 2 0 1 100 7 1
Global Mgt & OrgMaster of Arts 27 20 7 0 0 14 0 0 1 9 3 0Master of Bus Admin 145 76 69 0 2 26 3 0 9 103 2 0
Subtotal 172 96 76 0 2 40 3 0 10 112 5 0
School of Communication
Bachelor of Arts 74 52 22 0 0 6 1 0 1 63 3 0Bachelor of Fine Arts 9 6 3 0 0 1 0 0 0 8 0 0Bachelor of Science 8 6 2 0 0 3 0 0 0 5 0 0Master of Arts 26 20 6 0 1 0 1 0 1 23 0 0
Subtotal 117 84 33 0 1 10 2 0 2 99 3 0
Gender Race/Ethnicity
96 * 2012-13 Point Park University Factbook

Academic Programs and Degrees Conferred
2012-13 Point Park University Factbook * 97
Table 6.3. (Continued)
Am.Indian/ Black or Hispanic NatHawaiian Non-res Two or more Un-Total Female Male Alaska Nat. Asian Afr.Am. of any race /Pacific Isl. Alien White races known
Conservatory of Performing Arts
Cinema&Digital ArtsBachelor of Arts 50 14 36 0 0 2 2 0 0 44 2 0
Subtotal 50 14 36 0 0 2 2 0 0 44 2 0
DanceBachelor of Arts 53 47 6 1 0 2 5 0 1 42 2 0Bachelor of Fine Arts 14 12 2 0 0 0 1 0 1 12 0 0
Subtotal 67 59 8 1 0 2 6 0 2 54 2 0
TheatreBachelor of Arts 37 15 22 0 1 3 2 0 0 31 0 0Bachelor of Fine Arts 31 15 16 1 0 5 1 0 0 22 2 0
Subtotal 68 30 38 1 1 8 3 0 0 53 2 0
University Total 984 592 392 3 10 162 25 1 17 733 32 1
Gender Race/Ethnicity

Academic Programs and Degrees Conferred
Table 6.4 Trends in Degrees Conferred (detail)
School of Arts and SciencesDepartment of Criminal Justice & Intelligence Studies
UndergraduateMajor 2007-08 2008-09 2009-10 2010-11 2011-12 Totals:
CertificateIntelligence & National Security 1 3 1 1 0 6
Total: 1 3 1 1 0 6
Bachelor of ScienceAccelerated Criminal Justice 46 56 41 39 29 211Accelerated Law Enforcement 7 12 6 1 0 26Criminal Justice 10 4 9 7 7 37Criminal Justice/Capstone 16 21 18 7 16 78Intelligence & National Security 6 9 11 18 16 60
Total: 85 102 85 72 68 412
Post-baccalaureateMajor 2007-08 2008-09 2009-10 2010-11 2011-12 Totals:
CertificateIntelligence & National Security 2 1 1 0 0 4
Total: 2 1 1 0 0 4
Bachelor of ScienceIntelligence & National Security 3 2 1 1 1 8
Total: 3 2 1 1 1 8
GraduateMajor 2007-08 2008-09 2009-10 2010-11 2011-12 Totals:
Master of ScienceCriminal Justice Administration 23 19 18 20 19 99
Total: 23 19 18 20 19 99
Department Total: 114 127 106 94 88 529
98 * 2012-13 Point Park University Factbook

Academic Programs and Degrees Conferred
Table 6.4 (Continued)
School of Arts and SciencesDepartment of Education
UndergraduateMajor 2007-08 2008-09 2009-10 2010-11 2011-12 Totals:
Bachelor of ArtsCitizenship/Secondary Educ 3 0 2 0 0 5Early Childhood Education 3 4 1 3 6 17Elementary Education 11 20 24 24 22 101Elementary Educ Theatre Arts 0 0 1 0 0 1English/Secondary Educ 6 8 5 7 9 35Instructional Studies 2 4 8 5 4 23Mass Comm/Sec Educ 0 0 0 1 0 1
Total: 25 36 41 40 41 183
Bachelor of ScienceBiological Sciences/Sec Educ 1 0 0 0 0 1Mathematics/Secondary Educ 2 1 0 2 3 8
Total: 3 1 0 2 3 9
2012-13 Point Park University Factbook * 99

Academic Programs and Degrees Conferred
Table 6.4 (Continued)
School of Arts and Sciences Department of Education (continued)
Post-baccalaureateMajor 2007-08 2008-09 2009-10 2010-11 2011-12 Totals:
CertificateESL Program Specialist 0 0 0 1 2 3
Total: 0 0 0 1 2 3
Associate of ArtsEarly Childhood Education 0 0 0 1 0 1
Total: 0 0 0 1 0 1
Bachelor of ArtsCitizenship/Secondary Educ 0 0 2 3 1 6Early Childhood Education 4 2 1 0 2 9Elementary Education 4 3 5 0 3 15English/Secondary Educ 1 0 0 1 1 3Jour & Mass Comm/Sec Educ 1 0 0 0 0 1Mass Comm/Secondary Educ 0 0 1 0 0 1
Total: 10 5 9 4 7 35
Bachelor of ScienceBiological Sciences/Sec Educ 0 0 1 1 0 2Mathematics/Secondary Educ 2 2 0 0 0 4
Total: 2 2 1 1 0 6
GraduateMajor 2007-08 2008-09 2009-10 2010-11 2011-12 Totals:
CertificatePrincipalship 1 0 2 0 0 3
Total: 1 0 2 0 0 3
Master of ArtsCurriculum and Instruction 16 5 10 6 14 51Educational Administration 6 7 3 1 3 20
Total: 22 12 13 7 17 71
Master of EducationMasters Secon Ed Cert 7th-12th 0 0 0 1 5 6Masters Spec Ed Cert PreK-8th 0 0 0 0 1 1Teaching and Leadership 0 0 0 3 4 7
Total: 0 0 0 4 10 14
Department Total: 63 56 66 60 80 325
100 * 2012-13 Point Park University Factbook

Academic Programs and Degrees Conferred
Table 6.4 (Continued)
School of Arts and SciencesDepartment of Humanities & Human Sciences
UndergraduateMajor 2007-08 2008-09 2009-10 2010-11 2011-12 Totals:
Bachelor of ArtsApplied History 3 3 5 5 5 21Behavioral Sciences 2 3 7 3 4 19English 5 6 9 7 10 37English/Creative Writing 0 0 0 2 6 8Global Cultural Studies 0 0 0 3 9 12Interdisciplinary Studies 1 1 1 0 1 4Legal Studies/Capstone 11 11 7 11 6 46Liberal Studies 0 0 2 3 6 11Liberal Studies/Capstone 0 2 0 2 3 7Political Science 5 4 3 5 3 20Psychology 17 20 11 20 15 83
Total: 44 50 45 61 68 268
Bachelor of ScienceGeneral Studies 0 2 1 0 0 3Liberal Studies 0 0 2 1 1 4
Total: 0 2 3 1 1 7
Post-baccalaureateMajor 2007-08 2008-09 2009-10 2010-11 2011-12 Totals:
Bachelor of ArtsApplied History 0 0 0 1 0 1
Total: 0 0 0 1 0 1
Department Total: 44 52 48 63 69 276
2012-13 Point Park University Factbook * 101
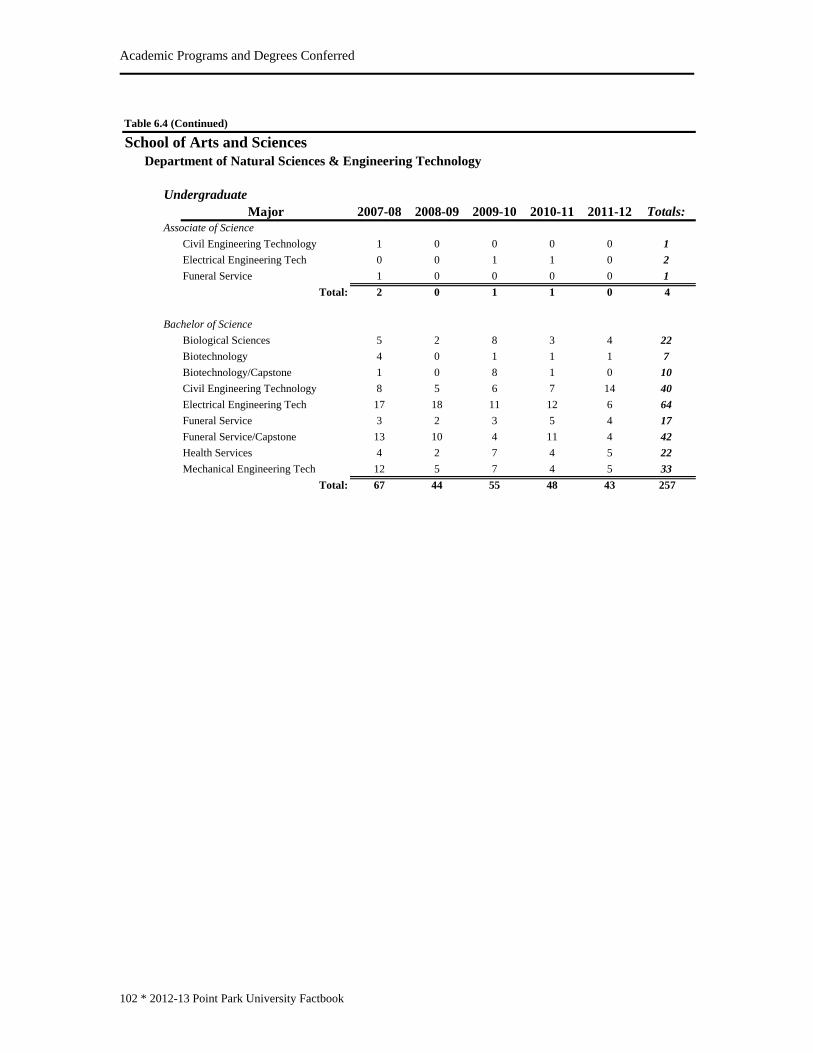
Academic Programs and Degrees Conferred
Table 6.4 (Continued)
School of Arts and SciencesDepartment of Natural Sciences & Engineering Technology
UndergraduateMajor 2007-08 2008-09 2009-10 2010-11 2011-12 Totals:
Associate of ScienceCivil Engineering Technology 1 0 0 0 0 1Electrical Engineering Tech 0 0 1 1 0 2Funeral Service 1 0 0 0 0 1
Total: 2 0 1 1 0 4
Bachelor of ScienceBiological Sciences 5 2 8 3 4 22Biotechnology 4 0 1 1 1 7Biotechnology/Capstone 1 0 8 1 0 10Civil Engineering Technology 8 5 6 7 14 40Electrical Engineering Tech 17 18 11 12 6 64Funeral Service 3 2 3 5 4 17Funeral Service/Capstone 13 10 4 11 4 42Health Services 4 2 7 4 5 22Mechanical Engineering Tech 12 5 7 4 5 33
Total: 67 44 55 48 43 257
102 * 2012-13 Point Park University Factbook

Academic Programs and Degrees Conferred
Table 6.4 (Continued)
School of Arts and Sciences Department of Natural Sciences & Engineering Technology (continued)
Post-baccalaureateMajor 2007-08 2008-09 2009-10 2010-11 2011-12 Totals:
Associate of ScienceElectrical Engineering Tech. 0 1 0 0 0 1
Total: 0 1 0 0 0 1Bachelor of Science
Electrical Engineering Tech. 0 1 0 0 0 1Funeral Services/Capstone 0 0 0 0 1 1Mechanical Engineering Tech. 0 0 0 0 1 1
Total: 0 1 0 0 2 3
GraduateMajor 2007-08 2008-09 2009-10 2010-11 2011-12 Totals:
Master of ScienceEngineering Management 8 6 10 10 7 41Environmental Studies 0 0 0 2 9 11
Total: 8 6 10 12 16 52
Department Total: 77 52 66 61 61 317
2012-13 Point Park University Factbook * 103

Academic Programs and Degrees Conferred
Table 6.4 (Continued)
School of BusinessDepartment of Accounting, Finance & Economics, Information Technology
UndergraduateMajor 2007-08 2008-09 2009-10 2010-11 2011-12 Totals:
Associate of ScienceAccounting 1 0 0 0 0 1
Total: 1 0 0 0 0 1
Bachelor of ScienceAccel Information Tech & Mgmt 24 42 28 26 31 151Accounting 12 11 17 16 14 70Economics and Finance 2 2 1 3 4 12Information Technology 3 4 1 4 6 18
Total: 41 59 47 49 55 251
Post-baccalaureateMajor 2007-08 2008-09 2009-10 2010-11 2011-12 Totals:
Bachelor of ScienceAccounting 3 6 3 4 3 19Information Technology 0 2 0 2 0 4
Total: 3 8 3 6 3 23
Department Total: 45 67 50 55 58 275
104 * 2012-13 Point Park University Factbook

Academic Programs and Degrees Conferred
Table 6.4 (Continued)
School of BusinessDepartment of Management
UndergraduateMajor 2007-08 2008-09 2009-10 2010-11 2011-12 Totals:
Associate of ScienceAccel Professional Studies 2 2 2 2 1 9Business Management 1 0 0 0 0 1Leadership & Public Service 0 0 1 1 2 4Public Administration 0 0 0 1 0 1
Total: 3 2 3 4 3 15
Bachelor of ArtsOrganizational Leadership 0 0 0 5 16 21
Total: 0 0 0 5 16 21
Bachelor of ScienceBusiness 62 43 45 47 54 251Business Management 18 22 25 24 32 121Human Resources Management 4 0 1 1 2 8Human Res. Mgmt/Capstone 3 8 6 4 2 23Management Services 2 3 4 3 1 13Professional Studies 7 12 12 3 3 37Public Administration 5 8 5 4 4 26Sport, Arts & Entertainment Mgmt 30 29 32 34 37 162
Total: 131 125 130 120 135 641
Post-baccalaureateMajor 2007-08 2008-09 2009-10 2010-11 2011-12 Totals:
Bachelor of ScienceHuman Resources Management 2 0 0 3 0 5
Total: 2 0 0 3 0 5
Department Total: 136 127 133 132 154 682
2012-13 Point Park University Factbook * 105

Academic Programs and Degrees Conferred
Table 6.4 (Continued)
School of BusinessDepartment of Global Management & Organization
GraduateMajor 2007-08 2008-09 2009-10 2010-11 2011-12 Totals:
Master of ArtsOrganizational Leadership 8 10 22 18 27 85
Total: 8 10 22 18 27 85
MBAMaster of Business Admin 117 155 156 180 145 753
Total: 117 155 156 180 145 753
Department Total: 125 165 178 198 172 838
106 * 2012-13 Point Park University Factbook
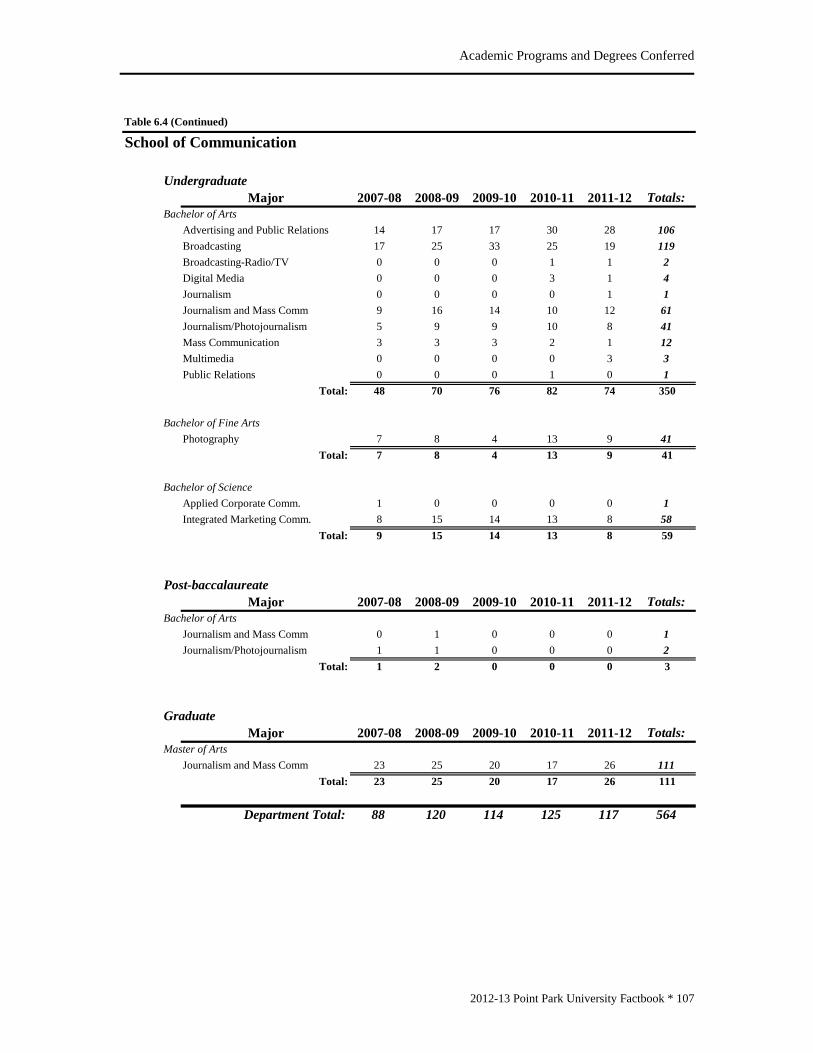
Academic Programs and Degrees Conferred
Table 6.4 (Continued)
School of Communication
UndergraduateMajor 2007-08 2008-09 2009-10 2010-11 2011-12 Totals:
Bachelor of ArtsAdvertising and Public Relations 14 17 17 30 28 106Broadcasting 17 25 33 25 19 119Broadcasting-Radio/TV 0 0 0 1 1 2Digital Media 0 0 0 3 1 4Journalism 0 0 0 0 1 1Journalism and Mass Comm 9 16 14 10 12 61Journalism/Photojournalism 5 9 9 10 8 41Mass Communication 3 3 3 2 1 12Multimedia 0 0 0 0 3 3Public Relations 0 0 0 1 0 1
Total: 48 70 76 82 74 350
Bachelor of Fine ArtsPhotography 7 8 4 13 9 41
Total: 7 8 4 13 9 41
Bachelor of ScienceApplied Corporate Comm. 1 0 0 0 0 1Integrated Marketing Comm. 8 15 14 13 8 58
Total: 9 15 14 13 8 59
Post-baccalaureateMajor 2007-08 2008-09 2009-10 2010-11 2011-12 Totals:
Bachelor of ArtsJournalism and Mass Comm 0 1 0 0 0 1Journalism/Photojournalism 1 1 0 0 0 2
Total: 1 2 0 0 0 3
GraduateMajor 2007-08 2008-09 2009-10 2010-11 2011-12 Totals:
Master of ArtsJournalism and Mass Comm 23 25 20 17 26 111
Total: 23 25 20 17 26 111
Department Total: 88 120 114 125 117 564
2012-13 Point Park University Factbook * 107

Academic Programs and Degrees Conferred
Table 6.4 (Continued)
Conservatory of Performing ArtsDepartment of Cinema & Digital Arts
UndergraduateMajor 2007-08 2008-09 2009-10 2010-11 2011-12 Totals:
Bachelor of ArtsCinema and Digital Arts 32 37 34 33 48 184Film and Video Production 6 0 6 6 2 20
Total: 38 37 40 39 50 204
Bachelor of Fine ArtsFilm and Video Production 5 3 1 1 0 10
Total: 5 3 1 1 0 10
Department Total: 43 40 41 40 50 214
108 * 2012-13 Point Park University Factbook

Academic Programs and Degrees Conferred
Table 6.4 (Continued)
Conservatory of Performing ArtsDepartment of Dance
UndergraduateMajor 2007-08 2008-09 2009-10 2010-11 2011-12 Totals:
Bachelor of ArtsDance 36 41 40 40 53 210Dance Pedagogy 1 0 1 0 0 2
Total: 37 41 41 40 53 212
Bachelor of Fine ArtsDance 6 7 6 8 14 41
Total: 6 7 6 8 14 41
Department Total: 43 48 47 48 67 253
2012-13 Point Park University Factbook * 109
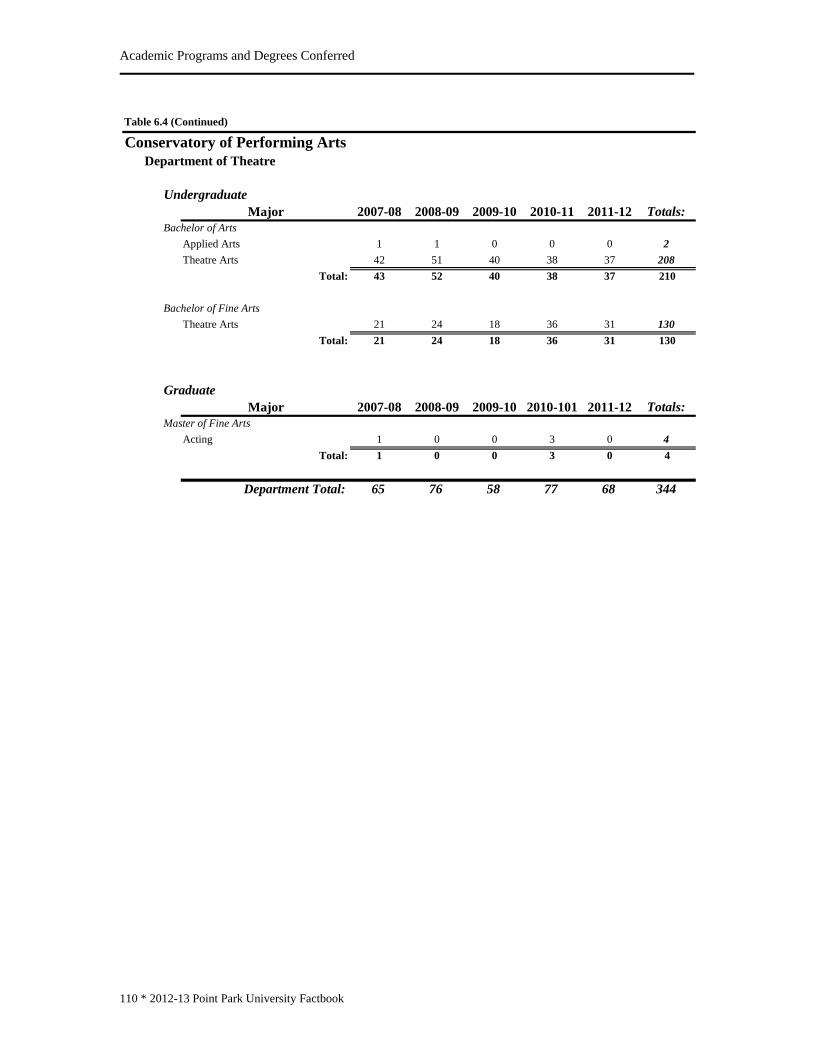
Academic Programs and Degrees Conferred
Table 6.4 (Continued)
Conservatory of Performing ArtsDepartment of Theatre
UndergraduateMajor 2007-08 2008-09 2009-10 2010-11 2011-12 Totals:
Bachelor of ArtsApplied Arts 1 1 0 0 0 2Theatre Arts 42 51 40 38 37 208
Total: 43 52 40 38 37 210
Bachelor of Fine ArtsTheatre Arts 21 24 18 36 31 130
Total: 21 24 18 36 31 130
GraduateMajor 2007-08 2008-09 2009-10 2010-101 2011-12 Totals:
Master of Fine ArtsActing 1 0 0 3 0 4
Total: 1 0 0 3 0 4
Department Total: 65 76 58 77 68 344
110 * 2012-13 Point Park University Factbook

Academic Programs and Degrees Conferred
Table 6.5. Degrees Offered, Academic Year 2012-13DegreesCertificates:
School of Arts & SciencesCriminal Justice and Intelligence Studies
Intelligence and National Security, CertificateEducation
Programs Leading to Pennsylvania Certification: Adult Education and Administration, Certificate ESL Program Specialist, Certificate School Principal K-12, Certificate
School of BusinessManagement
Emergency Medical Services, CertificateFire Service Administration, CertificateHuman Resource Management, CertificatePublic Administration, Certificate
Associate Degrees:School of Arts & Sciences
EducationEarly Childhood Education, A.A.
Natural Sciences and Engineering TechnologyAllied Health, A.S.Civil Engineering Technology, A.S.Electrical Engineering Technology, A.S.Mechanical Engineering Technology, A.S.
School of BusinessAccounting, Finance & Economics, Information Technology
Accounting, A.S.Information Technology, A.S.
ManagementBusiness Management, A.S.Leadership and Public Service, A.S.Public Administration, A.S.
Bachelor Degrees:School of Arts & Sciences
Criminal Justice and Intelligence StudiesCriminal Justice, B.S.Criminal Justice (Accelerated), B.S.Criminal Justice (Capstone), B.S.Forensic Science, B.S.Intelligence and National Security, B.S.
2012-13 Point Park University Factbook * 111

Academic Programs and Degrees Conferred
Table 6.5. (Continued)DegreesBachelor Degrees: (con't)
School of Arts & Sciences (con't)Education
Instructional Studies, B.A. Programs Leading to Pennsylvania Certification: Early Childhood Education, B.A. (must be completed by August 31, 2013) Elementary Education, B.A. (must be completed by August 31, 2013) Pre-Kindergarten - 4th Grade, B.A. Pre-Kindergarten - 4th Grade and Special Education (PreK-8), B.A. 4th Grade - 8th Grade (English), B.A. 4th Grade - 8th Grade (English) and Special Education (PreK-8), B.A. 4th Grade - 8th Grade (Math), B.A. 4th Grade - 8th Grade (Math) and Special Education (PreK-8), B.A. 4th Grade - 8th Grade (Science), B.A. 4th Grade - 8th Grade (Science) and Special Education (PreK-8), B.A. 4th Grade - 8th Grade (Social Studies), B.A. 4th Grade - 8th Grade (Social Studies) and Special Education (PreK-8), B.A. Secondary Education - Biology, B.S. Secondary Education - Biology and Special Education (Grades 7-12), B.S. Secondary Education - Citizenship, B.A. Secondary Education - Citizenship and Special Education (Grades 7-12), B.A. Secondary Education - English, B.A. Secondary Education - English and Special Education (Grades 7-12), B.A. Secondary Education - Mass Communication, B.A. Secondary Education - Mass Communication and Special Education (Grades 7-12), B.A. Secondary Education - Mathematics, B.S. Secondary Education - Mathematics and Special Education (Grades 7-12), B.S.
Humanities and Human SciencesBehavioral Sciences, B.A.English, B.A.English/Creative Writing, B.A.Global Cultural Studies, B.A.History, B.A.Interdisciplinary Design, B.A., B.S.Legal Studies, B.A.Legal Studies (Capstone), B.A.Liberal Studies, B.A., B.S.Liberal Studies (Capstone), B.A., B.S.Political Science, B.A.Psychology, B.A.
Natural Sciences and Engineering TechnologyBiological Sciences, B.S.Biotechnology, B.S.Biotechnology (Capstone), B.S.Civil Engineering Technology, B.S.Electrical Engineering Technology, B.S.Environmental Health Science and Protection, B.S.Funeral Service, B.S.Funeral Service (Capstone), B.A., B.S.Health Services (Capstone), B.S.Mechanical Engineering Technology, B.S.Premedical and Preprofessional Studies, B.S.
112 * 2012-13 Point Park University Factbook
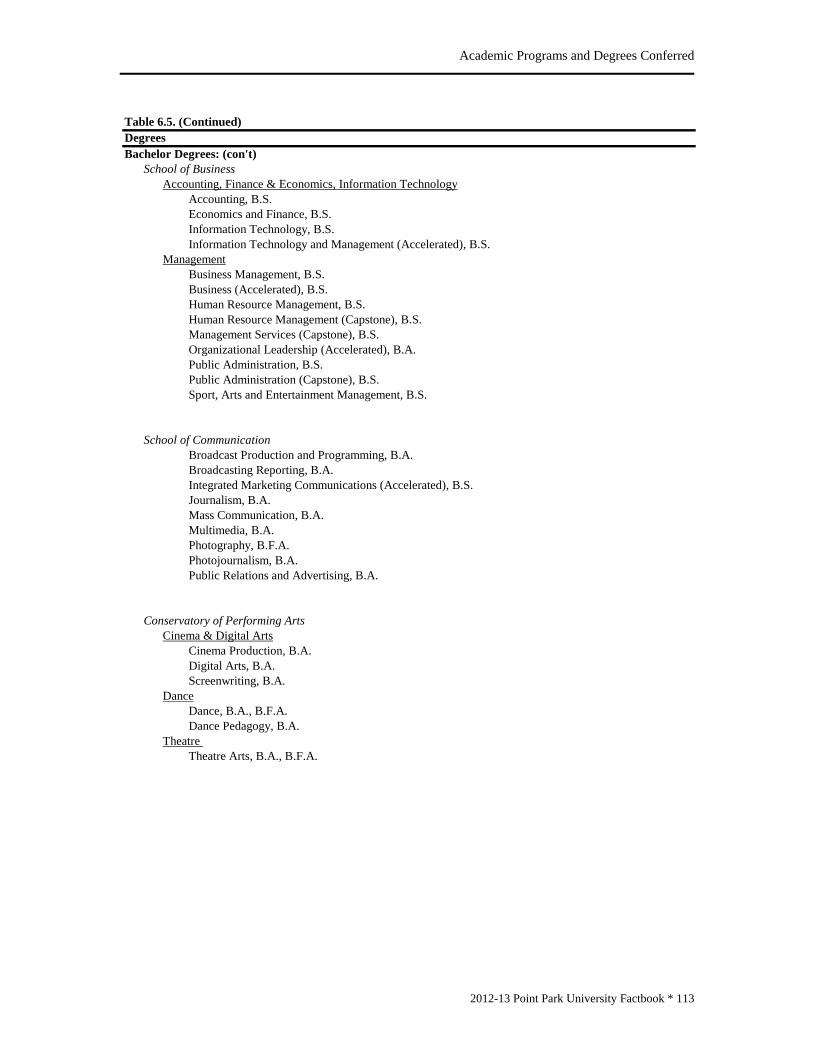
Academic Programs and Degrees Conferred
Table 6.5. (Continued)DegreesBachelor Degrees: (con't)
School of BusinessAccounting, Finance & Economics, Information Technology
Accounting, B.S.Economics and Finance, B.S.Information Technology, B.S.Information Technology and Management (Accelerated), B.S.
ManagementBusiness Management, B.S.Business (Accelerated), B.S. Human Resource Management, B.S.Human Resource Management (Capstone), B.S.Management Services (Capstone), B.S.Organizational Leadership (Accelerated), B.A.Public Administration, B.S.Public Administration (Capstone), B.S.Sport, Arts and Entertainment Management, B.S.
School of CommunicationBroadcast Production and Programming, B.A.Broadcasting Reporting, B.A.Integrated Marketing Communications (Accelerated), B.S.Journalism, B.A.Mass Communication, B.A.Multimedia, B.A.Photography, B.F.A.Photojournalism, B.A.Public Relations and Advertising, B.A.
Conservatory of Performing ArtsCinema & Digital Arts
Cinema Production, B.A.Digital Arts, B.A.Screenwriting, B.A.
DanceDance, B.A., B.F.A.Dance Pedagogy, B.A.
Theatre Theatre Arts, B.A., B.F.A.
2012-13 Point Park University Factbook * 113

Academic Programs and Degrees Conferred
114 * 2012-13 Point Park University Factbook
Table 6.5. (Continued)DegreesMasters Degrees:
School of Arts & SciencesCriminal Justice and Intelligence Studies
Criminal Justice Administration, M.S.Education
Teaching and Leadership, M.Ed. Programs Leading to Pennsylvania Certification: Curriculum and Instruction, M.A. Educational Administration, M.A. Secondary Education Certification Grades 7-12, M.Ed. Special Education Grades 7-12, M.Ed. Special Education Pre-K - Grade 8, M.Ed.
Natural Sciences and Engineering TechnologyEngineering Management, M.S.Environmental Studies, M.S.
School of BusinessGlobal Management & Organization
Master of Business Administration, M.B.A.Organizational Leadership, M.A.
School of CommunicationJournalism & Mass Communication, M.A.
Conservatory of Performing ArtsTheatre
Acting, M.F.A.
Total University Degree Programs OfferedCertificates 8Associates (A.A., A.S.) 10Bachelors (B.A., B.S., B.F.A.) 85Masters (M.A., M.B.A., M.Ed., M.F.A., M.S.) 13Total 116

FACULTY AND
STAFF

Faculty & Staff
FACULTY AND STAFF This chapter of the factbook pertains to full-time faculty and staff only. Part-time/adjunct faculty and staff are very transient populations, thus making it difficult to track and include in this chapter. Overall, in fall 2012, there were 136 full-time faculty and 288 full-time staff. The total (424) represents an increase of 6 full-time faculty while full-time staff remained the same as the prior year. When compared to five years ago, Point Park has increased the number of full-time faculty and staff by 7% (table 7.1) Almost two-thirds (62%) of the full-time faculty are male while only 42% of the full-time staff are male, (table 7.2). Only 8% of both full-time faculty and staff are considered being part of a racial/ethnic minority (table 7.3). This is consistent with the previous year, fall 2011. To see a more detailed breakdown of full-time faculty by academic department and gender/race, refer to table 7.4. As shown in table 7.5, the largest increase in average faculty salary from 2011 to 2012 occurred within the rank of ‘assistant professor’ (1.04%). Decreases occurred in the average faculty salary within the rank of ‘professor’ (-0.03%) followed by ‘associate professor’ (-3.25%) whereas the rank of ‘instructor/teaching artist’ remains unchanged. According to table 7.6, 60% of the full-time faculty are tenured in fall 2012 while another 29% are on tenure-track. The academic departments of Natural Sciences and Engineering Technology, Business, Humanities and Human Sciences, and Education have the highest percentage of full-time faculty who are tenured (80%, 71%, 70% and 67%, respectively). Table 7.7 shows that the mean years of service for professors is at 25 while the other ranks have substantially lower number of mean years of service.
2012-13 Point Park University Factbook * 115

Faculty & Staff
Table 7.1. Summary of Full-time Faculty and Staff
Fall 2008 Fall 2011 Fall 2012% change from
'11 to '12% change from
'08 to '12Full-time Faculty 114 130 136 5% 19%Full-time Staff 284 288 288 0% 1%
Total 398 418 424 1% 7%
114130 136
284 288 288
0
50
100
150
200
250
300
350
Fall 2008 Fall 2011 Fall 2012
Fig. 7.1. Full-time Faculty and Staff
Full-time Faculty
Full-time Staff
116 * 2012-13 Point Park University Factbook
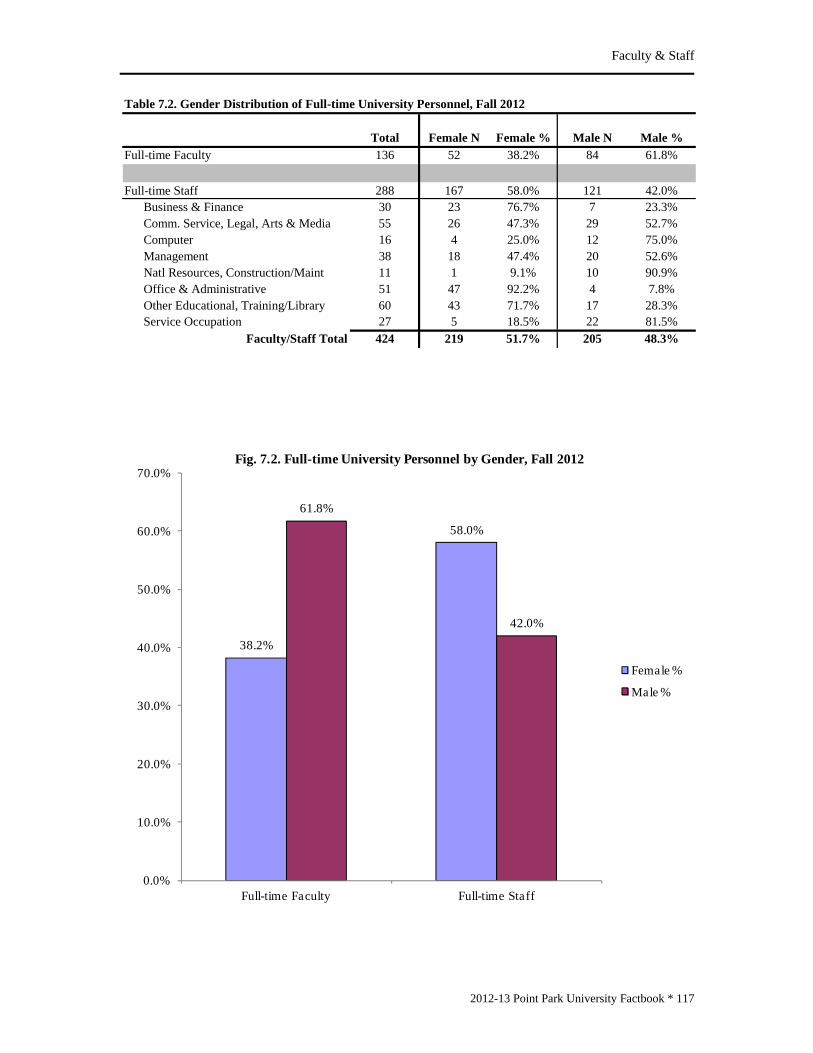
Faculty & Staff
Table 7.2. Gender Distribution of Full-time University Personnel, Fall 2012
Total Female N Female % Male N Male %Full-time Faculty 136 52 38.2% 84 61.8%
Full-time Staff 288 167 58.0% 121 42.0%Business & Finance 30 23 76.7% 7 23.3%Comm. Service, Legal, Arts & Media 55 26 47.3% 29 52.7%Computer 16 4 25.0% 12 75.0%Management 38 18 47.4% 20 52.6%Natl Resources, Construction/Maint 11 1 9.1% 10 90.9%Office & Administrative 51 47 92.2% 4 7.8%Other Educational, Training/Library 60 43 71.7% 17 28.3%Service Occupation 27 5 18.5% 22 81.5%
Faculty/Staff Total 424 219 51.7% 205 48.3%
38.2%
58.0%
61.8%
42.0%
0.0%
10.0%
20.0%
30.0%
40.0%
50.0%
60.0%
70.0%
Full-time Faculty Full-time Staff
Fig. 7.2. Full-time University Personnel by Gender, Fall 2012
Female %
Male %
2012-13 Point Park University Factbook * 117

Faculty & Staff
Table 7.3. Race/Ethnicity Distribution of Full-time University Personnel, Fall 2012
N % N % N % N % N % TotalFull-time Faculty 3 2.2% 5 3.7% 3 2.2% 122 89.7% 3 2.2% 136
Full-time Staff 0 0.0% 11 3.8% 2 0.7% 268 93.1% 7 2.4% 288Business & Finance 0 na 1 3.3% 2 6.7% 27 90.0% 0 na 30Comm. Service, Legal, Arts & Media 0 na 0 na 0 na 54 98.2% 1 1.8% 55Computer 0 na 0 na 0 na 16 100.0% 0 na 16Management 0 na 0 na 0 na 36 94.7% 2 5.3% 38Natl Resources, Construction/Maint 0 na 2 18.2% 0 na 9 81.8% 0 na 11Office & Administrative 0 na 2 3.9% 0 na 47 92.2% 2 3.9% 51Other Educational, Training/Library 0 na 4 6.7% 0 na 56 93.3% 0 na 60Service Occupation 0 na 2 7.4% 0 na 23 85.2% 2 7.4% 27
Faculty/Staff Total 3 0.7% 16 3.8% 5 1.2% 390 92.0% 10 2.4% 424
AsianBlack or
African-Am WhiteHispanicTwo or more
races
2.2% 3.7% 2.2%
89.7%
2.2%0.0%
3.8%0.7%
93.1%
2.4%
0.0%
10.0%
20.0%
30.0%
40.0%
50.0%
60.0%
70.0%
80.0%
90.0%
100.0%
Asian Black or African
American
Hispanic White Two or more races
Fig. 7.3. Full-time University Personnel by Race/Ethnicity, Fall 2012
Full-time Faculty
Full-time Staff
118 * 2012-13 Point Park University Factbook

Faculty & Staff
Table 7.4. Full-time Faculty by School/Department, Gender and Race/Ethnicity, Fall 2012
Male Female AsianBlack or
African-Am Hispanic WhiteTwo or more
races
Crim Justice&Intel Std 4 2 0 1 0 4 1Education 3 6 0 1 1 7 0Humanities&HumanSci 12 8 0 0 0 20 0Natl Sci & Engr Tech 12 3 1 0 0 14 0Business 18 13 2 1 2 25 1Communication 9 5 0 0 0 14 0Conservatory 26 15 0 2 0 38 1
Total 84 52 3 5 3 122 3
Gender Race/Ethnicity
Table 7.5. Full-time Faculty Salary by Rank
FT Faculty Salary by Rank
2010-11 Avg Sal
($)# FT
Faculty
2011-12 Avg Sal
($)# FT
Faculty
2012-13 Avg Sal
($)# FT
Faculty
% salary chg '11 to
'12
% salary chg '10 to
'12
Professor $83,739 46 $84,456 47 $84,433 54 -0.03% 0.83%Associate Professor $65,582 29 $65,646 35 $63,513 34 -3.25% -3.15%Assistant Professor $54,033 34 $54,372 35 $54,935 33 1.04% 1.67%Instructor/Teaching Artist* $51,267 5 $54,402 3 $54,402 3 0.00% 6.12%
*does not include Visiting, Professionals in Residence
$30,000
$40,000
$50,000
$60,000
$70,000
$80,000
$90,000
2010-11 Avg Sal ($) 2011-12 Avg Sal ($) 2012-13 Avg Sal ($)
Fig. 7.4. Full-time Faculty Salary by Rank
Professor
Associate Professor
Assistant Professor
Instructor/Teaching Artist*
2012-13 Point Park University Factbook * 119

Faculty & Staff
Table 7.6. Tenure Status of Full-time Faculty by Academic School/Department, Fall 2012Total
N % N % N % NCrim Justice & Intel 3 50.0% 3 50.0% 0 0.0% 6Education 6 66.7% 1 11.1% 2 22.2% 9Humanities&HumanSci 14 70.0% 5 25.0% 1 5.0% 20Nat Sci & Engr Tech 12 80.0% 3 20.0% 0 0.0% 15Business 22 71.0% 8 25.8% 1 3.2% 31Communication 8 57.1% 4 28.6% 2 14.3% 14Conservatory 17 41.5% 15 36.6% 9 22.0% 41
Total 82 60.3% 39 28.7% 15 11.0% 136
Tenured Tenure-track Non-tenure track
60.3%
28.7%
11.0%
0.0%
10.0%
20.0%
30.0%
40.0%
50.0%
60.0%
70.0%
Tenured Tenure-track Non-tenure track
Fig. 7.5. Tenure Status of Full-time Faculty, Fall 2012
120 * 2012-13 Point Park University Factbook

Faculty & Staff
2012-13 Point Park University Factbook * 121
Table 7.7. Full-time Faculty by Rank and Years of Service, Fall 2012
Under 1 year 1 to 5 years
6 to 10 years
11 to 20 years
21 to 30 years
More than 30 years
Mean Years of Service
Professor 0 5 5 12 15 17 25Associate 2 9 12 8 1 2 9.4Assistant 4 18 6 3 2 0 5.3Instructor 6 5 2 0 1 1 5.4
Total 12 37 25 23 19 20 14
25
9.4
5.3 5.4
0
5
10
15
20
25
30
Professor Associate Assistant Instructor
Fig. 7.6. Mean Years of Service by Full-time Faculty Rank, Fall 2012

BUDGET
Budget
BUDGET The following schedules summarize the University’s budget and results of operations for the fiscal year ended August 31, 2012. The budget is approved annually by the Board of Trustees. This section also highlights the University’s trended historical endowment balances at the end of each respective fiscal year. The final schedule details the primary sources of revenue for the University, tuition and fees, and also reflects the historical trend of those costs. The University relies primarily on revenue generated from tuition and fees. As illustrated in table 8.1, total tuition and fees represent 84.3% of revenue. The majority of auxiliary enterprise revenue is derived from room and board fees. The University’s operating budget (table 8.2) summarizes the primary expenditure categories. As illustrated, the largest category of Instruction and General Institutional Support directly funds the mission of educating students at Point Park. The second largest expenditure category, Student Aid, supports the fact that most Point Park students receive some form of internal financial assistance. Table 8.3 illustrates how the University’s collective endowment has increased over the years. The total endowment consists of two collective fund groups. It includes both donor-restricted endowment funds (the “Endowment Fund”) which are classified as either temporarily or permanently restricted funds, and non-donor unrestricted funds that have been established by the Board of Trustees to function as reserve-type funds (the “Board Designated Fund”). Table 8.4 and figure 8.4 provide additional trended historical information for the University’s tuition, fee, and room and board rates. As stated above, these rates are approved annually by the Board of Trustees as part of the annual budget process.
122 * 2012-13 Point Park University Factbook

Budget
Table 8.1. Total University Budget - Revenue, Fiscal Year 2012
Revenue Amount ($) % of TotalTuition and Fees 79,146,093 84.3%College Fees 2,330,689 2.5%Other Sources 1,894,276 2.0%Auxiliary Enterprises 10,562,494 11.2%Total Revenue 93,933,552 100.0%
Tuition and Fees, 79,146,093
College Fees, 2,330,689
Other Sources, 1,894,276
Auxiliary Enterprises, 10,562,494
Fig. 8.1. Total University Budget - Revenue, Fiscal Year 2012
2012-13 Point Park University Factbook * 123

Budget
Table 8.2. Total University Budget - Expenditures, Fiscal Year 2012
Expenditures Amount ($) % of TotalInstruction and General Institutional Support 46,625,469 50.6%Operation and Maintenance of Physical Plant 7,713,971 8.4%Student Aid 21,419,661 23.2%Library Sevices 749,303 0.8%Interest on Indebtedness 1,824,032 2.0%Depreciation Expense 5,795,588 6.3%Auxiliary Enterprises 8,079,533 8.8%Total Expenditures 92,207,557 100.0%
Instruction and General
Institutional Support,
46,625,469 Operation and Maintenance of Physical Plant,
7,713,971
Student Aid, 21,419,661
Library Sevices, 749,303
Interest on Indebtedness,
1,824,032
Depreciation Expense, 5,795,588
Auxiliary Enterprises, 8,079,533
Fig. 8.2. Total University Budget - Expenditures, Fiscal Year 2012
124 * 2012-13 Point Park University Factbook
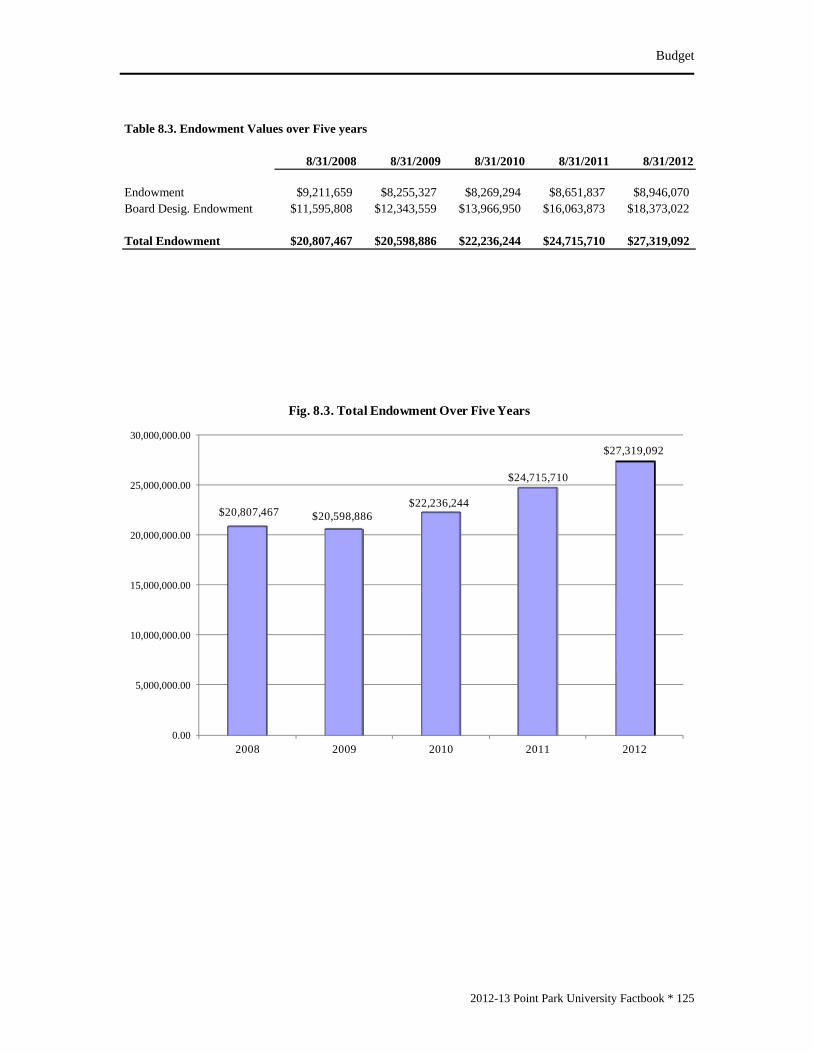
Budget
Table 8.3. Endowment Values over Five years
8/31/2008 8/31/2009 8/31/2010 8/31/2011 8/31/2012
Endowment $9,211,659 $8,255,327 $8,269,294 $8,651,837 $8,946,070Board Desig. Endowment $11,595,808 $12,343,559 $13,966,950 $16,063,873 $18,373,022
Total Endowment $20,807,467 $20,598,886 $22,236,244 $24,715,710 $27,319,092
$20,807,467 $20,598,886 $22,236,244
$24,715,710
$27,319,092
0.00
5,000,000.00
10,000,000.00
15,000,000.00
20,000,000.00
25,000,000.00
30,000,000.00
2008 2009 2010 2011 2012
Fig. 8.3. Total Endowment Over Five Years
2012-13 Point Park University Factbook * 125

Budget
Table 8.4. Tuition & Fee Rates
Annual Tuition ($)
Annual Fees ($)
Annual Total ($)
Per Credit Hour ($)
Annual Room & Board ($) *
2008 - 2009Non-COPA Undergraduate $19,980 $590 $20,570 $552 $8,940COPA Undergraduate $23,980 $590 $24,570 $681 $8,940Graduate n/a n/a n/a $635 $8,940
2009 - 2010Non-COPA Undergraduate $20,720 $614 $21,334 $574 $9,020COPA Undergraduate $25,100 $614 $25,714 $713 $9,020Graduate n/a n/a n/a $660 $9,020
2010 - 2011Non-COPA Undergraduate $21,700 $800 $22,500 $602 $9,480COPA Undergraduate $26,600 $800 $27,400 $755 $9,480Graduate n/a n/a n/a $692 $9,480
2011 - 2012Non-COPA Undergraduate $22,900 $820 $23,720 $650 $9,720COPA Undergraduate $28,900 $820 $29,720 $820 $9,720Graduate n/a n/a n/a $725 $9,720
2012 - 2013Non-COPA Undergraduate $24,020 $1,170 $25,190 $682 $9,920COPA Undergraduate $30,320 $1,170 $31,490 $860 $9,920Graduate n/a n/a n/a $761 $9,920
Academic Year
*Annual Room & Board is Double Room Rate plus 14 Meal Flex Plan Rate
126 * 2012-13 Point Park University Factbook
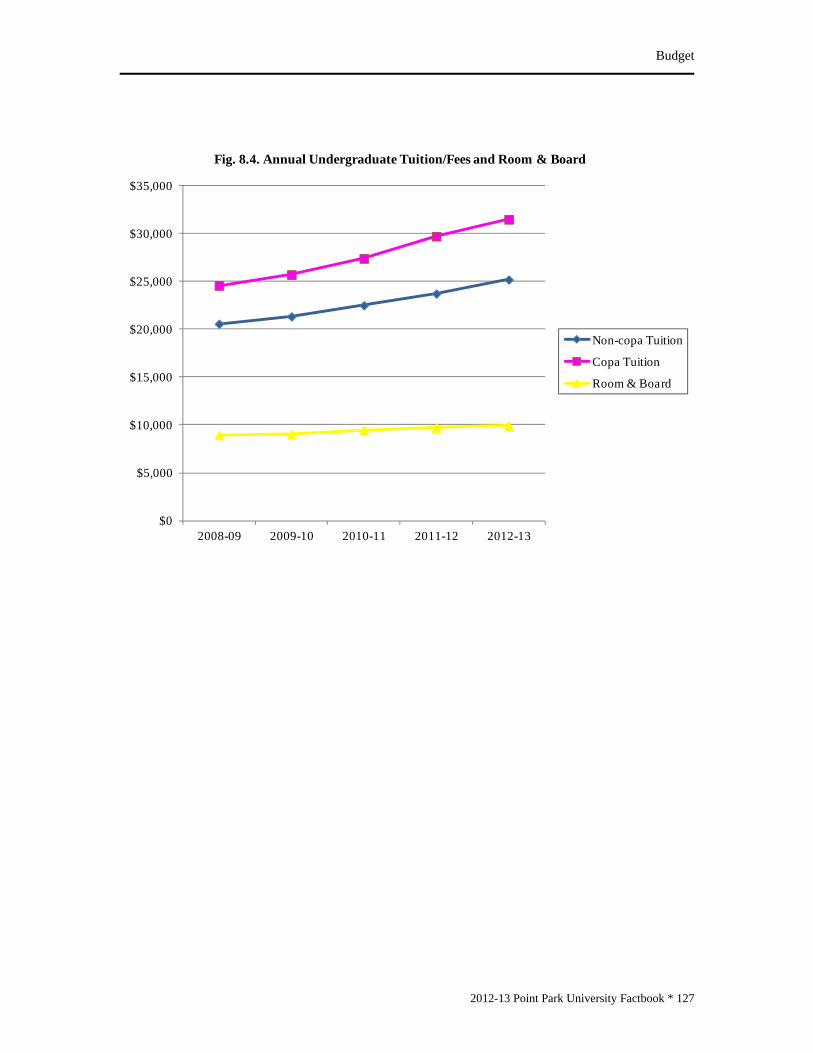
Budget
2012-13 Point Park University Factbook * 127
$0
$5,000
$10,000
$15,000
$20,000
$25,000
$30,000
$35,000
2008-09 2009-10 2010-11 2011-12 2012-13
Fig. 8.4. Annual Undergraduate Tuition/Fees and Room & Board
Non-copa Tuition
Copa Tuition
Room & Board


