PETITION FOR PROMULGATION OF REGULATIONS PURSUANT TO SECTION 101(a)(5) OF THE MARINE MAMMAL PROTECTION ACT for Oil and Gas Activities in the Beaufort Sea and Adjacent North Slope of Alaska 2011-2016 Polar Bear (Ursus maritimus) Pacific Walrus (Odobenus rosmarus divergens) Prepared for Alaska Oil and Gas Association 121 W. Fireweed Lane, Suite 207 Anchorage, AK 99503 Prepared by URS Corporation 560 E. 34 th Ave, Suite 100 Anchorage, Alaska 99503 April, 2009
Transcript
PETITION FOR PROMULGATION OF REGULATIONS PURSUANT TO
SECTION 101(a)(5) OF THE MARINE MAMMAL PROTECTION ACT
for
Oil and Gas Activities in the Beaufort Sea and Adjacent North Slope of Alaska
Alaska Oil and Gas Association 121 W. Fireweed Lane, Suite 207
Anchorage, AK 99503
Prepared by
URS Corporation
560 E. 34th Ave, Suite 100 Anchorage, Alaska 99503
April, 2009
TABLE OF CONTENTS Page 1.0 Statement of Request and Context ................................................................................................1-1
1.1 Nature of Request ............................................................................................................1-1 1.2 Regulatory Context ..........................................................................................................1-3
1.3 Scientific Context ............................................................................................................1-7 1.4 Information Submitted in Response to the Requirements of 50 CFR § 18.27.................1-8
2.0 Description of Activities ...............................................................................................................2-1 2.1 Oil and Gas Activity ........................................................................................................2-1 2.2 Geological and Geophysical Surveys ..............................................................................2-4
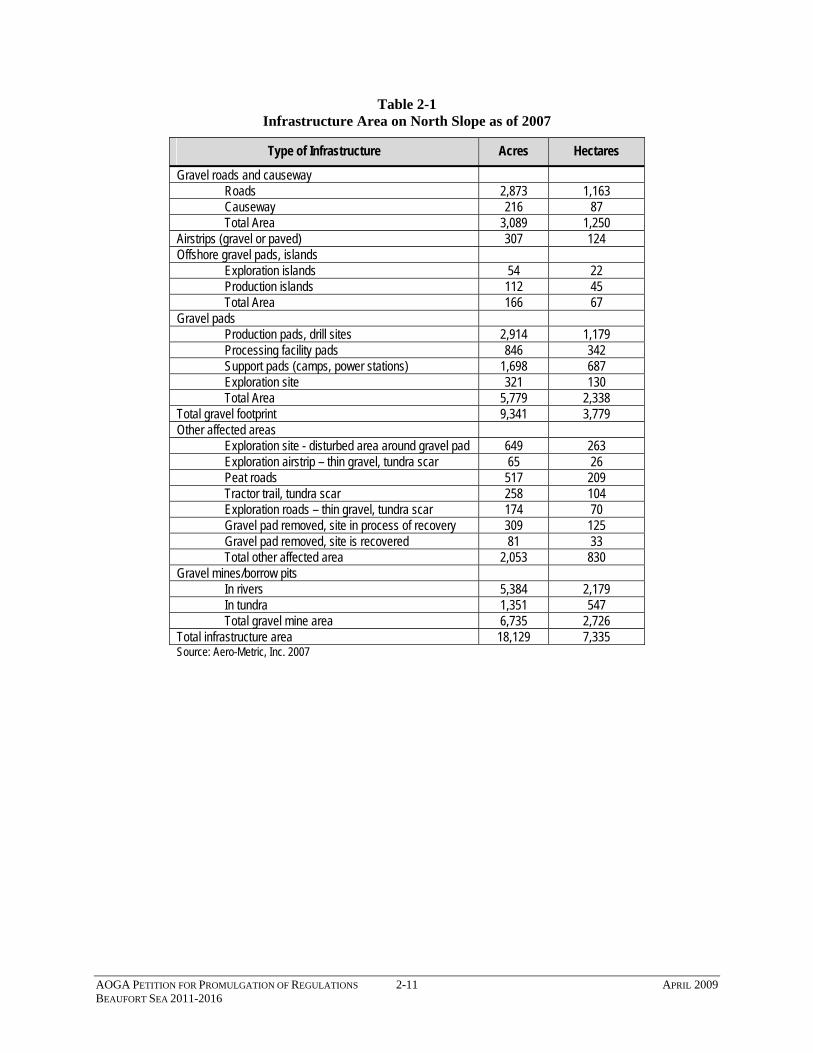
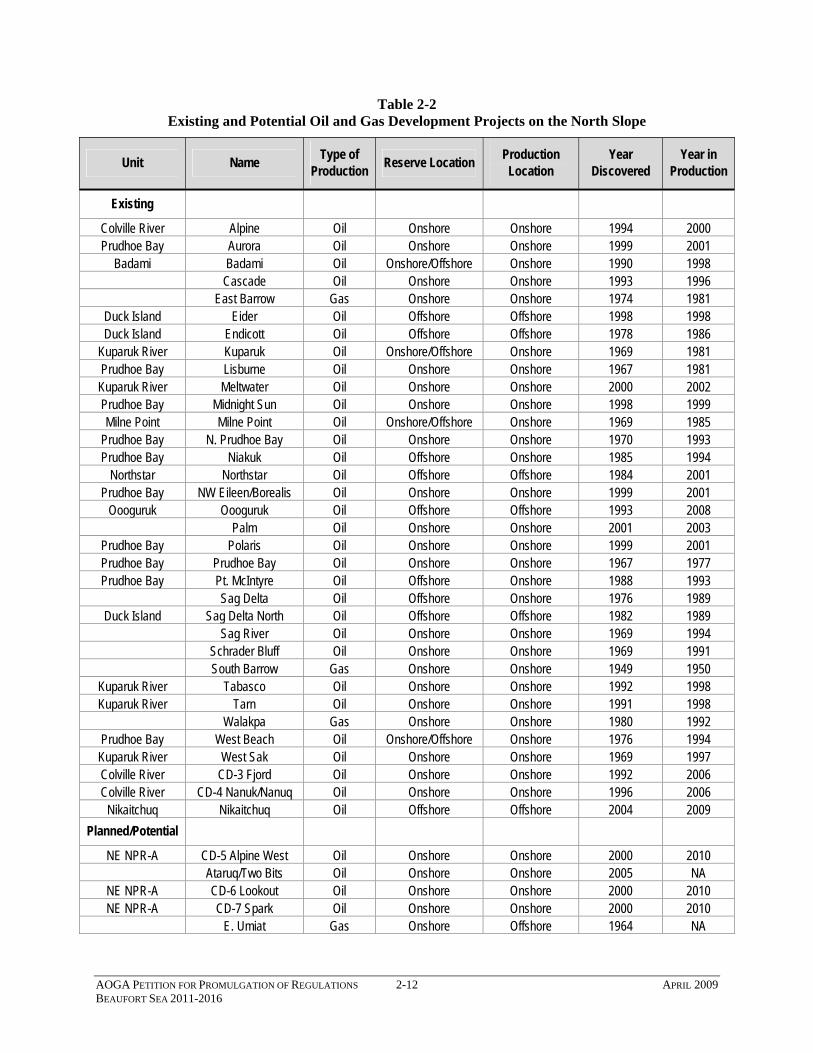
2.5 Development and Production.........................................................................................2-10 2.5.1 Prudhoe Bay Unit..............................................................................................2-13 2.5.2 Kuparuk River Unit ..........................................................................................2-14 2.5.3 Greater Point McIntyre .....................................................................................2-14 2.5.4 Milne Point .......................................................................................................2-14 2.5.5 Endicott.............................................................................................................2-14 2.5.6 Badami..............................................................................................................2-15 2.5.7 Alpine ...............................................................................................................2-15 2.5.8 Northstar ...........................................................................................................2-15 2.5.9 Oooguruk Unit ..................................................................................................2-15 2.5.10 Nikaitchuq Unit ................................................................................................2-16
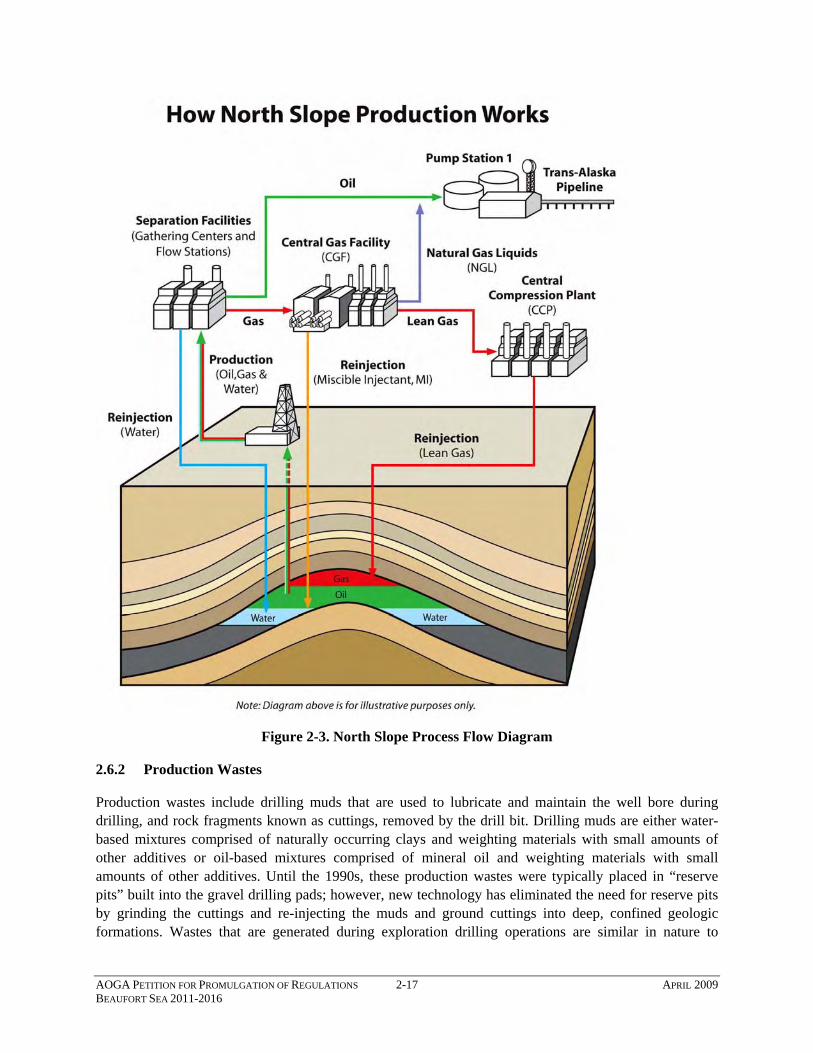
2.6 Oil Production Processes ...............................................................................................2-16 2.6.1 Production Facilities .........................................................................................2-16 2.6.2 Production Wastes ............................................................................................2-17 2.6.3 Decommissioning .............................................................................................2-18
2.7 Support and Distribution................................................................................................2-18 2.7.1 Support Operations ...........................................................................................2-18 2.7.2 Trans-Alaska Pipeline System ..........................................................................2-18
2.8 Planned and Potential Future Activities 2011-2016 ......................................................2-19 2.8.1 Minerals Management Service OCS Lease Sales .............................................2-19 2.8.2 National Petroleum Reserve – Alaska (NPR-A)...............................................2-20 2.8.3 State of Alaska Lease Sales ..............................................................................2-21
AOGA PETITION FOR PROMULGATION OF REGULATIONS i APRIL 2009 BEAUFORT SEA 2011-2016
2.8.4 Liberty...............................................................................................................2-21 2.8.5 Point Thomson..................................................................................................2-21 2.8.6 Alpine Satellites Development .........................................................................2-22 2.8.7 Ataruq (Two Bits).............................................................................................2-22 2.8.8 Shell Offshore Exploration Activities...............................................................2-22 2.8.9 North Shore Development ................................................................................2-23 2.8.10 Potential Future Gas Pipeline ...........................................................................2-23
3.0 Dates, Duration, and Region of Activites .....................................................................................3-1 4.0 Species, Number, and Type of Take.............................................................................................4-1
5.0 Status, Distribution, and Seasonal Distribution of Species...........................................................5-1 5.1 Polar Bear ........................................................................................................................5-1
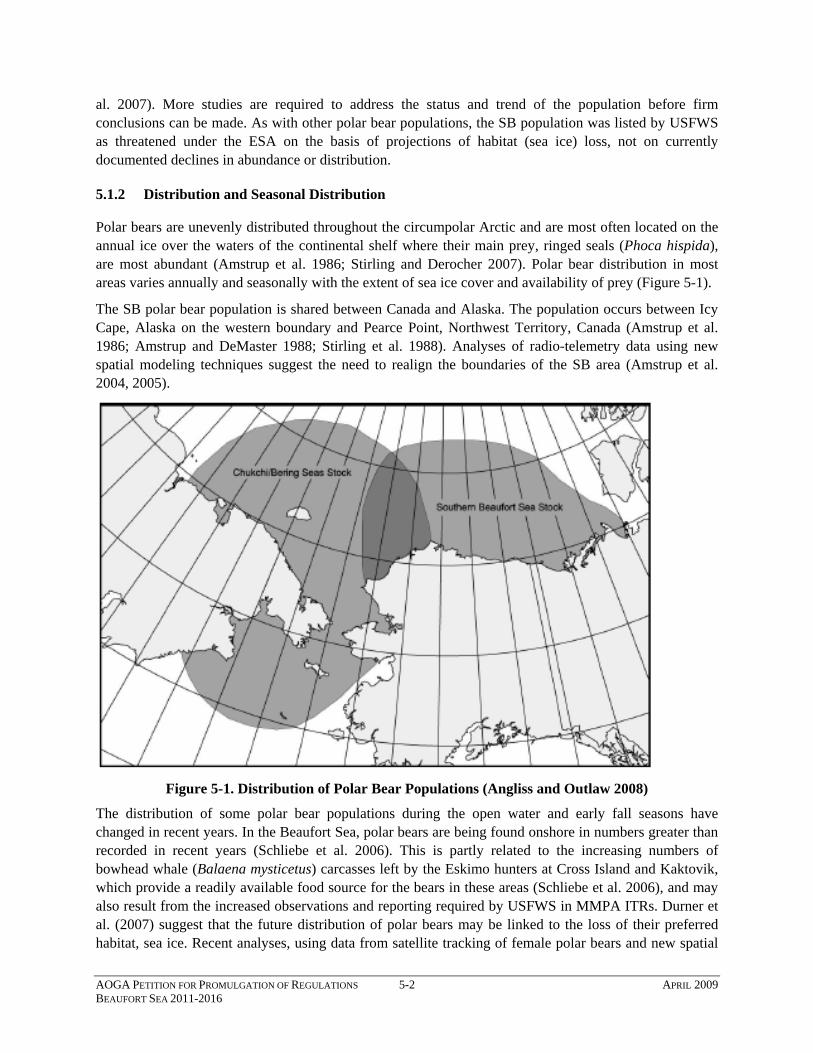
5.1.1 Population Status and Trend ...............................................................................5-1 5.1.2 Distribution and Seasonal Distribution...............................................................5-2 5.1.3 Feeding Ecology .................................................................................................5-3 5.1.4 Reproduction.......................................................................................................5-4 5.1.5 Denning...............................................................................................................5-4 5.1.6 Survival...............................................................................................................5-6 5.1.7 Sea Ice and Climate Change ...............................................................................5-6
5.2 Pacific Walrus..................................................................................................................5-7 5.2.1 Population Status and Trend ...............................................................................5-7 5.2.2 Distribution and Seasonal Distribution...............................................................5-8 5.2.3 Feeding Ecology .................................................................................................5-9 5.2.4 Reproduction.....................................................................................................5-10 5.2.5 Survival.............................................................................................................5-10 5.2.6 Climate Change.................................................................................................5-10
6.0 Anticipated Impact on Species......................................................................................................6-1 6.1 Polar Bear ........................................................................................................................6-1
6.1.1 Noise ...................................................................................................................6-1 6.1.2 Physical Obstruction ...........................................................................................6-7 6.1.3 Human Encounters..............................................................................................6-7 6.1.4 Spills .................................................................................................................6-10 6.1.5 Summary of Anticipated Impacts .....................................................................6-11
8.3 Climate Change................................................................................................................8-4 8.3.1 GHG Emissions ..................................................................................................8-4 8.3.2 Effects of Climate Change on Oil and Gas Activities ........................................8-5
9.0 Anticipated Impact of Habitat Loss or Modification on Species..................................................9-1 10.0 Mitigation Measures ...................................................................................................................10-1
10.3 Spill Response ..................................................................................................10-3 10.3.1 Oil Fate and Behavior in Arctic Waters............................................................10-4 10.3.2 Spill Response Techniques ...............................................................................10-4 10.3.3 Wildlife Management .......................................................................................10-7 10.3.4 Ongoing Research and Development of New Technologies ............................10-8
11.0 Monitoring and Reporting.........................................................................................................11-10 11.1 Monitoring ...................................................................................................................11-10 11.2 Reporting .....................................................................................................................11-10
12.0 Coordination of Research Efforts ...............................................................................................12-1 13.0 References...................................................................................................................................13-1 14.0 List of Petitioners/Representatives .............................................................................................14-1
AOGA PETITION FOR PROMULGATION OF REGULATIONS iii APRIL 2009 BEAUFORT SEA 2011-2016
LIST OF TABLES
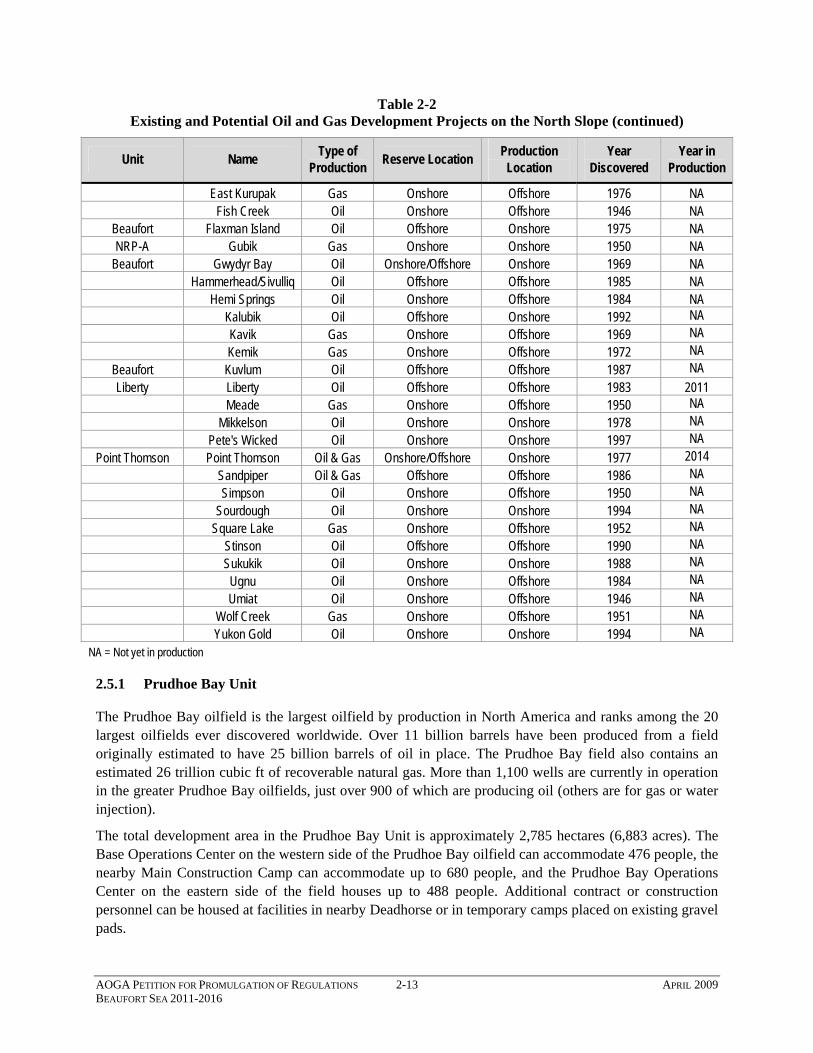
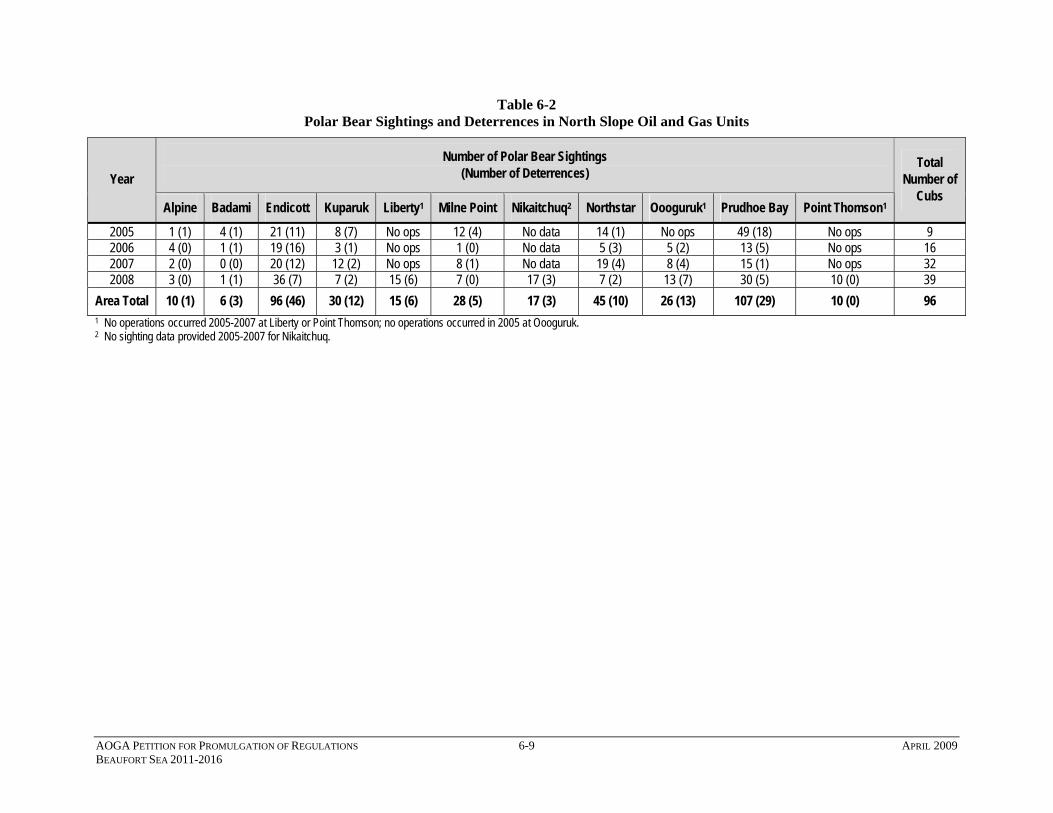
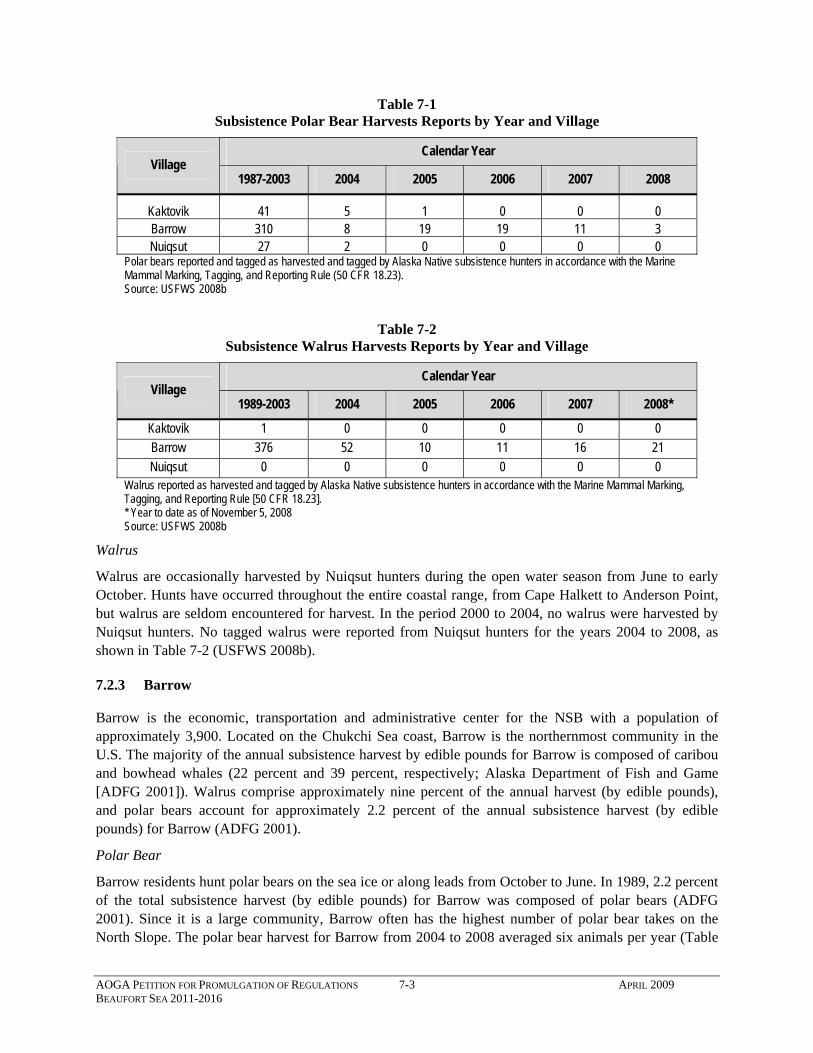
Table 1-1 Location in Petition of CFR § 18.27 Requirements Table 2-1 Infrastructure Area on North Slope as of 2007 Table 2-2 Existing and Potential Oil and Gas Development Projects on the North Slope Table 6-1 Definition of Acoustical Terms Table 6-2 Polar Bear Sightings and Deterrences in North Slope Oil and Gas Units Table 7-1 Subsistence Polar Bear Harvests Reports by Year and Village Table 7-2 Subsistence Walrus Harvests Reports by Year and Village
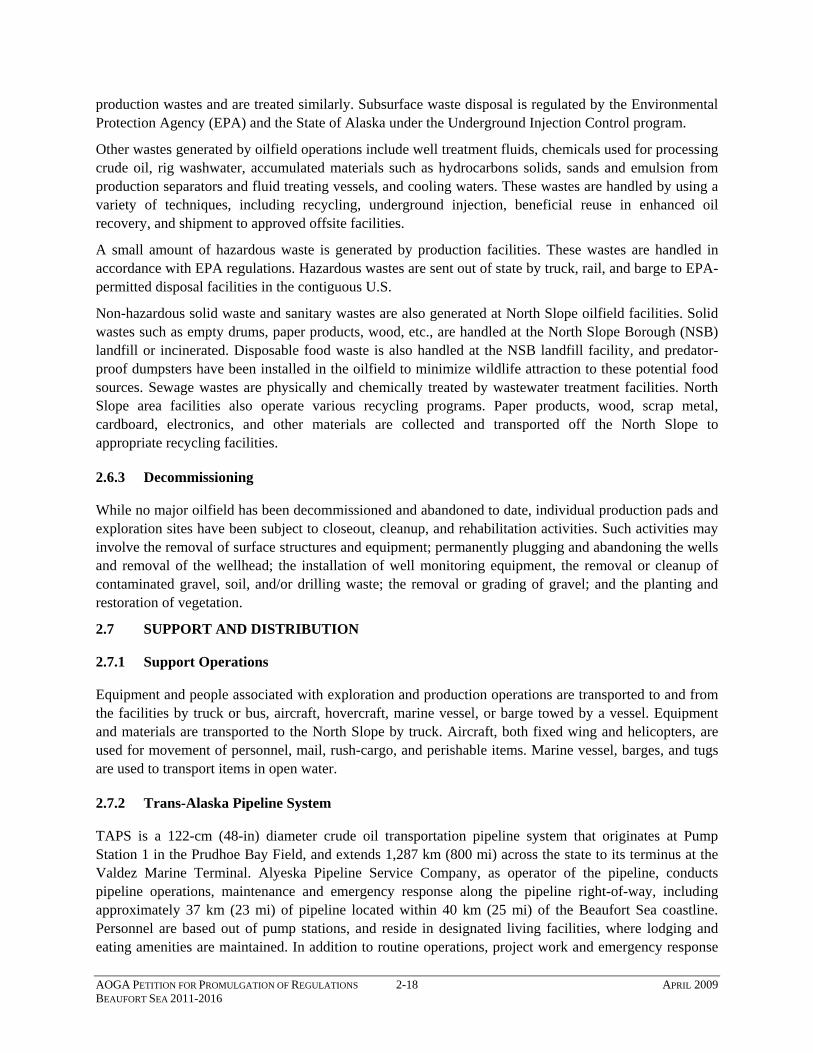
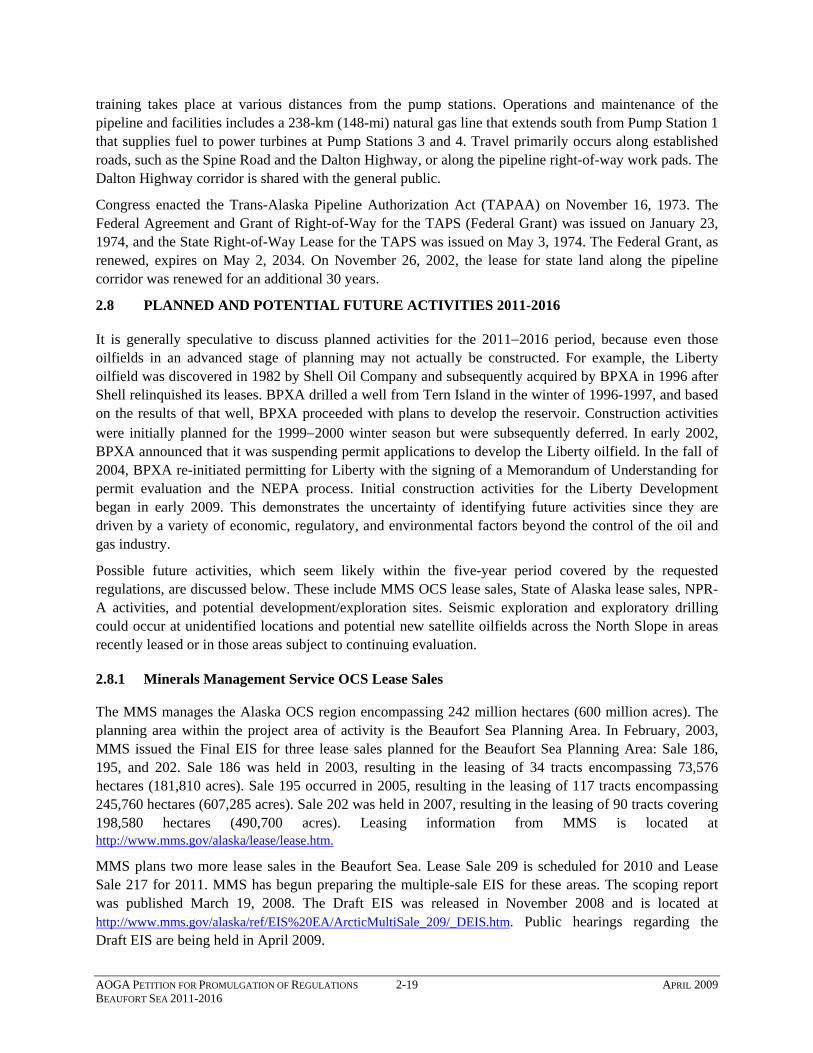
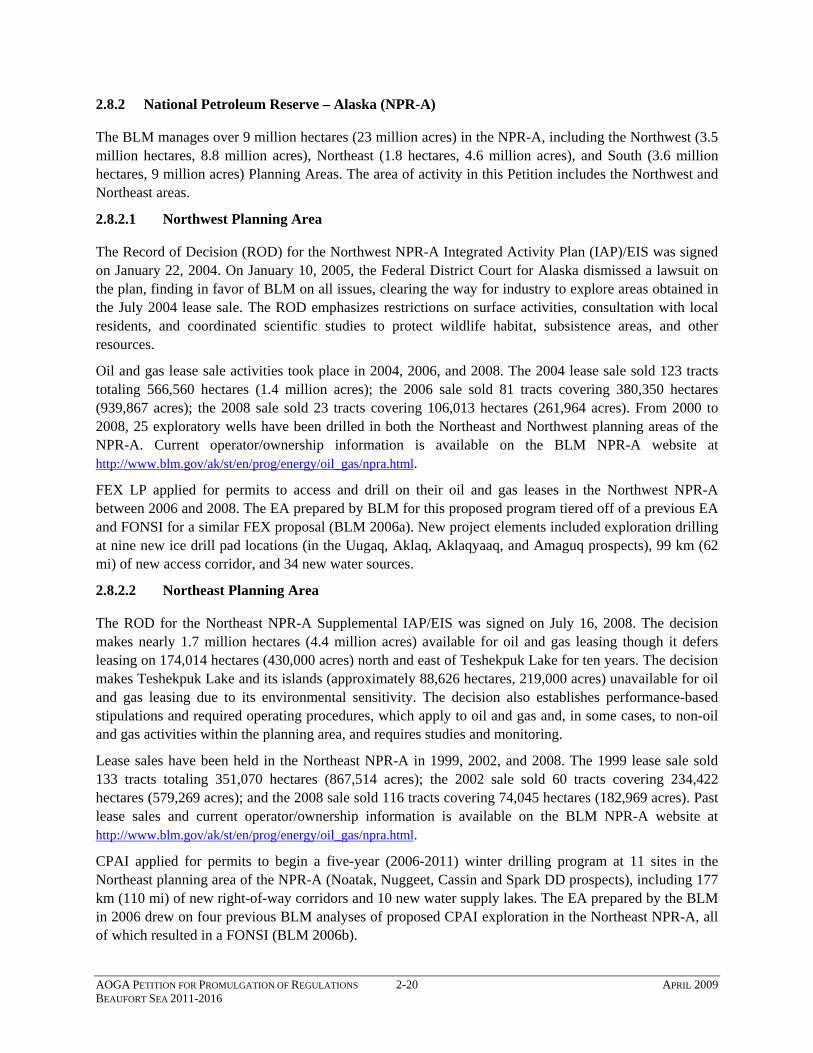
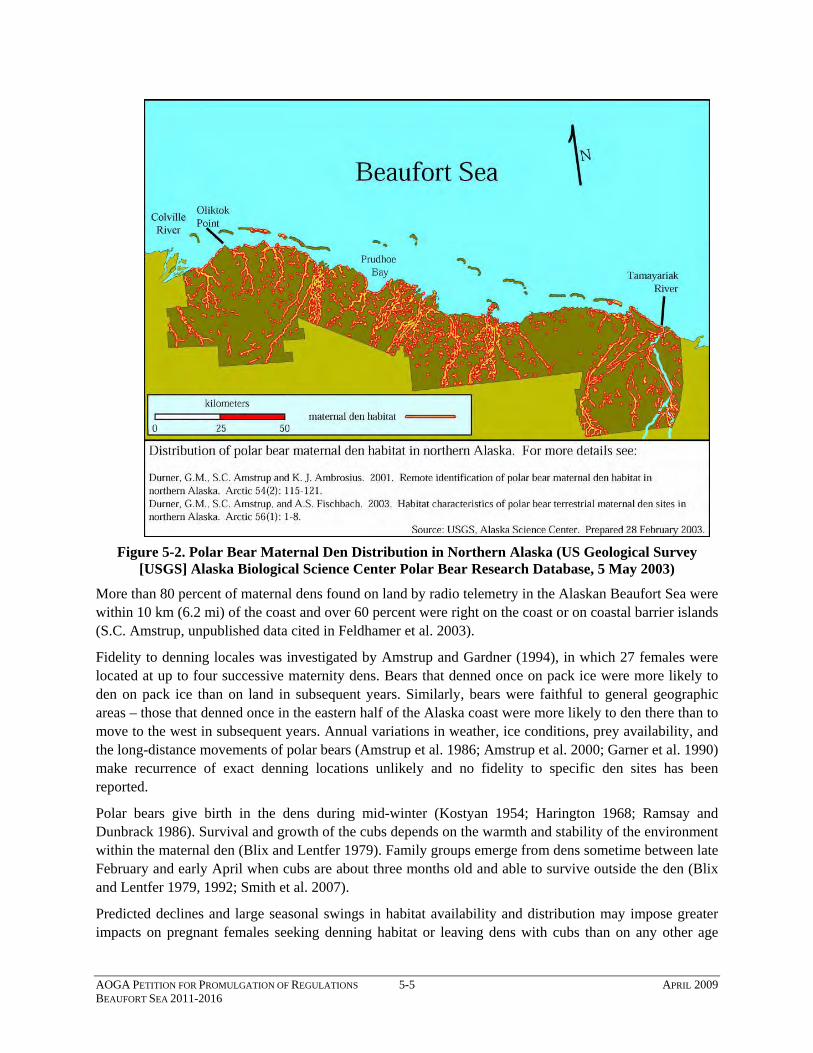
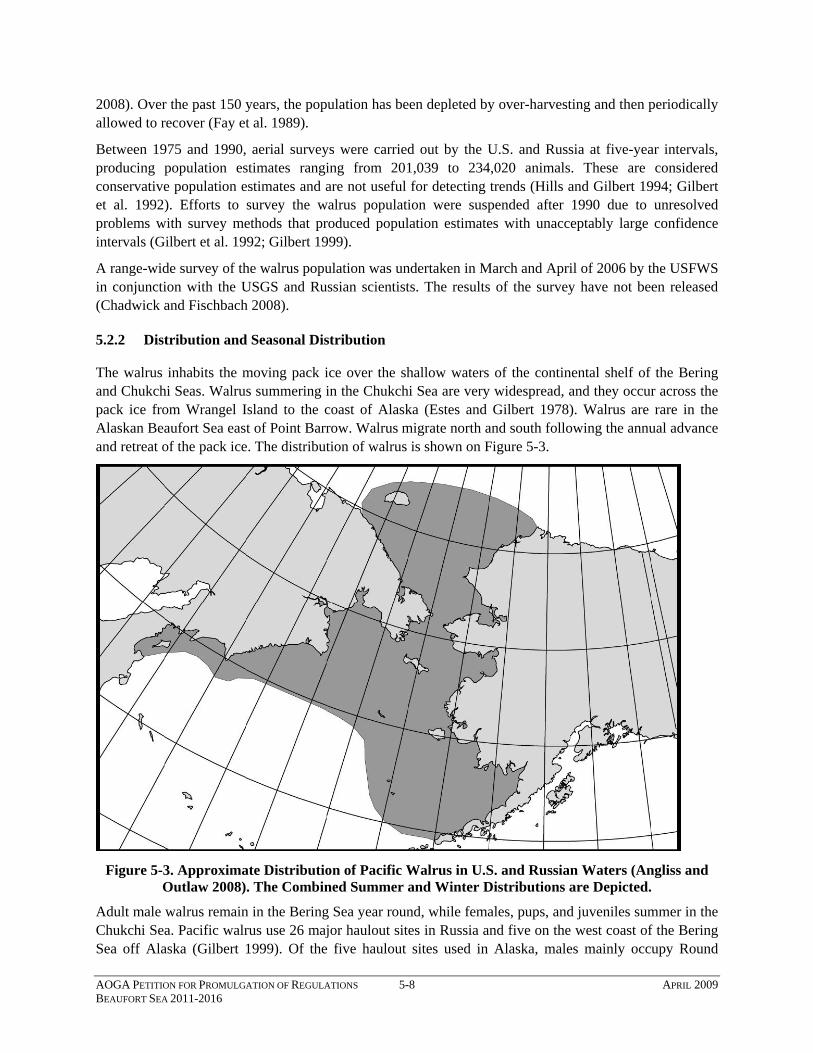
LIST OF FIGURES Figure 1-1 Area of Activity Figure 2-1 Oil and Gas Unit and Leaseholder Ownership Arctic Alaska – March 2009 Figure 2-2 National Petroleum Reserve – Alaska Figure 2-3 North Slope Process Flow Diagram Figure 5-1 Distribution of Polar Bear Populations Figure 5-2 Polar Bear Maternal Den Distribution in Northern Alaska Figure 5-3 Approximated Distribution of Pacific Walrus in U.S. and Russian Waters
AOGA PETITION FOR PROMULGATION OF REGULATIONS iv APRIL 2009 BEAUFORT SEA 2011-2016
LIST OF ACRONYMS AND ABBREVIATIONS 2D two dimensional 3D three dimensional µPa microPascal ACS Alaska Clean Seas ADEC Alaska Department of Environmental Conservation ADFG Alaska Department of Fish and Game ADNR Alaska Department of Natural Resources AGIA Alaska Gasline Inducement Act AMSA Australian Maritime Safety Authority ANWR Arctic National Wildlife Refuge AOGA Alaska Oil and Gas Association ARRT Alaska Regional Response Team ASRC Arctic Slope Regional Corporation AUV autonomous underwater vehicles BLM Bureau of Land Management BOE barrels of oil equivalent BOP blow out preventer boph barrels of oil per hour BPXA BP Exploration Alaska Inc. BRPC Brooks Range Petroleum Corporation CEQ Council on Environmental Quality CFR Code of Federal Regulations CGF Central Gas Facility Chevron Chevron USA, Inc. CHOPS cold heavy oil production with sand CI confidence interval CITES Convention on International Trade in Endangered Species of Wild Fauna and Flora cm centimeter CPAI ConocoPhillips Alaska Inc. CS Chukchi Sea dB decibel dBA A-weighted decibel Denali Denali – The Alaska Gas Pipeline LLC DOE Department of Energy EA Environmental Assessment EIS Environmental Impact Statement Eni Eni Petroleum EPA Environmental Protection Agency ESA Endangered Species Act ft feet ft2 square feet FLIR forward looking infrared FONSI Finding of No Significant Impact
AOGA PETITION FOR PROMULGATION OF REGULATIONS v APRIL 2009 BEAUFORT SEA 2011-2016
FR Federal Register GHG greenhouse gas GIS geographic information systems GPR ground-penetrating radar GPS global positioning system Hz Hertz IACPB International Agreement on the Conservation of Polar Bears IAP Integrated Activity Plan IHA Intentional Harassment Authorization in inches IPCC Intergovernmental Panel on Climate Change ITR Incidental Take Regulations ITS Incidental Take Statement IUCN International Union for Conservation of Nature JIP Joint Industry Program kg kilogram kHz kiloHertz km kilometer KPL Kuparuk pipeline LACT lease allocation and custody transfer lb pounds LGL LGL Research Associates LOA Letter of Authorization m meter mi mile MI miscible injectant msec milliseconds MMO Marine Mammal Observer MMPA Marine Mammal Protection Act MMS Minerals Management Service NB Northern Beaufort Sea NEPA National Environmental Policy Act NETL National Energy Technology Laboratory NGL natural gas liquids NMFS National Marine Fisheries Service NPR-A National Petroleum Reserve – Alaska NRC National Research Council NSB North Slope Borough OCS Outer Continental Shelf OSRV oil spill response vessel Pa Pascals PBSG Polar Bear Specialist Group Pioneer Pioneer Natural Resources Alaska, Inc. ppm parts per million
AOGA PETITION FOR PROMULGATION OF REGULATIONS vi APRIL 2009 BEAUFORT SEA 2011-2016
psi pounds per square inch PTS permanent threshold shift pulses/sec pulses per second rms root-mean-square ROD Record of Decision SB Southern Beaufort Sea SDC steel drilling caisson SDI satellite drilling island SEL sound exposure level Shell Shell Exploration and Production Company SLAR side-looking airborne radar SPAR Division of Spill Prevention and Response SPL sound pressure level TAPAA Trans-Alaska Pipeline Authorization Act TAPS Trans-Alaska Pipeline System TL transmission loss TTS temporary threshold shift uERD ultra-extended reach drilling U.S. United States U.S.C. United States Code USCG United States Coast Guard USFWS United States Fish and Wildlife Service USGS United States Geological Survey USW ultra shallow water UV/IR ultraviolet/infrared VLCC very large crude carrier VSP vertical seismic profile
AOGA PETITION FOR PROMULGATION OF REGULATIONS vii APRIL 2009 BEAUFORT SEA 2011-2016
1.0 STATEMENT OF REQUEST AND CONTEXT
1.1 NATURE OF REQUEST
The Alaska Oil and Gas Association (AOGA) hereby petitions the United States Fish & Wildlife Service (USFWS) to renew regulations, pursuant to Section 101(a)(5) of the Marine Mammal Protection Act (MMPA), for the non-lethal unintentional taking of small numbers of polar bears (Ursus maritimus) and Pacific walrus (Odobenus rosmarus divergens) incidental to oil and gas exploration, development, and production operations and all associated activities in the Beaufort Sea and adjacent northern coast (North Slope) of Alaska for the period of five years beginning August 3, 2011 extending through August 3, 2016. The requested regulations would be the eighth in a series dating from 1993 to the present.
AOGA is a private, non-profit trade association whose 16-member companies represent the majority of oil and gas exploration, production, transportation, refining, and marketing activities in Alaska. AOGA’s members are as follows:
Alyeska Pipeline Service Company Pacific Energy Resources Ltd.
Anadarko Petroleum Corporation Petro-Canada (Alaska) Inc.
BP Exploration Alaska Inc. (BPXA) Petro Star Inc.
Chevron USA, Inc. (Chevron) Pioneer Natural Resources Alaska, Inc. (Pioneer)
Eni Petroleum (Eni) Shell Exploration and Production Company (Shell)
ExxonMobil Production Company StatoilHydro
Flint Hills Resources, Inc. Tesoro Alaska Company
Marathon Oil Company XTO Energy, Inc.
This Petition is being filed by AOGA on behalf of its members, as well as on behalf of other participating parties. We request that USFWS promulgate regulations that are applicable to all persons conducting activities described herein. Non-AOGA members who participated in this Petition are: ConocoPhillips Alaska, Inc. (CPAI), CGG Veritas, Brooks Range Petroleum Corporation (BRPC), and Arctic Slope Regional Corporation (ASRC) Energy Services.
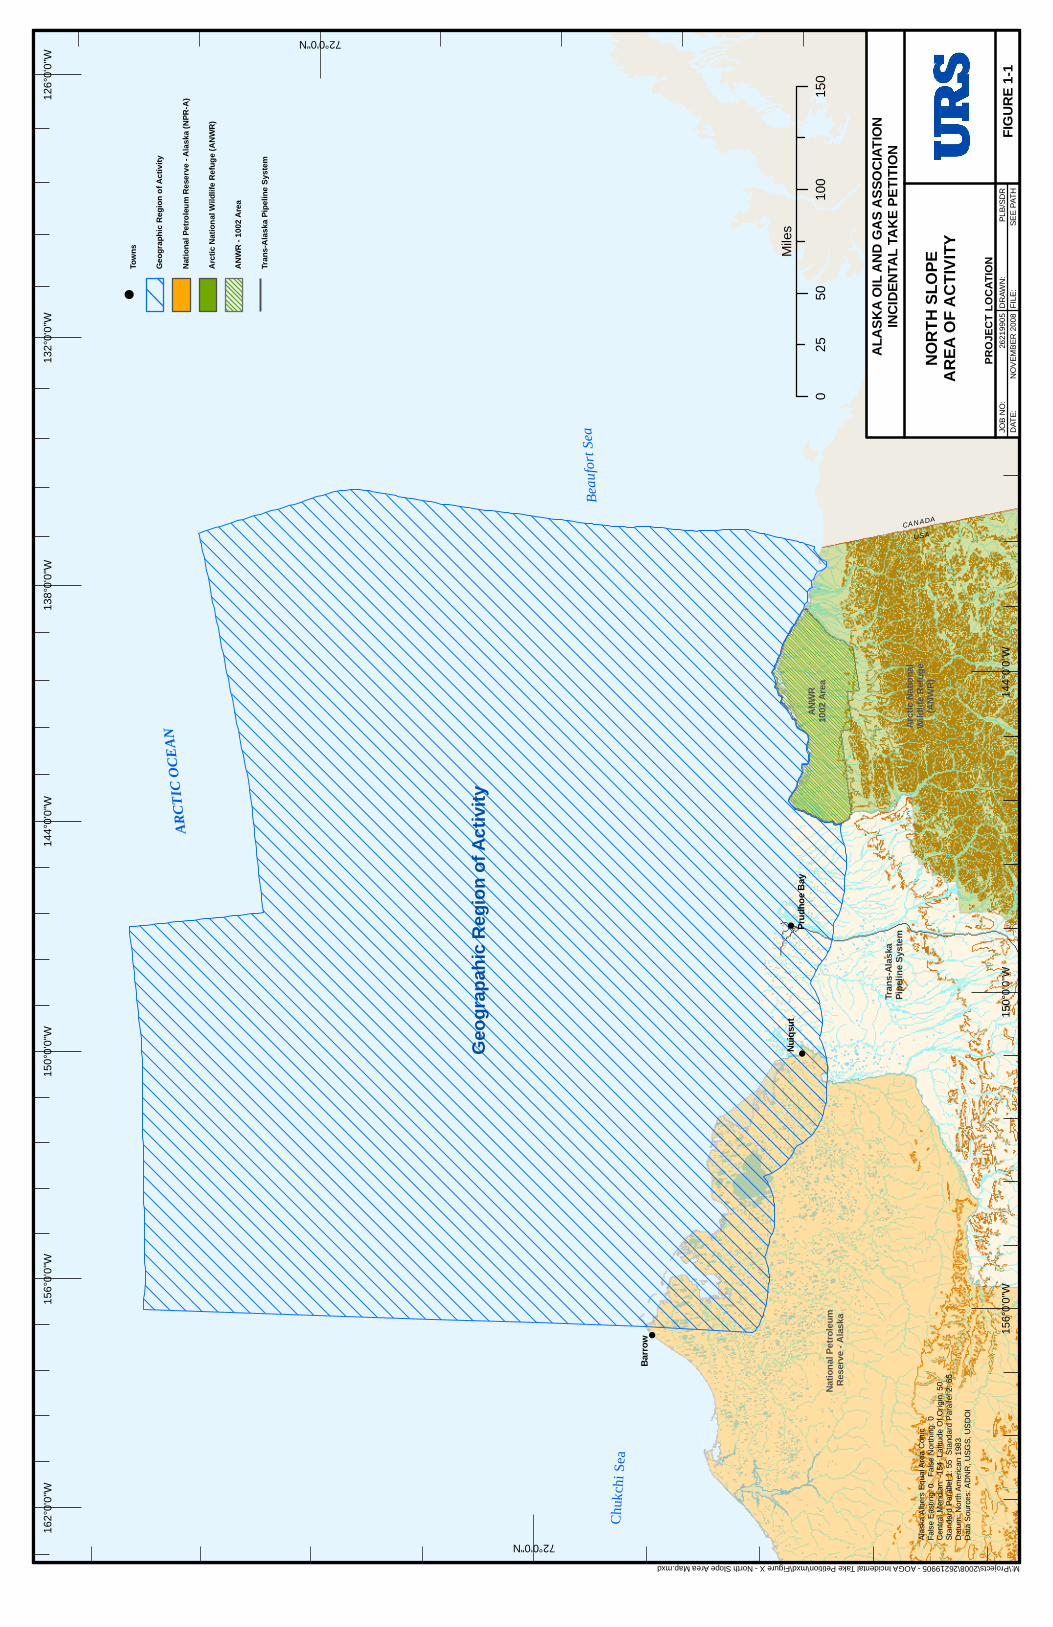
The geographic area of activity, illustrated in Figure 1-1, covers a total area of approximately 27.9 million hectares (68.9 million acres). The area of activity includes land on the North Slope of Alaska and adjacent waters of the Beaufort Sea including state waters and Outer Continental Shelf (OCS) waters. The area extends from Point Barrow on the west to the United States (U.S.)-Canada border on the east. The onshore boundary is 40 kilometer (km) (25 miles [mi]) inland, excluding the area within the Arctic National Wildlife Refuge (ANWR). The offshore boundary is the Minerals Management Service (MMS) Beaufort Sea Planning Area, approximately 322 km (200 mi) offshore.
AOGA PETITION FOR PROMULGATION OF REGULATIONS 1-1 APRIL 2009 BEAUFORT SEA 2011-2016
!
!
!
Arct
ic N
atio
nal
Wild
life
Ref
uge
(AN
WR)
ANW
R10
02 A
rea
Natio
nal P
etro
leum
Re
serv
e - A
lask
a
Tran
s-Al
aska
Pi
pelin
e Sy
stem
Chu
kchi
Sea
AR
CTI
C O
CE
AN
Beau
fort
Sea
CANADA
USA
Nuiq
sut
Barr
ow
Prud
hoe
Bay
Geo
grap
ahic
Reg
ion
of A
ctiv
ity
126°
0'0"
W13
2°0'
0"W
138°
0'0"
W
138°
0'0"
W
144°
0'0"
W
144°
0'0"
W
150°
0'0"
W
150°
0'0"
W
156°
0'0"
W
156°
0'0"
W16
2°0'
0"W
72°0'0"N
72°0'0"N 68°0'0"N
Alas
ka A
lber
s Eq
ual A
rea
Con
icFa
lse
Eas
ting:
0
Fals
e N
orth
ing:
0C
entra
l Mer
idia
n: -1
54 L
atitu
de O
f Orig
in: 5
0St
anda
rd P
aral
lel 1
: 55
Sta
ndar
d P
aral
lel 2
: 65
Dat
um: N
orth
Am
eric
an 1
983
Dat
a S
ourc
es: A
DN
R, U
SGS,
US
DO
I
ALA
SKA
OIL
AN
D G
AS
ASS
OC
IATI
ON
JOB
NO
:D
ATE:
DR
AWN
:FI
LE:
2621
9905
NO
VEM
BER
200
8PL
B/S
DR
SEE
PATH
PRO
JEC
T LO
CAT
ION
FIG
UR
E 1-
1
INC
IDEN
TAL
TAK
E PE
TITI
ON
NO
RTH
SLO
PEA
REA
OF
AC
TIVI
TY
050
100
150
25
Mile
s
M:\Projects\2008\26219905 - AOGA Incidental Take Petition\mxd\Figure X - North Slope Area Map.mxd
!To
wns
Geo
grap
hic
Reg
ion
of A
ctiv
ity
Nat
iona
l Pet
role
um R
eser
ve -
Ala
ska
(NPR
-A)
Arc
tic N
atio
nal W
ildlif
e R
efug
e (A
NW
R)
AN
WR
- 10
02 A
rea
Tran
s-A
lask
a Pi
pelin
e Sy
stem
sheyna_wisdom
As has been the case since 1993, AOGA is petitioning USFWS for regulations that cover a class of activity for a five-year period of time. Activity covered by this Petition encompasses all currently foreseeable oil and gas exploration, development, and production occurring within the area specified above for the Petition period. Consistent with the prior and existing regulations, and in consultation with USFWS, AOGA has identified this class of activity because, within the identified geographic area, this class of activity may affect small numbers of polar bear and walrus in substantially similar ways. In other words, the totality of potential effects is small for the class of activity; moreover, given the similarity in possible effects on polar bear and walrus, dividing the class into subcategories would be abstract and arbitrary, and neither comprehensive nor reasonably feasible.
This request by AOGA is consistent with the conservation and management measures stated in the 1976 International Agreement on the Conservation of Polar Bears (IACPB). The IACPB seeks to protect polar bear habitat, restrict the taking of polar bears, and restrict the commercial trade of polar bear parts. The U.S. is one of the five circumpolar countries (along with Canada, Norway, Denmark/Greenland, and the former Soviet Union) to sign the agreement.
In summary, AOGA is requesting that USFWS authorize non-lethal, non-intentional incidental take of small numbers of polar bears and Pacific walrus during oil and gas activities within the identified geographic area during the five-year period August 3, 2011 through August 3, 2016. These regulations should also identify: permissible methods of non-lethal take; measures to ensure the least practicable adverse impact on these species, and on the availability of these species for subsistence uses; and requirements for monitoring and reporting. In conjunction with issuance of the requested incidental take regulations (ITR), AOGA further petitions USFWS to engage in consultation under Section 7 of the Endangered Species Act (ESA) and to complete the environmental assessment process under the National Environmental Policy Act (NEPA).
1.2 REGULATORY CONTEXT
1.2.1 Marine Mammal Protection Act
Section 101(a)(5) of the MMPA, 16 U.S. Code (U.S.C.) § 1371(a)(5)(A), authorizes the Secretary of the Interior, through the USFWS, to promulgate regulations that allow the incidental, but not intentional, taking of small numbers of marine mammals associated with specified activities (other than commercial fishing), provided that the total of such taking will have no more than a negligible impact on the affected marine mammal species or stocks, and does not have an unmitigable adverse impact on the availability of these species or stocks for subsistence uses. U.S. citizens seeking to carry out activities (other than commercial fishing) that may result in the incidental taking of small numbers of these marine mammals may petition the USFWS to issue ITRs for the specified activities in a specified geographical region.
The following key terms and definitions have been promulgated in federal regulations implementing the MMPA at 50 Code of Federal Regulations (CFR) § 18.27(c):
Take means to harass, hunt, capture or kill, or attempt to harass, hunt, capture, or kill any marine mammal.
Harassment means any act of pursuit, torment, or annoyance which has the potential to: 1) injure a marine mammal or marine mammal stock in the wild (Level A harassment); or 2) has the potential to disturb a marine mammal or marine mammal stock in the wild by causing disruption of behavioral patterns, including, but not limited to, migration, breathing, nursing, breeding, feeding, or sheltering (Level B harassment).
AOGA PETITION FOR PROMULGATION OF REGULATIONS 1-3 APRIL 2009 BEAUFORT SEA 2011-2016
Incidental, but not intentional taking means takings which are infrequent, unavoidable, or accidental. It does not mean that the taking must be unexpected.
Small numbers is the portion of a marine mammal species or stock whose taking would have a negligible impact on that species or stock.
Negligible impact is an impact resulting from the specified activity that cannot be reasonably expected to, and is not reasonably likely to, adversely affect the species or stock through effects on annual rates of recruitment or survival.
Unmitigable adverse impact means an impact resulting from the specified activity: 1) that is likely to reduce the availability of the species to a level insufficient for a harvest to meet subsistence needs (i) by causing the marine mammals to abandon or avoid hunting areas, (ii) directly displacing subsistence users, (iii) or placing physical barriers between the marine mammals and the subsistence hunters; and 2) that cannot be sufficiently mitigated by other measures to increase the availability of marine mammals to allow subsistence needs to be met.
Regulations promulgated under Section 101(a)(5)(A) of the MMPA do not permit, approve, or otherwise allow any individual or class of commercial, industrial, or development activity. Rather, each regulation establishes a regulatory framework, linked to a specified area and a specified time frame not to exceed five years, pursuant to which U.S. citizens may apply to USFWS for a letter of authorization (LOA). Whereas the regulations identify a suite of regulatory requirements that may be applied by USFWS depending upon the nature of an activity, as well as its location, timing, and duration, each LOA issued by USFWS imposes specific enforceable mitigation, monitoring, and reporting tailored to the activity addressed in the LOA to ensure that interactions with the identified marine mammal species or stocks occur in small numbers and with no more than a negligible impact.
Pursuant to Section 101(a)(5)(A) of the MMPA, since 1993, the oil and gas industry operating on the North Slope of Alaska and in adjacent waters of the Beaufort Sea has requested and been issued a series of regulations for incidental take authorizations for conducting activities in polar bear and walrus habitat. A detailed history of past regulations can be found in the Federal Register (FR) at 68 FR 66744 (Nov. 28, 2003). Previous regulations were published on November 16, 1993 (58 FR 60402); August 17, 1995 (60 FR 42805); January 28, 1999 (64 FR 4328); February 3, 2000 (65 FR 16828); November 28, 2003 (68 FR 66744); and August 2, 2006 (71 FR 43926 [USFWS 2006]). The current regulations will expire on August 2, 2011 (USFWS 2006).
1.2.2 Endangered Species Act
The ESA establishes a comprehensive statutory scheme intended to conserve fish, wildlife, and plants facing extinction. Section 4 of the ESA, 16 U.S.C. § 1533, provides authority for the listing of species as either “threatened” or “endangered,” and for the designation of “critical habitat” for listed species. Once a species has been listed, the provisions of the ESA afford protection to such species and to designated critical habitat in the form of various procedural and substantive requirements and prohibitions.
Under Section 7 of the ESA, 16 U.S.C. § 1536, all federal agencies must insure through consultation with USFWS (or the National Marine Fisheries Service [NMFS]) that actions authorized, funded, or carried out by such agencies are not likely to jeopardize the continued existence of listed species or result in the destruction or adverse modification of critical habitat designated for such species. If, as a result of consultation, USFWS concludes that the proposed action is not likely to jeopardize listed species or to destroy or adversely modify designated critical habitat, it will issue an incidental take statement (ITS)
AOGA PETITION FOR PROMULGATION OF REGULATIONS 1-4 APRIL 2009 BEAUFORT SEA 2011-2016
authorizing take expected to occur as a result of the action. Importantly, as to ESA-listed marine mammals, under Section 7(b)(4)(C) of the ESA, no ITS may be issued with respect to a marine mammal unless authorization for the incidental take has been obtained pursuant to Section 105(a)(5)(A) of the MMPA.
In addition to the consultation requirements of Section 7, Section 9 of the ESA, 16 U.S.C. § 1538, broadly prohibits any person from the taking of any endangered species in the U.S. or on the high seas, except pursuant to an incidental take authorization issued by USFWS, or as otherwise allowed by statutory exemption. A taking under the ESA is more broadly defined (at 50 CFR § 17.3) than under the MMPA. In particular, in contrast to the MMPA, take under the ESA has been defined to encompass “harm,” which has in turn been defined to include “significant habitat modification or degradation where it . . . injures wildlife by significantly impairing essential behavioral patterns, including breeding, feeding, or sheltering.” The take prohibition does not apply to species listed as “threatened.” Instead, under Section 4(d) of the ESA, 16 U.S.C. § 1533(d), a regulation may be promulgated applying the taking prohibitions of Section 9 to threatened species.
As the ESA relates to the present Petition, USFWS has listed the polar bear as a threatened species (73 FR 28212 (May 15, 2008) [USFWS 2008a]). Although Pacific walrus are not currently a listed species, there is a pending petition to list them as endangered or threatened under the ESA. As of the date of this Petition, USFWS has not proposed or designated critical habitat for polar bears. In addition, pursuant to Section 4(d) of the ESA, USFWS has promulgated a regulation that applies the taking prohibitions of Section 9 to the polar bear, with certain limitations (50 CFR § 17.40(q)). These limitations apply to activities conducted in compliance with incidental take authorization or an applicable exemption under the MMPA; in compliance with the Convention on International Trade in Endangered Species of Wild Fauna and Flora (CITES); or in areas within the jurisdiction of the U.S. but outside of existing polar bear habitat.
In addition, in conjunction with issuance of the regulations proposed in this Petition, USFWS must consult under Section 7 of the ESA regarding the polar bear species. AOGA hereby requests that USFWS initiate this intra-agency consultation process. We further request that USFWS confirm that AOGA may participate in the consultation process as the “applicant.”
1.2.3 National Environmental Policy Act
Section 102 of NEPA, 42 U.S.C. § 4332(C), mandates a thoughtful and reasonably thorough analysis of the probable environmental impacts of a proposed major federal action, including analysis of both a reasonable range of alternatives that achieve the purpose and need for the project, and analysis of the no action alternative. An environmental assessment (EA) is a concise document that provides sufficient information and analysis to determine whether preparation of an environmental impact statement (EIS) is necessary. NEPA requires preparation of an EIS for major federal actions that significantly affect the quality of the human environment. An EIS is not required if, after preparation of an EA, a federal agency issues a finding of no significant impact (FONSI). The requirements of NEPA are entirely procedural. Accordingly, while NEPA mandates a thoughtful and thorough analysis, it does not establish any substantive regulatory standards or compel a particular decision to approve, modify, or disapprove a proposal.
USFWS must comply with the NEPA process as a part of its analysis and promulgation of an ITR. The proposed action – the ITR – does not permit, authorize, or otherwise allow any oil and gas activity. Rather, the agency action being analyzed is authorization of non-lethal incidental (non-intentional) take of
AOGA PETITION FOR PROMULGATION OF REGULATIONS 1-5 APRIL 2009 BEAUFORT SEA 2011-2016
small numbers of polar bear and Pacific walrus over a five-year period in a defined geographic area, that have no more than a negligible impact on these species and that have no unmitigable adverse impact on the availability of these species for subsistence uses by Alaska Natives. Because the proposed action must necessarily have no more than a negligible impact, we anticipate that USFWS may, as in the past, satisfy NEPA through an EA and FONSI process.
1.2.4 Future Regulatory Developments
Although the applicable MMPA, ESA, and NEPA processes described above are well defined, there are at least four areas where future regulatory developments have the potential to affect the ITR requested by this Petition. The following developments are likely to occur between the date of the Petition and issuance of the requested ITR:
• Designation of Polar Bear Critical Habitat – USFWS has listed the polar bear as threatened, but has not yet designated critical habitat. In a partial settlement of claims in currently pending litigation, USFWS committed to making a final decision regarding designation of critical habitat by June 30, 2010. AOGA does not anticipate that this ESA decision will directly affect issuance of an ITR, but designation of critical habitat, if any, will need to be addressed during the ESA consultation and NEPA process for this ITR.
• Issuance of Deterrence Guidelines – Section 101(a)(4)(B) of the MMPA authorizes USFWS to issue a list of guidelines for use in safely deterring marine mammals. For marine mammals listed under the ESA, the guidelines are to include specific measures which may be used for non-lethal deterrence. In partial settlement of claims in currently pending litigation, USFWS committed to issuance of non-lethal deterrence guidelines for polar bears by March 31, 2010. AOGA does not anticipate that these guidelines will result in any necessary delay in issuance of an ITR; however, the guidelines and the suite of mitigation measures adopted for this ITR should be consistent.
• Petition to list Pacific Walrus under the ESA – USFWS has before it a pending petition to list Pacific walrus as threatened or endangered under the ESA on the basis of the projected future consequences of climate change. The schedule for addressing this listing petition is uncertain; however, it is reasonable to assume that USFWS will complete its regulatory processes regarding the Petition before August 2011 when the proposed ITR would become effective. While AOGA does not anticipate that a decision regarding the petition to list Pacific walrus under the ESA will delay issuance of the proposed ITR, the scientific data and findings from the listing process should be incorporated into the record for this ITR. Moreover, should Pacific walrus be listed, the scope of the necessary Section 7 consultation under the ESA will need to expand to include Pacific walrus. This should not pose significant problems given that the geographic area addressed by this ITR request is outside of the primary habitat of Pacific walrus.
• Regulation of Greenhouse Gas (GHG) Emissions – There is no current federal regulatory scheme that addresses GHG emissions, or related climate change impacts. Numerous and widely varying proposals for regulation of GHG emissions have been introduced in Congress, and more are expected to follow. It is possible that Congress, the President acting by Executive authority, or federal agencies acting pursuant to existing statutory authority, may elect to regulate GHG emissions, although whether and how this will be achieved is uncertain and speculative at this time. AOGA does not anticipate that advances in GHG emissions regulation between the filing of this Petition and August of 2011 will directly affect issuance of the proposed ITR; however, analysis of GHG emissions and climate change issues in connection with this ITR, pursuant to the
AOGA PETITION FOR PROMULGATION OF REGULATIONS 1-6 APRIL 2009 BEAUFORT SEA 2011-2016
MMPA, ESA, and NEPA, should be as current as is practicable with the evolving state of scientific information regarding climate change and GHG emissions.
1.3 SCIENTIFIC CONTEXT
There is a very high degree of scientific consensus that the effects of the oil and gas industry operations in the Beaufort Sea and the adjacent North Slope on polar bear and walrus are negligible. The oil and gas industry has been operating in these areas for the past 40 years, with activities since 1993 closely monitored and reported pursuant to Section 101(a)(5)(A) of the MMPA. Accordingly, there is substantial long-term information concerning the class of activity, the specific geographic area, and the two marine mammal species addressed in this Petition. Particularly for the past 15 years monitored under the MMPA, it is known to a very high degree of reliability that there have been no lethal encounters between the oil and gas industry operations and polar bears, that the total number of annual observations of polar bears represents a small proportion of the Beaufort Sea populations, and that the number of actual incidental takings is a small fraction of annual observations. The data with respect to Pacific walrus, which are uncommon in the Beaufort Sea, demonstrate that there has never been a recorded take within the activity area covered by this Petition as a result of human encounters. Accordingly, with decades of experience, half of which has been rigorously monitored under the MMPA, there is no scientific evidence that oil and gas activity has had, or is having an adverse impact on survival or recruitment of polar bears and Pacific walrus.
In addition, a great deal of scientific and regulatory attention has been focused upon polar bears in recent years in connection the listing of this species as threatened under the ESA. The regulatory processes associated with the listing by USFWS have included a thorough analysis of the impacts of oil and gas activities on polar bears. The well-supported and unchallenged conclusions of these processes have been that oil and gas activities, as regulated pursuant to ITRs and other provisions of the MMPA, do not pose a threat to the conservation of the polar bear, and do not have more than a negligible impact. The recent and thorough extent of these detailed scientific analyses by USFWS provides further credibility and support for this Petition.
Finally, the findings of USFWS in listing the polar bear under the ESA are important context for this Petition. USFWS has found that this species may be threatened with extinction throughout all or a significant portion of its range as a result of sea ice recession caused by climate change (USFWS 2008a). USFWS has further concluded that: sea ice recession is likely to result in the presence of more polar bears for longer periods of time along the Beaufort Sea nearshore; and sea ice recession is contributing to, and likely will continue to cause, decreased fitness of individual bears, eventually resulting in population declines that may end in extinction. Under these circumstances, as assessed by USFWS in its listing decision, other adverse impacts could take on increased significance. However, it does not follow that future declines in polar bear fitness, abundance, and distribution increase the consequences of the incidental take addressed, mitigated, and monitored in this Petition. By definition, the takings addressed in this Petition are non-lethal and non-intentional, and have in the past, and are expected during the petitioned period, to continue to consist of no more than short-term changes in behavior with no detectable long-term injury or consequence, involving very small numbers of polar bear (and few, if any, Pacific walrus).
AOGA PETITION FOR PROMULGATION OF REGULATIONS 1-7 APRIL 2009 BEAUFORT SEA 2011-2016
1.4 INFORMATION SUBMITTED IN RESPONSE TO THE REQUIREMENTS OF 50 CFR § 18.27
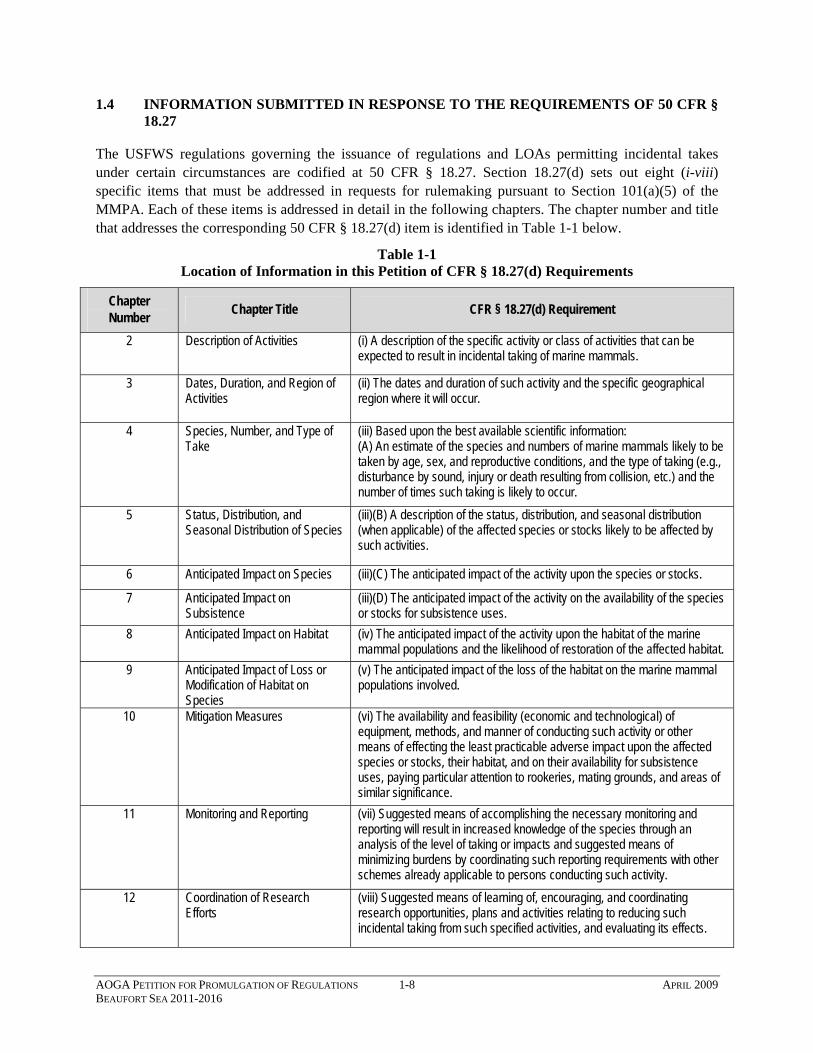
The USFWS regulations governing the issuance of regulations and LOAs permitting incidental takes under certain circumstances are codified at 50 CFR § 18.27. Section 18.27(d) sets out eight (i-viii) specific items that must be addressed in requests for rulemaking pursuant to Section 101(a)(5) of the MMPA. Each of these items is addressed in detail in the following chapters. The chapter number and title that addresses the corresponding 50 CFR § 18.27(d) item is identified in Table 1-1 below.
Table 1-1 Location of Information in this Petition of CFR § 18.27(d) Requirements
Chapter Number Chapter Title CFR § 18.27(d) Requirement
2 Description of Activities (i) A description of the specific activity or class of activities that can be expected to result in incidental taking of marine mammals.
3 Dates, Duration, and Region of Activities
(ii) The dates and duration of such activity and the specific geographical region where it will occur.
4 Species, Number, and Type of Take
(iii) Based upon the best available scientific information: (A) An estimate of the species and numbers of marine mammals likely to be taken by age, sex, and reproductive conditions, and the type of taking (e.g., disturbance by sound, injury or death resulting from collision, etc.) and the number of times such taking is likely to occur.
5 Status, Distribution, and Seasonal Distribution of Species
(iii)(B) A description of the status, distribution, and seasonal distribution (when applicable) of the affected species or stocks likely to be affected by such activities.
6 Anticipated Impact on Species (iii)(C) The anticipated impact of the activity upon the species or stocks.
7 Anticipated Impact on Subsistence
(iii)(D) The anticipated impact of the activity on the availability of the species or stocks for subsistence uses.
8 Anticipated Impact on Habitat (iv) The anticipated impact of the activity upon the habitat of the marine mammal populations and the likelihood of restoration of the affected habitat.
9 Anticipated Impact of Loss or Modification of Habitat on Species
(v) The anticipated impact of the loss of the habitat on the marine mammal populations involved.
10 Mitigation Measures (vi) The availability and feasibility (economic and technological) of equipment, methods, and manner of conducting such activity or other means of effecting the least practicable adverse impact upon the affected species or stocks, their habitat, and on their availability for subsistence uses, paying particular attention to rookeries, mating grounds, and areas of similar significance.
11 Monitoring and Reporting (vii) Suggested means of accomplishing the necessary monitoring and reporting will result in increased knowledge of the species through an analysis of the level of taking or impacts and suggested means of minimizing burdens by coordinating such reporting requirements with other schemes already applicable to persons conducting such activity.
12 Coordination of Research Efforts
(viii) Suggested means of learning of, encouraging, and coordinating research opportunities, plans and activities relating to reducing such incidental taking from such specified activities, and evaluating its effects.
AOGA PETITION FOR PROMULGATION OF REGULATIONS 1-8 APRIL 2009 BEAUFORT SEA 2011-2016
2.0 DESCRIPTION OF ACTIVITIES
CFR § 18.27(d)(i) A description of the specific activity or class of activities that can be expected to result in incidental taking of marine mammals.
The scope of this Petition includes the activities that will be conducted during the exploration (geological and geophysical surveys, and drilling activities), development, production, decommissioning, rehabilitation, and abandonment phases of oil and gas activities within the Petition’s geographic area (Figure 1-1). Activities that may take place between 2011 and 2016 are discussed in the following text. It is important to note that all activities described in this section have been implemented during past periods of the Beaufort Sea ITRs. Accordingly, analyses of potential impacts from these activities have been conducted by industry and regulatory agencies over an extended period of years, and the range of reasonably anticipated effects is well documented.
2.1 OIL AND GAS ACTIVITY
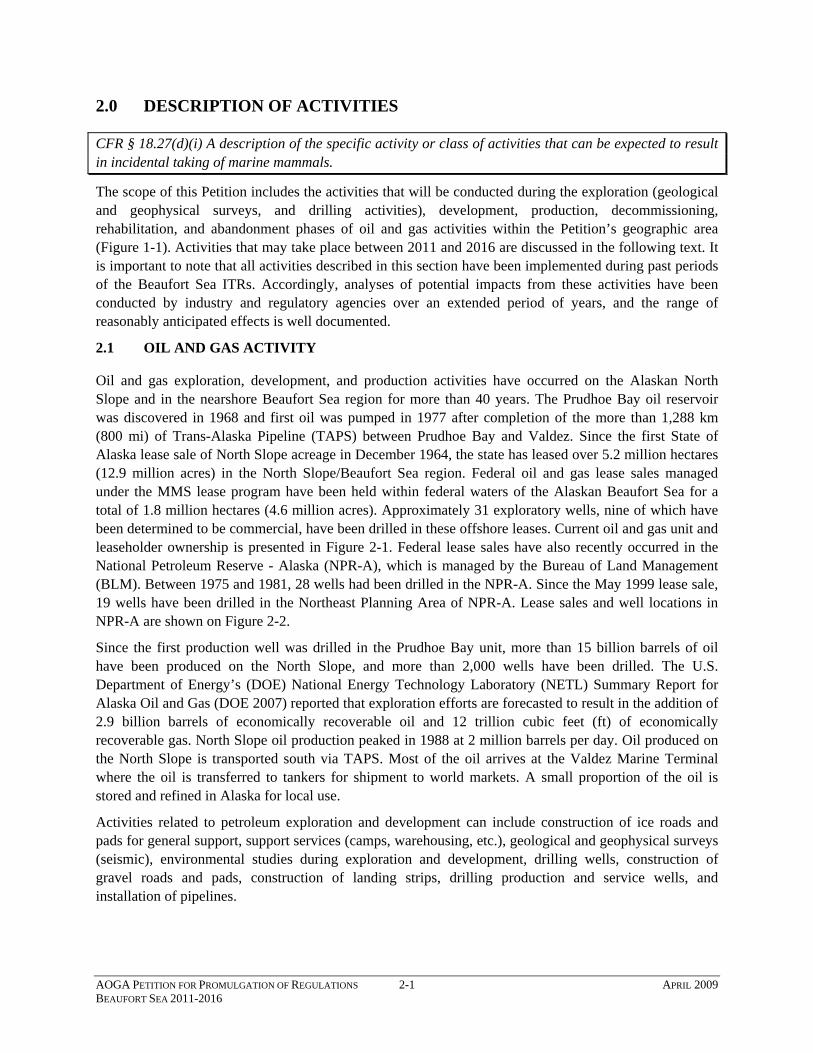
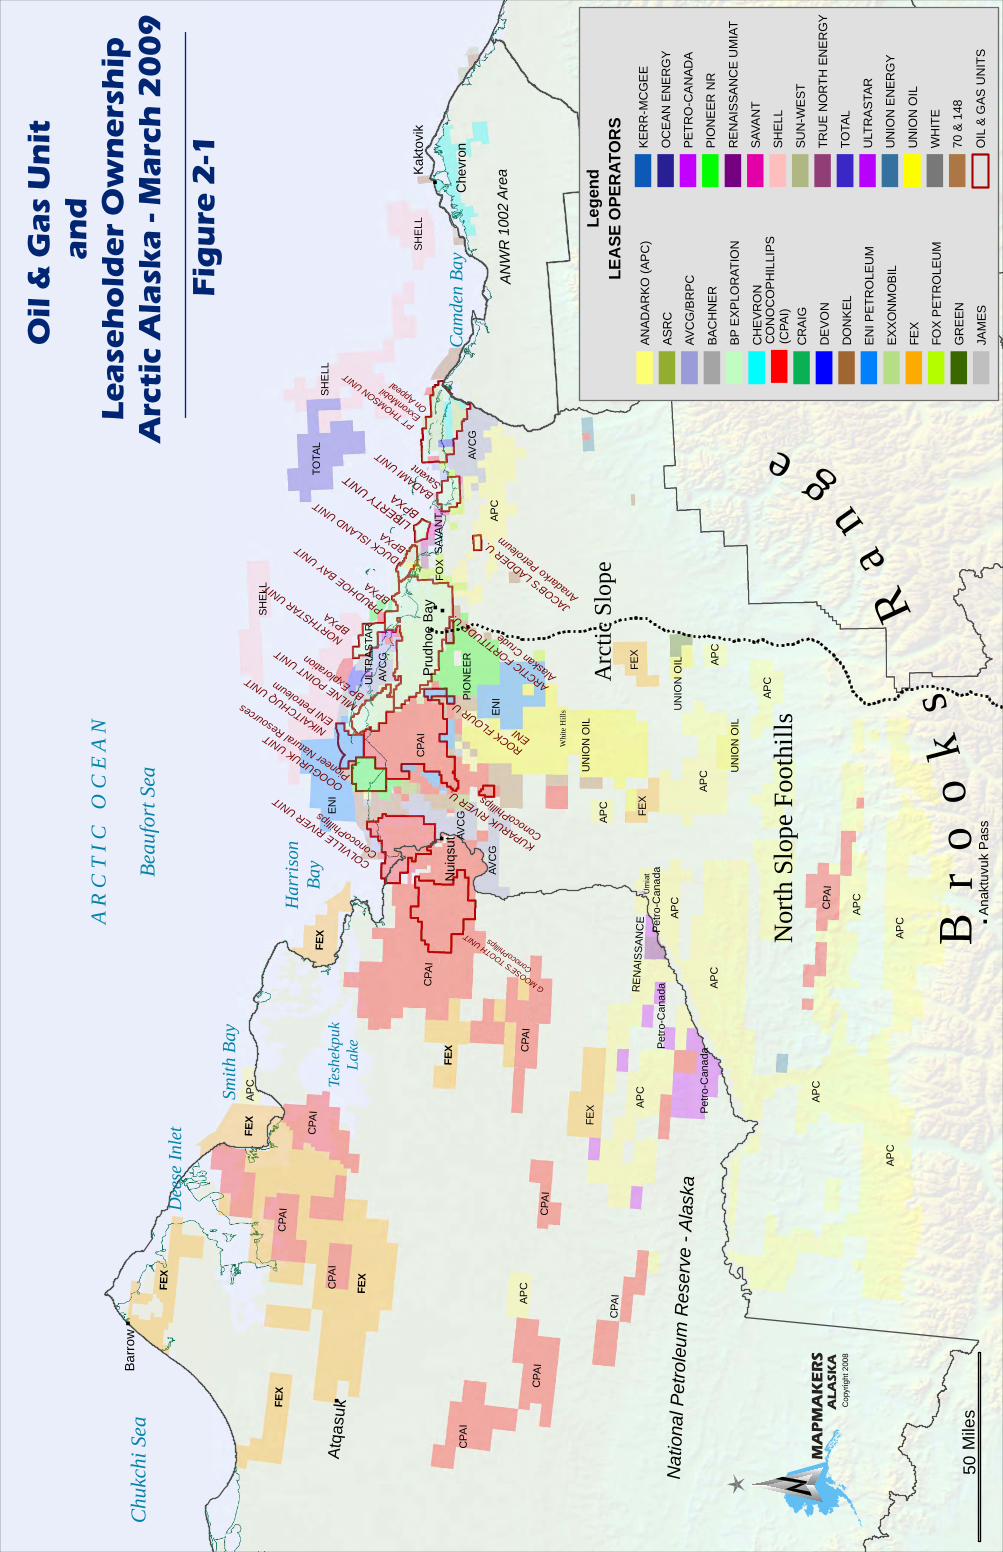
Oil and gas exploration, development, and production activities have occurred on the Alaskan North Slope and in the nearshore Beaufort Sea region for more than 40 years. The Prudhoe Bay oil reservoir was discovered in 1968 and first oil was pumped in 1977 after completion of the more than 1,288 km (800 mi) of Trans-Alaska Pipeline (TAPS) between Prudhoe Bay and Valdez. Since the first State of Alaska lease sale of North Slope acreage in December 1964, the state has leased over 5.2 million hectares (12.9 million acres) in the North Slope/Beaufort Sea region. Federal oil and gas lease sales managed under the MMS lease program have been held within federal waters of the Alaskan Beaufort Sea for a total of 1.8 million hectares (4.6 million acres). Approximately 31 exploratory wells, nine of which have been determined to be commercial, have been drilled in these offshore leases. Current oil and gas unit and leaseholder ownership is presented in Figure 2-1. Federal lease sales have also recently occurred in the National Petroleum Reserve - Alaska (NPR-A), which is managed by the Bureau of Land Management (BLM). Between 1975 and 1981, 28 wells had been drilled in the NPR-A. Since the May 1999 lease sale, 19 wells have been drilled in the Northeast Planning Area of NPR-A. Lease sales and well locations in NPR-A are shown on Figure 2-2.
Since the first production well was drilled in the Prudhoe Bay unit, more than 15 billion barrels of oil have been produced on the North Slope, and more than 2,000 wells have been drilled. The U.S. Department of Energy’s (DOE) National Energy Technology Laboratory (NETL) Summary Report for Alaska Oil and Gas (DOE 2007) reported that exploration efforts are forecasted to result in the addition of 2.9 billion barrels of economically recoverable oil and 12 trillion cubic feet (ft) of economically recoverable gas. North Slope oil production peaked in 1988 at 2 million barrels per day. Oil produced on the North Slope is transported south via TAPS. Most of the oil arrives at the Valdez Marine Terminal where the oil is transferred to tankers for shipment to world markets. A small proportion of the oil is stored and refined in Alaska for local use.
Activities related to petroleum exploration and development can include construction of ice roads and pads for general support, support services (camps, warehousing, etc.), geological and geophysical surveys (seismic), environmental studies during exploration and development, drilling wells, construction of gravel roads and pads, construction of landing strips, drilling production and service wells, and installation of pipelines.
AOGA PETITION FOR PROMULGATION OF REGULATIONS 2-1 APRIL 2009 BEAUFORT SEA 2011-2016
"
"
"
"
"
"
"
"
"
"
"
"
G MOOSE'S TOOTH UNIT
ConocoPhillips
PT THOMSON UNIT
ExxonMobilOn Appeal
LIBERTY UNIT
BPXA
FEX
CPA
I
FEX
FEX
Petro
-Can
ada
FEX
UN
ION
OIL
Che
vron
SHE
LL
TOTA
L
ENI
ENI
APC
AVC
G
SAVA
NT
AVC
G
PIO
NE
ER
Nor
th S
lope
Foo
thill
s
Arc
tic S
lope
AVC
G
Whi
te H
ills
SHE
LL
Um
iat
APC
APC
APC
APC
CPA
I
CPA
I
CPA
I
CPA
I
APC
CPA
I
CPA
I
CPA
I
FEX
FEX
FEX
FEX
APC
RE
NAI
SS
ANC
E
Petro
-Can
ada
CPA
I
FEX
AVC
G
Petro
-Can
ada
FOX
UN
ION
OIL
UN
ION
OIL
APC
APC
APC
APC
APC
APC
APC
SHE
LL
ULT
RAS
TAR
CPA
I
CPA
I
Barro
w
Nui
qsut
Atqa
suk
Kakt
ovik
Wai
nwrig
ht
Prud
hoe
Bay
Arct
ic V
illage
Anak
tuvu
k P
ass
PRUDHOE BAY UNIT
BPXA
KUPARUK RIVER U.
ConocoPhillips
COLVILLE RIVER UNIT
ConocoPhillips
BADAMI UNIT
Savant
OOOGURUK UNIT
Pioneer Natural Resources MILNE POINT UNIT
BP Exploration
NIKAITCHUQ UNIT
ENI Petroleum
NORTHSTAR UNIT
BPXA JACOB'S LADDER U.
Anadarko PetroleumDUCK ISLAND UNIT
BPXA
ROCK FLOUR U
ENI
ARCTIC FORTITUDE U.
Alaskan Crude
Natio
nal P
etrole
um R
eserv
e - Al
aska
ANWR
1002
Area
Smith
Bay
Dee
se In
let
Tesh
ekpu
kLa
ke
MAPM
AKER
SAL
ASKA
Cop
yrig
ht 2
008
Oil &
Gas
Uni
t an
dLe
aseh
olde
r Own
ersh
ipAr
ctic A
laska
- Mar
ch 20
09
50M
iles
A R
C T
I C
O
C E
A N
Beau
fort
Sea
Chu
kchi
Sea
Har
riso
nBa
y
Cam
den
Bay
B r
o o
k s
R a
n g
e
Lege
nd
OIL
& G
AS U
NIT
S
LEA
SE O
PER
ATO
RS
ASR
C
AVC
G/B
RPC
BAC
HN
ER
CH
EVR
ON
CR
AIG
DE
VON
DO
NK
EL
EXX
ON
MO
BIL
FEX
FOX
PET
RO
LEU
M
GR
EEN
JAM
ES
ANAD
AR
KO (A
PC
)
BP E
XPLO
RAT
ION
CO
NO
CO
PH
ILLI
PS(C
PAI)
ENI P
ETR
OLE
UM
KER
R-M
CG
EE
OC
EAN
EN
ER
GY
PETR
O-C
AN
ADA
PIO
NE
ER N
R
RE
NAI
SSA
NC
E U
MIA
T
SAVA
NT
SHEL
L
SUN
-WE
ST
TRU
E N
OR
TH E
NE
RG
Y
TOTA
L
ULT
RA
STAR
UN
ION
EN
ERG
Y
UN
ION
OIL
WH
ITE
70 &
148
Figur
e 2-1
The
Bur
eau
of L
and
Man
agem
ent m
akes
no
expr
esse
d or
impl
ied
war
rant
ies
with
resp
ect t
o th
e ch
arac
ter,
func
tion,
or c
apab
ilitie
s of
this
pro
duct
or i
tsap
prop
riate
ness
for a
ny u
ser's
pur
pose
s. In
not
eve
nt w
ill th
e B
urea
u of
Land
Man
agem
ent b
e lia
ble
for a
ny in
cide
ntal
, ind
irect
, spe
cial
, con
sequ
entia
lor
oth
er d
amag
es s
uffe
red
by th
e us
er o
r any
oth
er p
erso
n or
ent
ity w
heth
erfro
m u
se o
f the
pro
duct
, any
failu
re th
ereo
f or o
ther
wis
e, a
nd in
no
even
t will
the
Bure
au o
f Lan
d M
anag
emen
t lia
bilit
y to
you
or a
nyon
e el
se e
xcee
d th
e fe
epa
id fo
r the
pro
duct
.
Dis
crep
anci
es in
the
NP
R-A
Sou
th b
ound
ary
line
is c
urre
ntly
bei
ngre
sear
ched
and
be
subj
ect t
o ch
ange
.
Last
Upd
ated
: Apr
il 22
, 200
8.
$
(!
(!
(!
(!(!
(!
(!
(!
(!
(!
(!
(!
(! (!
(!
(!
(!
(!
(!(!
(!
(!
(!
(!
(!
AA
-08
41
66
AA
-08
41
80
AA
-08
41
67
AA
-08
41
60
AA
-08
41
81
AA
-08
55
44
AA
-08
55
45
AA
-08
41
73
AA
-08
41
68
AA
-08
55
53
AA
-08
55
55
AA
-08
55
57
AA
-08
41
48
AA
-08
41
46
AA
-08
41
74
AA
-08
41
69
AA
-08
55
52
AA
-08
55
58
AA
-08
55
54
AA
-08
55
56
AA
-08
41
55
AA
-08
41
51
AA
-08
41
56
AA
-08
41
75
AA
-08
41
78
AA
-08
41
76
AA
-08
55
64
AA
-08
55
66
AA
-08
41
54
AA
-08
41
52
AA
-08
41
79
AA
-08
41
77
AA
-08
17
27
AA
-08
55
65
AA
-08
55
67
AA
-08
55
59
AA
-08
17
28
AA
-08
55
68
AA
-08
55
70
AA
-08
41
59
AA
-08
18
47
AA
-08
18
55
AA
-08
17
29
AA
-08
55
69
AA
-08
55
71
AA
-08
55
60
AA
-08
41
38
AA
-08
17
69
AA
-08
41
29
AA
-08
41
39
AA
-08
41
26
AA
-08
41
36
AA
-08
17
90
AA
-08
18
39
AA
-08
17
86
AA
-08
18
15
AA
-08
17
70
AA
-08
17
72
AA
-08
18
31
AA
-08
17
91
AA
-08
17
83
AA
-08
17
93
AA
-08
41
23
AA
-08
41
24
AA
-08
41
27
AA
-08
41
30
AA
-08
18
30
AA
-08
17
37
AA
-08
18
40
AA
-08
17
73
AA
-08
17
71
AA
-08
41
34
AA
-08
18
41
AA
-08
41
33
AA
-08
41
32
AA
-08
18
17
AA
-08
41
37
AA
-08
66
74 A
A-0
86
67
1
AA
-08
17
40
AA
-08
66
73
AA
-08
66
72
AA
-08
55
72A
A-0
85
57
4
AA
-08
55
61
AA
-08
41
82
AA
-08
55
62
AA
-08
55
46
AA
-08
66
11
AA
-08
55
11
AA
-08
66
10
AA
-08
66
15
AA
-08
55
36
AA
-08
55
34
AA
-08
55
33
AA
-08
66
12
AA
-08
66
77
AA
-08
66
09
AA
-08
66
16
AA
-08
66
79
AA
-08
41
41
AA
-08
41
62
AA
-08
54
66
AA
-08
66
66
AA
-08
54
64
AA
-08
66
42
AA
-08
54
68
AA
-08
66
67
AA
-08
66
47
AA
-08
54
87
AA
-08
55
38
AA
-08
66
51
AA
-08
66
69
AA
-08
66
65 A
A-0
85
48
5
AA
-08
55
42
AA
-08
66
50
AA
-08
66
45
AA
-08
66
44
AA
-08
54
69
AA
-08
55
40
AA
-08
66
14
AA
-08
66
18
AA
-08
66
13
AA
-08
66
17
AA
-08
66
80
AA
-08
66
81
AA
-08
41
61
AA
-08
41
63
AA
-08
41
65
AA
-08
41
64
AA
-08
54
67
AA
-08
54
65
AA
-08
66
23
AA
-08
66
24
AA
-08
66
43
AA
-08
66
48
AA
-08
66
52
AA
-08
55
41
AA
-08
54
88
AA
-08
66
49
AA
-08
66
53
AA
-08
54
86
AA
-08
66
46
AA
-08
66
68
AA
-08
55
35
AA
-08
54
89
AA
-08
55
37
AA
-08
55
43
AA
-08
55
39
AA
-08
54
70
AA
-08
66
25
AA
-08
66
26
AA
-08
66
82
AA
-08
66
83
AA
-08
54
71
AA
-08
41
43
AA
-08
41
42
AA
-08
41
47
AA
-08
41
45
AA
-08
66
19
AA
-08
66
20
AA
-08
66
22
AA
-08
41
72
AA
-08
41
70
AA
-08
66
21
AA
-08
66
55
AA
-08
55
00
AA
-08
54
96
AA
-08
54
98
AA
-08
54
92
AA
-08
17
32
AA
-08
66
56
AA
-08
66
54
AA
-08
54
94
AA
-08
66
61
AA
-08
55
02
AA
-08
54
90
AA
-08
55
50
AA
-08
55
48
AA
-08
54
55
AA
-08
54
56
AA
-08
41
50
AA
-08
41
49
AA
-08
41
44
AA
-08
41
71
AA
-08
54
91
AA
-08
54
73
AA
-08
54
72
AA
-08
54
97
AA
-08
17
31
AA
-08
17
34
AA
-08
54
93
AA
-08
55
01
AA
-08
54
99
AA
-08
54
95
AA
-08
55
49
AA
-08
55
47
AA
-08
55
51
AA
-08
54
78
AA
-08
54
74
AA
-08
54
76
AA
-08
41
53
AA
-08
66
59
AA
-08
18
50
AA
-08
55
05
AA
-08
18
48
AA
-08
55
07
AA
-08
55
09
AA
-08
55
03
AA
-08
55
73
AA
-08
66
57
AA
-08
55
63
AA
-08
17
41
AA
-08
54
79
AA
-08
54
75
AA
-08
54
77
AA
-08
66
27
AA
-08
66
28
AA
-08
66
29
AA
-08
66
58
AA
-08
55
14
AA
-08
55
08
AA
-08
55
10
AA
-08
55
15
AA
-08
18
49
AA
-08
55
06
AA
-08
55
13
AA
-08
55
04
AA
-08
55
12
AA
-08
66
05
AA
-08
66
03
AA
-08
66
75
AA
-08
54
57
AA
-08
54
59
AA
-08
54
61
AA
-08
54
82
AA
-08
54
81
AA
-08
54
80
AA
-08
41
57
AA
-08
66
32
AA
-08
66
37
AA
-08
66
30
AA
-08
66
33
AA
-08
66
35
AA
-08
66
64
AA
-08
55
26
AA
-08
18
52
AA
-08
55
24
AA
-08
55
22
AA
-08
55
30
AA
-08
55
20
AA
-08
55
31
AA
-08
55
29
AA
-08
55
16
AA
-08
55
17
AA
-08
55
28
AA
-08
54
63
AA
-08
66
62
AA
-08
66
08
AA
-08
66
06
AA
-08
66
78
AA
-08
66
76
AA
-08
66
04
AA
-08
66
07
AA
-08
54
60
AA
-08
54
62
AA
-08
54
58
AA
-08
41
58
AA
-08
66
40
AA
-08
66
39
AA
-08
66
38
AA
-08
66
31
AA
-08
66
34
AA
-08
54
83
AA
-08
66
36
AA
-08
66
41
AA
-08
54
84
AA
-08
55
21
AA
-08
66
60
AA
-08
55
27
AA
-08
55
23
AA
-08
55
25
AA
-08
55
32
AA
-08
55
19
AA
-08
55
18
AA
-08
66
63
AA
-08
55
76
AA
-08
18
53
AA
-08
18
46
AA
-08
17
30
AA
-08
17
33
AA
-08
18
51
AA
-08
17
50
AA
-08
66
70
AA
-08
17
51
AA
-08
55
75
AA
-08
17
75
AA
-08
17
74
AA
-08
55
77
AA
-08
17
26
AA
-08
18
11
AA
-08
41
35
AA
-08
41
28
AA
-08
17
80
AA
-08
17
84
AA
-08
17
39
AA
-08
17
57
AA
-08
17
38
AA
-08
17
92
AA
-08
18
37
AA
-08
18
19
AA
-08
18
07
AA
-08
18
56
AA
-08
18
25
AA
-08
17
82
AA
-08
17
53
AA
-08
17
95
AA
-08
18
35
AA
-08
18
03
AA
-08
18
33
AA
-08
18
45
AA
-08
18
21
AA
-08
18
44
AA
-08
17
99
AA
-08
17
52
AA
-08
17
76
AA
-08
18
28
AA
-08
17
62
AA
-08
18
34
AA
-08
17
49
AA
-08
18
24
AA
-08
18
27
AA
-08
18
05
AA
-08
18
13
AA
-08
17
64
AA
-08
18
01
AA
-08
18
08
AA
-08
17
60
AA
-08
18
16
AA
-08
17
97
AA
-08
17
87
AA
-08
18
42
AA
-08
17
59
AA
-08
17
63
AA
-08
17
81
AA
-08
18
58
AA
-08
17
85
AA
-08
17
89
AA
-08
17
65
AA
-08
17
61
AA
-08
18
43
AA
-08
18
09
AA
-08
18
12
AA
-08
18
00
AA
-08
18
04
AA
-08
17
96
AA
-08
18
06
AA
-08
18
14
AA
-08
18
02
AA
-08
18
10
AA
-08
41
25
AA
-08
18
26
AA
-08
18
20
AA
-08
18
17
AA
-08
17
44
AA
-08
17
48
AA
-08
17
47
AA
-08
18
22
AA
-08
18
29
AA
-08
17
94
AA
-08
17
55
AA
-08
18
36
AA
-08
18
32
AA
-08
17
56
AA
-08
17
54
AA
-08
41
31
AA
-08
17
58
AA
-08
17
66
AA
-08
18
38
AA
-08
18
54
AA
-08
78
89
AA
-08
17
79
AA
-08
17
68
AA
-08
78
96
AA
-08
78
91
AA
-08
78
93
AA
-08
17
36
AA
-08
18
57
AA
-08
17
67
AA
-08
18
23
AA
-08
78
95
AA
-08
78
97
AA
-08
17
45
AA
-08
78
92
AA
-08
78
86
AA
-08
78
88
AA
-08
17
88
AA
-08
78
90
AA
-08
78
98
AA
-08
17
35
AA
-08
18
18
AA
-08
17
78
AA
-08
78
87
AA
-08
17
77
AA
-08
78
99
AA
-08
17
42
AA
-08
17
46
AA
-08
78
94
AA
-08
17
43 AA
-08
17
98
AA
-08
41
40
Bar
row
Atq
asuk
Ana
ktuv
uk P
ass
Akla
q 6
Akla
q 2
Spar
k 4
Scou
t 1
Spar
k1A
Spar
k 1M
itre
1
Amag
uq 2
Noa
tak
1
Car
bon
1
Koko
da 5
Koko
da 1
Clo
ver A
Hun
ter A
Alta
mur
a
Puvi
aq 1
Look
out 1
Look
out 2
Akla
qyaa
q 1
Ren
dezv
ous
A
Ren
dezv
ous
2
Car
ibou
26-
11
Trai
lbla
zer
H1 Tr
ailb
laze
r A1
Moo
ses
Toot
h C
020
4060
8010
Mile
s
Nat
iona
l Pet
role
umR
eser
ve -
Ala
ska
Leas
es, L
ease
Ow
ners
,R
elin
quis
hed
Leas
e Bo
unda
ries,
the
Gre
ater
Moo
ses
Toot
h U
nit B
ound
ary,
and
Expl
orat
ion
Wel
l loc
atio
ns
07
1421
283.
5M
iles
Lege
nd
NPR
-AO
IL &
GA
S LE
ASE
SAL
ES19
99, 2
002,
200
4 an
d 20
06
D
EP
ARTM
ENT
OF
THE
INT
ERIO
RBU
RE
AU
OF
LAN
D M
ANA
GEM
EN
TEN
ER
GY
SE
CTI
ON
Leas
es
Ope
rato
r
1999
Lea
ses
2002
Lea
ses
2004
Lea
ses
2006
Lea
ses
Rel
inqu
ishe
d Le
ases
Text
with
in le
ase
boun
darie
s re
flect
le
ases
num
bers
and
dol
lar a
mou
nt p
er a
cre.
BG
Ala
ska
E&
P, In
c. (B
GA
K)
Ana
dark
o P
etro
leum
Cor
pora
tion
(AP
C)
FEX
LP
Pet
ro C
anad
a (A
lask
a), I
nc. (
PC
AI)
Pio
neer
Nat
ural
Res
ourc
es A
lask
a, In
c. (P
NR
A)
Con
ocoP
hilli
ps A
lask
a, In
c. (C
PAI)
Ren
aiss
ance
Um
iat,
LLC
Gre
ater
Moo
ses
Toot
h U
nit B
ound
ary
Col
ville
Riv
er S
peci
al A
rea
Sout
hSo
uth
B ea u
f or t
Se a
Nor
thwe
stN
orth
west
Nor
thea
stN
orth
east
Na
tio
na
l P
etr
ole
um
Re
serv
e -
Ala
ska
Na
tio
na
l P
etr
ole
um
Re
serv
e -
Ala
ska
Gre
ater
Moo
ses
Toot
h U
nit B
ound
ary
Arcti
c Ocean
Def
erra
l Are
a
sheyna_wisdom
Figure 2-2
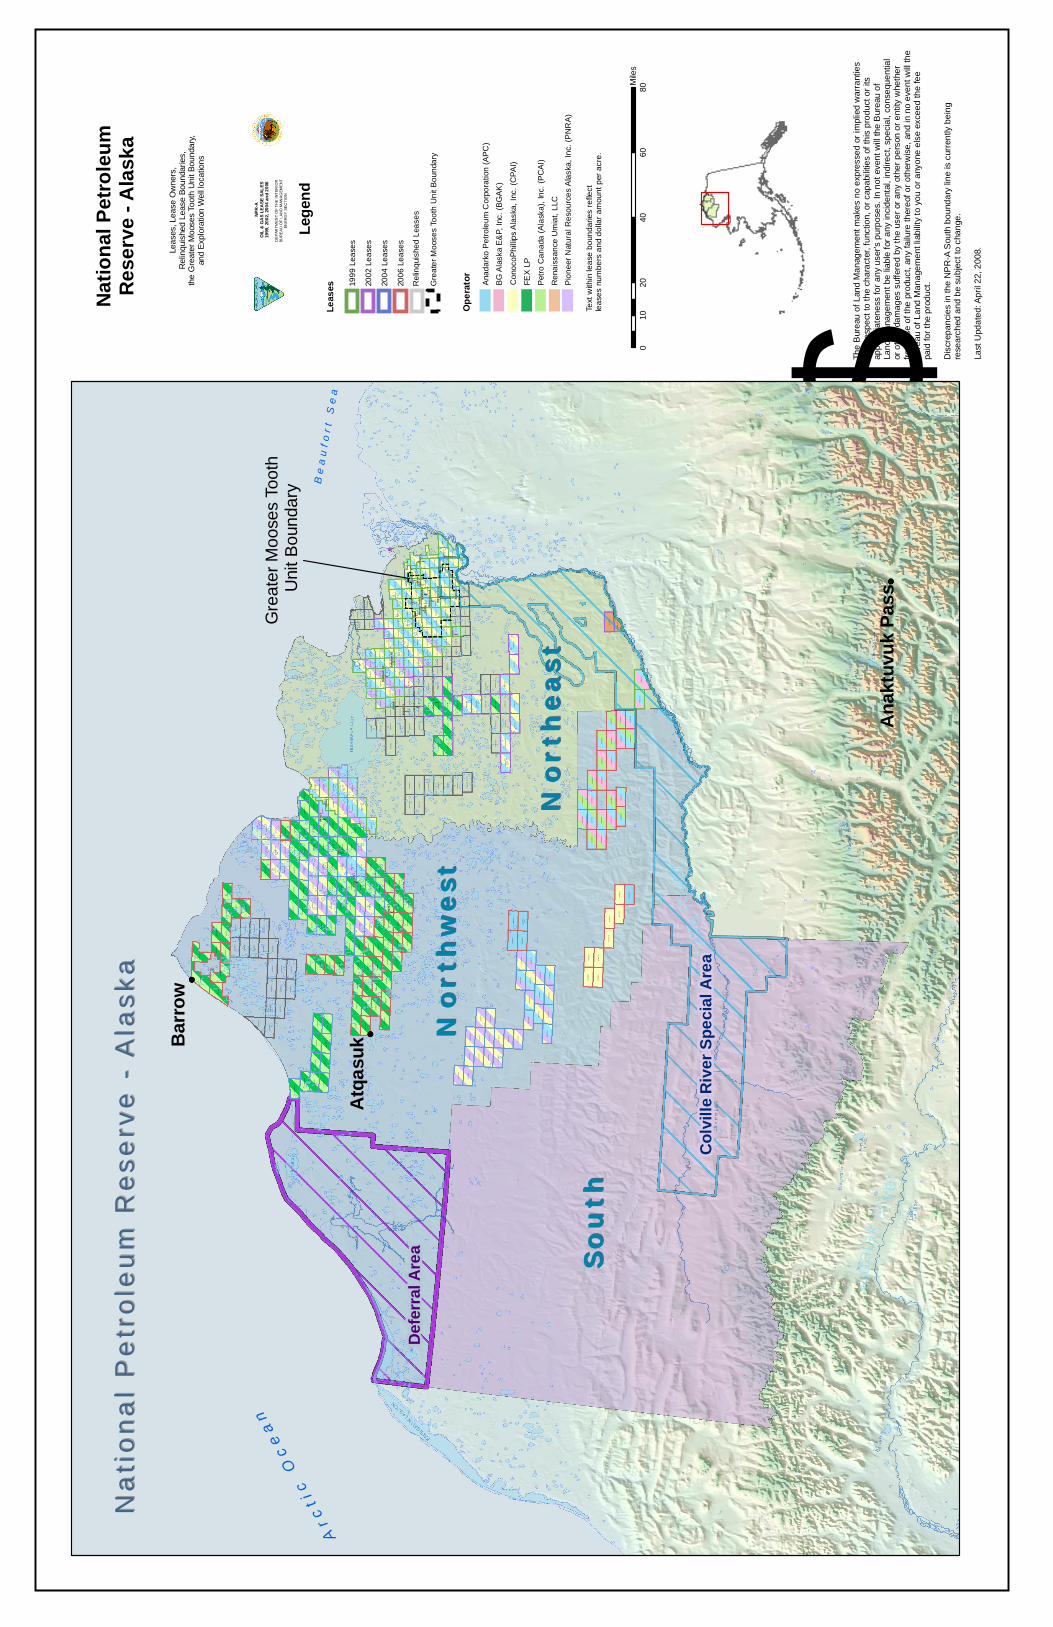
Total direct surface coverage calculated with Geographic Information Systems (GIS) and aerial photography in 2007 for oilfield related activities (gravel pads, roads, mine sites, and TAPS north of the Brooks Range) is 8,690 hectares (21,727 acres) or approximately 0.1 percent of the Arctic Coastal Plain between the Colville and Canning rivers. There are approximately 1,807 km (1,123 mi) of pipelines and 579 km (360 mi) of gravel roads. These measurements were conducted by Aerometric, Inc. using 2007 aerial photography. Fifteen gravel mine sites cover approximately 640 hectares (1,600 acres), although only seven of these are currently in use. There are approximately 130 gravel pads within the currently producing oilfields.
The following sections provide background information on geological and geophysical surveys, environmental studies, onshore and offshore exploratory drilling, development and production, and oil production processes (including production facilities, production wastes, production support operations, and decommissioning and abandonment/restoration). Information is also provided for potential future activities occurring within the timeframe of the proposed regulations. However, it is important to note that plans for exploration change regularly in scope and location, and some exploration may not occur at all.
2.2 GEOLOGICAL AND GEOPHYSICAL SURVEYS
Geological and geophysical surveys are conducted to gather information about subsurface geology. Geological surveys assist in interpreting conditions in the subsurface and may consist of potential field surveys, including gravity, magnetics, and electromagnetic surveys; surface geologic surveys; geotechnical site investigations; geochemical surveys; and other evaluations requiring access to the surface of the land or seafloor. Geophysical surveys can be divided into two classes: seismic and shallow hazard surveys. Seismic surveys generally map deep strata beneath the surface of the ground in search of gas and oil-bearing rock formations. Shallow hazard surveys, also known as “site clearance” or “high resolution surveys,” are conducted to gather information on near-surface hazards up to 305 to 500 meters (m) (1,000 to 1,640 ft) below ground level, which could be encountered during drilling, as well as to determine foundation and permafrost conditions. This information is used to plan drilling operations to avoid or minimize the risk of such features.
2.2.1 Geotechnical Site Investigation
Shallow cores provide information about soil conditions where onshore or offshore pipelines, structures, or other facilities are planned, or to define where facilities may not be sited. Soil borings define the soil stratigraphy and geotechnical properties at selected points and may be integrated with seismic data to develop a regional model for predicting soil conditions in areas not sampled.
2.2.2 Reflection Seismic Exploration
Reflection seismology, or “seismic” as it is more commonly referred to by the oil industry, is used to map the subsurface structure of rock formations. Seismic technology is used by geophysicists who interpret the data to map structural traps that could potentially contain hydrocarbons. Seismic exploration is the primary method of exploring for potential hydrocarbon deposits on land, under the sea, and in the transition zone (the interface area between sea and land). The general principle is to send sound energy waves (using an energy source like airgun or vibroseis) into the ground or water, where the different layers within the Earth's crust reflect back this energy. These reflected energy waves are recorded over a predetermined time period (called the record length) by using hydrophones in water and geophones on land. The reflected signals are recorded onto a storage medium, which is usually magnetic tape. The data
AOGA PETITION FOR PROMULGATION OF REGULATIONS 2-4 APRIL 2009 BEAUFORT SEA 2011-2016
are then processed and seismic profiles are produced. These profiles are then interpreted for possible hydrocarbon containing structures.
High resolution profiling is an integral part of site clearance and shallow hazard surveys. High resolution profiling is accomplished typically through the use of a high-frequency sub-bottom profiler, an intermediate-frequency profiler, and a multi-channel system. A sub-bottom profiler is used to map geologic features by modulating frequency and pulse rate of an acoustic signal. Intermediate-frequency profilers outline the fine strata and density layers of the subsurface sediments, often referred to as a “boomer.” A multi-channel system tows an array of hydrophones that receive the signal from various sizes and numbers of guns, often referred to as a “sparker.”
Seismic crews on the North Slope are typically between 80 and 160 personnel. Substantial logistical support is required to cover not only the seismic operation itself, but also to support the main camp (for catering, waste management and disposal, camp accommodations, washing facilities, water supply, laundry, etc.), fly camps (temporary camps set up away from the main camp on large land seismic operations), all of the crew vehicles (maintenance, fuel, spares, etc.), security, possible helicopter operations, restocking of the explosive magazine, medical support, scientists, marine mammal observers, and many other logistical and support functions.
2.2.2.1 Vibroseis
Vibroseis seismic operations use truck-mounted vibrators that systematically put variable frequency energy into the earth. These can be used both onshore and on offshore sea ice. At least 1.2 m (4 ft) of sea ice is required to support heavy vehicles used to transport equipment offshore for exploration activities. These ice conditions vary, but generally exist from sometime in January until sometime in May in the area of activity. The exploration techniques are most commonly used on landfast ice, but they can be used in areas of stable offshore pack ice. Several vehicles are normally associated with a typical vibroseis operation. One or two vehicles with survey crews move ahead of the operation and mark the source receiver points. Occasionally, bulldozers are needed to build snow ramps on the steep terrain or to smooth offshore rough ice within the survey area.
A typical wintertime exploration seismic crew consists of 40 to 160 personnel. Roughly 75 percent of the personnel routinely work on the active seismic crew, with approximately 50 percent of those working in vehicles and the remainder outside laying and retrieving geophones and cable. Other members of the team are focused on health, safety, or environmental issues, or general camp support.
With the vibroseis technique, activity on the surveyed seismic line begins with the placement of sensors. All sensors are connected to the recording vehicle by multi-pair cable sections. The vibrators move to the beginning of the line, and recording begins. The vibrators move along a source line, which is at some distance or angle to a sensor line. The vibrators begin vibrating in synchrony via a simultaneous radio signal to all vehicles.
In a typical survey, each vibrator will vibrate four times at each location. The entire formation of vibrators subsequently moves forward to the next energy input point (e.g., approximately 67 m [220 ft] in most applications) and repeats the process. In a typical 16- to 18-hour day, a survey will complete 6 to 16 linear km (4 to 10 mi) in two-dimensional (2D) seismic operation and 24 to 64 linear km (15 to 40 mi) in a three-dimensional (3D) seismic operation.
AOGA PETITION FOR PROMULGATION OF REGULATIONS 2-5 APRIL 2009 BEAUFORT SEA 2011-2016
2.2.2.2 Airgun and Watergun Seismic Data Collection
Airgun arrays produce sound waves from multiple guns fired simultaneously that produce sudden releases of pressurized air bubbles to create the sound source, while “ocean bottom cable” or “streamer cables” with attached hydrophones receive the returned echoes. These seismic techniques use compressed air or water in a cylinder at a pressure of about 2,000 pounds per square inch (psi) released from the gun.
In shallow waters or in transition (land and marine) surveys, ocean bottom cable is laid out on the ocean bottom with hydrophones; these hydrophones will measure the energy reflected by the geology. Typically, there will be a source vessel that deploys the airgun array and there will be multiple cable vessels that lay and pickup the cable.
In deeper waters, marine surveys are conducted using vessels capable of towing one or more seismic cables known as “streamers.” Larger vessels may use multiple streamers deployed in parallel, to record data suitable for the three-dimensional interpretation of the structures beneath the sea bed. A single vessel may tow up to 10 streamers, each up to 6 km (3.7 mi) in length, spaced 50 to 150 m (164 to 492 ft) apart. Hydrophones are deployed at regular intervals within each streamer. With this type of setup, the airguns and recording cables are on the same vessel, and the airgun array and streamers can be deployed at different depths, depending on the configuration of survey and regional geology.
To accurately calculate where subsurface features are located, navigators compute the position of both the sound source and each hydrophone group. The positioning accuracy required is achieved using a combination of acoustic networks and differential global positioning system (GPS) receivers.
2.2.2.3 Explosives Seismic Data Collection
Explosives can also be used on land as a source of energy to achieve energy waves for seismic surveys. The field procedures for seismic activities using explosives are essentially the same as outlined in the vibroseis section. Explosives are typically set on land at implanted depths of 10 to 30 m (30 to 100 ft). Charges of high velocity explosives of 15 to 45 kilogram (kg) (33 to 99 pounds [lb]) are normally loaded into each hole or “shotpoint,” and each shotpoint's charge is remotely detonated individually by the recording crew to produce a seismic record. Current practice limits the use of the explosive method to onshore operation.
2.2.3 Vertical Seismic Profiles
Vertical seismic profiles (VSPs) involve lowering geophones into a well bore on land or offshore and repeatedly activating the energy source. VSPs are elaborate checkshots that are used to calibrate seismic sections to well data (i.e., to correlate the reflections on the recorded seismic data with formations seen during drilling). VSPs are a form of well logging and are conducted both on and off the drill pad. VSP operations are usually crewed by fewer than eight people. If conducted during winter, four or five of the operators remain in the vehicles (vibrators) within 1.6 to 5 km (1 to 3 mi) of the rig, while the others are located at the rig.
2.2.4 Seafloor Imagery
A side-scan sonar is a sideward-looking, two-channel, narrow-beam instrument that emits a sound pulse and “listens” for its return. The sound energy transmitted is in a shape that sweeps the seafloor resulting in a 2D image that produces a detailed representation of the seafloor and any features or objects on it. A side-scan sonar emits high frequency sound typically between 120 and 132 kilohertz (kHz) band,
AOGA PETITION FOR PROMULGATION OF REGULATIONS 2-6 APRIL 2009 BEAUFORT SEA 2011-2016
occasionally reaching frequencies up to 410 to 445 kHz. The transmission pulse length can range from 20 milliseconds (msec) to 400 msec, depending on the equipment used. The sonar is typically towed behind a vessel.
2.2.4.1 Offshore Bathymetry
Bathymetry studies are sometimes conducted during the winter ice-season, and the open water season, but prior to seismic surveys to obtain information on water depths, seafloor contours, hazards, and other environmental conditions. These studies are typically conducted using echosounders, such as single-beam or multi-beam sonar devices.
Echosounders measure the time it takes for sound to travel from a transducer, to the seafloor, and back to a receiver. The travel time can be converted to a depth value by multiplying it with the sound velocity of the water column. Echosounders are generally mounted to the ship hull or on a side-mounted pole and could be a single-beam with one transducer, or a multi-beam with an array of transducers.
The single-beam sonar device emits a high frequency single pulse of sound directly below the ship along the vessel trackline and provides a continuous recording of water depth along the survey track. Generally these recorders require compensation to rectify the data point. The sonar can operate at a frequency of either 100 kHz or 200 kHz and emits approximately 15 pulses per second (pulses/sec). Each pulse phase is between 0.03 and 0.12 msec. These data can also provide information on evidence of water column anomalies which could indicate gas escaping into the water column.
A multi-beam sonar device is comprised of a transducer array that emits a swath of sound. The seafloor coverage swath of the multi-beam sonar depends on water depth, but is usually equal to two to four times the water depth. This sonar typically operates at a frequency of 240 kHz. It emits approximately 15 pulses/sec, with each pulse duration lasting 21 msec to 225 msec for a swath that can cover up to 500 m (1,640 ft) in width. The multi-beam system requires additional non-acoustic equipment including a motion sensor (on vessel) to measure heave, roll, and pitch; a gyrocompass (on vessel); and a sound velocity probe (lowered from the vessel when the vessel is stationary). These data provide a 3D view of the seafloor in the surveyed area.
2.2.5 Ultra Shallow Water (USW) Array
This device is an array composed of a series of air powered seismic sound sources (shots) with variable power outputs. The “source array” transmits energy through the water where reflected energy is received by a multi-channel marine digital recording streamer system. This tool is useful in finding shallow faults and amplitude anomalies in the seafloor.
2.3 ENVIRONMENTAL STUDIES
In addition to geological and geotechnical surveys, over the past 40 years there has been extensive research and monitoring in a variety of disciplines, including but not limited to geomorphology (soils, ice content, permafrost); archaeology and cultural resources; vegetation mapping; analysis of fish, avian, and mammal species and their habitat; hydrology; and various other freshwater, marine, and terrestrial studies of the arctic coastal and offshore regions. Many studies are performed in cooperation with scientists from consulting companies; federal, state, and local agencies; universities; non-profit organizations; and other local community stakeholders. Some research programs are multi-year efforts with objectives to collect baseline data or to answer specific research questions. These data are necessary to develop mitigation and monitoring strategies associated with exploration and development plans by:
AOGA PETITION FOR PROMULGATION OF REGULATIONS 2-7 APRIL 2009 BEAUFORT SEA 2011-2016
• Understanding the life cycles and natural variability of wildlife resources, most notably marine mammals, and plant communities;
• Assessing whether exploration activities and development of oilfield operations affect wildlife populations and plant communities, and developing appropriate mitigation and monitoring strategies;
• Identifying the location of important cultural and historical artifacts in order to avoid these areas during exploration and development phases; and
• Understanding the potential for impacts to tundra, air, and aquatic resources through exploration activities and developing mitigation and monitoring strategies.
For the Petition period of 2011 to 2016, studies will continue to be conducted for general monitoring purposes or in anticipation of exploration and development of Alaska’s North Slope natural resources.
2.4 OFFSHORE AND ONSHORE EXPLORATORY DRILLING
There are currently three principal forms of exploratory drilling platforms used in offshore exploration, namely artificial and natural islands, bottom-founded structures, and floating vessels. Onshore exploration in the Alaskan Arctic may be conducted from ice pads (single season or multi-season) and gravel pads.
2.4.1 Artificial Islands
Artificial islands are constructed in shallow offshore waters for use as drilling platforms. In the Arctic, artificial islands have been constructed from a combination of gravel, boulders, artificial structures (e.g., caissons which are watertight retaining structures), and/or ice. Artificial islands can be constructed at various times of the year. During summer, gravel is removed from the seafloor or onshore sites and barged to the proposed site and deposited to form the island. In the winter, gravel is transported over ice roads from an onshore site to the island site. After the artificial island is constructed to its full size, slope protection systems are installed, as appropriate for local oceanographic conditions, to reduce ice ride-up and erosion of the island. Once the island is complete, a drilling rig is transported to the island. One hundred or so people operate a typical rig site. Due to economic and engineering considerations, gravel island construction has historically been restricted to waters less than 15 m (50 ft) deep.
2.4.2 Caisson-retained Island
Caisson-retained islands are similar in construction and design to other artificial islands with one significant exception. Rather than relying entirely on gravel or large boulders for support, the island contains one or more floatable concrete or steel caissons, which rest on an underwater gravel berm or on the ocean floor in water less than 6 m (20 ft) deep. The berm is constructed with dredged or deposited material to within 6 m (20 ft) of the sea surface. When each caisson is in place, the resulting concrete or steel ring is filled with sand to give the structure stability. This design, like the gravel island, allows drilling to occur all year. When drilling is completed, the center core of sand can be dredged out, the caissons refloated, and the structure moved to a new location. The berm is left to erode by the natural action of the ocean. Personnel numbers on a caisson-retained island would be equivalent to those on an artificial island.
AOGA PETITION FOR PROMULGATION OF REGULATIONS 2-8 APRIL 2009 BEAUFORT SEA 2011-2016
2.4.3 Steel Drilling Caisson
The Steel Drilling Caisson (SDC), a bottom-founded structure, is a “fit for purpose” drilling unit constructed typically by modifying the forward section of an ocean-going Very Large Crude Carrier (VLCC). The main body of the structure is approximately 162 m (531 ft) long, 53 m (174 ft) wide, and 25 m (83 ft) high. The deck has been cantilevered to provide additional space. The stability of the system under ice loading is provided by water ballasting of the original cargo tanks. Shotcrete has been applied to the base of the unit to increase its coefficient of friction. The SDC is designed to conduct exploratory year-round drilling under arctic environmental conditions. On its first two deployments in the Canadian Beaufort, the SDC was supported by subsea gravel berms. For its third deployment in Harrison Bay in 1986, a steel component was constructed to support the SDC in lieu of the gravel berms. It was also used in 2002 by EnCana on the McCovey prospect. The steel base configuration adds 13 m (44 ft) to the design height of the structure and allows deployment of the SDC in water depths of 8 to 24 m (25 to 80 ft) without bottom preparation. The SDC requires minimal support during the drilling season. It is typically stocked with supplies before being moved to a drill site. Two or three tugs and/or supply vessels tow the SDC to or from the drill site during open water periods. Deployment and recovery of the SDC require less than one week each. Personnel (typically a maximum of 100) and some smaller equipment are transported to and from the SDC by helicopter. Fuel and larger items, if required, are transported by supply vessel.
2.4.4 Floating Drilling Vessels
Floating drilling vessels include drillships (e.g., Northern Explorer II, Frontier Discoverer), semi-submersibles, or other floating vessels (e.g., Kulluk) in which the hull does not rest on the seafloor. These types of drilling vessels can typically be used in water depths greater than 18 m (60 ft) in the Beaufort Sea. This range makes them more suitable for the deeper water exploratory prospects than the “bottom founded” units such as the islands or the SDC mentioned in previous sections. Floating drilling vessel crews typically range from 100 to 200 people to operate the marine and drilling systems and ensure the safety of the operation (not including support or ice management vessels). These types of floating drilling vessels are held over a well drilling location either by a mooring system (consisting of an anchor, chain, and wire rope) or by the use of dynamic positioning (omni-directional thrusters coupled with a computer control system).
These types of floating drilling vessels operate during the Arctic drilling season with the potential to work during break-up and freeze-up, provided that support vessels are available to manage ice. Operations are supported by one or more ice management vessels (icebreakers) to ensure ice does not encroach on operations. If one of these vessels is moored, then an anchor-handling vessel is required to support the operations. A barge and tug, or other type of Oil Spill Response Vessel (OSRV), typically accompany these floating drilling vessels to provide a standby safety vessel, oil spill response capabilities, and refueling support. Most supplies (including fuel) necessary to complete drilling activities are stored on the drilling and support vessels; however, a shallow draft re-supply vessel can be utilized to move critical equipment to and from marine terminals/docks. Helicopters based at existing shore facilities routinely transfer personnel and additional equipment. Flights average one or two per day. Fuel and supply caches may also be deployed on some occasions.
2.4.5 Ice Pads, Roads, and Islands
Ice roads provide seasonal routes for heavy equipment and supplies to be moved to remote areas, both onshore and offshore. These temporary, seasonal roads are constructed by spreading water from local
AOGA PETITION FOR PROMULGATION OF REGULATIONS 2-9 APRIL 2009 BEAUFORT SEA 2011-2016
sources (abandoned mine sites, lakes, rivers, seawater) to create a rigid surface. On land and along river corridors, ice roads and pads are constructed from freshwater sources. Most often and when available, abandoned mine sites that have filled with freshwater are used for construction of ice roads on tundra or along river banks. In cases where mine site water is not available, freshwater lakes are used for ice road construction. For grounded ice roads in shallow (< 2 m [< 6.5 ft]) waters of the Beaufort Sea, seawater is initially used for the foundation and the ice road is eventually “capped” with freshwater, strengthening the road. Floating ice roads may also be constructed over deeper water. Ice bridges may be constructed to provide winter access across frozen rivers; ice airstrips are built in the same manner as ice roads. Ice drilling and storage pads are now commonly used for winter exploration pads. Ice pads are also built in a similar way to ice roads and airstrips. The thickness of ice roads, pads, and bridges depends on the loads that must be supported and on terrain, and can range from 15 centimeter (cm) (6 inches [in]) to 3 m (10 ft). Offshore ice pads may be thicker.
Insulated ice pads are occasionally used to allow the ice structure to remain intact through summer, and thus, be used for multiple drilling seasons. Offshore ice islands and offshore ice roads are built using similar techniques to their onshore counterparts.
2.5 DEVELOPMENT AND PRODUCTION
Existing North Slope production operations extend from Alpine in the west to Point Thomson and Badami in the east. Badami and Alpine are developments without permanent access roads; access is available to these fields by airstrips, barges, and seasonal ice roads. Sales oil pipelines extend from these fields and connect to TAPS. North Slope oilfield developments include a series of major fields and their associated satellite fields. In some cases a new oilfield discovery has been developed completely using existing infrastructure. Thus, the Prudhoe Bay oilfield unit encompasses the Prudhoe Bay, Lisburne, Niakuk, West Beach, North Prudhoe Bay, Point McIntyre, Borealis, Midnight Sun, Polaris, Aurora and Orion reservoirs, while the Kuparuk oilfield development incorporates the Kuparuk, West Sak, Tarn, Palm, Tabasco, and Meltwater oilfields. Figure 2-1 depicts oil and gas units and leaseholder ownership on the North Slope. Table 2-1 summarizes the area of infrastructure. This area was calculated using recent (2007) aerial photography by Aerometric, Inc. Table 2-2 summarizes existing and potential future oil and gas developments.
AOGA PETITION FOR PROMULGATION OF REGULATIONS 2-10 APRIL 2009 BEAUFORT SEA 2011-2016
Table 2-1 Infrastructure Area on North Slope as of 2007
Type of Infrastructure Acres Hectares
Gravel roads and causeway Roads 2,873 1,163 Causeway 216 87 Total Area 3,089 1,250 Airstrips (gravel or paved) 307 124 Offshore gravel pads, islands Exploration islands 54 22 Production islands 112 45 Total Area 166 67 Gravel pads Production pads, drill sites 2,914 1,179 Processing facility pads 846 342 Support pads (camps, power stations) 1,698 687 Exploration site 321 130 Total Area 5,779 2,338 Total gravel footprint 9,341 3,779 Other affected areas Exploration site - disturbed area around gravel pad 649 263 Exploration airstrip – thin gravel, tundra scar 65 26 Peat roads 517 209 Tractor trail, tundra scar 258 104 Exploration roads – thin gravel, tundra scar 174 70 Gravel pad removed, site in process of recovery 309 125 Gravel pad removed, site is recovered 81 33 Total other affected area 2,053 830 Gravel mines/borrow pits In rivers 5,384 2,179 In tundra 1,351 547 Total gravel mine area 6,735 2,726 Total infrastructure area 18,129 7,335 Source: Aero-Metric, Inc. 2007
AOGA PETITION FOR PROMULGATION OF REGULATIONS 2-11 APRIL 2009 BEAUFORT SEA 2011-2016
Table 2-2 Existing and Potential Oil and Gas Development Projects on the North Slope
Unit Name Type of Production Reserve Location Production
Location Year
Discovered Year in
Production
Existing Colville River Alpine Oil Onshore Onshore 1994 2000 Prudhoe Bay Aurora Oil Onshore Onshore 1999 2001
Badami Badami Oil Onshore/Offshore Onshore 1990 1998 Cascade Oil Onshore Onshore 1993 1996 East Barrow Gas Onshore Onshore 1974 1981
Duck Island Eider Oil Offshore Offshore 1998 1998 Duck Island Endicott Oil Offshore Offshore 1978 1986
Kuparuk River Kuparuk Oil Onshore/Offshore Onshore 1969 1981 Prudhoe Bay Lisburne Oil Onshore Onshore 1967 1981 Kuparuk River Meltwater Oil Onshore Onshore 2000 2002 Prudhoe Bay Midnight Sun Oil Onshore Onshore 1998 1999 Milne Point Milne Point Oil Onshore/Offshore Onshore 1969 1985
Prudhoe Bay N. Prudhoe Bay Oil Onshore Onshore 1970 1993 Prudhoe Bay Niakuk Oil Offshore Onshore 1985 1994
NE NPR-A CD-5 Alpine West Oil Onshore Onshore 2000 2010 Ataruq/Two Bits Oil Onshore Onshore 2005 NA
NE NPR-A CD-6 Lookout Oil Onshore Onshore 2000 2010 NE NPR-A CD-7 Spark Oil Onshore Onshore 2000 2010
E. Umiat Gas Onshore Offshore 1964 NA
AOGA PETITION FOR PROMULGATION OF REGULATIONS 2-12 APRIL 2009 BEAUFORT SEA 2011-2016
Table 2-2 Existing and Potential Oil and Gas Development Projects on the North Slope (continued)
Unit Name Type of Production Reserve Location Production
Location Year
Discovered Year in
Production
East Kurupak Gas Onshore Offshore 1976 NA Fish Creek Oil Onshore Offshore 1946 NA
Beaufort Flaxman Island Oil Offshore Onshore 1975 NA NRP-A Gubik Gas Onshore Onshore 1950 NA
Beaufort Gwydyr Bay Oil Onshore/Offshore Onshore 1969 NA Hammerhead/Sivulliq Oil Offshore Offshore 1985 NA Hemi Springs Oil Onshore Offshore 1984 NA Kalubik Oil Offshore Onshore 1992 NA Kavik Gas Onshore Offshore 1969 NA Kemik Gas Onshore Offshore 1972 NA
Beaufort Kuvlum Oil Offshore Offshore 1987 NA Liberty Liberty Oil Offshore Offshore 1983 2011
Meade Gas Onshore Offshore 1950 NA Mikkelson Oil Onshore Onshore 1978 NA Pete's Wicked Oil Onshore Onshore 1997 NA
Point Thomson Point Thomson Oil & Gas Onshore/Offshore Onshore 1977 2014 Sandpiper Oil & Gas Offshore Offshore 1986 NA Simpson Oil Onshore Offshore 1950 NA Sourdough Oil Onshore Onshore 1994 NA Square Lake Gas Onshore Offshore 1952 NA Stinson Oil Offshore Offshore 1990 NA Sukukik Oil Onshore Onshore 1988 NA Ugnu Oil Onshore Offshore 1984 NA Umiat Oil Onshore Offshore 1946 NA Wolf Creek Gas Onshore Offshore 1951 NA Yukon Gold Oil Onshore Onshore 1994 NA
NA = Not yet in production
2.5.1 Prudhoe Bay Unit
The Prudhoe Bay oilfield is the largest oilfield by production in North America and ranks among the 20 largest oilfields ever discovered worldwide. Over 11 billion barrels have been produced from a field originally estimated to have 25 billion barrels of oil in place. The Prudhoe Bay field also contains an estimated 26 trillion cubic ft of recoverable natural gas. More than 1,100 wells are currently in operation in the greater Prudhoe Bay oilfields, just over 900 of which are producing oil (others are for gas or water injection).
The total development area in the Prudhoe Bay Unit is approximately 2,785 hectares (6,883 acres). The Base Operations Center on the western side of the Prudhoe Bay oilfield can accommodate 476 people, the nearby Main Construction Camp can accommodate up to 680 people, and the Prudhoe Bay Operations Center on the eastern side of the field houses up to 488 people. Additional contract or construction personnel can be housed at facilities in nearby Deadhorse or in temporary camps placed on existing gravel pads.
AOGA PETITION FOR PROMULGATION OF REGULATIONS 2-13 APRIL 2009 BEAUFORT SEA 2011-2016
2.5.2 Kuparuk River Unit
The Kuparuk oilfield is the second-largest producing oilfield in North America. More than 2.6 billion barrels of oil are expected to be produced from this oilfield. The Greater Kuparuk Area includes the satellite oilfields of Tarn, Palm, Tabasco, West Sak, and Meltwater. These satellite fields have been developed using existing facilities. To date, nearly 900 wells have been drilled in the Greater Kuparuk Area. The total development area in the Greater Kuparuk Area is approximately 603 hectares (1,508 acres), including 167 km (104 mi) of gravel roads, 231 km (144 mi) of pipelines, 6 gravel mine sites, and over 50 gravel pads.
The Kuparuk Operations Center and Kuparuk Construction Camp are able to accommodate up to 1,200 people. The Kuparuk Industrial Center is primarily used for personnel overflow during the winter in years with a large amount of construction.
2.5.3 Greater Point McIntyre
The Greater Point McIntyre Area encompasses the Point McIntyre field and nearby satellite fields of West Beach, North Prudhoe Bay, Niakuk, and Western Niakuk. The Point McIntyre area is located 11.3 km (7 mi) north of Prudhoe Bay. It was discovered in 1988 and came online in 1993. BPXA produces the Point McIntyre area from two drill site gravel pads. The field’s production peaked in 1996 at 170,000 barrels per day, whereas in 2006 production averaged 21,000 barrels per day with just over 100 wells in operation. Cumulative oil production as of December 31, 2006 was 738 million barrels of oil equivalent (BOE).
2.5.4 Milne Point
Located approximately 56 km (35 mi) northwest of Prudhoe Bay, the Milne Point oilfield was discovered in 1969 and began production in 1985. The field consists of more than 220 wells drilled from 12 gravel pads. Milne Point produces from three main fields: Kuparuk, Schrader Bluff, and Sag River. Cumulative oil production as of December 31, 2006 was 248 million BOE. The total area of Milne Point and its satellites is 94.4 hectares (236 acres) of tundra, including 31 km (19 mi) of gravel roads, 64 km (40 mi) of pipelines, and one gravel mine site. The Milne Point Operations Center has accommodations for up to 300 people.
It is estimated that the Ugnu reservoir contains roughly 20 billion barrels of heavy oil in place. BPXA’s reservoir scientists and engineers conservatively estimate that roughly 10 percent of that resource, or 2 billion barrels, could be recoverable. Currently, cold heavy oil production with sand (CHOPS) technology is being tested at Milne South Pad. CHOPS is part of a multi-year technology testing and research program initiated at Milne Point in 2007.
2.5.5 Endicott
The Endicott oilfield is located approximately 16 km (10 mi) northeast of Prudhoe Bay. It is the first continuously producing offshore field in the U.S. Arctic. The Endicott oilfield was developed from two man-made gravel islands connected to the mainland by a gravel causeway. The operations center and processing facilities are located on the 18-hectare (45-acre) Main Production Island. Approximately 80 wells have been drilled to develop the field. Two satellite fields drilled from Endicott’s Main Production Island access oil from the Ivishak formation: Eider produces about 110 barrels per day, and Sag Delta North produces about 117 barrels per day. The total area of Endicott development is 156.8 hectares (392
AOGA PETITION FOR PROMULGATION OF REGULATIONS 2-14 APRIL 2009 BEAUFORT SEA 2011-2016
acres) of land with 25 km (15 mi) of roads, 47 km (29 mi) of pipelines, and one gravel mine site. Approximately 100 people are housed at the Endicott Operations Center.
2.5.6 Badami
Production began from the Badami oilfield in 1998, but has not been continuous. The Badami field is located approximately 56 km (35 mi) east of Prudhoe Bay and is currently the most easterly oilfield development on the North Slope. The Badami development area is approximately 34 hectares (85 acres) of tundra including 7 km (4.5 mi) of gravel roads, 56 km (35 mi) of pipeline, one gravel mine site, and two gravel pads with a total of eight wells. There is no permanent road connection from Badami to Prudhoe Bay. The pipeline connecting the Badami oilfield to the common carrier pipeline system at Endicott was built from an ice road. The cumulative production is five million BOE. This field is currently in “warm storage” status and currently is not producing oil reserves at this time. BPXA recently entered into an agreement with Savant LLC; under this agreement Savant will drill an exploration well in the winter of 2009 and potentially add an additional well in 2010. Depending on the outcome of these drilling programs, Badami could resume production.
2.5.7 Alpine
Discovered in 1996, the Alpine oilfield began production in November 2000. Alpine is the westernmost oilfield on the North Slope, located 50 km (31 mi) west of the Kuparuk oilfield and just 14 km (9 mi) northeast of the village of Nuiqsut. Although the Alpine reservoir covers 50,264 hectares (124,204 acres), it has been developed from 65.9 hectares (162.92 acres) of pads and associated roads. Alpine features a combined production pad/drill site and three additional drill sites with an estimated 172 wells. There is no permanent road connecting Alpine with the Kuparuk oilfield; small aircraft are used to provide supplies and crew changeovers. Major resupply activities occur in the winter, using the ice road that is constructed annually between the two fields. The Alpine base camp can house approximately 540 employees.
2.5.8 Northstar
The Northstar oilfield was discovered in 1983 and developed by BPXA in 1995. The offshore oilfield is located 6 km (4 mi) northwest of the Point McIntyre field and 10 km (6 mi) from Prudhoe Bay in about 39 feet of water. The 15,360-hectare (38,400-acre) reservoir has now been developed from a 2-hectare (5-acre) artificial island. Production from the Northstar reservoir began in late 2001. The 2-hectare (5-acre) island will eventually contain 19 producing wells, six gas injector wells, and one solids injection well. A subsea pipeline connects facilities to the Prudhoe Bay oilfield. Access to Northstar is via helicopter, hovercraft, and boat.
2.5.9 Oooguruk Unit
The Oooguruk Unit is located adjacent to Kuparuk River Unit in shallow waters of Harrison Bay. Pioneer and its partner, Eni, constructed an offshore drill site and onshore production facilities pad in 2006 on State of Alaska leases. A subsea flowline was constructed to transfer produced fluids 9.2 km (5.7 mi) from the offshore drill site to shore. The subsea flowline transitions to an aboveground flowline supported on vertical support members for 3.9 km (2.4 mi) to the onshore facilities for approximately 3.3 hectares (8.2 acres). The offshore drill site (2.4 hectares, 6 acres) is planned to support 48 wells drilled from the Nuiqsut and Kuparuk reservoirs. The wells are contained in well bay modules, with capacity for an
AOGA PETITION FOR PROMULGATION OF REGULATIONS 2-15 APRIL 2009 BEAUFORT SEA 2011-2016
additional 12 wells, if needed. Development drilling began in 2007 with unit production commencing in 2008.
2.5.10 Nikaitchuq Unit
The Nikaitchuq Unit is located at Spy Island, north of Oliktok Point and the Kuparuk River unit, and northwest of the Milne Point Unit. Former operator Kerr-McGee Oil and Gas Corporation drilled exploratory wells from up to three locations on or immediately adjacent to Spy Island, 6.4 km (4 mi) north of Oliktok Point in 2004-2005. Kerr McGee drilled six wells in the Nikaitchuq and Tuvaaq units between 2004 and 2005. Three of the six tested oil from the Schrader Bluff or Sag River formations; Kerr McGee drilled two additional Schrader Bluff wells in 2006. Seventy-six wells are expected to be drilled between 2008 and 2011, 31 of which would be producers. In 2007, Eni became operator in the area, after acquiring Armstrong Oil & Gas interests. In 2007, Eni received state approval for expansion of the unit, combining it with the former Tuvaaq unit and adding a segment from the Kuparuk unit. Initial drilling will be from a gravel pad housing production facilities. Future drilling will be from a small gravel island shoreward of the barrier islands.
2.6 OIL PRODUCTION PROCESSES
2.6.1 Production Facilities
Wells are drilled into oil bearing zones to bring oil to the surface. Wells are typically grouped on gravel pads (or islands), commonly called well pads or drill sites. During development design, pads are placed to optimize oil recovery within the constraints of drilling reach and environmental protection. At the surface well-head, a mix of crude oil, water, and natural gas flows into the manifold building, which is also located on the well pad. The primary function of the manifold building is to combine production from multiple wells and route it to separation facilities via cross-country flow lines. Some remote locations with space limitations decrease the footprint of the manifold building by utilizing multi-phase flow meters instead of a test separator. Production from a well may be diverted through the multi-phase flow meter or sent directly to a common production flow line. Crude oil from offshore remote locations is transported via buried subsea pipelines to onshore flow lines that deliver it to the separation facilities.
At the separation facilities (also called production facilities, gathering centers, or flow stations), gas, oil, and water are separated. Following the separation process, oil is routed by pipeline to Pump Station 1, which is the beginning of the TAPS. The separated water (referred to as produced water) is sent via pipeline back to the well pads where it is typically injected back into the reservoir to help maintain reservoir pressure and enhance recovery of oil. Most of the produced gas is also reinjected to maintain reservoir pressure. A portion of the gas is used to fuel the overall production operation. In the Prudhoe Bay Unit, gas is first routed to the Central Gas Facility (CGF) where natural gas liquids (NGLs) and miscible injectant (MI) are extracted using a low temperature separation process. The NGLs are shipped via TAPS with the crude oil. MI is sent via pipelines to the well pads where it is injected for enhanced oil recovery. After the NGLs and MI are removed, the remaining gas is routed to compressors at both the CGF and the Central Compressor Plant, where it is compressed for re-injection into the gas cap of the reservoir. In older fields, such as Prudhoe Bay and Kurparuk, the crude oil fraction of production fluids is substantially less than the water and gas fraction. A diagram illustrating the oil production processed is provided in Figure 2-3.
AOGA PETITION FOR PROMULGATION OF REGULATIONS 2-16 APRIL 2009 BEAUFORT SEA 2011-2016
Figure 2-3. North Slope Process Flow Diagram
2.6.2 Production Wastes
Production wastes include drilling muds that are used to lubricate and maintain the well bore during drilling, and rock fragments known as cuttings, removed by the drill bit. Drilling muds are either water-based mixtures comprised of naturally occurring clays and weighting materials with small amounts of other additives or oil-based mixtures comprised of mineral oil and weighting materials with small amounts of other additives. Until the 1990s, these production wastes were typically placed in “reserve pits” built into the gravel drilling pads; however, new technology has eliminated the need for reserve pits by grinding the cuttings and re-injecting the muds and ground cuttings into deep, confined geologic formations. Wastes that are generated during exploration drilling operations are similar in nature to
AOGA PETITION FOR PROMULGATION OF REGULATIONS 2-17 APRIL 2009 BEAUFORT SEA 2011-2016
production wastes and are treated similarly. Subsurface waste disposal is regulated by the Environmental Protection Agency (EPA) and the State of Alaska under the Underground Injection Control program.
Other wastes generated by oilfield operations include well treatment fluids, chemicals used for processing crude oil, rig washwater, accumulated materials such as hydrocarbons solids, sands and emulsion from production separators and fluid treating vessels, and cooling waters. These wastes are handled by using a variety of techniques, including recycling, underground injection, beneficial reuse in enhanced oil recovery, and shipment to approved offsite facilities.
A small amount of hazardous waste is generated by production facilities. These wastes are handled in accordance with EPA regulations. Hazardous wastes are sent out of state by truck, rail, and barge to EPA-permitted disposal facilities in the contiguous U.S.
Non-hazardous solid waste and sanitary wastes are also generated at North Slope oilfield facilities. Solid wastes such as empty drums, paper products, wood, etc., are handled at the North Slope Borough (NSB) landfill or incinerated. Disposable food waste is also handled at the NSB landfill facility, and predator-proof dumpsters have been installed in the oilfield to minimize wildlife attraction to these potential food sources. Sewage wastes are physically and chemically treated by wastewater treatment facilities. North Slope area facilities also operate various recycling programs. Paper products, wood, scrap metal, cardboard, electronics, and other materials are collected and transported off the North Slope to appropriate recycling facilities.
2.6.3 Decommissioning
While no major oilfield has been decommissioned and abandoned to date, individual production pads and exploration sites have been subject to closeout, cleanup, and rehabilitation activities. Such activities may involve the removal of surface structures and equipment; permanently plugging and abandoning the wells and removal of the wellhead; the installation of well monitoring equipment, the removal or cleanup of contaminated gravel, soil, and/or drilling waste; the removal or grading of gravel; and the planting and restoration of vegetation.
2.7 SUPPORT AND DISTRIBUTION
2.7.1 Support Operations
Equipment and people associated with exploration and production operations are transported to and from the facilities by truck or bus, aircraft, hovercraft, marine vessel, or barge towed by a vessel. Equipment and materials are transported to the North Slope by truck. Aircraft, both fixed wing and helicopters, are used for movement of personnel, mail, rush-cargo, and perishable items. Marine vessel, barges, and tugs are used to transport items in open water.
2.7.2 Trans-Alaska Pipeline System
TAPS is a 122-cm (48-in) diameter crude oil transportation pipeline system that originates at Pump Station 1 in the Prudhoe Bay Field, and extends 1,287 km (800 mi) across the state to its terminus at the Valdez Marine Terminal. Alyeska Pipeline Service Company, as operator of the pipeline, conducts pipeline operations, maintenance and emergency response along the pipeline right-of-way, including approximately 37 km (23 mi) of pipeline located within 40 km (25 mi) of the Beaufort Sea coastline. Personnel are based out of pump stations, and reside in designated living facilities, where lodging and eating amenities are maintained. In addition to routine operations, project work and emergency response
AOGA PETITION FOR PROMULGATION OF REGULATIONS 2-18 APRIL 2009 BEAUFORT SEA 2011-2016
training takes place at various distances from the pump stations. Operations and maintenance of the pipeline and facilities includes a 238-km (148-mi) natural gas line that extends south from Pump Station 1 that supplies fuel to power turbines at Pump Stations 3 and 4. Travel primarily occurs along established roads, such as the Spine Road and the Dalton Highway, or along the pipeline right-of-way work pads. The Dalton Highway corridor is shared with the general public.
Congress enacted the Trans-Alaska Pipeline Authorization Act (TAPAA) on November 16, 1973. The Federal Agreement and Grant of Right-of-Way for the TAPS (Federal Grant) was issued on January 23, 1974, and the State Right-of-Way Lease for the TAPS was issued on May 3, 1974. The Federal Grant, as renewed, expires on May 2, 2034. On November 26, 2002, the lease for state land along the pipeline corridor was renewed for an additional 30 years.
2.8 PLANNED AND POTENTIAL FUTURE ACTIVITIES 2011-2016
It is generally speculative to discuss planned activities for the 2011−2016 period, because even those oilfields in an advanced stage of planning may not actually be constructed. For example, the Liberty oilfield was discovered in 1982 by Shell Oil Company and subsequently acquired by BPXA in 1996 after Shell relinquished its leases. BPXA drilled a well from Tern Island in the winter of 1996-1997, and based on the results of that well, BPXA proceeded with plans to develop the reservoir. Construction activities were initially planned for the 1999−2000 winter season but were subsequently deferred. In early 2002, BPXA announced that it was suspending permit applications to develop the Liberty oilfield. In the fall of 2004, BPXA re-initiated permitting for Liberty with the signing of a Memorandum of Understanding for permit evaluation and the NEPA process. Initial construction activities for the Liberty Development began in early 2009. This demonstrates the uncertainty of identifying future activities since they are driven by a variety of economic, regulatory, and environmental factors beyond the control of the oil and gas industry.
Possible future activities, which seem likely within the five-year period covered by the requested regulations, are discussed below. These include MMS OCS lease sales, State of Alaska lease sales, NPR-A activities, and potential development/exploration sites. Seismic exploration and exploratory drilling could occur at unidentified locations and potential new satellite oilfields across the North Slope in areas recently leased or in those areas subject to continuing evaluation.
2.8.1 Minerals Management Service OCS Lease Sales
The MMS manages the Alaska OCS region encompassing 242 million hectares (600 million acres). The planning area within the project area of activity is the Beaufort Sea Planning Area. In February, 2003, MMS issued the Final EIS for three lease sales planned for the Beaufort Sea Planning Area: Sale 186, 195, and 202. Sale 186 was held in 2003, resulting in the leasing of 34 tracts encompassing 73,576 hectares (181,810 acres). Sale 195 occurred in 2005, resulting in the leasing of 117 tracts encompassing 245,760 hectares (607,285 acres). Sale 202 was held in 2007, resulting in the leasing of 90 tracts covering 198,580 hectares (490,700 acres). Leasing information from MMS is located at http://www.mms.gov/alaska/lease/lease.htm.
MMS plans two more lease sales in the Beaufort Sea. Lease Sale 209 is scheduled for 2010 and Lease Sale 217 for 2011. MMS has begun preparing the multiple-sale EIS for these areas. The scoping report was published March 19, 2008. The Draft EIS was released in November 2008 and is located at http://www.mms.gov/alaska/ref/EIS%20EA/ArcticMultiSale_209/_DEIS.htm. Public hearings regarding the Draft EIS are being held in April 2009.
AOGA PETITION FOR PROMULGATION OF REGULATIONS 2-19 APRIL 2009 BEAUFORT SEA 2011-2016
The BLM manages over 9 million hectares (23 million acres) in the NPR-A, including the Northwest (3.5 million hectares, 8.8 million acres), Northeast (1.8 hectares, 4.6 million acres), and South (3.6 million hectares, 9 million acres) Planning Areas. The area of activity in this Petition includes the Northwest and Northeast areas.
2.8.2.1 Northwest Planning Area
The Record of Decision (ROD) for the Northwest NPR-A Integrated Activity Plan (IAP)/EIS was signed on January 22, 2004. On January 10, 2005, the Federal District Court for Alaska dismissed a lawsuit on the plan, finding in favor of BLM on all issues, clearing the way for industry to explore areas obtained in the July 2004 lease sale. The ROD emphasizes restrictions on surface activities, consultation with local residents, and coordinated scientific studies to protect wildlife habitat, subsistence areas, and other resources.
Oil and gas lease sale activities took place in 2004, 2006, and 2008. The 2004 lease sale sold 123 tracts totaling 566,560 hectares (1.4 million acres); the 2006 sale sold 81 tracts covering 380,350 hectares (939,867 acres); the 2008 sale sold 23 tracts covering 106,013 hectares (261,964 acres). From 2000 to 2008, 25 exploratory wells have been drilled in both the Northeast and Northwest planning areas of the NPR-A. Current operator/ownership information is available on the BLM NPR-A website at http://www.blm.gov/ak/st/en/prog/energy/oil_gas/npra.html.
FEX LP applied for permits to access and drill on their oil and gas leases in the Northwest NPR-A between 2006 and 2008. The EA prepared by BLM for this proposed program tiered off of a previous EA and FONSI for a similar FEX proposal (BLM 2006a). New project elements included exploration drilling at nine new ice drill pad locations (in the Uugaq, Aklaq, Aklaqyaaq, and Amaguq prospects), 99 km (62 mi) of new access corridor, and 34 new water sources.
2.8.2.2 Northeast Planning Area
The ROD for the Northeast NPR-A Supplemental IAP/EIS was signed on July 16, 2008. The decision makes nearly 1.7 million hectares (4.4 million acres) available for oil and gas leasing though it defers leasing on 174,014 hectares (430,000 acres) north and east of Teshekpuk Lake for ten years. The decision makes Teshekpuk Lake and its islands (approximately 88,626 hectares, 219,000 acres) unavailable for oil and gas leasing due to its environmental sensitivity. The decision also establishes performance-based stipulations and required operating procedures, which apply to oil and gas and, in some cases, to non-oil and gas activities within the planning area, and requires studies and monitoring.
Lease sales have been held in the Northeast NPR-A in 1999, 2002, and 2008. The 1999 lease sale sold 133 tracts totaling 351,070 hectares (867,514 acres); the 2002 sale sold 60 tracts covering 234,422 hectares (579,269 acres); and the 2008 sale sold 116 tracts covering 74,045 hectares (182,969 acres). Past lease sales and current operator/ownership information is available on the BLM NPR-A website at http://www.blm.gov/ak/st/en/prog/energy/oil_gas/npra.html.
CPAI applied for permits to begin a five-year (2006-2011) winter drilling program at 11 sites in the Northeast planning area of the NPR-A (Noatak, Nuggeet, Cassin and Spark DD prospects), including 177 km (110 mi) of new right-of-way corridors and 10 new water supply lakes. The EA prepared by the BLM in 2006 drew on four previous BLM analyses of proposed CPAI exploration in the Northeast NPR-A, all of which resulted in a FONSI (BLM 2006b).
AOGA PETITION FOR PROMULGATION OF REGULATIONS 2-20 APRIL 2009 BEAUFORT SEA 2011-2016
2.8.3 State of Alaska Lease Sales
In 1996, the State of Alaska Department of Natural Resources (ADNR), Oil and Gas Division, adopted an “areawide” approach to leasing. Under areawide leasing, the state offers all available state acreage not currently under lease within each area annually. The area of activity in this Petition includes the North Slope and Beaufort Sea planning areas. Lease sale data are available on the ADNR website at: http://www.dog.dnr.state.ak.us/oil/index.htm.
The North Slope planning area has 1,225 tracts that lie between the ANWR and the NPR-A. The southern boundary of the North Slope sale area is the Umiat baseline. In this planning area, ten lease sales have been held to date. As of August 2008, there are 774 active leases on the North Slope, encompassing 971,245 hectares (2.4 million acres), and 224 active leases in the state waters of the Beaufort Sea, encompassing 249,000 hectares (615,296 acres). The sale on October 22, 2008 resulted in the sale of 60 tracts for a total of 86,765 hectares (214,400 acres).
The Beaufort Sea planning area encompasses a gross area of approximately 809,370 hectares (2 million acres) divided into 573 tracts ranging in size from 259 to 2,330 hectares (640 to 5,760 acres). These tracts are located within the NSB and consist of State-owned tidal and submerged lands in the Beaufort Sea between the Canadian Border and Point Barrow. The sale area is adjacent to both the NPR-A and the ANWR. The southern fringe of the sale area includes some state-owned uplands lying between the NPR-A and ANWR. Eight lease sales have been held to date. As of July 2008, there are 38 active leases in this area, encompassing 38,333 hectares (94,724 acres). The sale on October 22, 2008 resulted in the sale of 32 tracts for a total of 40,145 hectares (99,200 acres).
2.8.4 Liberty
BPXA is currently in the process of developing the Liberty field. The project concept is to use ultra-extended-reach drilling (uERD) technology to access an offshore reservoir from existing onshore facilities. Using uERD will allow Liberty to be developed with a much smaller footprint than originally planned. The Liberty reservoir is located in federal waters in Foggy Island Bay about 13 km (8 mi) east of the Endicott Satellite Drilling Island (SDI). The SDI will be expanded to accommodate the drill rig, Liberty wells, camp for approximately 160 people, and associated infrastructure. Drilling of the initial Liberty development well is planned to start in early 2010, with completion and first oil production in the first quarter of 2011.
2.8.5 Point Thomson
The Point Thomson reservoir is approximately 32 km (20 mi) east of the Badami field. ExxonMobil submitted a Plan of Development to the ADNR in February 2008 that provide for drilling beginning in the winter of 2008-2009 and production in 2014. ADNR rejected that plan in April 2008 and terminated the unit and leases. ExxonMobil and the other working interest owners appealed to the termination of the unit and the individual leases. In July 2008, ExxonMobil submitted permit applications for a multi-well program for the Point Thomson field. In January 2009, ADNR issued a conditional interim decision in the lease appeals that allows the drilling of two wells by 2010 and commencing production by 2014. The interim decision only addresses drilling of two wells, with a final decision pending, and the parties continue to discuss settlement and full development of the field., both penetrating the Thomson Sands reservoir by 2010.
AOGA PETITION FOR PROMULGATION OF REGULATIONS 2-21 APRIL 2009 BEAUFORT SEA 2011-2016
The Point Thomson reservoir straddles the coastline with a portion of the reservoir underlying the Beaufort Sea, and all wells and supporting infrastructure will be located onshore. Full development contemplates wells drilled from three drill sites. Construction of field central processing facilities, an export pipeline to the Badami pipeline, camps, and an airstrip are planned to occur between 2012 and 2014. Some gravel placement may occur in earlier years. No permanent roads will connect Point Thomson with the Alaska all-weather road system at Prudhoe Bay. Infield gravel roads and pipelines will connect the drill sites with the central production facilities, camp, and airstrip. Ice roads will be constructed annually during drilling and construction between Prudhoe Bay and Point Thomson and barges will be used in most years to provide equipment and supplies to Point Thomson during the open water periods.
Following startup of production from Point Thomson in 2014, it is expected that field development will include additional liquids production and sale of gas. Field development will require additional wells, field facilities, and pipelines. The timing and nature of additional facilities and expansions will depend upon initial field performance and timing of an Alaska gas pipeline to export gas off the North Slope.
2.8.6 Alpine Satellites Development
Development of five drill sites are planned by CPAI in the immediate future in the Alpine development area. In September of 2004, BLM released the Final EIS for this development. Two of the drill sites, CD-3 (also known as Fiord prospect or CD-North), and CD-4 (also known as the Nanuq prospect or CD-South), are in the Colville River Delta. The CD-3 drill site is located north of CD-1 (Alpine facility) and is a roadless development accessed by a gravel airstrip or ice road in winter. Much of the resupply is accomplished during winter when trucks use the ice road between Kuparuk and Alpine. The CD-4 drill site is connected to the main production pad via a gravel road. The Final EIS cited connection of the remaining three drill sites to CD-2 via road and bridge over the Niglilq Channel to CD-5 (also known as Alpine West prospect). The other two drill sites are planned to be connected to CD-5 via road; however, the permitting for these scenarios has not been completed. Along with CD-5, CD-6 (Lookout prospect) and CD-7 (Spark prospect) are located in the Northeast NPR-A, an area bordered by the Beaufort Sea coast to the north, and Brooks Range to the south. Gravel sources available for extraction are from an existing mine near Nuiqsut (owned by ASRC) and a potential new gravel mine site (Clover) near the Ublutuoch River in NPR-A. Construction of CD-3 and CD-4 drill sites was completed in spring 2006, with production startup in August 2006.
2.8.7 Ataruq (Two Bits)
The Ataruq project is permitted for construction but not completely permitted for operation. This Kerr-McGee Oil and Gas Corporation project is located about 7.2 km (4.5 mi) northwest of KRU Drill Site 2M. The area consists of two onshore prospects and covers about 2,071 hectares (5,120 acres). It includes a 6.4-km (4-mi) gravel road and a single gravel pad with production facilities and up to 20 wells in secondary containment modules. The processed fluids will be transported to DS 2M via a pipe-in-a-pipe buried line within the access road. After drilling, the facility would be normally unmanned.
2.8.8 Shell Offshore Exploration Activities
Shell anticipates conducting an exploration drilling program on MMS Alaska OCS leases located in the Beaufort Sea during the arctic drilling seasons of 2011-2016. These leases were acquired during Beaufort Sea Oil and Gas Lease Sales 195 (March 2005) and 202 (April 2007). Exploration or delineation drilling
AOGA PETITION FOR PROMULGATION OF REGULATIONS 2-22 APRIL 2009 BEAUFORT SEA 2011-2016
would occur only where proposed locations have been approved by the MMS following the federal exploration plan and authorization of permit to drill approval process. Shell currently holds majority or partial ownership in excess of 150 OCS leases in the Beaufort Sea.
Presently, the arctic drilling seasons are generally considered to be from July through October in the Beaufort Sea. Shell would use a floating drilling vessel complimented by ice management and OSR barges and/or vessels to accomplish exploration and/or delineation drilling during each arctic drilling season.
2.8.9 North Shore Development
BRPC is proposing the North Shore Development Project to produce oil from several relatively small, isolated hydrocarbon accumulations on the North Slope. The fields are close to existing Prudhoe Bay infrastructure, and BRPC plans to use a simple design and cost structure to develop these marginal fields. The North Shore prospects are located within a 4,500-m (15,000-ft) horizontal drilling radius of the proposed pad. Two productive horizons, the Ivishak and Sag River sands, will be produced from each prospect. Horizontal drilling technology and long-reach wells will be used to maximize production while minimizing surface impacts. BRPC expects to recover between five and ten million barrels of oil, and future exploration success could increase the reserves.
The North Shore pad will cover approximately 5.3 hectares (13 acres) and will be located approximately 5.6 km (3.5 mi) north-northwest of Prudhoe Bay, 1.6 km (1 mi) west of the Kuparuk River, and 3.2 km (2 mi) inland from the Beaufort Sea coast. BRPC will build a gravel road about 8.4 km (5.2 mi) from just south of the entrance to South Pad to the North Shore pad in order to provide year-round access to the wells and production facilities. Placement of fill in wetlands is required for the pad and access road.
Production will be processed on the pad with a three-phase process facility with separation and re-injection capabilities. Produced water and gas will be re-injected for enhanced oil recovery. Sales oil will be trucked to a lease allocation and custody transfer (LACT) metering skid adjacent to the Kuparuk Pipeline (KPL) for delivery into KPL and eventual transmission through TAPS. BRPC may also drill one or more exploration wells from on or near the proposed North Shore pad. If oil is found at one of these new prospects and the accumulation proves to be large enough to be commercial, additional development wells may be drilled on the pad and/or a satellite drilling pad may be permitted and constructed to connect to the North Shore process facilities.
BRPC hopes to submit permit applications for the North Shore Project permitted by the end of January 2009 so that permits may be received by the third quarter of 2009. Gravel construction would begin in early 2010, and first oil is currently planned for the end of 2010.
2.8.10 Potential Future Gas Pipeline
Two companies are currently proposing to construct a natural gas pipeline that would transport natural gas from the North Slope to North American markets. The two proposed projects are discussed below, although it is expected that only one pipeline would be constructed. Only a small portion (40 km [25 mi] inland) of a pipeline would occur within the specified area of activity covered under this Petition. The entire project footprint is discussed below, without the intent to extend the regulations further south.
AOGA PETITION FOR PROMULGATION OF REGULATIONS 2-23 APRIL 2009 BEAUFORT SEA 2011-2016
2.8.10.1 Denali
Denali – The Alaska Gas Pipeline LLC (Denali) is a company that is jointly owned by BP Alaska Gas Pipelines LLC and the ConocoPhillips Denali Company. The Denali natural gas pipeline project is expected to include a gas treatment plant on the North Slope and approximately 3,220 km (2,000 mi) of large diameter natural gas transmission pipeline beginning on the North Slope and terminating in the vicinity of the British Columbia-Alberta, Canada border.
The Alaska portion of the project would generally follow the Dalton Highway south from the North Slope and then southeast along the Alaska Highway through Tok to a location near Beaver Creek at the Alaska-Yukon Territory border. The Canadian portion of the project would generally follow the Alaska Highway southeast to the British Columbia-Alberta border.
The Denali pipeline would have an initial capacity of about four billion cubic ft per day depending on the final level of customer commitments. Denali currently proposes to use 12 compressor stations on the pipeline segment from Alaska’s North Slope to Alberta.
2.8.10.2 TransCanada
The Alaska Gasline Inducement Act (AGIA) was passed into law by the State of Alaska in May 2007. Its purpose was to expedite the construction of a pipeline to transport Alaskan natural gas resources to market. AGIA offers certain incentives to gas producers and pipeline companies in exchange for specific commitments that will provide significant benefit to the State. After a competitive bid process and a thorough public and legislative review, TransCanada Corporation was selected by the State of Alaska in August 2008 as the exclusive recipient of the AGIA license.
Wholly owned subsidiaries of TransCanada Corporation are in the planning stages of developing the Alaska Pipeline Project, which will move natural gas from Alaska to North American markets. The project is planned to stretch approximately 2,760 km (1,715 mi) from Prudhoe Bay through the Yukon Territory and northeastern British Columbia to the British Columbia/Alberta border near Boundary Lake, and will include new construction and certain existing infrastructure within Alberta. TransCanada would be responsible for designing and constructing the portion located in Alaska, while Foothills Pipe Lines Ltd. would be responsible for the project from the Alaska/Yukon border to market connections in Alberta.
AOGA PETITION FOR PROMULGATION OF REGULATIONS 2-24 APRIL 2009 BEAUFORT SEA 2011-2016
3.0 DATES, DURATION, AND REGION OF ACTIVITES
CFR § 18.27(d)(ii) The dates and duration of such activity and the specific geographical region where it will occur.
The geographic area of activity, illustrated in Figure 1-1, covers a total area of approximately 27.9 million hectares (68.9 million acres). The area of activity includes land on the North Slope of Alaska and adjacent waters of the Beaufort Sea including state waters and OCS waters. The area extends from Point Barrow on the west to the U.S.-Canada border on the east. The onshore boundary is 40 km (25 mi) inland, excluding the area within ANWR. The offshore boundary is the MMS Beaufort Sea Planning Area, approximately 322 km (200 mi) offshore.
Activities to be conducted are expected to occur on a year-round basis. Anticipated types of activities are outlined in Chapter 2. Activities over the next five-year period can be expected to involve continued operations in the existing, producing oilfields, in-field drilling, and maintenance activities to maximize production in the existing oilfields, seismic survey activities to determine the presence of new hydrocarbon deposits (both onshore and offshore), exploratory and appraisal drilling both onshore and offshore to verify hydrocarbon accumulations, development of new oilfields following exploratory activity, and cleanup activities from decommissioning, and closeout of exploration and/or production facilities.
The locations of these activities are assumed, for the purpose of this Petition, to be approximately equally divided among the onshore and offshore tracts presently under lease and to be leased during the period under consideration. Remediation and closeout activities at decommissioned exploratory well sites or production facilities could occur at up to ten sites annually at various locations across the North Slope, where activities have been previously conducted.
Because of the large number of variables influencing exploration activity, it is not possible to predict the exact dates and locations of the operations that will take place over the next five-year regulation petitioned period. The specific dates and durations of the individual operations and their geographic locations will, however, be set forth in detail when requests for LOAs are submitted by industry applicants to USFWS.
The descriptions of existing and future activities presented in this Petition have been compiled from information supplied by AOGA member companies and non-members: CPAI, CGG Veritas, BRPC, and ASRC. These projections are also intended to encompass activities to be undertaken by companies not participating in this Petition (i.e., contractor and sub-contractor companies providing services to the oil and gas lease holders).
AOGA PETITION FOR PROMULGATION OF REGULATIONS 3-1 APRIL 2009 BEAUFORT SEA 2011-2016
4.0 SPECIES, NUMBER, AND TYPE OF TAKE
CFR § 18.27(d)(iii)(A) Based upon the best available scientific information: An estimate of the species and numbers of marine mammals likely to be taken by age, sex, and reproductive conditions, and the type of taking (e.g., disturbance by sound, injury or death resulting from collision, etc.) and the number of times such taking is likely to occur.
Pursuant to Section 101(a)(5) of the MMPA, AOGA petitions the USFWS to renew regulations for taking of polar bear and Pacific walrus incidental to oil and gas exploration, development, and production operations and all associated activities on the Alaskan North Slope (area shown in Figure 1-1) for the period of five years beginning August 3, 2011 and extending through August 3, 2016. Renewal of the regulations would allow the incidental, but not intentional, non-lethal taking of small numbers of polar bears and Pacific walrus in the event that takes occur from oil and gas activities in the aforementioned area.
This chapter is a synthesis of information provided in other chapters to address the criterion in 50 CFR § 18.27(d). Biological information on polar bears and walrus is provided in Chapter 5, including abundance, habitat associations, feeding ecology, breeding behavior, and survival. Chapter 2 describes the oil and gas activities that may result in a potential impact on these species. Chapter 6 discusses these potential impacts in detail. The potential impacts of oil and gas activities on the habitat of each species are described in Chapter 8 and how these potential impacts on the habitat may impact the species is identified in Chapter 9. This chapter (Chapter 4) uses the information provided in the other chapters to identify the types of take likely to occur to polar bear and Pacific walrus.
As discussed in Chapter 1, the MMPA defines “take” to mean “harass, hunt, capture, or kill, or attempt to harass, hunt, capture, or kill any marine mammal.” (16 U.S.C 1362(13)). The types of take can be categorized from greatest to no effect as follows:
• Injury/Mortality –Activities result in the mortality or injury of polar bear or walrus.
• Intentional Harassment –Activities purposefully alter the natural behavior of polar bear or walrus by deterring the animals.
• Incidental Harassment –Activities unintentionally alter the natural behavior of polar bear or walrus.
• No Take –Activities have no observed effect on polar bear or walrus.
AOGA anticipates all takes to be non-lethal and is only petitioning for incidental harassment take authority (Level B harassment). Intentional harassment and lethal takes (Level A harassment) are not covered under this Petition. Since the incidental take regulations went into effect in 1993, there have been no known instances of injury or mortality of a polar bear or a walrus, and the likelihood of such an event occurring during the period of this Petition is remote. Intentional harassment authorizations (IHAs) are applied for individually by each operating company pursuant to Sections 101(a)(4), 109(h), and 112(c) of the MMPA.
In addition, as discussed in Chapter 1, the MMPA does not define take to include “harm.” As such, the MMPA has not been interpreted by USFWS or by any federal court to extend takings to modification of habitat. Because emission of GHGs cannot be characterized as an act of harassment, hunting, capturing or killing a marine mammal, such emissions are not a form of conduct or activity regulated under the
AOGA PETITION FOR PROMULGATION OF REGULATIONS 4-1 APRIL 2009 BEAUFORT SEA 2011-2016
MMPA as a taking. However, GHG emissions and the effects of climate change are further discussed in Chapters 5 and 8 of this Petition.
4.1 POLAR BEAR
The numbers and types of take of polar bears addressed in this Petition encompass only the Southern Beaufort Sea (SB) population of polar bears (see Chapter 5 for more details). As discussed in detail in Chapter 6, the types of oil and gas activities having the potential to impact and result in an incidental take of a polar bear include noise disturbance, temporary or permanent physical obstructions and facility development and operations, human and vessel encounters, and spills. The potential for incidental take caused by these activities is greatest during fall and winter when more bears are found within the area of activity. Offshore and nearshore facilities typically document higher numbers of polar bear sightings than more inland onshore facilities and as such there is a greater potential for activities at these facilities to result in an incidental take. However, there have been minimal impacts on polar bears by the oil and gas industry during the past 40 years as documented in the prior and current ITR decisions issued by USFWS since 1993, the 2008 ESA listing decision for the polar bear by USFWS, and monitoring reports submitted in compliance with the applicable MMPA ITRs, LOAs, and IHAs through the present.
As part of the LOA conditions, the oil and gas industry provides annual reports and sighting reports to the USFWS for all polar bear sightings. These sighting sheets provide data on the age/sex of the polar bear (if possible), number of bears, type of encounter, behavioral reaction (if observed) to any oil and gas activity, and whether the animal was intentionally deterred. These data were compiled for all the North Slope Units to identify trends in sightings of polar bears and are summarized in Table 6-2, and are the best available data regarding the age, sex, type of take, and number of takes experienced to date.
For example, of the total number of polar bear sightings between 2006 and 2008 (total = 281), approximately half (51 percent) resulted in no take (no observed behavioral alteration). Of the remaining half, 10 percent (28) resulted in incidental harassment (behavioral alteration) and 39 percent resulted in intentional harassment (deterrence). The average number of sightings between 2006 and 2008 that resulted in the incidental harassment of polar bears was 8 annually (4 in 2006, 7 in 2007, and 13 in 2008). On an annual basis, the number of incidentally harassed polar bears is a very small percentage of the SB population (less than one percent annually). Overall, there is no evidence that all incidental take and all intentional deterrence activities in combination have had an impact on the survival and recruitment of polar bears (USFWS 2006).
Of the total number of polar bear sightings between 2006 and 2008, approximately 60 percent were single adults, 20 percent were sows with cubs, 16 percent were subadults, and 4 percent were unknown. Based on these data, most polar bears with the potential to be incidentally harassed are single adults, not sows with cubs. Sows with cubs are most likely to be sighted after emerging from dens in the spring; however, a concerted effort is made to avoid dens by identifying and mapping their locations and by compliance with USFWS restrictions on the proximity of oil and gas activity to an active or potential den site (see Chapter 10).
Due to the solitary nature of polar bears, widespread distribution, the small number of polar bears being incidentally harassed, and the measures taken by industry to mitigate the potential for incidental harassment, it is anticipated that physical obstructions, facility development and operations, noise, human encounters, and spills will only result in a small number of incidental takes of polar bears, and the impact will be temporary, short-term, and localized to the immediate area of activity. As such, it is anticipated
AOGA PETITION FOR PROMULGATION OF REGULATIONS 4-2 APRIL 2009 BEAUFORT SEA 2011-2016
that incidental takes will have no more than a negligible impact on individual polar bears and a negligible impact on the SB population.
4.2 PACIFIC WALRUS
As discussed in Chapter 5, the Beaufort Sea is considered extralimital for Pacific walrus. Accordingly only very small numbers of walrus are present within the area of activity, and only during the open water season. There are no important foraging, haulout, or rookery habitats for this population within the area of activity. As such, while oil and gas activities have the potential to incidentally take small numbers of walrus during the open water season in the region of activity, few, if any, takes have been documented in the past or are expected during the five-year period of the proposed ITR. The types of oil and gas activities that have the potential for an incidental take of walrus include noise disturbance, human and vessel encounters, and spills. A detailed description of these activities and their potential impact on walrus and their habitat is presented in Chapter 6 and 8.
The likelihood of incidental takes of walrus occurring from incidental or intentional harassment is extremely low and is anticipated to have no more than a negligible impact on individual or the Alaskan stock of walrus. Since the incidental take regulations went into effect in 1993, there have been no known instances of intentional harassment, injury, or mortality of a walrus and the likelihood of such an event occurring during the period of this Petition is extremely low. As such, the data indicate that no more than a very small number of walrus, if any, will be incidentally taken during the five-year period of the proposed regulations, and that any take will be unintentional, short-term, and localized low impact (Level B) events. Overall takes are anticipated to have no more than a negligible impact on individual animals and a negligible impact on the Alaskan stock of Pacific walrus.
AOGA PETITION FOR PROMULGATION OF REGULATIONS 4-3 APRIL 2009 BEAUFORT SEA 2011-2016
5.0 STATUS, DISTRIBUTION, AND SEASONAL DISTRIBUTION OF SPECIES
CFR § 18.27(d)(iii)(B) A description of the status, distribution, and seasonal distribution (when applicable) of the affected species or stocks likely to be affected by such activities.
5.1 POLAR BEAR
5.1.1 Population Status and Trend
Polar bears are marine mammals subject to the protections of the MMPA under the administration of the USFWS. In May 2008, the USFWS listed the polar bear as threatened under the ESA. The USFWS determined that polar bear habitat, principally sea ice, is declining throughout the species’ range, that this decline is predicted to continue for the foreseeable future, and that the predicted loss of sea ice threatens the species throughout all of its range (USFWS 2008a). Once a species is listed, the ESA requires the USFWS to prepare a recovery plan. The determination and designation of critical habitat for polar bear under Section 4(a)(3) of the ESA is currently pending.
The worldwide abundance of polar bears is estimated to be between 20,000 to 25,000 animals (Aars et al. 2006). These estimates were derived from information presented at the International Union for Conservation of Nature (IUCN) Polar Bear Specialist Group (PBSG) meeting held in Seattle, Washington in June 2005, and updated with results available in October 2006 (Aars et al. 2006). The PBSG identified 19 relatively discrete subpopulations, three of which may be found in the U.S. and surrounding waters in and adjacent to northern Alaska. Although there is believed to be considerable overlap among polar bear subpopulations, the only polar bear subpopulation known to occupy the area of activity addressed in this Petition is the Southern Beaufort Sea (SB) population. This subpopulation is described in further detail below. The Chukchi Sea (CS) subpopulation overlaps with the SB subpopulation in some northwestern areas of Alaska, particularly between Point Hope and Barrow Island, which is outside this Petition’s geographic area. The eastern boundary of the CS population is reported as Icy Cape, Alaska (Aars et al. 2006), which is also outside the geographic area addressed in this Petition. Only limited information is known about the Northern Beaufort Sea (NB) population, which overlaps with the SB population in northwestern Canada. The reported western boundary for this population does not extend beyond the eastern border of Canada (Stirling et al. 2007), which is also outside the geographic area addressed here. Because neither the CS nor NB populations are known to occur in the area specified in this Petition, or to be affected by oil and gas activity in the identified area, they are not addressed further in this Petition. However, in the event of a reassignment of the boundaries of the CS or NB, the impacts associated with industry activities addressed in this Petition are anticipated to be the same on these populations.
5.1.1.1 Southern Beaufort Sea Population
Amstrup et al. (1986) estimated the size of the SB subpopulation to be approximately 1,800 bears. A revised population assessment derived from capture-recapture data collected during 2001 to 2006 estimated 1,526 (95 percent Confidence Interval [CI] = 1,211 to 1,841) polar bears in the SB population (Regehr et al. 2006). A decline in the population cannot be concluded as the two estimates cannot be statistically differentiated. Although not statistically concluded, the status of the subpopulation is designated by USFWS as reduced and the predicted trend is declining (Aars et al. 2006). A recent analysis of the body condition of adult polar bears and cub survival suggests that the SB polar bears may be experiencing a decline in nutritional status that may be related to changing sea ice conditions (Rode et
AOGA PETITION FOR PROMULGATION OF REGULATIONS 5-1 APRIL 2009 BEAUFORT SEA 2011-2016
al. 2007). More studies are required to address the status and trend of the population before firm conclusions can be made. As with other polar bear populations, the SB population was listed by USFWS as threatened under the ESA on the basis of projections of habitat (sea ice) loss, not on currently documented declines in abundance or distribution.
5.1.2 Distribution and Seasonal Distribution
Polar bears are unevenly distributed throughout the circumpolar Arctic and are most often located on the annual ice over the waters of the continental shelf where their main prey, ringed seals (Phoca hispida), are most abundant (Amstrup et al. 1986; Stirling and Derocher 2007). Polar bear distribution in most areas varies annually and seasonally with the extent of sea ice cover and availability of prey (Figure 5-1).
The SB polar bear population is shared between Canada and Alaska. The population occurs between Icy Cape, Alaska on the western boundary and Pearce Point, Northwest Territory, Canada (Amstrup et al. 1986; Amstrup and DeMaster 1988; Stirling et al. 1988). Analyses of radio-telemetry data using new spatial modeling techniques suggest the need to realign the boundaries of the SB area (Amstrup et al. 2004, 2005).
Figure 5-1. Distribution of Polar Bear Populations (Angliss and Outlaw 2008)
The distribution of some polar bear populations during the open water and early fall seasons have changed in recent years. In the Beaufort Sea, polar bears are being found onshore in numbers greater than recorded in recent years (Schliebe et al. 2006). This is partly related to the increasing numbers of bowhead whale (Balaena mysticetus) carcasses left by the Eskimo hunters at Cross Island and Kaktovik, which provide a readily available food source for the bears in these areas (Schliebe et al. 2006), and may also result from the increased observations and reporting required by USFWS in MMPA ITRs. Durner et al. (2007) suggest that the future distribution of polar bears may be linked to the loss of their preferred habitat, sea ice. Recent analyses, using data from satellite tracking of female polar bears and new spatial
AOGA PETITION FOR PROMULGATION OF REGULATIONS 5-2 APRIL 2009 BEAUFORT SEA 2011-2016
modeling techniques, indicate the boundary between NB and the SB populations needs to be adjusted, probably expanding the area occupied by bears from NB and retracting that of SB (Aars et al. 2006).
Polar bears migrate south with the sea ice, and advance north with the retreat of sea ice each fall/winter and spring/summer, respectively. During winter, polar bears den and feed on the sea ice and along the northern coastline (Amstrup and Gardner 1994); then they retreat with the ice during summer. Sea ice disappears from the Bering Sea and is greatly reduced in the Chukchi Sea in the summer, and polar bears occupying these areas move as much as several thousand km to stay with the pack ice (Garner et al.1990). Sea ice provides a platform from which to hunt seals; to seek mates and breed; as a platform for maternity denning and as a platform on which to move to terrestrial maternal denning areas; and as a substrate on which to make long distance movements (Stirling and Derocher 1993).
Data from telemetry studies on female polar bears indicate that their movements are not random, nor do they passively follow ocean currents on the ice as previously thought (Mauritzen et al. 2003). Results show strong fidelity to broad activity areas used over multiple years (Ferguson et al. 1997). Activity areas have not been determined for many of the populations, and what information is available reflects movement data collected prior to the recent changes of ice conditions.
Radio collar studies indicate that male and female polar bears have similar activity areas on a monthly basis, but males travel farther each month (Amstrup et al. 2000). Telemetry data from radio-collared females indicate some individuals occupy home ranges (or “multi-annual activity areas”) which they seldom leave (Amstrup 2003). The size of a polar bear’s home range is determined, in part, by the annual pattern of freeze-up and break-up of sea ice, and therefore by the distance a bear must travel to obtain access to prey (Stirling 1988; Durner et al. 2004). A bear that has consistent access to ice, leads (channels of open water through areas of ice), and seals may have a relatively small home range; while bears in areas such as the Barents, Greenland, Chukchi, Bering or Baffin seas may move many hundreds of km each year to remain in contact with sea ice from which they can hunt (Born et al. 1997; Mauritzen et al. 2001; Ferguson et al. 2001; Amstrup 2003; Wiig et al. 2003). Individual home ranges are large, averaging 149,000 square km in the Beaufort Sea (Garner et al. 1990; Amstrup et al. 2000).
5.1.3 Feeding Ecology
Polar bears are carnivorous and are the top predator of the arctic marine ecosystem. Polar bears prey heavily on ice seals, predominantly ringed seals and, to a lesser extent, bearded seals (Erignathus barbatus). The relationship between ringed seals and polar bears is so close in some areas that ringed seal abundance may regulate polar bear densities, while polar bear predation in turn, regulates ringed seal density and reproductive success (Hammill and Smith 1991; Stirling and Øritsland 1995).
Over half the caloric content of a seal is located in the layer of fat between the skin and underlying muscle (Stirling and McEwan 1975). Polar bears show their preference for fat by quickly removing the fat layer from beneath the skin after catching a seal. On average, an adult polar bear needs approximately 2 kg (4.4 lb) of seal fat per day to survive (Best 1985). Polar bears hunt along pressure ridges in the fast ice and often break into seal birth lairs to take newborn pups (Stirling and Archibald 1977; Furgal et al. 1996).
Polar bears are opportunistic feeders and feed on a variety of other foods and carcasses including beluga whales (Delphinapterus leucas), arctic cod (Arctogadus glacialis), Canada geese (Branta canadensis) and their eggs, walrus, and bowhead whales (Smith 1985; Jefferson et al. 1993; Smith and Hill 1996; Derocher et al. 2000). Lunn and Stenhouse (1985) report possible cannibalism among polar bears.
AOGA PETITION FOR PROMULGATION OF REGULATIONS 5-3 APRIL 2009 BEAUFORT SEA 2011-2016
Derocher et al. (2004) hypothesized that prey availability to polar bears may be altered due to reduced prey abundance, changes in prey distribution, and changes in sea ice availability as a platform for hunting seals. Some polar bears in northern Alaska have begun to arrive near sites where subsistence hunters consistently leave the carcasses of harvested bowhead whales (Kaktovik and Cross Island). The discarded bowhead carcasses may provide a substantial proportion of the annual energy requirements for these bears (Schliebe et al. 2006).
5.1.4 Reproduction
Females give birth to one or two, and occasionally three cubs, an average of every 3.6 years (Jefferson et al. 1993; Lentfer and Hensel 1980). Cubs remain with their mothers for 1.4 to 3.4 years (Derocher et al. 1993; Ramsay and Stirling 1988). Mating occurs from April to June followed by a delayed implantation during September to December. Females give birth usually the following December or January (Harington 1968; Jefferson et al. 1993). In general, females six years of age or older successfully wean more young than younger bears; however, females as young as four years old can produce offspring (Ramsay and Stirling 1988).
In the Beaufort Sea, ringed seal densities are lower than in some areas of the Canadian High Arctic and Hudson Bay. As a possible consequence, female polar bears in the Beaufort Sea usually do not breed for the first time until they are five years of age (Stirling et al. 1976; Lentfer and Hensel 1980). Females that are over 20 years old have a very high rate of cub loss or do not successfully reproduce. The maximum reproductive age reported for Alaskan polar bears is 18 years (Amstrup and DeMaster 1988).
Regher et al. (2007) determined that the survival and breeding success of polar bears in the SB were high from 2001 to 2003 and markedly lower for 2004 and 2005. Although there is uncertainty regarding these data, one possible explanation is that these declines were associated with increases in the duration of ice-free period over the continental shelf.
5.1.5 Denning
Pregnant female polar bears excavate dens in snow on land and on pack and shorefast sea ice in the fall-early winter period and enter the dens from October to early November (Amstrup and Gardner 1994). Successful denning by polar bears requires an accumulation of sufficient snow combined with winds to cause snow accumulation leeward of topographic features that create denning habitat (Harington 1968). The common characteristic of all denning habitat are topographic features that catch snow in the autumn and early winter (Durner et al. 2003). In the central Beaufort Sea, Amstrup and Gardner (1994) found that polar bear dens were concentrated near or north of the Beaufort Sea coastline in eastern Alaska and the Yukon Territory (Figure 5-2). Of 22 terrestrial dens examined on the coastal plain of northern Alaska, dens were located on or associated with pronounced landscapes (primarily coastal and river banks, but also a lake shore and an abandoned oil field gravel pad) that were readily distinguishable from the surrounding terrain in summer and physically suited to catch snow in the early winter (Durner et al. 2003).
AOGA PETITION FOR PROMULGATION OF REGULATIONS 5-4 APRIL 2009 BEAUFORT SEA 2011-2016
Figure 5-2. Polar Bear Maternal Den Distribution in Northern Alaska (US Geological Survey
[USGS] Alaska Biological Science Center Polar Bear Research Database, 5 May 2003)
More than 80 percent of maternal dens found on land by radio telemetry in the Alaskan Beaufort Sea were within 10 km (6.2 mi) of the coast and over 60 percent were right on the coast or on coastal barrier islands (S.C. Amstrup, unpublished data cited in Feldhamer et al. 2003).
Fidelity to denning locales was investigated by Amstrup and Gardner (1994), in which 27 females were located at up to four successive maternity dens. Bears that denned once on pack ice were more likely to den on pack ice than on land in subsequent years. Similarly, bears were faithful to general geographic areas – those that denned once in the eastern half of the Alaska coast were more likely to den there than to move to the west in subsequent years. Annual variations in weather, ice conditions, prey availability, and the long-distance movements of polar bears (Amstrup et al. 1986; Amstrup et al. 2000; Garner et al. 1990) make recurrence of exact denning locations unlikely and no fidelity to specific den sites has been reported.
Polar bears give birth in the dens during mid-winter (Kostyan 1954; Harington 1968; Ramsay and Dunbrack 1986). Survival and growth of the cubs depends on the warmth and stability of the environment within the maternal den (Blix and Lentfer 1979). Family groups emerge from dens sometime between late February and early April when cubs are about three months old and able to survive outside the den (Blix and Lentfer 1979, 1992; Smith et al. 2007).
Predicted declines and large seasonal swings in habitat availability and distribution may impose greater impacts on pregnant females seeking denning habitat or leaving dens with cubs than on any other age
AOGA PETITION FOR PROMULGATION OF REGULATIONS 5-5 APRIL 2009 BEAUFORT SEA 2011-2016
group (Durner et al. 2007). Fischbach et al. (2007) evaluated the changes in distribution of polar bear maternal dens in the Beaufort Sea between 1985 and 2005, using satellite telemetry. The proportion of dens on pack ice declined from 62 percent between 1985 and 1994, to 37 percent between 1998 and 2004, and among pack ice dens fewer occurred in the western Beaufort Sea after 1998. The study hypothesized that the proportion of polar bears denning in coastal areas may increase until autumn ice retreats far enough from the shore that it precludes offshore pregnant females from reaching the Alaska coast in advance of denning.
5.1.6 Survival
Polar bears are long-lived mammals not known to be susceptible to disease, parasites, or injury (Schliebe et al. 2006). The oldest known female polar bear in the wild was 32 years of age and the oldest known male was 28, although few bears in the wild live beyond 20 years (Stirling 1990). Survival rates increase up to a certain age, with cubs-of-the-year having the lowest rates and prime age adults (between 5 and 20 years of age) having survival rates that can exceed 90 percent (Schliebe et al. 2006; USFWS 2008c). Amstrup and Durner (1995) report that high survival rates (exceeding 90 percent for adult females) are essential to sustain populations. Survival of cubs is dependent upon their weight when they exit dens (Derocher and Stirling 1992), and most cub mortality occurs early in the period after emergence from the den (Amstrup and Durner 1995; Derocher and Stirling 1996), with early age mortality generally associated with starvation (Derocher and Stirling 1996). Survival of cubs to weaning stage (generally 27 to 28 months) is generally estimated to range from 15 to 56 percent of births (Schliebe et al. 2006). Although infanticide by male polar bears has been well documented (Hansson and Thomassen 1983; Larsen 1985; Taylor et al. 1985; Derocher and Wiig 1999), it is thought that this activity does not account for large percentage of the cub mortality.
Population age structure data indicate subadults (2 to 5 years old) survive at lower rates than adults (Amstrup 1995), probably because their hunting and survival skills are not fully developed (Stirling and Latour 1978). Eberhardt (1985) hypothesized adult survival rates must be in the upper 90 percent range to sustain polar bear populations. Studies using telemetry monitoring of individual animals (Amstrup and Durner 1995) estimated adult female survival in prime age groups may exceed 96 percent, and survival estimates are a reflection of the characteristics and qualities of an ecosystem to maintain the health of individual bears (Schliebe et al. 2006). Polar bears that avoid serious injury may become too old and feeble to hunt efficiently and most are generally believed to die of old age.
Injuries sustained in fights over mates or in predation attempts can lead to mortalities of polar bears (Amstrup et al. 2006). In an extensive review of ursid parasites, Rogers and Rogers (1976) found that seven endoparasites had been reported in polar bears. Only Trichinella spp., however, had been observed in wild polar bears. Certain species of nematodes and cestodes reported in captive polar bears have not occurred in the wild. Trichinella can be quite common in polar bears and has been observed throughout their range. Concentrations of this parasite in some tissues can be high, but infections are not normally fatal (Rausch 1970; Dick and Belosevic 1978; Larsen and Kjos-Hanssen 1983; Taylor et al. 1985).
5.1.7 Sea Ice and Climate Change
As described in Section 5.1, polar bears are an ice-obligate species that rely on sea ice as a habitat to hunt, feed, seek mates and breed, den, and rest. Recent years have seen record low September Arctic sea ice extent, and the shallow continental shelf waters of the Chukchi Sea experienced a rapid and complete retreat of sea ice during the summer of 2007 (National Snow and Ice Data Center 2007). The 4th
AOGA PETITION FOR PROMULGATION OF REGULATIONS 5-6 APRIL 2009 BEAUFORT SEA 2011-2016
Assessment Report of the Intergovernmental Panel on Climate Change (IPCC) (IPCC 2007; http://www.ipcc.ch/ipccreports/ar4-syr.htm) observed that decreases in snow and ice extent are consistent with climate warming, and that satellite data since 1978 show that annual average Arctic ice extent has shrunk by 2.7 percent (90 percent CI = 2.1 to 3.3 percent) per decade, with larger decreases in summer of 7.4 percent (90 percent CI = 5.0 to 9.8 percent) per decade.
Recent studies have indicated that changes in the sea ice are likely to affect the distribution and abundance of polar bears throughout their range as well as impact many aspects of their life history. Declines in sea ice extent and degrading ice in the SB have been associated with an increasing shift toward land-based denning (Fischbach et al. 2007); declines in cub survival (Regehr et al. 2006); and observations of drowned, emaciated, and cannibalized polar bears (Amstrup et al. 2006). Regehr et al. (2007) concluded that in 2002, the ice-free period over the continental shelf in the SB region was relatively short (mean 92 days) and survival of adult female polar bears was high (approximately 0.99, 90 percent CI = 0.10 to 1.0). In 2004 and 2005, the ice-free period was longer (mean 135 days) and survival of adult female polar bears was lower (approximately 0.77, 90 percent CI = 0.53 to 0.94). Breeding and cub-of-the-year litter survival also declined from high rates to lower rates in latter years of the study. Regehr et al. (2007) further concluded that although the precision of estimated vital rates was low, subsequent analysis (Hunter et al. 2007) indicated the declines in vital rates associated with longer ice-free periods have ramifications for the probability of persistence of the SB population of polar bears.
Many of these studies also suggest other factors could have caused or contributed to the reported changes in polar bear life history features, including changes in prey distribution and abundance, disease, readily available food sources, and hunting patterns. The carrying capacity of the Beaufort Sea is not known, which could have a major influence on any changes in polar bear life history. Accordingly, while sea ice changes are well documented, our understanding of the response of polar bears and their prey to changing sea ice conditions remains uncertain.
Amstrup et al. (2007) grouped the 19 polar bear subpopulations into four ecological regions in order to forecast the range-wide status of polar bears in the 21st century based on their ecological relationship to sea ice. These included the Polar Basin Divergent Ecoregion that encompasses the SB subpopulation. Amstrup et al. (2007) incorporated projections of future sea ice in each ecoregion into two models of polar bear habitat and potential response. Under both modeling approaches, polar bear populations were forecast to decline throughout all of their range during the 21st century. The populations of bears in the Polar Basin Divergent Ecoregion were predicted to be extinct by mid-century.
5.2 PACIFIC WALRUS
5.2.1 Population Status and Trend
The Pacific walrus is not listed as threatened or endangered under the ESA or classified as depleted or a strategic stock under the MMPA (Angliss and Outlaw 2008). However, the USFWS was petitioned to list the walrus under the ESA in February 2008. USFWS is currently responding to this Petition.
Pacific walrus are found throughout Arctic waters, typically associated with the offshore pack ice (USFWS 2007). The walrus stock is found throughout the northern Bering and Chukchi Seas. Limited numbers of walrus inhabit the Beaufort Sea during the open water season and are considered extralimital east of Point Barrow (Fay 1982). The current size of the walrus population is unknown. Estimates of the pre-exploitation population of the walrus range from 200,000 to 250,000 animals (Angliss and Outlaw
AOGA PETITION FOR PROMULGATION OF REGULATIONS 5-7 APRIL 2009 BEAUFORT SEA 2011-2016
2008). Over the past 150 years, the population has been depleted by over-harvesting and then periodically allowed to recover (Fay et al. 1989).
Between 1975 and 1990, aerial surveys were carried out by the U.S. and Russia at five-year intervals, producing population estimates ranging from 201,039 to 234,020 animals. These are considered conservative population estimates and are not useful for detecting trends (Hills and Gilbert 1994; Gilbert et al. 1992). Efforts to survey the walrus population were suspended after 1990 due to unresolved problems with survey methods that produced population estimates with unacceptably large confidence intervals (Gilbert et al. 1992; Gilbert 1999).
A range-wide survey of the walrus population was undertaken in March and April of 2006 by the USFWS in conjunction with the USGS and Russian scientists. The results of the survey have not been released (Chadwick and Fischbach 2008).
5.2.2 Distribution and Seasonal Distribution
The walrus inhabits the moving pack ice over the shallow waters of the continental shelf of the Bering and Chukchi Seas. Walrus summering in the Chukchi Sea are very widespread, and they occur across the pack ice from Wrangel Island to the coast of Alaska (Estes and Gilbert 1978). Walrus are rare in the Alaskan Beaufort Sea east of Point Barrow. Walrus migrate north and south following the annual advance and retreat of the pack ice. The distribution of walrus is shown on Figure 5-3.
Figure 5-3. Approximate Distribution of Pacific Walrus in U.S. and Russian Waters (Angliss and
Outlaw 2008). The Combined Summer and Winter Distributions are Depicted.
Adult male walrus remain in the Bering Sea year round, while females, pups, and juveniles summer in the Chukchi Sea. Pacific walrus use 26 major haulout sites in Russia and five on the west coast of the Bering Sea off Alaska (Gilbert 1999). Of the five haulout sites used in Alaska, males mainly occupy Round
AOGA PETITION FOR PROMULGATION OF REGULATIONS 5-8 APRIL 2009 BEAUFORT SEA 2011-2016
Island and Cape Pierce during the summer (Hills 1992; Jefferson et al. 1993), the Punuk Islands are only used in late autumn (Fay and Kelly 1980), Cape Seniavin in the spring and autumn (Frost et al. 1982), and St. Matthew Island is seldom used. An unusually light ice year in 2007 resulted in walrus that summered in the Chukchi Sea hauling out between Point Lay and Point Barrow. Walrus retreated to the shoreline after the pack ice retreated north of the shallow OCS waters (Ireland et al. 2008). There are currently no known haulout sites from Point Barrow to Demarcation Point on the Beaufort Sea coast.
The migration pattern is not completely known. During winter, large concentrations of walrus occur south of the Bering Strait and southwest of St. Lawrence Island near the ice edge. Smaller concentrations occur east of the Pribilof Islands and southwest of Cape Navarin along the Koryak coast. Fay (1982) suggested those adult females, their young, and a few adult males winter in the center of the pack ice while juveniles and sub-adults occupy the periphery. These animals follow the retreating ice in spring and summer, and as a result, congregate between Barrow and Wrangel Island in the Chukchi Sea.
Walrus sightings in the Beaufort Sea have consisted solely of widely scattered individuals and small groups. While walrus have certainly been encountered and are present in the Beaufort Sea, there were only five sightings of walrus between 146º and 150º West longitude during MMS and LGL Research Associates (LGL) aerial surveys conducted from 1979 to 1995 (LGL and Greeneridge 1996). Aerial and vessel surveys conducted by LGL between Harrison Bay and Kaktovik in 2006 and 2007 reported no walrus in 2006 and fewer than 15 in 2007 (Ireland et al. 2008). These results confirm walrus are very uncommon in the Beaufort Sea.
5.2.3 Feeding Ecology
Walrus can have a large effect on their prey and play an important role in the Arctic ecosystem by influencing the structure of benthic invertebrate communities. They mainly feed on bivalve mollusks obtained from bottom sediments along the shallow continental shelf, typically at depths of 80 m (262 ft) or less (Fay 1982). They can eat more than 50 clams during a single seven-minute dive to the seafloor and consume 35 to 50 kg (77 to 110 lb) of food per day. Pregnant and nursing walrus consume even more food (Fay 1985; Born et al. 2003).
Walrus also feed on a variety of benthic invertebrates, including worms, snails, shrimp, and some slow-moving fish (Jefferson et al. 1993). Walrus have been reported to feed on seals and small whales (Jefferson et al. 1993), and even on seabirds (Gjertz 1990). They mainly feed between June and November when the young are growing and adult females are accumulating fat stores for the breeding season (Fay 1982).
Hauling out on moving ice provides significant advantages for foraging walrus, including proximity to varying food supplies, and relative freedom from disturbance when resting (Fay 1974). Since the walrus feed on benthic invertebrates, which are distributed in patches, this continually moving ice facilitates their feeding over a larger area without much effort.
As walrus root along the seafloor in search of food, they plow through large quantities of sediment (Nelson and Johnson 1987; Nelson et al. 1994). They remove large quantities of prey from the seafloor, affect the size structure of clam populations, mix bottom sediments while foraging, create new microhabitats from discarded shells, and generate food for seafloor scavengers from uneaten scraps of prey (Oliver et al. 1983).
AOGA PETITION FOR PROMULGATION OF REGULATIONS 5-9 APRIL 2009 BEAUFORT SEA 2011-2016
5.2.4 Reproduction
Male walrus reach sexual maturity between eight and ten years, but usually do not breed until age 15 (Fay 1985). Females reach sexual maturity around six to eight years of age (Fay 1985).
Mating usually occurs between January and March. Implantation is delayed until June or July (Fay 1982). Gestation lasts 11 months (a total of 15 months after mating) and birth occurs between April and June during the annual northward migration. Calves weigh about 63 kg (139 lb) at birth and are usually weaned by age two (Fay 1982). Females give birth to one calf every two or more years (Fay 1982).
5.2.5 Survival
Although the reproductive rate described in the previous section is much lower than other pinnipeds, some walrus may live to age 35 to 40 and remain reproductively active until age 26 (Fay 1982; Born 2001).
Walrus are preyed upon by polar bears, killer whales, and subsistence hunters. The magnitude of natural mortality is unknown but is assumed to be low, given the population's low productivity. Eskimo hunters from St. Lawrence Island have described walrus becoming emaciated after becoming entrapped in heavy ice. It is probable that in some instances those walrus starve to death but no documentation of such events exists. Rock slides are a hazard to walrus on terrestrial haulouts and occasionally result in mortality (USFWS 2008d).
Serious injury and death can result from intra-specific interactions, mainly involving strikes with tusks and trampling. Skin lacerations and subcutaneous hemorrhages resulting from tusk strikes are common in both sexes and all age classes. The most serious wounds are observed on males during the breeding season when they wound each other during vigorous fights in the water. Trampling can result in abortion, injury, and death during stampedes at crowded haulouts and has been observed at Wrangel Island in the Chukchi Sea and the Punuk Islands in the Bering Sea (USFWS 2008d).
5.2.6 Climate Change
There is no current scientific or regulatory consensus regarding the future effects of climate change on Pacific walrus; however, this may change when USFWS completes the status review and regulatory determination regarding the pending petition to list Pacific walrus as threatened or endangered under the ESA. The petition to list is based on projected changes in sea ice habitats associated with climate change. The results of USFWS’ assessment should be incorporated into the record for the proposed ITR, as well as the related NEPA and ESA processes.
As discussed earlier in this section, sea ice plays an important role in the life history of the Pacific Walrus. As detailed in Section 5.1.7, sea ice is more frequently disappearing from the continental shelf of the Chukchi Sea. Chadwick and Fishbach (2008) hypothesize that when the sea ice recedes over the deep ocean basin, walrus must either continue to haul out on the sea ice with little access to food, or abandon the sea ice and move to coastal areas where they can rest on land. During the record minimum sea ice extent in summer 2007 (National Snow and Ice Data Center 2007), the Chukchi Sea shelf contained little to no ice for approximately 80 days and several thousand walrus hauled out on the shores of northwestern Alaska, which had not been previously documented (Chadwick and Fischbach 2008).
During fall 2007, tens of thousands of female and young walrus began using resting areas along the northern coast of Chukotka, after sea ice was no longer available. A few thousand mortalities were
AOGA PETITION FOR PROMULGATION OF REGULATIONS 5-10 APRIL 2009 BEAUFORT SEA 2011-2016
reported at this location, apparently from trampling due to disturbances that caused adults to stampede into the water (Chadwick and Fischbach 2008).
As more walrus haul out on land instead of sea ice, nearshore prey populations may be subjected to greater predation pressure. Today, it is unknown whether more concentrated foraging by walrus will change or deplete nearshore prey communities, or if walrus energetics will be affected if prey do become less abundant. A better understanding of walrus movement and foraging patterns is necessary to determine the effects of decreasing availability of sea ice on walrus and the prey upon which they depend.
The specified geographic area to which the proposed ITR applies (the Beaufort Sea) is outside of the primary habitat of the Pacific walrus. Only widely scattered individuals and small groups are present and then only during open water periods. Accordingly, there is no present evidence or prediction that the consequences of climate change, particularly sea ice recession, would pose a direct threat to the abundance, distribution or significant behaviors of Pacific walrus that infrequently inhabit the Southern Beaufort Sea region.
AOGA PETITION FOR PROMULGATION OF REGULATIONS 5-11 APRIL 2009 BEAUFORT SEA 2011-2016
6.0 ANTICIPATED IMPACT ON SPECIES
CFR § 18.27(d)(iii)(C) The anticipated impact of the activity upon the species or stocks.
6.1 POLAR BEAR
6.1.1 Noise
The following sections provide an overview of noise terminology, a general background of noise effects on wildlife, a brief description of noise sources associated with oil and gas activities, and potential impacts of noise on polar bears.
6.1.1.1 Noise Background
Sound is a physical phenomenon consisting of minute vibrations that travel through a medium, such as air or water. The disturbed particles of the media move against undisturbed particles causing an increase in pressure. This increase in pressure causes adjacent undisturbed particles to move away, spreading the disturbance away from its origin. This combination of pressure and particle motion makes up the acoustic wave.
The intensity of sound is characterized by decibels (dB). The mathematical definition of a decibel is the base 10 logarithmic function of the ratio of the pressure fluctuation to a reference pressure. Decibels are measured using a logarithmic scale, so sound levels cannot be added or subtracted directly. For example, if a sound’s intensity is doubled, the sound level increases by 3 dB, regardless of the initial sound level. Thus: 60 dB + 60 dB = 63 dB, and 80 dB + 80 dB = 83 dB. The decibel measures the difference in orders of magnitude (x 10), so 10 dB means ten times the power, 20 dB means 100 times the power, 30 dB means 1,000 times the power, and so on.
Because the decibel is a relative measure, any absolute value expressed in dB is meaningless without the appropriate reference. The metric that describes the change in pressure (amplitude) is the pascal (Pa), approximately equivalent to 0.0001465 psi. In this Petition, all underwater sound levels are expressed in decibels referenced to 1 micro Pascal (dB re 1 µPa) and all airborne sound levels are expressed in dB re 20 µPa. It is possible to convert between the reference pressures, in this instance 26 dB. However, the efficiencies of sound generation and reception in air and water differ greatly, so simply adding a constant to the underwater sound pressure level (SPL) will not allow a reasonable assessment of how the sound is perceived by the receiver.
The method commonly used to quantify airborne sounds consists of evaluating all frequencies of a sound according to a weighting system that reflects that human hearing is less sensitive at low frequencies and extremely high frequencies than at the mid-range frequencies. This is called “A” weighting, and the decibel level measured is called the A weighted sound level (dBA). Sound levels to assess potential noise impacts on wildlife, airborne or underwater, are not weighted and measure the entire frequency range of interest.
Hertz (Hz) is a measure of how many times each second the crest of a sound pressure wave passes a fixed point. For example, when a drummer beats a drum, the skin of the drum vibrates a number of times per second. When the drum skin vibrates 100 times per second, it generates a sound pressure wave that is oscillating at 100 Hz, and this pressure oscillation is perceived by the ear/brain as a tonal pitch of 100 Hz. Sound frequencies between 20 and 20,000 Hz (or 20 kHz) are within the range of sensitivity of the best
AOGA PETITION FOR PROMULGATION OF REGULATIONS 6-1 APRIL 2009 BEAUFORT SEA 2011-2016
human ear. The hearing sensitivities of the animals of interest in this Petition will be discussed for each species in the text below.
As sound propagates out from the source, there are many factors that change the amplitude. These include the spreading of sound over a wide area (spreading loss), loss to friction between particles that vibrate (absorption), and scattering and reflections from objects in the path (including surface or seafloor). The total propagation including these factors is called the transmission loss (TL). Transmission loss parameters vary with frequency, temperature, wind, sea conditions, source and receiver depth, water chemistry, and bottom composition and topography.
Table 6-1 summarizes commonly used terms to describe underwater sounds. Two common descriptors are the instantaneous peak SPL and the root-mean-square (rms) over a defined averaging period. The peak pressure is the instantaneous maximum or minimum overpressure observed during each sound event. The rms level is the square root of the energy divided by a defined time period.
Table 6-1 Definition of Acoustical Terms
Term Definition Decibel, dB A unit describing the amplitude of sound, equal to 20 times the logarithm to the base 10
of the ratio of the pressure of the sound measured to the reference pressure. The reference pressure for water is 1 micro Pascal (µPa) and for air is 20 µPa (approximate threshold of human audibility).
Sound Pressure Level, SPL Sound pressure is the force per unit area, usually expressed in µPa (or 20 micro Newtons per square meter), where 1 Pascal is the pressure resulting from a force of 1 Newton exerted over an area of 1 m2. The sound pressure level is expressed in decibels as 20 times the logarithm to the base 10 of the ratio between the pressure exerted by the sound to a reference sound pressure. Sound pressure level is the quantity that is directly measured by a sound level meter.
Frequency, Hz or kHz
Frequency is expressed in terms of oscillations, or cycles, per second. Cycles per second are commonly referred to as Hertz (Hz). Typical human hearing ranges from 20 Hz to 20,000 Hz (or 20 kHz).
Peak Sound Pressure (unweighted), dB re 1 µPa
Peak sound pressure level is based on the largest absolute value of the instantaneous sound pressure over the frequency range from 20 Hz to 20,000 Hz. This pressure is expressed in this Petition as dB re 1 µPa.
Root-Mean-Square (rms), dB re 1 µPa
The rms level is the square root of the energy divided by a defined time period. For pulses, the rms has been defined as the average of the squared pressures over the time that comprise that portion of waveform containing 90 percent of the sound energy for one impulse.
A-Weighting Sound Level, dBA
The sound pressure level in decibels as measured on a sound level meter using the A- or C-weighting filter network. The A-weighting filter de-emphasizes the low and high frequency components of the sound in a manner similar to the frequency response of the human ear and correlates well with subjective human reactions to noise.
Ambient Noise Level The background sound level, which is a composite of noise from all sources near and far. The normal or existing level of environmental noise at a given location.
6.1.1.2 Potential Effects of Noise on Wildlife
General effects of noise on wildlife may range from direct effects, such as physical injury to the auditory system, to indirect effects, such as change in habitat use. Noise may directly affect reproductive physiology or energetic consumption as individuals incur energetic costs or lose mating or foraging opportunities by repeatedly reacting to or avoiding noise. Animals may also be forced to retreat from
AOGA PETITION FOR PROMULGATION OF REGULATIONS 6-2 APRIL 2009 BEAUFORT SEA 2011-2016
favorable habitat in order to avoid aversive anthropogenic noise levels. Though the direct effects of noise on wildlife may be the most obvious, noise may also have indirect effects on population dynamics through changes in habitat use, courtship and mating, reproduction and parental care, and possibly migration patterns. Excessive noise may also affect mortality rates of adults by causing hearing loss, a serious hazard in predator-prey interactions. Other effects of noise on wildlife may be more subtle, such as those affecting heart rate or communication. In species that rely on acoustic communication, anthropogenic noise may adversely affect individual behavior by making signal detection difficult and thus altering the dynamic interaction between the producers and perceivers of communicative signals.
In assessing potential effects of noise, Richardson et al. (1995) has suggested four criteria for defining zones of influence. These zones are shown below from greatest influence to least:
Zone of hearing loss, discomfort, or injury – the area within which the received sound level is potentially high enough to cause discomfort or tissue damage to auditory or other systems. This includes temporary threshold shifts (TTS, temporary loss in hearing) or permanent threshold shifts (PTS, loss in hearing at specific frequencies or deafness). Non-auditory physiological effects or injuries that theoretically might occur in marine mammals exposed to strong underwater sound include stress, neurological effects, bubble formation, resonance effects, and other types of organ or tissue damage.
Zone of masking – the area within which the noise may interfere with detection of other sounds, including communication calls, prey sounds, or other environmental sounds.
Zone of responsiveness – the area within which the animal reacts behaviorally or physiologically. The behavioral responses of marine mammals to sound is dependent upon a number of factors, including: 1) acoustic characteristics of the noise source of interest; 2) physical and behavioral state of animals at time of exposure; 3) ambient acoustic and ecological characteristics of the environment; and 4) context of the sound (e.g., does it sound like a predator) (Richardson et al. 1995; Southall et al. 2007). However, temporary behavioral effects are often simply evidence that an animal has heard a sound and may not indicate lasting consequence for exposed individuals (Southall et al. 2007).
Zone of audibility – the area within which the marine mammal might hear the noise. Marine mammals as a group have functional hearing ranges of 10 Hz to 180 kHz, with best thresholds near 40 dB (Ketten 1998; Southall et al. 2007). Hearing capabilities of the species included in this Petition are discussed further below.
In addition, habituation of animals to their environment also is a significant factor in assessing potential impacts of noise. The definition of habituation is “the elimination of the organism’s response to often recurring, biologically irrelevant stimuli without impairment of its reaction to others.” Habituation is ubiquitous in the animal kingdom (Peeke and Petrinovich 1984). No study takes place without subjects habituating to their environments. More predictable sources of disturbance can lead to greater habituation in situations than less predictable ones. Situations in which similar noise-producing activities occurring in the same habitat at frequent intervals may therefore affect locally breeding wildlife less than less-frequent or less-predictable activities (National Research Council [NRC] 2003).
6.1.1.3 Hearing Abilities of Polar Bear
There is limited information on the hearing of polar bears. The noise levels required to cause TTS or PTS have not been determined for polar bears; however, they are likely beyond the sounds produced by oil and
AOGA PETITION FOR PROMULGATION OF REGULATIONS 6-3 APRIL 2009 BEAUFORT SEA 2011-2016
gas activity, except close to the source of underwater seismic airguns. Polar bears are not known to communicate underwater and studies have not been conducted to determine the effects, if any, on polar bear from underwater noise.
Nachtigall et al. (2007) measured the in-air hearing of three polar bears using evoked auditory potentials. Measurements were not obtainable at 1 kHz and best sensitivity was found in the range from 11.2 to 22.5 kHz. Preliminary behavioral testing of hearing indicates that they can hear down to at least 14 Hz and up to 25 kHz (Bowles personal communication 2008).
6.1.1.4 Description of Noise Sources
Sources of sound in the area of activity are comprised of multiple sources, including physical noise, biological noise, and man-made noise. Physical noise includes wind, atmospheric noise, earthquakes, waves and currents, and ice. Biological noise includes sounds produce by marine mammals, fish, and invertebrates. Man-made noise consists of air and vessel traffic, seismic surveys, icebreakers, supply ships, drilling, and noise from operations at production facilities. In the arctic environment, wind has the greatest influence on the overall ambient noise levels, due to its effect on the ice and water. In addition, calls of bearded seals in the spring significantly contribute to ambient noise levels. Ice cover at the ocean surface can alter the underwater noise characteristics dramatically. The factors influencing acoustic properties include type and degree of ice cover; whether it is shorefast pack ice, moving pack ice, or at marginal ice zone; chemical characteristics of the ice itself; and decreased air temperatures that can result in cracking of rigid ice (NRC 2003).
Underwater ambient noise levels in the Beaufort Sea region were measured to be between 95 and 110 dB re 1 µPa between 20 and 1,000 Hz (Greene 1997, 1998; Greene et al. 2001; Burgess and Greene 1999; LGL et al. 2007). In-air ambient noise levels measured by Blackwell et al. (2004a,b) near Northstar were approximately 65 dB re 20 µPa.
During the open water season, industry sound sources can include production facilities, geotechnical and geophysical surveys, exploratory drilling, and vessel and aircraft traffic. During the ice-covered season, noise sources can include production facilities, ice road and ice pad construction, vibroseis, exploratory drilling, and on-ice vehicle and aircraft traffic. Noise sources can be categorized into either stationary or mobile sources. Stationary sources include construction, maintenance, repair, and remediation activities; operations at production facilities; flaring excess gas; and drilling operations from onshore or offshore facilities. Mobile sources include vessel and aircraft traffic, open water seismic exploration; winter vibroseis programs; geotechnical surveys; ice road construction and associated vehicle traffic, including tracked vehicles and snowmobiles; dredging; and icebreakers.
Construction
Construction activities may generate both underwater and airborne noise. Greene et al. (2008) measured underwater and airborne noise during construction of a gravel island at Northstar. The study measured noise from ice road construction, heavy equipment operations (ditchwitch machine, gravel trucks, and backhoe), augering, and pile driving (vibratory and impact). Underwater sound levels from construction ranged from 103 dB re 1 µPa at 100 m (328 ft) for augering to 143 dB re 1 µPa at 100 m (328 ft) for pile driving. Most of the energy of these sounds was below 100 Hz. Airborne sound levels from these activities ranged from 65 dB re 20 µPa at 100 m (328 ft) for the bulldozer and 81 dB re 20 µPa at 100 m (328 ft) for the pile driving. Most of the energy for in-air levels was also below 100 Hz.
AOGA PETITION FOR PROMULGATION OF REGULATIONS 6-4 APRIL 2009 BEAUFORT SEA 2011-2016
Drilling
Noise from drilling operations varies with equipment type. The sound levels associated with the different drilling operations are not well known. Richardson et al. (1995) and NRC (2003) provide a limited summary of drilling noise. Based on the results of drillship sounds from the Northern Explorer II and a support vessel recorded in the 1980s, and re-modeled recently, the aggregate broadband source level for a drillship and support vessel is 175 dB re µPa at 1 m based on precautionary interpretation of the third-party measurement data (Greene 1987; Miles et al. 1987). Auxiliary noise is also created during drilling operations from supply vessels and aircraft. Underwater and airborne drilling noises from Northstar were measured by Blackwell et al. (2004b). They found that underwater noise levels increased between the bands of 60 and 250 Hz and 650 to 1,400 Hz. Airborne noise levels were indistinguishable over the typical production island sounds.
Seismic
As discussed in Section 2.2.2, seismic reflection profiling uses sound to derive information about geological structures beneath the surface of the earth. The amount of acoustic energy released is directly proportional to the operating pressure and number of airguns. A review of literature on airgun acoustics by NRC (2003) reported a maximum output peak SPL of 260 dB re 1 µPa at 1 m (3.3 ft) in the vertical far field. The location of where this peak SPL would be received by a marine mammal is dependent on the makeup of the array, water depth, and physical properties of the water.
Vessel Traffic
Vessel traffic is a major contributor to underwater noise (Richardson et al. 1995; NRC 2003). Noise is created primarily by propeller cavitation, but other machinery (e.g., diesel engines, generators, pumps, fans, etc.) also contribute to the overall noise level. Vessel noise is a combination of narrowband tonal sounds at specific frequencies and broadband sounds with energy spread over a range of frequencies. Sound levels and frequencies are related to vessel size, design, speed, and load. Broadband source levels range from 150 to 180 dB re 1 µPa at 1 m (3.2 ft), with components extending to 100 kHz, but usually peaking between 50 and 150 Hz.
Dredging
Dredges can be a strong source of continuous noise in the coastal region. Underwater noise from dredging is strongest at low frequencies, but because low frequencies attenuate rapidly in shallow water, dredge noise is typically undetectable at ranges beyond 20 to 25 km (12.4 to 15.5 mi) (Richardson et al. 1995). Broadband source levels range from 150 to 170 dB re 1 µPa at 1 m (3.3 ft), with most of the energy below 1,000 Hz.
Icebreakers
Icebreaking ships produce louder and more variable sounds than typically produced by vessels of similar size or power, causing substantial increases in noise levels out to at least 5 km (3.1 mi) (Richardson et al. 1995). The primary source of increased noise is the propeller cavitation during alternating periods of ramming and backing. Broadband source levels have been measured to be approximately 180 dB re 1 µPa at 1 m (3.3 ft), with dominant tones at 50 Hz.
Production Islands
Blackwell et al. (2004b) measured underwater and airborne noise from Northstar during production operations. Underwater broadband levels were similar with and without production, but there was a peak
AOGA PETITION FOR PROMULGATION OF REGULATIONS 6-5 APRIL 2009 BEAUFORT SEA 2011-2016
between 125 and 160 Hz that could be from production. Noise sources from the production islands include generators, turbines, vehicles, pumps, and general human activity. Most mechanical noise is below 500 Hz, but traffic noise is typically up to 1,500 Hz. Airborne sound levels will vary depending on the amount of activity.
6.1.1.5 Potential Impacts on Polar Bear
Stationary Sources
Noise from stationary sources, including drilling, may result in several types of responses in polar bears. It may attract bears to the area, as they are known to be curious. Attracting the bears to a facility could result in a human encounter, which could result in unintentional harassment, lethal take, or intentional deterrence. Conversely, noise may act as a deterrent to keep bears from coming into the area. Although this would reduce the number of potential human encounters, it may also deter females from denning in the area if the noise and habitat were coincident. However, polar bears have been known to den in close proximity to industrial activities. For example, two polar bears denned near Flaxman Island without any observed impact to the polar bears (MacGillivray et al. 2002). It is also possible that human disturbance may have caused a polar bear to abandon a den due to rolligon traffic, however, this impact could not be confirmed (USFWS 2006). This type of event has occurred very infrequently and will likely to continue to be infrequent due to the extensive measures the oil and gas industry undergoes to identify dens prior to any construction activities (see Chapter 10).
Mobile Sources
Oil and gas activities during the open water season are generally limited to vessel-based exploration activities. There is a potential that polar bears on ice floes could encounter a vessel, but the presence of the vessel is more likely to cause the disturbance to a polar bear, rather than the airborne noise generated by the vessel. Moreover, most vessel activity would occur south of the sea ice used by polar bears. Due to the solitary nature and widespread distribution of the polar bear, disturbance from vessel traffic would be short-term, localized, and temporary and limited to a few individuals. Therefore, the anticipated impact on the polar bear SB population is anticipated to be negligible.
Little information is available on the effects of seismic activity on polar bears. Monitoring during seismic surveys have documented the presence of polar bears and reported that polar bears typically reacted to the vessels by moving away (either on ice or in the water) (USFWS 2008c). Although there is no evidence that airgun pulses could cause injury or mortality to polar bears, sound from an airgun could be transmitted into their ears or up through their jaw if they are swimming, even with their head above water (Bowles, Personal Communication, 2008). The most likely response would be short-term, temporary behavioral avoidance of seismic vessels. There has never been more than a temporary behavioral disturbance recorded for polar bears exposed to seismic operations in the Alaskan Arctic. Marine mammals that show behavioral avoidance of seismic vessels are unlikely to incur auditory impairment (USFWS 2008c). Furthermore, implementation of the mitigation measures during seismic surveys to shut down when a marine mammal enters the safety zone of 190 dB re 1 µPa rms would further reduce the likelihood a polar bear would injured from seismic surveys (see Chapter 10). Therefore, the anticipated impact from seismic noise is anticipated to be negligible on the SB population.
Vessel Traffic
During the open water season, polar bears typically remain offshore in the pack ice and are not usually present in the more frequent vessel traffic area, which is south of the pack ice. There is a potential that an
AOGA PETITION FOR PROMULGATION OF REGULATIONS 6-6 APRIL 2009 BEAUFORT SEA 2011-2016
occasional polar bear on ice floes could encounter a vessel, but the presence of the vessel is likely to cause a disturbance, rather than the airborne noise. Due to the solitary nature and widespread distribution of the polar bear, disturbance from vessel traffic would be short-term and temporary and limited to a few individuals. Therefore, there would be no more than a negligible impact on the SB population.
Aircraft Traffic
Behavioral reactions of polar bears to aircraft depend on distance and type of aircraft. Polar bears often run away from aircraft passing at low altitudes. Routine aircraft traffic may result in short-term, temporary disturbance to a few individual polar bears, but the impact, if any, on the SB population is expected to be no more than negligible.
Amstrup (1993) reported most polar bears in dens continue to occupy the dens after close approaches by aircraft (Amstrup 1993). Although the snow attenuates some aircraft noise (Blix and Lentfer 1992), it is possible that repeated overflights may cause polar bears to abandon or depart their dens. However, required mitigation measures including minimum flight elevations over polar bear areas and flight restrictions around known polar bear dens would reduce the potential for bears to be disturbed by aircraft.
6.1.2 Physical Obstruction
There is a limited chance that physical obstructions caused by oil and gas activities would have an impact on polar bears. Physical obstructions have the potential to impact polar bears by displacing animals; however, if this were to occur, it would likely be temporary and localized and have minimal impact, if any. Most oil and gas facilities are located further inland where polar bears are found infrequently (USFWS 2006). Offshore and coastal facilities are most likely to be approached by polar bears.
The Endicott Causeway and West Dock facilities have the greatest potential to interfere with polar bear movements because the facilities extend continuously from the coastline to offshore facilities (USFWS 2006). However, polar bears have little or no fear of man-made structures (Stirling 1988) and can easily climb and cross gravel roads and causeways. Bears have frequently been observed crossing existing roads and causeways in the oilfields. Offshore production facilities, such as Northstar and Oooguruk, have been approached by polar bears, but due to the design (i.e., continuous sheet pile walls around the perimeter) the bears have limited ability to gain direct access to the facilities (USFWS 2006).
Physical obstructions may present a small-scale, local obstruction to polar bears; however, it is anticipated that this will have no more than a negligible impact on individual polar bears and a negligible impact, if any, on the SB population.
6.1.3 Human Encounters
AOGA anticipates that the small number of human encounters from oil and gas activities is likely to have a temporary impact on individual polar bears and a negligible impact, if any, on the SB population. Encounters with humans can be dangerous for both polar bears and oil and gas industry personnel. Human encounters could potentially result in harassment, increased stress, or (rarely) death of polar bears. Since the incidental take regulations went into effect in 1993, there have been no known instances of a bear being killed as a result of oil and gas activities (USFWS 2006).
Human encounters are more likely to occur during fall and winter periods when greater numbers of bears are found in the coastal environment searching for food and denning habitat (Amstrup and Gardner 1994). Offshore facilities such as Endicott Causeway and Northstar typically document higher numbers of polar
AOGA PETITION FOR PROMULGATION OF REGULATIONS 6-7 APRIL 2009 BEAUFORT SEA 2011-2016
AOGA PETITION FOR PROMULGATION OF REGULATIONS 6-8 APRIL 2009 BEAUFORT SEA 2011-2016
bear sightings than onshore facilities. In 2004, these two facilities accounted for 63 percent of all polar bear sightings, 42 percent and 21 percent, respectively (USFWS 2006). Endicott, Northstar, and Prudhoe Bay reported between five and 49 sightings of polar bears annually from 2005 to 2008 at each facility (Table 6-2). Some of these sightings are very likely repeated observations of the same animals resulting in a lower actual number of bears at these facilities. These sightings were comprised mostly of single adult and sub-adult bears and fewer sows with cubs. Polar bear sightings have generally increased since the inception of the incidental take regulations. The USFWS attributes this pattern in part to increased monitoring efforts throughout the years (USFWS 2006). Development of future offshore and nearshore production facilities could potentially increase polar bear-human encounters.
As discussed in Section 4.1, polar bear sighting data from oil and gas operations were analyzed from 2005 to 2008 to identify trends. These data are presented in Table 6-2. Of the total number of polar bear sightings, approximately 51 percent were deterred by trained personnel using horns, sirens, vehicles, and cracker shells. The effects of non-invasive deterrence techniques on polar bears are not well documented; however, there is no evidence that deterrence is having an impact on the survival and recruitment of polar bears (USFWS 2006). The number of bears being deterred per year represents a small proportion (less than about 1 percent per year) of the SB population. The numbers of bears deterred away from production facilities are expected to be low and any impacts are expected to be short-term and temporary, resulting in no more than a negligible impact, if any, on the SB polar bear population.
There is also the potential for oil and gas activities to disturb polar bear dens. The oil and gas industry makes a concerted effort to avoid known polar bear dens found as a result of locating USGS-radio-collared, pregnant females or documentation by Forward Looking Infrared (FLIR) surveys around the oil fields. These dens, monitored by the USFWS, represent only a small percentage of the total active polar bear dens located in the SB (USFWS 2006). LOA conditions require oil and gas operations to avoid known polar bear dens by 1.6 km (1 mi). From 2002 to 2006, four previously unknown maternal dens were encountered by the oil and gas industry during project activities (USFWS 2006). The oil and gas industry reports unknown dens to the USFWS who then establishes mitigation measures, such as the 1.6 km (1 mi) exclusion zone, to minimize the potential disturbance from oil and gas activities (see Chapter 10).
PETITION FOR PROMULGATION OF REGULATIONS 6-9 APRIL 2009
Number of Polar Bear Sightings (Number of Deterrences) Year
Alpine Badami Endicott Kuparuk Liberty1 Milne Point Nikaitchuq2 Northstar Oooguruk1 Prudhoe Bay Point Thomson1
Total Number of
Cubs
2005 1 (1) 4 (1) 21 (11) 8 (7) No ops 12 (4) No data 14 (1) No ops 49 (18) No ops 9 2006 4 (0) 1 (1) 19 (16) 3 (1) No ops 1 (0) No data 5 (3) 5 (2) 13 (5) No ops 16 2007 2 (0) 0 (0) 20 (12) 12 (2) No ops 8 (1) No data 19 (4) 8 (4) 15 (1) No ops 32 2008 3 (0) 1 (1) 36 (7) 7 (2) 15 (6) 7 (0) 17 (3) 7 (2) 13 (7) 30 (5) 10 (0) 39
Area Total 10 (1) 6 (3) 96 (46) 30 (12) 15 (6) 28 (5) 17 (3) 45 (10) 26 (13) 107 (29) 10 (0) 96 1 No operations occurred 2005-2007 at Liberty or Point Thomson; no operations occurred in 2005 at Oooguruk. 2 No sighting data provided 2005-2007 for Nikaitchuq.
Table 6-2 Polar Bear Sightings and Deterrences in North Slope Oil and Gas Units
AOGABEAUFORT SEA 2011-2016
Human-bear interactions are governed by polar bear interaction plans developed by and in collaboration with USFWS all oil and gas companies. The plans provide guidance for minimizing polar bear encounters through personnel training, polar bear guards, lighting, snow clearance, waste management and garbage control, agency communication, site clearance, and site-specific safety briefings for polar bear awareness. Employee training programs are designed to educate field personnel about the dangers of human-bear encounters and to implement safety procedures in the event of a bear sighting. Personnel are instructed to leave an area when bears are seen in the vicinity.
6.1.4 Spills
Oil, production waste, and non-hydrocarbon spills, if encountered by bears, have the potential to directly impact them. The indirect effects of oil spills on polar bear habitat are discussed in Chapter 8. Operational spills may occur during transfer of fuel, refueling, handling of lubricants and liquid products, and general maintenance of equipment. Polar bears may be impacted by external contact with oil, ingestion of oil, or inhalation of fumes. Polar bears could encounter oil spills during open water and ice-covered seasons in the offshore or onshore habitat (USFWS 2006).
Effects on experimentally oiled captive bears have included acute inflammation of the nasal passages, marked epidermal responses, anemia, anorexia, biochemical changes indicative of stress, renal impairment, and death (USFWS 2006; Øritsland et al. 1981). Oiling could cause significant thermoregulatory problems by reducing the insulation value of the pelt (Øritsland et al. 1981; Hurst and Øritsland 1982). In experimental oiling, many effects did not become evident until several weeks after exposure to oil (USFWS 2006).
Oil ingestion by polar bears through consumption of contaminated prey and by grooming or nursing could have pathological effects, depending on the amount of oil ingested and the individual’s physiological state (USFWS 2006). In April 1988, a large adult male polar bear was found dead on a barrier island north of Prudhoe Bay. The cause of death was determined to be poisoning from ingestion of a mixture that included ethylene glycol and Rhodamine B dye (USFWS 2006). This represents the only record of a bear mortality caused by chemical waste products on the North Slope. Some hazardous substances are used during oil production activities, and if spilled near a facility, they could be hazardous to polar bears if ingested. These substances, if spilled, would most likely be spilled on land in areas where polar bears would be unlikely to encounter them. If spilled on land, ice, or water, oil and gas industry procedures require immediate clean up.
It is likely that polar bears swimming in or walking adjacent to an oil spill will inhale petroleum vapors. Inhalation of highly concentrated vapors, such as gasoline in excess of 10,000 parts per million (ppm), is typically fatal (Boesch and Rabalais 1987). At lower concentrations, up to 1,000 ppm, humans and laboratory animals can develop inflammation, hemorrhaging, and congestion of the lungs (Boesch and Rabalais 1987). Øritsland et al. (1981) reported on the effects of vapor inhalation on captive polar bears. Their report indicated inhalation of hydrocarbons from crude oil in a confined space may have been a factor in the death of two of three polar bears exposed to oil in their experiments.
Small, localized spills on land or in the water are typically cleaned up quickly and pose little to no threat to polar bears. Large spills, however, may pose a potentially more serious threat to polar bears. Historically large spills associated with Alaskan oil and gas activities on the North Slope have been production-related and have occurred at production facilities or pipelines connecting wells on land (USFWS 2006). The probability of a large oil spill (> 500 barrels) occurring on the North Slope is low. To date, only one major oil spill has occurred on the North Slope. In March 2006, approximately 267,000
AOGA PETITION FOR PROMULGATION OF REGULATIONS 6-10 APRIL 2009 BEAUFORT SEA 2011-2016
gallons of crude oil was released onto the snow-covered tundra from the GC-2 transit pipeline in Prudhoe Bay. The spill covered about two acres of the snow-covered tundra. A Tundra Treatment Plan was developed and implemented to remove the hydrocarbons and to minimize the potential for long-term damage to the tundra. The site is currently being successfully re-vegetated and rehabilitated. Other mitigation measures discussed in Chapter 10 will also be implemented to reduce the likelihood and impact of a spill.
6.1.5 Summary of Anticipated Impacts
Impacts on polar bears by oil and gas industry activity during the past 40 years have been minimal, as shown by the small number of documented incidents. Polar bears have been encountered at or near coastal and offshore production facilities, or along roads and causeways linking these facilities to the mainland. Since the ITRs went into effect in 1993, there have been no known instances of a bear being killed from oil and gas industry activities (USFWS 2006).
Although there are limited specific data regarding the hearing of polar bear, the long-term consequences of all effects of oil and gas activity in the action area are reliably known to be no more than localized, short-term, and temporary changes in behavior with no effect on recruitment or survival of the SB population. Accordingly, it may be logically inferred that noise impacts from oil and gas activity, as a subset of all effects, have not had more than a negligible adverse impact on the SB population.
The majority of actual incidental take to polar bears are expected to result from direct human encounters. As discussed previously, approximately half of recorded encounters may result in a deterrence event, where bears are deterred from industrial areas. The number of bears being deterred represents a small proportion of the Beaufort Sea populations and there is no evidence that deterrence has had an impact on the survival and recruitment of polar bears (USFWS 2006). The numbers of bears deterred away from production facilities are expected to be low relative to the overall polar bear population, and any impacts are expected to be short-term and temporary, and to have no more than a negligible impact, if any, on the SB polar bear population. The implementation of polar bear interaction plans has helped raise employee awareness about the importance of bear avoidance and has minimized the impact of human encounters on polar bears.
With over 40 years of oil and gas exploration and development in Alaska, the existing data reliably demonstrate that with proper management, the potential negative effects of oil and gas industry activities on polar bears can be minimized (USFWS 2008a). With the implementation of effective mitigation measures, oil and gas industry activities are anticipated to have a short-term, temporary impact on a small number of individual polar bears and no more than a negligible impact, if any, on the SB population.
6.2 PACIFIC WALRUS
6.2.1 Noise
The following sections discuss the potential noise impacts on walrus. The noise sources discussed in Section 5.1.1 are also applicable for walrus.
6.2.1.1 Hearing Abilities of Walrus
Walrus hear sounds both in air and in water. Kastelein et al. (1996) tested the in-air hearing of a walrus from 125 Hz to 8 kHz and determined the best sensitivity was between 250 Hz and 2 kHz. Walrus were able to hear at all frequency ranges tested. Kastelein et al. (2002) tested the underwater hearing and
AOGA PETITION FOR PROMULGATION OF REGULATIONS 6-11 APRIL 2009 BEAUFORT SEA 2011-2016
determined that the best sensitivity was at 12 kHz. Their best range of hearing was between 1 and 12 kHz. Most of the noise sources discussed, other than the very high frequency seismic profiling, would be audible to walrus; however, the noise levels required to cause TTS or PTS have not been determined for walrus.
6.2.1.2 Potential Impacts on Pacific Walrus
Stationary Sources
Noises produced from stationary sources, including drilling, are within the hearing range of the walrus and could result in disturbance to a small number of walrus. However, because walrus are rarely observed in the vicinity of these facilities, the likelihood of disturbance is low. Furthermore, in the few instances where walrus have been observed near Northstar and Endicott, there is no indication that they avoided the noise. Therefore, noise from stationary sources is anticipated to disturb no more than a few individuals with no impact to the population.
Mobile Sources
The mobile source most likely to result in noise exposure of walrus is seismic surveys that take place during the open water season. Airgun arrays may be audible several km (mi) from the source and source levels of the array may be loud enough to cause hearing damage in walrus in proximity to the source. However, seismic survey operators employ monitoring programs that require shut down of airgun arrays if a walrus enters the safety zone of 180 dB re 1 µPa rms (see Chapter 10). Implementation of this mitigation would minimize the potential for walrus to be injured during seismic surveys. Furthermore, because open water seismic activities typically occur in ice-free areas where walrus are not typically found, the likelihood of noise disturbance from this activity is considered extremely low and would be limited to no more than a few individuals. Therefore, impacts, if any, to the population are expected to be negligible.
Vessel Traffic
The behavioral response of walrus to vessel traffic is extremely variable. Richardson et al. (1995) reviewed various studies on walrus reactions to ships and boats and reported that some studies reported no reaction, while other studies showed that high-frequency noise from outboards may be more disturbing than low frequency noise from diesel engines. Richardson et al. (1995) summarized that walrus response to ships depend strongly on distance and ship speed, as well as previous exposure to hunting. Females with young are typically more wary than adults, and walrus in open water are less responsive than those on ice.
Walrus in water appear to be even less readily disturbed by vessels than walrus hauled out on land or ice (Fay et al. 1984). They also reported that walrus in the water showed little concern about an approaching vessel unless the ship was actually about to run over them. Even then, they simply dove and swam away. Fay observed that when a ship was stationary, walrus often swam to within 20 m (66 ft). Frequently, they dove under the ship and surfaced on the other side.
Underwater noise from vessel traffic has the potential to mask sounds of walrus very close to the source, when walrus are present in the region. However, due to the low numbers of walrus observed in the area, impacts, if any, from vessel traffic would be limited to no more than a few individuals and would have no impacts to the population.
AOGA PETITION FOR PROMULGATION OF REGULATIONS 6-12 APRIL 2009 BEAUFORT SEA 2011-2016
Aircraft Traffic
The behavioral response of walrus to aircraft traffic also varies with distance, type of aircraft, flight pattern, age, sex, and group size. Richardson et al. (1995) reviewed responses of walrus to aircraft and summarized that individual responses to aircraft can range from orientation (i.e., looking at the aircraft) to leaving the haulout. In general, small herds on a haulout sites (terrestrial and pack ice) seem more easily disturbed than large groups, and that adult females and calves are more likely to enter the water during disturbance. Stronger reactions occur when the aircraft is flying low, passes overhead, or causes abrupt changes in sound. The greatest potential impact of aircraft is when the disturbance causes a stampede into the water by all of the walrus at a haulout site, which may result in the crushing of calves.
Most aircraft traffic in the area of activity normally occurs inland and at altitudes that are unlikely to affect walrus. Additionally, there are no rookeries located in the area of activity and a generally there is a low occurrence of walrus in the Beaufort Sea. Therefore, aircraft traffic would have no more than a negligible impact, if any, on the individual or walrus population.
6.2.2 Physical Obstruction
It is unlikely that walrus would be negatively impacted by a physical obstruction caused by oil and gas activities. There have been no recorded instances of take of walrus within the activity area from a physical obstruction. Small numbers of walrus have been observed to haul out on Northstar Island and Endicott (USFWS 2006; BPXA 2007). There is no evidence that these animals were disrupted or displaced by oil and gas activities. It is unlikely that stationary offshore facilities and artificial islands would affect the movement of walrus. In the event that walrus are encountered on a stationary facility, the oil and gas industry will record and report the interaction.
6.2.3 Human Encounters
Human encounters with walrus are rare in the Beaufort Sea. Aerial and vessel surveys conducted by LGL between Harrison Bay and Kaktovik in 2006 and 2007 reported no walrus in 2006 and fewer than 15 in 2007 (Ireland et al. 2008). There have been no recorded instances of take within the activity area from human encounters. In the event that an individual or small group of walrus is encountered on a stationary facility the oil and gas industry will record and report the interaction and implement the necessary precautions to minimize any effect on walrus. Vessels that encounter walrus typically divert around the animals wherever practical and make every effort to avoid disturbing the animals. Close approaches to walrus are prohibited. Given the small number of walrus in the Beaufort Sea, human encounters are expected to have no more than a negligible impact on individual walrus and a negligible impact, if any, on the Alaskan stock.
6.2.4 Spills
There is the potential for oil, production waste, and chemical spills to negatively impact individual walrus by displacing animals and causing injury or death. The likelihood of spills and current mitigation measures discussed for polar bear in Section 5.1.4 are also applicable to the walrus.
Onshore oil spills would not impact walrus unless the spill moved into the offshore environment or near a haulout area (USFWS 2006). Little is known about the effects of oil or other chemical compounds on walrus; however, oil and production waste spills have been documented to cause a range of physiological and toxic effects on other pinnipeds. Components of oil can burn eyes, burn skin, irritate or damage
AOGA PETITION FOR PROMULGATION OF REGULATIONS 6-13 APRIL 2009 BEAUFORT SEA 2011-2016
sensitive membranes in the nose, eyes, and mouth (USFWS 2006). If ingested, it can damage red blood cells, suppress immune systems, strain the liver, spleen and kidneys and interfere with the reproductive system of animals (Australian Maritime Safety Authority [AMSA] 2002). Walrus do not exhibit grooming behavior which lessens the chance of ingestion of oil (USFWS 2006). After a period of exposure, inhalation of hydrocarbon fumes can cause pulmonary hemorrhages, inflammation, congestion, and nerve damage (USFWS 2006). Walrus calves may die as a result of abandonment. If the mother cannot identify its pup by smell in the large colony, the mother may reject attempts by the pup to suckle (AMSA 2002).
Given the small number of walrus present in the Beaufort Sea, the low probability of a large oil or production waste spill, and the measures that will be taken to mitigate the impact of any spill, it is anticipated that oil and production waste spills will have a negligible impact on individual walrus and negligible impact, if any, on the Alaskan stock.
6.2.5 Summary of Anticipated Impacts
It is unlikely that oil and gas activities will result in any noise, physical obstructions, human encounters, or oil and production waste spills that would have a negative impact on more than a very few individual walrus. Walrus are not present in the region of activity during the ice-covered season and occur infrequently in the region during the open water season.
As with polar bears, although there is limited specific data regarding the effects of noise on walrus, the long-term consequences of all effects of oil and gas activity in the action area are reliably known to be no more than localized, short-term and temporary changes in behavior with no effect on recruitment or survival of the Pacific walrus. Indeed, adverse impacts to walrus within the Petition area have not been observed. Accordingly, it may be logically inferred that noise impacts from oil and gas activity, as a subset of all effects, have not had more than a negligible adverse impact, if any, on Pacific walrus.
To date, there have been no recorded instances in which oil and gas activity has caused more than a temporary, short-term impact on a few walrus in the Beaufort Sea. The limited potential for incidental take during the period of the proposed regulations will be further mitigated by implementation of management measures required by USFWS (Chapter 10). Accordingly, it is anticipated that any impact from oil and gas activities will be temporary and short-term in nature, have no more than a negligible impact on individual walrus, and have no more than a negligible impact, if any, on the Alaskan stock.
AOGA PETITION FOR PROMULGATION OF REGULATIONS 6-14 APRIL 2009 BEAUFORT SEA 2011-2016
7.0 ANTICIPATED IMPACT ON SUBSISTENCE
CFR § 18.27(d)(iii)(D) The anticipated impact of the activity on the availability of the species or stocks for subsistence uses.
7.1 SUBSISTENCE SPECIES SYNOPSIS
Subsistence hunting is considered integral to the way of life of northern Alaska communities. The subsistence harvest provides food, clothing, and materials that are used to produce arts and crafts. These subsistence products have substantial material and economic importance, since the subsistence goods would have enormous replacement costs if alternatives had to be purchased. However, the subsistence way of life also has important cultural and socio-economic benefits. Subsistence harvest activities express and reproduce central cultural values, including respect for and generosity with the foods of the natural world, as shown in the widespread patterns of sharing, trading, and bartering of subsistence foods.
The annual cycle of subsistence harvests shows effort directed at a wide array of resources, at strategic times and places when animals are abundant and may be harvested efficiently. In this sense, the composition of the subsistence harvest represents an ecological adaptation to available resources. All of the subsistence resources are important at some time of the annual cycle, even though certain resources provide much greater quantities of food. The three communities in the area of activity, Barrow, Nuiqsut, and Kaktovik, have a particularly high level of reliance on marine mammals, especially bowhead whales. Caribou are also an important food resource, along with fish and birds. Polar bears and walrus are also important subsistence resources. Though harvested infrequently, they contribute small quantities of food and important byproducts. Polar bears are primarily hunted for their fur, which is used to craft cold weather gear such as boots, mitts, and coats. Their meat is also consumed (MMS 1990). Walrus provide meat as a food resource, and ivory as a valuable byproduct used to manufacture traditional arts and crafts (MMS 1990).
7.1.1 Polar Bear
Historically, polar bears have been killed for subsistence and handicrafts by Alaska Native hunters, and for recreation by others (non-Alaska natives). Based on skins shipped from Alaska, an average of 120 polar bears were taken annually by natives between 1925 and 1953. Trophy hunting from aircraft was initiated in the 1950s, and as a result, the annual harvest rate by natives and sport hunters more than doubled to an average of 260 polar bears each year between 1961 and 1972 (Amstrup et al. 1986; Schliebe et al. 1998). After enactment of the MMPA in 1972, the annual subsistence harvest of polar bears decreased, ranging from 29 to 181 between 1973 and 1984 (Amstrup et al. 1986). From 1990 to 2001, the total number of harvested polar bears has ranged between 38 and 123 animals each year. However, the harvest of polar bears continues to play an important role in Inupiat communities where they utilize parts of the bears to make traditional handicrafts and clothing (Nelson 1981). USFWS has concluded that the continuing subsistence harvest of polar bears by native Alaskans is sustainable and does not a present threat to the SB population. According to USFWS, the number of unreported kills of polar bears from the SB population since 1980 is thought to be negligible.
7.1.2 Pacific Walrus
The walrus has cultural and subsistence significance to the Inupiat of the North Slope, but east of Barrow harvests are uncommon as this is outside of the common range of the species. Alaskan communities
AOGA PETITION FOR PROMULGATION OF REGULATIONS 7-1 APRIL 2009 BEAUFORT SEA 2011-2016
harvest few walrus in the southern Beaufort Sea along the northern coast of Alaska, including Barrow, Nuiqsut, and (rarely) Kaktovik. Small numbers of walrus migrate through the area annually and are harvested seasonally (Braund et al. 1989). Current harvest estimates (including those killed in fisheries) do not exceed estimated recruitment levels (USFWS 2008b).
7.2 SUBSISTENCE HARVESTS BY COMMUNITY
7.2.1 Kaktovik
Kaktovik, located on Barter Island, is approximately 145 km (90 mi) west of the Canadian border and 447 km (278 mi) southeast of Barrow with a population of approximately 300. The village is on the northern edge of ANWR. Like other coastal communities, Kaktovik relies on maritime resources other than walrus and polar bears, primarily bowhead whales, but hunters also take caribou and fish. Bowhead whales, caribou, and fish comprise approximately 63 percent, 11 percent, and 13 percent of the total annual harvest (by edible pounds), respectively (MMS 2003). Other marine mammal species comprise a very small percentage of the overall harvest.
Polar Bear
Polar bears are primarily harvested during fall and winter on the pack ice and along open leads. Bears may be pursued seaward of the barrier islands for 16 km (10 mi) or more (MMS 2003). Compared to other North Slope communities, the overall harvest of polar bears is relatively low. The polar bear harvest by Kaktovik from 2004 to 2008 averaged 1.2 polar bears per year (Table 7-1). This is half of the average of 2.4 polar bears for the period 2000 to 2004. The reason for this decline is unknown, but contributing factors could be a difference in data collection techniques, changes in level of effort by harvesters, changes in food preference, or response to other constraints (e.g., environmental conditions, rising fuel costs).
Walrus
Walrus rarely occur near Kaktovik and thus are rarely harvested. However, boat crews hunting for seals in open water (currently July and August) along the coast east and west of the village occasionally harvest walrus. Kaktovik hunters did not harvest any walrus from 2000 to 2008, as summarized in Table 7-2.
7.2.2 Nuiqsut
Nuiqsut is located approximately 29 km (18 mi) south of the Nechelik Channel entrance, which is the head of the Colville River at the Beaufort Sea, and 219 km (136 mi) southeast of Barrow with a population of approximately 440. Nuiqsut is an inland community, but the community maintains an active whaling and marine mammal harvest pattern, accounting for 31.8 percent of subsistence foods. Caribou and fish are very important, representing by edible pounds 58 percent and 30 percent, respectively. The use of polar bears and walrus for subsistence is relatively low (MMS 2003).
Polar Bear
Most polar bear hunting occurs from September through April from Nuiqsut. The overall harvest of polar bears is lower than Barrow and Kaktovik. The annual polar bear harvest for Nuiqsut from 2004 to 2008 averaged 0.4 bears (Table 7-1), lower than the 2 bears per year reported for the period 2000-2004. The reason for this decline is unknown.
AOGA PETITION FOR PROMULGATION OF REGULATIONS 7-2 APRIL 2009 BEAUFORT SEA 2011-2016
Table 7-1 Subsistence Polar Bear Harvests Reports by Year and Village
Polar bears reported and tagged as harvested and tagged by Alaska Native subsistence hunters in accordance with the Marine Mammal Marking, Tagging, and Reporting Rule (50 CFR 18.23). Source: USFWS 2008b
Table 7-2 Subsistence Walrus Harvests Reports by Year and Village
Walrus reported as harvested and tagged by Alaska Native subsistence hunters in accordance with the Marine Mammal Marking, Tagging, and Reporting Rule [50 CFR 18.23]. * Year to date as of November 5, 2008 Source: USFWS 2008b
Walrus
Walrus are occasionally harvested by Nuiqsut hunters during the open water season from June to early October. Hunts have occurred throughout the entire coastal range, from Cape Halkett to Anderson Point, but walrus are seldom encountered for harvest. In the period 2000 to 2004, no walrus were harvested by Nuiqsut hunters. No tagged walrus were reported from Nuiqsut hunters for the years 2004 to 2008, as shown in Table 7-2 (USFWS 2008b).
7.2.3 Barrow
Barrow is the economic, transportation and administrative center for the NSB with a population of approximately 3,900. Located on the Chukchi Sea coast, Barrow is the northernmost community in the U.S. The majority of the annual subsistence harvest by edible pounds for Barrow is composed of caribou and bowhead whales (22 percent and 39 percent, respectively; Alaska Department of Fish and Game [ADFG 2001]). Walrus comprise approximately nine percent of the annual harvest (by edible pounds), and polar bears account for approximately 2.2 percent of the annual subsistence harvest (by edible pounds) for Barrow (ADFG 2001).
Polar Bear
Barrow residents hunt polar bears on the sea ice or along leads from October to June. In 1989, 2.2 percent of the total subsistence harvest (by edible pounds) for Barrow was composed of polar bears (ADFG 2001). Since it is a large community, Barrow often has the highest number of polar bear takes on the North Slope. The polar bear harvest for Barrow from 2004 to 2008 averaged six animals per year (Table
AOGA PETITION FOR PROMULGATION OF REGULATIONS 7-3 APRIL 2009 BEAUFORT SEA 2011-2016
7-1). This is a significant reduction from the reported annual average of 15.6 bears for the period 2000 to 2004. The reason for this decline is unknown, as stated previously.
Walrus
Barrow residents hunt walrus from boats, during the marine mammal hunts west and southwest of Point Barrow to Peard Bay, generally no more than 24 to 32 km (15 to 20 mi) from the community (MMS 2003). Most walrus hunting occurs from June through September, and peaks in August, when the landfast ice breaks up and hunters can access the walrus by boat as they migrate north on the retreating pack ice (MMS 1990). The average annual walrus harvest for Barrow from 2004 to 2008 was 22 animals (Table 7-2). This is less than the reported average of 31.8 walrus taken annually for the period 2000 to 2004. As stated previously, the reason for this decline is unknown.
7.3 SUMMARY OF ANTICIPATED IMPACTS
The impact of oil and gas exploration, development, and production on the availability of polar bears and walrus for subsistence harvest has been, and is anticipated to remain, negligible. Polar bears are hunted primarily during the ice-covered period. Oil and gas activity during the period of the proposed ITR are expected to have a negligible impact, if any, on the distribution, movement, and numbers of polar bears in this area. Walrus are primarily hunted during the open water period. Oil and gas activities are also expected to have a negligible impact on the distribution, movement, and numbers of walrus in the region. Mitigation and regular communication between the industry and native communities will further reduce the likelihood of interference with subsistence harvest. All operators work with the communities to reduce the interference of activities on the availability of these animals for subsistence uses, as discussed in more detail in Chapter 10.
AOGA PETITION FOR PROMULGATION OF REGULATIONS 7-4 APRIL 2009 BEAUFORT SEA 2011-2016
8.0 ANTICIPATED IMPACT ON HABITAT
CFR § 18.27(d)(iv) The anticipated impact of the activity upon the habitat of the marine mammal populations and the likelihood of restoration of the affected habitat.
8.1 POLAR BEAR
Though there is the potential for oil and gas activities to impact polar bear habitat, the documented impacts by the oil and gas industry during the past 40 years have been minimal. Given the mitigation measures in place and their likely continued use in the future, the low level of oil and gas activities occurring in polar bear habitat and the temporary and localized nature of many of the oil and gas activities, it is anticipated that oil and gas industry will have a minimal impact on polar bear habitat.
As described in Chapter 5, habitats that are important to polar bears include pack ice, landfast ice, and coastal areas. Open water by itself is not considered to be a habitat type frequently used by polar bears, because life functions such as feeding, reproduction, or resting do not occur in open water (USFWS 2008a). However, open water is a fundamental part of the marine system that supports seal species, the principal prey of polar bears, and seasonally refreezes to form the ice needed by the bears (USFWS 2008a).
8.1.1 Noise
The primary potential impacts from noise on polar bear habitat are impacts on their prey, the bearded seal, ringed seal, and spotted seal (Phoca largha). As discussed in Section 5.1, anthropogenic noise may affect marine mammals in various ways, from small behavioral changes to Level A harassment. Noise associated with oil and gas activities has the potential to result in disturbance to the seals on which polar bears prey. The primary source of noise disturbance to these species would be from the air and vessel traffic associated with exploration activities, including supply boats, seismic survey operations, icebreakers, and aircraft. Secondary sources would be drilling and production operations, although most of this noise is relatively low frequency and at low sound levels.
The vessel and aircraft traffic could potentially cause behavioral disturbance to the seals hauled out on the ice. However, the numbers of seals potentially affected is expected to be small due to the low number of disturbance events and the relatively dispersed distribution of seals in the area of activity. Furthermore, seals in the region are likely habituated to industrial noise. Blackwell et al. (2004a) reported that ringed seals exhibited tolerance to industrial noise associated with construction activities, including pile driving, at Northstar.
Noise from seismic surveys could also result in temporary disturbance to seals. Similar to vessel traffic, seismic activities are likely to result in startle responses near the sound source, but the disturbance is likely to be limited to a few seals in the localized area due to their scattered distribution. Furthermore, mitigation programs that require shut down of seismic activity if a marine mammal enters the 190 dB safety zone would reduce the numbers of seals that may be impacted by seismic noise (see Chapter 10). In addition, Moulton et al. (2002) and other studies (Moulton and Lawson 2002; Miller et al. 2005; Ireland et al. 2008) report that the distribution of ringed seals did not change after seismic operations.
AOGA PETITION FOR PROMULGATION OF REGULATIONS 8-1 APRIL 2009 BEAUFORT SEA 2011-2016
8.1.2 Facility Development and Operations
Facility development and operation has the potential to cause some degradation and fragmentation effects on polar bear habitat. As discussed in Chapter 6, the operation of existing facilities represents a small scale, local obstruction to polar bears and the anticipated impact of these facilities on polar bear foraging and breeding habitat is considered no more than negligible. The majority of existing facilities are located inland where polar bears are found infrequently (USFWS 2006). Areas of landfast ice adjacent to existing offshore production facilities, including the Northstar, the Salt Water Treatment Plant on the West Dock Causeway, and the Endicott production island, provide marginal hunting habitat due to their low seal densities (USFWS 2006). Furthermore, these facilities do not impact the adjacent landfast ice habitat used by ringed seals (Williams et al. 2001, 2002). Since pack ice is in constant motion by the winds and tides, structures are not constructed on this type of ice.
The development of future facilities, particularly offshore and nearshore coastal facilities, are more likely to have a potential impact on polar bear foraging or denning habitat. As more permanent structures are built, there is the potential to reduce the amount of undisturbed, connected habitat that may be utilized by polar bears. Female polar bears tend to select secluded areas for denning, presumably to minimize disturbance during the critical period of cub development (USFWS 2008a). Terrestrial denning sites have specific prominent features (e.g., coastal bluffs, river banks, and abandoned pads), which help to accumulate snow for den excavation and expansion (Harington 1968; Durner et al. 2003). Over 80 percent of maternal dens on land were within 10 km (6.2 mi) of the coast and over 60 percent were on the coast or coastal barrier islands (Schliebe et al. 2006). While direct disturbance may cause abandonment of occupied dens before their cubs are ready to leave (USFWS 2008a), the consistent features and distance from the coast of potential denning areas have enabled the USFWS to map potential denning habitats along the coast for avoidance by industrial activities. Therefore, activities such as expansion of the network of roads, pipelines, well pads, and infrastructure associated with oil and gas activities can be managed to have a negligible effect on denning habitat.
The potential effects of human activities are greater in areas where there is a high concentration of dens. Denning habitat around existing facilities represents only a small percentage of the total area available to and used by polar bear to den (USFWS 2006). The oil and gas industry makes a concerted effort to locate, monitor, and avoid known polar bear denning habitat around existing and future facilities. This habitat is also monitored by the USFWS, and mitigation measures require oil and gas operations to avoid known polar bear dens by 1.6 km (1 mi).
The operation of existing facilities is not anticipated to impact polar bear habitat. There is the potential for future development or for expansion of existing facilities to impact polar bear habitat; however, the USFWS will evaluate these impacts through a requested LOA and apply suitable conditions. The oil and gas industry also maintains best practices in mitigating the potential impacts of operation and development on polar bear habitat. Mitigation techniques that have been instituted, and will be modified as necessary, have proven to be highly successful in providing for polar bear conservation in Alaska (Chapter 10).
8.1.3 Spills
The possibility of spills from oil and gas activities and the subsequent potential impacts on polar bears are a concern (USFWS 2006). Oil spills can have an indirect effect on polar bears by altering their feeding, breeding, or resting habitat as well as the availability and distribution of prey species.
AOGA PETITION FOR PROMULGATION OF REGULATIONS 8-2 APRIL 2009 BEAUFORT SEA 2011-2016
The potential impact of a larger spill on polar bear habitat would depend on multiple factors, including the time of year, environmental conditions, the magnitude of the spill, the origin of the spill, and the success of clean-up efforts. Oil spills in the fall or spring during the formation or break-up of sea ice present a greater risk because of difficulties associated with clean up during these periods, and the presence of bears in the prime feeding areas over the continental shelf (USFWS 2008a). Amstrup et al. (2000) concluded that the release of oil trapped under the ice from an underwater spill during the winter could be catastrophic during spring break-up if bears were present (USFWS 2008a). During the autumn freeze-up and spring breakup periods, any oil spilled in the marine environment would likely concentrate and accumulate in open leads and polynyas, areas of high activity for both polar bears and seals (USFWS 2008a).
The main potential impact oil spills may have on polar bear habitat is through the reduction of suitable foraging habitat and prey availability. However, the biology of the polar bear and its prey greatly minimizes the potential population impacts from an oil spill. For instance, polar bears and their prey are widespread in low densities in the Beaufort Sea occurring in many different habitats in the sea ice. Ringed seals use shorefast ice, pack ice, and offshore pack ice, which cover a broad geographic area. Similarly, polar bears, often solitary, inhabit these ice types, traveling long distances in search of prey. Polar bears have also been reported to adapt to changing prey conditions by switching to other seal species including bearded seals (Iverson et al. 2006; Stirling and Parkinson 2006). Consequently, these and other life history features of polar bears and their prey would greatly reduce the potential for any impacts on polar bears from oil spills in their habitat. Any impacts would be localized to a small amount of habitat relative to that available in the Beaufort Sea.
The potential impact of a major oil spill on polar bear habitat is of great concern, although the probability of a large oil spill occurring is very low. Small spills are expected to be localized and cleaned up quickly, minimizing potential impact on the habitat. In the event that a large oil spill occurs, existing detection, containment and recovery procedures, and waste holding practices provide adequate protection to minimize impacts to polar bear habitat.
8.2 PACIFIC WALRUS
Proposed oil and gas activities on the North Slope and in the Beaufort Sea are not expected to impact the habitat of walrus. Habitat important to the walrus is located outside of the area of activity addressed in this Petition. During summer months, the walrus inhabits the moving pack ice over the shallow waters off the continental shelf of the Bering and Chukchi Seas. Walrus are rare in the Alaskan Beaufort Sea east of Point Barrow. All five of the walrus haulout sites used in Alaska are in the Bering Sea. An unusually light ice year in 2007 resulted in walrus hauled out between Point Lay and Point Barrow in the Chukchi Sea. Walrus retreated to the shoreline after the pack ice retreated north of the shallow OCS waters (Ireland et al. 2008). There was no evidence of walrus moving into the Beaufort Sea during this unusual event (Ireland et al. 2008), suggesting that walrus are not likely to shift their distribution from the Chukchi Sea to the Beaufort Sea during years of light ice conditions.
8.2.1 Noise
There is little information on how or if noise from oil and gas activities affects the prey of walrus. As reviewed in NRC (2003), cephalopods (octopods and squid) and crabs have statocysts that may detect low-frequency sounds. Marine invertebrates do not hear in the same manner as vertebrates, but they are able to sense vibrations and movements associated with sound production to allow detection of potential
AOGA PETITION FOR PROMULGATION OF REGULATIONS 8-3 APRIL 2009 BEAUFORT SEA 2011-2016
predators, prey, and the activity of tides and currents (Discovery of Sound in the Sea 2008). They accomplish this with special sensory organs known as chordotonal organs, a type of internal mechanoreceptor. These organs sense pressure, movement, and tension. They detect cues generated from vibrations that may be associated with sound. However, because there are no important feeding grounds in the area of activity, noise from oil and gas activities is not expected to impact prey species comprising walrus feeding habitat.
8.2.2 Spills
Spills near or around Barrow may indirectly affect the walrus by impacting the benthic invertebrates on which they feed. Oil settling on the ocean floor has the potential to reduce the availability of benthic invertebrates as a food source due to smothering and toxicity (USFWS 2006). Some polynuclear aromatics, that are carcinogenic and toxic, may also become concentrated in the food chain (Etkin 1997). However, little or no contamination of benthic food organisms and bottom feeding habitats of walrus would be expected to occur, because little oil would likely reach offshore feeding areas. Given the small number of walrus using the Beaufort Sea and the small proportion of total available habitat affected by a spill, the probability of oil or waste products having more than a negligible impact on important feeding areas from an oil and gas industry oil spill is very low. Mitigation measures undertaken by industry and highlighted in Chapter 10 would assist in further reducing any impact on the benthic environment.
8.3 CLIMATE CHANGE
The Council on Environmental Quality (CEQ) has issued guidance under NEPA indicating that climate change is a reasonably foreseeable impact of GHG emissions. As acknowledged in prior chapters of this Petition, USFWS has determined that climate change poses a threat to the survival of the polar bear species throughout its range because of the resulting modification (recession) of arctic sea ice habitat upon which the polar bear is dependent. In addition, climate change poses an indeterminate potential threat to Pacific walrus, albeit primarily in areas outside of the area specified for the proposed ITR. This section summarizes information regarding the potential contribution of the proposed action to GHG emissions and climate change, and the potential for climate change to alter the environmental consequences of oil and gas activities in a manner adverse to the North Slope habitat of polar bear and Pacific walrus.
8.3.1 GHG Emissions
The underlying oil and gas activities, and the use of the produced hydrocarbons by consumers for energy, are sources of GHG emissions; however, it is not possible to meaningfully assess the contribution of such activities to global climate change in general, and in the arctic in particular, for several reasons.
• First, GHG emissions are not currently regulated under the Clean Air Act, under Alaska law, or under other applicable international, federal, state, or local regulatory programs. Accordingly, there is no existing project-specific database or source to reliably determine GHG emissions from past or present sources. There are, however, available programmatic GHG emissions estimates, such as the estimated contribution of OCS oil and gas activities to GHG emissions analyzed in the EIS for the 2007-2012 OCS leasing Program (MMS 2007).
• Second, the activity to which this proposal relates will be occurring in the future, from August 2011 to August 2016. It is an added and important element of significant complexity and speculation to attempt to predict what North Slope GHG emissions sources will exist during this
AOGA PETITION FOR PROMULGATION OF REGULATIONS 8-4 APRIL 2009 BEAUFORT SEA 2011-2016
time period, what regulatory programs may exist at that time, and what emissions may result from the existing sources as authorized under then-existing regulatory programs. To the extent that new requirements regulating GHG emissions are enacted, as is expected to occur prior to August 2012, any activities subject to these programs will, in the future, perform project-specific and site-specific air emissions analyses and modeling, and GHG emissions reduction and mitigation measures appropriate to the location, activity, and equipment will be developed as warranted.
• Third, current science and modeling cannot link individual actions that contribute to atmospheric carbon levels to specific responses of species or specific impacts to their habitats. Accordingly, the available scientific information does not enable us to establish a connection, let alone to assess the relative extent of the connection, between specific sources and locations of GHG emissions, and specific impacts to polar bears or walrus arctic habitats.
• Fourth, AOGA, as the petitioner is not an oil or gas operator and, accordingly, has no ownership, authority, obligation, right, or ability to take specific actions affecting GHG emissions during oil and gas operations in the future.
• Fifth, because USFWS is evaluating the effect of incidental take, and not approving the underlying oil and gas operations, the agency does not have discretionary authority under the MMPA to regulate GHG emissions.
• Sixth, the impacts of GHG emissions from energy consumption are well outside the scope of this proposed ITR and the authority of MMS under the MMPA. Seventh, and finally, the same or more GHG emissions would result from domestic consumption of oil and gas without North Slope oil and gas activity. Oil and gas is projected to remain a significant energy source during the five-year period of proposed regulations, and for the foreseeable future thereafter. Were oil and gas activity on the North Slope curtailed, most of the lost production would be replaced by a combination of imports, fuel switching, and increased onshore production, not by reductions in energy needs or consumption of oil. Any projected decrease in GHG emissions resulting from a reduction in consumption attributed to conservation measures would be offset by increases in GHG emissions resulting from transportation of foreign oil via tanker to domestic markets.
8.3.2 Effects of Climate Change on Oil and Gas Activities
It is not possible to predict from existing information the specific locations or extent of climate change on oil and gas activities for the Petition period. However, changing environments on the North Slope are expected to be a greater topic of discussion during the period of these regulations than during past regulatory periods.
Continuing recession of sea ice are likely to affect the distribution and abundance of polar bears throughout their range and a potential increased presence in nearshore areas (as discussed in Section 5.1.7), thereby creating the potential for more frequent bear-human encounters, with more frequent incidental take or more frequent use of intentional deterrence measures to deflect polar bears safely away from facilities and humans. Because of the many uncertainties associated with the pace and effects of climate change, it is not possible precisely or reliably predict to what extent an increase in interactions with polar bears may arise during the five-year period of the proposed ITR. However, with over 40 years of documented experience in conducting oil and gas operations within polar bear habitat, it is reliably expected that with proper training, management, and monitoring under the proposed ITR, the potential for adverse effects to polar bears and stocks from oil and gas activities will be minimized. Based upon the
AOGA PETITION FOR PROMULGATION OF REGULATIONS 8-5 APRIL 2009 BEAUFORT SEA 2011-2016
anticipated level of activity during the five-year period, the wide distribution and low density of polar bears, it is still reasonably expected that the number of incidental takes will be small and that such takes will involve non-lethal, short-term changes in behavior that do not have more than a negligible impact on individual bears or on the SB polar bear population.
Changes to weather and the related effects upon infrastructure and coastlines is not expected to alter the potential for incidental interactions or the expected intensity of such interactions with Pacific walrus in offshore open water areas. Pacific walrus are very uncommon in specified area and are not known to use coastal beaches or uplands of the North Slope where affected infrastructure may be located.
AOGA PETITION FOR PROMULGATION OF REGULATIONS 8-6 APRIL 2009 BEAUFORT SEA 2011-2016
9.0 ANTICIPATED IMPACT OF HABITAT LOSS OR MODIFICATION ON SPECIES
CFR § 18.27(d)(v) The anticipated impact of the loss of the habitat on the marine mammal populations involved.
Chapter 8 discussed the anticipated impact of oil and gas activity upon the habitat of polar bears and Pacific walrus. The chapter identified several potential losses or modifications to polar bear or walrus habitat that could result from oil and gas exploration or production activities in the proposed area of activity. For the polar bear, based on the broad geographic distribution, low density, and high mobility of polar bears; the small proportion of the total area of habitat potentially affected by oil and gas activities; and the short-term, temporary, and localized nature of oil and gas activities; combined with existing and future mitigation measures, we conclude that the oil and gas industry will have no more than a negligible effect on polar bear habitat. Further, we conclude that oil and gas activities will have no more than a negligible impact, if any, on the habitat of the walrus, as the Beaufort Sea is considered extralimital for the walrus.
Consequently, it is anticipated that due to the negligible loss of habitat as a result of oil and gas activities, there will be no more than a negligible impact on the SB polar bear population or Pacific walrus Alaskan stock.
AOGA PETITION FOR PROMULGATION OF REGULATIONS 9-1 APRIL 2009 BEAUFORT SEA 2011-2016
10.0 MITIGATION MEASURES
CFR § 18.27(d)(vi) The availability and feasibility (economic and technological) of equipment, methods, and manner of conducting such activity or other means of effecting the least practicable adverse impact upon the affected species or stocks, their habitat, and on their availability for subsistence uses, paying particular attention to rookeries, mating grounds, and areas of similar significance.
To mitigate potential impacts to polar bears and Pacific walrus, exploration, development, and production activities will be coordinated with the appropriate federal, state, and local regulatory agencies.
10.1 MITIGATION MEASURES
The following section lists the actions and measures the oil and gas industry has historically used to and may continue to implement in the future to reduce impacts or the risk of impacts on polar bears and walrus. Each operator will continue to coordinate with USFWS and others to develop and implement any additional measures, if needed:
• Operators designate a qualified individual or individuals to observe, record, and report the effects of their activities on polar bear and walrus.
• Operators develop a polar bear and walrus interaction plan and works with the USFWS to approve the plan prior to beginning any activities. Plans must be filed with USFWS and retained on site. The plans identify the following:
− The type of activity including when and where the activity will occur
− A food and waste management plan
− Personnel training materials and procedures
− Site at-risk locations and situations
− Snow management plan
− Polar bear and walrus observation and reporting procedures
− Polar bear and walrus avoidance and encounter procedures
• Operators must minimize the effect on subsistence uses. Each operator, to the extent practicable, will use methods and conduct activities to minimize adverse impacts to polar bears and walrus, their habitat, and their availability for subsistence uses.
• Operators will consult, as needed, with affected subsistence communities and marine mammal management groups to discuss potential conflicts with subsistence polar bear and walrus hunting.
• If community concerns suggest the activities may adversely impact subsistence uses of these species, a plan of cooperation will be developed by the operator to ensure activities will not interfere with subsistence hunting and adverse effects on the availability of polar bear or walrus will be minimized.
• Marine vessels will maintain a minimum operational separation distance as determined by the USFWS around any polar bears or walrus observed on land or ice, to the extent practicable.
AOGA PETITION FOR PROMULGATION OF REGULATIONS 10-1 APRIL 2009 BEAUFORT SEA 2011-2016
• Aircraft will maintain a minimum altitude as determined by the USFWS from hauled out walrus, to the extent practicable.
• Trained marine mammal observers (MMO) may be used for some marine activities. MMOs may be required to monitor impacts of activities on polar bear and walrus.
• Operators will identify the location of potential polar bear dens when conducting activities during the denning season in the coastal areas of the Beaufort Sea through the use of best available technology, such as FLIR imagery or polar bear scent-trained dogs.
• Operators will limit disturbance around known occupied dens by timing of activities. A minimum of 1.6 km (1 mi) exclusion buffer will surround known dens. If dens are occupied, this exclusion buffer will limit disturbance or operators will conduct activities after the female bears emerge from their dens. Extenuating circumstances will require a separate review on a case-by-case basis.
• At their own discretion, USFWS must be allowed to place an observer on site to monitor impacts of activities on polar bears.
• Offshore seismic exploration mitigation measures may include the following:
− Space activities to maintain a minimum distance as required by USFWS between activities to mitigate impacts to resting, feeding, and migrating walrus.
− Maintain an exclusion zone at and below the surface of the water within a radius defined by a 190-dB safety zone for polar bears and 180-dB safety zone for walrus from the center of the sound source.
− Monitor the exclusion zone using trained MMOs for avoidance and take behaviors.
− For multiple airgun arrays, ramp up procedures may be implemented.
10.2 SPILL PREVENTION
The Alaska Department of Environmental Conservation (ADEC) Division of Spill Prevention and Response (SPAR) is responsible for regulating oil and hazardous substance spills by preventing, responding to, and ensuring the cleanup. Each operator is required to submit a contingency plan that outlines their methods for preventing, responding to, and ensuring the cleanup. The following text summarizes the mission of SPAR from the ADEC website (http://www.dec.state.ak.us/spar/about.htm):
Prevention –ensures spill prevention through the review and approval of prevention plans for oil terminals, pipelines, tank vessels and barges, railroads, refineries, and exploration and production facilities; the underground storage tank spill prevention program; technical assistance to industry and the public; risk reduction measures; inspections; and education in proper spill prevention and response methods.
Preparedness –ensures response preparedness through the review and approval of oil discharge contingency plans; inspections; spill drills and exercises; partnerships with local communities and other state and federal agencies; pre-positioning of response equipment for local use; maintenance of statewide and regional spill response plans; and implementation of the Incident Command System for spill response.
AOGA PETITION FOR PROMULGATION OF REGULATIONS 10-2 APRIL 2009 BEAUFORT SEA 2011-2016
Response –ensures an effective response through the identification and rapid abatement of dangerous acute human exposures to hazardous substances; timely characterization and remediation of chronic health exposure risks from hazardous substance releases; mitigation of the effects of spills on the environment and cultural resources; and restoration of property value and usability through adequate cleanup.
The oil and gas industry considers spill prevention a vital part of typical operations. Regular maintenance, inspections, and accurate record keeping by trained personnel are integral. Details of each operators’ prevention programs are located in the contingency plans approved by ADEC. Contingency plans typically include, but are not necessarily limited to, details on the following:
• Prevention training programs • Substance abuse policy • Medical programs • Security programs • Well control and emergency shutdown procedures • Fluid transfer procedures • Operating requirements for exploration and production facilities • Storage tank requirements • Description of secondary containment • Facility piping corrosion program • Leak detection system monitoring • Discharge detection procedures
To provide an example of the prevention techniques, the following text provides information on prevention of a well blowout. Operators apply a rigorous multi-layer well control management system that has proven successful in preventing escalation of a well control incident to a blowout situation. These measures result in an extremely low probability of an uncontrolled well release. Mitigation measures are taken to ensure that oil is not released into the environment. Preventive layers are as follows:
• Layer I. Layer I includes proper well planning, risk identification, training, routine tests and drills on the rig (e.g., blowout preventer [BOP] tests, pit drills, and trip drills), which build a strong foundation.
• Layer II. Layer II includes early kick detection and timely implementation of kick response procedures. Continuous monitoring including the use of a Real Time Operations Center provides early kick detection. When a kick is detected, the general response is to immediately shut down the pumps, perform a flow check, shut in the well, and kill the well.
• Layer III. Layer III involves the use of mechanical barriers, including, but not limited to, BOPs, casing, and cement. Testing and inspections are performed to ensure competency.
• Layer IV. Layer IV represents relief well drilling, which would be implemented if a blowout were to occur, despite the first three layers of protection. Contingency plans include dynamic surface control measures and the methods of drilling a relief well.
10.3 Spill Response
The history of offshore operations around the world confirms that large spills are extremely rare events. As reported by NRC (2003), only 1 percent of the oil discharges in North American waters are related to
AOGA PETITION FOR PROMULGATION OF REGULATIONS 10-3 APRIL 2009 BEAUFORT SEA 2011-2016
the extraction of petroleum, and only a fraction of this is from drilling operations. There has never been an oil spill caused by a blowout from offshore exploration and production drilling in state and federal waters off Alaska or in the Canadian Arctic. Using the U.S. Coast Guard (USCG) classification, there have been no major spills (less than or equal to 2,381 barrels) from U.S. exploration or production platforms since 1973.
10.3.1 Oil Fate and Behavior in Arctic Waters
Spill response in ice conditions is different than spill response in open water. However, experience has shown that low temperatures and ice can enhance spill response and reduce the potential for environmental impacts under certain conditions. For example:
• Low air and water temperatures generally lead to higher oil viscosity and greater oil equilibrium thicknesses that result in reduced spreading rates and smaller impacted area. These beneficial effects greatly reduce the potential for direct oil contact with natural resources, while providing an opportunity for much higher oil encounter/removal rates using mechanical recovery and controlled in situ burning operations.
• Evaporation rates are reduced in cold temperatures and ice. As a result, the lighter and more volatile components remain for a longer time, thereby enhancing the ease with which the oil can be ignited.
• The regional presence of ice dampens wave action and often limits the fetch over which winds might otherwise create larger fully developed waves.
• During ice conditions, responders may operate with short-boom extensions and skimmers to maneuver among ice pieces and intercept oil in open areas.
• Ice can serve as a natural barrier to the spread of oil and help concentrate it for recovery with stationary skimmers dipped into discrete pockets of oil. The natural containment of oil against ice edges leads to thicker oil films that enhance the effectiveness of controlled in situ burning.
10.3.2 Spill Response Techniques
Detection and Monitoring
Tracking of an oil spill can be accomplished through airplane and helicopter surveys, FLIR surveys, GPS, and digital cameras. In addition, tracking buoys and various types of radar reflectors can be launched from vessels on location at the beginning of a spill and at appropriate intervals thereafter to help track the oil. Specialized ice-strengthened beacons have been used successfully for many years to track ice movements over an entire winter season throughout the polar basin.
Techniques for detecting and tracking oil under ice include drilling holes and trenches in ice, using Autonomous Underwater Vehicles (AUVs), or surface operated, portable Ground Penetrating Radar (GPR). Several GPR systems are capable of detecting and mapping oil under the ice surface. Alaska Clean Seas (ACS) recently (2006) acquired a GPR system and personnel are trained on its use and readings.
AOGA PETITION FOR PROMULGATION OF REGULATIONS 10-4 APRIL 2009 BEAUFORT SEA 2011-2016
Open Water Offshore Response
Mechanical Containment & Recovery
Oil skimmers are widely used to collect oil at the water surface and transfer it to a storage container. Skimmers are the most efficient method for recovering thick oil slicks. When safety considerations permit, mechanical recovery tactics include the use of broad-swath, open-apex booms to intercept oil and funnel it to skimming vessels equipped with large skimmers. Mechanical recovery is the first line of oil spill response widely accepted within the U.S. and abroad.
Controlled In Situ Burning
Controlled in situ burning provides a unique way to eliminate oil quickly, efficiently, and safely. Oil slicks contained to a thickness greater than 3 mm (<1 in) by fireproof booms, ice, or a shoreline can be ignited to burn oil off the water surface. On average, about 80 to 95 percent of oil volume is eliminated as gas, 1 to 10 percent as soot, and 1 to 10 percent remains as a residue. Residue is much less toxic than the original oil as most of the toxic components have low molecular weight and burn off first. Concentration of combustion products in the air is short lived and carefully monitored. Igniters can be deployed from a helicopter, eliminating the need for personnel or equipment exposure. In open water and light-ice conditions, controlled in situ burning with fire booms provides a valuable alternative strategy to mechanical recovery.
Relatively small burn areas can yield high elimination rates. For example, a 100 square ft (ft²) pool could burn at 10 barrels of oil per hour (boph) or more, and an 8,000 ft² pool (only 100 ft in diameter) could burn on the order of 1,000 boph or more. The consensus of research on spill response with controlled in situ burning of oil on open water and with solid and broken ice is that burning is a highly effective technique, with removal rates of 85 to 95 percent or more in most situations.
Dispersants as a Possible Future Arctic Response Option
Dispersants reduce the oil/water interfacial tension, thereby decreasing the energy needed for an oil slick to break into small particles and mix into the water column. Specially formulated products containing surface-active agents are sprayed (at concentrations of 1 to 5 percent by volume of the oil) from aircraft or boats onto an oil slick. Dispersed oil droplets are then colonized by bacteria and biodegrade naturally. Dispersants are used to rapidly remove large volumes of oil from the water surface therefore providing greater protection to birds and marine mammals, which otherwise may come into contact with surface oil. Dispersing oil rapidly decreases oil concentration and prevents an oil slick from reaching the shore.
There is growing evidence from scientific testing that dispersants could play a significant role in future arctic spill response plans. The application of chemical dispersants is recognized worldwide as an environmentally acceptable and highly efficient means of rapidly eliminating spilled oil offshore under the right conditions. Furthermore, numerous laboratory and field studies have demonstrated that a decision to use dispersants can provide a clear net environmental benefit compared to the impacts of not using the dispersant. Dispersants may provide a valuable response option when strong wind and sea conditions make mechanical cleanup and controlled in situ burn techniques unsafe and/or ineffective. Under these conditions the treatment of spilled oil with chemical dispersants is actually enhanced by the mixing energy provided by breaking waves that hinder other response operations. This advantage, combined with the potential to treat large areas quickly with aerial application systems, makes dispersants an essential tool for most offshore oil spill response organizations.
AOGA PETITION FOR PROMULGATION OF REGULATIONS 10-5 APRIL 2009 BEAUFORT SEA 2011-2016
Broken Ice Offshore Response
As ice concentrations increase, the containment lost through ice interference with conventional open water booms is replaced by the natural containment provided by the close proximity of individual ice floes. Even relatively thin ice can provide an effective barrier to oil spreading.
Light ice concentration may be addressed by use of Ice Deflection or Ice Management Techniques. Using vessels as physical barriers or prop wash from an icebreaker allows deflecting ice away from the spill site, thus creating a relatively open space where open water strategies can be used.
Mechanical Response in Broken Ice
As ice concentrations increase beyond very open drift conditions (10 to 30 percent), response strategies generally move toward smaller, more maneuverable vessels with side arms to continue to recover oil at reduced encounter rates for some time after operations with the larger systems have ceased. Continued operations with containment boom may become impractical. At this point, mechanical recovery can then continue with over-the-side skimmers (e.g., brush and rope mop) to access pockets of oil trapped between ice cakes and floes or in leads. In high ice concentrations, ice acts as a natural barrier preventing oil from spreading and maintaining it at a thickness suitable for mechanical recovery.
Controlled In Situ Burning in Broken Ice
Heavy ice concentrations can actually aid controlled in situ burning. The ice tends to dampen waves, reduce surface spreading, and increase slick thickness. Under these conditions, there is an increased potential for the accumulation of oil on water at thicknesses that can support sustained combustion. In this case, igniters can be deployed from a helicopter eliminating the need for personnel exposure to a dynamic ice field.
Dispersants in Broken Ice
Recent tests have demonstrated that dispersants are efficient even in cold waters. While ice floes tend to dampen the waves and decrease energy input needed for the dispersion, icebreaker prop wash can be used to break oil into small droplets and mix them into water column. This energy input is so powerful that the efficiency of oil dispersion is far greater than in the natural breaking wave conditions, even for weathered oils. The size of oil droplets dispersed with the prop wash is smaller than that of naturally dispersed oil, which facilitates natural biodegradation.
Response to Oil in Solid Ice
Oil under solid ice occupies a much smaller area than it would if allowed to spread on the water surface. Oil can be exposed through the use of icebreakers, drilling holes, or cutting trenches in the nearshore ice. Once oil is exposed, vacuum pumps, skimmers, and controlled in situ burning can be used in procedures similar to the broken ice scenario.
If oil is released onto the surface of solid stable ice, snow and ice berms and trenches are used to prevent oil from spreading. Vacuum tracks, sorbents, or manual cleanup can be used for the cleanup. Personnel from ACS are highly experienced in nearshore and solid ice clean up. A comprehensive manual of various response techniques can be found on ACS’ website at: http://www.alaskacleanseas.org/.
Nearshore Response
Response to offshore spills aims at recovering oil in the ocean and preventing it from reaching the shore. In the nearshore, shallow draft boats, as well as deflection and exclusion booms, are used to protect
AOGA PETITION FOR PROMULGATION OF REGULATIONS 10-6 APRIL 2009 BEAUFORT SEA 2011-2016
sensitive shoreline areas and collect oil in the designated locations. Then oil is collected using skimmers, vacuum tracks, sorbents, and manual labor.
Landfast ice that forms at the first signs of cold weather and is last to melt provides invaluable protection to the nearshore areas. It acts as a natural barrier concentrating oil and preventing it from reaching the shore. Mechanical response and in situ burning can be conducted at the ice edge using conventional techniques.
Spring Recovery
When oil accumulates under ice during the freeze-up, it can get quickly encapsulated into an ice sheet, which isolates oil from the environment. This protects wildlife from coming into contact with oil and prevents oil from weathering. Tracking buoys may be frozen into contaminated ice to monitor its location. In the springtime, when ice starts to melt, pools of encapsulated oil penetrate through the brine channels and form pools on top of the melting ice. Controlled in situ burning with ignition from helicopters can be used to treat these pools of oil. If a large amount of oil becomes exposed, mechanical recovery can be used in procedures similar to the broken ice scenario.
10.3.3 Wildlife Management
During oil spill response, every effort is made to minimize the potential for environmental damage and prevent wildlife from coming into contact with oil. A wildlife management plan will be developed and implemented, which may include wildlife monitoring, hazing, wildlife capture and stabilization, maintenance of subsistence levels, etc. These activities are conducted in close collaboration with the incident Unified Command, which includes Federal, State, and Local representatives. The USFWS is also included in this collaboration.
The oil and gas industry may follow the guidance of Annex G of the Alaska Regional Response Team (ARRT) Wildlife Protection Guidelines for Alaska (2002) and the USFWS Oil Spill Response Plan for Polar Bears in Alaska (USFWS 1999) in responding to an oil spill that could affect polar bears or their habitat. These policy documents both outline a three-tier strategy characterized by the following:
• Primary response for protecting polar bears from an oil spill is to prevent the oil from reaching sensitive areas such as denning sites, feeding sites, or areas where animals are concentrated. Known den sites should be avoided by all personnel at all times to minimize disturbance;
• Secondary response is to deter or haze polar bears from the area of the oil slick or contaminated habitat. This response is appropriate under all circumstances and may be incorporated with primary response activities. The degree of risk associated with the animal actually contacting oil before secondary response strategies are initiated should be considered. If the spill occurs when polar bears are believed to be present, an aerial survey should be conducted to locate potentially affected animals; and
• Tertiary response is the treatment of polar bears contaminated with oil. The components of tertiary response are the capture, handling, transport, treatment, holding, and release of polar bears. The tertiary response involving capture of polar bears may only be undertaken by the USFWS or with their authorization.
AOGA PETITION FOR PROMULGATION OF REGULATIONS 10-7 APRIL 2009 BEAUFORT SEA 2011-2016
10.3.4 Ongoing Research and Development of New Technologies
Oil companies spend millions of dollars every year to advance oil spill response capability in arctic and ice-infested waters. Some of the ongoing arctic research and development projects include the following:
• Use of icebreaker prop wash to facilitate oil dispersion in broken ice; recent tests have shown high effectiveness of this technique.
• New formulation of a dispersant that is more efficient even under cold temperatures and on viscous oils. It is more viscous than conventional dispersants and will float on the water surface together with a slick rather than dissolving into the water column.
• A Joint Industry Project (JIP) has been formed to address stakeholders concerns by studying the effect of dispersed oil on arctic marine organisms specific to the Beaufort and Chukchi Seas. This research will provide comprehensive information that will facilitate the Net Environmental Benefit Analysis by comparing the effect of use of dispersants to other response techniques.
• Ice deflection: a series of tests were conducted to demonstrate how vessels can be used to deflect ice away from the response operations and create an open water area where conventional response techniques can work with greater efficiency.
• Assess feasibility of Nuclear Magnetic Resonance Radar to detect oil under ice.
• A comprehensive, ongoing (2007-2009) JIP managed through SINTEF Norway (a Scandinavian research organization), is aimed at developing improved arctic spill response techniques. Several projects are a part of this effort:
− Feasibility of using airborne radar with sufficient power and resolution to detect and map oil trapped under ice from a low-flying helicopter. This project also evaluated the capabilities of different remote sensing systems such as laser fluorosensor, GPR, ultraviolet/infrared (UV/IR), side-looking airborne radar (SLAR), radar satellites, and enhanced marine radar to detect and map oil in a variety of ice conditions.
− Improve the efficiency of mechanical recovery in broken ice. Improve, “winterize”, and test in the field state-of-the-art skimmer designs.
− Analyze weathering of oil in ice and snow and evaluate feasibility of controlled in situ burning under variable response conditions.
− Use of herders to facilitate controlled in situ burning. “Herder” is a chemical similar to dispersant that reduces surface tension of water. When applied in small quantities around the edges of a slick, it makes an oil slick contract and increases its thickness several fold. Controlled in situ burning can then be used on this herded slick. Recent tests show that herders work well in calm water and may be used in a broken ice field where ice concentration prevents use of booms, but is not high enough to contain oil to a desired thickness.
− Analyze dispersant “window of opportunity” and develop new application equipment that would allow targeted application of dispersant between ice floes avoiding spraying dispersant on clean ice.
− Develop a Generic Arctic Spill Response Guide summarizing available information on feasibility of response techniques.
AOGA PETITION FOR PROMULGATION OF REGULATIONS 10-8 APRIL 2009 BEAUFORT SEA 2011-2016
− Conduct field tests to validate JIP findings in a real arctic environment in broken ice.
AOGA PETITION FOR PROMULGATION OF REGULATIONS 10-9 APRIL 2009 BEAUFORT SEA 2011-2016
11.0 MONITORING AND REPORTING
CFR § 18.27(d)(vii) Suggested means of accomplishing the necessary monitoring and reporting that will result in increased knowledge of the species through an analysis of the level of taking or impacts and suggested means of minimizing burdens by coordinating such reporting requirements with other schemes already applicable to persons conducting such activity.
The following section lists the monitoring and reporting measures the oil and gas operators may undertake to increase the knowledge of the species and monitor potential impacts of activities.
11.1 MONITORING
• Monitoring plans are site specific and dependent on location and timing of activity relative to the habitat (den sites, travel corridors, and food sources).
• Monitoring plans document when and how polar bears and walrus are encountered, the number encountered, and their behavior.
• All sightings of polar bears and walrus must be recorded for all exploration, development, and production activities, including seismic. To the extent possible, group size, age, sex, reaction, duration of interaction, and closest approach to activity will be recorded.
• Polar bear monitors will be required if polar bears are known to frequent the area or known polar bear dens are present.
11.2 REPORTING
• Each operator must submit an “after action monitoring report” to the USFWS Alaska Regional Director, Marine Mammals Management Office for exploratory and development activities within 90 days of completion of the activity. For production activities, each operator will submit an annual report for the preceding year’s activities. The reports must include the following information:
− Dates and times of activities
− Dates and locations of polar bears and walrus activities related to monitoring activities
− Results of monitoring activities including an estimated level of take
− Dates and locations of polar bear and walrus activities related to operation activity when the sightings occurred
• In the event a bear is deterred, the operator must submit a report within 24 hours to the USFWS Alaska Regional Director, Marine Mammals Management Office.
AOGA PETITION FOR PROMULGATION OF REGULATIONS 11-10 APRIL 2009 BEAUFORT SEA 2011-2016
12.0 COORDINATION OF RESEARCH EFFORTS
CFR § 18.27(d)(viii) Suggested means of learning of, encouraging, and coordinating research opportunities, plans and activities relating to reducing such incidental taking from such specified activities, and evaluating its effects.
To minimize the potential for impacts to the species, stocks, and subsistence use of polar bears and walrus, all oil and gas activities will be conducted in accordance with all federal, state, and local regulations. Additionally, all operators will continue to cooperate with USFWS and other appropriate federal agencies (i.e., MMS, BLM, NMFS), the State of Alaska, NSB, the potentially affected communities, and other monitoring programs to coordinate research opportunities and assess all measures than can be taken to eliminate or minimize any impacts from these activities.
The operators will also cooperate with marine mammal researchers in the Beaufort Sea area in sharing data on polar bears and walrus and other marine mammal species that occur in the project area. This information will also be shared with other relevant governmental and private groups conducting studies. The operators will also continue to support research to further the knowledge of the species and interactions with oil and gas activities. Recent research activities supported by operators include:
• Acoustic monitoring of construction and operation noise associated with oil and gas exploration and production, both underwater and airborne.
• Hearing studies on polar bears.
• Aerial and vessel surveys to determine distribution and abundance of species.
• Satellite tagging of species to determine distribution and behavior.
• Oceanographic sampling to determine prey availability and habitat associations for walrus.
• FLIR surveys to identify den sites.
AOGA PETITION FOR PROMULGATION OF REGULATIONS 12-1 APRIL 2009 BEAUFORT SEA 2011-2016
13.0 REFERENCES
Aars, J., N. J. Lunn, and A. E. Derocher, editors. 2006. Polar Bears: Proceedings of the Fourteenth Working Meeting of the IUCN/SSC Polar Bear Specialists Group. International Union for Conservation of Nature and Natural Resources, Gland, Switzerland. 189 pp.
Aerometric, Inc. 2007. Calculation of oil and gas activity area. Provided to BP Explorations Alaska and ConocoPhillips Alaska.
Alaska Department of Fish and Game (ADFG). 2001. Community Profile Database. Version 3.12. Available: http://www.subsistence.adfg.state.ak.us/geninfo/publctns/cpdb.cfm. ADF&G. (May 2007).
Alaska Regional Response Team (ARRT). 2002. Alaska Federal/State Preparedness Plan for Response to Oil and Hazardous Substance Discharges/Releases (Unified Plan, Volume I), Annex G. Wildlife Protection Guidelines for Alaska, Alaska Regional Response Team, Wildlife Protection Working Group. Revision 4–June 4, 2002. 176 pp.
Amstrup, S.C. 1993. Human disturbances of denning polar bears in Alaska. Arctic 46: 246-250.
Amstrup, S. C. 1995. Movements, distribution, and population dynamics of polar bears in the Beaufort Sea. Ph.D. Dissertation. University of Alaska Fairbanks, Fairbanks, Alaska. 299 pp.
Amstrup, S.C. 2003. Polar bear, Ursus maritimus. In: G.A. Feldhamer, B.C. Thompson, and J.A. Chapman, eds. Wild mammals of North America: Biology, Management, and Conservation. John Hopkins University Press, Baltimore.
Amstrup, S.C. and C. Gardner. 1994. Polar bear maternity denning in the Beaufort Sea. Journal of Wildlife Management 58: 1–10.
Amstrup, S. C. and D. DeMaster. 1988. Polar Bear. Selected Marine Mammals of Alaska, p 39-56.
Amstrup, S.C. and G.M. Durner. 1995. Survival rates of radio-collared female polar bears and their dependent young. Canadian Journal of Zoology 73: 1312–22.
Amstrup, S.C, .B.G. Marcot, and D.C. Douglas. 2007. Forecasting the rangewide status of polar bears at selected times in the 21st century. USGS Alaska Science Center, Anchorage, Administrative Report.
Amstrup, S.C., G.M. Durner, I. Stirling, N.J. Lunn, and F. Messier. 2000. Movements and distribution of polar bears in the Beaufort Sea. Canadian Journal of Zoology 78: 948–66.
Amstrup. S.C., G.M. Durner, I. Stirling, and T.L. McDonald. 2005. Allocating harvests among polar bear stocks in the Beaufort Sea. Arctic 58: 247–259.
AOGA PETITION FOR PROMULGATION OF REGULATIONS 13-1 APRIL 2009 BEAUFORT SEA 2011-2016
Amstrup, S. C., I. Stirling, and J.W. Lentfer. 1986. Past and present status of polar bears in Alaska. Wildlife Society Bulletin 14: 241–254.
Amstrup, S.C., I. Stirling, T.S. Smith, C. Perham, and G.W. Thieman. 2006. Recent observations of intraspecific predation and cannibalism among polar bears in the Southern Beaufort Sea. Polar Biology doi 10.1007/S00300-006-0142-5.
Amstrup, S.C., T.L. McDonald, and G.M. Durner. 2004. Using satellite radio-telemetry data to delineate and manage wildlife populations. Wildlife Society Bulletin 32: 661–679.
Angliss, R. P. and R. B. Outlaw. 2008. Alaska Marine Mammal Stock Assessments. 2007. U.S. Department of Commerce, NOAA Technical Memorandum.NMFS-AFSC-180, 252
Australian Maritime Safety Authority (AMSA). 2002. The Effects of Maritime Oil Spills on Wildlife including Non-Avian Marine Life. Internet website: http://www.amsa.gov.au/Marine_Environment_Protection/National_Plan/General_Information/Oiled_Wildlife/Oil_Spill_Effects_on_Wildlife_and_Non-Avian_Marine_Life.asp#0gens
Best, R.C. 1985. Digestibility of ringed seals by the polar bear. Canadian Journal of Zoology 63: 1033–1036.
Blackwell, S.B., J.W. Lawson, and M.T. Williams. 2004a. Tolerance by ringed seals (Phoca hispida) to impact pipe-driving and construction sounds at an oil production island. Journal of the Acoustical Society of America 115: 2346–2357.
Blackwell, S.B., C.R. Greene Jr., and W.J. Richardson. 2004b. Drilling and operational sounds from an oil production island in the ice-covered Beaufort Sea. Journal of the Acoustical Society of America 116: 3199–3211.
Blix, A.S. and J.W. Lentfer. 1979. Modes of thermal protection in polar bear cubs: at birth and on emergence from the den. American Journal of Physiology 236: 67–74.
Blix, A.S. and J.W. Lentfer. 1992. Noise and vibration levels in artificial polar bear dens as related to selected petroleum exploration and developmental activities. Arctic 45: 20–24.
Boesch, D.F. and N.N. Rabalais. 1987. Long-term Environmental Effects of Offshore Oil and Gas Development. New York, NY: Elsevier Applied Science, 1987. 708 pp.
Born, E.W. 2001. Reproduction in female Atlantic walrus (Odobenus rosmarus rosmarus) from north-western Greenland. Journal of Zoology (London) 255: 165–174.
Born, E.W., Ø. Wiig, and J. Thomassen. 1997. Seasonal and annual movements of radio collared polar bears (Ursus maritimus) in NE Greenland. Journal of Marine Systems 10: 67–77.
Born, E.W., S. Rysgaard, G. Ehlmé, M. Sejr, M. Acquarone, and N. Levermann. 2003. Underwater observations of foraging free-living Atlantic walrus (Odobenus rosmarus rosmarus) and estimates of their food consumption: Polar Biology 26: 348–357.
AOGA PETITION FOR PROMULGATION OF REGULATIONS 13-2 APRIL 2009 BEAUFORT SEA 2011-2016
Bowles, A.E. 2008. Personal communication from Dr. Ann Bowles, Senior Research Biologist, Hubbs-Sea World Research Institute to Sheyna Wisdom, Senior Biologist, URS Corporation. November 10, 2008.
BP Exploration Alaska Inc. (BPXA). 2008. 2007 Polar Bear Monitoring Report Badami, Endicott, Milne Point, Northstar, and Prudhoe Bay. Report to U.S. Fish and Wildlife Service Anchorage, Alaska 14 pp.
Braund, S.R., T.P. Holmes, J.A. Kruse, L. Moorehead, E. Witten, D.C. Burnham, and S. Stocker. 1989. North Slope subsistence study Barrow, 1988. Report from Stephen R. Braund & Associates, Anchorage, AK, for U.S. Minerals Management Service, Anchorage, AK. 193 pp.
Bureau of Land Management (BLM). 2006a. Final Environmental Assessment for FEX LP Winter Drilling Program for 2006-2008. Prepared by BLM. Internet website: http://www.blm.gov/pgdata/etc/medialib/blm/ak/aktest/energy/egy_maps.Par.94059.File.dat/fex_npra_ea_final.pdf
BLM. 2006b. Final Environmental Assessment for ConocoPhillips Alaska Inc. Winter Drilling Program for 2006-2011. Internet website: http://www.blm.gov/pgdata/etc/medialib/blm/ak/aktest/energy/egy_maps.Par.25037.File.dat/cpai_ea_final.pdf.
Burgess, W.C. and C.R. Greene, Jr. 1999. Physical Acoustics Measurements. In: W.J. Richardson (ed.), Marine mammal and acoustical monitoring of Western Geophysical’s open-water seismic program in the Alaskan Beaufort Sea, 1998. LGL Rep. TA2230-3. Report from LGL Ltd., King City, Ont., and Greeneridge Sciences Inc., Santa Barbara, CA, for Western Geophysical, Houston, TX, and NMFS., Anchorage, AK, and Silver Spring, MD. 390 p.
Chadwick, V.J. and A.S. Fischbach. 2008. Pacific walrus response to Arctic sea ice losses. USGS fact sheet 3041., 6 pp.
Department of Energy (DOE). 2007. Alaska North Slope Oil and Gas: A Promising Future or an Area in Declining. Report: DOE/NETL0-2007-1280. Prepared by National Energy Technology Laboratory. Internet website: http://www.netl.doe.gov/technologies/oil-gas/publications/EPreports/ANSSummaryReportFinalAugust2007.pdf
Derocher, A.E. and I. Stirling. 1992. The population dynamics of polar bears in Western Hudson Bay. In: McCullough, D.R. and R.H. Barrett, eds. Wildlife 2001: Populations. Elsevier Applied Science, London. Pages 1150–1159.
Derocher, A. E. and I. Stirling. 1996. Aspects of survival in juvenile polar bears. Canadian Journal of Zoology 74: 1246–1252.
Derocher, A.E. and Ø. Wiig. 1999. Infanticide and cannibalism of juvenile polar bears (Ursus maritimus) in Svalbard. Arctic 52: 307–310.
Derocher, A. E., D. Andriashek, and I. Stirling. 1993. Terrestrial foraging by polar bears during the ice-free period in western Hudson Bay. Arctic 46: 251–254.
AOGA PETITION FOR PROMULGATION OF REGULATIONS 13-3 APRIL 2009 BEAUFORT SEA 2011-2016
Derocher, A.E., N.J. Lunn, and I. Stirling. 2004. Polar bears in a warming climate. Integrative and Comparative Biology 44: 163–176.
Derocher, A.E., Ø. Wiig, and G. Bangjord. 2000. Predation of Svalbard reindeer by polar bears. Polar Biology 23: 675–678.
Dick, T.A. and M. Belosevic. 1978. Observations on a Trichinella spiralis isolate from a polar bear. Journal of Parasitology 64: 1143–45.
Discovery of Sound in the Sea. 2008. Website developed by University of Rhode Island's Office of Marine Programs in partnership with Marine Acoustics, Inc. of Newport, RI. Internet website: http://www.dosits.org/index.htm.
Durner, G.M., D.C. Douglas, R.M. Nielson, S.C. Amstrup, and T.L. McDonald. 2007. Predicting the future distribution of polar bear habitat in the polar basin from resource selection functions applied to 21st century general circulation model projections of sea ice. USGS Administrative Report, Reston, Virginia. 55 pp.
Durner, G.M., S.C. Amstrup, and A.S. Fischbach. 2003. Habitat characteristics of polar bear terrestrial maternal den sites in northern Alaska. Arctic 561: 55–62.
Durner, G.M., S.C. Amstrup, R. Nielson, and T. McDonald. 2004. Using discrete choice modeling to generate resource selection functions for female polar bears in the Beaufort Sea. In: S. Huzurbazar (ed.). Resource Selection Methods and Applications: Proceedings of the 1st International Conference on Resource Selection, 13–15 January 2003, Laramie, Wyoming. p 107–120.
Eberhardt, L.L. 1985. Assessing the dynamics of wild populations. Journal of Wildlife Management 49: 997–1012.
Etkin, D.S. 1997. The Impact of Oil Spills on Marine Mammals, OSIR Report 13 March 1997 Special Report.
Estes, J.A. and J.R. Gilbert. 1978. Evaluation of an aerial survey of Pacific Walruses (Odobenus rosmarus divergens). Journal of the Fisheries Research Board of Canada 35: 1130–1140.
Fay, F.H. 1974. The role of ice in the ecology of marine mammals of the Bering Sea. In: Hood, D.W., and Kelley, E.J. (eds.). Oceanography of the Bering Sea: Fairbanks, University of Alaska, Institute of Marine Science, Occasional Publication No. 2, p. 383.
Fay, F.H. 1982. Ecology and Biology of the Pacific Walrus (Odobenus rosmarus divergens). North American Fauna 74. U.S. Fish and Wildlife Service, Washington, DC., 279 pp.
Fay, F.H. 1985. Odobenus rosmarus. The American Society of Mammalogists.
Fay, F. H. and B. P. Kelly. 1980. Mass natural mortality of walrus (Odobenus rosmarus) at St. Lawrence Island, Bering Sea, autumn 1978. Arctic 33: 226–245.
AOGA PETITION FOR PROMULGATION OF REGULATIONS 13-4 APRIL 2009 BEAUFORT SEA 2011-2016
Fay, F.H., B.P. Kelly, and J.L. Sease. 1989. Managing the exploitation of Pacific walrus: a tragedy of delayed response and poor communication. Marine Mammal Science 5: 1–16.
Fay, F.H., B.P. Kelly, P.H. Gehnrich, J.L. Sease, and A.A. Hoover. 1984. Modern populations, migrations, demography, trophics, and historical status of the Pacific walrus. Final Report R.U. #611. NOAA Outer Continental Shelf Environmental Assessment Program, Anchorage AK., 142 pp.
Feldhamer, G.A., B.C. Thompson, and J.A. Chapman. 2003. Wild Mammals of North America: Biology, Management, and Conservation. Baltimore, Maryland, Johns Hopkins University Press, 2003. 1216 pp.
Ferguson, S. H., M. K. Taylor, and F. Messier. 1997. Space use by polar bears in and around Auyuittuq National Park, Northwest Territories, during the ice-free period. Canadian Journal of Zoology 75: 1585–1594.
Ferguson, S.H., M.K. Taylor, E.W. Born, A. Rosing-Asvid, and F. Messier. 2001. Activity and movement patterns of polar bears inhabiting consolidated versus active pack ice. Arctic 54: 49–54.
Fischbach, A.S., S.C. Amstrup, and D. Douglas. 2007. Landward and eastern shift of Alaska polar bear denning associated with recent sea ice changes. Polar Biology 30: 1395–1405.
Frost, K. J., L. F. Lowry, and J. J. Burns. 1982. Distribution of marine mammals in the coastal zone of the Bering Sea during summer and autumn. U. S. Dept. Commer., NOAA, OCSEAP Final Rep. 20 (1983):365-561.
Furgal, C. M., S. Innes, and K. M. Kovacs. 1996. Characteristics of ringed seal, Phoca hispida, subnivean structures and breeding habitat and their effects on predation. Canadian Journal of Zoology 74: 858–874.
Garner, G.W., S.T. Knick, and D.C. Douglas. 1990. Seasonal movements of adult female polar bears in the Bering and Chukchi Seas. International Conference on Bear Research and Management 8: 219–226.
Gilbert, J.R. 1999. Review of previous Pacific walrus surveys to develop improved survey designs. In: Garner, G.W., S.C. Amstrup, J.L. Laake, B.F.J. Manly, L.L. McDonald, and D.G. Robertson (eds.), Marine Mammal Survey and Assessment Methods. A. A. Balkema, Rotterdam, 287 pp.
Gilbert, J.R., G.A. Fedoseev, D. Seagars, E. Razlivalov, and A. LaChugin. 1992. Aerial census of Pacific walrus, 1990. USFWS R7/MMM Technical Report 92-1, 33 pp.
Gjertz, I. 1990. Walrus predation of seabirds. Polar Record 26: 317.
Greene, C.R., Jr. 1987. Characteristics of oil industry dredge and drilling sounds in the Beaufort Sea. Journal of the Acoustical Society of America 82: 1315–1324.
AOGA PETITION FOR PROMULGATION OF REGULATIONS 13-5 APRIL 2009 BEAUFORT SEA 2011-2016
Greene, C.R., Jr. 1997. Physical acoustics measurements. In: W.J. Richardson (ed.), Northstar Marine Mammal Marine Monitoring Program, 1996. Rep. from LGL Ltd., King City, Ont., and Greeneridge Sciences Inc., Santa Barbara, CA for BP Explor. (Alaska) Inc., Anchorage, AK, and U.S. Nat. Mar. Fish. Serv., Anchorage AK, for BP Explor. (Alaska) Inc., Anchorage, AK. 22 p.
Greene, C.R., Jr. 1998. Underwater acoustic noise and transmission loss during summer at BP’s Liberty prospect in Foggy Island Bay, Alaskan Beaufort Sea. Rep. from Greeneridge Sciences Inc., Santa Barbara, CA, and LGL Ltd., , King City Ont., for BP Explor. (Alaska) Inc., Anchorage, AK. 39p.
Greene, C.R., Jr., M.W. McLennan, T.L. McDonald, and W.J. Richardson. 2001. Acoustic monitoring of bowhead whale migration, autumn 2000. In: Richardson, W.J. and M.T. Williams (eds.) Monitoring of industrial sounds, seals, and whale calls during construction of BP’s Northstar Oil Development, Alaskan Beaufort Sea, 2000. (Draft, April 2001) Rep. from LGL Ltd., King City, Ont., and Greeneridge Sciences Inc., Santa Barbara, CA, for BP Explor. (Alaska) Inc., Anchorage, AK, and Nat. Mar. Fish. Serv., Anchorage, AK, and Silver Spring, MD. LGL Rep. TA2431-2.
Greene, C.R., Jr., S.B. Blackwell, and M.W. McLennan. 2008. Sounds and vibrations in the frozen Beaufort Sea during gravel island construction. Journal of the Acoustical Society of America 123: 687−695.
Hammill, M.O. and T.G. Smith. 1991. The role of predation in the ecology of the ringed seal in the Barrow Strait, Northwest Territories, Canada. Marine Mammal Science 7: 123−135.
Hansson, R. and J. Thomassen. 1983. Behaviour of polar bears with cubs of the year in the denning area. International Conference on Bear Research and Management 5: 246−254.
Harington, C.R. 1968. Denning habits of the polar bear (Ursus maritimus). Report Series 5, Canadian Wildlife Service, Ottawa, Canada.
Hills, S. 1992. The effect of spatial and temporal variability on population assessment of Pacific walrus. University of Maine, Orono. Dissertation. 220 pp.
Hills, S. and J.R. Gilbert. 1994. Detecting Pacific walrus population trends with aerial survey - a review. Transactions North American Wildlife and Natural Resource Conference.
Hunter, C.M., H. Caswell, M.C. Runge, S.C. Amstrup, E.V. Regehr, and I. Stirling. 2007. Polar bears in the Southern Beaufort Sea II: Demography and population growth in relation to sea ice conditions. USGS Alaska Science Center, Anchorage, Administrative Report.
Hurst, R.J. and N.A. Øritsland. 1982. Polar bear thermoregulation: effect of oil on the insulative properties of fur. Journal of Thermal Biology 7: 201−208.
International Panel on Climate Change (IPCC). 2007. Fourth Assessment Report of the Intergovernmental Panel on Climate Change. Internet website: http://www.ipcc.ch/ipccreports/ar4-syr.htm.
Ireland, D.S., D.W. Funk, R. Rodrigues, and W.R. Koski (eds.). 2008. Joint monitoring program in the Chukchi and Beaufort Seas, July-November 2007. LGL Alaska Report P971-1,
AOGA PETITION FOR PROMULGATION OF REGULATIONS 13-6 APRIL 2009 BEAUFORT SEA 2011-2016
Report from LGL Alaska Research Associates, Inc. , LGL Ltd., JASCO Research, Ltd., and Greeneridge Sciences, Inc., for Shell Offshore, Inc. ConocoPhillips Alaska, Inc. and National Marine Fisheries Service, U.S. Fish and Wildlife Service. 445 p. plus Appendices.
Iverson, S.J., I. Stirling, and S.L.C. Lang. 2006. Spatial and temporal variation in the diets of polar bears across the Canadian Arctic: indicators of change in prey populations and environment. In: Boyd, I.S. Wanless, and C.J. Camphuysen (eds.). Top predators in marine ecosystems. Cambridge University Press. Pages 98-117.
Jefferson, T. A., S. Leatherwood, and M. A. Wobber. 1993. Marine mammals of the world. FAO Species Identification Guide. Rome, 320 p.
Kastelein, R.A., P. Mosterd, B. van Santen, M. Hagedoorn, and D. de Haan. 2002. Underwater audiogram of a Pacific walrus (Odobenus rosmarus) measured with narrow-band frequency-modulated signals. Journal of the Acoustical Society of America 112: 2173-2182.
Kastelein, R.A., P. Mosterd, C.L. van Ligtenberg, and W.C. Verboom. 1996. Aerial hearing sensitivity tests with a male Pacific walrus (Ododbenus rosmarus), in the free field and with headphones. Aquatic Mammals 22: 81–93.
Ketten, D. 1998. Marine mammal auditory systems: a summary of audiometric and anatomical data and its implications for underwater acoustic impacts. NOAA-TM-NMFS-SWFSC-256. 74p.
Kostyan, E.Y. 1954. New data on the reproduction of the polar bear. Zoologicheskii Zhurnal 33: 207–15.
Larsen, T. 1985. Polar bear denning and cub production in Svalbard, Norway. Journal of Wildlife Management 49: 320–326.
Larsen, T. and B. Kjos-Hanssen. 1983. Trichinella sp. in polar bears from Svalbard, in relation to hide length and age. Polar Research 1: 89–96.
Lentfer, J.W. and R.J. Hensel. 1980. Alaskan polar bear denning. International Conference on Bear Research and Management 4: 101–108.
LGL and Greeneridge. 1996. Northstar Marine Mammal Monitoring Program, 1995: Baseline surveys and Retrospective analyses of marine mammal and ambient noise data form the Central Alaskan Beaufort Sea. Rep. from LGL Ltd., King City, Ont., and Greeneridge Sciences Inc., Santa Barbara, CA, for BP Exploration (Alaska) Inc., Anchorage, AK. 104 p.
LGL Limited, Greeneridge Sciences Inc., Bioacoustics Research Program Cornell University, and Bio-Wave, Inc. 2007. Joint Monitoring Program in the Chukchi and Beaufort Seas, July – November 2006. Prepared for Shell Offshore Inc., ConocoPhillips Alaska Inc., and GX Technology. November 2007.
AOGA PETITION FOR PROMULGATION OF REGULATIONS 13-7 APRIL 2009 BEAUFORT SEA 2011-2016
Lunn, N.J. and G.B. Stenhouse. 1985. An observation of possible cannibalism by polar bears (Ursus maritimus). Canadian Journal of Zoology 63: 1516-1517.
MacGillivray, A. O., D. E. Hannay, R. G. Racca, C. J. Perham, S. A. Maclean, and M. T. Williams. 2002. Assessment of industrial sounds and vibrations received in artificial polar bear dens, Flaxman Island, Alaska. ExxonMobil Production Co. Draft Report by LGL Alaska Research Associates, Inc., Anchorage, AK, and JASCO Research Ltd., Victoria, BC 60 pp.
Mauritzen, M., A.E. Derocher, and Ø. Wiig. 2001. Space-use strategies of female polar bears in a dynamic sea ice habitat. Canadian Journal of Zoology 79: 1704-1713.
Mauritzen, M., A.E. Derocher, O. Pavlova., and Ø. Wiig. 2003. Female polar bears, Ursus maritimus, on the Barents Sea drift ice: walking the treadmill. Animal Behaviour 66: 107–113.
Miles, P.R., C.I. Malme, and W.J. Richardson. 1987. Prediction of drilling site-specific interaction of industrial acoustic stimuli and endangered whales in the Alaskan Beaufort Sea. BBN Rep. 6509; OCS Study MMS 87-0084. Report from BBN Labs Iunc. and LGL Ltd. for Minerals Management Service, Anchorage. 341 pp.
Miller, G.W., V.D. Moulton, R.A. Davis, M. Holst, P. Millman, A. MacGillivray, and D. Hannay. 2005. Monitoring seismic effects on marine mammals--southeastern Beaufort Sea, 2001-2002. p. 511-542 In : S.L. Armsworthy, P.J. Cranford and K. Lee (eds.), Offshore oil and gas environmental effects monitoring/Approaches and technologies. Battelle Press, Columbus, OH.
Minerals Management Service (MMS). 1990. Beaufort Sea planning area oil and gal lease sale 124. Final Environmental Impact Statement. Minerals Management Service document 90-0063, Alaska OCS Region, Anchorage, AK.
MMS. 2003. Beaufort Sea Multiple Sale (186, 195, 202, 203) Final Environmental Impact Statement.
MMS. 2006. Outer Continental Shelf Oil and Gas Activities Leasing Program: 2007-2012. Final Environmental Impact Statement.
Moulton, V.D. and J.W. Lawson. 2002. Seals, 2001. In: W.J. Richardson and J.W. Lawson (eds.). Marine Mammal Monitoring of Western Geco's Open-water Seismic Program in the Alaskan Beaufort Sea, 2001. LGL Rep. TA2564-4. Rep. from LGL Ltd., King City, Ont., for WesternGeco LLC, Anchorage, AK; BP Exploration (Alaska) Inc., Anchorage, AK; and NMFS, Anchorage, AK, and Silver Spring, 46 MD. 95 p.
Moulton, F. D., W. J. Richardson, T. L. McDonald, R. E. Elliott, and M. T. Williams. 2002. Factors influencing local abundance and haulout behavior of ringed seals (Phoca hispida) on land fast ice of the Alaskan Beaufort Sea. Canadian Journal of Zoology 80: 1900-1917.
AOGA PETITION FOR PROMULGATION OF REGULATIONS 13-8 APRIL 2009 BEAUFORT SEA 2011-2016
Nachtigall, P.E., A.Y. Supin, M. Amundin, B. Röken, T. Møller, T. Aran Mooney, K.A. Taylor, and M. Yuen. 2007. Polar bear Ursus maritimus hearing measures with auditory evoked potentials. Journal of Experimental Biology 210: 116–1122.
National Research Council (NRC). 2003. Ocean Noise and Marine Mammals. The National Academies Press, Washington, D.C. 192 pp.
National Snow and Ice Data Center. 2007. Available at http://wwwl.nsidc.org.
Nelson, C.H. and K.R. Johnson. 1987. Whales and walrus as tillers of the sea floor: Scientific American 256: 112–117.
Nelson, C.H., R.L. Phillips, J. McRea, Jr., J.H. Barber, M.W. McLaughlin, and J.L. Chin. 1994. Gray whale and Pacific walrus benthic feeding grounds and sea floor interaction in the Chukchi Sea: U.S. Geological Survey, Menlo Park, California, Technical report for Minerals Management Service/IA No. 14157, OCS Study MMS 93-0042, 51 pp.
Nelson, R.K. 1981. Harvest of the sea: Coastal subsistence in modern Wainwright. Rep. of the North Slope’s Coastal Management Program. North Slope Borough, Barrow, AK.
Oliver, J.S., P.N. Slattery, E.F. O’Connor, and L.F. Lowry. 1983. Walrus, Odobenus rosmarus, feeding in the Bering Sea—A benthic perspective. Fishery Bulletin 81: 501–512.
Øritsland, N. A., F.R. Engelhardt, F.A. Juck, R.J. Hurst, and P.D. Watts. 1981. Effect of crude oil on polar bears, p. 1-268 in Environmental Studies 24. Indian and Northern Affairs Canada, Ottawa, Canada.
Peeke, H. V. S. and Petrinovich, L. (Eds.). 1984. Habituation, Sensitization, and Behavior. New York: Academic Press. 471 pp.
Ramsay, M.A. and I. Stirling. 1988. Reproductive biology and ecology of female polar bears (Ursus maritimus). Journal of Zoology (London) 214: 601–634.
Ramsay, M.A. and I. Stirling. 1990. Fidelity of female polar bears to winter-den sites. Journal of Mammalogy 71: 233–236.
Ramsay, M.A. and R.L. Dunbrack. 1986. Physiological constraints on life history phenomena: the example of small bear cubs at birth. American Naturalist 127: 735–743.
Rausch, R.L. 1970. Trichinosis in the Arctic. Pages 348–73 in S.E. Gould, ed. Trichinosis in man and animals. C.C. Thomas, Springfield, Illinois, USA.
Regehr, E.V., C.M. Hunter, H. Caswell, S.C. Amstrup, and I. Stirling. 2007. Polar bears in the southern Beaufort Sea I: survival and breeding in relation to sea ice conditions, 2001-2006. U.S. Dept. of the Interior, U.S. Geological Survey Administrative Report, Reston, Virginia. 45 pp.
Regehr, E.V., S.C. Amstrup, and I. Stirling. 2006. Polar Bear Population Status in the Southern Beaufort Sea. USGS Alaska Science Center, Anchorage, Open File Report 1337.
AOGA PETITION FOR PROMULGATION OF REGULATIONS 13-9 APRIL 2009 BEAUFORT SEA 2011-2016
Richardson, W.J., C.R. Greene, Jr., C.I. Malme, and D.H. Thomson. 1995. Marine Mammals and Noise. Academic Press, Inc., San Diego, CA.
Rode, K.D., C.S. Amstrup, and E.V. Regehr. 2007. Polar bear in the Southern Beaufort Sea III: Status, Mass, and Cub Recruitment in Relationship to time and Sea Ice Extent Between 1982 and 2006. U.S. Dept. of the Interior, U.S. Geological Survey Administrative Report, Reston, Virginia. 3128 pp.
Rogers, L. L. and S. M. Rogers. 1976. Parasites of bears: A review. International Conference on Bear Research and Management 3: 411–430.
Schliebe, S.L., T.J. Evans, A.S. Fischbach, and S.B. Kalxdorff. 1998. Summary of Polar Bear Management in Alaska. In: Derocher, A. E., G. W. Gardner, N. J. Lunn, and Ø. Wiig (eds). 1998. Polar Bears: Proceedings of the Twelfth Working Meeting of the IUCN/SSC Polar Bear Specialist Group, 3-7 February 1997, Oslo, Norway. Occasional paper of the IUCN Species Survival Commission, No. 19. P 115 – 123.
Schliebe, S., T.J. Evans, K. Johnson, M. Roy, S. Miller, C. Hamilton, R. Meehan, and S. Jahrsdoerfer. 2006. Range-wide status review of the polar bear (Ursus maritimus). U.S. Fish and Wildlife Service 1011 E. Tudor Road, Anchorage, Alaska.
Smith, A.E. and M.R.J. Hill. 1996. Polar bear, Ursus maritimus, depredation of Canada goose, Branta canadensis, nests. Canadian Field-Naturalist 110: 339–340.
Smith, T.G. 1985. Polar bears, Ursus maritimus, as predators of belugas, Delphinapterus leucas. Canadian Field-Naturalist 99: 71–75.
Smith, T.S., S.T. Partridge, S.C. Amstrup, and S. Schliebe. 2007. Post-den emergence behavior of polar bears (Ursus maritimus) in Northern Alaska. Arctic 60: 187–194.
Stirling, I. 1988. Polar bears. University of Michigan Press, Ann Arbor, Michigan, USA. 220 pp.
Stirling, I. 1990. Polar bears and oil: ecological perspectives. Pages 223–34 in Geraci, J.R. and D.J. St. Aubin, eds. Sea mammals and oil: confronting the risks. Academic Press, San Diego, California.
Stirling, I. and A.E. Derocher. 1993. Possible impacts of climatic warming on polar bears. Arctic 46: 240–245.
Stirling, I. and C.L. Parkinson. 2006. Possible effects of climate warming on selected populations of polar bears in the Canadian Arctic. Arctic 99: 261–275
AOGA PETITION FOR PROMULGATION OF REGULATIONS 13-10 APRIL 2009 BEAUFORT SEA 2011-2016
Stirling, I. and M. McEwan. 1975. The caloric value of whole ringed seals (Phoca hispida) in relation to polar bear (Ursus maritimus) ecology and hunting behavior. Canadian Journal of Zoology 53: 1021–1027.
Stirling, I. and N.A.Øritsland. 1995. Relationships between estimates of ringed seal (Phoca hispida) and polar bear (Ursus maritimus) populations in the Canadian Arctic. Canadian Journal of Fisheries and Aquatic Sciences 52: 2594–2612.
Stirling, I. and P.B. LaTour. 1978. Comparative hunting abilities of polar bear cubs of different ages. Canadian Journal of Zoology 56: 1768–72.
Stirling, I., A.M. Pearson, and F.L. Bunnell. 1976. Population ecology studies of polar and grizzly bears in northern Canada. Transactions of the North American Wildlife and Natural Resources Conference 41: 421–430.
Stirling, I. and A. E. Derocher. 2007. Melting under pressure the real scoop on climate warming and polar bears. The Wildlife Professional 43: 23–27.
Stirling, I. and W. R. Archibald. 1977. Aspects of predation of seals by polar bears. Journal of Fisheries Research Board of Canada 34: 1126–1129.
Stirling, I., D. Andriashek, C. Spencer, and A.E. Derocher. 1988. Assessment of the polar bear population in the eastern Beaufort Sea. Final report to the Northern Oil and Gas Assessment Program. Canadian Wildlife Service, Edmonton, Alberta, Canada. 81 pp.
Stirling, I., T.L. McDonald, E.S. Richardson, and E.V. Regehr. 2007. Polar bear population status in the Northern Beaufort Sea. U.S. Dept. of the Interior, U.S. Geological Survey Administrative Report, Reston, Virginia. 3633 pp.
Taylor, M. K., T. Larsen, and R.E. Schweinsburg. 1985. Observations of intraspecific aggression and cannibalism in polar bears (Ursus maritimus). Arctic 38: 303–309.
U.S. Fish and Wildlife Service (USFWS). 1999. Oil spill response plan for polar bears in Alaska. U.S Fish and Wildlife Service Marine Mammals Management. Anchorage, Alaska. 21pp.
USFWS. 2006. Marine mammals; incidental take during specified activities, Beaufort Sea; Final Rule. Wednesday August 2, 2006. 71 FR 43926 – 43953.
USFWS. 2007. Proposed rule for incidental take of marine mammals during specified activities, Chukchi Sea, Proposed Rule. Friday June 1, 2007. 72 FR 30670 - 30700.
USFWS. 2008a. Endangered and threatened wildlife and plants; determination of threatened status for the polar bear (Ursus maritimus) throughout its range; Final Rule. Thursday May 15, 2008. 73 FR 28212 – 28303.
USFWS. 2008b. Walrus reported as harvested and tagged by Alaska Native subsistence hunters in accordance with the Marine Mammal Marking, Tagging, and Reporting Rule [50 CFR 18.23]. Polar Bears Reported and Tagged as harvested and tagged by Alaska Native
AOGA PETITION FOR PROMULGATION OF REGULATIONS 13-11 APRIL 2009 BEAUFORT SEA 2011-2016
AOGA PETITION FOR PROMULGATION OF REGULATIONS 13-12 APRIL 2009 BEAUFORT SEA 2011-2016
Subsistence hunters in accordance with the Marine Mammal Marking, Tagging, and Reporting Rule (50 CFR 18.23). Marine Mammals Management Office, Anchorage, Alaska. November 5, 2008.
USFWS. 2008c. Programmatic biological opinion for polar bears (Ursus maritimus) on Beaufort Sea Incidental Take Regulations. June 23, 2008. U.S. Fish and Wildlife Service. 65 pp.
U.S. Geological Service (USGS). 2003. Polar Bear Maternal Den Distribution in Northern Alaska. Alaska Biological Science Center Polar Bear Research Database, 5 May 2003.
Wiig, Ø., E.W. Born, and L.T. Pedersen. 2003. Movements of female polar bears (Ursus maritimus) in the east Greenland pack ice. Polar Biology 26: 509–516.
Williams, M.T., T.G. Smith, and C.J. Perham. 2002. Ringed seal structures in sea ice near Northstar, winter and spring of 2000-2001. p. 4-1 to 4-32 In: Richardson, W.J., and M.T. Williams (eds.) 2002. Monitoring of industrial sounds, seals, and whale calls during construction of BP’s Northstar Oil Development, Alaskan Beaufort Sea, 2001. [Draft, April 2002.] Report from LGL Ltd., King City, Ont., and Greeneridge Sciences Inc., Santa Barbara, CA, for BP Exploration (Alaska) Inc., Anchorage, AK, and NMFS., Anchorage, AK and Silver Spring, MD.
Williams, M.T., J.A. Coltrane, and C.J. Perham. 2001. On-ice location of ringed seal structures near Northstar, December 1999 and May 2000. In: Richardson, W.J., and M.T. Williams (eds.) 2002. Monitoring of industrial sounds, seals, and whale calls during construction of BP’s Northstar Oil Development, Alaskan Beaufort Sea, 2001. [Draft, April 2002.] Report from LGL Ltd., King City, Ont., and Greeneridge Sciences Inc., Santa Barbara, CA, for BP Exploration (Alaska) Inc., Anchorage, AK, and NMFS, Anchorage, AK and Silver Spring, MD.
Marilyn Crockett AOGA Executive Director AOGA Principal In Charge Sami Glascott AOGA Regulatory Affairs Coordinator AOGA Project Manager Diane Sanzone BPXA Senior Environmental Scientist AOGA Working Group Chair
Julie Lina Pioneer Regulatory and Environmental Affairs Coordinator
AOGA Working Group Co-Chair
Greg Horner Shell Senior Scientist AOGA Working Group Member Robert Province Eni Land Manager AOGA Working Group Member
Steve Krohn ExxonMobil Senior Geologist AOGA Working Group Member Russell Tait ExxonMobil Senior Environmental &
Regulatory Consultant AOGA Working Group Member
Kenneth Wilson Alyeska Pipeline Fish and Wildlife Specialist AOGA Working Group Member Janet Bounds Chevron Legislative & Regulatory
Advocacy Specialist AOGA Working Group Member
Tara Vicente Chevron Permitting Support Contractor AOGA Working Group Member Caryn Rea ConocoPhillips Alaska,
Inc. Senior Biologist AOGA Working Group Member
Justin Blank ConocoPhillips Alaska, Inc.
Scientist AOGA Working Group Member
Jay Brueggeman Canyon Creek Consulting
Principal Scientist Senior Technical Review
Jeffrey Leppo Stoel Rives LLP Attorneys at Law
Principal Legal Review
Sheyna Wisdom URS Senior Noise Analyst/Biologist URS Project Manager Anne Southam URS Environmental Scientist URS Deputy Project Manager Stephen Robey URS Marine Mammal Biologist Author Karen Brown URS Environmental Scientist Author Luke Boggess URS GIS Specialist GIS