Providing Low Cost Reliable Power For Telecommunications
May 2017NASDAQ: POLA
2
The following discussion, in addition to the other information contained in this presentation, should be considered carefully inevaluating our prospects. This presentation (including without limitation the following factors that may affect operating results)contains forward-looking statements regarding us and our business, financial condition, results of operations and prospects. Wordssuch as "expects," "anticipates," "intends," "plans," "believes," "seeks," "estimates" and similar expressions or variations of suchwords are intended to identify forward-looking statements, but are not the exclusive means of identifying forward-lookingstatements in this presentation. Additionally, statements concerning future matters such as revenue projections, projectedprofitability, growth strategies, and other statements regarding matters that are not historical are forward-looking statements.
Forward-looking statements in this presentation reflect the good faith judgment of our management and the statements are basedon facts and factors as we currently know them. Forward-looking statements are subject to risks and uncertainties and actualresults and outcomes may differ materially from the results and outcomes discussed in the forward-looking statements. Factorsthat could cause or contribute to such differences in results and outcomes include, but are not limited to, those discussed in thispresentation. Readers are urged not to place undue reliance on these forward-looking statements which speak only as of the dateof this presentation. We undertake no obligation to revise or update any forward-looking statements in order to reflect any eventor circumstance that may arise after the date of this presentation.
This presentation shall not constitute an offer to sell or the solicitation of an offer to sell or the solicitation of an offer to buy anysecurities of the Company nor shall there be any sale of securities in any jurisdiction in which such offer, solicitation or sale wouldbe unlawful prior to registration or qualification under the securities laws of any such jurisdiction.
Founded in 1979, we design, manufacture and sell direct current, or DC, power systems for applications in:
• Telecommunications• Military• Electric vehicle charging
Our core technologies include: • Energy conversion• Digital control systems• Cooling systems
Within the telecommunications market, our DC power systems provide reliable and low-cost DC power to service applications in:
• Prime power applications - do not have access to the utility grid
• Back-up power applications - have critical power needs and cannot be without power in the event of utility grid failure
Customers can rely on Polar to deliver a turn-key solution as opposed to ‘reinventing the wheel’ using their internal engineers or consultants
• Cogeneration• Distributed power• Uninterruptable power supply (UPS)
• System integration• Manufacturing
4
Investment HighlightsBroad Market Opportunities In Telecommunications, Distributed Power, Cogeneration, Military,
Electric Vehicle Charging & Uninterruptible Power Supply (UPS)
We are not a Commodity Product Provider
• Multi-billion dollar opportunity with multiple applications within multiple markets
• Top-tier customer base including Verizon, AT&T, T-Mobile, Telstra, and more
• Direct sales / relationships with customers
Strong Technology History & Brand Recognition With Proprietary DC Power System Technologies
Always Staying Ahead of the Competition
• Leadership in energy conversion, power generation, energy storage and digital controls
• Our DC power systems are smaller, lighter, and more efficient than many AC power systems
• Integrated controls with remote monitoring and control
• Manufacturing expertise enables us to provide a turnkey, fully integrated system
Track Record of Growth and Profitability
• Funded a decade of growth with free cash flow generated by operations
• Proceeds from recent public offering will support greater penetration of existing customers and broader outreach to new customers and end markets
5
Leroy SommerAC Model 42.2Power: 16kWWeight: 246 LBSLength: 18 IN
Polar Power Alternator
DC Model 8220Power: 22 kW
Weight: 49 LBSLength: 5.5 IN
SIMPLICITY = RELIABILITY
AC Versus DC
3X Larger
6
Market Opportunity
.Telecom
Military
Automotive
Industrial
Marine and RV
Remote and Distributed Power
P O L A RP O W E R
S O L U T I O N S
Oil Field and Mining
UPS + Prime PowerData CentersBattery Systems
UPS + Prime PowerBattery SystemsCogenerationSeries Hybrid Electric Drives
UPS + Prime PowerData CentersBattery SystemsCogenerationSeries Hybrid Electric Drives
Electric Car ChargingAnti-Idling Restrictions
Prime Power for off Dock / Dry CampingBattery SystemsSeries Hybrid Electric Drives
Prime Power
UPS + Prime Power
7
Customers
Telecom Military Others
8
9Growth StrategyFurther Develop U.S. Mobile Telecommunications Market
• During the last three years, we achieved significant success in selling our DC power systems to large wireless companies
• Achieved product approval from the big 3 wireless carriers in the USA
• Further expand our sales, manufacturing and service infrastructure through strategic allocation of capital in operations and plant and equipment
Expand DC Power Systems Sales Into New Geographic Markets
• Currently, our sales of DC power systems are mostly to U.S. customers, which represents only 4.7% of the total global telecommunications market
• A significant opportunity exists for sales of our DC power systems to customers located in developing nations
Expand Renewable Solar Energy Product Offerings
• Increased environmental regulations and reduction in cost of solar and advanced storage batteries has accelerated tower operators’ focus on solar hybrid systems in off-grid and bad-grid regions
• In 2013, we developed our proprietary Lithium Battery Management System and Solar Control System
Offer OPEX model (Energy Rental for Telecoms)
• Trend of wireless carriers divesting tower assets to tower operators and tower operators further divesting power infrastructure to energy companies
• Introduced pilot rental program in Southern California in 2014 to evaluate business model
Develop Products For Telecom Data Centers
• Industry transitioning towards distributed data centers favoring our DC power systems
• In process of developing higher power DC systems for applications in data centers
Expand our Global Sales and Increase Product Line Offerings
Build OPEX Program
Increase our Commissioning and
Maintenance Service Areas
Increase the Battery Systems Polar Offers
Expand Into the Telco Data Centers
10
2017 Operational Milestones
Reduce Customer Concentration
• Achieved vendor approval from AT&T and T-Mobile during first quarter of 2017
• Actively demonstrate product portfolio in second quarter to regional centers
• Deploy and install overseas sales and support personnel
Introduced Lower Cost Product
• Economy model enables us to be competitive in domestic and international markets
Introduce New Technologies in Lithium Ion Battery Management
• Providing lower cost CAPEX and OPEX solutions
• Allows the customers to escape the problems of lead acid batteries
Hired & Appointed Strategic Personnel
• Chris Sabo (USA)
• Andre Herbst (Africa)
• Michael Mullen (Middle East)
• In the process of hiring for Asia Pacific region
11
2017 Operational Milestones
Develop 200kW DC Generator
• Currently setting up engineering and marketing teams
• First prototypes target to be ready by end of third quarter
Establishing Network Operation Center (NOC) in Romania
• Hired staff of four (initial deployment)
• Maximize maintenance revenue by leveraging Romanian office for rest of world contracts
Vendor Approval for 20 of Top 50 Global Wireless Carriers
• Enables Polar Power to participate in their RFP process
Marketing
• Exhibit actively at tradeshows: TowerXchange, Communicasia, etc.
• Truck demo
• Building sales support staff
12
Mobile Classroom For DC Power Solutions
• Exhibiting at conventions is losing its effectiveness• Engineers and technicians are not attending shows
• Most efficient means to accelerate our footprint is to demonstrate our product to the customer
• Reduces duration in sales cycle
• Within the USA we have over 100 viable targets to demonstrate this year:
Visiting regions / operations of the 5 major carriers
Visiting the ‘last mile’ carriers, approx. 300 independent companies
Training our service networks
Rolling Demonstration To Commence In May 2017
13
2017 Operational Milestones - Conclusion
OPEX Model
• Procured customers’ requirements and interest levels in first quarter
• Proposing new financial models in second quarter
Research & Development
• Filed our first patent in Q1 and expect to file at least two more in 2017
• Expanding our engineering team with new hires
Reduce Lead Times
• Build to stock
• Quick to react to field trial requests with immediate deployments
14
Polar’s Global Presence
Headquarters
Overseas office
Network Operations
Current activity
15
$2,500
$3,500
$4,500
$5,500
Q1 2016 Q1 2017
Net Sales $3,388 $4,967
42.5% 38.9%
$1,000
$1,200
$1,400
$1,600
Q1 2016 Q1 2017
Gross Profit $1,438 $1,438
28.1% of Net Sales
19.5% of Net Sales
$0
$200
$400
$600
$800
$1,000
$1,200
Q1 2016 Q1 2017
OP Inc. $952 $966
Net
Sal
es $
,00
0G
ross
Pro
fit
$ ,0
00
Op
erat
ing
Inco
me
$ ,0
00
Financial HighlightsNet Sales
Operating Income
Gross Profit
May 2017NASDAQ: POLA
0
500
1,000
1,500
2,000
2,500
3,000
3,500
Jan Mar May Jul Sep Nov Jan Mar May Jul Sep Nov Jan Mar
Gross margin was 38.6% in Q1 2017, a drop of 390 basis points from Q1 2016 margin of 42.5%
Downward price adjustments
Increase in direct labor absorbed in cost of sales
Operating income remained unchanged at $1.0 million in Q1 2017 versus Q1 2016. As a percentage of net sales, Q1 2017 was 19.5% versus 29.1% in Q1 2016
Cash at March 31,2017 totaled $16.8 million
Successful completion of $19.3 million initial public offering in December 2016
.
Financial Metrics
UnauditedMarch 31,
2017 March 31,
2016
Gross Margin % of revenue 38.6% 42.5%
Operating Expenses % of revenue 19% 14%
Income from Operations % of revenue 19.5% 28%
Net Income of % revenue 12% 17%
Sales Growth % compared to Q prior year
47% 229%
Income from Operations Growth % compared to Q prior year
2% 502%
Return on Assets % 2.2% 10.5%
Earnings Per Share $0.06 $0.08
Activity Ratios
Current Ratio 7.40 2.18
Quick Ratio 5.73 0.80
Inventory Turnover 0.59 0.93
Fixed Asset Turnover ratio 6.76 4.68
Average Collection Period (days) 58 60
Average Payment Period 29 41
Return on Equity (ROE) % 2.45% 18.0%
Return on Capital Invested % 4% 32%
17
Financial Review | Q1 2017 Versus Q1 2016
Sales growth of 47% in Q1 2017 versus Q1 2016
Increase in number of DC power systems sold within the U.S. telecommunications market
Net income remained unchanged at $0.6 million, or $0.06 per basic and diluted share, in Q1 2017, versus $0.6 million, or $.08 per basic and diluted share, in Q1 2016
Operating expenses totaled 19.1% of net sales in Q1 2017 versus 14.3% of net sales in Q1 2016
Addition of sales and administrative personnel
Increase in consulting and accounting fees
Income Statement
(in thousands, except per share data)Quarter Ended
March 31,
Unaudited 2017 2016
Net Sales $4,967 $3,388
Cost of Sales 3,050 1,950
Gross Profit 1,917 1,438
Total operating expenses 950 486
Income from operations 966 952
Total other (expense) (2) (23)
Income before income taxes 964 929
Income tax provision (371) (353)
Net Income $593 $576
Net Income per share – basic and diluted
$0.06 $0.08
May 2017NASDAQ: POLA
18
Balance Sheet
$25,664
$26,935
$738
$734
$227
$290
$25,000
$25,500
$26,000
$26,500
$27,000
$27,500
$28,000
$28,500
Dec. 2016 Mar. 2017Current Assets PP&E Other Assets
$2,740 $3,505
$19,244 $19,244
$4,408 $5,001
$-
$5,000
$10,000
$15,000
$20,000
$25,000
$30,000
Dec. 2016 Mar. 2017
Cur Liabilities LT Liability
Stock Ret. Earnings
Assets Dec 2016-Q1 2017
Liabilities and Equity Dec 2016-Q1 2017
March 31,2017
(unaudited)
December 31,2016
ASSETSTotal current assets 26,934,901 25,664,264
Property and equipment, net 734,370 737,586Other Assets 290,089 227,433Total assets $27,959,360 $26,629,283
LIABILITIES AND SHAREHOLDERS EQUITYTotal current liabilities 3,505,250 2,739,874
Notes payable, net of current portion 209,253 237,431
Total liabilities 3,714,502 2,977,305Common stock, 10,143,158 issuedand additional paid in capital
Other Projects Reflecting Market Opportunities and Polar Capabilities
Appendix
23
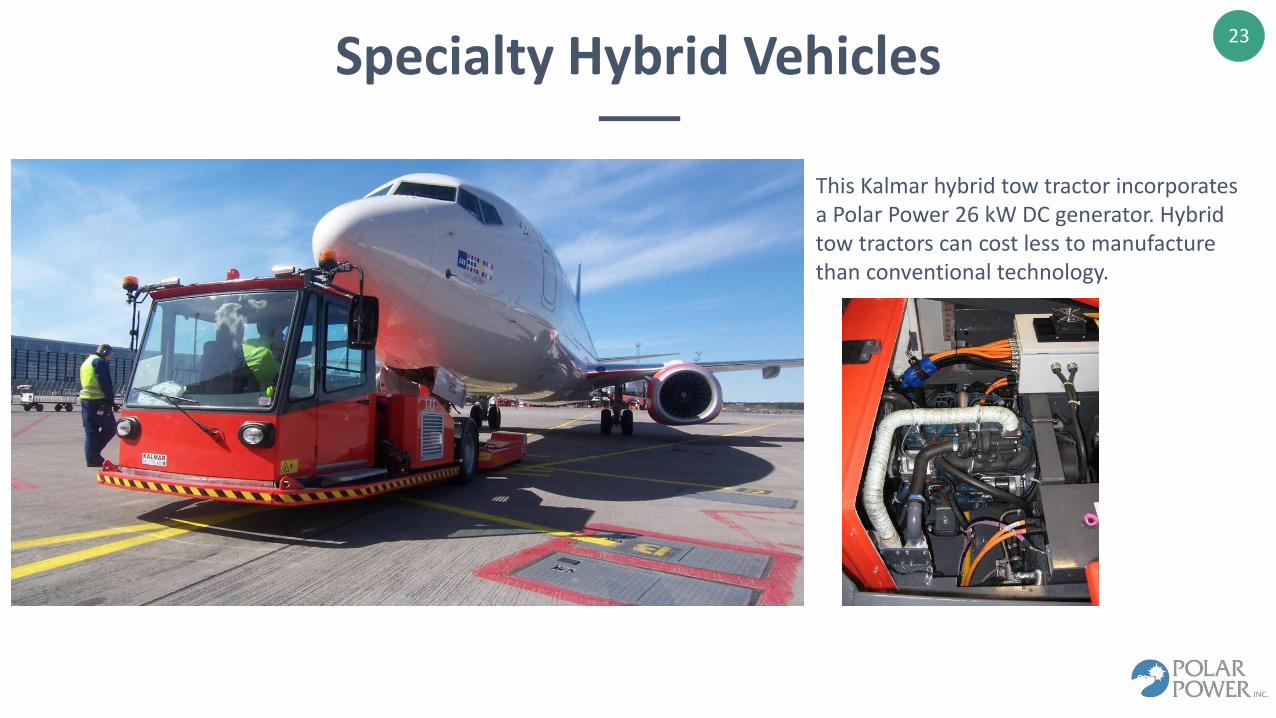
Specialty Hybrid Vehicles
This Kalmar hybrid tow tractor incorporates a Polar Power 26 kW DC generator. Hybrid tow tractors can cost less to manufacture than conventional technology.
24
Mobile Solar Hybrid SUSS Trailer
Small Unit Sustainment System, or SUSS, provides temporary power for shelters, communications, oil and mining work camps, and military expeditions.
Enables emergency service teams and first responders to quickly set up a command center or emergency shelter in time-critical situations.
This SUSS is powered by Polar 10kW diesel generator with solar array assembled and presented to the military by HDT Global.
Currently under US Army field trails in Hawaii. For more info see: https://www.army.mil/article/179906.
In this application Polar Power Inc. is supplying DC generators to Raytheon for its Hy-DRA vehicle. Installed on this vehicle is the Polar 8340P-40415 generator with output power of 20 kW at 320 VDC nominal. Crew have the option of operating all electric in stealth mode then switching over to the Polar DC generator for long range cruising.
26
Oshkosh Firefighting Vehicle
A Polar DC 5.5 kW DC auxiliary power unit (APU) provides military grade DC power to operate communications, air-conditioning, a backup means to start the vehicle engine and other equipment.
APU’s are extensively used in all types of military vehicles.
27
Marine Hybrid Electric
Saving energy while making recreation safer and more pleasurable
• Series hybrid electric propulsion
• Powering air-conditioning, communications, water-makers, autopilots and other electrical appliances
28
Chrysler Mobile Car Charger
• Polar has provided systems to Ford, Bosh, Volkswagen and Mazda.
• Polar projects that the need for Mobile chargers for “AAA” type road service is 3 -4 years into the future.
• Also stationary rapid chargers for home / office vehicle charging fueled by natural gas will help launch micro-cogeneration in the USA.
Two Chrysler / Fiat electric vehicles being charged at the same time during road testing
29
Why the Change to DC?
Solid state electronics need DC power, not AC power
AC was popular at cell sites because air conditioning units needed large amounts of AC power. Over years, the electronics became more immune to temperature extremes and no longer require air conditioning
This advance in electronics broadened the market for DC generators and power systems
Polar has successfully overcome 100 years of AC power legacy. Our sales are growing rapidly as engineers and managers experience the advantages of our DC power technologies
May 2017NASDAQ: POLA
30
Why Choose Polar Power?
• Optimized core product technology over 20 years from both a cost and performance perspective and now deliver a turnkey system
• Provide technical support for our customers including their: architecture and engineering (A&E), installers, commissioning, maintenance, local, regional, and national project managers. Support goes beyond just that of the DC power system
• Rapidly change the product to keep up with the constantly evolving telecommunications infrastructure and power requirements
• Manufacturing the product in volume with 8-week delivery schedules
31Polar Power Engineered Backup & Prime Power Solutions Specifically for Telecommunications Applications
History shows that reliability, low maintenance, and fuel efficiency are necessary when it comes to an
actual emergency. To help solve for these issues, Polar engineered a fuel efficient generator with the
following features:
1. Eliminated the Starting Battery. This is the number 1 reason why generators fail to start. Polar uses a
Supercapacitor to start its telecom generators. Providing the highest amount of cranking amps during
the coldest weather. Providing 15 to 20 years of reliable service in the hottest and coldest weather
extremes.
2. IP65 Sealed and Electronics. To ensure reliability during storms or flooding, all electrical connections
and components are sealed and water tight.
3. No Transfer Switches. Polar’s DC generators connect directly to the battery (through fuses or circuit
breakers).
4. NEMA 4 Storm Resistant Enclosures. Designed to minimize the intrusion of rain and snow.
5. Corrosion Resistant. The all aluminum frame is a unitized, welded and powder coated enclosure with
stainless hardware for corrosion resistance and durability.
6. Remote Monitoring and Control. Real time access to operational status, fuel level, fault diagnosis
and maintenance schedule of our products is critical to reliability and makes more efficient use of
assets and vital human resources. Offers the capability of off loading management of power
producing assets to out of state personnel or Polar Power.
During an extended storm or disaster the mission of a backup generator changes to prime power
32Polar Power Engineered Backup & Prime Power Solutions Specifically for Telecommunications Applications
“All fixed and portable gensets require constant refueling, usually once a
day, which presents important logistics issues.”
“Taking the genset to a site is usually complicated, because roads may be
damaged or filled with debris and bridges may have been washed away.”
-Katrina NSF report UILU-ENG-2006-2511
Detailed reports on the problems with AC Generators during the Katrina hurricane are available on the internet and include: CEME-TR-06-05 and CRPT-109srpt322
Think of the disruption of communication as one AC generator goes down and the time it takes to get another one to site along with the logistics to make it happen. And where do all these additional generators come from during the disaster? What is the cost to maintain a larger reserve of portable generators or the cost to get on the spot market during a disaster?
33
NO MAINTENANCE, HIGH RELIABILITY• No bearings• No exciters• No rotating diodes, electrical components, wire and
laminations
LONG LIFE WITH NO PARTS TO WEAR• 100,000+Hours
VERY COMPACT• Reduces footprint of generator
MAGNETS INCREASE EFFICIENTCY• Reduces fuel consumption• Reduces the amount of fuel stored on site
LIGHT WEIGHT• Reduces cost to replace generator on site• Less reinforcing of roof installations• Very easy to service generator set
POLAR DC ALTERNATOR
34Why Telecoms & Commercial Companies Need Backup Power or Uninterruptible Power Supply (UPS)
• Mission-critical businesses can’t afford to be without power, even for less than a second
‒ Data centers‒ Financial institutions‒ Hospitals
• Results are lost revenue, customers and human safety
• Telecoms – FCC requirement for all cell towers to have some form of backup power following Hurricane Sandy
• More businesses are questioning the reliability of today’s public power grid
• Blackouts and rolling brownouts due strain on public grid during peak demand
• Onsite power generation and storage provides backup power to enable telecoms/businesses to function without interruption
35Our Market Focus is in Telecommunications
1980s
LAUNCH
1990s
FIELD TRAILS
2010s
ACCEPTANCE
Polar began providing backup power systems / UPS
Polar starts providing solar PV charge controllers for microwave communications
Polar starts manufacturing its DC power systems, debugging its prime power and backup power systems in field trails and supplying systems to most major telecoms
2000s
MOVING AWAY FROM AIR CONDITIONING
Radios’ ability to operate at higher temperatures eliminates the air conditioning at site, creating significant energy savings and opening the market for DC generators
36
Why a Telecommunications Focus?
Presently 4.7 billion unique mobile subscribers and 5.7 billion projected by 2020 (1)
Telecommunications companies worldwide will invest over $1.4 trillion in the construction of new cell towers and equipment upgrades by 2020 (2)
Reducing energy cost presents a major opportunity to increase profit or lower subscriber fees
It is estimated there are more than 1,000 small and medium telecom companies in the U.S. alone
Currently, it is estimated that there are more than 300,000 cell sites in the U.S. (3)
New 5G rollout requires large tower and power expansion
FCC regulatory change and wireless carriers revenue goals demand longer backup capacity at all cell sites triggered by Hurricane Katrina & Sandy
Cell phones are displacing land lines as primary means of communications. Now the same level of reliability is being demanded of cell phones
Enhanced pressure from the EPA to reduce greenhouse gases
Necessity of independent towers and cell sites for first responders
Strict mandates to provide rural connectivity to broadband service in the U.S. and developing nations
Many wireless carriers are divesting their tower assets and in turn renting the space from the “new” owners; now referred to as Tower Operators.
Tower Operators have a narrow business interest of providing space and electrical energy; with new owners cell sites are now focused on reducing energy costs to increase their profits.
Key Drivers to Growth of Reliable Power Systems
1
2
3
5
4
38
Vertical DC Power System Open Frame DC Power System Horizontal DC Power SystemPrimarily used for backup power systems Primarily used for prime power systems
including solar hybridPrimarily used for prime power systems
including solar hybrid
• Very small footprint.• Diesel models include fuel
tank.• Propane and natural gas
units have compartment space that can be used to house batteries or super capacitors.
• Natural gas can operate off of very low line pressure without the use of booster pumps.
• Provides very quiet operation.• All aluminum cabinet with stainless hardware,
corrosion resistant.• Engineered to provide 20 to 30 year service life
with low maintenance.• Will operate in all weather conditions.• Maximum electrical output is 15 kW at 54 VDC.
• Designed for installations inside shelters. Locating the generator inside a walk in shelter facilitates maintenance at sites with weather extremes, especially very cold climates.
• Available in all fuels: propane, natural gas, and diesel.
• Can operate up to 6 - 12 months without maintenance or inspection.
• Engineered to provide 15 to 25 year service life with low maintenance.
• Designed for weather extremes, especially hurricanes.
• All aluminum cabinet with stainless hardware, corrosion resistant.
• Available in all fuels: propane, natural gas, and diesel.
• Can operate up to 6 - 12 months without maintenance or inspection.
• Engineered to provide 15 to 25 year service life with low maintenance.
• Very quiet operation.
DC Configuration
39
Backup Power
Systems
On-GridSites
Advantages of DC Power Systems
• With air conditioning no longer required, during a power outage there is now the opportunity for smaller and more efficient DC power systems to provide backup power.
• Space is at a very high premium on the cell site. Polar’s DC power systems are smaller than many AC power systems.
• Polar’s DC power systems are lighter than many AC power systems, reducing roof reinforcing requirements.
• Polar’s unique fuel carburation system allows our power systems to function off line pressure without expensive booster pumps, typical of AC power systems.
• Isolation from the grid, no problems with the power system accidentally connecting to the grid• Quiet operation• Small amounts of fuel on site
40
Prime Power
Systems
Off-Grid Sites
• Fuel saving has been the most important reason for choosing Polar DC power systems. We can reduce fuel savings significantly over typical AC installations.
• Our DC hybrid systems reduce field maintenance and refueling from 1 to 4 times a month for traditional technologies to as long as 12 months.
• The CAPEX for an installed Polar DC hybrid system is typically lower than AC based systems.
• Our products are specifically engineered for low maintenance and long life in prime power applications; thereby reducing OPEX costs. Typically 20 kW AC power systems and smaller are engineered for a low cost applications, and not prime power; increasing the OPEX cost.
• Ease of transportation to remote sites.
• Remote monitoring and control.
• Built in battery charging algorithms.
Advantages of DC Power Systems
41
0
50
100
150
200
250
300
350
400
450
1 2 3 4
GA
LLO
NS
PER
WEE
K
Average Fuel Consumption a Week
Red – Solar hybrid site using a LPG AC genset with a large solar array and 10 days of autonomy from lead acid battery bank. The AC generator ran for an average of 103.7 hours a week, consuming 4 gal/hr. of propane, requiring a total of 414.8 gallons per week.
Blue – Same site with a LPG DC generator with 1 day of autonomy from Li-Ion battery. With this upgrade the DC generator ran for 25.6 hrs./week, using 1.4 gal/hr., averaging 35.9 gal/week.
Example of an upgraded site in New Mexico, Polar replaced the AC generator and lead acid batteries with a DC generator and lithium-Ion batteries.
DC Solar Hybrid Power Systems
42
• Remote monitoring and control of sites from anywhere in the world
• Reduces maintenance costs
• Improves reliability
• Foundation for Rental / Micro-Utility / OPEX
• Designed to support 99.9% network up-time
• Polar’s Hybrid system reduces fuel costs
• Combines a low CAPEX fuel energy source with a low OPEX renewable energy for low cost sustainable power
Polar Remote Control and Monitoring Improves Reliability
Lowers Maintenance Cost
Global Network
Polar Supra Control System
Polar DC Generator High Efficiency
Low Capital Cost
Polar Li-Ion Battery Energy
Storage
Solar and Wind Power Renewable Energy Low Operating Cost
Cell Tower
DC Microgrid Low Cost Sustainable Power Over 3.3 Million