Polarization modulation high resolution Fourier transformspectroscopy
Mohammed Elhanine, Robert Farrenq, and Guy Guelachvili
A new polarization modulation Zeeman method combined with high resolution Fourier transform spectrosco-py is described. It selectively detects the paramagnetic species produced in a plasma under a constantmagnetic field. The polarizing optics is convenient and easily covers wide spectral ranges. NO absorptionand N2 0, NO emission spectra are reported. With a magnetic field of the order of 560 G and a 40-cm long dis-charge tube, the P and R lines of the 1-0 band of NO around 5jum are observed up to J = 28.5 whereas themuch more intense N 2O lines are not detected. Unexplained line shapes of the first Q2 lines of NO arereported. A comparison with a recent frequency modulation Zeeman method coupled with high resolutionFourier transform spectroscopy is given.
1. Introduction
High resolution spectra of unstable molecules arenow being recorded with high information Fouriertransform interferometers.' However, for radicalspectra to benefit from the usual well-known advan-tages of Fourier transform spectroscopy several specif-ic difficulties must first be overcome. They practical-ly all come from the fact that acquiring the interfer-ogram may take several hours.
The unstable species must first be produced in asteady state. In the laboratory, this is generally ob-tained by designing various types of reactor with flow-ing systems. The entrance flux is made of stable mole-cules. The exhaust products are a mixture of stableand unstable species in various phases resulting fromthe dissociation and recombination mechanisms tak-ing place in the source.
Another difficulty, related to the finite time neededfor recording the interferogram (and for computing thespectrum), is that trials on the different parameters forimproving the efficiency of the production of the un-stable species of interest before the final run cannot berepeated easily. Monitoring the reactor can be donewith a laser beam tuned to an already known transitionof the radical.2 A real time computer associated withthe Fourier spectrometer, providing on an oscilloscope
The authors are with University of Paris-Sud, Batiment 350,Laboratoire d'Infrarouge, Associ6 CNRS, 91405 Orsay, France.
the spectrum while the interferogram is being record-ed, may also be time saving.
Extracting useful information on radicals from theirFourier spectra is faced with another difficulty.These spectra are generally heavily overlapped by thestrong transitions of the mother molecule provided atthe entrance of the reactor. Although ab initio calcu-lations are generally helpful in locating the positionwhere the spectra should be found,3 it is often notenough. To make recognition easier in the spectrumof the faint lines of the unstable molecules, new modu-lating schemes are being developed at Laboratoired'Infrarouge. They all take advantage of the para-magnetism of the radicals which generally distin-guishes them from the stable molecules. The firstapproach uses only the Zeeman shift and not the polar-ization quality of the split lines. This frequency mod-ulation method, usual in laser techniques, has recentlybeen demonstrated for the first time with a Fouriertransform spectrometer.4 5 Some unpublished resultswere also obtained with a fast scanning interferome-ter.6 The frequency modulation method does notneed any polarizer but requires modulation of the mag-netic field. When applied to a plasma this may some-times cause problems. Apart from the difficulty ofgetting high frequency modulation, a varying magneticfield on a plasma may induce other types of modula-tion, more particularly troublesome concentrationmodulation of all types of species created in the dis-charge.
This paper presents a new method for obtainingselective high resolution Fourier transform spectrawhich does not involve these drawbacks. It is essen-tially based on the polarization property of the Zeemantransitions.
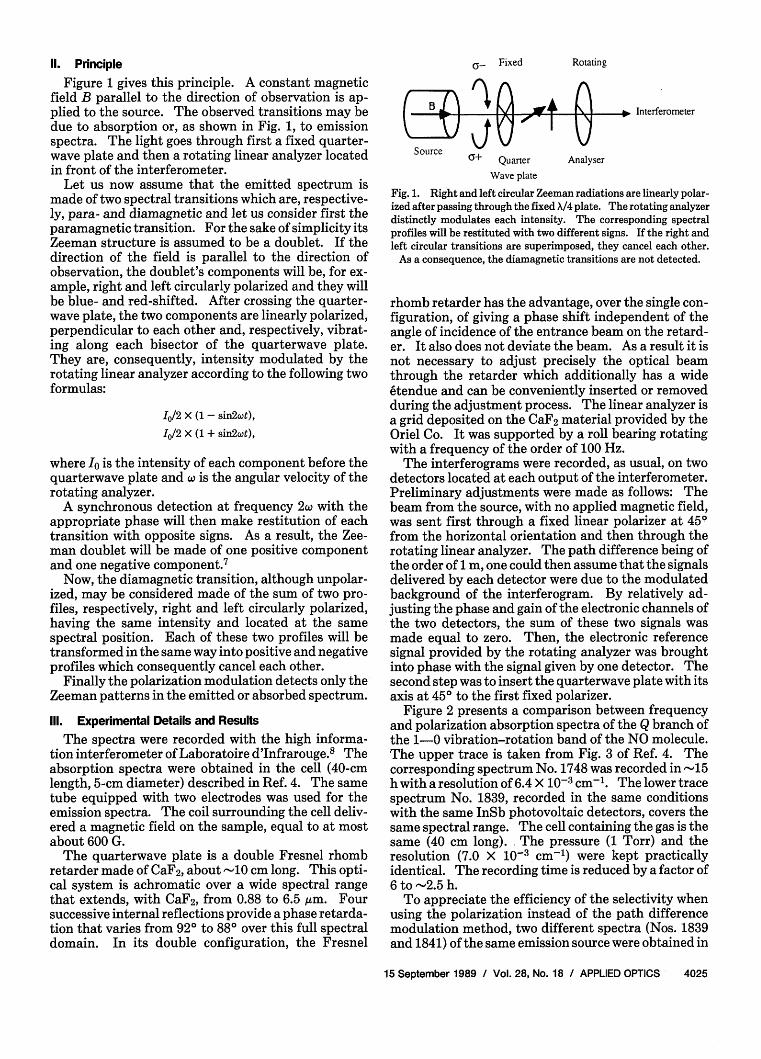
Figure 1 gives this principle. A constant magneticfield B parallel to the direction of observation is ap-plied to the source. The observed transitions may bedue to absorption or, as shown in Fig. 1, to emissionspectra. The light goes through first a fixed quarter-wave plate and then a rotating linear analyzer locatedin front of the interferometer.
Let us now assume that the emitted spectrum ismade of two spectral transitions which are, respective-ly, para- and diamagnetic and let us consider first theparamagnetic transition. For the sake of simplicity itsZeeman structure is assumed to be a doublet. If thedirection of the field is parallel to the direction ofobservation, the doublet's components will be, for ex-ample, right and left circularly polarized and they willbe blue- and red-shifted. After crossing the quarter-wave plate, the two components are linearly polarized,perpendicular to each other and, respectively, vibrat-ing along each bisector of the quarterwave plate.They are, consequently, intensity modulated by therotating linear analyzer according to the following twoformulas:
I/2 X (1 - sin2wt),
Io/2 X (1 + sin2wt),
where Io is the intensity of each component before thequarterwave plate and X is the angular velocity of therotating analyzer.
A synchronous detection at frequency 2w with theappropriate phase will then make restitution of eachtransition with opposite signs. As a result, the Zee-man doublet will be made of one positive componentand one negative component.7
Now, the diamagnetic transition, although unpolar-ized, may be considered made of the sum of two pro-files, respectively, right and left circularly polarized,having the same intensity and located at the samespectral position. Each of these two profiles will betransformed in the same way into positive and negativeprofiles which consequently cancel each other.
Finally the polarization modulation detects only theZeeman patterns in the emitted or absorbed spectrum.
111. Experimental Details and Results
The spectra were recorded with the high informa-tion interferometer of Laboratoire d'Infrarouge.8 Theabsorption spectra were obtained in the cell (40-cmlength, 5-cm diameter) described in Ref. 4. The sametube equipped with two electrodes was used for theemission spectra. The coil surrounding the cell deliv-ered a magnetic field on the sample, equal to at mostabout 600 G.
The quarterwave plate is a double Fresnel rhombretarder made of CaF2, about -10 cm long. This opti-cal system is achromatic over a wide spectral rangethat extends, with CaF2, from 0.88 to 6.5 Aim. Foursuccessive internal reflections provide a phase retarda-tion that varies from 920 to 880 over this full spectraldomain. In its double configuration, the Fresnel
ca Fixed
3ourceA+ Quarter
Rotating
Analyser
Wave plate
Fig. 1. Right and left circular Zeeman radiations are linearly polar-ized after passing through the fixed X/4 plate. The rotating analyzerdistinctly modulates each intensity. The corresponding spectralprofiles will be restituted with two different signs. If the right andleft circular transitions are superimposed, they cancel each other.
As a consequence, the diamagnetic transitions are not detected.
rhomb retarder has the advantage, over the single con-figuration, of giving a phase shift independent of theangle of incidence of the entrance beam on the retard-er. It also does not deviate the beam. As a result it isnot necessary to adjust precisely the optical beamthrough the retarder which additionally has a wide6tendue and can be conveniently inserted or removedduring the adjustment process. The linear analyzer isa grid deposited on the CaF2 material provided by theOriel Co. It was supported by a roll bearing rotatingwith a frequency of the order of 100 Hz.
The interferograms were recorded, as usual, on twodetectors located at each output of the interferometer.Preliminary adjustments were made as follows: Thebeam from the source, with no applied magnetic field,was sent first through a fixed linear polarizer at 450from the horizontal orientation and then through therotating linear analyzer. The path difference being ofthe order of 1 m, one could then assume that the signalsdelivered by each detector were due to the modulatedbackground of the interferogram. By relatively ad-justing the phase and gain of the electronic channels ofthe two detectors, the sum of these two signals wasmade equal to zero. Then, the electronic referencesignal provided by the rotating analyzer was broughtinto phase with the signal given by one detector. Thesecond step was to insert the quarterwave plate with itsaxis at 450 to the first fixed polarizer.
Figure 2 presents a comparison between frequencyand polarization absorption spectra of the Q branch ofthe 1-0 vibration-rotation band of the NO molecule.The upper trace is taken from Fig. 3 of Ref. 4. Thecorresponding spectrum No. 1748 was recorded in -15h with a resolution of 6.4 X 10⁻³ cm-'. The lower tracespectrum No. 1839, recorded in the same conditionswith the same InSb photovoltaic detectors, covers thesame spectral range. The cell containing the gas is thesame (40 cm long). The pressure (1 Torr) and theresolution (7.0 X 10⁻³ cm-') were kept practicallyidentical. The recording time is reduced by a factor of6 to -2.5 h.
To appreciate the efficiency of the selectivity whenusing the polarization instead of the path differencemodulation method, two different spectra (Nos. 1839and 1841) of the same emission source were obtained in
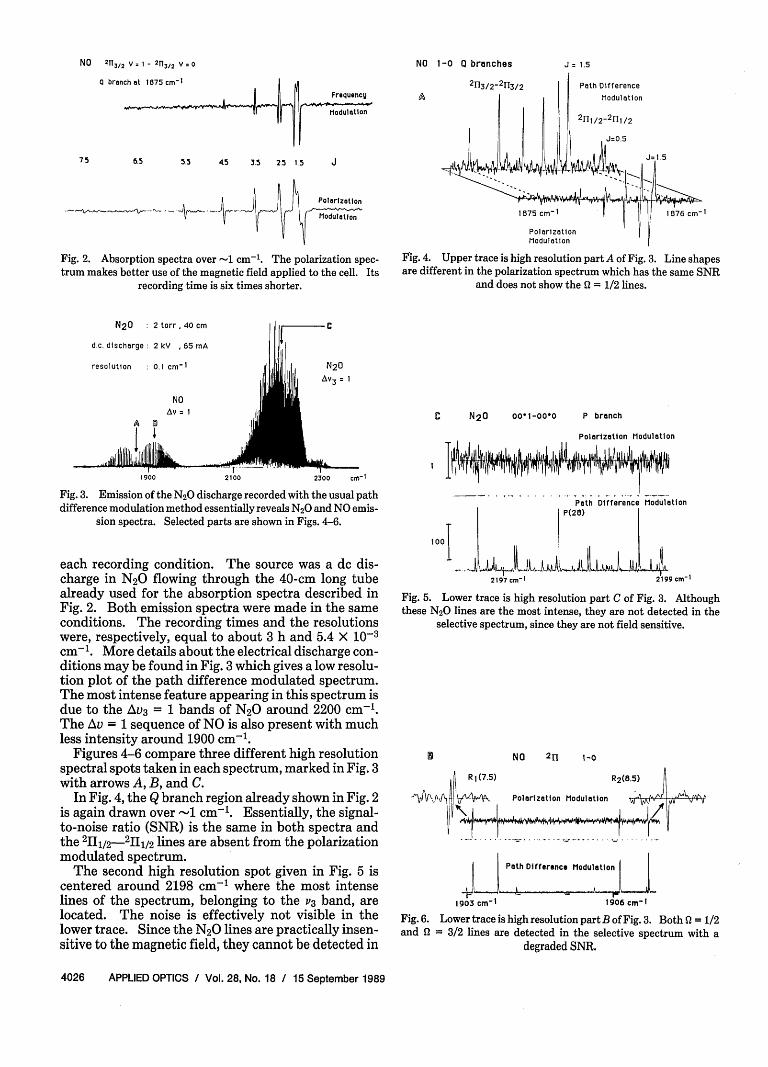
Fig. 2. Absorption spectra over -1 cm-'. The polarization spec-trum makes better use of the magnetic field applied to the cell. Its
recording time is six times shorter.
Fig. 4. Upper trace is high resolution part A of Fig. 3. Line shapesare different in the polarization spectrum which has the same SNR
and does not show the Q = 1/2 lines.
CN20
AV3 = I
C N20 001-00'0
"Ab-2300 cr I2100
Fig. 3. Emission of the N 2 0 discharge recorded with the usual pathdifference modulation method essentially reveals N 2 0 and NO emis-
sion spectra. Selected parts are shown in Figs. 4-6.
each recording condition. The source was a dc dis-charge in N20 flowing through the 40-cm long tubealready used for the absorption spectra described inFig. 2. Both emission spectra were made in the sameconditions. The recording times and the resolutionswere, respectively, equal to about 3 h and 5.4 X 10⁻³cm-'. More details about the electrical discharge con-ditions may be found in Fig. 3 which gives a low resolu-tion plot of the path difference modulated spectrum.The most intense feature appearing in this spectrum isdue to the AV3 = 1 bands of N20 around 2200 cm-'.The Au = 1 sequence of NO is also present with muchless intensity around 1900 cm-'.
Figures 4-6 compare three different high resolutionspectral spots taken in each spectrum, marked in Fig. 3with arrows A, B, and C.
In Fig. 4, the Q branch region already shown in Fig. 2is again drawn over -1 cm-'. Essentially, the signal-to-noise ratio (SNR) is the same in both spectra andthe 2II11/2_2H112 lines are absent from the polarizationmodulated spectrum.
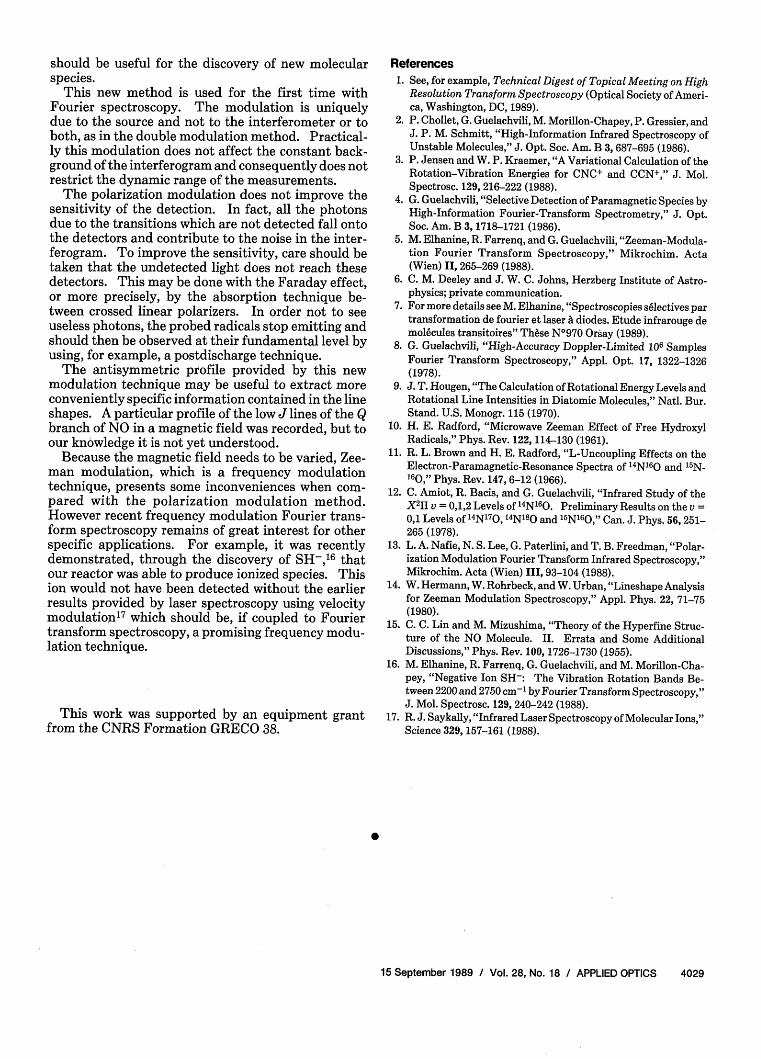
The second high resolution spot given in Fig. 5 iscentered around 2198 cm-1 where the most intenselines of the spectrum, belonging to the 3 band, arelocated. The noise is effectively not visible in thelower trace. Since the N20 lines are practically insen-sitive to the magnetic field, they cannot be detected in
P branch
Polarization Modulation
Path Difference ModulationP(28)
1001
2197 cm-1
2199 cm-1
Fig. 5. Lower trace is high resolution part C of Fig. 3. Althoughthese N20 lines are the most intense, they are not detected in the
selective spectrum, since they are not field sensitive.
Is NO 2TI 1-0
l R 1 (7.5) R2 (8.5)
+/f\ l(?.S) b- Polarization Modulation jA,
Path Difference Modulation
1903 cm 1906 cm I
Fig.6. Lower trace is high resolution partB of Fig.3. Both S2 = 1/2and = 3/2 lines are detected in the selective spectrum with a
Fig. 7. Calculated positions and intensities of the Zeeman compo-nents of the two R(2.5) 1-0 lines selectively detected. Each of thesecomponents is dressed in a inc2 profile to get the lower calculated
spectrum.
the other spectrum. Indeed, the upper trace of Fig. 4even with magnification of the vertical scale by a factorof 100 hardly shows any N20 signature. The very faintsignals given by the P(27) and the P(29) lines areprobably due to some residual polarization effects.
The last spot, which is given in Fig. 6, covers a smallportion of the R branch of the 1-0 band of NO. Con-trary to Fig. 4, the SNR in the polarization modulatedspectrum is now slightly degraded when comparedwith the other recording spectrum. Also, the linesbelonging to the Q = 1/2 sublevel are now present in thespectrum, which did not happen in the Q branch. Fi-nally, the shapes of the lines from the U = 3/2 and Q =1/2 sublevels are different. To interpret these obser-vations, the simulation of the corresponding Zeemanpatterns was performed as follows:
First, amplitude and shift from the zero field posi-tion of each Zeeman component were calculated. Therelative intensities taking into account the Boltzmanndistribution were obtained through the calculations ofthe director cosine matrix elements.9 The shifts weredetermined using the gj Land6 factors given by theo-retical expressions from Refs. 10 and 11. The zerofield positions involved both the X-doubling and thespin-orbit effects; they were evaluated from the energylevel table given in Ref. 12. Finally each componentwas convolved with a sinc2 function, the halfwidth ofwhich was 8 X 10⁻³ cm-1.
As an example, the calculated Zeeman pattern forthe R1 (2.5) and the R2 (2.5) lines ( = 1/2 and = 3/2)in the 1-0 band are shown in the bottom part of Fig. 7for a magnetic field of 560 G. The upper part of thefigure gives for these two lines, on a different wave-number scale, the position and the intensity of eachZeeman component, represented by a single vertical
Q2(5 Q(1(l.5)
Rliil-
Calc.
5)
Obs.
I'S AA /S A HAeA 1AA
PolarizationModulation
F. T. Spectra
Fig. 8. Observed and calculated NO lines profiles.
bar. Actually, although the shift is very small in the Q= 1/2 level, the various components of the R1(2.5) addvery efficiently. Exactly the opposite happens for theQ = 3/2 level, essentially due to the fact that the Land6factors in the Q = 1/2 state do not depend on Jwhereastheir variation is in 1/J(J + 1) in the Q = 3/2 state.The X-doubling also differently affects the two pro-files: In the upper left part of Fig. 7, it gives two verydistinct antisymmetric patterns, while on the right-hand side, for the Q = 3/2 line, it barely broadens thebar representing each Zeeman component.
Figure 8 gives, for the 1-0 band, two calculated Qlines and four R lines above their observed profileswhich are correctly reproduced. The weakness of theQ1(1.5) transition agrees with the absence of this tran-sition from the spectra in Figs. 2 and 3.
IV. Discussion
In comparison with the frequency modulation ap-proach4'5 the polarization method presented here hastwo essential advantages: it requires only a constantmagnetic field and it uses this magnetic field moreefficiently. The components are shifted apart by thewhole field before being multiplied by +1 and -1,respectively, depending on their state of polarization.Let us assume again, for the sake of simplicity, that theZeeman pattern is a doublet. If the field is big enoughso that the two components do not overlap, the detec-tion efficiency is optimum. This efficiency decreaseswhen the overlapping of the two profiles increases. Itvanishes when the two profiles are exactly on top ofeach other.
More generally, when the line splits into more thantwo components, determining the detection efficiencyas a function of the field magnitude, of the gj factors, ofthe J quantum numbers, and of the linewidth is notstraightforward and should be done from calculationsas demonstrated in Fig. 8. When the Zeeman compo-nents do not overlap, the detection efficiency is opti-mum and the SNR is the same as with the path differ-ence modulation recording mode; this is clear from Fig.4. On the other hand as shown in Fig. 6, having a highgj does not necessarily lead to good detection.
Zeeman components(B = 560 gauss, abscissa in 10-3 cm-1)
. K1=1/2 l AM= -I
- - -~~~~A = +1 1 ._
10
0
-10
NO2, 1-0
R 1(2.5) .
-10 0 10
F
The frequency modulation approach uses, for thesame observing conditions, twice as much signal as thepolarization method which modulates the amplitudeof the analyzed beam. Both methods suffer from alack of efficiency when compared with path differencemodulation detection. For example, the highest ob-served J values in the 1-0 band in the spectra shownin Figs. 4-6 are 28.5 instead of 40.5 in favor of the pathdifference modulation spectrum. Because the Zee-man components are well separated, in both spectrathe observed highest J in the Q branch are identical.
Even if it makes better use of the magnetic field, thepolarization modulation method requires polarizingoptics. The double Fresnel rhomb X/4 retarder ac-cepts a wide etendue, does not deviate the beam, and isachromatic over a wide spectral range. Linear polariz-ers are currently available and present the same ad-vantages. Both types of polarizer were found to beconvenient. They can be made from other refractivematerials and cover different spectral ranges.
The step-by-step recording mode of the interferom-eter used for these experiments leaves great freedom inthe choice of the modulation frequency. In this par-ticular case, it was chosen equal to 200 Hz, which is theinternal modulation frequency usually practiced atLaboratoire d'Infrarouge. The modulating process isachromatic and does not induce any phase problem inthe interferogram. Increasing this frequency to muchhigher values would lead to practical limitations if theintensity modulation is performed through the me-chanical rotation of the analyzer.
Clever polarization modulation methods have beenused with FTS for low resolution studies of vibrationalcircular dichroism (VCD)13; they use fast scanning re-cording mode interferometers. Consequently the in-terferogram is doubly modulated, first by the pathdifference linear variation, and then by the polariza-tion, the frequency of which must be taken much high-er. This is obtained with a photoelastic modulatorvibrating at -50 kHz. The same device could be usedin our arrangement instead of the rotating linear ana-lyzer. However in such a case the modulation efficien-cy would be chromatic, as it is in the VCD experiments.Provided two lock-in detections are performed, the lowresolution VCD method delivers two different inter-ferograms in one run. This is an interesting advan-tage. It can also be obtained with stepping modeinterferometry, by recording the interferogram togeth-er with the path difference and the polarization modu-lations. Naturally, the respective frequencies of eachmodulation must be well separated and two detectionsmust also be performed.
Original results in Zeeman modulation laser spec-troscopy were reported previously.14 Their lineshapes present similarities with those given in thispaper. They make use of both the polarization andfrequency shift properties of the Zeeman effect. Onlyone type of circular transition is sent to the detector;this avoids the overlapping of the right and left transi-tions which, as seen above, degrades the detectionefficiency. The spectrum is frequency modulated.
Consequently it has the selectivity advantage but suf-fers, as also explained above, from the obligation tomodulate the magnetic field.
The antisymmetric line shape obtained with theselective method may be more convenient than theusual symmetric Zeeman pattern to better appreciatethe various physical factors contributing to the Zee-man profile. For example, the Q2(1.5) line in the bot-tom part of Fig. 2 catches the attention. The calculat-ed profile of this line is drawn on the upper part of Fig.8; it clearly does not reproduce the recorded line shape.To interpret the double structure of this Q2(1.5), par-ticular attention was paid to the interpretation of theprofiles of the P, R, and Q branch lines. Calculationsof several lines up to R(22.5) gave, within the noise,good interpretation of the observed line shapes as illus-trated in Fig. 8. Some low J lines showed a differencebetween the relative intensities of the two spin-orbittransitions. For example, the R2(2.5) calculated in-tensity (Fig. 7) is slightly too weak when comparedwith the R1(2.5). This may be due to the lack in thecalculation procedure of the effect of linewidth varia-tion explained in Ref. 5. Nevertheless no departurefrom the general observed shapes was seen. Attemptsto induce a double profile of the Q2(1.5) type, withdifferent values taken for the gj Land6 factors, for theX-doubling, and for the linewidth of the sinc2 functionwere unsuccessful. These attempts at least validate i-nthe observed domain the Land6 factor values calculat-ed from Refs. 10 and 11 and also, unsurprisingly, the X-doubling estimates.
This particular structure of the Q2(1.5) line is in-duced by the magnetic field. It cannot be understoodas being a consequence of the spatial field distribution,which was measured, and presents a smooth variationalong the axis of observation.7 The Q2(1.5) is not theonly line that reveals the discussed effect. Clearly theQ2(2.5) is also broader than the following Q transitions.The evolution with J of the linewidth suggests a non-linear behavior in J. Since the hyperfine effect is fieldindependent to the first order it should not explain theline shape of the Q2(1.5) unless the field interactionswith nuclear spin and electronic angular momentumare strong enough. To estimate the validity of a non-linear Zeeman interaction, diagnonalization of theZeeman matrix' 5 was performed. The corrections tothe first-order Zeeman positions with a field magni-tude of 560 G were found to be at most 0.5 X 10⁻³ cm1for a shift equal to -20 X 10-3 cm-, which is too smallto provide a satisfactory explanation. As a result theeffect responsible for the Q2(2.5) line shape is notunderstood.
V. Conclusion
The polarization method proposed in this paper tofacilitate, in the high resolution spectra, recognition ofthe lines emitted or absorbed by paramagnetic speciesshows efficient selectivity. It works over wide spectralranges and benefits from the usual advantages of highinformation Fourier transform spectroscopy. It
should be useful for the discovery of new molecularspecies.
This new method is used for the first time withFourier spectroscopy. The modulation is uniquelydue to the source and not to the interferometer or toboth, as in the double modulation method. Practical-ly this modulation does not affect the constant back-ground of the interferogram and consequently does notrestrict the dynamic range of the measurements.
The polarization modulation does not improve thesensitivity of the detection. In fact, all the photonsdue to the transitions which are not detected fall ontothe detectors and contribute to the noise in the inter-ferogram. To improve the sensitivity, care should betaken that the undetected light does not reach thesedetectors. This may be done with the Faraday effect,or more precisely, by the absorption technique be-tween crossed linear polarizers. In order not to seeuseless photons, the probed radicals stop emitting andshould then be observed at their fundamental level byusing, for example, a postdischarge technique.
The antisymmetric profile provided by this newmodulation technique may be useful to extract moreconveniently specific information contained in the lineshapes. A particular profile of the low J lines of the Qbranch of NO in a magnetic field was recorded, but toour knowledge it is not yet understood.
Because the magnetic field needs to be varied, Zee-man modulation, which is a frequency modulationtechnique, presents some inconveniences when com-pared with the polarization modulation method.However recent frequency modulation Fourier trans-form spectroscopy remains of great interest for otherspecific applications. For example, it was recentlydemonstrated, through the discovery of SH-,' 6 thatour reactor was able to produce ionized species. Thision would not have been detected without the earlierresults provided by laser spectroscopy using velocitymodulations which should be, if coupled to Fouriertransform spectroscopy, a promising frequency modu-lation technique.
This work was supported by an equipment grantfrom the CNRS Formation GRECO 38.
References
1. See, for example, Technical Digest of Topical Meeting on HighResolution Transform Spectroscopy (Optical Society of Ameri-ca, Washington, DC, 1989).
2. P. Chollet, G. Guelachvili, M. Morillon-Chapey, P. Gressier, andJ. P. M. Schmitt, "High-Information Infrared Spectroscopy ofUnstable Molecules," J. Opt. Soc. Am. B 3, 687-695 (1986).
3. P. Jensen and W. P. Kraemer, "A Variational Calculation of theRotation-Vibration Energies for CNC+ and CCN+," J. Mol.Spectrosc. 129, 216-222 (1988).
4. G. Guelachvili, "Selective Detection of Paramagnetic Species byHigh-Information Fourier-Transform Spectrometry," J. Opt.Soc. Am. B 3, 1718-1721 (1986).
5. M. Elhanine, R. Farrenq, and G. Guelachvili, "Zeeman-Modula-tion Fourier Transform Spectroscopy," Mikrochim. Acta(Wien) II, 265-269 (1988).
6. C. M. Deeley and J. W. C. Johns, Herzberg Institute of Astro-physics; private communication.
7. For more details see M. Elhanine, "Spectroscopies s6lectives partransformation de fourier et laser a diodes. Etude infrarouge demolecules transitoires" These N1970 Orsay (1989).
9. J. T. Hougen, "The Calculation of Rotational Energy Levels andRotational Line Intensities in Diatomic Molecules," Natl. Bur.Stand. U.S. Monogr. 115 (1970).
10. H. E. Radford, "Microwave Zeeman Effect of Free HydroxylRadicals," Phys. Rev. 122, 114-130 (1961).
11. R. L. Brown and H. E. Radford, "L-Uncoupling Effects on theElectron-Paramagnetic-Resonance Spectra of 4N'60 and 5N-160," Phys. Rev. 147, 6-12 (1966).
12. C. Amiot, R. Bacis, and G. Guelachvili, "Infrared Study of theX 211 v = 0,1,2 Levels of 4N160. Preliminary Results on the v =0,1 Levels of 4N17
0, 14N180 and 5N16
0," Can. J. Phys. 56, 251-265 (1978).
13. L. A. Nafie, N. S. Lee, G. Paterlini, and T. B. Freedman, "Polar-ization Modulation Fourier Transform Infrared Spectroscopy,"Mikrochim. Acta (Wien) III, 93-104 (1988).
14. W. Hermann, W. Rohrbeck, and W. Urban, "Lineshape Analysisfor Zeeman Modulation Spectroscopy," Appl. Phys. 22, 71-75(1980).
15. C. C. Lin and M. Mizushima, "Theory of the Hyperfine Struc-ture of the NO Molecule. II. Errata and Some AdditionalDiscussions," Phys. Rev. 100, 1726-1730 (1955).
16. M. Elhanine, R. Farrenq, G. Guelachvili, and M. Morillon-Cha-pey, "Negative Ion SH-: The Vibration Rotation Bands Be-tween 2200 and 2750 cm- 1 by Fourier Transform Spectroscopy,"J. Mol. Spectrosc. 129, 240-242 (1988).
17. R. J. Saykally, "Infrared Laser Spectroscopy of Molecular Ions,"Science 329, 157-161 (1988).