44
annual report Police Credit Union 2011
| Date post: | 11-May-2019 |
| Category: |
Documents |
| Upload: | truongdung |
| View: | 216 times |
| Download: | 0 times |

annual report
Police Credit Union 2011

Mission Statement 2
Key Statistics of the Credit Union 2
Directors’ Report 3
Directors’ Declaration 9
Auditor’s Report 10
Statement of Comprehensive Income 11
Statement of Changes in Member Equity 12
Statement of Financial Position 13
Statement of Cash Flows 14
Notes to and Forming Part of the Accounts 15
General Information 42
Table of Contents

2 Mission Statement & Key Statistics
Capital Adequacy
2011 20.09%
2010 19.45%
Membership
2011 74,607
2010 73,877
Deposits $000’s
2010
2011 997,179
915,621
Reserves $000’s
2010
2011 123,626
112,479
Loans $000’s
2010
2011 918,223
858,645
Total Assets $000’s
2010
2011 1,142,072
1,046,597
The Police Credit Union is a community of Members, Directors and Staff who together form an important and integral part of the life of Police, family and associated community groups.
Directors and Staff operate in the interest of all Members according to the following key values: • A flexible and caring response to Members’ needs; • Honouring excellence in relationships between and among
Members, Directors and Staff; • Personal honesty and integrity.
We provide personal attention to the financial well-being of each Member through flexible products and services in a competitive environment combined with prudential financial management in pursuing appropriate levels of growth.
We work together in building the Police Credit Union to become the best in Member service, range of relevant products and services, management practices and financial strength.
MISSION STATEMENT
KEY STATISTICS

3Directors’ Report
Other Committees
Meetings Attended Eligible Attended Meetings Attended Eligible Attended Meetings Attended Eligible Attended
Moroney 10 12 - - 2 2
Walton 12 12 4 4 3 4
Biscoe 12 12 - - 14 15
Del Vecchio 12 12 4 4 8 8
Green 11 12 4 4 6 6
Lauer 10 12 - - 14 15
Loughlin 11 12 4 4 8 8
Taylor 12 12 - - 21 21
Audit CommitteeBoard
Your Directors submit the Financial Accounts of the Credit Union for the financial year ended 30 June, 2011.
Directors’ DisclosuresThe names of Directors in office at the date of this report, or who held office during the course of the financial year, are:
Kenneth Edward Moroney (Chairman)David Charles Walton (Deputy Chairman)Paul Thomas BiscoeRaff Del Vecchio Geoffrey Richard GreenAnthony Raymond LauerGraham James Loughlin Lloyd William Taylor
Directors’ BenefitsNo Director has received or become entitled to receive during, or since the financial year, a benefit because of a contract made by the Credit Union, controlled entity, or a related body corporate with a Director, a firm of which a Director is a member or an entity in which a Director has a substantial financial interest, other than that disclosed in note 31 of the financial report.
Indemnification and InsuranceDuring the year, a premium was paid in respect of a contract insuring Directors and Officers of the Credit Union against any costs and expenses incurred by them in defending any legal proceedings arising out of their conduct while acting in their capacity as an Officer of the Credit Union. The Officers of the Credit Union covered by the insurance contract include the Directors, Executive Officers, Secretary and Employees. In accordance with normal commercial practice, disclosure of the total amount of premium payable under, and the nature of liabilities covered by, the insurance contract is prohibited by a confidentiality clause in the contract.
No insurance cover has been provided for the benefit of the auditors of the Credit Union.
Share OptionsThe Credit Union has not issued any options over shares. All shares issued by the Credit Union are withdrawable shares.
Principal ActivitiesThe principal activities of the Credit Union during the year were the provision of financial and associated services to Members. There were no significant changes in the principal activities during the year.
Operating Results The Credit Union’s profit after providing for income tax and Minority Equity Interest amounted to $11,136,616. The previous year’s comparable result was $10,422,069. This is an increase in profit for the year of $714,547. Assets increased during the year by $95.5M from $1,046.6M to $1,142.1M. The year’s growth had no impact on the capital adequacy ratio which increased from 19.45% to 20.09%. At 20.09% the capital adequacy ratio remains well above the statutory minimum of 8%.
These results were achieved in an environment where the effects of the global financial crisis continue to be felt, and competition in the domestic banking industry continues to be intense with depositors benefiting from higher margins. The results reflect the continuing support of the Membership for the products and services offered by the Credit Union and the ongoing attention given by both the Board and Management to Member service, relevant products and the control of costs. It is envisaged that the results for the year ending 30 June 2012 will be similar to those achieved in 2011.
DividendsNo dividends have been paid or declared since the end of the financial year and no dividends have been recommended or provided for by the Directors of the Credit Union.
DIRECTORS’ REPORT

4 Directors’ Report
Review of OperationsThe results of the Credit Union’s operations from its activities of providing financial services to Members did not change significantly from those of the previous year. During the year a number of significant activities and events took place:
n Annual Employee Awards. Star Achievers are awarded to staff who consistently deliver an outstanding level of service, demonstrating a commitment above and beyond the normal call of duty. Congratulations go out to our 2011 winners: Chris Cureton – Marketing Teresa Scarfo – Business Development Craig McGinniskin – Newcastle Branch Tim Grove – Information Technology
In addition to the above, a new award known as the PCU Young Achiever was also introduced. The purpose of this award to acknowledge, encourage and most importantly promote the positive achievements of young employees of the Credit Union. Melissa Young from Transaction Services was the inaugural winner.
n Continued Sponsorship Association with NSW Police Legacy. The Credit Union during the year continued our sponsorship association with Police Legacy. The Credit Union is recognised as a ‘major sponsor’ providing financial and operational support. PCU is proud to assist Legacy to help continue their excellent work assisting police families.
n Supporter of Credit Union Foundation Australia (CUFA). Police Credit Union is a ‘Silver Sponsor’ of the Foundation. CUFA develops community access to affordable financial services in the Asia-Pacific region, working co-operatively at grass-roots through to government levels. Through programs and activities, CUFA aims to create sustainability, improve lives and relieve poverty.
n New Customs Credit Union Branch. The Customs Credit Union (CCU) operation continues to expand with the opening during the year of an additional branch in Melbourne. This modern facility provides our current and future Customs’ Members with a more convenient banking service and is part of our strategy to continue to expand our product offerings into this new market. The Melbourne location is now the third office opened (Sydney and Canberra being the other two) since the merger of HMC Credit Union in 2009.
n Additional Products:Verified by Visa: PCU launched a new “Verified by Visa” service during the year which provides additional security for Members when buying online. Verified by Visa ensures that only the rightful cardholder can use a Visa Card online.
Website Improvements: During the year the Credit Union released an upgrade to its online membership and loan application process. Joining PCU and applying for a loan online is now a more streamlined process resulting in a quicker completion process, all within a secure online environment. In addition a number of extra functions were introduced to help Members self-manage their account. PCU will launch towards the end of 2011 a ‘next generation’ website which will make available to Members further enhancements for interacting online.
Introduction of Social Media sites: Social media sites have become important communication channels around the world and PCU has joined this space with the launch during the year of both Facebook and Twitter sites. The sites are proving popular with a steady increase in usage by Members.
Mobile Phone Banking: We were pleased to be able to offer Members during the year the convenience of accessing Internet Banking from a mobile device whether it’s to view account balances, analyse transaction listings, transfer funds or pay bills. Members with an iPhone, iPod Touch or any device that uses Windows Live can securely access PCU internet banking.
‘Bonus Saver’ Account: PCU launched a new savings account which enables Members to reach their goals faster with the ability to earn bonus interest when $100 or more is deposited per month with no withdrawals.
n Events: Annual Police Games: PCU was once again a proud sponsor of the NSW Police Games. Held annually in March, the Games stage around 30 sports with the theme of encouraging integrity, fair play, team work and co-operation. The Games are a wonderful opportunity for PCU to support many of our Members and promote our services.
Family Fun Days: This year two family fun days were held at Luna Park. The event is designed to provide an opportunity to show appreciation to Members for their support of PCU. In all, over 600 Members took the opportunity to enjoy a family oriented day at an iconic venue.
Annual PCU Charity Golf Day: PCU held its Annual Charity Golf Day in May 2011 at New Brighton Golf Course. The successful event was well supported by Members with all money raised from the day being donated to NSW Police Legacy
n PCU Sponsorship Program: Police Credit Union is strongly committed to the Police Community and through our sponsorship program we generously supported during the year a varied number of Police charities, events and fund raisers. Many of these sponsorships have contributed towards significantly improving the lives of individuals as well as assisting with community projects.
n Recognition of Police Academic Achievement: In partnership with Charles Sturt University, Police Credit Union sponsors an academic achievement award at the Goulburn Police Academy recognising student officers who have excelled with their studies.
n Community Employee Engagement: During the year PCU staff were active with various initiatives to assist individuals and communities. In addition to supporting people disadvantaged from the recent devastating natural disasters, a number of charities such as Westmead Children’s Hospital, Beyond Blue, Cancer Council and the Children’s Medical Research Institute all benefited from the fund raising efforts of PCU employees.
n PCU Green Initiatives: PCU is committed to reducing its carbon footprint by undertaking a number of environmental initiatives. Producing electronic statements, engaging environmentally efficient suppliers, recycling/reduction of paper and a level of self sufficient water and power facilities at the Goulburn Processing Centre are some of the actions currently in place.
n Continuous Operational Improvement. Management has maintained its focus on continuous internal improvements through re-engineering of underlying processes aimed at improving Member service and internal productivity. The desired outcomes are to grow whilst limiting the need for additional capital, keeping cost increases to a minimum and to meet price competition without significantly impacting upon profitability.

5Directors’ Report
Significant Changes In State Of AffairsThere were no significant changes in the state of the affairs of the Credit Union during the year.
Events Occurring After Balance DateNo other matters or circumstances have arisen since the end of the financial year which significantly affected or may significantly affect the operations, or state of affairs of the Credit Union in subsequent financial years, except for:
n Price Competition. Police Credit Union provides an excellent level of service, which allows it to compete on more than price alone. However, the Board and Management are mindful that competition cannot be ignored and that price is certainly a factor in Members’ consideration of their ongoing relationship with the Credit Union. However, being a mutual organisation and not having to provide dividends for shareholders does allow room to pass on pricing reflective in the marketplace.
n Global Financial Markets. The current global turmoil could have a flow-on effect locally and impact on asset prices. Police Credit Union has no direct exposure to any overseas activity and is well placed to weather any effects of the volatility. PCU continues to adopt safe and conservative lending and investment practices.
Likely Developments and ResultsThe likely developments in the operations of the Credit Union and the expected results of those operations in the financial year subsequent to the year ended 30 June 2011 are as follows:
n The Board of Directors anticipate that the profit will be in the vicinity of 0.8% - 0.95% return on average assets.
n Planned capital expenditure on infrastructure amounts to $1.8M for the year ending 30 June 2012. This covers general equipment and core banking upgrades. No other matter, circumstances or likely developments in the operation has arisen since the end of the financial year that has significantly affected or may significantly affect:
(i) The operations of the Credit Union;
(ii) The results of those operations; or
(iii) The state of affairs of the Credit Union.
In the financial years subsequent to this financial year.
The Auditors have provided the Declaration of Independence to the Board as prescribed by the Corporations Act 2001 as set out on this page.
Declaration of Independence by Neville Sinclair to The Directors of the Police Department Employees’ Credit Union Limited
As lead Auditor of The Police Department Employees’ Credit Union Limited for the year ended 30 June 2011, I declare that to the best of my knowledge and belief, there have been no contraventions of:
(i) the Auditor independence requirements of the Corporations Act 2001 in relation to the audit, and
(ii) any applicable code of professional conduct in relation to the audit.
Neville SinclairDirector
BDO Audit (NSW-VIC) Pty Ltd
Signed in Sydney this 29th day of September 2011.

6 Directors’ Report
Information on Directors and Secretary
Mr K E Moroney ChairmanAO, APM Remuneration Committee (Chairman) Age 66 Qualifications Doctor of the University, Hons Causa (Charles Sturt University) Master of Arts (Macquarie University) Diploma Justice Administration (Charles Sturt University) Graduate Diploma Management (Macquarie University) Other Qualifications Officer in the Order of Australia (General Division) Former Commissioner, NSW Police Former Deputy President, Police Association of NSW Life Member, Police Association of NSW Holder of Australian Police Medal for Distinguished Service Member, Australian Mutuals Institute Graduate, Federal Bureau of Investigation Academy (Quantico, Virginia, USA) Board Member since 1994 Other Responsibilities Patron, Lifeline (Macarthur) Include Patron, Youth Off the Streets Chairman & Presiding Officer, Australian Graduate School of Policing, Manly Experience Member, State Parole Authority Member, Board & State Council St John’s Ambulance NSW Member, Conduct Division, Judicial Commission Member, Law Enforcement Advisory Panel, World Bank Interest in Shares $10.00 in ordinary shares in the Police Credit Union
Mr D C Walton Deputy Chairman Audit Committee (Chairman) Risk Management & Compliance Committee Age 46 Qualifications Bachelor of Business Master of Management & Leadership Company Directors Course Diploma, Australian Institute of Company Directors Fellow, Australian Institute of Company Directors Member, Australasian Mutuals Institute Experience Manager Academic Programs - International, Australian Institute of Police Management Former, NSW Police Fraud Squad & Detective Inspector of Police Volunteer Auditor, Police RSL Sub-Branch Volunteer Auditor, Police Provident Fund (2006 – 2010) Casual Academic Staff (Charles Sturt University) (Graduate School of Policing & Faculty of Arts) (1997 – 2008) Casual Academic Staff, University of Western Sydney (Faculty of Arts, Policing Studies) (1999) Former Executive Manager of Audit & Risk, Energy Australia Board Member since 2001 Interest in Shares $10.00 in ordinary shares in the Police Credit Union
Mr P T Biscoe Director Credit Committee Remuneration Committee Corporate Governance Committee Age 60 Qualifications Member of the Australian Mutuals Institute Experience President of the Retired Police Association Police Legacy Legator Police RSL Sub-Branch Member Board Member since 2000 Interest in Shares $10.00 in ordinary shares in the Police Credit Union

7Directors’ Report
Mr R Del Vecchio Director Corporate Governance Committee (Chairman) Audit Committee Risk Management & Compliance Committee Age 42 Qualifications Company Directors Course Diploma, Australian Institute of Company Directors Graduate, Australian Institute of Company Directors Post Graduate Diploma in Criminology Bachelor of Policing Member, Australasian Mutuals Institute Experience Current Head of Administrative Services, Police Association of NSW Chairman, Police Shop of NSW Director, Police Legacy NSW Member, Police Superannuation Advisory Board Member, Retired Police Association Senior management positions within financial institutions – specialising in fraud identification, risk management & card operations Co-author of ACTU publication on Financial Best Practices in Trade Unions (nationally published) Board Member since April 2008 Interest in Shares $10.00 in ordinary shares in the Police Credit Union
Mr G R Green Director Audit Committee Corporate Governance Committee Remuneration Committee Age 66 Qualifications L.L.B. (Hons) Barrister of the Supreme Court of NSW Fellow, Australasian Mutuals Institute Experience Former Secretary Legal & Senior Vice President of the Police Association of NSW Life Member, Police Association of NSW Member, Retired Police Association Board Member since 1989 Interest in Shares $10.00 in ordinary shares in the Police Credit Union
Mr A R Lauer Director Credit Committee (Chairman) Risk Management & Compliance Committee Age 75 Qualifications Diploma in Criminology (University of Sydney) (1973) Graduate, NSW Police Senior Executive Course (Merit) (Australian Police College) (1986) Graduate, Senior Executive Police Officer Course (Australian Police Staff College) (1987) Graduate, Seventeenth National Executive Institute – Federal Bureau of Investigation Academy (Quantico, Virginia, USA) (1994) Honorary Fellow, NSW Police Academy (1996) Associate Fellow, Australian Mutuals Institute (1996) Experience Career Police Officer (1955 – 1996) President, Police Association of NSW (1979 – 1982) Commissioner of Police 1991 – 1996 Board Member since 1997 Interest in Shares $10.00 in ordinary shares in the Police Credit Union

8 Directors’ Report
Mr G J Loughlin Appointed Director Risk Management & Compliance Committee (Chairman) Audit Committee Corporate Governance Committee Age 61 Qualifications Bachelor of Arts, Hons (Adelaide) Graduate Certificate Management (Monash University - Mt. Eliza) Member, Australian Institute of Company Directors Associate, Chartered Secretaries Australia Experience Current Manager Group Strategic Development & Company Secretary, DataDot Technology Limited Director - DataDot Technology (UK) Limited Director - DataDot Technology (Asia) Pte. Ltd. Appointed Director April 2008 Previous Director, Data Advantage Limited Chairman, AFCUL Service Corporation Limited General Manager, Credit Union Services Corporation (Aust) Limited Member, Australian Housing Council Member, Australian Payments System Council Director, Jetset Tours (SA) Pty. Ltd. Member, SA Credit Union Stabilization Board Executive Assistant, SA Premier & Treasurer Interest in Shares $10.00 in ordinary shares in the Police Credit Union
Mr L W Taylor Director Corporate Governance Committee Credit Committee Risk Management & Compliance Committee Age 70 Qualifications Mediator, Australian Commercial Disputes Centre Fellow, Australasian Mutuals Institute Experience Former President, Federation of Police Credit Unions (Australia) (1999 – 2006) Convenor, Juvenile Justice (1997 – 2009) Deputy Chairman, 1992 – 1996, Chairman (1996 – 2001) Former Audit Chairman Former Secretary Administration, Police Association of NSW Former President, Police Association of NSW Life Member, Police Association of NSW Life Member, Police Federation of Australia & New Zealand Board of Management, Retired Police Association Member, Police Education Advisory Committee (1988 – 1996) Member, Police Superannuation Advisory Committee (1986 – 1997) Former Honorary Secretary, Police Legacy Board Member since 1988 Interest in Shares $10.00 in ordinary shares in the Police Credit Union
Mr B A Williams Secretary Qualifications Master of Business in Finance FCIS Experience 39 years of experience in banking and finance Directorships Credit Union Financial Support System Limited Chelsea Wealth Management Pty Limited Chelsea Home Loans Pty Limited.

9Directors Declaration
AcknowledgmentsIn concluding this Report, the Board wishes to acknowledge its appreciation of Bruce Williams, Chief Executive Officer, the Management and Staff of the Credit Union without whose expertise and commitment the achievements of the past year would not have been achieved.
This Report is made in accordance with a resolution of the Board of Directors and is signed for and on behalf of the Directors by:
Kenneth E Moroney David C Walton Chairman Deputy Chairman 29th September 2011
The Police Department Employees’ Credit Union Limited
Directors’ Declaration
The Directors of The Police Department Employees’ Credit Union Limited declare that: 1 The financial statements comprising Statement of Financial Position, Statement of Comprehensive Income, Statement of Changes in Members
Equity, Statement of Cash Flows, and accompanying notes related thereto, are in accordance with the Corporations Act 2001; and: a) comply with Accounting Standards and the Corporations Regulations 2001; and b) give a true and fair view of the financial position of the Credit Union as at 30 June 2011 and the performance for the year ended on that
date. 2 In the Directors’ opinion there are reasonable grounds to believe that the Credit Union will be able to pay its debts as and when they become due
and payable.
This declaration is made in accordance with a resolution of the Board of Directors.
Kenneth E Moroney David C Walton Chairman Deputy Chairman 29th September 2011
DIRECTORS’ DECLARATION
10 Independent Auditor’s Report
To the Members of The Police Department Employees’ Credit Union LimitedWe have audited the accompanying financial report of The Police Department Employees’ Credit Union Limited, which comprises the statement of financial position as at 30 June 2011, and the statement of comprehensive income, statement of changes in members equity and statement of cash flows for the year ended on that date, a summary of significant accounting policies, other explanatory notes and the Directors’ Declaration for consolidated entity comprising the company and the entities it controlled at the year’s end or from time to time during the financial year.
Directors’ Responsibility for the Financial ReportThe Directors of the Credit Union are responsible for the preparation and fair presentation of the financial report in accordance with Australian Accounting Standards (including the Australian Accounting Interpretations) and the Corporations Act 2001. This responsibility includes establishing and maintaining internal controls relevant to the preparation and fair presentation of the financial report that is free from material misstatement, whether due to fraud or error; selecting and applying appropriate accounting policies; and making accounting estimates that are reasonable in the circumstances. In Note 1, the Directors also state, in accordance with Accounting Standard AASB 101 Presentation of Financial Statements, that compliance with the Australian equivalents to International Financial Reporting Standards ensures that the financial report, comprising the financial statements and notes, complies with International Financial Reporting Standards.
Auditor’s ResponsibilityOur responsibility is to express an opinion on the financial report based on our audit. We conducted our audit in accordance with Australian Auditing Standards. These Auditing Standards require that we comply with relevant ethical requirements relating to audit engagements and plan and perform the audit to obtain reasonable assurance whether the financial report is free from material misstatement.
An audit involves performing procedures to obtain audit evidence about the amounts and disclosures in the financial report. The procedures selected depend on the auditor’s judgement, including the assessment of the risks of material misstatement of the financial report, whether due to fraud or error. In making those risk assessments, the auditor considers internal control relevant to the entity’s preparation and fair presentation of the financial report in order to design audit procedures that are appropriate in the circumstances, but not for the purpose of expressing an opinion on the effectiveness of the entity’s internal control. An audit also includes evaluating the appropriateness of accounting policies used and the reasonableness of accounting estimates made by the Directors, as well as evaluating the overall presentation of the financial report.
We believe that the audit evidence we have obtained is sufficient and appropriate to provide a basis for our audit opinion.
IndependenceIn conducting our audit, we have complied with the independence requirements of the Corporations Act 2001. We confirm that the independence declaration required by the Corporations Act 2001 provided to the Directors of The Police Department Employees’ Credit Union Limited, would be in the same terms if provided to the Directors at the time that this Auditor’s Report was made.
Auditor’s Opinion
In our opinion: a. the financial report of The Police Department Employees’ Credit
Union Limited is in accordance with the Corporations Act 2001, including:
i. giving a true and fair view of the Company’s and consolidated entity’s financial position as at 30 June 2011 and of its performance for the year ended on that date; and
ii. complying with Australian Accounting Standards (including
the Australian Accounting Interpretations) and the Corporations Regulations 2001: and
b. the financial report also complies with International Financial Reporting Standards as disclosed in Note 1.
BDO Audit (NSW-Vic) Pty Ltd
Neville SinclairDirectorSigned in Sydney this 30th day of September 2011
INDEPENDENT AUDITOR’S REPORT

11Page Title 11Statement of Comprehensive Income
Consolidated Credit Union
2011 2010$ $
2011 2010$ $
Interest Revenue 2a 80,107,802 66,651,145 80,107,802 66,651,145
Borrowing Costs 2b 43,695,939 32,990,019 43,695,939 32,990,019
Net Interest Revenue 36,411,863 33,661,126 36,411,863 33,661,126
Other revenue from ordinary activities
3 7,986,509 8,816,994 7,536,432 8,424,489
Impairment losses on Loan Receivables from Members
4a 1,216,006 787,715 1,216,006 787,715
Fees and Commission 5,199,392 5,487,437 5,199,392 5,487,437
General Administration
- Personnel expenses 12,049,383 11,661,566 12,049,383 11,661,566
- Depreciation and amortisation 1,385,112 1,954,000 1,384,260 1,954,000
- Lease expenses 1,095,277 859,223 1,095,277 859,223
- Other administration expenses 4,176,910 3,707,249 3,808,505 3,315,722
Other operating expenses 3,190,053 3,110,956 3,190,053 3,110,956
Operating Profit before Income Tax 16,086,239 14,909,974 16,005,419 14,908,996
Income Tax Expense 5 4,659,709 4,487,734 4,635,093 4,487,734
Operating Profit after Income Tax 11,426,530 10,422,240 11,370,326 10,421,262
Minority Equity Interest Adjustment (9,836) (171) - -
Profit attributable to Members of the parent entity
11,416,694 10,422,069 11,370,326 10,421,262
Other comprehensive income (280,078) - (280,078) -
Total comprehensive income 11,136,616 10,422,069 11,090,248 10,421,262
For the Year Ended 30 June 2011
Note
The accompanying notes form part of these accounts and are to be read in conjunction therewith.
STATEMENT OF COMPREHENSIVE INCOME

12 Statement of Changes in Members Equity
Consolidated
Balance 1 July 2009 292,940 61,451,212 2,459,627 2,846,306 377,671 1,430,212 33,199,082 102,057,050
Operating Profit for the year - 10,422,240 - - - - - 10,422,240
Profit attributable to minority shareholders - (171) - - - - 211 40
Transfers to and from Reserves
- General Reserves - (1,200,000) - - - - 1,200,000 -
- Capital Account 21,270 (21,270) - - - - - -
- Reserves for Credit Losses - - - - - - - -
- Revalution Reserve - - - - - - - -
Transfer of Engagements - - 84,105 - (84,105) - - -
Balance 30 June 2010 314,210 70,652,011 2,543,732 2,846,306 293,566 1,430,212 34,399,293 112,479,330
Balance 1 July 2010 314,210 70,652,011 2,543,732 2,846,306 293,566 1,430,212 34,399,293 112,479,330
Operating Profit for the year - 11,426,530 - - - - - 11,426,530
Profit attributable to minority shareholders - (9,836) - - - - 9,836 -
Transfers to and from Reserves
- General Reserves - (1,200,000) - - - - 1,200,000 -
- Capital Account 14,530 (14,530) - - - - - -
- Reserves for Credit Losses - (150,000) - 150,000 - - - -
- Revalution Reserve - - - - - - - -
Cash Flow Hedge Reserve - - - - - - (280,078) (280,078)
Balance 30 June 2011 328,740 80,704,175 2,543,732 2,996,306 293,566 1,430,212 35,329,051 123,625,782
Credit Union Capital Account
Retained Profits
Reserve for Credit Losses
Asset Revaluation
ReserveCapital Profits
Reserve
Transfer of Engagements
ReserveOther
Reserves Total
Balance 1 July 2009 292,940 61,465,792 2,459,627 2,846,306 377,671 1,430,212 33,197,000 102,069,548
Operating Profit for the year - 10,421,262 - - - - - 10,421,262
Transfers to and from Reserves -
- General Reserves - (1,200,000) - - - - 1,200,000 -
- Capital Account 21,270 (21,270) - - - - - -
- Reserves for Credit Losses - - - - - - - -
Transfer of Engagements - - 84,105 - (84,105) - - -
Balance 30 June 2010 314,210 70,665,784 2,543,732 2,846,306 293,566 1,430,212 34,397,000 112,490,810
Balance 1 July 2010 314,210 70,665,784 2,543,732 2,846,306 293,566 1,430,212 34,397,000 112,490,810
Operating Profit for the year - 11,370,326 - - - - - 11,370,326
Transfers to and from Reserves
- General Reserves - (1,200,000) - - - - 1,200,000 -
- Capital Account 14,530 (14,530) - - - - - -
- Reserves for Credit Losses - (150,000) - 150,000 - - - -
Cash Flow Hedge Reserve - - - - - - (280,078) (280,078)
Balance 30 June 2011 328,740 80,671,580 2,543,732 2,996,306 293,566 1,430,212 35,316,922 123,581,058
Capital Account
Retained Profits
Reserve for Credit Losses
Asset Revaluation
ReserveCapital Profits
Reserve
Transfer of Engagements
ReserveOther
Reserves Total
STATEMENT OF CHANGES IN MEMBERS EQUITY

13Statement of Financial Position
As at 30 June 2011 Consolidated Credit Union
2011 2010$ $
2011 2010$ $
Assets
Cash and Liquid Assets 6 56,910,798 11,606,938 56,851,110 11,606,938
Receivables due from other Financial Institutions
7 72,000,000 163,500,000 72,000,000 163,500,000
Accrued Receivables 8 3,389,000 2,634,141 3,344,007 2,598,602
Investment Securities 9 80,787,158 - 80,787,158 -
Loans and Advances 10&11 916,360,594 857,424,598 916,360,594 857,424,598
Available for Sale Investments 12 6,883,082 5,610,154 6,883,089 5,610,161
Property Plant and Equipment 13 3,419,563 3,880,559 3,399,711 3,880,559
Intangible Assets 14 598,842 400,142 598,842 400,142
Taxation Assets 15 1,722,839 1,540,478 1,722,839 1,540,478
Derivative Fair Value - - - -
Total Assets 1,142,071,876 1,046,597,010 1,141,947,350 1,046,561,478
Liabilities
Payables to other Financial Institutions
16 - - - -
Deposits and Borrowings 17 997,178,757 915,621,165 997,178,757 915,621,165
Creditors and other Liabilities 18 14,997,969 13,294,365 14,996,782 13,280,385
Provisions 19 3,505,554 3,223,968 3,461,626 3,202,457
Taxation Liabilities 20 2,465,493 1,447,665 2,430,806 1,436,144
Derivative Fair Value 298,321 530,517 298,321 530,517
Total Liabilities 1,018,446,094 934,117,680 1,018,366,292 934,070,668
Net Assets 123,625,782 112,479,330 123,581,058 112,490,810
Member Funds
Capital Account 21 328,740 314,210 328,740 314,210
Reserves 42,860,849 41,510,849 42,860,816 41,510,816
Retained Profits 80,704,175 70,652,011 80,671,580 70,665,784
Cash Flow Hedge Reserve (280,078) - (280,078) -
Minority Equity Interest 12,096 2,260 - -
Total Member Funds 123,625,782 112,479,330 123,581,058 112,490,810
Balance 1 July 2009 292,940 61,451,212 2,459,627 2,846,306 377,671 1,430,212 33,199,082 102,057,050
Operating Profit for the year - 10,422,240 - - - - - 10,422,240
Profit attributable to minority shareholders - (171) - - - - 211 40
Transfers to and from Reserves
- General Reserves - (1,200,000) - - - - 1,200,000 -
- Capital Account 21,270 (21,270) - - - - - -
- Reserves for Credit Losses - - - - - - - -
- Revalution Reserve - - - - - - - -
Transfer of Engagements - - 84,105 - (84,105) - - -
Balance 30 June 2010 314,210 70,652,011 2,543,732 2,846,306 293,566 1,430,212 34,399,293 112,479,330
Balance 1 July 2010 314,210 70,652,011 2,543,732 2,846,306 293,566 1,430,212 34,399,293 112,479,330
Operating Profit for the year - 11,426,530 - - - - - 11,426,530
Profit attributable to minority shareholders - (9,836) - - - - 9,836 -
Transfers to and from Reserves
- General Reserves - (1,200,000) - - - - 1,200,000 -
- Capital Account 14,530 (14,530) - - - - - -
- Reserves for Credit Losses - (150,000) - 150,000 - - - -
- Revalution Reserve - - - - - - - -
Cash Flow Hedge Reserve - - - - - - (280,078) (280,078)
Balance 30 June 2011 328,740 80,704,175 2,543,732 2,996,306 293,566 1,430,212 35,329,051 123,625,782
Balance 1 July 2009 292,940 61,465,792 2,459,627 2,846,306 377,671 1,430,212 33,197,000 102,069,548
Operating Profit for the year - 10,421,262 - - - - - 10,421,262
Transfers to and from Reserves -
- General Reserves - (1,200,000) - - - - 1,200,000 -
- Capital Account 21,270 (21,270) - - - - - -
- Reserves for Credit Losses - - - - - - - -
Transfer of Engagements - - 84,105 - (84,105) - - -
Balance 30 June 2010 314,210 70,665,784 2,543,732 2,846,306 293,566 1,430,212 34,397,000 112,490,810
Balance 1 July 2010 314,210 70,665,784 2,543,732 2,846,306 293,566 1,430,212 34,397,000 112,490,810
Operating Profit for the year - 11,370,326 - - - - - 11,370,326
Transfers to and from Reserves
- General Reserves - (1,200,000) - - - - 1,200,000 -
- Capital Account 14,530 (14,530) - - - - - -
- Reserves for Credit Losses - (150,000) - 150,000 - - - -
Cash Flow Hedge Reserve - - - - - - (280,078) (280,078)
Balance 30 June 2011 328,740 80,671,580 2,543,732 2,996,306 293,566 1,430,212 35,316,922 123,581,058
Note
The accompanying notes form part of these accounts and are to be read in conjunction therewith.
STATEMENT OF FINANCIAL POSITION

14 Statement of Cash Flows
For Year Ended 30 June 2011 Consolidated Credit Union
2011 2010$ $
2011 2010$ $
Cash Flow From Operating Activities Note
Interest Received - Loans 67,778,098 58,136,357 67,778,098 58,136,357
Other Income 19,218,269 16,860,953 18,768,193 16,468,448
Dividends Received 744,620 313,434 744,620 313,434
Interest Paid (42,476,255) (31,946,366) (42,476,255) (31,946,366)
Suppliers and Employees (26,926,529) (21,793,368) (26,556,844) (21,398,253)
Taxes Paid (2,791,246) (3,186,919) (2,791,246) (3,186,919)
Net Cash from Revenue Activities 36c 15,546,957 18,384,091 15,466,566 18,386,701
Inflows from Other Operating Activities
Net Movement in Member Loans (60,110,319) (53,486,100) (60,110,319) (53,486,100)
Net Movement in Member Shares (14,530) (21,310) (14,530) (21,310)
Net Movement in Deposits 81,572,121 67,408,052 81,572,121 67,408,052
Net Cash from Operating Activities 36,994,229 32,284,733 36,913,838 32,287,343
Cash Flows from Investing Activities
Investment Redemption 704,547,770 530,555,422 704,547,770 530,555,422
Proceeds from Sale of Fixed Assets 50,700 1,012,950 50,700 1,012,950
Purchase of Investments (695,107,855) (558,119,211) (695,107,855) (558,119,211)
Purchase of Fixed Assets (1,180,984) (2,011,412) (1,160,281) (2,011,412)
Net Cash Used in Investing Activities 8,309,631 (28,562,251) 8,330,334 (28,562,251)
Cash Flow from Financing Activities
Net Movement in Borrowings - - - -
Net Cash Provided by Financing Activities
- - - -
Net Increase (Decrease) in Cash 45,303,860 3,722,482 45,244,172 3,725,092
Cash at Beginning of Year 11,606,938 7,884,456 11,606,938 7,881,846
Cash at End of Reporting 56,910,798 11,606,938 56,851,110 11,606,938
Reconciliation of Cash at End of Reporting Period
36a
Cash 3,344,045 3,606,938 3,284,357 3,606,938
Overdraft - - - -
Deposits at Call 53,566,753 8,000,000 53,566,753 8,000,000
Total 56,910,798 11,606,938 56,851,110 11,606,938
STATEMENT OF CASH FLOWS

15Notes to and Forming Part of the Accounts
1Statement of Accounting Policies
The financial report is a general purpose financial report which has been prepared in accordance with Australian equivalents to International Financial Reporting Standards (AIFRS), other authoritative pronouncements of the Australian Accounting Standards Board Urgent Issues Group Interpretations and the Corporations Act 2001. Compliance with Australian equivalents to International Financial Reporting Standards (AIFRS) ensures the financial statements and notes comply with the International Financial Reporting Standards (IFRS).
a. Basis of MeasurementThe financial statements have been prepared on an accruals basis, and are based on historical costs, which do not take into account changing money values or current values of non current assets. The accounting policies are consistent with the prior year unless otherwise stated.
b. Loans to MembersAll loans are initially recognised at fair value, net of transaction costs incurred and inclusive of loan origination fees. Loans are subsequently measured at amortised cost. Any difference between the proceeds (net of transaction costs) and the redemption amount is recognised in the Statement of Comprehensive Income over the period of the loans using the effective interest method. Loans to Members are reported at their recoverable amount representing the aggregate amount of principal and unpaid interest owing to the Credit Union at balance date, less any allowance or provision against debts considered doubtful. A loan is classified as impaired where recovery of the debts is considered unlikely as determined by the Board of Directors.
(i) Interest on Loans - Method of CalculationInterest charged by the Credit Union on Members’ loans funded before the introduction of the Consumer Credit Code on 1st November 1996, other than Overdrafts, are calculated on the basis of charging interest in the initial month from the date the loan is advanced, and thereafter on the first day of the month on the opening balance. On completion of a loan, a full month’s interest is charged on the opening balance for the month in which the loan is finalised. For loans funded after 1st November 1996, the interest is calculated on the basis of the daily balance outstanding and is charged in arrears on the last day of each month.
(ii) Non Accrual Loan Interest While still legally recoverable, interest is not brought to account as income when the Credit Union is informed that the Member has deceased, or on impaired loans where recovery of the debt is considered unlikely as determined by the Board of Directors. APRA has made it mandatory that interest is not recognised as revenue after the irregularity exceeds 90 days for a loan, or 15 days for an overlimit overdraft or credit facility.
(iii) Loan FeesLoan establishment fees are initially deferred as part of the loan balance, and are brought to account as income over the expected life of the loan.
(iv) Transaction CostsTransaction Costs are expenses which are direct and incremental to the establishment of the loan. These costs are initially deferred as part of the loan balance, and are brought to account as a reduction to income over the expected life of the loan.
c. Principles of ConsolidationThe consolidated entity’s financial statements comprise consolidated accounts of the Credit Union and its controlled entities. The effects of intercompany balances, transactions and unrealised profits arising between the controlled entities and the Credit Union are eliminated on consolidation.
d. Property, Plant and EquipmentProperty, Plant and Equipment are stated at the lower of cost less depreciation, or recoverable amount. Fixed Assets are depreciated using the straight line method. The following rates are used:
Building 2.50% Office Equipment 20.00% EDP Equipment 37.50% Motor Vehicles 25.00% EDP Software 37.50% Office Furniture and Fittings 20.00% Leasehold Improvements 25.00%
Assets less than $1,000 are not capitalised. e. Deposits with other Financial InstitutionsTerm Deposits with other Financial Institutions are unsecured and have a carrying amount equal to their principal amount. Interest is calculated on the daily balance and paid at maturity. All deposits are in Australian currency. The accrual for interest receivable is calculated on a proportional basis over the expired period of the term of the investment. Interest receivable, but not yet paid, is included in the amount of receivables in the Statement of Financial Position.
f. Investments and SecuritiesInvestments in shares are classified as available for sale financial assets where they do not qualify for classification as loans and receivables, or investments held for trading. Investments in shares listed on the stock exchanges are revalued to fair value based on the market bid price at the close of business on the balance sheet date. The gains and losses in fair value are reflected in equity through the asset revaluation reserve. Investments in shares which do not have a ready market and are not capable of being reliably valued are recorded at the lower of cost or recoverable amount. Realised net gains and losses on available for sale financial assets taken to the profit and loss account comprises only gains and losses on disposal.
All investments are in Australian currency.
g. Member Savings (i) Basis for Determination Member Savings and Term Deposits are quoted at the
aggregate amount of monies owing to depositors.
(ii) Interest PayableInterest is calculated on savings accounts on a daily basis and credited to most account types every six months at the end of June and December. For Term Deposits, interest is calculated on a daily basis at the agreed rate for the appropriate term and is paid as per the conditions of the term account.
h. Provision for Employee EntitlementsProvision is made for the Credit Union’s liability for employee benefits arising from services rendered by employees to balance date. Employee
NOTES TO AND FORMING PART OF THE ACCOUNTS

16 Notes to and Forming Part of the Accounts
benefits expected to be settled within one year, have been measured at their nominal amount. Other employee benefits payable later than one year have been measured at the present value of the estimated future cash outflows to be made for those benefits discounted using national government bond rates. Provision for long service leave is on a pro-rata basis from commencement of employment with the credit union based on the present value of its estimated future cash flows. Annual leave is accrued in respect of all employees on pro-rata entitlement for part years of service and leave entitlement due but not taken at balance date. Annual leave is reflected as part of the sundry creditors and accruals. Contributions are made by the credit union to an employee’s superannuation fund and are charged to the Statement of Comprehensive Income as incurred.
i. Loan Impairment (i) Specific Provision
Losses for impairment loans are recognised when there is objective evidence that the impairment of a loan has occurred. Impairment losses are calculated on individual loans in arrears. The amount provided for doubtful debts is determined by Management and the Board to recognise the probability of loan amounts not being collected in accordance with terms of the loan agreement. The critical assumptions in the calculation are set out in Note 11. The APRA Prudential Standards requires a minimum provision to be maintained, based on specific percentages on the loan balance which are contingent upon the length of time the repayments are in arrears. This approach is used to assess the collective provisions for impairment. An assessment is made at each balance sheet date to determine whether there is objective evidence that a specific financial asset or a group of financial assets is impaired. Evidence of impairment may include indications that the borrower has defaulted, is experiencing significant financial difficulty, or where the debt has been restructured to reduce the burden to the borrower.
(ii) Reserve for Credit Losses (formerly held as a General Provision) In addition to the above specific provision, the Board has recognised the need to make an allocation from retained earnings to ensure there is adequate protection for Members against the prospect that some Members will experience loan repayment difficulties in the future. The reserve is based on estimation of potential risk in the loan portfolio based upon: - the level of security taken as collateral; and - the concentration of loans taken by employment type As a result of changes to Accounting Standards prescribed by AIFRS, the General Provision is no longer eligible for recognition as a provision to be offset against the gross balance of loans. The provision for general credit risk in the loan portfolio is now recognised as the Reserve for Credit Losses.
(iii) Renegotiated Loans Loans which are subject to renegotiated terms which would have otherwise been impaired do not have the repayment arrears diminished and interest continues to accrue to income. Each renegotiated loan is retained at
the full arrears position until the normal repayments are reinstated and brought up to date and maintained for a period of 6 months.
j. Bad Debts Written OffBad debts are written off from time to time as determined by Management and the Board when it is reasonable to expect that the recovery of the debt is unlikely. Loans written off are brought to account as an expense in the Statement of Comprehensive Income. Bad debts are written off against the provision for doubtful debts if a provision for impairment had previously been recognised.
k. Income TaxThe income tax expense shown in the Statement of Comprehensive Income is based on the operating profit before income tax adjusted for any non tax deductible, or non assessable items between accounting profit and taxable income. Deferred tax assets and liabilities are recognised using the balance sheet liability method in respect of temporary differences arising between the tax bases of assets or liabilities and their carrying amounts in the financial statements. Current and deferred tax balances relating to amounts recognised directly in equity are also recognised directly in equity. Deferred tax assets and liabilities are recognised for all temporary differences between carrying amounts of assets and liabilities for financial reporting purposes and their respective tax bases at the rate of income tax applicable to the period in which the benefit will be received or the liability will become payable. These differences are presently assessed at 30%. Deferred tax assets are only brought to account if it is probable that future taxable amounts will be available to utilise those temporary differences. The recognition of these benefits is based on the assumption that no adverse change will occur in income tax legislation; and the anticipation that the Credit Union will derive sufficient future assessable income and comply with the conditions of deductibility imposed by the law to permit a future income tax benefit to be obtained. l. Goods and Services TaxAs a Financial Institution the Credit Union is Input Taxed on all income except other income from commissions and some fees. An Input Taxed supply is not subject to GST collection, and the GST on purchases cannot be recovered. As some income is charged GST, the GST on purchases are generally recovered on a proportionate basis. In addition, certain prescribed purchases are subject to Reduced Input Tax Credits, of which 75% of the GST paid is recoverable. Revenue, expenses and assets are recognised net of the amount of goods and services tax (GST), except where the amount of the GST incurred is not recoverable from the Australian Tax Office (ATO). In these circumstances, the GST is recognised as part of the cost of acquisition of the asset or as part of an item of the expense. Receivables and payables are stated with the amount of GST included where applicable GST is collected.
The net amount of GST recoverable from, or payable to the ATO, is included as a current asset or current liability in the Statement of Financial Position. Cashflows are included in the statement of cashflows on a gross basis. The GST components of cash flows arising from investing and financing activities which are recoverable from, or payable to, the Australian Taxation Office are classified as operating cash flows.
m. Leasehold on PremisesLeases where the lessor retains substantially all the risks and rewards of ownership of the net asset are classified as operating leases. Payments made under operating leases (net of incentives received from the lessor) are charged to the Statement of Comprehensive Income on a straight-line basis over the period of the lease.

17Notes to and Forming Part of the Accounts
AASB Reference Nature of Change Application date: Impact of Initial Application
AASB 9 Issued Dec 2009 Financial Instruments
Amends the requirements for classification and measurement of financial assets
Periods beginning on or after 1 January 2013
Due to the recent release of these amendments and that adoption is only mandatory for the 30 June 2014 year end, the entity has not yet made an assessment of the impact of these amendments.
A provision is recognised for the estimated make good costs on the operating leases, based on the Net Present Value of the future expenditure at the conclusion of the lease term discounted at 5%. Increases in the provision in future years shall be recognised as part of the interest expense.
n. Intangible AssetsCapitalised software costs that are not an integral part of the associated hardware are classified as intangibles, and are amortised over the useful life of the asset and assessed for impairment whenever there is an indication that the asset may be impaired. The amortisation of the intangible asset is recognised as an expense in the Statement of Comprehensive Income.
o. Impairment of AssetsAt each reporting date the Credit Union assesses whether there is any indication that individual assets are impaired. Where impairment indicators exist, recoverable amount is determined and impairment losses are recognised in the Statement of Comprehensive Incomewhere the asset’s carrying value exceeds its recoverable amount. Recoverable amount is the higher of an asset’s fair value less costs to sell and value in use. For the purpose of assessing value in use, the estimated future cash flows are discounted to their present value using a pre-tax discount rate that reflects current market assessments of the time of value of money and the risks specific to the assets. Where it is not possible to estimate recoverable amount for an individual asset, recoverable amount is determined for the cash-generating unit to which the asset belongs.
p. New or emerging standardsCertain new accounting standards and interpretations have been published that are not mandatory for 30 June 2011 reporting periods. The company’s assessment of the impact of these new standards and interpretations is set out below.
q. Derivatives and Hedging ActivitiesThe Credit Union uses derivative financial instruments to avoid or minimise possible adverse financial effects of movements in interest rates.The Credit Union designates certain derivatives as either:
(i) Fair Value HedgeChanges in the fair value of derivatives that are designated and qualify as fair value hedges are recorded in profit and loss.
(ii) Cash Flow HedgeThe effective portion of changes in the fair value of derivatives that are designated and qualify as cash flow hedges is recognised in other comprehensive income and accumulated in reserves in equity. The gain or loss relating to the ineffective portion is recognised in profit or loss within other income or other expenses.
Amounts accumulated in equity are reclassified to profit or loss in the periods when the hedged item affects profit or loss, for instance, when the forecast transaction that is hedged takes place. Hedge accounting is discontinued when the hedging instrument expires or no longer qualifies for hedge accounting or is terminated. At that point in time, any cumulative gain or loss on the hedging instrument recognised in equity remains in equity until the forecasted transaction occurs. If a hedged transaction is no longer expected to occur, the net cumulative gain or loss recognised in equity is reclassified to profit or loss.

18 Notes to and Forming Part of the Accounts
b. Analysis of Interest Expense Consolidated Credit Union
2011 2010$ $
2011 2010$ $
Category of Interest Bearing Liabilities
Deposits held from other financial Institutions
- - - -
Member Deposits 41,683,767 30,432,306 41,683,767 30,432,306
Overdraft 87,952 68,713 87,952 68,713
Long Term Borrowings - - - -
Others 1,924,220 2,489,000 1,924,220 2,489,000
Total 43,695,939 32,990,019 43,695,939 32,990,019
Consolidated Credit Union
2011 2010$ $
2011 2010$ $
Category of Interest Bearing Liabilities
Cash - Deposit 502,158 380,474 502,158 380,474
Receivables from Financial Institutions 11,827,546 8,134,314 11,827,546 8,134,314
Securities - Trading - - - -
Securities - Investment - - - -
Loans and Advances 67,778,098 58,136,357 67,778,098 58,136,357
Others - - - -
Total 80,107,802 66,651,145 80,107,802 66,651,145
a. Analysis of Interest Revenue
2 Income Statement

19Page Title 19Page Title Notes to and Forming Part of the Accounts
Profit from Ordinary Activities - Revenue 3 Consolidated Credit Union
2011 2010$ $
2011 2010$ $
Dividend Revenue 744,620 313,434 744,620 313,434
Fee and Commission Revenue
- Loan Fee Income 1,388,436 1,640,063 1,388,436 1,640,063
- Other Fee Income 2,147,787 2,136,064 2,147,787 2,136,064
- Insurance Commissions 1,926,666 2,078,423 1,926,666 2,078,423
- Other Commissions 1,104,603 999,285 654,526 606,780
Bad Debts Recovered 147,499 189,439 147,499 189,439
Total Revenue from Ordinary Activities 7,459,611 7,356,708 7,009,534 6,964,203
Other Revenue
- Income from Derivative Fair Value 512,274 1,324,354 512,274 1,324,354
- Other 14,624 135,932 14,624 135,932
Total Revenue from Other Activities 526,898 1,460,286 526,898 1,460,286
Total Revenue from Ordinary and Other Activities
7,986,509 8,816,994 7,536,432 8,424,489
a. Loan Impairment Losses
Increase/(decrease) in provision for impairment 683,282 (95,296) 683,282 (95,296)
Bad Debts written off directly against profit 532,724 883,011 532,724 883,011
Total Impairment Losses 1,216,006 787,715 1,216,006 787,715
b. Other Prescribed Expense Disclosures
Auditor’s Renumeration
- Audit Fees 140,150 147,900 140,150 147,900
- Other Services 82,551 16,188 78,170 16,188
222,701 164,088 218,320 164,088
Profit /(loss) on disposal of assets
- Property, Plant and Equipment (7,469) 125,436 (7,469) 125,436
Net movement in provision for depreciation
- Buildings 32,139 30,965 32,139 30,965
- Plant and Equipment 1,017,016 1,141,840 1,017,016 1,141,840
- Leasehold Improvements 28,447 98,970 28,447 98,970
- Intangible Assets 307,509 682,225 307,509 682,225
Other Expense
- Expense from Derivative Fair Value - - - -
- Supervision Levy 47,318 46,062 47,318 46,062
- Superannuation 1,429,187 1,351,417 1,373,406 1,304,958
4 Profit from Ordinary Activities - Expenses

20 Notes to and Forming Part of the Accounts
Income Tax 5a. The prima facie tax payable on operating
profit is reconciled to the income tax expense in the account as follows
Consolidated Credit Union
2011 2010$ $
2011 2010$ $
Prima facie tax payable on operating profit before income at 30%
4,859,475 4,472,699 4,834,859 4,472,699
Loan fee income and costs deferred 8,013 48,146 8,013 48,146
Tax distribution from ‘PCU 2009-1’ 10,386 - 10,386 -
Entertainment 16,396 15,261 16,396 15,261
First home savers account 4,532 - 4,532 -
Building depreciation 9,642 9,642 9,642 9,642
Imputation credit 95,737 40,299 95,737 40,299
Less:
Refund of income tax (32,857) - (32,857) -
Other:
Rebate on fully franked dividends (319,124) (134,329) (319,124) (134,329)
Investment allowance - (193,729) - (193,729)
Deduction not allowed in accounting expenses
- (63,481) - (63,481)
Over provision of Income Tax Previous Year 7,509 293,226 7,509 293,226
Total 4,659,709 4,487,734 4,635,093 4,487,734
b. Income tax expense comprises amounts
Provision for income tax attributable to current year taxable income
4,648,172 3,902,968 4,623,556 3,902,968
Movement in future income tax benefit (182,361) 235,368 (182,361) 235,368
Movement in deferred tax liability 186,389 56,172 186,389 56,172
Over provision of Income Tax Previous Year 7,509 293,226 7,509 293,226
4,659,709 4,487,734 4,635,093 4,487,734
c. Restatement of prior year tax expense
The over provided tax in 2009 of $293,226, shown as part of the equity statement movements in the 2010 accounts, has been reclassified and included as part of the tax expense in the 2010 comparative to reflect a consistent disclosure to that of 2011 equivalent amount.
Cash on hand 2,233,839 2,171,410 2,174,151 2,171,410
Deposits at call 53,566,753 8,000,000 53,566,753 8,000,000
Cash at Bank 1,110,206 1,435,528 1,110,206 1,435,528
56,910,798 11,606,938 56,851,110 11,606,938
Deposits - Term 72,000,000 163,500,000 72,000,000 163,500,000
Interest Receivable on deposits with other Financial Institutions
1,528,176 1,614,778 1,528,176 1,614,778
Prepayments 813,287 499,305 813,287 499,305
Sundry Debtors 1,047,537 520,058 1,002,544 484,519
3,389,000 2,634,141 3,344,007 2,598,602
6 Cash and Liquid Assets
7 Receivables Due from other Financial Institutions
8 Accrued Receivables

21Page Title 21Notes to and Forming Part of the Accounts
Consolidated Credit Union
2011 2010$ $
2011 2010$ $
Bank Bills and Certificates of Deposits 80,787,158 - - 80,787,158
a. Amount Due comprises
Overdrafts and Revolving Credit Loans 48,185,136 46,935,140 48,185,136 46,935,140
Term Loans 870,037,509 811,709,909 870,037,509 811,709,909
918,222,645 858,645,049 918,222,645 858,645,049
Less: Provision for Impaired Loans 1,194,319 511,037 1,194,319 511,037
Less: Unamortised Loan Origination Fees 800,599 819,687 800,599 819,687
Plus: Amortised Loan Transaction Costs 132,867 110,273 132,867 110,273
Net Loans and Advances 916,360,594 857,424,598 916,360,594 857,424,598
b. Credit Quality - Security held against Loans
Secured by Mortgage 770,949,179 709,469,737 770,949,179 709,469,737
Secured Other 73,440,712 72,976,767 73,440,712 72,976,767
Unsecured 73,832,754 76,198,545 73,832,754 76,198,545
918,222,645 858,645,049 918,222,645 858,645,049
9 Investment Securities
Consolidated Credit Union
2011 2010$ $
2011 2010$ $
- loan to valuation ratio of less than 80%; 541,027,992 501,235,523 541,027,992 501,235,523
- loan to valuation ratio of more than 80% but mortgage insured; and
197,881,619 175,841,492 197,881,619 175,841,492
- loan to valuation ratio or more than 80% and not mortgage insured.
32,039,568 32,392,722 32,039,568 32,392,722
Total 770,949,179 709,469,737 770,949,179 709,469,737
c. Concentration of Loans
(i) Individual loans which exceed 10% of Member Funds in aggregate amount to $0.00 (2010 $0.00)
(ii) Loans to Members are solely in Australia (iii) Loan purpose dissection:
- Residential 701,221,481 646,010,043 701,221,481 646,010,043
- Personal 131,807,162 134,494,396 131,807,162 134,494,396
- Commercial 69,731,980 63,893,706 69,731,980 63,893,706
- Lease 15,462,022 14,246,904 15,462,022 14,246,904
918,222,645 858,645,049 918,222,645 858,645,049
Loans and Advances10
It is not practicable to value all collateral as the balance is due to a variety of assets and conditions. A breakdown of the quantity of the residential mortgage security on a portfolio basis is as follows:Security held as mortgage against real estate is on the basis of:

22 Notes to and Forming Part of the Accounts
Provision on Impaired Loans11
a. Total Provision Comprises
Consolidated Credit Union
2011 2010$ $
2011 2010$ $
Specific Provision - - - -
Collective Provision 1,194,319 511,037 1,194,319 511,037
1,194,319 511,037 1,194,319 511,037
b. Movement in Specific Provision
Balance at the beginning of the year 511,037 606,333 511,037 606,333
Add: Transfers from Income Statement 683,282 - 683,282 -
Deduct: Bad debts written off against provision
- - - -
Deduct: Transfers to Income Statement - (95,296) - (95,296)
Balance at end of year 1,194,319 511,037 1,194,319 511,037
c. The Specific Loans Provision Consists of:
(i) Provision required under the APRA Prudential Standards
1,194,319 511,037 1,194,319 511,037
(ii) Additional specific provision - - - -
1,194,319 511,037 1,194,319 511,037
d. Impaired Loans Written Off
Amount written off against the provision for impaired loans
- - - -
Amounts written off directly to expense 532,724 883,011 532,724 883,011
Total bad debts 532,724 883,011 532,724 883,011
Bad debts recovered in the period 147,499 189,439 147,499 189,439
e. Impaired Loan Disclosures Impaired Loans as at Balance Date
Balance of the impaired loans 2,726,001 799,841 2,726,001 799,841
Estimated value of loans which is secured 2,174,868 260,959 2,174,868 260,959
Loans with repayments Past Due but not impaired (due to security held)
- Real estate 1,262,341 145,507 1,262,341 145,507
- Other - - - -
Geographical Areas
Sydney City 78,403,860 23,379,993 4,003,473 3,196,654 365,773 109,349,753
Western Suburbs 236,433,911 19,564,289 2,846,920 1,587,414 - 260,432,534
Australian Capital Territory 114,113,139 13,127,337 1,901,505 1,387,734 - 130,529,715
Illawarra 102,104,433 13,352,548 1,677,951 1,068,435 - 118,203,367
Hunter Valley 67,407,874 9,549,360 1,129,884 969,667 - 79,056,785
Central Coast 38,563,234 8,806,100 976,421 650,463 - 48,996,218
NSW North Coast 44,091,760 5,172,264 775,549 1,131,947 - 51,171,520
Other States 27,243,746 3,419,245 750,726 989,322 - 32,403,039
NSW Country 24,270,191 4,274,754 564,299 382,260 - 29,491,504
Blue Mountains 24,943,034 2,200,930 369,183 270,212 - 27,783,359
South Coast 13,473,933 1,443,392 209,172 216,332 - 15,342,829
Grand Total 771,049,115 104,290,212 15,205,083 11,850,440 365,773 902,760,623
Housing Personal Credit Card Overdraft Business Total
Analysis of loans that are impaired or potentially impaired based on age of repayments outstanding.

23Notes to and Forming Part of the Accounts
Carrying Value Provision
2011 2011$ $
2010 2010$ $
Mortgage Insured 536,855 - 1,306,626 -
30 up to 90 days in arrears 1,336,714 - 451,686 -
90 to 181 days in arrears 1,179,902 471,961 418,366 167,346
182 to 272 days in arrears 589,093 353,456 139,495 83,697
273 to 364 days in arrears 9,622 7,698 35,503 28,402
365 days and over in arrears 271,780 271,780 77,384 77,384
Overlimit facilities over 14 days 130,504 89,424 238,491 154,208
Total 4,054,470 1,194,319 2,667,551 511,037
Carrying ValueProvision
Consolidated Credit Union
2011 2010$ $
2011 2010$ $
Cuscal Member Shares (i) 2,507,621 2,507,621 2,507,621 2,507,621
Chelsea Wealth Management Pty Ltd 661,869 661,869 661,876 661,876
‘PCU 2009-1’ Trust (ii) 3,713,592 2,440,664 3,713,592 2,440,664
6,883,082 5,610,154 6,883,089 5,610,161
Available for Sale Investments12
2011 2010
Carrying Value
Mortgages 3,931,905 2,793,828 823,380 1,597,727 406,757 111,633
Personal 749,997 330,699 197,331 666,905 372,616 228,114
Credit Cards 315,513 318,817 66,151 245,228 72,489 75,747
Overdrafts 817,769 25,347 107,457 545,617 93,778 95,543
Total to Natural Persons 5,815,184 3,468,691 1,194,319 3,055,477 945,640 511,037
Corporate Borrowers - - - - - -
Total 5,815,184 3,468,691 1,194,319 3,055,477 945,640 511,037
Value of impaired
loans
Provision of impairment
Carrying Value
Value of impaired
loans
Provision of impairment
The impaired loans are generally not secured against residential property. Some impaired loans are secured by bill of sale over motor vehicles or other types of assets. It is not practicable to determine the fair value of all collateral as at the balance date due to the variety of assets and conditions of those assets. The key assumptions in determining the provision for impairmentIn the course of the preparation of the annual report, the Credit Union has determined the likely impairment loss on loans which have not
maintained the loan repayments in accordance with the loan contract, or where there is other evidence of potential impairment such as industrial restructuring, job losses or economic circumstances. In identifying the impairment likely from these events, the Credit Union is required to estimate the potential impairment using the length of time the loan is in arrears and the historical losses arising in the past years. Given the relatively small number of impaired loans, the circumstances may vary for each loan over time resulting in higher or lower impairment losses. An estimate is based on the period of impairment.

24 Notes to and Forming Part of the Accounts
Consolidated Credit Union
2011 2010$ $
2011 2010$ $
Fixed assets
Land at cost 264,440 264,440 264,440 264,440
Buildings at cost 1,285,560 1,285,560 1,285,560 1,285,560
Less: Provisions for depreciation 111,313 79,174 111,313 79,174
Total Buildings 1,174,247 1,206,386 1,174,247 1,206,386
Total Land and Buildings 1,438,687 1,470,826 1,438,687 1,470,826
Plant and Equipment at cost 9,139,701 9,370,928 9,110,358 9,370,928
Less: Provision for depreciation 7,207,820 7,016,115 7,198,329 7,016,115
Total Plant and Equipment 1,931,881 2,354,813 1,912,029 2,354,813
Capitalised leasehold improvements at cost 2,789,896 2,767,374 2,789,896 2,767,374
Less: Provision for depreciation 2,740,901 2,712,454 2,740,901 2,712,454
Total Capitalised Leasehold Improvements 48,995 54,920 48,995 54,920
Closing Balance 30 June 3,419,563 3,880,559 3,399,711 3,880,559
Property, Plant and Equipment13
a. Property, Plant and Equipment Annual
2011 2010
Property
Opening Balance 1 July 1,470,826 2,354,813 54,920 1,951,791 2,236,664 150,779
Add: Purchases in the year - 652,253 22,522 - 1,347,503 3,111
Revaluation increase adjustments - - - (50,000) - -
Less: Disposal of assets - (50,700) - (400,000) (212,950) -
Loss on Sale - (7,469) - - 125,436 -
Depreciation charge (32,139) (1,017,016) (28,447) (30,965) (1,141,840) (98,970)
Closing Balance 30 June 1,438,687 1,931,881 48,995 1,470,826 2,354,813 54,920
Plant & Equipment
Leasehold Improvement
Property Plant & Equipment
Leasehold Improvement
b. Land and Buildings - ValuationThe Credit Union has a property at Goulburn with the land valued by an independent valuation as at 31 December 2009 at $1,550,000. The increase to valuation over cost has not been brought to account in the balance sheet.
(i) Cuscal provides numerous services to the Credit Union. These are referred to in Notes 30.
The shareholding in Cuscal is measured at cost as its fair value could not be measured reliably. This company was created to supply services to the member Credit Unions. The shares are not redeemable.
The financial reports of Cuscal record net tangible asset backing of these shares exceeding their cost value. Based on the net assets of Cuscal, any fair value determination on these shares is likely to be greater than their cost value, but due to the absence of a ready market, a market value is not able to be determined readily.
The Credit Union is not intending to dispose of these shares.
(ii) The ‘PCU 2009-1’ Trust is a special purpose vehicle that issues securities under an internal securitisation program for the purpose of contingency liquidity management. The Credit Union’s risk management has been strengthened with the implementation of the ‘re-purchase’ facility with the Reserve Bank of Australia providing greater access to funds and a higher level of security for the organisation.

25Notes to and Forming Part of the Accounts
Intangible Assets 14 Consolidated Credit Union
2011 2010$ $
2011 2010$ $
Computer Software 7,144,028 6,645,326 7,144,028 6,645,326
Less: Provision for Amortisation (6,545,186) (6,245,184) (6,545,186) (6,245,184)
598,842 400,142 598,842 400,142
Movement in the intangible asset balances during the year were:
Opening Balance 1 July 400,142 771,569 400,142 771,569
Add: Purchases in the year 506,209 310,798 506,209 310,798
Less: Disposal of Assets - - - -
Depreciation charge (307,509) (682,225) (307,509) (682,225)
Closing Balance 30 June 598,842 400,142 598,842 400,142
Deferred Tax Asset 1,722,839 1,540,478 1,722,839 1,540,478
Deferred Tax Asset Comprises:
- Provision for Impairment 358,296 153,311 358,296 153,311
- Deferred Loan Origination Costs/Fees 240,179 245,906 240,179 245,906
- Provision for Staff Entitlements 896,217 931,218 896,217 931,218
- Fair Value of derivatives 89,120 159,155 89,120 159,155
- Provision Leasehold make good 118,200 27,000 118,200 27,000
- Other 20,827 23,888 20,827 23,888
1,722,839 1,540,478 1,722,839 1,540,478
Cuscal Ltd. - - - -
- Overdraft Secured (Note 29) - - - -
Member Deposits:
- at call 396,357,664 370,166,238 396,357,664 370,166,238
- term 600,419,943 545,039,247 600,419,943 545,039,247
Total Member Deposits 996,777,607 915,205,485 996,777,607 915,205,485
Withdrawable Shares 401,150 415,680 401,150 415,680
997,178,757 915,621,165 997,178,757 915,621,165
15 Taxation Assets
16 Amounts Payable to Other Financial Institutions
17 Deposits
Consolidated Credit Union
2011 2010$ $
2011 2010$ $
Industry Group
State Government 259,862,422 238,564,471 259,862,422 238,564,471
Federal Government 80,584,844 69,620,917 80,584,844 69,620,917
Concentration of Risk
(i) There are no Members who individually have deposits which represent 10% or more of the total liabilities of the Credit Union. (ii) Details of classes of deposits which represent 10% or more of shareholders’ equity of the Credit union are set out below:
26 Notes to and Forming Part of the Accounts
Consolidated Credit Union
2011 2010$ $
2011 2010$ $
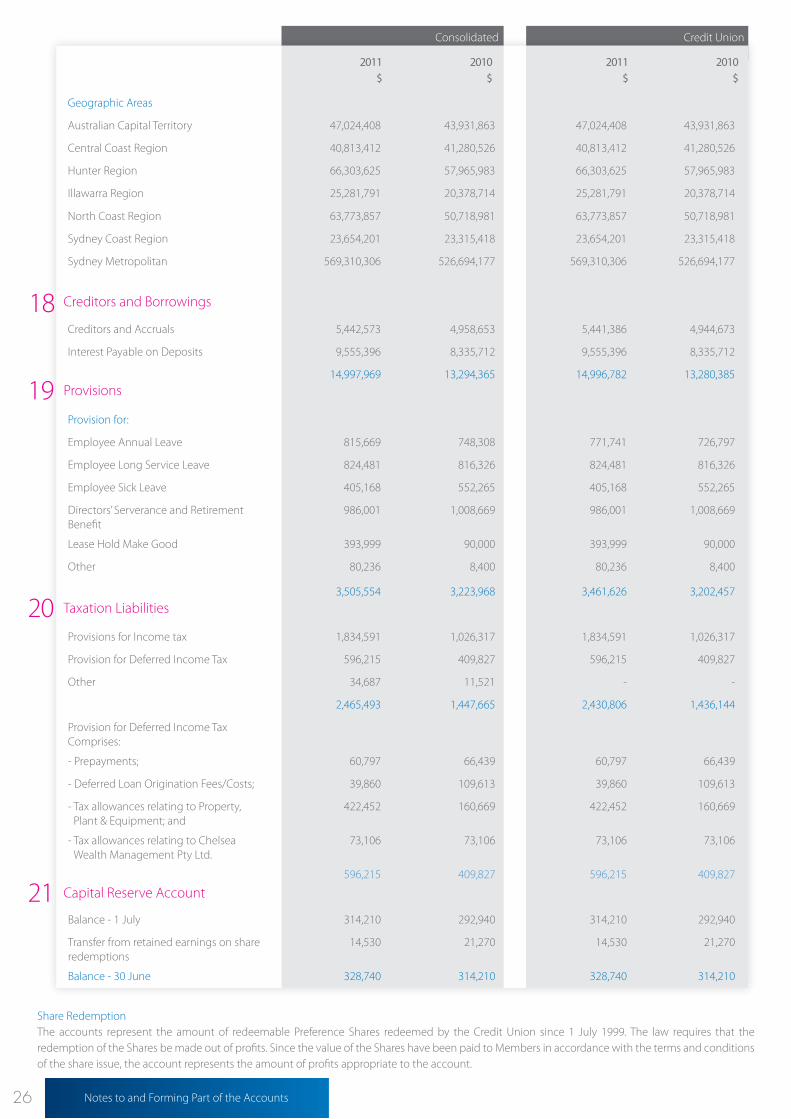
Geographic Areas
Australian Capital Territory 47,024,408 43,931,863 47,024,408 43,931,863
Central Coast Region 40,813,412 41,280,526 40,813,412 41,280,526
Hunter Region 66,303,625 57,965,983 66,303,625 57,965,983
Illawarra Region 25,281,791 20,378,714 25,281,791 20,378,714
North Coast Region 63,773,857 50,718,981 63,773,857 50,718,981
Sydney Coast Region 23,654,201 23,315,418 23,654,201 23,315,418
Sydney Metropolitan 569,310,306 526,694,177 569,310,306 526,694,177
Creditors and Accruals 5,442,573 4,958,653 5,441,386 4,944,673
Interest Payable on Deposits 9,555,396 8,335,712 9,555,396 8,335,712
14,997,969 13,294,365 14,996,782 13,280,385
Provision for:
Employee Annual Leave 815,669 748,308 771,741 726,797
Employee Long Service Leave 824,481 816,326 824,481 816,326
Employee Sick Leave 405,168 552,265 405,168 552,265
Directors’ Serverance and Retirement Benefit
986,001 1,008,669 986,001 1,008,669
Lease Hold Make Good 393,999 90,000 393,999 90,000
Other 80,236 8,400 80,236 8,400
3,505,554 3,223,968 3,461,626 3,202,457
Provisions for Income tax 1,834,591 1,026,317 1,834,591 1,026,317
Provision for Deferred Income Tax 596,215 409,827 596,215 409,827
Other 34,687 11,521 - -
2,465,493 1,447,665 2,430,806 1,436,144
Provision for Deferred Income Tax Comprises:
- Prepayments; 60,797 66,439 60,797 66,439
- Deferred Loan Origination Fees/Costs; 39,860 109,613 39,860 109,613
- Tax allowances relating to Property, Plant & Equipment; and
422,452 160,669 422,452 160,669
- Tax allowances relating to Chelsea Wealth Management Pty Ltd.
73,106 73,106 73,106 73,106
596,215 409,827 596,215 409,827
Balance - 1 July 314,210 292,940 314,210 292,940
Transfer from retained earnings on share redemptions
14,530 21,270 14,530 21,270
Balance - 30 June 328,740 314,210 328,740 314,210
18 Creditors and Borrowings
19 Provisions
20 Taxation Liabilities
21 Capital Reserve Account
Share RedemptionThe accounts represent the amount of redeemable Preference Shares redeemed by the Credit Union since 1 July 1999. The law requires that the redemption of the Shares be made out of profits. Since the value of the Shares have been paid to Members in accordance with the terms and conditions of the share issue, the account represents the amount of profits appropriate to the account.

27Notes to and Forming Part of the Accounts
22 Financial Risk Management Objectives and Policies
The Board has endorsed a policy of compliance and risk management to suit the risk profile of the Credit Union.
The Credit Union’s risk management focuses on the major areas of market risk, credit risk, liquidity risk and operational risk. Authority flows from the Board of Directors. In addition to this, the internal risk management structure is strengthened by the interaction with external audit. The Audit Committee is responsible for reviewing the external audit plan and the progress against the plan each year, and ensuring that issues raised are dealt with in an adequate and timely manner. Over and above the aforementioned the external auditor reports to Members by the way of the Auditor’s Report in which the auditor expresses an opinion on the annual accounts. Please refer to the Auditor’s Report for the full details. The diagram below shows the risk management structure. The main elements of risk governance are as follows:
Board: This is the primary governing body. It approves the level of risk which the Credit Union is exposed to and the framework for reporting and mitigating those risks.
Corporate Governance Committee: This Committee holds at least three meetings each year and the primary objectives of the Committee are: - To ensure that the Credit Union practices good corporate
governance primarily by fulfilling its obligations as set out by the Australian Prudential Regulation Authority in Australian Prudential Standards 510 and 520;
- To ensure all Directors and persons nominating for the
position of Director are of good character and meet the “Fit and Proper” requirements of the Corporate Governance policy;
- To recommend to the Board on how best for the Board to
achieve Board renewal to ensure that the majority of the Directors are independent and that the Board as a whole possess the required skills of directing the Credit Union; and
- To review disputes from Members relating to the Credit
Union’s policies, procedures, systems or service delivery, which have been unable to be resolved by Management.
Audit Committee: This Committee’s key role in risk management is the assessment of the controls that are in place to mitigate risks. The Audit Committee considers and confirms that the significant risks and controls are to be assessed within the internal audit plan. The Audit Committee receives the internal audit reports on assessment and compliance with the controls, and provides feedback to the Board of Directors for their consideration.
Risk Management and Compliance Committee: The Risk Committee assists the Board by providing an objective non-executive review of the effectiveness of the Risk Management Policy. This Committee holds at least four meetings each year and the primary objective of the Committee is to establish and periodically review the Risk Management Policy and to formulate and regularly review the Credit Unions risk profile and risk appetite. In addition, the Committee reviews risk management practices and internal controls having regard to material business risk. These risks include: • Credit Risk, Liquidity Risk and Market Risk; • Operations Risk (data, legal, fraud, insurance etc); • Financial Reporting Risk; and • Other identified risks such as Compliance Risk, Reputation
Risk, Staffing Risk.The Committee monitors the annual risk assessment.
Credit Committee – Credit Risk: This Committee meets monthly and has responsibility for managing and reporting credit risk exposure. It scrutinises operational reports and monitors exposures against limits determined by the Board. The Credit Committee also determines the credit risk of loans in the banking book, ensures provisioning is accurate and determines controls that need to be in put in place regarding the authorisation of new loans.
The Credit Committee has responsibility for implementing policies to ensure that all large credit exposures are properly pre-approved, measured and controlled. Details concerning a prospective borrower are subject to a criteria based decision-making process. Criteria used for this assessment include: credit references, loan-to-value ratio on security and borrower’s capacity to repay which vary according to the value of the loan or facility.
All large credit exposure facilities above policy limits are approved by the Credit Committee.
All loans are managed through the monitoring of the scheduled repayments. Accounts where the arrears are over 90 days or overlimit facilities over 14 days, have collective provisions charged against them. Other provisions are taken up on accounts considered doubtful and the status of these loans is reported to the Credit Committee monthly.Arrears are strictly controlled. The size of the loan book is such that it is possible to monitor each individual exposure to evaluate whether specific provisions are necessary and adequate. A dedicated credit control team, which reports to the Credit Committee, implements the credit union’s credit risk policy. Additionally, a collective provision is held to cover any losses where there is objective evidence that losses are present in components of the loans and advances portfolio at the balance sheet date.
CreditCommittee
InternalAudit
AuditCommittee
Board of
Directors
CorporateGovernanceCommittee
Risk Management
and Compliance Committee
Assets and Liabilities
Committee (ALCO)
ExternalAudit
Members
RemunerationCommittee
ComplianceRisk
NominationsCommittee

28 Notes to and Forming Part of the Accounts
Asset and Liability Committee (ALCO) - Market Risk: This Committee meets monthly and has responsibility for managing interest rate risk exposures, and ensuring that the treasury and finance functions adhere to exposure limits as outlined in the policies for interest rate and liquidity risk. The daily scrutiny of market risk reports is intended to prevent any exposure breaches prior to the monthly review by the ALCO Committee.
Remuneration Committee: The Remuneration Committee has been established to ensure that the Credit Union practices good corporate governance primarily by fulfilling its obligations as set out by the Australian Prudential Regulation Authority (APRA) in Australian Prudential Standards 510. The committee’s primary responsibility is to assess the appropriateness of Director and Executive remuneration, and encourage behaviour that supports the long-term financial soundness of the Credit Union and the risk management framework.
Nomination Committee: The Nomination Committee has been established to independently assess the fairness and propriety of all candidates (excluding incumbents who are re-standing) for the positions of Director. In addition, the Committee ensures that those persons interviewed for the position of Director have the appropriate level of skills, experience and qualifications.
Compliance and Risk Managers: Their primary responsibilities involve the development and implementation of controls to manage operational risk to balance the avoidance of financial loss and damage to the Credit Union’s reputation.
Internal Audit: Internal Audit has responsibility for implementing the controls testing and assessment as required by the Audit Committee.
Key risk management policies encompassed in the overall risk management framework include: • Interest Rate Risk; • Liquidity Management; • Credit Risk Management; and • Operations Risk Management including data risk management.
The Credit Union has undertaken the following strategies to minimise the risks arising from financial instruments
a. Market Risk and Hedging PolicyThe objective of the Credit Union’s market risk management is to manage and control market risk exposures in order to optimise risk and return. Market risk is the risk that changes in interest rates, foreign exchange rates or other prices and volatilities will have an adverse effect on the Credit Union’s financial condition or results. The Credit Union is not exposed to currency risk, and other significant price risk. The Credit Union does not trade in the financial instruments it holds on its books. The Credit Union is exposed only to interest rate risk arising from changes in market interest rates.The management of market risk is the responsibility of the ALCO Committee, which reports directly to the Board. (i) Interest Rate Risk
Interest rate risk is the risk of variability of the fair value or future cash flows arising from financial instruments due to the changes in interest rates. Most banks are exposed to interest rate risk within its Treasury operations. Police Credit Union does not have a treasury operation and does not trade in financial instruments.
(ii) Interest Rate Risk in the Banking BookThe Credit Union is exposed to interest rate risk in its banking book due to mismatches between the repricing dates of assets and liabilities. The interest rate risk on the banking book is measured daily, reported to the ALCO monthly, and to the Board via the ALCO Committee monthly. In the banking book the most common risk the Credit Union faces arises from fixed rate assets and liabilities. This exposes the Credit Union to the risk of sensitivity should interest rates change. The level of mismatch on the banking book is set out in Note 25. The table set out at note 25 displays the period that each asset and liability will reprice as at the balance date.
(iii) Method of Managing RiskThe Credit Union manages its interest rate risk by the use of value at risk models (VAR) and interest rate sensitivity analysis, the detail and assumptions used are set out below.
(iv) HedgingTo mitigate this risk the Credit Union has entered into pay fixed/receive floating interest rate swaps. The interest rate risk on fixed rate loans/assets are hedged by purchasing pay fixed/receive floating interest rate swaps. As at 30 June 2011 the notional principle amounts of the interest rate swap contracts is $35,000,000. The fair value reflected in the Balance Sheet is ($298,321). The valuation of the derivative transactions is based on mid-market levels as of the close of business on 30 June 2011. The valuations are derived from proprietary models based upon well recognised financial principles and reasonable estimates about relevant future market conditions.
(v) Interest Rate SensitivityThe Credit Union’s exposure to market risk is measured and monitored using interest rate sensitivity models. The policy of the Credit Union to manage the risk is to monitor on a monthly basis the changes to maturity profiles within its deposit base and changes in the underlying portfolio mix to ensure that such changes will not have an unacceptable adverse outcome to the Credit Union. The policy of the Credit Union is to use derivatives to hedge against adverse consequences of interest rate risk. The Credit Union’s exposure to interest rate risk is set out in Note 25 which details the contractual interest change profile. An independent review of the interest rate risk profile is conducted by Strategic Risk International, an independent Risk Management Consultancy. Based on the calculations as at 30 June 2011, the calculated market value of equity (EVE) is $123.1 million, with a sensitivity of $435,729 to a 1% change in interest rates The Credit Union performs a sensitivity analysis to measure market risk exposures.

29Notes to and Forming Part of the Accounts
2011 2010
To total adjusted liabilities
As at 30 June 13.47% 14.85%
Average for the year 15.08% 15.95%
Minimum during the year 13.08% 14.62%
To total Member deposits
As at 30 June 14.61% 19.12%
APRA
The method used in determining the sensitivity was to evaluate the profit based on the timing of the interest repricing on the banking book of the Credit Union for the next 12 months. In doing the calculation the assumptions applied were that: - the interest rate change would be applied equally
over to the loan products and term deposits; - the rate change would be as at the beginning of
the 12 month period and no other rate changes would be effective during the period;
- the term deposits would all reprice to the new
interest rate at the term maturity, or be replaced by deposit with similar terms and rates applicable;
- savings deposits would not reprice in the event of a
rate change; - fixed rate loans would all reprice to the new interest
rate at the contracted date; - variable rate mortgage loans would all reprice to
the new interest rate in one month; - personal loans would reprice at the contracted
maturity date; - all loans would be repaid in accordance with the
current average repayment rate (or contractual repayment terms);
- the value and mix of call savings to term deposits
will be unchanged; and - the value and mix of personal loans to mortgage
loans will be unchanged. There has been no change to the Credit Union’s exposure to
market risk or the way the Credit Union manages and measures market risk in the reporting period.
b. Liquidity RiskLiquidity risk is the risk that the Credit Union may encounter difficulties raising funds to meet commitments associated with financial instruments, e.g. borrowing repayments or Member withdrawal demands. It is the policy of the Board of Directors that the Credit Union maintains adequate cash reserves and committed credit facilities so as to meet the Member withdrawal demands when requested.
The Credit Union manages liquidity risk by: - continuously monitoring actual daily cash flows and
longer term forecasted cash flows;
- monitoring the maturity profiles of financial assets and liabilities;
- maintaining adequate reserves, liquidity support facilities and reserve borrowing facilities; and
- monitoring the prudential liquidity ratio daily.
The Credit Union has a longstanding arrangement with the industry liquidity support company Credit Union Financial Support Services
(CUFSS) which can access industry funds to provide support to the Credit Union should it be necessary at short notice.
The Credit Union is required to maintain at least 9% of total adjusted liabilities as liquid assets capable of being converted to cash within 24 hours under the APRA Prudential standards. The Credit Union policy is to apply a minimum of 11% of funds as liquid assets to maintain adequate funds for meeting Member withdrawal requests. The ratio is checked daily. Should the liquidity ratio fall below this level, the Management and Board are to address the matter and ensure that the liquid funds are obtained from new deposits, or borrowing facilities available. Note 29 describes the borrowing facilities as at the balance date. These facilities are in addition to the support from CUFSS.
The maturity profile of the financial liabilities, based on the contractual repayment terms are set out in the specific Note 24. The ratio of liquid funds over the past year is set out below:

30 Notes to and Forming Part of the Accounts
2011 2010
Carrying Value
Residential 701,221,481 34,478,718 735,700,199 646,010,043 38,721,860 684,731,903
Personal 119,960,558 783,089 120,743,647 122,743,809 507,314 123,251,123
Credit Cards 15,205,083 15,259,727 30,464,810 13,731,212 13,650,728 27,381,940
Overdrafts 12,103,543 23,734,594 35,838,137 12,266,279 24,436,799 36,703,078
Total to Natural Persons 848,490,665 74,256,128 922,746,793 794,751,343 77,316,701 872,068,044
Commercial 69,731,980 - 69,731,980 63,893,706 - 63,893,706
Total 918,222,645 74,256,128 992,478,773 858,645,049 77,316,701 935,961,750
Off Balance Sheet
Maximum Exposure
Carrying Value
Off Balance Sheet
Maximum Exposure
Carrying value is the value on the balance sheet. Maximum exposure is the value on the balance sheet plus the undrawn facilities (loans approved not advanced, redraw facilities; line of credit facilities; overdraft facilities; credit cards limits). The details are shown in Note 28 and a summary is in Note 10.c. All loans and facilities are within Australia. The geographic distribution is not analysed into significant areas within Australia as the exposure classes are not considered material. Concentrations are described in Note 10.c. The method of managing credit risk is by way of strict adherence to the credit assessment policies before the loan is approved and close monitoring of defaults in the repayment of loans thereafter on a weekly basis. The credit policy has been endorsed by the Board to ensure that loans are only made to members that are creditworthy (capable of meeting loan repayments). The Credit Union has established policies over the: - credit assessment and approval of loans and facilities covering
acceptable risk assessment, security requirements - limits of acceptable exposure over the value to individual borrowers,
non mortgage secured loans, commercial lending and concentrations to geographic and industry groups considered at high risk of default
- reassessing and review of the credit exposures on loans and facilities - establishing appropriate provisions to recognise the impairment of
loans and facilities - debt recovery procedures; and - review of compliance with the above policies.A regular review of compliance is conducted as part of the internal audit scope. Past Due and ImpairedA financial asset is past due when the counterparty has failed to make a payment when contractually due. As an example, a Member enters into a lending agreement with the Credit Union that requires interest and a portion of the principle to be paid every month. On the first day of the next month, if the agreed repayment amount has not been paid, the loan is past due. Past due does not mean that a counterparty will never pay, but it can trigger various actions such as renegotiation, enforcement of covenants, or legal proceedings. Once the past due exceeds 90 days
the loans is regarded as impaired, unless other factors indicate the impairment should be recognised sooner. Daily reports monitor the loan repayments to detect delays in repayments and recovery action is undertaken after 7 days. For loans where repayments are doubtful, external consultants are engaged to conduct recovery action once the loans is over 90 days in arrears. The exposures to losses arise predominantly in the personal loans and facilities not secured by registered mortgages over real estate. If such evidence exists, the estimated recoverable amount of that asset is determined and any impairment loss, based on the net present value of future anticipated cash flows, is recognised in the income statement. In estimating these cash flows, Management makes judgements about a counterparty’s financial situation and the net realisable value of any underlying collateral. In addition to specific provisions against individually significant financial assets, the Credit Union makes collective assessments for each financial asset portfolio segmented by similar risk characteristics. Balance sheet provisions are maintained at a level that Management deems sufficient to absorb probable incurred losses in the Credit Union’s loan portfolio from homogenous portfolios of assets and individually identified loans. A provision for incurred losses is established on all past due loans after a specified period of repayment default where it is probable that some of the capital will not be repaid or recovered. The provisions for impaired and past due exposures relate to the loans to Members. Past due value is the ‘on balance sheet’ loan balances which are past due by 90 days or more. Details are as set out in Note 11. Bad Debts Amounts are written-off when collection of the loan or advance is considered to be remote. All write-offs are on a case by case basis, taking account of the exposure at the date of the write off. On secured loans, the write off takes place on ultimate realisation of collateral value, or from claims on any lender’s mortgage insurance. A reconciliation in the movement of both past due and impaired exposure provisions is provided in Note 11.
c. Credit RiskCredit risk is the risk that Members, financial institutions and other counterparties will be unable to meet their obligations to the Credit Union which may result in financial losses. Credit risk arises principally from the Credit Union’s loan book, investment assets and derivative contracts.
(i) Credit Risk - Loans The analysis of the Credit Union’s loans by class, is as follows:

31Notes to and Forming Part of the Accounts
2011
Tier 1
Share capital 328,740
Capital reserve 1,430,212
General reserve 35,597,000
Cash flow hedge reserve (280,078)
Retained earnings 83,260,044
Less prescribed deductions 3,774,021
Net tier 1 capital 116,561,897
Tier 2
Reserve for credit losses 2,996,306
Asset revaluation reserves on property 132,104
Less prescribed deductions 1,253,810
Net tier 2 capital 1,874,600
Total Capital 118,436,497
Collateral Securing Loans A sizeable portfolio of the loan book is secured on residential property in Australia. Therefore, the Credit Union is exposed to risks in the reduction the Loan to Value (LVR) cover should the property market be subject to a decline. The risk of losses from the loans undertaken is primarily reduced by the nature and quality of the security taken. The Board policy is where the outstanding loan balance exceeds 80% of the valuation, the mortgage must be 100% mortgage insured secured. Note 10 b describes the nature and extent of the security held against the loans held as at the balance date. Concentration Risk – Individuals Concentration risk is a measurement of the Credit Union’s exposure to an individual counterparty (or group of related parties). If prudential limits are exceeded as a proportion of the Credit Union’s regulatory capital (10 per cent) a large exposure is considered to exist. No capital is required to be held against these but APRA must be informed. APRA may impose additional capital requirements if it considers the aggregate exposure to all loans over the 10% capital benchmark, to be higher than acceptable. The aggregate value of large exposure loans are set out in Note 10. The Credit Union holds no significant concentrations of exposures to Members. Concentration Risk – Industry The Credit Union has a concentration in the retail lending for members who comprise employees and family in the Policing Industry. This concentration is considered acceptable on the basis that the Credit Union was formed to service these Members, and the employment concentration is not exclusive. Should Members leave the industry the loans continue and other employment opportunities are available to the Members to facilitate the repayment of the loans.
(ii) Credit Risk - Liquid InvestmentCredit risk is the risk that the other party to a financial instrument will fail to discharge their obligation resulting in the Credit Union incurring a financial loss. This usually occurs when debtors fail to settle their obligations owing to the Credit Union. There is a concentration of credit risk with respect to investment receivables with the placement of investments in Cuscal. The credit policy is that investments are only made to authorised institutions. Directors have established policies that a maximum of up to 30% of the capital base (excluding Cuscal) can be invested with any one financial institution at a time. The risk of losses from the liquid investments undertaken is reduced by the nature and quality of the independent rating of the investment body and the limits to concentration on one Credit Union. Also the relative size of the Credit Union as compared to the industry is relatively low such that the risk of loss is reduced. Under the liquidity support scheme at least 3.2% of the total assets must be invested in Cuscal and/or a Credit Union Financial Support Scheme (CUFSS) approved Authorised Deposit-taking Institution (ADI), to allow the scheme to have adequate resources to meet its obligations if needed.
d. Capital ManagementThe capital levels are prescribed by Australian Prudential Regulation Authority (APRA). Under the APRA prudential standards capital is determined in three components: • Credit risk; • Market risk (Trading Book); and • Operations risk.
The market risk component is not required as the Credit Union is not engaged in a Trading Book for financial instruments.
Capital ResourcesTier 1 CapitalThe vast majority of Tier 1 capital comprises: - General Reserves (excluding Reserve for Credit Losses) - Retained Earnings - After Tax Current Year Earnings
Tier 2 CapitalTier 2 capital consists of capital instruments that combine the features of debt and equity in that they are structured as debt instruments, but exhibit some of the loss absorption and funding flexibility features of equity. There are a number of criteria that capital instruments must meet for inclusion in Tier 2 capital resources as set down by APRA.
Tier 2 capital generally comprises: • available for sale reserve which arises from the revaluation of financial
instruments categorised as available for sale and reflects the net gains in the fair value of those assets in the year. This is included within upper Tier 2 capital;
• a general reserve for credit Losses.
The Credit Union’s available for sale (AFS) reserve, and an asset revaluation reserve on the land and buildings are discounted to 45% of the value net of any capital gains tax and estimated costs of sale.
Capital in the Credit Union is made up as shown in chart below.

32 Notes to and Forming Part of the Accounts
Carrying Value
Cash 0% 2,233,839 -
Deposits in Highly Rated ADI’S 20% 238,466,803 47,693,361
Deposits in Less Highly Rated ADI’s 50%-150% 23,841,868 11,920,934
Loans Secured Against Eligible Residential Mortgages 35% 603,708,301 211,297,905
Loans Secured Against Eligible Residential Mortgages 50% 142,621,034 71,310,517
Loans Secured Against Eligible Residential Mortgages 75% 10,452,331 7,839,248
Loans Secured Against Eligible Residential Mortgages 100% 10,944,989 10,944,989
Investment in equity instruments 150% - -
Other Assets 100% 150,535,580 150,535,580
Off Balance Sheet Business 79,064,863 23,545,819
Total 1,261,869,608 535,088,353
Risk Weighted Value
2011 2010 2009 2008 2007
20.09% 19.45% 18.13% 18.17% 16.01%
The risk weighted assets processes were modified by APRA as from the 1 January 2008 as part of the Basel II Prudential framework enhancements.
The capital ratio as at the end of the financial year over the past 5 years is as follows:
The level of capital ratio can be affected by growth in asset relative to growth in reserves and by changes in the mix of assets.
To manage the Credit Unions capital the Credit Union reviews the ratio monthly and monitors movements in the asset levels. Policies have been implemented to require reporting to the Board and the regulator if the capital ratio falls below 13%. Further a 5 year capital budget projection of the capital levels is maintained annually to address how strategic decisions or trends may impact on the capital level.
Pillar 2 Capital on Operational Risk This capital component was introduced as from 1 January 2008 and coincided with changes in the asset risk weightings for specified loans and liquid investments. Previously no operational charge was prescribed.
The Credit Union uses the Standardised approach which is considered to be most suitable for its business given the small number of distinct transaction streams. The Operational Risk Capital Requirement is calculated by mapping the Credit Union’s three year average net interest income and net non-interest income to the Credit Union’s various business lines.
Based on this approach, the Credit Union’s operational risk requirement is as follows: • Operational Risk Regulatory Capital $ 4,875,689
It is considered that the Standardised approach accurately reflects the Credit Union’s operational risk other than for the specific items set out below: Internal Capital Adequacy ManagementThe Credit Union manages its internal capital levels for both current and future activities annually during the review of the budget and business plan and at times when the Credit Union’s risk matrix detects an adverse movement of the Credit Union’s risk profile. The outputs are reviewed by the Board in its capacity as the primary governing body. The capital required for any change in the Credit Union’s forecasts for asset growth, or unforeseen circumstances, are assessed by the Board.
The Credit Union is required to maintain a minimum capital level of 8% as compared to the risk weighted assets at any given time.
The risk weights attached to each asset are based on the weights prescribed by APRA in its Guidance AGN 112-1. The general rules apply the risk weights according to the level of underlying security.

33Notes to and Forming Part of the Accounts
Categories of Financial Instruments Consolidated Credit Union
2011 2010$ $
2011 2010$ $
Financial Assets - carried at amortised cost
Cash 6 56,910,798 11,606,938 56,851,110 11,606,938
Receivables from Financial Institutions
7 72,000,000 163,500,000 72,000,000 163,500,000
Accrued Receivables 8 2,575,713 2,134,836 2,530,720 2,099,297
Investment Securities 9 80,787,158 - 80,787,158 -
Loans & Advances 10 916,360,594 857,424,598 916,360,594 857,424,598
Total Loans and Receivables 1,128,634,263 1,034,666,372 1,128,529,582 1,034,630,833
Available for Sale Investments carried at cost
12 6,883,082 5,610,154 6,883,089 5,610,161
Fair Value of Derivatives - - - -
Total Financial Assets 1,135,517,345 1,040,276,526 1,135,412,671 1,040,240,994
Financial Liabilities carried at amortised cost
Short Term Borrowings 16 - - - -
Deposits from Members 17 996,777,607 915,205,485 996,777,607 915,205,485
Withdrawable Shares 17 401,150 415,680 401,150 415,680
Creditors - Interest Payable on Deposits
18 14,997,969 13,294,365 14,996,782 13,280,385
Total Carried at Amortised Cost 1,012,176,726 928,915,530 1,012,175,539 928,901,550
Fair Value of Derivatives 298,321 530,517 298,321 530,517
Total Financial Liabilities 1,012,475,047 929,446,047 1,012,473,860 929,432,067
Note
23The following information classifies the financial instruments into measurement classes
24 Maturity Profile of Financial Assets and Liabilities Monetary assets and liabilities have differing maturity profiles depending on their contractual term, and in the case of loans, the repayment amount and frequency. The table on the next page shows the period in which different monetary assets and liabilities held will mature and be eligible for renegotiation or withdrawal. In the case of loans, the table shows the period over which the principal outstanding will be repaid based on the remaining period to the repayment date assuming contractual repayments are maintained, and is subject to change in the event that current repayment conditions are varied. Financial assets and liabilities are at the undiscounted values (including future interest expected to be earned or paid). Accordingly these values will not agree to the balance sheet.

34 Notes to and Forming Part of the Accounts
2011 Balance Sheet Up to 3 Months
3 to 12 Months
1 to 5 Years After 5 Years Total Cash Flows
Assets
Cash 56,910,798 56,910,798 - - - 56,910,798
Accrued Receivables 2,575,713 233,105 - - - 233,105
Receivables from Financial Institutions 72,000,000 65,007,215 3,115,989 6,435,794 - 74,558,998
Investment Securities 80,787,158 76,000,000 6,000,000 - - 82,000,000
Loans and Advances 916,360,594 26,585,000 79,757,665 425,374,214 848,266,905 1,379,983,784
Available for Sale Investments 6,883,082 - - - 6,883,082 6,883,082
On Balance Sheet Financial Assets 1,135,517,345 224,736,118 88,873,654 431,810,008 855,149,987 1,600,569,767
Interest Rate Swaps 35,000,000 5,058,010 - 33,748,924 - 38,806,934
Total Financial Assets 1,170,517,345 229,794,128 88,873,654 465,558,932 855,149,987 1,639,376,701
Liabilites
Creditors Interest Payable on Deposits 9,555,396 - - - - -
Deposits from Members - At Call 396,357,664 396,357,664 - - - 396,357,664
Deposits from Members - Fixed Term 600,419,943 336,703,409 210,135,726 87,065,641 501,350 634,406,126
Withdrawable Shares 401,150 401,150 - - - 401,150
Borrowings - - - - - -
On Balance Sheet Financial Liabilities 1,006,734,153 733,462,223 210,135,726 87,065,641 501,350 1,031,164,940
Undrawn Loan Commitments 74,256,128 74,256,128 - - - 74,256,128
Interest Rate Swaps 35,000,000 5,082,668 - 34,503,073 - 39,585,741
Total Financial Liabilities 1,115,990,281 812,801,019 210,135,726 121,568,714 501,350 1,145,006,809
2010
Assets
Cash 11,606,938 11,606,938 - - - 11,606,938
Accrued Receivables 2,134,836 260,463 - - 260,463
Receivables from Financial Institutions 163,500,000 161,399,175 3,677,206 1,129,977 - 166,206,358
Investment Securities - - - - - -
Loans and Advances 857,424,598 71,878,521 74,830,140 399,094,080 774,936,127 1,320,738,868
Available for Sale Investments 5,610,154 - - - 5,610,154 5,610,154
On Balance Sheet Financial Assets 1,040,276,526 245,145,097 78,507,346 400,224,057 780,546,281 1,504,422,781
Interest Rate Swaps 35,000,000 10,610,957 21,681,195 5,553,660 - 37,845,812
Total Financial Assets 1,075,276,526 255,756,054 100,188,541 405,777,717 780,546,281 1,542,268,593
Liabilites
Creditors Interest Payable on Deposits 8,335,712 - - - - -
Deposits from Members - At Call 370,166,238 370,166,238 - - - 370,166,238
Deposits from Members - Fixed Term 545,039,247 316,289,462 172,251,131 85,822,579 470,712 574,833,884
Withdrawable Shares 415,680 415,680 - - - 415,680
Borrowings - - - - - -
On Balance Sheet Financial Liabilities 923,956,877 686,871,380 172,251,131 85,822,579 470,712 945,415,802
Undrawn Loan Commitments 77,316,701 77,316,701 - - - 77,316,701
Interest Rate Swaps 35,000,000 10,858,906 22,590,732 5,724,668 - 39,174,306
Total Financial Liabilities 1,036,273,578 775,046,987 194,841,863 91,547,247 470,712 1,061,906,809
Balance Sheet Up to 3 Months
3 to 12 Months
1 to 5 Years After 5 Years Total Cash Flows

35Notes to and Forming Part of the Accounts
2011 Floating Rate 1 to 3 Months 3 to 12 Months 1 to 5 Years Non Interest Sensitive
Total
Assets
Cash 54,676,959 - - - 2,233,839 56,910,798
Accrued Receivables - - - - 2,575,713 2,575,713
Receivables from Financial Institutions - 64,000,000 3,000,000 5,000,000 - 72,000,000
Investment Securities - 74,904,514 5,882,644 - - 80,787,158
Loans and Advances 796,995,181 2,163,481 29,064,922 88,137,010 - 916,360,594
Available for Sale Investments - - - - 6,883,082 6,883,082
On Balance Sheet Financial Assets 851,672,140 141,067,995 37,947,566 93,137,010 11,692,634 1,135,517,345
Interest Rate Swaps - 35,000,000 - - - 35,000,000
Total Financial Assets 851,672,140 176,067,995 37,947,566 93,137,010 11,692,634 1,170,517,345
Liabilites
Creditors Interest Payable on Deposits - - - - 9,555,396 9,555,396
Deposits from Members - At Call 396,357,664 - - - - 396,357,664
Deposits from Members - Fixed Term - 302,101,537 226,076,797 72,241,609 600,419,943
Withdrawable Shares - - - - 401,150 401,150
Borrowings - - - - - -
On Balance Sheet Financial Liabilities 396,357,664 302,101,537 226,076,797 72,241,609 9,956,546 1,006,734,153
Undrawn Loan Commitments 74,256,128 - - - - 74,256,128
Interest Rate Swaps - 5,000,000 - 30,000,000 - 35,000,000
Total Financial Liabilities 470,613,792 307,101,537 226,076,797 102,241,609 9,956,546 1,115,990,281
Floating Rate 1 to 3 Months 3 to 12 Months 1 to 5 Years Non Interest Sensitive
Total2010
Assets
Cash 9,435,528 - - - 2,171,410 11,606,938
Accrued Receivables - - - - 2,134,836 2,134,836
Receivables from Financial Institutions - 159,000,000 3,500,000 1,000,000 - 163,500,000
Investment Securities - - - - - -
Loans and Advances 755,656,542 10,457,174 29,833,234 61,477,648 - 857,424,598
Available for Sale Investments - - - - 5,610,154 5,610,154
On Balance Sheet Financial Assets 765,092,070 169,457,174 33,333,234 62,477,648 9,916,400 1,040,276,526
Interest Rate Swaps - 35,000,000 - - - 35,000,000
Total Financial Assets 765,092,070 204,457,174 33,333,234 62,477,648 9,916,400 1,075,276,526
Liabilites
Creditors Interest Payable on Deposits - - - - 8,335,712 8,335,712
Deposits from Members - At Call 370,166,238 - - - - 370,166,238
Deposits from Members - Fixed Term - 290,895,701 179,750,429 74,393,117 - 545,039,247
Withdrawable Shares - - - - 415,680 415,680
Borrowings - - - - - -
On Balance Sheet Financial Liabilities 370,166,238 290,895,701 179,750,429 74,393,117 8,751,392 923,956,877
Undrawn Loan Commitments 77,316,701 - - - - 77,316,701
Interest Rate Swaps - 10,000,000 20,000,000 5,000,000 - 35,000,000
Total Financial Liabilities 447,482,939 300,895,701 199,750,429 79,393,117 8,751,392 1,036,273,578
25 Interest Rate Change Profile of Financial Assets and Liabilities Monetary assets and liabilities have conditions which allow interest rates to be amended either on maturity (Term Deposits and Term Investments) or after adequate notice is given (Loans and Savings). The following table shows the respective value of funds where interest rates are capable of being altered within the prescribed time bands, being the earlier of the contractual repricing date, or maturity date.

36 Notes to and Forming Part of the Accounts
Receivables from other Financial Institutions
Loans & Advances (before Provision)
2011 2010 2011 2010$ $ $ $
Net Fair Value 151,934,441 162,399,139 917,904,069 858,858,421
Book Value 152,787,158 163,500,000 918,222,645 858,645,050
Variance (852,717) (1,100,861) (318,576) 213,371
Liabilities Interest Rate Swaps
Net Fair Value - - 995,861,575 914,073,869 34,701,679 34,469,483
Book Value - - 997,178,757 915,621,165 35,000,000 35,000,000
Variance - - (1,317,182) (1,547,296) (298,321) (530,517)
2011 20102011 2010
Member DepositsPayable to other
Financial Insititutions
Assets
2011 2010$ $
2011 2010$ $
Within 1 year 100,372 338,791 100,372 338,791
1 to 2 years - - - -
2 to 5 years - - - -
over 5 years - - - -
100,372 338,791 100,372 338,791
Consolidated Credit Union
2011 2010$ $
2011 2010$ $
Within 1 year 1,256,042 1,554,712 1,256,042 1,554,712
1 to 2 years 1,153,380 1,138,071 1,153,380 1,138,071
2 to 5 years 2,936,026 3,029,672 2,936,026 3,029,672
over 5 years - - - -
5,345,448 5,722,455 5,345,448 5,722,455
Consolidated Credit Union
$ $ $ $2011 2010
$ $
26 Net Fair Value of Financial Assets and Liabilities Net Fair Value is an estimate of the present market value of each asset or liability and has been calculated to show the difference between the current and future value of funds at the present time. Where the assets/liabilities are short term in nature or reprice frequently, then the net fair value is stated at book value.
The information is only relevant to circumstances at Balance Date and will vary depending on the contractual rates applied to each asset and liability. No assets held are regularly traded by the Credit Union.
27 Expenditure Commitments
a. Future Capital Commitments The Credit Union has entered into contracts to purchase fixed assets at a value of $100,372 (2010 $338,791). The amount is to be paid over the following periods.
b. Future Lease Rental Commitments Future lease rental commitments are $5,345,448 (2010 $5,722,455). Operating lease payments under existing lease arrangements for office accommodation are payable over the following periods:

37Notes to and Forming Part of the Accounts
2011 2010$ $
2011 2010$ $
Total value of facilities approved 98,947,945 97,157,016 98,947,945 97,157,016
Less: Amount outstanding at balance day 48,185,136 46,935,140 48,185,136 46,935,140
Net undrawn value 50,762,809 50,221,876 50,762,809 50,221,876
Consolidated Credit Union
2011 2010$ $
2011 2010$ $
Approved Limit 12,000,000 12,000,000 12,000,000 12,000,000
Less: Amount drawn 0 0 0 0
Available to draw 12,000,000 12,000,000 12,000,000 12,000,000
Consolidated Credit UnionOverdraft
28 Financial Commitments
a. Loan CommitmentsLoans approved but not funded as at 30 June 2011 total $23,493,319 (2010 $27,094,825).
b. Undrawn Loan FacilitiesLoan facilities available to Members for Overdrafts, Credit Card and Redraw Loans are as follows:
29 Standby Borrowing Facilities The Credit Union has the following credit facilities with Cuscal:
These commitments are contingent on Members maintaining credit standards and on-going repayment terms on amounts drawn. Under the contracts, the Credit Union has the right to withdraw the facilities at any time without notice. Draw down of the loan facility is subject to the availability of funds at Cuscal. Cuscal holds an equitable mortgage charge over all of the assets of the Credit Union as security against loan and overdraft amounts drawn.
30 Contingent Liabilities
Liquidity Support SchemeThe Credit Union is a Member of the Credit Union Financial Support Scheme (CUFSS), a company established to provide financial support to Member Credit Unions in the event of a liquidity or capital problem arising. As a Member, the Credit Union is committed to maintaining an amount equivalent to 3.2% of total assets as deposits with Cuscal and/or a CUFSS approved Authorised Deposit-taking Institution (ADI). The maximum call for each Member Credit Union would be 3.2% of the Credit Union’s total assets. The Credit Union has the opportunity under certain circumstances to draw on this scheme.
Employee EntitlementsThe Credit Union has a potential liability for the payment of entitlements to employees consequent on the dismissal of an employee, the amount of which cannot be determined. At the time of this report there are no matters outstanding. No amount has been provided, as in the view of the Directors the reasons were justified and the matter is before the industrial relations tribunal for determination.
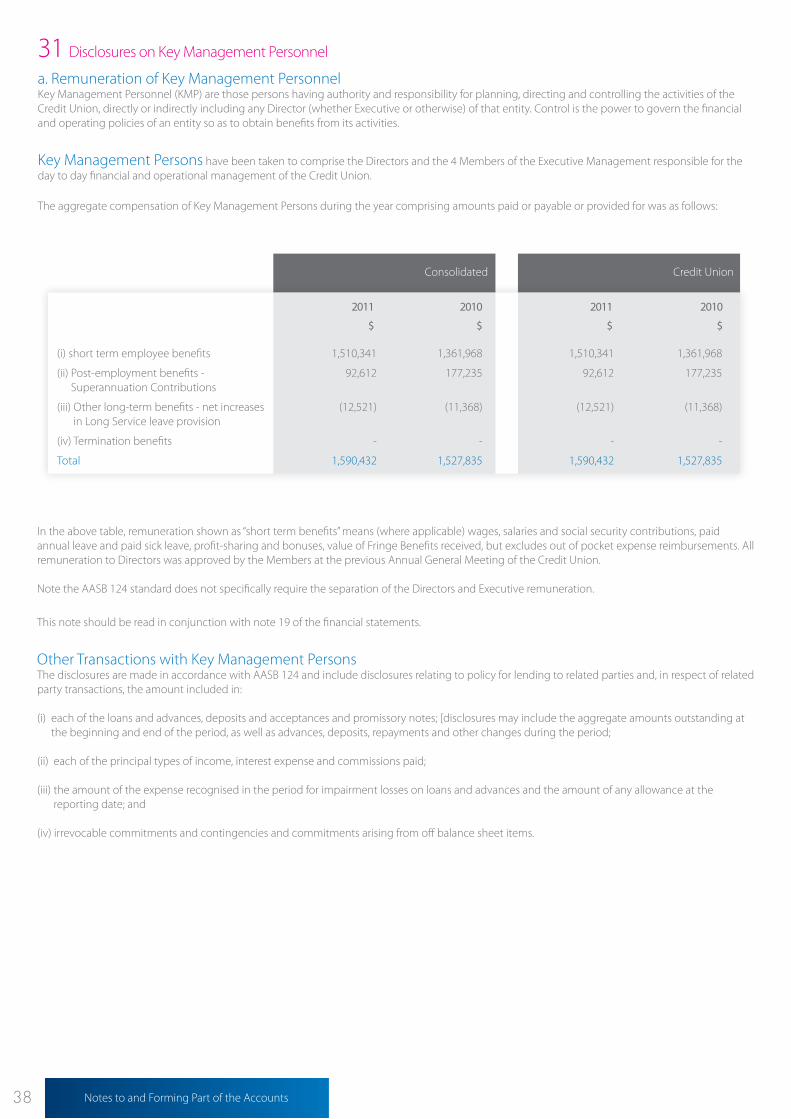
38 Notes to and Forming Part of the Accounts
2011 2010
$ $
2011 2010
$ $
(i) short term employee benefits 1,510,341 1,361,968 1,510,341 1,361,968
(ii) Post-employment benefits - Superannuation Contributions
92,612 177,235 92,612 177,235
(iii) Other long-term benefits - net increases in Long Service leave provision
(12,521) (11,368) (12,521) (11,368)
(iv) Termination benefits - - - -
Total 1,590,432 1,527,835 1,590,432 1,527,835
Consolidated Credit Union
31 Disclosures on Key Management Personnel
a. Remuneration of Key Management PersonnelKey Management Personnel (KMP) are those persons having authority and responsibility for planning, directing and controlling the activities of the Credit Union, directly or indirectly including any Director (whether Executive or otherwise) of that entity. Control is the power to govern the financial and operating policies of an entity so as to obtain benefits from its activities.
Key Management Persons have been taken to comprise the Directors and the 4 Members of the Executive Management responsible for the day to day financial and operational management of the Credit Union.
The aggregate compensation of Key Management Persons during the year comprising amounts paid or payable or provided for was as follows:
In the above table, remuneration shown as “short term benefits” means (where applicable) wages, salaries and social security contributions, paid annual leave and paid sick leave, profit-sharing and bonuses, value of Fringe Benefits received, but excludes out of pocket expense reimbursements. All remuneration to Directors was approved by the Members at the previous Annual General Meeting of the Credit Union.
Note the AASB 124 standard does not specifically require the separation of the Directors and Executive remuneration.
This note should be read in conjunction with note 19 of the financial statements.
Other Transactions with Key Management PersonsThe disclosures are made in accordance with AASB 124 and include disclosures relating to policy for lending to related parties and, in respect of related party transactions, the amount included in:
(i) each of the loans and advances, deposits and acceptances and promissory notes; [disclosures may include the aggregate amounts outstanding at the beginning and end of the period, as well as advances, deposits, repayments and other changes during the period;
(ii) each of the principal types of income, interest expense and commissions paid;
(iii) the amount of the expense recognised in the period for impairment losses on loans and advances and the amount of any allowance at the reporting date; and
(iv) i rrevocable commitments and contingencies and commitments arising from off balance sheet items.
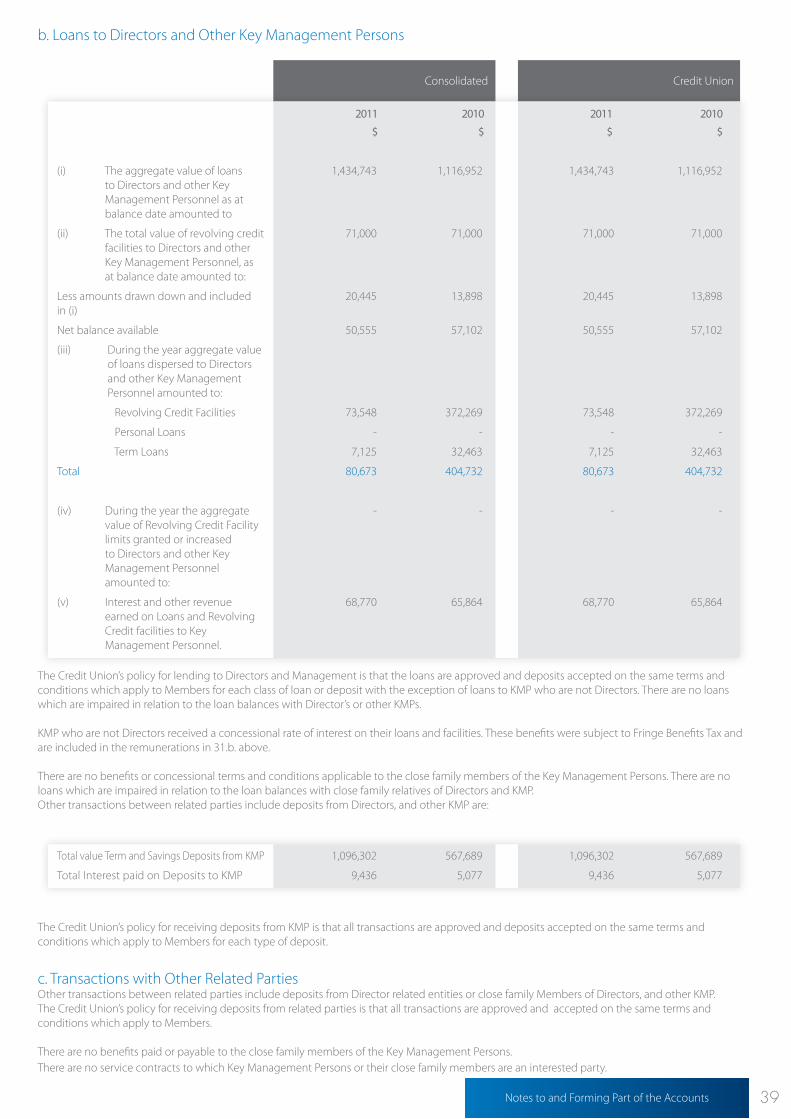
39Notes to and Forming Part of the Accounts
2011 2010
$ $
2011 2010
$ $
(i) The aggregate value of loans to Directors and other Key Management Personnel as at balance date amounted to
1,434,743 1,116,952 1,434,743 1,116,952
(ii) The total value of revolving credit facilities to Directors and other Key Management Personnel, as at balance date amounted to:
71,000 71,000 71,000 71,000
Less amounts drawn down and included in (i)
20,445 13,898 20,445 13,898
Net balance available 50,555 57,102 50,555 57,102
(iii) During the year aggregate value of loans dispersed to Directors and other Key Management Personnel amounted to:
Revolving Credit Facilities 73,548 372,269 73,548 372,269
Personal Loans - - - -
Term Loans 7,125 32,463 7,125 32,463
Total 80,673 404,732 80,673 404,732
(iv) During the year the aggregate value of Revolving Credit Facility limits granted or increased to Directors and other Key Management Personnel amounted to:
- - - -
(v) Interest and other revenue earned on Loans and Revolving Credit facilities to Key Management Personnel.
68,770 65,864 68,770 65,864
Consolidated Credit Union
Total value Term and Savings Deposits from KMP 1,096,302 567,689 1,096,302 567,689
Total Interest paid on Deposits to KMP 9,436 5,077 9,436 5,077
b. Loans to Directors and Other Key Management Persons
The Credit Union’s policy for lending to Directors and Management is that the loans are approved and deposits accepted on the same terms and conditions which apply to Members for each class of loan or deposit with the exception of loans to KMP who are not Directors. There are no loans which are impaired in relation to the loan balances with Director’s or other KMPs.
KMP who are not Directors received a concessional rate of interest on their loans and facilities. These benefits were subject to Fringe Benefits Tax and are included in the remunerations in 31.b. above.
There are no benefits or concessional terms and conditions applicable to the close family members of the Key Management Persons. There are no loans which are impaired in relation to the loan balances with close family relatives of Directors and KMP.Other transactions between related parties include deposits from Directors, and other KMP are:
The Credit Union’s policy for receiving deposits from KMP is that all transactions are approved and deposits accepted on the same terms and conditions which apply to Members for each type of deposit.
c. Transactions with Other Related PartiesOther transactions between related parties include deposits from Director related entities or close family Members of Directors, and other KMP. The Credit Union’s policy for receiving deposits from related parties is that all transactions are approved and accepted on the same terms and conditions which apply to Members.
There are no benefits paid or payable to the close family members of the Key Management Persons.There are no service contracts to which Key Management Persons or their close family members are an interested party.

40 Notes to and Forming Part of the Accounts
32 Segmental ReportingThe Credit Union operates exclusively in the retail financial services industry within Australia.
33 Events Occurring after the Balance DateThere were no events that have occurred since 30 June, 2011 that will have significant impact upon the Credit Union.
34 Superannuation LiabilitiesIf an employee does not nominate a fund of choice, the Credit Union contributes to one of two superannuation funds. One being the NGS Super which is an industry fund. The Credit Union has no interest in the Superannuation Fund (other than as a contributor to comply with Superannuation Guarantee Levy) and is not liable for the performance of the plan nor the obligations of the plan.
The other fund is a Corporate Master Trust which is administered by MLC Limited. It is a contribution accumulated type fund. The Credit Union has no legal obligation to cover any shortfall in the Fund’s obligation to provide benefits to employees on retirement. In the event the Fund is terminated, Members are only entitled to the balance of their account within the fund. As at the date of the last annual review being 30 June 2011, the fund had reserves equal to Members accumulated balances.
The Credit Union is legally obligated to contribute to the Fund as per the Superannuation Guarantee Levy Act and for employees who have a contract of service. These obligations are enforceable. As at the date of this report there is:-1. No outstanding payments due by the Credit Union.2. No former employee or any individual associated with a former employee or an entity of a former employee receiving or entitled to receive a benefit under the Corporate Master Trust.
35 SecuritisationThe Credit Union has an arrangement with Integris Securitisation Services Pty Limited and Australian Mortgage Securities Limited whereby the Credit Union acts as an agent to manage the loans portfolio on their behalf. The Credit Union bears no credit risk exposure in respect of these loans. Securities sold subject to repurchase agreements are retained in their respective balance sheet categories as neither the risks nor rewards have been transferred away from the Credit Union.

41Notes to and Forming Part of the Accounts
2011 2010$ $
2011 2010$ $
Cash as at balance date comprises:
Cash on Hand 3,344,045 3,606,938 3,284,357 3,606,938
Deposits at Call 53,566,753 8,000,000 53,566,753 8,000,000
Less: Overdraft with Cuscal - - - -
56,910,798 11,606,938 56,851,110 11,606,938
Consolidated Credit Union
2011 2010$ $
2011 2010$ $
Operating Profit & Extraordinary Item after Income Tax
11,426,530 10,422,240 11,370,326 10,421,262
Add (Deduct):
Bad Debts Written Off 532,724 883,011 532,724 883,011
Depreciation Expense 1,385,112 1,954,000 1,384,260 1,954,000
Increase in Provision for Employee Entitlements
(94,251) 441,510 (116,668) 421,999
Accrued Expenses 1,703,605 3,740,343 1,716,399 3,769,819
Loss on Sale of Assets 7,470 (125,436) 7,470 (125,436)
Decrease (Increase) in Prepayments (313,982) (107,658) (313,982) (107,658)
Increase (Decrease) in Unearned Income (19,090) 149,816 (19,090) 149,816
Amortised Loan Transaction Costs (22,594) (10,670) (22,594) (10,670)
Decrease (Increase) in Sundry Debtors (440,877) (242,125) (431,423) (169,539)
Increase (Decrease) in Deferred Taxes Payable 4,027 291,539 4,027 291,539
Provisions for Income Tax 831,440 1,089,025 808,274 1,010,062
Other Provisions 1,059,117 (101,504) 1,059,117 (101,504)
Derivative Fair Value (512,274) - (512,274) -
Net Cash from Operating Activities 15,546,957 18,384,091 15,466,566 18,386,701
Consolidated Credit Union
a. Reconciliation of CashCash includes cash on hand and deposits at call with Cuscal net of overdraft.
b. Member deposits and shares are shown net of deposits and withdrawals.
c. The net cash from Operating Activities is reconciled to the Operating Profit and Extraordinary Item after Income Tax.
Compliance Statistics
a. Capital Adequacy At all times the Credit Union must maintain a minimum of 8% capital adequacy ratio. The capital adequacy ratio is a measure of reserves, general provisions for doubtful debts less an amount equal to the future income tax benefit as a percentage of the risk weighted value of assets. The Credit Union’s ratio as at balance date was 20.09% (2010 19.45%).
b. LiquidityThe Credit Union is required to maintain at all times liquid assets at a minimum level of 9% of its liability base in High Quality Liquid Assets. These percentages were exceeded for the whole year. In addition to liquid assets the Credit Union has in place confirmed standby lines available to it. The High Quality Liquid Asset Ratio as at balance date was 13.47% (2010 14.85%).
36 Notes to Cash Flow Statement Liabilities

42 General Information
AuditorsBDO Audit (NSW-VIC) Pty Ltd Level 192 Market StreetSydney NSW 2000
BankersCuscal Limited
AffiliationsAbacus1 Margaret StreetSydney NSW 2000
Credit Union Financial Support Scheme
Federation of Police Credit Unions
PCU Assistance CentreLevel 27, 1 Market Street Sydney NSW 2000Phone: 131 PCU (131 728)Eaglenet: 88899Email: [email protected]
PCU DirectLevel 27, 1 Market StreetSydney NSW 2000Phone: 131 PCU (131 728)Eaglenet: 88884Email: [email protected]
Sydney18 Pelican StreetSurry Hills NSW 2010Phone: (02) 8268 2500Eaglenet: 44850Email: [email protected]
Gosford9-11 Mann StreetGosford NSW 2250Phone: (02) 4320 0200Eaglenet: 44880Email: [email protected]
CanberraShop 16, Canberra House40 Marcus Clarke Street Canberra ACT 2601Phone: (02) 6206 7000Eaglenet: 44860Email: [email protected]
Goulburnc/o Police AcademyMcDermott Dr Goulburn NSW 2580Phone: (02) 4827 1000Eaglenet: 44730Email: [email protected]
Penrith295 High StreetPenrith NSW 2750Phone: (02) 4720 5000Eaglenet: 44750Email: [email protected]
CampbelltownUnit 2/100 Queen Street Campbelltown NSW 2560Phone: (02) 4640 7000Eaglenet: 88839Email: [email protected]
Port Macquarie6-14 Clarence StreetPort Macquarie NSW 2444Phone: (02) 6582 9900Eaglenet: 44840Email: [email protected]
ParramattaGround Floor Octagon Building110 George Street Parramatta NSW 2150Phone: (02) 9841 8200Eaglenet: 44700Email: [email protected]
Wollongong76 Market Street Wollongong NSW 2500Phone: (02) 4221 9000Eaglenet: 44830Email: [email protected]
Newcastle24 Bolton Street Newcastle NSW 2300Phone: (02) 4908 6200Eaglenet: 44870Email: [email protected]
Websites: www.pcu.com.au www.customscu.com.au
ABN: 95 087 650 799
AFSL/ Australian Credit Licence No: 240018
BSB: 815 000
Head OfficeThe Police Department Employees’ Credit Union LimitedLevel 27, 1 Market Street Sydney NSW 2000Phone: 131 PCU (131 728)Email: [email protected]
Police Credit Union
Canberra5 Constitution AvenueCanberra ACT 2601Phone: (02) 6243 8900Email: [email protected]
Mascotc/o Customs House10 Cooks River Drive Sydney International Airport NSW 2020Phone: (02) 8335 4200Email: [email protected]
Melbourne1010 LaTrobe Street Docklands, Melbourne VIC 3008 Phone: (03) 9642 1003Email: [email protected]
Customs Credit Union
GENERAL INFORMATION

NOTES


