Maize production has expanded across most of west and central Africa (Gilbert et al., 1994). In Cameroon, most of the expansion of maize has been in the savanna of the western highlands. But questions have been raised about the ecological consequences of exclusive reliance on chemical fertilizers for maize production in sub-Saharan Africa (Smith et al., 1993; Byerlee and Eicher, 1997). The economic sustainabil-
ity of maize expansion through dependence on chemical fertilizers has also been questioned given the high levels of subsidies on fertilizers (Spencer and Polson, 1991; Smith et al., 1993; Byerlee and Eicher, 1997) that provided financial incentives for farmers but which exacerbated social costs.
In response to these concerns, alternative resource management technologies have been developed for farmers. These alternatives include agroforestry-based technologies such as improved fallow with herbaceous legumes (i.e., Mucuna, Tephrosia,Crotolaria and Canavalia), rotational hedgerow intercropping or alley farming with leguminous shrub species (i.e., Calliandra, Cassia, Luecaena, Sesbania) (National Cereals Research and Extension, 1990; Kang et al., 1991; Yamoah et al., 1993; Tonye and Titi-Nwel,
1995). Several studies have examined the technical feasibility and productivity of these agroforestry and green manure-based technologies for increasing maize productivity in west and central Africa (Ngambeki, 1985; McHugh, 1989; Yamoah et al., 1993; Tonye and Titi-Nwel, 1995).
However, only few economic studies of agroforestry technologies have been done in west and central Africa (Ngambeki, 1985; Sumberg et al., 1987; Ehui et al., 1990; Yamoah et al., 1993). Economic studies have not addressed the issue of social costs and returns to agroforestry-based technologies. Yet, this is important given the recent macro- and sectoral-policies that have made the price of fertilizer substitutes high for farmers. At non-subsidized fertilizer prices, social profitability of agroforestry-based technologies that rely on internal nutrient cycling would be different, and as such the interest of both farmers and policy makers in these natural resource management technologies could be expected to increase.
Since maize is a tradable commodity that can be imported, policy makers are currently debating options for maize production that are economically efficient and sustainable. The objectives of the paper are to determine, using the PAM (Monke and Pearson, 1989), the social profitability of agroforestry-based technologies for maize production in the highland savanna zone of Cameroon, and the impacts of policy shifts on the financial competitiveness of maize production under these technologies. While economic studies have used the PAM to evaluate effects of policies on financial competltlveness of crop production in developing countries (Nelson and Panggabean, 1991; Gumua et al., 1994; Pearson et al., 1995), no study has used this approach to evaluate social profitability of agroforestry-based technologies for commodity production in subSaharan Africa.
The rest of the paper is divided into four sections. Section 2 discusses the study zone, maize production systems, and how recent devaluation of the currency has affected the structure of product and input prices. Section 3 presents the PAM model. Section 4 discusses the results from the PAM analysis, while Section 5 concludes with implications for development and targeting of agroforestry technologies.
2. Study zone and data
The study was conducted in the northwestern highlands of Cameroon characterized by elevations ranging from 700 to 3000 m, with an average of 1400 m classifying the area as a high altitude (McHugh, 1989). The soils are low in major nutrients and have high demand for phosphorus (Yamoah et al., 1993). The zone has high population pressure, and increased farming of steeply sloping and marginal lands. Fallowing has disappeared in many areas and average fallow lengths vary from 1-2 years. Maize is the most important staple crop in the zone and is intercropped with beans, typically grown in small scattered fields and planted on ridges. The western highlands produce more than 70% of the maize in Cameroon. Maize production in these zones experienced major technical change in the mid-1980's with the development of adaptable and high yielding improved varieties by the National Cereals Research and Extension (NCRE) Project, a highly successful collaborative project between the International Institute of Tropical Agriculture (IITA) and the Institute of Agronomic Research (IRA) funded by the United States Agency for International Development from 1979 to 1994. Besides improved cultivars of maize technologies, chemical fertilizers and agroforestry techniques such as improved fallows with leguminous species were widely tested and extended to farmers to address the problems of increasing soil erosion and declining fertility (National Cereals Research and Extension, 1990; Yamoah et al., 1993).
The agroforestry-based technologies that were considered in the analysis were tested on-farm and onexperiment station by the Institute of Agronomic Research (IRA) and the NCRE project in the northwest province. Most of the trials were farmer-managed and carried out by the training and extension unit of the NCRE project. However, three researcher-managed trials (improved maize plus 250 kg of fertilizer and Mucuna, Tephrosia and Sesbania) were included in the analysis. The corresponding yields of these technologies were discounted by 25% to reflect farm-level management context. The yield discount rate was proposed by soil scientists and farming systems' agronomists working in the study area. Twenty one maize production technologies were analyzed, with alternative combinations of local or
improved maize grown with fertilizer alone (at three levels: 50 kg/ha; 100 kg/ha and 250 kg/ha) and/or improved fallow herbaceous legumes such as Mucuna and Tephrosia. In addition, we considered alternative cropping with leguminous shrub species such as Calliandra and Sesbania.
Crop budgets were developed for each of these technologies. Costs considered included seeds for maize and leguminous species, labor costs for seedlings' establishment, transplanting, pruning, incorporation of biomass, and amortized costs for small equipments. Nursery costs are relevant only for Calliandra. Following seedling establishment, farmers transplant Calliandra seedlings in the maize fields. Subsequently, farmers prune and incorporate the biomass from Calliandra in the maize fields. The costs for nursery covered seeds, plastic bags and labor for watering. For the leguminous shrubs for improved fallows (i.e., Tephrosia, Mucuna and Sesbania), their method of establishment is direct broadcasting in the fallow fields at the beginning of the rainy season. The shrubs are left on the fields for a 1 year fallow. At the end of the fallow period, farmers incorporate biomass from the leguminous shrubs directly in their fields prior to the planting of maize.
Financial competitiveness of maize production under alternative production technologies has been influenced by two major policy shifts. In 1987, the government began implementation of measures to correct existing macro-economic policy distortions (period 1). By 1991, the government liberalized input and cereal grain markets while removing direct subsidies on fertilizers, insecticides and commodities (period 2). Removal of fertilizer subsidies increased the fertilizer input prices from 50 to 200 CFA/kg, leading to a decline in level of fertilizer use by farmers. Another major policy shift with important implication for maize production was the devaluation of the CFA Franc in January 1994. The CFA Franc, which had been substantially over-valued, was devalued by 50% with respect to the French Franc (period 3), leading to major shifts in the relative prices of tradable and non-tradable inputs and outputs (see the foot note No. 2 of Table 1) and financial competitiveness of crops. A positive aspect of the devaluation of the CFA is the subsequent increase in domestic price levels and thus the output price for maize, which increased from 70 to 95 CFA/kg. However, the prices of tradable
inputs also increased following devaluation. For example, the price of compound N-P-K fertilizer increased from 120 to 220 CFA/kg.
3. Empirical analysis
The PAM model has the advantage that it allows disaggregation of the production activities, assessment of the effects of policy induced transfers, and individual and net effects of seemingly conflicting sets of policies (Nelson and Panggabean, 1991). Construction of the PAM model starts with the estimation of farm budgets that represent the costs and returns to production activities. Production and inputs have to be first broken down into tradable outputs and inputs, factor or domestic inputs (e.g. land, labor and capital). The model has two identities (see Note of Table 1). The input and output quantities in row one are multiplied by financial or observed market prices, with all of their associated distortions. Net financial (or private) profitability (D) is defined as gross returns at market prices (A) less the tradable input costs (B) and the cost of domestic factors (C). Net private profitability (NPP) is a direct measure of the incentives to farmers to produce a commodity, and reflects the competitiveness of the commodity system at observed market prices. If NPP>O, it is implied that the commodity system is financially profitable, given input and output prices, technology sets and existing government policy or market distortions. The second row of the PAM model values outputs and inputs at their respective social prices. Net social profitability (NSP) (H) measures revenue valued at social prices less value of tradable and domestic resource both valued at their respective social prices. If NSP>O, the activity is implied to have a static comparative advantage, in that it effectively utilizes resources within the economy. The last row of the model measures policy-induced transfers that come into play due to policy-induced market failures or distortions. The divergence between the revenue at market and economic prices l=A-E is the output transfer; a positive value implies that producers receive a subsidy due to existing policies as they receive a higher price than the world price for the commodity. Input transfer l=(B-F) measures difference between input prices at financial and social prices, a negative value implying that producers
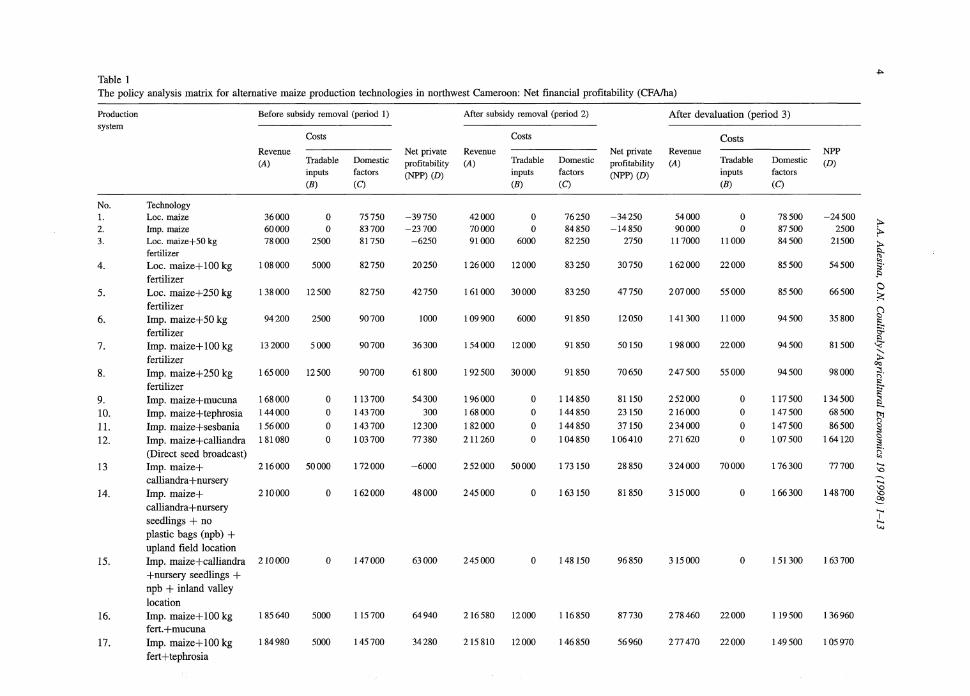
.,. Table I The policy analysis matrix for alternative maize production technologies in northwest Cameroon: Net financial profitability (CFA!ha)
Production Before subsidy removal (period I) After subsidy removal (period 2) After devaluation (period 3) system
Costs Costs Costs Revenue Net private Revenue Net private Revenue NPP
Source: Computed from the PAM model. Note: (1) The format of the PAM model is explained below, following Monke and Pearson (1989). PAM tabular representation is not presented here due to space limitations. For details see Monke and Pearson (1989), where: A=revenue valued at private prices; B=tradable inputs valued at private prices; C=domestic factors valued at private prices; D=Net private profitability (NPP =(A-B-C); £=revenue valued at social prices; F=tradable inputs valued at social prices; G=domestic factors valued at social prices; H=Net social profitability (NSP)=(E-F-G); Output transfers: l=(A-E); Tradable input transfers, J=(B-F); Factor transfers, K=(C-G); Net transfers from policy effects, L=(D-H). (2) The fmancial and economic prices for inputs and outputs in three periods are as follow in period 1 (with subsidy), period 2 (wihout subsidy) and period 3 (after devaluation): (a) fertilizers (20-10-10): 50, 120 and 220 CPA, respectively; (b) improved maize: 400, 450 and 500 CPA, respectively; (c) local maize: 50, 70 and 100 CPA, respectively; (d) herbaceous legume seed was 600 for three periods; (e) Calliandra seeds costs was 4000 CPA for the periods; (f) maize output was 60, 70, and 90 CPA, respectively; (g) labor cost was 1000 CPA per man-day, respectively for three periods; (h) small equipments cost 2500, 2500 and 4000 CPA, respectively, in the periods. Economic prices were as follows for each input: (a) fertilizer: 250 CPA/kg; (b) improved maize, 500 CPA/kg); (c) local maize, 100 CPA/kg); (d) herbaceous legume seed, 600 CPA/kg; (e) Calliandra seeds, 5000 CPA/ kg; (f) maize, 95 CPA/kg; (g) labor, 1000 CPA/man-day; and (h) small-equipment, 4,500 CPA.
receive subsidy and a positive value implies a tax (i.e, producers pay more than they should). The extent of factor transfer is measured by K=(C-G). The net transfers from policy distortions or market failures not corrected by efficient policies is measured by L=(D-H). If L>O (i.e, NPP>NSP), it is implied that transfers occur to producers from the government, i.e., a subsidy. If L<O, it is implied that a tax on producers exists. Other traditional measures of effects of government policies (e.g., nominal and effective protection coefficient) and of comparative advantage or efficiency such as the domestic resource costs (DRC) are easily derivable from the PAM results. DRC is the ratio of domestic factors valued at economic prices (G) over the difference between the gross benefit and the costs of tradable inputs. It compares the opportunity costs of domestic factors to the value added at border prices. If DRC<1, it implied that the value of domestic resources used in the production of the commodity is less than the value added at social prices and the production of the commodity represents an efficient use of domestic resources. If DRC>1, the economy is implied to be incurring costs in excess of value added at social prices and foreign exchange is lost by producing the commodity under that technology set. If DRC= 1, it is indicated that the economy on balance neither gains nor saves foreign exchange through domestic production. It is a summary measure of the relative efficiency of domestic production and can be used by researchers and research managers to decide on resource allocation between technologies (Morris, 1990).
4. Results
The analysis of financial competitiveness of maize production under the alternative technologies was conducted under three time periods: (a) the period before fertilizer subsidies were removed (period 1); (b) the period after fertilizer subsidies were removed (period 2); and (c) the period after the devaluation of the CFA (period 3). Finally, we computed the social profitability for these systems at the economic prices.
Analysis of financial profitability across the three periods (Table 1) shows that all the agroforestry-based maize production systems had positive NPP, indicat-
ing that the farmers have financial incentives to adopt the techniques. One important observation is that despite the removal offertilizer subsidies, agroforestry systems that involve additional use of fertilizers remained financially profitable. Although the financial costs of purchased inputs increased across the three periods, maize output price also increased significantly. Devaluation of the CFA led to increase in the domestic price for locally produced maize. These results are supported by field studies that have shown existence of positive synergetic effects of fertilizers to increasing productivity of agroforestry-based maize systems (Kang et al., 1991; Yamoah et al., 1993; Tonye and Titi-Nwel, 1995). Where farmers can afford fertilizers, their use with agroforestry and green manure-based technologies can significantly enhance financial profits.
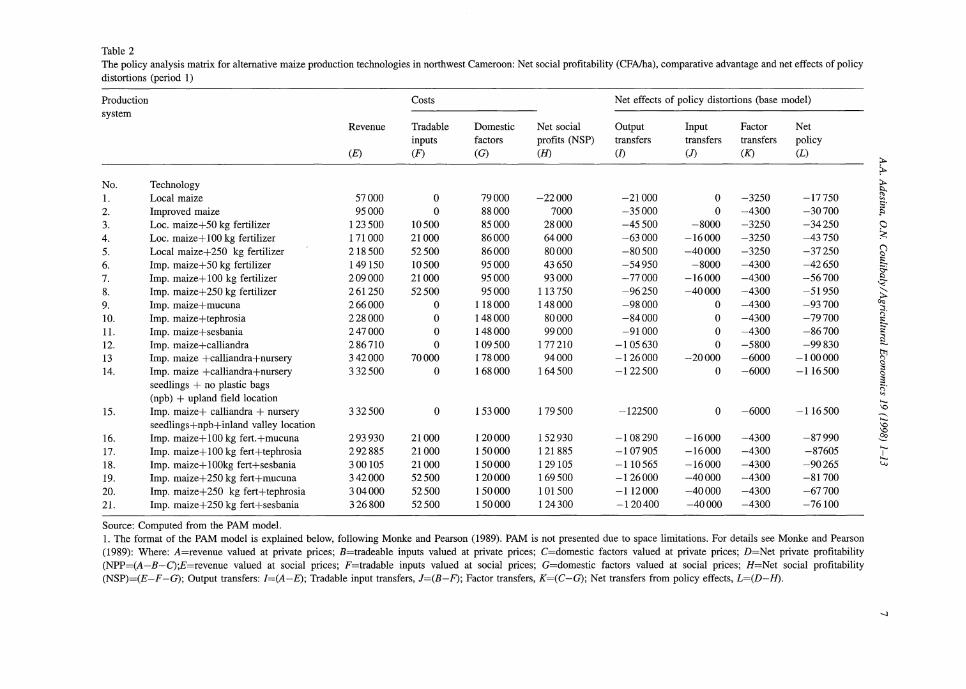
The agroforestry-based maize production technologies also were found to be socially profitable (i.e., NSP>O) (Tables 2 and 3). Compared to periods 1 and 2 (i.e, when currency overvaluation existed), the true economic output prices (after correction for overvalued exchange rates) were higher than the financial prices due to these distortionary government policies and financial market imperfections. This implies that had the CFA not been overvalued, farmers would have received higher real prices for their maize during these periods. An overvalued exchange rate was used to import cheap maize which made the financial profits to be lower than the true economic profits (i.e., NSP>NPP) for these periods (i.e., on the output side, the tax on farmers implies economic prices are greater than financial prices).
The extent of policy-induced transfers in the product and factor markets was computed from the PAM results for each of the maize production systems, for period 1 (Table 2), period 2 and period 3 (Table 3), respectively. Results show negative output transfers (I) for all the maize production systems, implying that economic output prices, (after correction for the overvalued exchange rates and distortionary policies) farmers should have received, were higher than what they actually received, especially in period 1 and period 2, respectively. This suggests that the existence of overvalued exchange rates in these periods amounted to an output tax on maize farmers. However, the extent of such distortions were largely removed with the devaluation of the CFA.
Table 2 The policy analysis matrix for alternative maize production technologies in northwest Cameroon: Net social profitability (CFA/ha), comparative advantage and net effects of policy distortions (period I)
Production Costs Net effects of policy distortions (base model) system
Revenue Tradable Domestic Net social Output Input Factor Net inputs factors profits (NSP) transfers transfers transfers policy
Source: Computed from the PAM model. I. The format of the PAM model is explained below, following Monke and Pearson (1989). PAM is not presented due to space limitations. For details see Monke and Pearson (1989): Where: A=revenue valued at private prices; B=tradeable inputs valued at private prices; C=domestic factors valued at private prices; D=Net private profitability (NPP=(A-B-C);E=revenue valued at social prices; F=tradable inputs valued at social prices; G=domestic factors valued at social prices; H=Net social profitability (NSP)=(E-F-G); Output transfers: l=(A-E); Tradable input transfers, l=(B-F); Factor transfers, K=(C-G); Net transfers from policy effects, L=(D-H).
--l
00
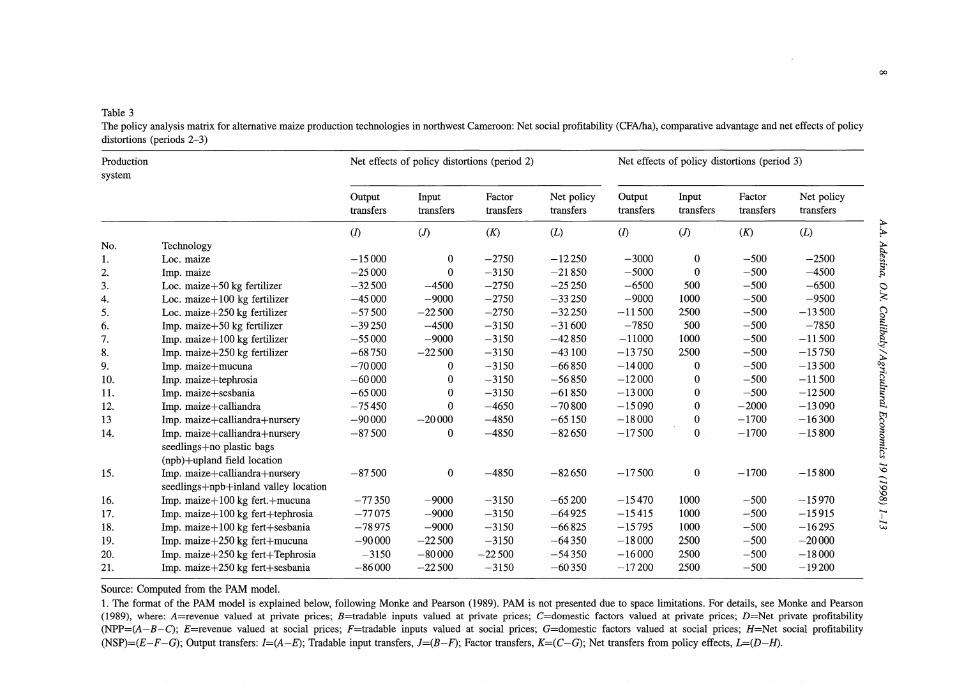
Table 3 The policy analysis matrix for alternative maize production technologies in northwest Cameroon: Net social profitability (CFA/ha), comparative advantage and net effects of policy distortions (periods 2-3)
Production Net effects of policy distortions (period 2) Net effects of policy distortions (period 3) system
Output Input Factor Net policy Output Input Factor Net policy transfers transfers transfers transfers transfers transfers transfers transfers
Source: Computed from the PAM model. I. The format of the PAM model is explained below, following Monke and Pearson (1989). PAM is not presented due to space limitations. For details, see Monke and Pearson (1989), where: A=revenue valued at private prices; B=tradable inputs valued at private prices; C=domestic factors valued at private prices; D=Net private profitability (NPP=(A-B-C); E=revenue valued at social prices; F=tradable inputs valued at social prices; G=domestic factors valued at social prices; H=Net social profitability (NSP)=(E-F-G); Output transfers: l=(A-E); Tradable input transfers, l=(B-F); Factor transfers, K=(C-G); Net transfers from policy effects, L=(D-H).
Input transfers (J) are nil for the agroforestry technologies without fertilizers but negative for all maize production systems using fertilizers. This suggests that farmers producing maize with only agroforestry-based technologies (without complementary use of fertilizers) obtained no input subsidies from the government. When corrections were made for the effects of overvalued exchange rate and market imperfections, the true economic prices for the tradable inputs used in maize production should have been much higher than farmers actually paid during the periods of subsidies and CFA currency overvaluation. Thus, the use of overvalued exchange rates to import cheap fertilizers, which at a point was subsidized, amounted to significant input transfers (i.e., subsidies) to farmers. All systems that require the use of fertilizers received input subsidies as farmers were paid less for these tradable inputs than the true economic costs.
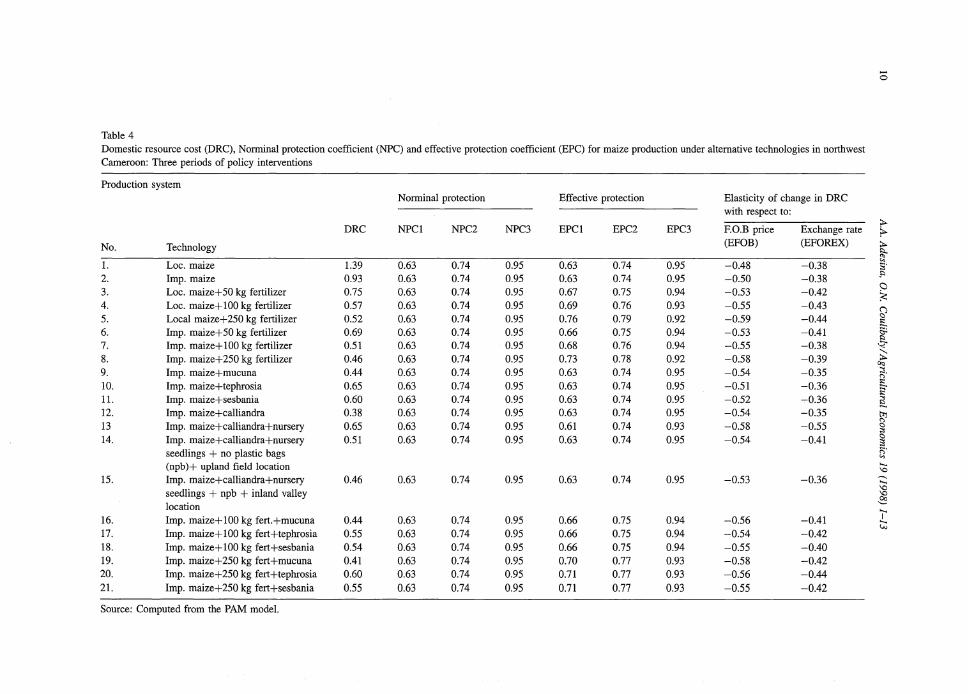
The net effect of all transfers is shown by the net policy transfer (L). These values are negative for practically all of the maize production systems, suggesting that when account is taken of the overvalued exchange rates during these periods, the net effect of government policy was a significant tax on maize farmers. The nominal protection coefficient (NPC), which measures the effects of government policy (or market failures not corrected via efficient policies) in output and factor markets, was computed (Table 4). NPC values for maize output was 0.63 for period 1 and 0.74 for period 2. This implies that farmers received less for their maize due to taxes and inappropriate exchange rates. NPC for tradable input (i.e., fertilizer) computed for period 1 and period 2 were 0.2 and 0.48, respectively. This suggests that farmers were heavily protected in these periods via huge fertilizer subsidies.
The net effect of these seemingly conflicting policies is best measured by the effective protection coefficient (EPC) which reflects the complete pattern of incentives to farmers in the tradable commodities markets. EPC is measured as the revenue less costs of tradable factors, both valued in private prices divided by revenue less costs of tradable factors, both valued at social prices. EPC values allow the assessment of the net effects of subsidies, taxes or inappropriate exchange rates taking into account both the product and input markets. EPC estimates for all technologies (Table 4) for the period when there were fertilizer subsidies (period 1) ranged from 0.63 to 0.76, and
from 0.74 to 0.79 for the period when the subsidies were removed (period 2). EPC> 1 show that the net effects have been largely negative for maize farmers, although with devaluation the net tax effects of overvalued exchange rates have been significantly reduced, and the EPC values are close to 1.
The computed values for the domestic resource costs (DRC) show that maize production under the agroforestry-based systems have DRCs less than one, indicating that there exists comparative advantage in producing maize under these systems. The lowest DRCs were for (i) improved maize + Calliandra hedgerow: 0.38; (ii) improved maize + Mucuna + fertilizer (250 kg): 0.41; (iii) improved maize + Mucuna +fertilizer (100 kg/ha): 0.44; (iv) improved maize + Mucuna: 0.44; (v) improved maize + Calliandra + nursery (no plastic bags) in the lowland areas: 0.46; (vi) improved maize + Calliandra + nursery in uplands (no plastic bags): 0.51. Of all the systems considered, only the local maize without external inputs or agroforestry technologies was socially non-profitable (DRC>1). Yield oflocal maize under such systems are very low. Improved maize grown without fertilizers or agroforestry technologies also has low comparative advantage.
To determine the sensitivity of the results to changes in underlying wage rates for labor, we re-estimated the PAM model assuming that the wage rate was 50% of the current wage rate. Labor constraints have often been listed as a major factor limiting farmers' interest in the use of agroforestry-based technologies. The results show that if labor requirements (or wage rates) were reduced, the comparative advantage of all maize production technologies will increase substantially. In addition, to assess the sensitivity of the DRCs to changes in the FOB prices and exchange rates, we estimated corresponding elasticities (for each technology) using FOB and exchange rate prices data from 1981 to 1994. Regression models were fitted to the estimated DRCs for each of the technologies and the computed marginal effects were used to quantify the elasticities at the means of the relevant variables. Elasticities of the DRC with respect to the FOB price (EFOB) are slightly more elastic than elasticity of DRC with respect to the exchange rate (EFOREX) (Table 4). EFOB estimates ranged from -0.48 to -0.59, while EFOREX ranged from -0.38 to -0.55. The EFOB estimates indicate that a 10%
Table 4 Domestic resource cost (DRC), Norminal protection coefficient (NPC) and effective protection coefficient (EPC) for maize production under alternative technologies in northwest Cameroon: Three periods of policy interventions
Production system Norminal protection Effective protection Elasticity of change in DRC
increase in the FOB will reduce DRC of maize production (i.e, increase domestic comparative advantage) by 5-6%. EFOREX estimates indicate that a 10% increase in the amount of domestic currency per unit of foreign currency (i.e., devaluation) leads to a 4-6% decrease in DRC of maize production (i.e., domestic comparative advantage increases by 4-6% ). Thus, as international market prices for maize increases, or as domestic currency is devalued, the comparative advantage of maize production will increase.
5. Conclusions
This paper analyzed the comparative advantage of maize production under alternative resource management technologies in the northwest of Cameroon using the PAM model. Results show that the financial profitability for maize production in Cameroon has increased substantially with the devaluation of the CFA. Maize production under agroforestry-based systems has high comparative advantage compared to imported maize and maize production relying only on chemical fertilizers.
As with all PAM analysis, the application in this paper is a static partial equilibrium analysis (Nelson and Panggabean, 1991). One way of accounting for resource dynamics within the PAM framework is to integrate yield growth functions in a series of timeindexed PAM models (Pagiola, 1991). Empirical analysis using such an approach has not been reported in the literature, and is an area for future research. We have not considered in our analysis how the social profitability of the agroforestry-based technologies may change due to positive externalities. Such positive externalities may include soil erosion control and temporal build up of soil organic matter. Our results are, therefore, conservative. The incorporation of these positive externalities will further increase the social profitability of these natural resource management technologies.
The results have several implications. First, the high financial incentives for maize production under agroforestry-based technologies suggest that farmers will adopt resource management technologies provided that they contribute to soil fertility improvement and income generation. Several resource management
technologies have failed in sub-Saharan Africa because scientists have focused only on soil fertility improvement. In northwest Cameroon, farmers are widely using resource management technologies for maize production because these technologies significantly increase their financial returns.
Second, the high social profitability of maize production under agroforestry-based technologies suggests that research managers should give increased emphasis to research on these technologies, as these represent a socially efficient use of domestic resources.
Third, there is a need to increasingly target agroforestry-based resource management technologies into areas where preconditions for their adoption exist. A reason for the reported low rate of adoption of agroforestry and other resource management technologies by farmers in humid and sub-humid zones of sub-Saharan Africa is inappropriate targeting of such technologies (Ehui et al., 1990; Spencer and Polson, 1991). By inappropriate targeting, we refer to the extension of agroforestry-based technologies for soil fertility management to areas of low population pressure and where farmers do not perceive soil fertility decline as a problem. For example, in Cameroon, some institutions are targeting such technologies to the humid forest zone, a zone with very low population pressure and where farmers do not face any serious soil fertility problems.
While such technologies may be relevant in the long term - when population pressure increases and farmers begin to face land constraints and soil fertility declines, in the short to medium term there is a low probability that farmers in the humid forest zone will significantly adopt these agroforestry-based technologies. However, in the northwest province where we conducted this work, there is very extensive use of these agroforestry-based technologies by farmers. It is not a question of potential adoption. Results from an extensive adoption survey of agroforestry-based technologies for soil fertility management (i.e., alley farming, improved planted fallows) across three provinces (northwest, southwest and center) of Cameroon showed very clearly that adoption levels are lowest in the humid forest of the Center province (Adesina et al., 1997). Adoption is highest in the northwest province where we conducted the economic analysis reported in this paper.
Agroforestry-based technologies for soil fertility improvement should be targeted to farmers in zones where there is high land use intensity and farmers recognize low soil fertility as a major problem. In addition, such technologies would also have a higher probability of adoption in areas where there are shortage of fuelwood, fodder for livestock feed, and problems of soil erosion (Adesina et al., 1997). Agroforestry-based technologies are land saving and should increase output per unit of land in a land scarce (i.e., high population density) area. Where land supply is more elastic and there is sufficient land for practising long fallow periods, farmers may not perceive incentives for investing in such land saving technologies.
Finally, efforts to expand the adoption of agroforestry-based technologies for soil fertility management in Cameroon should shift focus away from the humid forest zone and focus more on the northwest province where these preconditions for successful adoption exist. Farmers in the northwest highlands of Cameroon face serious problems of low soil fertility, soil erosion and fuelwood supply. They have, therefore, adopted, more rapidly, agroforestry-based resource management technologies in sharp contrast to farmers in the humid forest zones where land pressure is relatively low (Adesina et al., 1997; Degrande, 1997). Besides, our analysis has shown that these technologies are financially and socially profitable for maize production, and the northwest province accounts for most of the maize production in Cameroon.
Acknowledgements
We thank Tom Randolph and Steve Franzel for helpful comments and suggestions on an earlier version of the paper. The data assistance provided by Franc;ois Meppe, Anne Degrande, and the Bambui station of the Institut de Recherche Agronomique et de Developpement (IRAD) are gratefully acknowledged.
References
Adesina, A.A., Mbila, D., Tonye, J., 1997. Gender and alley farming in Cameroon, Monograph, Resource and Crop
Management Program, International Institute of Tropical Agriculture, Yaounde, Cameroon.
Byerlee, D., Eicher, C. (Eds), 1997. Africa's emerging maize revolution. Rienner, Boulder, Colorado, 300 pp.
Degrande, A., 1997. Socio-economic characteristics of households engaged in agroforestry technology testing in humid lowlands of Cameroon, Implications for adoption, IRAIICRAF Project, Yaounde, Cameroon.
Ehui, S.K., Kang, B.T., Spencer, D.S.C., 1990. Economic analysis of soil erosion effects in alley cropping, no-till and bushfallow systems in southwestern Nigeria. Agric. Syst. 34, 349-368.
Gilbert, E., Phillips, L., Roberts, M., Smale, M., Stround, Hunting, E., 1994. Maize research impact in Africa: the obscured revolution, Office of Sustainable Development, Bureau for Africa, Technical Report No.7. December, 1994.
Gumua, Y., Faki, H., Mohammed, A., Ismail, M., 1994. Profitability analysis of food grain in the Sudan's irrigated agricultural sector. Agric. Econom. 11, 325-333.
Monke, B.A., Pearson, S.R., 1989. The policy analysis matrix for agricultural development, Cornell University Press, Ithaca, 279 pp.
McHugh, D., 1989. A comparison of labor use and income generation for maize-based cropping systems in the mid- and high- altitude zones of the western highlands in Cameroon. Paper presented at the 1989 FSRJE Symposium at the University of Arkansas, Fayetteville, 8-17 October, 13 pp.
Morris, M.L., 1990. Determining comparative advantage through DRC analysis, CIMMYT Economics Paper, No. 1, International Maize and Wheat Improvement Center, Mexico.
National Cereals Research and Extension (NCRE) Project, 1990. Annual report for research activities of 1989. USAID/IITA/ NCRE, Yaounde, Cameroon.
Nelson, G.C., Panggabean, M., 1991. The cost of Indonesian sugar policy: A policy analysis matrix approach. Am. J. Agric. Econ. 73(3), 703-712.
Ngambeki, D.S., 1985. Economic evaluation of alley cropping Leucaena with maize-maize and maize-cowpeas in southern Nigeria. Agric. Syst. 17, 243-258.
Pagiola, S., 1991. Use of cost-benefit analysis and the policy analysis matrix to examine environmental and natural resource problems, Mimeograph, Food Policy Research Institute, Stanford University.
Pearson, S., Monke, E., Argwings-Kodhek, G., Avillez, F., Mukimbu, M., Pagiola, S., Sellen, D., Winter-Nelson, A., 1995. Agricultural policy in Kenya, Applications of the Policy Analysis Matrix, Cornell University Press, Ithaca, 300 pp.
Smith, J., Barau, A.D., Goldman, A., Mareck, J.H., 1993. The role of technology in agricultural intensification: The evolution of maize production in the northern guinea savannah of Nigeria. In: Dvorak, K.A. (Ed), Social Science Research and Agricultural Technology Development, Spatial and Temporal Dimensions, CAB International, U.K. pp. 144-166.
Spencer, D.S.C., Polson, R.A., 1991. Agricultural growth and sustainability: Conditions for their compatibility in the humid
and sub-humid tropics of Africa, In: Vosti, S.A., Reardon, T., von Urff, W. (Eds.), Agricultural Sustainability, Growth and Poverty Alleviation: Issues and Policies. Proc. Conf. 23-27 September 1991, Feldafing, Germany, pp. 273-293.
Sumberg, J.E., Mcintire, J., Okali, C., Atta-Krah, A.N., 1987. Economic analysis of alley farming with small ruminants. ILCA Bulletin 28, 2-6.
Tonye, J., Titi-Nwel, P., 1995. Agronomic and economic evaluation
of methods of establishing alley cropping under a maize/ groundnut intercrop system. Agric. Ecosyst. Environ. 56, 29-36.
Yamoah, C.F., Tambi, E.N., Ngueguim, M., Ngong, C., 1993. Amendment of problem soils in the East-Central African highlands with agroforestry and green manuring, In: Proceedings of the Third North American Agroforestry Conference., 16-18 August, 1993, pp. 137-143.