24
Policy Committee Meeting Fiscal Year 2004 Budget Considerations: Dark Fiber November 13, 2002

Policy Committee Meeting
Fiscal Year 2004 Budget Considerations: Dark Fiber
November 13, 2002

Economics in One Lesson by Henry Hazlitt
1. What are the long-term effects versus the short-term effects?
2. What are the unintended consequences versus the intended consequences?
3. What is the impact on the many versus the few?
Long term vs. Short term Effects
• Short term effects – Internet2 Access for all Illinois Education– Lower cost connectivity – Lower cost equipment – Higher reliability/more robust network– Lower cost filtering solutions

Long term vs. Short term Effects
• Long term effects – I2: Exposure and adoption of cutting edge pedagogy
tools and learning models that allow Illinois education to be more effective and compete globally.
– Lower cost connectivity: Allows the purchase of more bandwidth and the provision of connectivity and services that will prepare students to compete with their peers across the state and the nation.
– Lower cost equipment: Allows reallocation of funds for training and modernization of internal networks and equipment.

Long term vs. Short term Effects
• Long term effects – Higher reliability/More robust network: Fosters
reliance by education and use by other entities such as healthcare and law enforcement ultimately driving costs lower for everyone.
– Low cost filtering solutions: Opens the door for K-12 schools without technical or economic resources to “turn on filtering” instantaneously and become eligible for federal e-rate funds bringing more federal dollars into the state.
• Approximately 44% of private and 56% of public schools received e-rate funding totaling almost $170 million in fiscal year 2000.

Unintended Consequences vs. Intended Consequences
• Intended Consequences– Greater access for education– Increased opportunities for educational delivery– Aggregate benefits of participation in a
singular, large scale network

Unintended Consequences vs. Intended Consequences
• Unintended Consequences– Dramatic changes in telecommunications price
structures in Illinois
– Access to cutting edge applications and methods
– An advocacy role
– An expertise role
– Maintaining an environment that invites opportunity
– National leadership and recognition

The Impact on the Many vs. the Few
• Educational use and bandwidth demand continues to grow at rates of 30% to 433% on individual links.
• Aggregate growth in utilization network-wide is approximately 150%.
• For the price of one 16 ounce soft drink per student, per month, the state has built the nation’s premier education network.
• Truly a case where the ICN expenditure is a win-win and the aggregate network reduces overall expenses statewide.

Summary
Direct ICN Expenditures: $31.9 million
Estimated Constituent Expenditures: $41.5 million
(Access and equipment costs)
Fiscal Year 2003, Based on current utilization
Total Cost of Network (All Sources) $74.6 million
$6.0 millionCentral and regional staff and all other operating costs
Other Costs
Administrative Expenses
Cost Recovery: $ 1.2 million
BenefitBandwidth Provided For Primary Constituents
Does not include bandwidth purchased above
baseline allocation
$3.0 millionAccess Circuits:
Grooming / Last
Mile:
($1.4 million)
CT3 Local Loops: ($1.6 million)
Utilized primarily by K-12 schools (80-89%) to decrease access costs.
Internet NETWORK
ConstituentSites
K-12 Schools
Higher Education
Libraries
Museums
4,352 Connections
7,080 Mbps Provided
216 Connections
1,216 Mbps Provided
467 Connections
726 Mbps Provided
24 Connections
48 Mbps Provided
$30.03 millionEstimate of costs for constituent-paid access circuits
$11.15 millionEstimate of costs for constituent-paid equipment
Estimated Constituent Expenditures
$4.9 millionInternet & Internet2 -Transit -Transport
$18.0 millionBackbone Network:
ICN POP Facility
& Equipment:
($6.8 million)
Backbone Circuits:
($11.2 million)


4,223 K-12 Schools and
Administrative Offices

277 Higher Education Institutions
A recent study revealed that the
55 private institutions save approximately $1,319,000 per year including
bandwidth, connections, and
equipment.
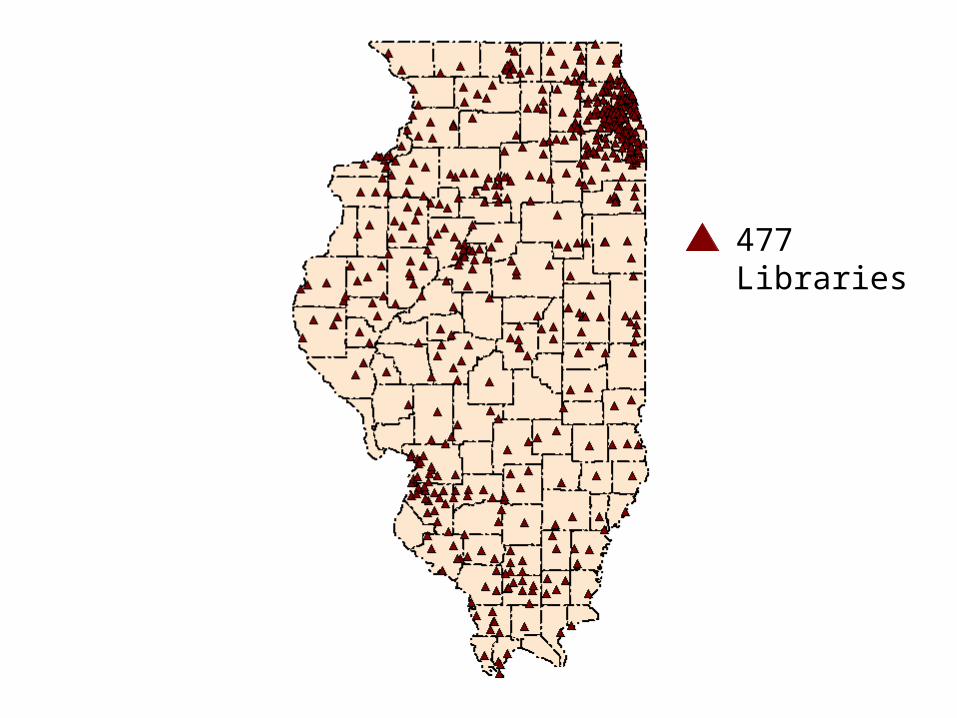
477 Libraries

25 Museums (some with
multiple locations)
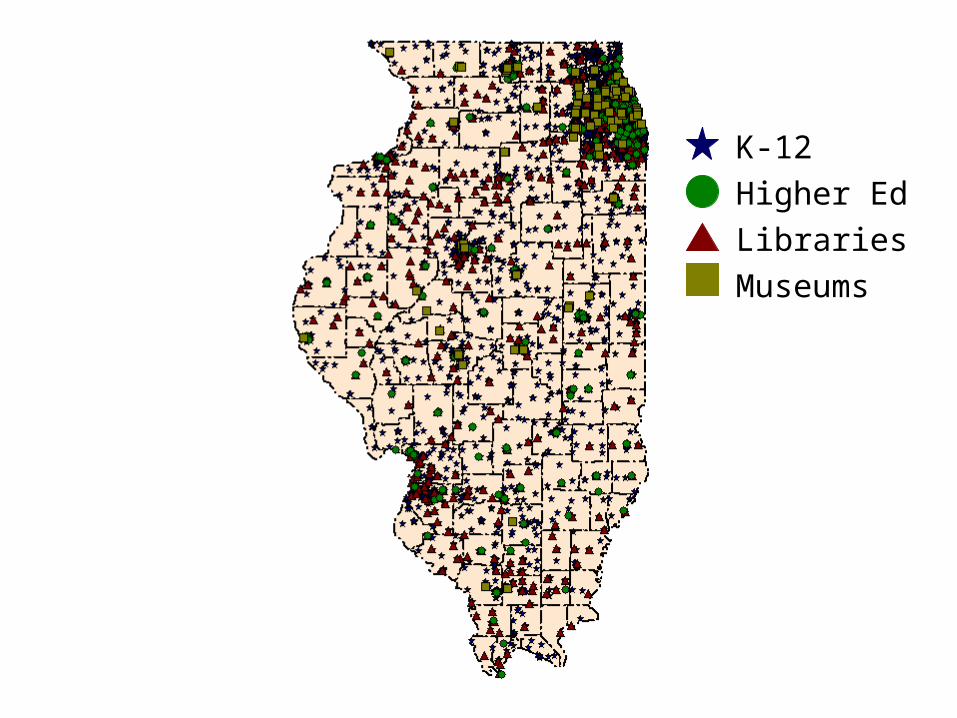
K-12
Higher Ed
Libraries
Museums

214 Municipal
Governments ranging in size from Benton to Chicago

45 Hospitals

235 Other Institutions

K-12 Schools
Higher Ed.
Libraries
Museums
Mun. Gov’t
Hospitals
Other
Almost 6,000 connected institutions!

Dark Fiber Implementation
• With level funding and internal reallocations, the ICN can “light up” the primary ring (Chicago-Peoria-Springfield-Collinsville-Champaign-Chicago).
• We estimate that we will need an additional $1-2 million to implement the Northwestern and Western legs in fiscal year 2004 (Chicago-DeKalb and Peoria-Macomb).
• As the circuits are turned up, staff estimates that continued cost recovery and other opportunities will allow implementation of other routes with minimal additional funding, if any.
• Dark fiber does not save today’s dollars.• Dark fiber provides increased capacity for the same
money.


