38
MARCH 1996 RESEARCH PAPER FORTY-THREE POLICY CONSISTENCY AND INFLATION IN GHANA Nil K. SOWA ARCHIV 104734 DMIC RESEARCH CONSORTIUM WIN iuivi rOUR LA RECHERCHE ECONOMIQUE EN AFRIQUE
MARCH 1996
RESEARCH PAPER FORTY-THREE
POLICY CONSISTENCY AND INFLATION IN GHANA
Nil K. SOWA
ARCHIV 104734 DMIC RESEARCH CONSORTIUM
WIN iuivi rOUR LA RECHERCHE ECONOMIQUE EN AFRIQUE

ID RC Ii b. (
Policy consistency and Inflation in Ghana
Other publications in the AERC Research Papers Series:
Structural Adjustment Programmes and the Coffre Sector in Uganda by Germina Ssemogerere, Research Paper 1.
Real interest Rates and the Mobilization of Private Savings in Africa by F.M. Mwega, S.M. Ngola and N. Mwangi, Research Paper 2
Mobilizing Domestic Resources for Capital Formation in Ghana: the Role of Infr)rmal Financial Markets by Ernest Aryeetey and Fritz Gockel, Research Paper 3.
The Informal Financial Sector and Macroeconomic Adjustment in Malawi by C. Chipeta and M.L.C. Mkandawire, Research Paper 4.
The Effects of Non-Bank Financial Intermediaries on Demand for Money in Kenya by S.M. Ndele, Research Paper 5.
Exchange Rate Policy and Macroeconomic Peiformance in Ghana by C.D. Jebuni, N.K. Sowa and K.S. Tutu, Research Paper 6.
A Macroeconomic-Demographic Mode/for Ethiopia by Asmerom Kidane, Research Paper 7.
Macroeconomic Approach to External Debt: the Case of Nigeria by S. Ibi Ajayi, Research Paper 8.
The Real Exchange Rate and Ghana's Agricultural Exports by K. Yerfi Fosu, Research Paper 9.
The Relationship Between the Formal and Informal Sectors of the Financial Market in
Ghana by E. Aryeetey, Research Paper 10.
Financial System Regulation, Deregulation and Savings Mobilization in Nigeria by A. Soyibo and F. Adekanye, Research Paper 11.
The Savings-Investment Process in Nigeria: an Empirical Study of the Supply Side by A. Soyibo, Research Paper 12.
Growth and Foreign Debt: the Ethiopian Experience, 1964-86 by B. Degefe, Research Paper 13.
Links Between the informal and Formal/Semi-Formal Financial Sectors in Malawi by C. Chipeta and M.L.C. Mkandawire, Research Paper 14.
The Determinants of Fiscal Deficit and Fiscal Adjustment in Cote d'lvoire by 0. Kouassy

and B. Bohoun, Research Paper 15.
Small and Medium-Scale Enterprise Development in Nigeria by D.E. Ekpenyong and M.O. Nyong, Research Paper 16.
The Nigerian Banking System in the Context of Policies of Financial Regulation and Deregulation by A. Soyibo and F. Adekanye, Research Paper 17.
Scope, Structure and Policy implications of informal Financial Markets in Tanzania by M. Hyuha, 0. Ndanshau and J.P. Kipokola, Research Paper 18.
European Economic Integration and the Franc Zone: the future of the CPA Franc after 1996. Part 1: Historical Background and a New Evaluation of Monetary Co-operation in the CFA Countries by Allechi M'bet and Madeleine Niankey, Research Paper 19.
Revenue Productivity implications of Tax Reform in Tanzania by Nehemiah E. Osoro, Research Paper 20.
The Informal and Semi-formal Sectors in Ethiopia: a Study of the Iqqub, Iddir and Sav- ings and Credit Co-operatives by Dejene Aredo, Research Paper 21.
Inflationary Trends and Control in Ghana by Nii K. Sowa and John K. Kwakye, Research Paper 22.
Macroeconomic Constraints and Medium-Term Growth in Kenya: A Three-Gap Analysis by F.M. Mwega, N. Nguguna and K. Olewe-Ochilo, Research Paper 23.
The Foreign Exchange Market and the Dutch Auction System in Ghana by Cletus K. Dordunoo, Research Paper 24.
Exchange Rate Depreciation and the Structure of Sectoral Prices in Nigeria Under an Alternative Pricing Regime, 1986-89 by Olu Ajakaiye and Ode Ojowu, Research Paper 25.
Exchange Rate Depreciation, Budget Deficit and Inflation - The Nigerian Experience by F. Egwaikhide, L. Chete and G. Falokun, Research Paper 26.
Trade, Payments Liberalization and Economic Performance in Ghana by C.D. Jebuni, A.D. Oduro and K.A. Tutu, Research Paper 27.
Constraints to the Development and Diversification of Non-Traditional Exports in
Uganda, 1981-90 by 0. Ssemogerere and L.A. Kasekende, Research Paper 28.
indices of Effective Exchange Rates: A Comparative Study of Ethiopia, Kenya and the Sudan by Asmerom Kidane, Research Paper 29.
Monetary Harmonization in Southern Africa by C. Chipeta and M.L. C. Mkandawire, Research Paper 30.
Tanzania's Trade with PTA Countries: A Special Emphasis on Non-Traditional Products by Flora Mndeme Musonda, Research Paper 31.
Macroeconomic Adjustment, Trade and Growth: Policy analysis using a Macroeconomic model of Nigeria by C. Soludo, Research Paper 32.
Ghana: The Burden of Debt Service Payment Under Structural Adjustment by Barfour Osei, Research Paper 33.
Short-Run Macroeconomic Effects of Bank Lending Rates in Nigeria, 1987-91: A Computable General Equilibrium Analysis by D. Olu Ajakaiye, Research Paper 34.
Capital Flight and External Debt in Nigeria by S. Ibi Ajayi, Research Paper 35.
institutional Reforms and The Management of Exchange Rate Policy in Nigeria by Kassey Odubogun, Research Paper 36.
The Role of Exchange Rate and Monetary Policy in the Monetary Approach to the Bal- ance of Payments: Evidence From Malawi by Exley B.D. Silumbu, Research Paper 37.
Tax Reforms in Tanzania: Motivations, Directions and Implications by Nehemiah E. Osoro, Research Paper 38.
Money Supply Mechanisms in Nigeria, 1970 -88 by Oluremi Ogun and Adeola Adenikinju, Research Paper 39.
Profiles and Determinants of Nigeria's Balance of Payments: The Current Account Component, 1950-88, by Joe U. Umo and Tayo Fakiyesi, Research Paper 40.
Empirical Studies of Nigeria's Foreign Exchange Parallel Market 1: Price Behaviour and Rate Determination by Melvin D. Ayogu, Research Paper 41.
The Effects of Exchange Rate Policy on Cameroon's Agricultural Competitiveness by Aloysius Ajab Amin , Research Paper 42
Policy consistency and inflation in Ghana
Nil Kwaku Sowa University of Ghana
/ /
AERC Research Paper 43
African Economic Research Consortium, March, 1996 /

©African Economic Research Consortium, 1996
Published by The African Economic Research Consortium P.O. Box 62882 Nairobi, Kenya
Printed by the Regal Press Kenya Ltd P.O. Box 46166 Nairobi, Kenya
ISBN 9966-900-62-4

Contents
List of tables List of figures Acknowledgements Abstract
I. Introduction 1
2. Fiscal deficits, money and inflation 3
3. An error correction model of inflation 9
4. Inflationary targets and control in Ghana 13
5. Fiscal policy consistency 15
6. Conclusion 20
Appendix 21
Notes 24 References 25

List of tables
1. Fiscal performance:1965-91 5
2. Changes in money supply and sources of changes 6
3. Balance sheet of the banking system 7
4. An error-correction model of inflation 11
5. Actual and programmed GDP growth and inflation 14
6. Ghana: actual and financeable deficit 18
List of figures
1. Output growth and inflation 2
Acknowledgements
I wish to acknowledge with thanks fmancial support from the African Economic Research Consortium. I also recognize with gratitude logistic support provided by the Centre for the Study of African Economies, Oxford, where the project was completed while on sabbatical leave. This paper has benefited from comments by members of the AERC Advisory Committee and participants at workshops in Nairobi (AERC), Oxford University, and University of Warwick. I have particularly benefited from helpful suggestions by Chris Adam, Benno Ndulu, Steve O'Connell and two anonymous referees. I, however, remain solely responsible for any remaining errors.

Abstract
Inflation appears to be the macro-problem in Ghana for which no antidote has been found under the economic recovery programme. It is possible that either a wrong diagnosis has been made of the problem, or that certain factors within the economy are preventing inflation from staying within target levels.
Using an error-correction model (ECM), the paper estimates an inflation equation for Ghana. The convenience of this model is in the fact that all the data series exhibit an autoregressive scheme of order one: that is they are 1(1) series. In such an instance the Granger-Engle Theorem shows that the ECM provides the most efficient model. Further, the ECM unveils some of the short-run dynamics which are missing in other estimation techniques. The results of the econometric regression showed that inflation in Ghana, in either the long run or the short run, is influenced more by output volatility than by monetary factors.
An examination is made of the consistency of fiscal deficits. The hypothesis is that an unsustainable fiscal policy would make government miss some macroeconomic targets. It is shown that in 1985 and 1989, fiscal policy was consistent. Inflation was well within target in 1985. For 1986-1988, the government did not maintain consistent fiscal deficits, and inflation in those years was well above targets.
It is recommended that to control inflation in Ghana, more attention should be paid to supply factors. Further, government should pursue consistent fiscal policies.

I Introduction
Inflation has been the albatross of Ghana's economic recovery programme (ERP). Since the beginning of the programme, the Government of Ghana has made a lot of effort to bring inflation under control. Tight monetary and fiscal policies targeted the demand causes of inflation. Within a year of the programme, the inflation rate was dropped from 123% to about 40% and then to 10% percent in 1985. Since then, inflationary rates have averaged about 30% per annum, persistently above targets set within the ERP.
Two major recent studies on Ghana's inflation have identified two different reasons for the problem. Chhibber and Shafik (1990) concluded that monetary growth was instrumental in determining the pace of inflation in Ghana. They observed that the large inflow of external resources over the ERP period has led to a huge expansion of the money stock, which in turn has exerted strong demand and inflationary pressures. While agreeing that the high pace of monetary expansion has a strong effect on inflation, Sowa and Kwakye (1991) observed that the foreign inflows also led to the rehabilitation of factories and the import of final goods, which eased the supply pressures as well. Thus, Sowa and Kwakye claimed, though money has been expanding at about the same rate in the ERP period as before, its influence on inflation has not been that strong. On the other hand, they found real factors to be more pronounced in Ghana's inflationary spiral. Figure 1 demonstrates the relationship. The authors reckoned that by formulating real factors as monetary (using Wairas' Law), Chhibber and Shafik lost the ability to capture the real factors independently and rather accentuated the effect of the monetary factors. Sowa and Kwakye further explained that the potency of the real factors is in food production. Food accounts for about 50% of the official consumer price index;' hence fluctuations in food production and price affect the general price level significantly.
This paper examines why the rates of inflation in Ghana have usually stayed above target levels. A trivial answer is that the targets were too optimistic and outside the achievable ranges. The paper assumes that the targets were reasonable and examines other possible reasons why they were not met.2 One answer provided by the Sowa and Kwakye (1991) study is that inflation is much more influenced by real factors (particularly food production), which have so far not been addressed by policy. It can be argued that policy effects on the real sector are of a long-run nature and may not be expected to have short-run effects on inflation. A weakness of the Sowa and Kwakye (1991) study was its inability to capture the short-run dynamics of the inflationary spiral. This study addresses this issue by employing an error-correction model to examine inflation in Ghana.
Another possible reason for the inability of the ERP to bring inflation rates within target levels may arise from policy inconsistencies. The main hypothesis is that fiscal

2 RESEARCH PAPER 43
Figure 1: Output growth and inflation
C a 0 a
deficits (broadly defined)3 over the ERP period are not consistent with macroeconomic targets (including inflation) in the programme. In such a situation some of the macroeconomic targets like inflation are violated.
The paper is organized as follows: The next section discusses the deficit-money- inflation linkages in Ghana. Section III reformulates an econometric model of inflation in Ghana using an error-correction model. Section IV discusses the control measures adopted so far and their effectiveness in relation to the targets set. Section V examines the consistency of fiscal policy, while the last section summarizes the paper and brings out recommendations.
Year

II Fiscal deficits, money and inflation
The theory that links fiscal deficits, money and inflation can be traced through the familiar government budget constraint. Consider a situation in which the goal of national policy is the closure of a potential GNP gap. Demand management techniques suggest the application of a particular fiscal stimulus to close the gap. Such an expansionary fiscal policy, without a corresponding increase in tax revenue, leads to an increase in the fiscal deficit. There are four ways in which the deficit can be financed: 1) printing money, 2) running down foreign reserves, 3) borrowing from abroad, and 4) borrowing from the domestic sector. That is,
Budget deficit = [money printing + foreign reserves + foreign borrowing + domestic borrowing] (1)
Each of the different ways of financing the deficit has its own problems. For example, foreign reserve use can lead to exchange rate crises, while foreign borrowing may lead to an external debt problem. The printing of money to finance the deficit may also lead to inflation.
With the exception of money printing, there are limitations on the extent to which a
government can pursue these financing options. The following sections show the nature of fiscal deficits in Ghana and how they have been financed.
Fiscal deficits
From the early 1960s, when over-indulgence in modernization and import substitution led to excessive government spending, until 1986, the public budget (even narrowly defined) registered deficits. Between 1965 and 1985, the narrowly defined deficit averaged about 5% of GDP per annum. To finance the deficit, government relied mostly on internal borrowing from banks and the non-bank public.
Before the ERP, reliance on external borrowing to finance Ghana's fiscal deficit was negligible. Nkrumah's pride of place as the champion in the fight against neo-colonialism prevented his government from seeking budgetary support from the Bretton Woods institutions, whose activities he viewed as imperialistic. During the governments of the National Liberation Council (NLC, 1966-1969) and the Progress Party (PP, 1969-1972), an IMF-sponsored adjustment programme opened the door to external borrowing for financing the deficit. In 1970, the deficit was almost fully financed from external borrowing.

4 RESEARCH PAPER 43
The lean towards external borrowing to finance the deficit was turned in 1972, when on taking over power from the Progress Party government, Acheampong's National Redemption Council (NRC) repudiated some of Ghana's external debts. Ghana was then black-listed in the international financial community. From 1973-1979, and even running over to the years of the Armed Forces Revolutionary Council (AFRC) to the People's National Party (PNP), through to the beginning years of the Provisional National Defence Council (PNDC) (1979-1983), Ghana could raise very little external finance to support her deficit. Over these years, government borrowed heavily from the banking sector to finance the deficit. The implication of this for the money supply and inflation will be examined later.
Fiscal performance in the ERP period (1983 onwards) has been quite different from those of past regimes. Government expenditure has been somehow restrained in both real and nominal terms. Several "cost-saving" and "cost-recovery" measures have been introduced in most public departments and services. Subsidies on health and education have been removed. Hospital fees have been introduced at government hospitals and parents are now required to pay more for the education of their wards. Government expenditure has consistently been kept at 14% of GDP. As part of the measures to maintain the restraint on expenditure, the public sector wage bill has been pegged at 5% of GDP, forcing government to retrench public servants. On the revenue side, efforts at tax collection have intensified. The tax net has been widened. The restrained government spending and the enhanced revenue collection have resulted in the elimination of the deficit (narrowly defined) since 1986.
It is interesting to note the importance of foreign inflows to the Ghana budget in the ERP era. International credibility gained by Ghana in her economic turn-around under the ERP has translated into external capital inflow, which has supported her budget and balance of payments. Since 1986, external support has even helped pay off some internal public debt. See columns 7 and 8 of Table 1.
The effect of fiscal deficits on inflation is usually through the impact of financing on the money stock. This issue is examined below.
Money supply
Up until 1972, and with the exception of 1964, the growth of the money supply in Ghana hardly exceeded the 15% mark set out in the Bank ofGhanaAct(1963). The 1964 lunge of 39% in monetary growth made inflation surge into double digits from that year on. But the distinct era of monetary indiscipline was the 1972-1982 period in which the money supply grew at an average of about 40% per annum. A casual look at the sources of growth in money shows that a lot of it came from domestic credit creation: basically the government was just printing money.
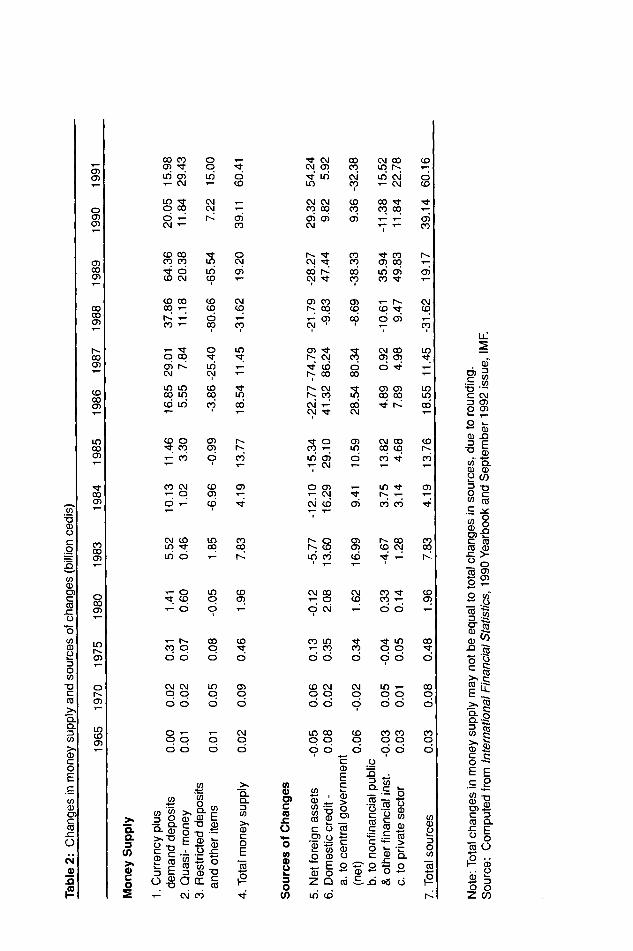
Over the ERP period, money supply has been growing at the same high average of 40%. However, the source of growth in money has not been the same as previously. As evidenced by the data in Table 2, even though there had been huge leaps in domestic credit after 1983, money supply did not expand by as much. This is because, since the

POLICY CONSISTENCY AND INFLATION IN GHANA 5
Table 1: Fiscal performance: 1965-1991 (billion cedis)
Year GDP External
Revenue Grants Expend. Deficit Financing
Domestic Foreign
1965 1970 1975 1980 1983 1984 1985 1986 1987 1988 1989*
1990 1991
1.47 2.26 5.24
42.85 184.05 270.56 343.05 511.37 746.00
1057.90 1419.80 1889.00
236.00
0.30 0.00 0.40 0.00 0.80 0.00 2.95 0.00
10.20 0.06 21.70 0.91 38.70 1.60 69.80 3.90
105.00 6.00 142.20 11.60 193.20 21.30 241.30 28.10 334.20 34.30
0.37 0.49 1.20 4.80
15.20 27.50 47.90 73.30
102.10 149.90 204.20 264.30 337.46
0.07 0.09 0.40 1.85 4.95 4.89 7.60 0.40÷ 8.90+ 3.90+
10.30+ 5.10
31 .04+
0.08 0.00 0.05 0.05 0.40 0.00 1.52 0.29 3.83 0.97 3.03 1.82 4.04 3.52 5.32 -5.61
-2.88 -1.18 -6.17 2.26
-15.28 4.93 -25.07 20.06 -53.04 22.00
* World Bank estimates. + Surplus. Source: International Financial Statistics, 1990 Yearbook, IMF and Ghana Monetary Survey, World (unpublished)
ERP, expansions in domestic credit have been mitigated by decreases in net foreign assets.
Change in the net foreign assets over the ERP period has come about through two channels. First, there has been capital inflow in the form of balance of payments and budgetary support loans and grants. These external inflows have augmented the national reserves position and, thus, its capacity to increase domestic liquidity. A substantial portion of the inflows result in direct cedi-counterpart payments to domestic entities (government, public and private organizations, individuals) leading directly to enlargement of domestic liquidity. During 1983-1990, gross external inflows averaged more than $650 million per annum. Assuming that the same levels of domestic liquidity had been fully supported by internal portfolio adjustments, increases in money supply would have averaged in excess of 100% over the ERP period.
The second source of change in the net foreign assets is through the so-called "revaluation losses". Revaluation losses comprise losses to government arising from revaluation (following exchange rate depreciation) of accrued external commitments —
oil bills, dividends awaiting transfer, current payment arrears, repurchases to the IMF and other outstanding loans.
There has been a lot of argument among central bankers and researchers as to whether revaluation losses do, indeed, constitute liquidity injection. The answer lies in how the book keeping entries are made for the losses. Consider the balance sheet of the banking system as shown in Table 3. When there are changes in the exchange rate, the value of the net foreign assets, in cedi terms, changes. For instance, a devaluation will
Tab
le 2
: C
hang
es in
mon
ey s
uppl
y an
d so
urce
s of
cha
nges
(bf
lhio
n ce
dis)
1965
1970
1975
1980
1983
1984
1985
Money S
uppl
y
1. C
urre
ncy
plus
de
man
d de
posi
ts
2. Q
uasi
- m
oney
3.
Res
tric
ted
depo
sits
an
d ot
her
item
s
4. T
otal
mon
ey s
uppl
y
Sou
rces
of C
hang
es
5. N
et f
orei
gn a
sset
s -0
.05
0.06
0.
13
6. D
omes
tic c
redi
t -
0.08
0.
02
0.35
a.
to
cent
ral
gove
rnm
ent
(net
) 0.
06
-0.0
2 0.
34
b. t
o no
nfin
anci
al p
ublic
&
oth
er fi
nanc
ial i
nst.
-0.0
3 0.
05
-0.0
4 c.
to
priv
ate
sect
or
0.03
0.
01
0.05
7. T
otal
sou
rces
0.
03
0.08
0.
48
Not
e: T
otal
cha
nges
in m
oney
sup
ply
may
not
be
equa
l to
tota
l cha
nges
in
sour
ces,
due
to
roun
ding
.
Sou
rce:
C
ompu
ted
from
Int
erna
tiona
l Fin
anci
al S
tatis
tics,
199
0 Y
earb
ook
and
Sep
tem
ber
1992
iss
ue,
IMF
.
1986
19
87
1988
19
89
1990
19
91
0.00
0.
02
0.31
0.
01
0.02
0.
07
0.01
0.
05
0.08
0.02
0.
09
0.46
1.41
0.60
-0.0
5
1.96
-0.1
2 2.
08
1.62
0.33
0.
14
1.96
5.52
0.
46
1.85
7.83
-5.7
7 13.60
16.9
9
-4.6
7 1.
28
7.83
10.1
3 11
.46
1.02
3.
30
-6.9
6 -0
.99
4.19
13
.77
-12.
10
-15.
34
16.2
9 29
.10
9.41
10
.59
3.75
13
.82
3.14
4.
68
4.19
13
.76
16.8
5 29
.01
37.8
6 64
.36
20.0
5 15
.98
5.55
7.84
11.18
20.38
11.84
29.43
-3.86 -25.40
-80.66
-65.54
7.22
15.00
18.54
11.4
5 -3
1.62
19
.20
39.1
1 60
.41
-22.
77 -
74.7
9 -2
1.79
-2
8.27
29
.32
54.2
4 41
.32
86.24
-9.83
47.44
9.82
5.92
28.54 80.34
-8.69
-38.33
9.36 -32.38
4.89
0.92
-10.61
35.94
-11.38
15.52
7.89
4.98
9.47
49.83
11.84
22.78
18.55 11.45
-31.62
19.17
39.14
60.16

POLICY CONSISTENCY AND INFLATION IN GHANA 7
Table 3: Balance sheet of the banking system
Central bank Commercial banks Banking system
Assets Assets Assets
Net foreign assets Credit to government
Reserves Credit to private sector
Net foreign assets Credit to government
Liabilities Liabilities Laibilities
Currency Commercial bank reserves Net worth
Demand deposits Time deposits
Currency Demand deposits Time deposits Net worth
cause a decrease in the cedi value of the net foreign assets.4 This change can be posted to the balance sheet in three different ways. The central bank can either:
1. Consider it as a liability of government and hence debit the government account; 2. Create a pseudo-asset account and post in all the losses; or 3. Change the net worth on the liability side to match up the change in net foreign
assets.
It is clear that only the third method will have an effect on the money supply, since the first and second methods will leave both total assets and total liabilities unaffected. On the other hand, if the third method had been adopted, the net worth of the central bank would have been completely wiped out and the country would have been bankrupt. Further, since the country's net worth does not automatically decrease by devaluation, one car rule out the third option. Hence, one can conveniently assume that the revaluation losses do not directly affect the money stock. The choice between the other two options is reduced to the question of who bears the revaluation losses — the central bank or the cental government.
The second accounting method was used in Ghana until September 1990. That is, instead of being charged to the account of the government, whose liability they were, the losses were allowed to accumulate in a pseudo-asset account at the Bank of Ghana. With the massive exchange rate depreciation from 2.75 cedis to the US dollar in 1983 to more than 350 cedis to the dollar in 1990, the losses increased substantially, reaching some 311 billion cedis by September
In September 1990 the Bank of Ghana changed its accounting to the first method, whereby government's account is debited with the losses. The government issued long- term securities to the Bank of Ghana to cover the accrued losses as of September 1990. Only interest payments (nominally fixed at 4% ) were to be charged to the budget.
Since 1990 government has managed to keep the growth in money supply at a minimal

8 RESEARCH PAPER 43
rate. From Table 2, it can be seen that in 1990 the credit squeeze was on public enterprises while in 1991 it was on central government. The private sector has somehow escaped the squeeze. This may be in line with the government objective under the structural adjustment programme (SAP-2) to promote private sector initiatives.
In sum, though growth in money under the ERP has averaged about the same rate as before the programme started, the source of the change has been different. Changes in net foreign assets have influenced changes in money under the ERP period. Capital inflow usually brings with it the ability to purchase necessary imports for promotion of domestic output. The increase in prices due to the increased liquidity under the NFA injection may thus have been muffled by increased supply of goods and services. The effect of changes in money on inflation then becomes an empirical issue.
Ill An error correction model of inflation
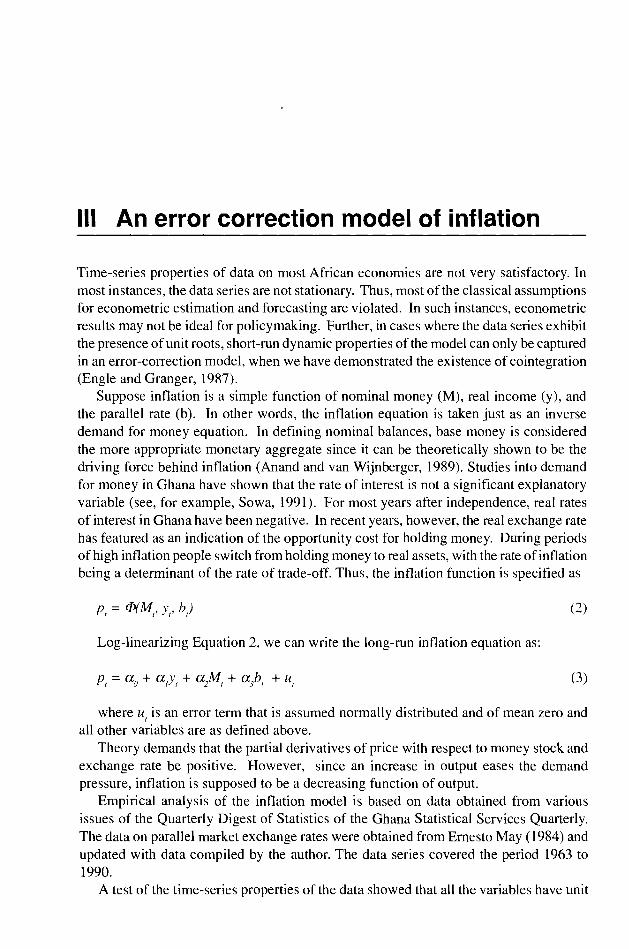
Time-series properties of data on most African economies are not very satisfactory. In most instances, the data series are not stationary. Thus, most of the classical assumptions for econometric estimation and forecasting are violated. In such instances, econometric results may not be ideal for policymaking. Further, in cases where the data series exhibit the presence of unit roots, short-run dynamic properties of the model can only be captured in an error-correction model, when we have demonstrated the existence of cointegration (Engle and Granger, 1987).
Suppose inflation is a simple function of nominal money (M), real income (y), and the parallel rate (b). In other words, the inflation equation is taken just as an inverse demand for money equation. In defining nominal balances, base money is considered the more appropriate monetary aggregate since it can be theoretically shown to be the driving force behind inflation (Anand and van Wijnberger, 1989). Studies into demand for money in Ghana have shown that the rate of interest is not a significant explanatory variable (see, for example, Sowa, 1991). For most years after independence, real rates of interest in Ghana have been negative. In recent years, however, the real exchange rate has featured as an indication of the opportunity cost for holding money. During periods of high inflation people switch from holding money to real assets, with the rate of inflation being a determinant of the rate of trade-off. Thus, the inflation function is specified as
= (2)
Log-linearizing Equation 2, we can write the long-run inflation equation as:
Pt = + + + + u1 (3)
where U, 15 an error term that is assumed normally distributed and of mean zero and all other variables are as defined above.
Theory demands that the partial derivatives of price with respect to money stock and exchange rate be positive. However, since an increase in output eases the demand pressure, inflation is supposed to be a decreasing function of output.
Empirical analysis of the inflation model is based on data obtained from various issues of the Quarterly Digest of Statistics of the Ghana Statistical Services Quarterly. The data on parallel market exchange rates were obtained from Ernesto May (1984) and updated with data compiled by the author. The data series covered the period 1963 to 1990.
A test of the time-series properties of the data showed that all the variables have unit

10 RESEARCH PAPER 43
roots. That is, the auto-regressive distributed lag (ADL) functions of the variables are of 1(1) series. This implies that the variables are non-stationary and hence may exhibit some spurious correlations. On the other hand, a test for cointegration using the Dickey- Fuller (DF), Augmented Dickey-Fuller (ADF) and Sargan-Bhargava-Durbin-Watson (SBDW) tests revealed that the residual in Equation 3 is of 1(0) series. In other words, inflation is co-integrated with output, money and the parallel market exchange rate. Applying ordinary least squares (OLS) to Equation 3 yields the long-run regression results:
2.0418 - 0 + O.6641M + (4) (2.060) (0.389) (0.282) (0.040)
R2 = .997, o• = .1556; F(3,27) = 3019.61[.0000]; DW = 1.19
The standard errors of the estimates are shown under them in parentheses. The high F-statistic and R-squared indicate the joint significance of the explanatory variable and the high degree to which variations in the rate of inflation are explained by variations in output, real balances and the parallel rate. The DW indicates a strong case of serial correlation, brought on apparently by the lack of any lag structure in the model. All the parameters have the right signs. Note also that the Durbin-Watson statistic is above the critical level of 1.10, and therefore accepts cointegration by the SBDW test.
The result in Equation 4 suggests that in the longrun there is not much significant difference in the effects of money and output on inflation, although output has an edge. This agrees with the monetarist argument on the power of monetary factors in the long- run inflationary process.
To capture the short-run dynamics of inflation, we impose lag structures on the cointegration equation in 3. Since the variables are co-integrated, by the Granger-Engle Representation theorem, an error-correction model (ECM) will present the most efficient estimation. We therefore formulate an over-parameterized inflation model as:
zip + + J3 8Ab / + (6)
is the error-correction factor and is a serially uncorrelated disturbance term. The initial run of the over-parameterized model using OLS is presented in Appendix 1.
The F-statistic (=5.66 [.0012]) implies the acceptance of the hypothesis of joint significance of the explanatory variables at the 1% significance level, against the null of non-significance. The lack of significant difference between the "ordinary" standard errors and the heteroscedastic consistent standard errors (HCSE) indicates the near homoscedasticity of the errors.
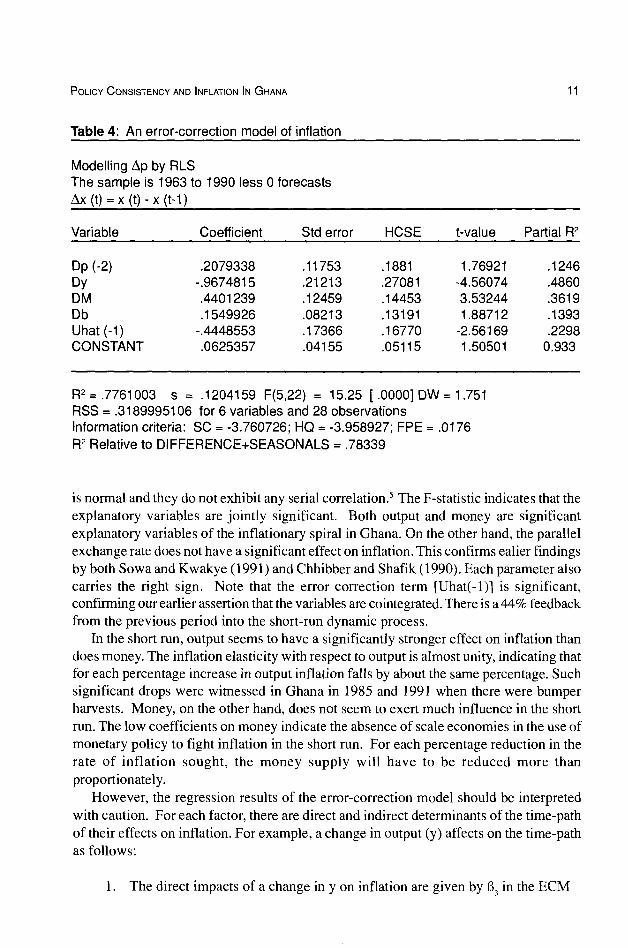
In an attempt to work towards a more parsimonious equation, variables with low t- statistics in the over-parameterized regression were dropped. The regression results of the restricted model are presented in Table 4. Notice the fall in the Schwarz Criterion from -3.14 in the over-parameterized model in Appendix I to -3.76 in the restricted model in Table 4. This implies that the information content in the latter model is more than in the former. The model has nice statistic Ia properties: the distribution of the errors
POLICY CONSISTENCY AND INFLATION IN GHANA 11
Table 4: An error-correction model of inflation
Modelling by RLS The sample is 1963 to 1990 less 0 forecasts
x (t) x (t-1)
Variable Coefficient Std error HCSE t-value Partial R2
Dp(-2) .2079338 .11753 .1881 1.76921 .1246 Dy -.9674815 .21213 .27081 -4.56074 .4860 DM .4401239 .12459 .14453 3.53244 .3619 Db .1549926 .08213 .13191 1.88712 .1393 Uhat(-1) -.4448553 .17366 .16770 -2.56169 .2298
CONSTANT .0625357 .04155 .05115 1.50501 0.933
R2 = .7761003 s = .1204159 F(5,22) = 15.25 [.00001 DW = 1.751 RSS = .3189995106 for 6 variables and 28 observations Information criteria: SC = -3.760726; HQ -3.958927; FPE = .0176 R2 Relative to DIFFERENCE+SEASONALS = .78339
is normal and they do not exhibit any serial correlation.5 The F-statistic indicates that the explanatory variables are jointly significant. Both output and money are significant explanatory variables of the inflationary spiral in Ghana. On the other hand, the parallel exchange rate does not have a significant effect on inflation. This confirms ealier findings by both Sowa and Kwakye (1991) and Chhibber and Shafik (1990). Each parameter also carries the right sign. Note that the error correction term [Uhat(-1)] is significant, confirming our earlier assertion that the variables are cointegrated. There is a 44% feedback from the previous period into the short-run dynamic process.
In the short run, output seems to have a significantly stronger effect on inflation than does money. The inflation elasticity with respect to output is almost unity, indicating that for each percentage increase in output inflation falls by about the same percentage. Such significant drops were witnessed in Ghana in 1985 and 1991 when there were bumper harvests. Money, on the other hand, does not seem to exert much influence in the short run. The low coefficients on money indicate the absence of scale economies in the use of monetary policy to fight inflation in the short run. For each percentage reduction in the rate of inflation sought, the money supply will have to be reduced more than proportionately.
However, the regression results of the error-correction model should be interpreted with caution. For each factor, there are direct and indirect determinants of the time-path of their effects on inflation. For example, a change in output (y) affects on the time-path as follows:
1. The direct impacts of a change in y on inflation are given by 133 in the ECM

12 RESEARCH PAPER 43
Equation 6 and the coefficients on the lagged output variables. 2, The indirect effects are of two kinds: a. The lagged dependent variable in the ECM equation means that a shock to
will have additional effects on inflation in periods t+], t+2 given by 1313 and similarly for effects coming through the lagged outputs.
b) The second indirect impact comes through the error-correction term, and therefore depends on the relative size of the direct effects of y in the cointegration and error- correction equations. This effect is given by (133-cz1)1310, B4B10,._
Thus, from our regression results above, we can calculate the total short-run impacts as follows:
Impact Output Money
Direct -0.9675 0.4401 Indirect (a) -0.2012 0.0915
(b) -0.1149 0.0996 Total -1.2836 0.6312
In sum, working through the short-run dynamics shows that the effect of output on Ghana's inflationary spiral is more pronounced than the monetary effect. As a long-run phenomenon, however, there is not much significant difference between the impact of output and the impact of money.
Thus, to keep inflation under control, more attention should be paid to policies that will enhance growth in real output. Any anti-inflationary policy that neglects the supply side is not likely to be successful. A first clue as to why Ghana has been missing its inflation targets could be that not enough attention has been paid to the supply side, which is more subject to the vagaries of the weather.
In the next section we examine some of the policies that have been pursued so far, and their effect on inflation in Ghana.

IV Inflationary targets and control in Ghana
Since the inception of the ERP in 1983, a number of policies have been directed at
reducing the level of inflation in Ghana. These policies, designed to stabilize an economy in serious disequilibrium, included fiscal, monetary and income policies. Fiscal management — in terms of improved tax administration and restrictions on government spending involving removal of subsidies on some goods and services and cost recovery and cost saving effort were applied in order to reduce the huge deficit build-up. From a
low of 6% of GDP in 1983, total revenue (inclusive of external grants) increased to about 15% in 1987 and has maintained that ratio since. On the expenditure side, there has been an increase from about 8% of GDP in 1983 to about 14% in 1987. Thus, by 1986 the budget deficit was eliminated.
Though the deficit was eliminated, government never let loose the rein on monetary control. Tight monetary policy was maintained. Interest rates were steadily increased administratively until 1989 when the market was allowed to determine the rates. Banks were asked to restrain their issue of advances (Sowa, 1991). In spite of these attempts, money supply continued to grow at an average of about 40% per annum over the ERP period — but as explained above, the source of growth of money in the ERP period has been foreign inflows.
Inflation does seem to have shown some response to the policy initiatives. From a
high level of 123% in 1983, the rate of inflation dropped to just about 37% in 1990, with an ERP low of 10% in 1985.6 In spite of these reductions, however, inflation has usually stayed above targets set within the recovery programme.
There is no evidence of inflationary targets being set in Ghana in the pre-ERP period. During the ERP, targets were normally set and presented in the policy framework papers (PFPs) prepared and agreed upon by the Government of Ghana, the International Monetary Fund and the World Bank. Table 5 presents data on actual and target values for inflation and growth of real gross domestic product. There are also data on external debt-GDP ratios.
Inflation has for most of the ERP period stayed above target. Between 1984 and 1991, the rate of inflation was within target only three times while output was within target five times. It is quite clear that both output and inflation in Ghana are influenced by the weather. The years when output fell short of target were mostly years of partial drought, particularly 1983/84 and 1989/90. Inflation was also within target mostly during years of good weather and good harvest. In 1984/85 and 1991 gluts in production caused food prices to fall.
The puzzle is that, given the significant influence that output has on inflation, and given the good growth performance of GDP during the ERP period, inflation was

14 RESEARCH PAPER 43
Table 5: Actual and program med GDP g rowth an d inflation (percent) 1984 1985 1986 1987 1988 1989 1990 1991
Inflation
Target Actual Deviation
40.6 39.7
0.9
25.6 10.3 15.3
20.0 24.6 -4.6
15.0 39.8 -24.8
21.8 31.4 -9.6
20.0 25.2 -5.2
15.0 37.2
-22.2
20.0 18.0 2.0
Real GDP growth
Target Actual Deviation
7.6 2.6 5.0
4.0 5.1
-1.1
4.3 5.2
-0.9
4.2 4.8
-0.6
5.5 6.2
-0.7
6.0 5.1
0.9
4.8 3.3 1.5
4.5 5.0
-0.5
Debt/GDP Ratio 44.6 50.3 48.9 66.3 58.0 55.4 56.3 57.7
Source: World Bank, Ghana: Policy Framework Paper (several Issues); World Bank, Ghana:
Towards Structural Adjustment (1985); World Bank, World Debt Tables (1991 -1 992).
not brought within target. For instance, between 1986-1988, output performed better than programmed and yet inflation stayed above target levels. It is worth noting that in those years the agricultural sector generally, and food production in particular, did not perform well.7
The deviation from macroeconomic targets may be explained by lack of consistency in policy formulation. In making projections and preparing targets, the Ghanaian authorities and the Bretton Woods institutions rely on a five-sector flow-of-funds model "to ensure consistency between the current and capital accounts of the public, monetary and private sectors, the balance of payments, and the national accounts" (World Bank, 1985, p. 111). The consistency of the targets set for the various sectors ties into the government budget constraint. In other words, consistency of targets hinges on the maintenance of a sustainable government budget deficit.

V Fiscal policy consistency
The analytical framework in this section draws extensively on the work of Anand and van Wijnbergen (1989),8 The analysis starts with the government budget constraint and shows the restrictions it imposes on various macroeconomic targets, including inflation. Earlier theoretical analysis of the importance of the government budget constraint in macro-equilibrium can be found in Blinder and Solow (1973), Phelps (1973), Dornbusch (1977), Sargent and Wallace (1982), and Buiter (1983a,b). Our earlier discussion also established the relation between the government budget constraint and inflation.
The basic idea is that there must be consistency between fiscal deficits and other macroeconomic targets. From Equation 1, we notice that fiscal deficits can be financed through internal or external borrowing or through the printing of money. "Macroeconomic targets, such as target inflation rate, imply restrictions on these sources of financing which then determine financeable deficit. If the actual deficit exceeds the financeable deficit, one or more of the macroeconomic targets will not be met without fiscal adjustment" (Anand and van Wijnbergen, 1989, p. 18). In other words, macro targets, including inflation, should be consistent with a sustainable fiscal deficit.
The fiscal deficit is made up of the non-interest deficit, that is the excess of expenditure over revenue, plus interest payments on domestic and foreign debt. This is financed through running down reserves, borrowing from internal and external sources, and printing money. Thus the government budget constraint, as in Equation 1, can be expressed as,
D + iB + -NFA1)E = + (ABJ-ANFAJ)E + AM (5)
where,
D = non-interest deficit in cedis i = nominal domestic interest rate B = domestic debt in cedis
= nominal foreign interest rate B1 = foreign debt in dollars NFAJ. = net foreign assets in dollars E = exchange rate (cedis/dollars) M = nominal money stock (zi) denotes change in the variable over time
Thus, the left-hand side of Equation 5 lists the expenses of the public sector as the current deficit plus interest payments to creditors. The right-hand side shows the sources of

16 RESEARCH PAPER 43
finance as new debt raised, running down on reserves and printing of money. It has been argued by some researchers (e.g., Anand and van Wijnbergen, 1989), that
the deficit should be defined exhaustively to include central and local government and public enterprises, as well as the central bank.9 Data limitations for Ghana, however, prevent such an exhaustive definition. In a situation where the local governments and public enterprises depend heavily on central government subvention, there is not much that one is giving away by relying solely on the central government budget. In the case of the central bank, its profits from the printing of money are treated as a source of financing the public budget deficit (Fischer and Easterly, 1990, p. 130). On the issue of revaluation losses, since 1990 government has accepted it as its liability and has been charging interest payments on it to the deficit. These limitations bias our analysis of government deficit towards sustainability.
Equation 5 can be written in real terms as,
d + rh + r//bf - nfa1)e = Ab + + (AMIP) (6)
The lower case letters denote real variables. P is the general price level; e (=EP/P) defines the real exchange rate; and m (=MIP) is the real money stock (base money). The real interest rate r is defined as,
r (1 + i)I(] + jr) - 1, where iris the inflation rate.
Note that (A.MIP) = Am + mlr. Thus, Equation 6 can be re-written as
d + i-b + r/bf-nfaf)e = Ab + (Ab1-Anfa1)e + Am + mir (7)
In Equation 7, the real fiscal deficit equals changes in the real value of domestic and foreign debt, plus revenue from seigniorage and inflation tax. It is clear that an increased deficit will have to be financed by increased interest-bearing debt and seigniorage revenue.
Sometimes a government may wish to reduce its debt through high inflation rates. This is because as inflation rates rise, the value of the stock of existing debt falls. Notice from Equation 6 that the inflation tax may also increase, helping to make the fiscal debt sustainable. However, there is a trade-off between inflation and seigniorage revenue. Fischer and Easterly (1990) postulate a Laffer curve situation in which seigniorage revenue rises as inflation rises until it reaches a maximum, and thereafter declines with every increase in the rate of inflation. This is because as inflation increases there is an increased demand for base money (basically, currency). But beyond some point the demand for base money declines as the inflation rate rises.
Using recursive least squares (RLS), Equation 8 shows the seigniorage revenue- inflation trade-off for Ghana.

POLICY CONSISTENCY AND INFLATION IN GHANA 17
Am = 0.1188 - 0.3416ir (8)
(0.0916) (0.0441)
R2=0.3398; F(1,27)= 13.90 [.0009]; DW 2.36
The trade-off shows a decreasing function, with seigniorage revenue dropping by 34.16% for each percentage increase in the rate of inflation. From the graph in Figure 1, it is
clear that for inflation rates above 40%, there is no seigniorage gain at all — in fact government starts to lose on seiniorage revenue. This result seems to support the converse of the argument that "...if inflation elasticity of base money demand is below unity in
absolute value then higher inflation will increase real seigniorage" (Buiter, 1985, reprinted in Buiter, 1990, p.57). If the inflation equations in Section III are treated as inverse money demand functions, then the results indicate inflation elasticity of base money demand to be above unity.
Under the assumption that government keeps to a constant debt-output ratio as a
strategy, real domestic debt cannot grow faster than real output and real net foreign debt cannot grow faster than the ratio of output to the real exchange rate (Anand and van Wijnbergen, 1989, p. 27). That is,
zlb = gb, and A(b1 - = (g - e)(h1 - nfa1),
where g is the growth rate in the economy and ê is the percentage change in the real exchange rate. Also, in a steady state, the percentage increase in the demand for real balances must be equal to the growth rate of the economy. Using these assumptions in equation 7 yields,
d ÷ rb + r/b1-nfa1)e = gb + + gm + mit (9)
Thus for a given debt strategy, Equation 9 calculates the value of fiscal deficit consistent with a target growth rate in the economy and inflation. Because of the lack of sufficient published data on Ghana, especially for the later years of the ERP where our interest lies, we had to rely mostly on estimates (especially by the World Bank) in our calculations. The results presented in Table 6 should therefore be taken as indicative rather than definitive.
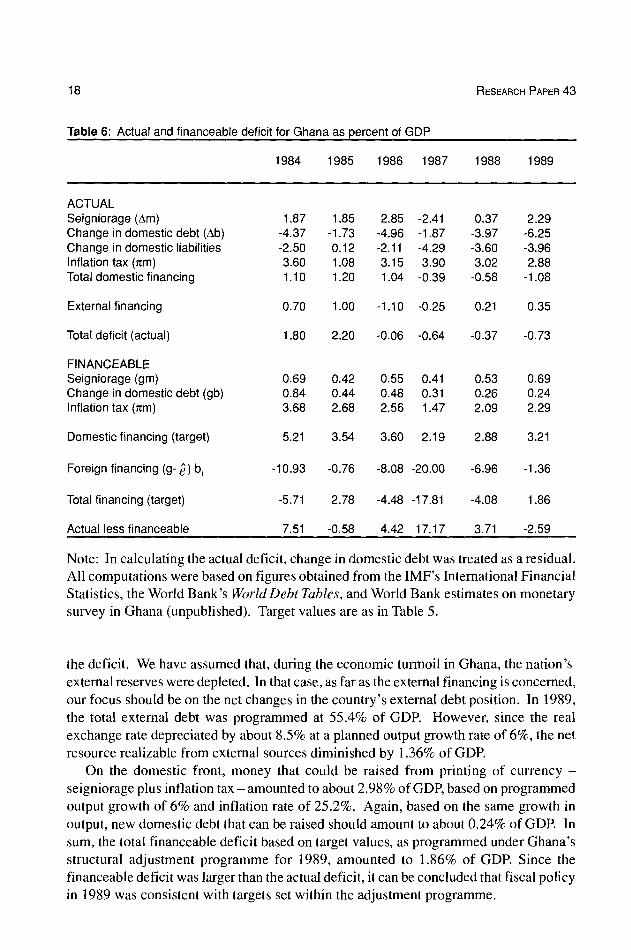
In checking for fiscal consistency, actual and financeable deficits were compared. Fiscal policy is consistent if the actual is less than or equal to the financeable deficit, the latter being on the set targets.
In 1989, the total deficit was about -0.73% of GDP; it was negative because the budget recorded a surplus in that year. In that year also government reduced its liability to domestic creditors by about 3.96% of GDP. Through inflation tax, government gained about 2.88% of GDP. Thus net financing of the deficit from domestic sources amounted to about 1.08% of GDP. External financing in 1989 amounted to 0.35% of GDP.
The calculation of the financeable deficit has been based on the three ways of financing
18 RESEARCH PAPER 43
Table 6: Actual and financeable d eficit for Gha na as per cent of GDP
1984 1985 1986 1987 1988 1989
ACTUAL Seigniorage (Am) Change in domestic debt (Ab) Change in domestic liabilities Inflation tax (1cm)
Total domestic financing
1.87 -4.37 -2.50 3.60 1.10
1.85 -1.73 0.12 1.08 1.20
2.85 -2.41 -4.96 -1.87 -2.11 -4.29 3.15 3.90 1.04 -0.39
0.37 -3.97 -3.60 3.02
-0.58
2.29 -6.25 -3.96 2.88
-1.08
Externalfinancing 0.70 1.00 -1.10 -0.25 0.21 0.35
Total deficit (actual) 1.80 2.20 -0.06 -0.64 -0.37 -0.73
FINANCEABLE Seigniorage (gm) Change in domestic debt (gb) Inflation tax (1cm)
0.69 0.84 3.68
0.42 0.44 2.68
0.55 0.41 0.48 0.31 2.56 1.47
0.53 0.26 2.09
0.69 0.24 2.29
Domestic financing (target) 5.21 3.54 3.60 2.19 2.88 3.21
Foreign -10.93 -0.76 -8.08 -20.00 -6.96 -1.36
Total financing (target) -5.71 2.78 -4.48 -17.81 -4.08 1.86
Actual less financeable 7.51 -0.58 4.42 17.17 3.71 -2.59
Note: In calculating the actual deficit, change in domestic debt was treated as a residual. All computations were based on figures obtained from the IMF's International Financial Statistics, the World Bank's World Debt Tables, and World Bank estimates on monetary survey in Ghana (unpublished). Target values are as in Table 5.
the deficit. We have assumed that, during the economic turmoil in Ghana, the nation's external reserves were depleted. In that case, as far as the external financing is concerned, our focus should be on the net changes in the country's external debt position. In 1989, the total external debt was programmed at 55.4% of GDP. However, since the real exchange rate depreciated by about 8.5% at a planned output growth rate of 6%, the net resource realizable from external sources diminished by 1.36% of GDP.
On the domestic front, money that could be raised from printing of currency —
seigniorage plus inflation tax — amounted to about 2.98% of GDP, based on programmed output growth of 6% and inflation rate of 25.2%. Again, based on the same growth in output, new domestic debt that can be raised should amount to about 0.24% of GDP. In sum, the total financeable deficit based on target values, as programmed under Ghana's structural adjustment programme for 1989, amounted to 1.86% of GDP. Since the financeable deficit was larger than the actual deficit, it can be concluded that fiscal policy in 1989 was consistent with targets set within the adjustment programme.

POLICY CONSISTENCY AND INFLATION IN GHANA 19
A similar exercise was carried out for the first six years of the adjustment programme (1984-1989); the results are presented in Table 6. Notice that with the exception of 1985 and 1989, fiscal policy was not consistent in the other years. It is interesting that in 1985 actual inflation was better than target by about 15 percentage points. Output in that year also exceeded target. It is equally surprising that in 1989, though policy was deemed consistent, both inflation and output were below their target values.
A clear indication of the consequence of policy inconsistency on inflation was given by events in 1986-1988. In those years, though output growth exceeded target values, inflation rates were very much above expectation. Notice from Table 6 that in those years government relied heavily on inflation tax to finance the deficit.

VI Conclusion
There is evidence that inflation in Ghana is engineered more by real factors than by monetary factors. Shortages in output, particularly food, are likely to cause volatile swings in the general price level. This is particularly so in the short run. In the long run, though the output effect is more pronounced, the monetary factors are also quite significant.
Changes in money supply under the ERP have been at about the same high average of around 40% as before the programme, thus giving rise to the suspicion of inflation being a monetary phenomenon. However, since the source of growth in money under the adjustment programme has been from external inflows, these would have generated resources to ease supply pressures. Thus, the monetary pressures cannot explain the short-run price increases in the ERP era.
The fact that the control policies pursued so far have placed a greater emphasis on monetary factors to the neglect of supply factors may explain why they have been ineffective.
Another possible reason why inflation may have stayed above target values is because of policy inconsistency. Fiscal policy in Ghana was consistent with the set targets only in 1985 and 1989 in the ERP era. In 1985, inflation was well within target. For 1986- 1988, when policy was deemed inconsistent, inflation was very much above target.
An important result of our analysis was that government does not gain much from seigniorage revenue with high rates of inflation. Any inflation rate above the 40% mark yields a negative seigniorage revenue.
It is recommended that for effective control of inflation, the government of Ghana should maintain a sustainable fiscal deficit. Government should continue to keep the growth of the money supply in check, especially given the likely long-run impact of uncontrolled monetary growth. As a matter of urgency government should initiate policies that will increase output supply. It is important to note that a high output growth rate would encourage the attainment of the consistency criterion, In extreme cases of problematic inflationary situations, government should initiate interim policies such as food importation to supplement local supply.

Appendix
Appendix 1: An over-parameterized ECM model for inflation
Modelling The sample
Variable
by OLS s 1963 to 1990 less
Coefficient
0 Forecasts
STD Error HCSE t-Value Partial R2
Ap(-l) .1982577 .31094 .27576 .63761 .0264 zsp(-2) .1561642 .23847 .22448 .65485 .0278 Ay -.9871174 .25949 .26369 -3.80402 .4910 Ay(-l) .4479612 .42878 .43090 1.04473 .0678 Ay(-2) -.1628079 .41418 .33075 -.39308 .0102 AMO .3261670 i7401 .17245 1.87441 .1898 AMQ(-1) .0325316 .24797 .18799 .13119 . 0011 AMO(-2) .0791714 .29508 .21369 .26831 .0048 Abi .1583376 .14441 .14136 1.09646 .0742 Abl(-1) .0428733 .12683 .13856 .33803 .0076 Abl(-2) -.1326038 .11256 .10961 -1.17811 .0847 Uhat(-1) -.3998382 .27257 .19644 -1.46692 .1255 CONSTANT .0437617 .05817 .05562 .75232 .0364
A2 .8190697 .1310926 F(12,15) 5.66[.0012] DW = 1.866 ASS = .2577792357 for 13 variables and 28 observations Information Criteria: SC = -3.1408; HQ = -3.5702; FPE = .0252 A2 relative to DIFFERENCE÷SEASONALS = .82496
22 RESEARCH PAPER 43
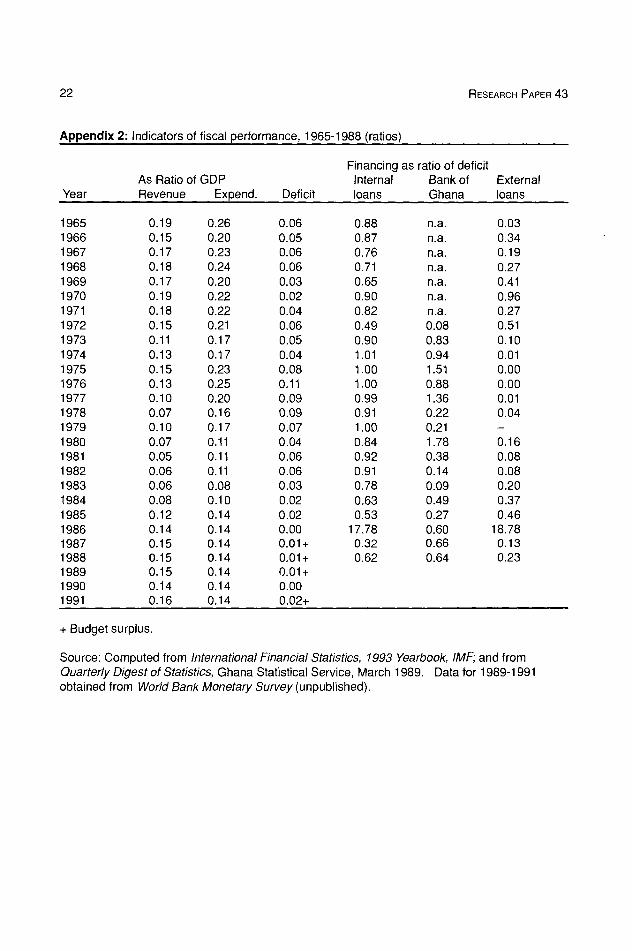
Appendix 2: Indicators of fiscal performance, 1 965-1988 (ratios)
Financing as ratio of deficit As Ratio of GDP Internal Bank of External
Year Revenue Expend. Deficit loans Ghana loans
1965 0.19 0.26 0.06 0.88 n.a. 0.03 1966 0.15 0.20 0.05 0.87 n.a. 0.34 1967 0.17 0.23 0.06 0.76 n.a. 0.19 1968 0.18 0.24 0.06 0.71 n.a. 0.27 1969 0.17 0.20 0.03 0.65 n.a. 0.41 1970 0.19 0.22 0.02 0.90 n.a. 0.96 1971 0.18 0.22 0.04 0.82 n.a. 0.27 1972 0.15 0.21 0.06 0.49 0.08 0.51 1973 0.11 0.17 0.05 0.90 0.83 0.10 1974 0.13 0.17 0.04 1.01 0.94 0.01 1975 0.15 0.23 0.08 1.00 1.51 0.00 1976 0.13 0.25 0.11 1.00 0.88 0.00 1977 0.10 0.20 0.09 0.99 1.36 0.01 1978 0.07 0.16 0.09 0.91 0.22 0.04 1979 0.10 0.17 0.07 1.00 0.21 —
1980 0.07 0.11 0.04 0.84 1.78 0.16 1981 0.05 0.11 0.06 0.92 0.38 0.08 1982 0.06 0.11 0.06 0.91 0.14 0.08 1983 0.06 0.08 0.03 0.78 0.09 0.20 1984 0.08 0.10 0.02 0.63 0.49 0.37 1985 0.12 0.14 0.02 0.53 0.27 0.46 1986 0.14 0.14 0.00 17.78 0.60 18.78 1987 0.15 0.14 0.01+ 0.32 0.66 0.13 1988 0.15 0.14 0.01+ 0.62 0.64 0.23 1989 0.15 0.14 0.01+ 1990 0.14 0,14 0.00 1991 0.16 0.14 0.02+
+ Budget surplus.
Source: Computed from International Financial Statistics, 1993 Yearbook, IMF; and from Quarterly Digest of Statistics, Ghana Statistical Service, March 1989. Data for 1989-1991 obtained from World Bank Monetary Survey (unpublished).

POLICY CONSISTENCY AND INFLATION IN GHANA 23
Append ix 3: Growt h in money , its compo nents and price (percent)
Year Base Narrow Broad Currency Demand Quasi- Reserve CPI money money money with pub. deposit money money
1961 0.0 9.7 8.8 0.0 27.7 3.8 0.0 6.2 1962 19.6 12.2 14.9 10.3 15.0 29.6 100.0 5.9 1963 -6.9 4.8 7.5 2.1 8.7 20.0 -50.0 5.6 1964 51.9 39.3 37.2 36.7 42.7 28.6 200.0 15.8 1965 -9.8 -0.4 1.7 -11.9 14.0 11.1 0.0 22.7 1966 6.1 3.3 5.0 -0.8 7.4 11.7 33.3 14.8 1967 1.9 -2.8 1.3 2.6 -7.6 16.4 0.0 -9.7 1968 3.8 7.5 10.3 5.0 9.9 19.2 0.0 10.7 1969 21.7 12.0 10.5 20.6 3.8 6.5 25.0 6.5 1970 21.3 5.5 9.8 2.0 9.4 22.2 80.0 3.0 1971 -1.2 4.9 11.2 4.5 5.3 27.3 -11.1 8.8 1972 45.9 44.2 40.6 50.0 38.4 33.1 37.5 10.8 1973 25.5 21.8 18.9 12.3 32.3 12.2 54.5 17.1
1974 32.5 23.6 26.6 38.1 10.0 33.9 23.5 18.8 1975 52.3 44.8 38.0 36.3 54.7 22.7 81.0 29.8 1976 40.9 41.6 37.2 45.9 37.2 25.4 34.2 55.4 1977 57.5 67.5 60.0 69.9 64.8 37.3 39.2 116.5 1978 89.5 72.4 68.6 83.6 59.7 54.4 100.0 73.1 1979 19.1 13.4 15.8 20.0 4.8 25.6 17.6 54.5 1980 30.6 30.0 33.7 42.3 11.6 47.4 10.8 50.2 1981 52.3 54.7 51.5 52.8 58.4 40.9 51.4 116.5 1982 18.2 19.0 23.3 17.2 22.3 38.5 20.4 22.3 1983 48.0 49.2 40.3 57.1 35.3 12.7 28.8 122.8 1984 72.2 60.6 53.6 60.8 60.3 24.9 101.8 39.7 1985 33.9 42.7 46.2 38.7 50.8 64.6 23.9 10.3 1986 60.3 44.0 47.9 49.3 34.0 66.0 85.7 24.6 1987 12.2 52.6 53.3 23.2 114.6 56.2 -8.3 39.8 1988 36.7 45.0 46.3 39.8 51.3 51.3 28.9 31.4 1989 56.7 52.7 54.7 44.6 61.9 61.8 89.4 25.2 1990 1.5 10.8 13.3 2.7 18.8 22.2 -0.9 37.2 1991 13.6 7.7 16.7 8.3 7.2 45.1 24.8 18.0
Source: International Financial Statistics, 1988 Yearbook, and September 1992, Quarterly Issue, IMF.

Notes
1 The Ghana Living Standards Survey (1988) reports that food accounts for 65% of household expenditure.
2 The assumption of credible targets for inflation simplifies the analysis. 3 The narrow (broader) definition of the deficit includes (excludes) external grants. 4 Since the country's external commitments reduce its external assets, a devalua-
tion that causes an increase in the cedi value of these external commitments will lead to a reduction in the net external assets.
5 a). Testing for serial correlation from lags I to 2
x2 (2) = .707 and F-Form (2, 20) = .26 .7743]
b). Auto-regressive conditional heteroscedastic test: Residuals scaled by .1204D+00
CNST 1 LAG COEFF. .9735 -.2791
S.E.'s .2582 .2364 RSS = .20552D±02 r = 1.01370
x2( 1)= 1.759 with F(1,20) 1.39 [.2517]
c). x2 test for normality: x2 (2) = .966
6 Since 1991, point-to-point averages of inflation have been very low (below 20%). This will lead to reduction in the annual averages for 1991-1992. It is not clear whether the reduction is due to the effect of policy, especially since money stock grew at just about 1.5% and 10% for 1990 and 1991, respectively. We should also note that 1991 was a good harvest year.
7 See Jebuni, Sowa and Tutu (1991) for a breakdown of output growth. 8 For other works on the sustainability of the deficit, refer to Buiter (1 983a, I 983b,
1985), Miller (1982) and Zee (1988). For an African country, see the work on Tanzania by Rutayisire (1987).
9 For a comprehensive treatment of different ways of measuring the deficit, see Buiter (1985) or Wetzel (forthcoming).
10 It should be noted that in 1989, government "freed" interest rates, but it is
possible that since the growth rate of output was more than the real interest rate, a kind of "Ponzi game" ensued. That is, government kept on financing existing debt service by further borrowing without insolvency (Buiter, 1985).

REFERENCES
Anand, R. and S.V. Wijnbergen. 1989. "Inflation and the financing of government expenditure: An introductory analysis with an application to Turkey." World Bank Economic Review 3, no. 1. pp. 17-38. January.
Blinder, A.S. and R.M. Solow. 1973. "Does fiscal policy matter?". Journal of Public Economics, no. 2. pp. 3 12-337.
Buiter, W.H. 1983a. "Measurement of the public sector deficit and its implication for policy evaluation and design". International Monetary Fund Staff Papers 30, no. 2. pp. 306-49. June. Reprinted in Buiter, W.H. 1990. Principles of budgetary and financial policy. New York: Harvester Wheatsheaf. pp. 105-144.
Buiter, W.H. 1983b. "The theory of optimum deficits and debt". NBER Working Paper Series. Cambridge, Mass. no. 1232.
Buiter, W.H. 1985. "A guide to public sector debt and deficits" Economic Policy, 1. pp. 13-79. Reprinted in Buiter, W.H. 1990. Principles of budgetary and financial policy. New York: Harvester Wheatsheaf. pp. 47-101. November.
Cagan, P. 1956. "The monetary dynamics of hyper-infi ation" , in Fiedman M. ed. Studies in the Quantity Theory of Money Chicago: University of Chicago Press. pp. 25- 117.
Chhibber, A. and S. Nemat. 1990. "Exchange reform, parallel markets, and inflation in Africa: The case of Ghana", World Bank Working Papers, WPS 427, May.
Dornbusch, R. 1977. "Deficits, capital accumulation and inflation". Journal of Money Credit and Banking. Part 2. pp. 14 1-50. February.
Dornbusch, R. and S. Fisher. 1986. "Stopping hyperinflation past and present". NBER Working Paper, no. 1810.
Engle, R.F. and C.W.J. Granger. 1987. "Co-integration and error correction: representation, estimation and testing". Econometrica 55. no.2.
Ewusi, K. 1977. "The determinants ofprice fluctuations in Ghana". ISSER Discussion Paper. Legon. December.
Fischer, S. and W. Easterly. 1990. "The economics of the government budget constraint". The World Bank Research Observer 5, no. 2 pp. 127-142. July.
Jebuni, C. N.K. Sowa. and K.A. Tutu. 1991. "Exchange rate policy and macroeconomic peiformance in Ghana". AERC Research Report, no. 6. September.
Kwakye, J.K. 1981. "An econometric analysis of price behaviour in Ghana". M.Sc. Thesis, University of Ghana, Legon, January.
Lawson, R.M. 1966. "Inflation in the consumer market in Ghana". Economic Bulletin of Ghana, vol X, no. 1.
Lipsey, R.G. 1981."The understanding and control of inflation: Is there a crisis in macroeconomics?". Canadian Journal of Economics, vol. XIV. no. 4.
DRC CRDI
I 111111 11111 11111 11111 11111 11111 liii 1111
26 281140 RESEARCH PAPER 43
May, E. 1984. "Exchange controls and parallel market activities", World Bank Special Working Paper no. 711. Washington, D.C.
Miller, M. 1982. "Inflation adjusting the public sector financial deficit". in J. Kay The 1982 Budget Oxford: Basil Blackwell.
Phelps, E. 1973. "Inflation in the theory of public finance". Swedish Journal of Economics 2, no. 1. January-March.
Rutayisire, L.W. 1987. "Measurement of government budget deficit and fiscal stance in a less developed economy: The case of Tanzania, 1966-84". World Development, 15, no. 10/11
Sargent, T. and N. Wallace. 1982. "Some unpleasant monetarist arithmetic". Federal Reserve Bank of Minnesota, Quarterly Review 5. pp.1-17.
Sowa, N.K. 1991. "Monetary control in Ghana: 1987-88", Overseas Development Institute Working Paper, no. 45. London: ODI.
Sowa, N. K. and J.K. Kwakye. 1991. "Inflationary trends and control in Ghana" ,AERC Research Report. Nairobi.
Tanzi, V. 1984. "Is there a limit to the size offiscal deficits in developing countries?", in Bernard P. Herber, ed. Public Finance and Public Debt Detroit: Wayne State University Press.
Wijnbergen, V.S. 1988. "Inflation, balance ofpayments crises, and public sector deficits". in E. Helpman, A. Razin, and E. Sadka, eds. Economic Effects of the Government Budget Cambridge, Mass: MIT Press.
Wetzel, D. (forthcoming). "The macroeconomics of fiscal deficits in Ghana". D.Phil. Dissertation, University of Oxford.
World Bank, 1985. "Ghana: Towards structural adjustment". p. 111. Washington, D.C.: World Bank.
Zee, H.H. 1988. "The sustainability and optimality of government expenditure". IMF Staff Papers, 35, no. 4. pp. 658-685.
P.O. BOX 62882 NAIROBI, KENYA
TELEPHONE (254-2) 228057 225234 215898 212359
332438 225087
TELEX 22480
FAX (254-2) 219308
E-MAIL [email protected]
AFRICAN ECONOMIC RESEARCH CONSORTIUM
The principal objective of the African Economic Research Consortium (AERC), established in August 1988, is to strengthen local capacity for conducting independent, rigorous inquiry into problems pertinent to the management of economies in Sub-Saharan Africa.
In response to special needs of the region, AERC has adopted a flexible approach to improve the technical skills of local researchers, allow for regional determination of research priorities, strengthen national institutions concerned with economic policy research, and facilitate closer ties between researchers and policy makers.
Since its establishment, AERC has been supported by private foundations, bilateral aid agencies and international organizations.
SPECIAL PAPERS contain the findings of commissioned studies in furtherance of AERC's programmes for research, training and capacity building.
RESEARCH PAPERS contain the edited and externally reviewed results of research financed by the AERC.
It is AERCs policy that authors of Special and Research Papers are free to use material contained therein in other publications. Views expressed in the Special and Research Papers are those of the authors alone and should not be attributed to the AERCs sponsoring Members, Advisory Committee, or Secretariat.
Further information concerning the AERC and additional copies of Special and Research Papers can be obtained by writing to: African Economic Research Consortium, P.O. Box 62882, Nairobi, Kenya.
ISBN 9966-900-62-4


