Policy Deliberation and Voter Persuasion: Experimental Evidence from an Election in the Philippines Leonard Wantchekon * Gabriel López - Moctezuma † Thomas Fujiwara ‡ Cecilia Pe Lero § Daniel Rubenson ¶ December 18, 2018 Abstract In a randomized experiment in cooperation with two national parties competing in a congressional election in the Philippines, we estimate the causal effect on voting behavior of a town-hall style campaign in which candidates discuss their campaign platform with small groups of citizens. Keeping the parties’ platform fixed, we find that town-hall meetings have a positive effect on parties’ vote shares compared to the status quo, in which voters play a passive role. Consistent with the parties’ advocacy for underprivileged groups, we observe heterogeneous effects by income, education and gender. Deliberative campaigns increase voters’ awareness on the issues parties campaign on, affecting the vote of the direct beneficiaries of the parties’ platform. Abstract: 118 Words Body of Paper: 9143 Words * Princeton University and African School of Economics. † California Institute of Technology. CorrespondingAuthor. e-mail: [email protected]‡ Princeton University, NBER, and CIFAR. § University of Notre Dame. ¶ Ryerson University & Research Institute of Industrial Economics. 1
Transcript
Policy Deliberation and Voter Persuasion:
Experimental Evidence from an Election in the
Philippines
Leonard Wantchekon* Gabriel López - Moctezuma†
Thomas Fujiwara‡ Cecilia Pe Lero§ Daniel Rubenson¶
December 18, 2018
Abstract
In a randomized experiment in cooperation with two national parties competing
in a congressional election in the Philippines, we estimate the causal effect on voting
behavior of a town-hall style campaign in which candidates discuss their campaign
platform with small groups of citizens. Keeping the parties’ platform fixed, we find
that town-hall meetings have a positive effect on parties’ vote shares compared to the
status quo, in which voters play a passive role. Consistent with the parties’ advocacy
for underprivileged groups, we observe heterogeneous effects by income, education
and gender. Deliberative campaigns increase voters’ awareness on the issues parties
campaign on, affecting the vote of the direct beneficiaries of the parties’ platform.
Abstract: 118 Words
Body of Paper: 9143 Words
*Princeton University and African School of Economics.†California Institute of Technology. Corresponding Author. e-mail: [email protected]‡Princeton University, NBER, and CIFAR.§University of Notre Dame.¶Ryerson University & Research Institute of Industrial Economics.
1
1 Introduction
Normative proponents of a participatory approach to political decision-making suggest
that deliberation can lead to revelatory discussion and the resolution of political conflicts
(Gutmann and Thompson 1996; Habermas 1996; Macedo 2010). On purely instrumen-
tal grounds, deliberation may be an avenue through which individuals can share private
information prior to collective decision-making, helping voters to implement more in-
formed choices. (Austen-Smith and Feddersen 2006; Coughlan 2000; Meirowitz 2006).
Moreover, the opportunity to discuss relevant issues might provide citizens the motiva-
tion to actively become more informed about policy and act on this information (Ester-
ling, Neblo and Lazer [2011]). In fact, laboratory and observational evidence has shown
that policy choices can be more effective in changing attitudes, eliciting information and
encouraging cooperation when they are chosen through deliberative settings (Ban, Jha
and Rao 2012; Barabas 2004; Dal Bó, Foster and Putterman 2010; Goeree and Yariv 2011;
Karpowitz and Mendelberg 2014).
In principle, if deliberative forums can increase citizens’ incentives to become more
informed and affect their political behavior, it might be in the interest of politicians to
use them as an electoral strategy to persuade voters of the merits of a desired alterna-
tive, offering a bridge between the practice of deliberative democracy and the domain of
electoral politics.
Empirically, assessing the potential benefits of implementing deliberative forums on
a politician’s electoral prospects is challenging, as these could be confounded with other
factors that might affect both the behaviors of politicians and citizens. In general, the
effect that any political strategy might have on voting behavior is a function of the plat-
form message, the communication strategy, the intrinsic traits of the politician, and the
audience characteristics. Therefore, being able to disentangle whether and to what extent
deliberation affects voting behavior requires manipulating the communication strategy
of the campaign, while keeping fixed any other relevant variable that might affect voting
2
behavior. In this study, we implement such an experimental design by randomizing the
assignment of town-hall meetings to different areas, while keeping campaign platforms
fixed.
The implementation of the experiment involved the cooperation of two national party-
lists competing for representation in the legislative election of May, 2013 in the Philip-
pines. Importantly, the two party-lists with which we collaborated claimed to represent
and advocate for distinct societal groups—namely women in one platform and the ur-
ban poor in another —emphasizing distinct legislative policies favorable to each of these
groups in their campaign platforms. This allows us to measure the impact of town-hall
meetings on the subset of voters that are more susceptible to the information contained
in the campaign messages. Moreover, the Filipino party-list contest is ideal to assess the
effect of deliberative forums on electoral returns, as it permit us to focus on a type of party
that distinguishes itself programatically from the mainstream political organizations that
compete in other legislative, presidential and local mayoral elections, where clientelis-
tic practices, corruption, and vote buying have been widespread in the recent past (e.g.,
Hicken et al. [2014]).1
The treatment we implement manipulates the communication strategy for each party-
list platform. First, we design a deliberative campaign in which the party-list message
was communicated in town-hall meetings, where voters and party representatives dis-
cussed and debated the party-list platform and its potential implementation. The com-
munication strategy in control villages was the “business-as-usual" campaign that parties
implemented elsewhere. The same policy platform discussed in town-hall meetings was
1According to law, 20 percent of congressional seats are reserved for minority groups. To fill these seats,
voters do not choose candidates to represent their electoral districts, as in the first-past-the-post race that
apportions the remainder 80 percent of Congress, but for “party-lists” in a closed-list (CL), proportional
representation (PR) system. In other words, voters on Election Day cast two different votes for legislative
representation, one for their candidate in their district and one for their preferred party-list at the national
level.
3
also delivered through “one-way" communication technologies, such as the distribution
of party propaganda and speeches in party rallies, with no direct participation of voters
or debate between party representatives and citizens.
In the control group, we explicitly did not introduce any restriction on the communi-
cation strategy of party-lists except that town-hall meetings were not to be implemented.2
In this way, we ensure that our results are not driven by an artificial condition imposed
on politicians that could differ greatly from the way they would usually campaign.
Second, party-lists were randomly assigned to different areas and a treatment subset
of these areas set up two or three town-hall meetings with around 40 participants each.
This random assignment allowed us to control for the effect that intrinsic party charac-
teristics might have had on voting behavior. We do this by focusing only on the electoral
prospects of a given party-list in treatment versus control areas.
Given the random assignment of a deliberative campaign strategy, we examine whether
the presence of town-hall meetings, in which citizens are encouraged to deliberate with
candidates about policy, affects voters’ attitudes and political behavior differently than
the “business-as-usual” campaign.
We argue that the favorable conditions to engage with both politicians and other cit-
izens in town-hall meetings can improve voters’ knowledge about the private benefits
and externalities of programmatic policies advocated by different candidates. This in-
formation in turn, might generate a benchmark or focal point with which to evaluate
politicians. The increase in voters’ awareness about the candidate’s policies and its con-
sequences on different societal groups might translate into an increase in votes from those
citizens whose most-preferred policy is closer to the party’s platform.
Our main results show that town-hall meetings have a positive effect on both official
2It is important to note here that deliberative campaigns, as the ones we designed for this experiment,
were not part of the campaign strategy of any of the involved party-lists, either in past elections or prior to
their agreement to cooperate with the experiment.
4
and self-reported measures of electoral support. Conditioning on casting a vote, party-
lists increased their official vote shares around 46 percent with respect to the control group
in those areas assigned to the deliberative campaign. In this context, we do not find
that holding town-hall meetings increases turnout, as other campaign strategies, such as
face-to-face voter mobilization, appear to do (Gerber and Green 2000; Green, Gerber and
Nickerson 2003). This is not surprising, however, as we measure turnout as casting a valid
vote in the party-list election, which occurs concurrently with the election to other offices
(e.g., House, senatorial, mayoral and provincial elections). To the extent these other races
are the main forces driving voters to the polls, no effects on party-list turnout would be
expected.
When we analyze potential heterogeneous effects of town-hall meetings by party-list
and socio-demographic characteristics using a post-election survey, we find positive and
significant electoral returns of town-hall meetings only for women when the party-list
that is campaigning is the one running a feminist platform (i.e., Akbayan party). Simi-
larly, we find a positive and significant effect of the implementation of town-hall meet-
ings only on poor and less educated voters when the party-list that is campaigning is the
one running the pro-poor platform (i.e., Umalab Ka party).
Along with the impact on voting behavior, we find a widespread attitudinal change
on the issues at the center of the party-list platforms when they are delivered via delibera-
tion. On the one hand, voters exposed to the pro-feminist platform in town-hall meetings
increased their disagreement with gender discrimination and sexism by 0.43 standard
deviation units with respect to the control group. On the other hand, voters exposed to
the pro-poor platform were 0.13 standard deviation units more concerned about poverty-
related issues when town-hall meetings were in place compared to “business-as-usual”
campaigns.
These results confirm that deliberative campaigns are indeed an effective way of de-
livering a campaign message and affect voters’ attitudes towards relevant policy issues.
5
More importantly, the heightened knowledge and awareness of policy proposals in town-
hall meetings has relevant consequences on citizen’s voting behavior, specifically per-
suading those voters who would directly benefit from the party’s platform to cast a vote
in their favor.
Our analysis follows a burgeoning empirical literature implementing randomized field
experiments in actual campaigns with the collaboration of politicians. Our paper is closely
related to Fujiwara and Wantchekon [2013], who find that programmatic platforms deliv-
ered through a deliberative campaign reduce the perception of clientelism and increase
electoral returns. Although this paper makes a contribution on the relevance of platform
transparency, it is unable to isolate the effect of deliberation from that of the platform
content itself, as the latter also changes by treatment status.3 In contrast, our experiment
focuses on an electoral race where parties can only implement legislation in Congress and
do not hold discretionary power to offer any type of particularistic spending. Thus, the
legislative platform offered by parties’ representatives remains fixed in both treatment
and control areas, allowing us to isolate the effect of deliberative campaigns.
In the context of U.S. congressional elections, Esterling, Neblo and Lazer [2011] use a
deliberative field experiment to assess whether debating with incumbent representatives
increases participants’ knowledge about policy issues. The authors find that participat-
ing in a deliberating session with the politician motivate constituents to become more
informed about policy-relevant issues. In Nigeria, Collier and Vicente [2014] show ex-
perimental evidence that the implementation of a campaign against electoral violence
through the holding of town metings and popular theatre was able to decrease violence
perception in local elections, improve citizen empowerment, and increase voter turnout.
Casey, Glennester and Bidwell [2015] measure the impact of voters’ exposure to can-
3Under deliberation, candidates and voters debated about a universalistic platform that emphasized
the national benefits of policies, whereas under the “business-as-usual" campaign, candidates offered a mix
of clientelistic goods (cash distribution, patronage, and discretionary spending), as well as universalistic
policies.
6
didates’ debates on voting behavior, campaign spending, and politicians’ performance
using a field experiment in Sierra Leone. The authors find that exposure to debates re-
sults in a higher number of votes cast. Unlike our treatment that facilitates deliberation
between parties’ representatives and voters, they focus on the interaction between candi-
dates from different parties and the subsequent exposure of these debates to voters.
Finally, our paper is related to the works of Kendall, Nannicini and Trebbi [2015] and
Dewan, Humphreys and Rubenson [2014] that experimentally assess the effects of dif-
ferent informational campaign treatments on voting behavior. Unlike our paper, their
messages did not involve a deliberative setting. Instead, they manipulated the content of
the messages themselves, making them either about the candidate’s valence or ideology.
2 Party List Electoral System
Since the reinstatement of electoral democracy in 1986, the Philippines’ political system
has been formally composed of a presidential executive and a bicameral legislative body.
The Senate is composed of 24 members elected every six years, whereas the House of Rep-
resentatives is composed of 292 members elected every three years. A new constitution
was drafted in 1987 that reapportioned congressional districts, reduced the term lengths
for members of the House of Representatives, and introduced term limits for all elected
officials. In addition, and with the intention of strengthening the party system, advancing
programmatic-based parties, and reducing the elite monopoly of political power, the 1987
Constitution mandated that 20 percent of the lower House should be composed of repre-
sentatives of marginalized societal groups such as “labor, peasant, fisherfolk, urban poor,
indigenous cultural communities, elderly, handicapped, women, youth, veterans, over-
seas workers, professionals, and other such sectors as may be provided by law, except
7
the religious sector” (Article VI; Section 5.2).4 However, it was not until 1995 that this
mandate was implemented via the Party-List System Act, which stated that “the State
shall promote proportional representation in the election of representatives to the House
of Representatives through a party-list system. . .which will enable Filipino citizens be-
longing to the marginalized and underrepresented sectors. . . to become members of the
House of Representatives" (Sec. 2). In practice, Party-List seats in Congress are allocated
via a closed-list proportional representation election at the national level. The Philip-
pines’ Commission of Elections (COMELEC) is in charge of certifiying whether a political
organization that seeks Party-List status is organized along one of the abovementioned
sectoral groups. As a prerequisite, a political organization needs to submit an ordered
list of at least five candidates, who need to be registered voters older than 25 years, and
bona fide members of the organization nominating them. Party-list candidates cannot be
nominated by more than one party, nor run for other elective offices in the same election.
In addition, those candidates who lost a race in the immediate preceding election cannnot
run under the party-list system. Beyond these requirements, there are no formal quotas
by category of disadvantaged group and any legislative seat allocated to the Party-list
system can be occupied by any of these political organizations.
For the Party-List election, a voter chooses one party via closed list and each party
that receives 2 percent of the party-list vote at the national level is entitled to one seat and
an additional seat for every 2 percent thereafter, for a maximum of three seats per party-
list. Therefore, every three years at each election, voters cast two votes for the House
of Representatives, one for their district representative via plurality rule and one for a
national party-list.
4The remaining 80% of seats are allocated by simple majority from single-member districts apportioned
among the Philippines’ provinces and cities.
8
3 Experimental Design
The campaign experiment we analyze here focuses on the party-list election that took
place on May 13, 2013. In this election, 58 out of 289 congress seats were allocated for
party-list representatives among more than 130 registered parties. Two party-lists collab-
orated in the campaign field experiment: Akbayan, Citizens’ Action Party and Umalab
Ka.
Akbayan is one of the most prominent party-lists nationwide and the more established
of the two participants in the experiment. It has consistently won at least one seat since
its founding in 1998, and has been one of the five most successful party-lists, of the more
than 100 registered at the national level.
Founded as a left pluralist national party, Akbayan is a multi-sectoral party comprised
of labor, peasants, urban poor, women, LGBT, and youth organizations. In the 2013 cam-
paign, however, Akbayan’s message focused heavily on women. This was because Ak-
bayan wanted to capitalize on a recent high-profile legislative victory concerning repro-
ductive rights, as well as on its candidate for Senator, a well-known feminist activist.5 In
the May 2013 election, Akbayan was able to secure around 2.9 percent of the popular vote
at the national level, which translated into two seats in the House of Representatives.
In contrast, Umalab Ka, although formally founded in 2003, did not participate in a
party-list election until 2013. This party-list is composed mainly of urban poor organiza-
tions and informal sector workers (i.e., drivers, street vendors, and house servants). As a
political organization, Umalab Ka has dealt in the past with issues such as the demolition
of informal settlers’ dwellings, discussions with government agencies about the plight of
the urban poor and other peripheral issues that directly affect the lives of informal work-
ers and other marginalized sectors in society. The primary legislative agenda of Umalab
Ka includes the creation of a Magna Carta to protect workers in the informal sector.6 In
5The platform and constitution of the Akbayan party-list can be found at www.akbayan.org.ph.6The entire legislative agenda of the Umalab Ka party-list can be found at www.facebook.com/notes/
field while implementing the town-hall meetings. First, in the selected municipalities of
Marikina and Valenzuela, the town-hall meeting organizers switched the originally se-
lected control barangay for the treatment barangay.8 The reason behind this decision was
that the incumbent officials associated with another party-list (“Alay Buhay") were hos-
tile to the CPE research team and blocked the implementation of town-hall meetings in
the originally selected treatment units. This issue made it impossible to organize and an-
nounce scheduled meetings before the election at other randomized selected barangays.
In these cases, both party-lists used their presence at the originally selected controls to
organize the series of town-hall meetings. Second, in the municipality of Luisiana, the
original treatment barangay, San Roque, could not be reached by the party-list Umalab
Ka given the difficulties posed by the local authorities to implement the meetings. In-
stead, meetings were held in the barangays of San Diego and San Antonio, chosen by the
party-list representatives themselves. Given these compliance issues, all of our analyses
aimed at assessing the effectiveness of deliberative campaigns estimates both intention-
to-treat effects (ITT), using assigned treatment rather than implemented treatment, and
complier average causal effects (CACE), instrumenting treatment status with the original
random assignment.
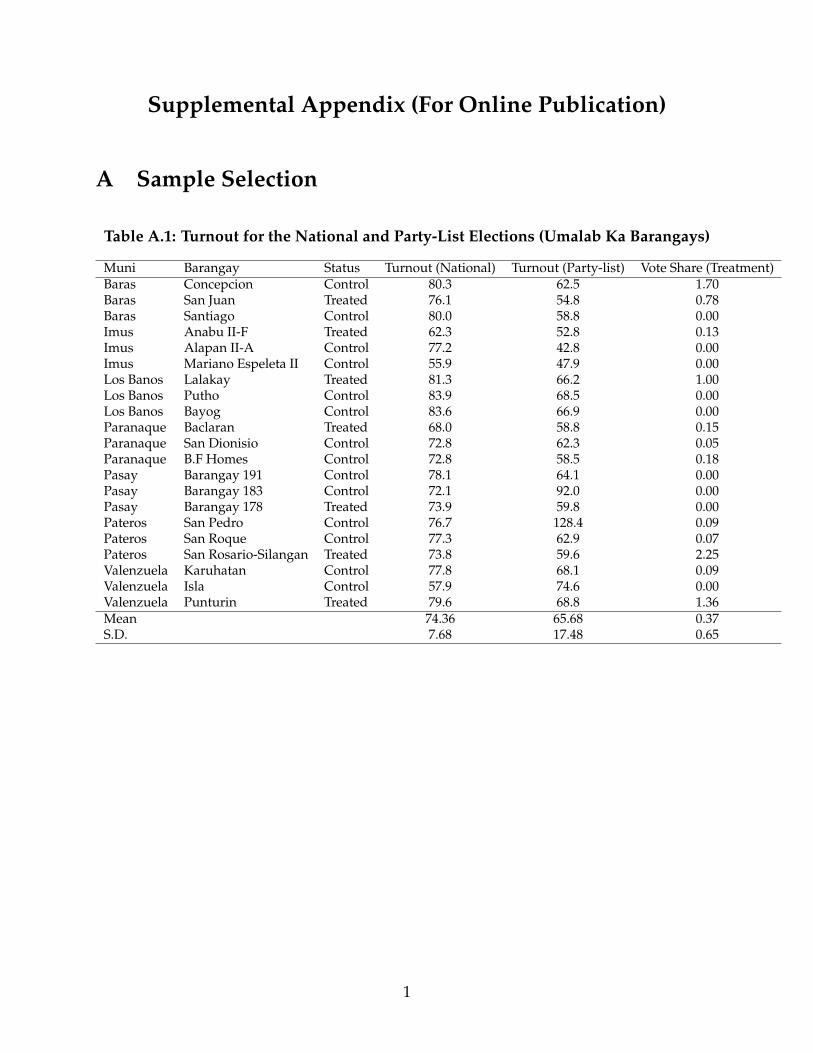
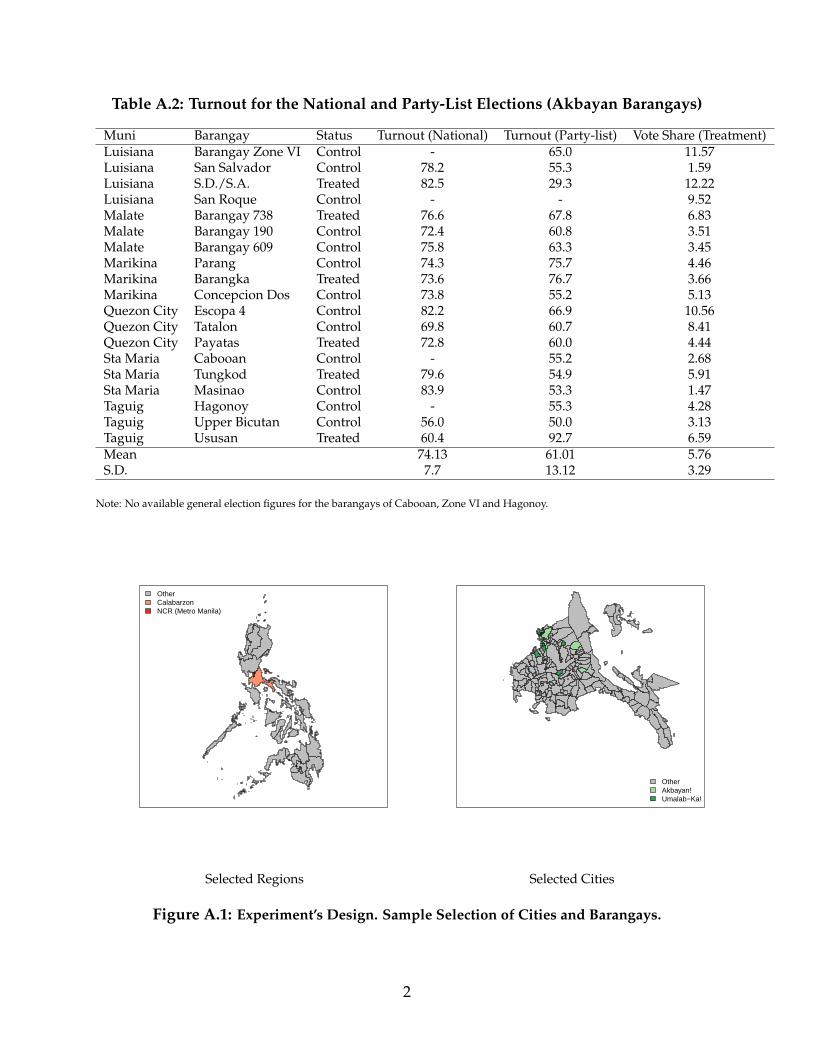
Tables A.1 and A.2 in Appendix A present the sample of selected barangays for each
municipality and the treatment status for each participating party-list.
3.2 Treatment Barangays
In advance of the implementation of town-hall meetings, one representative from CPE
conducted a series of meetings with the party-list representatives to instruct them on the
specifications of the protocol they had to follow in treatment barangays.
8In Marikina, town-hall meetings were implemented in the originally control unit, Barangka, instead of
the selected treatment barangay Concepcion Dos. In Valenzuela, town-hall meetings were implemented in
Punturin instead of the originally selected treatment barangay Isla.
11
A team of one organizer from CPE along with party-list members (mainly nominees
and leading officers) implemented two or three town-hall meetings, each with around 40
participants, during the period between April 21 and May 9 of election year.9 A staff of
approximately four CPE staff members, along with party-list representatives, deployed
teams a week in advance of the scheduled meetings to inform potential voters door-to-
door and in public areas about the location, date, and time of the town-hall meetings.
At the time of the implementation, every citizen who wished to attend a meeting was
offered a place in the town-hall. On average, the town-hall meetings lasted between 90–
120 minutes, and were divided in three stages: Introduction (10–15 minutes); deliberation
(70–95 minutes); and resolution and commitment (10 minutes).
At the introduction stage, the CPE representative gave a brief explanation of the pur-
pose of the party-list electoral system. In general, the audience was informed of the
value of electing a party-list representative as differentiated from a district representa-
tive, mainly in that its objective is to give political representation to marginalized societal
sectors.
Second, the party-list representative gave an introductory speech containing its plat-
form and programmatic statement, following as a guideline a homogenous statement
previously designed by the party-list officials and transmitted to its nominees. Akbayan’s
representative explained the services that the party provides to its members and its leg-
islative accomplishments. The party-list representative highlighted Akbayan’s role in
passing the Responsible Parenthood Law, explaining how the law would help marginal-
ized women. At this stage, Umalab Ka representatives stated that, if elected, they would
push for the creation of laws aimed at protecting the urban poor, such as legislation to
address price stabilizations on basic commodities during natural disasters and laws to
9In the case of Akbayan, the National Secretary General Conrad Castillo coordinated the town-hall
meeting implementation with CPE and instructed the party’s nominees about the protocols to follow. In
the case of Umalab Ka, National Secretary General Rosel Vargas coordinated the town-hall meeting imple-
mentation with CPE, but also personally led all the town-hall meetings.
12
give job security to informal workers.
The deliberation stage usually consisted of several rounds of questions/comments, in
which participants were encouraged to suggest amendments to the original policies pre-
sented by the party-lists and to give new proposals that could potentially be included in
the party-list platform. town-hall meeting participants had no restrictions to debate the
policy proposals among themselves and with the candidates. For example, at a meeting
conducted by Akbayan in the barangay of San Diego in the city of Luisiana, a young par-
ticipant raised the concern that it was common for parties to make a lot of promises, but
he wanted to know exactly what, if elected, Akbayan would do. The party representative
clarified that, as members of Congress, they would be involved in crafting meaningful
policies and would be involved in the drafting of the budget process, as it is determined
by Congress at the national level. At another meeting conducted by Umalab Ka in the
barangay Santo Rosario-Silangan, a woman raised the issue of land property that affected
many households in that barangay. She shared her fear that her home would be demol-
ished, as she did not have a property title. The Umalab Ka representative emphasized
that one of their main objectives, if elected, was to reform the Urban Development and
Housing Act to better regulate informal settling and help women like her.
At the resolution and commitment stage, the CPE representative summarized the
main proposals of the party-list and the main issues raised during deliberation. At this
stage, the party-list representative made a commitment to the participants to transmit the
summary report of the meeting to the party-list leaders and candidates with their sugges-
tions and proposals.
It is worth emphasizing that in each of the town-hall meetings implemented in the
treatment barangays, there was no cash or any other type of valuable gift distributed to
the meeting attendees. Both party-lists only distributed flyers and attached posters and
banners at the meeting locations.
13
3.3 Control Barangays
In those barangays assigned to the control group, there were no instructions to party-
list representatives on what campaign strategy to follow. The only restriction was that
town-hall meetings were not to be implemented. In fact, both party-lists followed the
“business-as-usual” strategy, which they have followed elsewhere to mobilize voters.
The only relevant distinction between control “barangays” and those not selected in
the randomization protocol is that in the latter, we were able to monitor the presence and
campaign efforts of both party-lists involved in the experiment.10 CPE engaged 4 field
researchers to monitor the campaign strategy of party-lists at each control barangay. The
reports from the field indicate that both parties deployed mobile propaganda teams using
a sound system roving within the barangays asking people for their vote. In addition,
party-lists followed a door-to-door campaign, in which party-list volunteers distributed
flyers to households.
Finally, party-lists organized around one public event in each control barangay to mo-
bilize voters. These events took the form of rallies attended mainly by party members.
The average size of these rallies usually exceeded 100 participants, notably higher than
any of the town-hall meetings implemented in treatment barangays. In terms of the inter-
action between candidate and voters, party rallies are what we call “one-way communi-
cation" campaigns, in which only party-list leaders engaged the audience with a message
containing the party’s policy platform, without the possibility that attendees speak di-
rectly to the candidate.
10In addition, COMELEC does not disclose the electoral returns of the party-list election at the barangay
level. In order to obtain this official information for treatment and control barangays we had to collect
the electoral results from each polling precinct the weeks after the election. This data would have been
unfeasible to collect for all the untreated barangays at each municipality.
14
4 Data
We use two types of data for the evaluation of the field experiment. To quantify the
treatment effect of the presence of town-hall meetings on voting behavior, we use offi-
cial data reported by COMELEC at the precinct level, a lower level electoral unit than
the barangay. We aggregate this data to construct barangay-level measures of electoral
returns (i.e., turnout and vote shares). Tables A.1 and A.2 in Appendix A present the of-
ficial information on turnout and vote shares at the general and at the party-list elections
for the barangays assigned to Akbayan and Umalab Ka, respectively. On average, turnout
for the general election was around 75 percent of registered voters, whereas the turnout
for the party-list election was around 60 percent.11
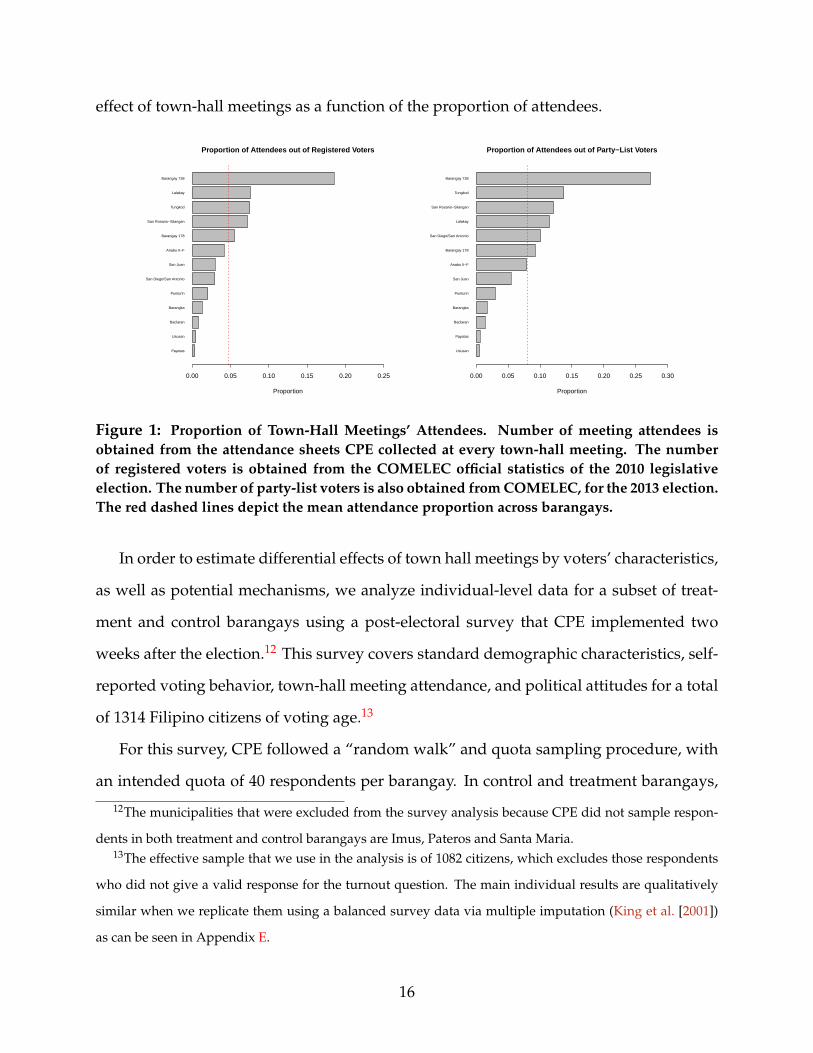
Figure 1 presents the number of potential voters who attended at least one town-hall
meeting in treatment barangays as a proportion of both the number of registered voters
and the party-list voters for the 2013 election. On average, meeting attendees accounted
for 5 percent of potential voters and 8 percent of party-list voters. There is, however, a
huge amount of variation in the proportion of meeting attendees across barangays. On
highly populated barangays such as Payatas and Ususan, meetings attendees accounted
for barely 0.5 percent of party-list voters, whereas in barangays with a smaller number of
voters like Barangay 738 or Lalakay, meeting attendees accounted for more than 25 per-
cent of the electorate. In our analysis of official electoral returns, we address the variation
in meeting attendance at the barangay level. First, we show the differential impact of
town-hall meetings by the size of the electorate and then we present the heterogeneous
11Even though party-list elections are concurrent to legislative district elections, low turnout has been a
concern since the implementation of the Party-List system. For instance, in the first Party-List election in
1998, only 33% of voters cast a valid vote for a party-list. This has been attributed to a lack of awareness
from the Philippines electorate and an inefficient campaign of disemination and information from the gov-
ernment regarding the Party-List system. In our survey of individual voters, 17% of respondents said to be
unaware of the existence of the Party-List system.
15
effect of town-hall meetings as a function of the proportion of attendees.
Payatas
Ususan
Baclaran
Barangka
Punturin
San Diego/San Antonio
San Juan
Anabu II−F
Barangay 178
San Rosario−Silangan
Tungkod
Lalakay
Barangay 738
Proportion of Attendees out of Registered Voters
Proportion
0.00 0.05 0.10 0.15 0.20 0.25
Ususan
Payatas
Baclaran
Barangka
Punturin
San Juan
Anabu II−F
Barangay 178
San Diego/San Antonio
Lalakay
San Rosario−Silangan
Tungkod
Barangay 738
Proportion of Attendees out of Party−List Voters
Proportion
0.00 0.05 0.10 0.15 0.20 0.25 0.30
Figure 1: Proportion of Town-Hall Meetings’ Attendees. Number of meeting attendees isobtained from the attendance sheets CPE collected at every town-hall meeting. The numberof registered voters is obtained from the COMELEC official statistics of the 2010 legislativeelection. The number of party-list voters is also obtained from COMELEC, for the 2013 election.The red dashed lines depict the mean attendance proportion across barangays.
In order to estimate differential effects of town hall meetings by voters’ characteristics,
as well as potential mechanisms, we analyze individual-level data for a subset of treat-
ment and control barangays using a post-electoral survey that CPE implemented two
weeks after the election.12 This survey covers standard demographic characteristics, self-
reported voting behavior, town-hall meeting attendance, and political attitudes for a total
of 1314 Filipino citizens of voting age.13
For this survey, CPE followed a “random walk” and quota sampling procedure, with
an intended quota of 40 respondents per barangay. In control and treatment barangays,
12The municipalities that were excluded from the survey analysis because CPE did not sample respon-
dents in both treatment and control barangays are Imus, Pateros and Santa Maria.13The effective sample that we use in the analysis is of 1082 citizens, which excludes those respondents
who did not give a valid response for the turnout question. The main individual results are qualitatively
similar when we replicate them using a balanced survey data via multiple imputation (King et al. [2001])
as can be seen in Appendix E.
16
enumerators sampled households following a “random walk” starting from the barangay’s
town-hall in control areas and from the location of the town-hall meetings in treatment
barangays.14
Given its non-representative sampling procedure, the post-electoral survey does not
reflect the sociodemographic characteristics of potential voters at the barangay-level. The
presence of sampling biases, along with the lack of census data at the barangay level, pre-
vents us from directly comparing the aggregate electoral returns to the individual-level
survey responses. Nevertheless, the post-electoral survey is a valuable source of voters’
characteristics and attitudes to assess under what conditions deliberative campaigns were
more effective for delivering a political platform to voters.
5 Barangay Level Results
We evaluate the effect of town-hall meetings (i.e., treatment) on aggregate voting behavior
at the barangay-level on two main electoral outcomes: party-list turnout (as a proportion
of registered voters) and vote shares (as a proportion of total party-list votes), both ob-
tained from official results provided by COMELEC.
The random assignment process of the campaign treatment makes identification of
the ITT of town-hall meetings on aggregate electoral returns straightforward using the
following regression of the observed electoral return Yj,k in barangay j = 1, . . . , J, within
municipality k = 1, . . . , K, on an assignment dummy, Zj,k, that equals 1 if either party p ∈
{Akbayan, Umalab Ka} was randomly assigned to implement a deliberative campaign
in barangay j and zero, otherwise:
Yj,k = δk + βZj,k + εj,k, (1)
14First, the household nearest to the starting point was the first included and then the enumerators
flipped a coin to decide the direction to move next. Following the chosen road or path, the protocol dictated
to include every fifth household until the quota was completed.
17
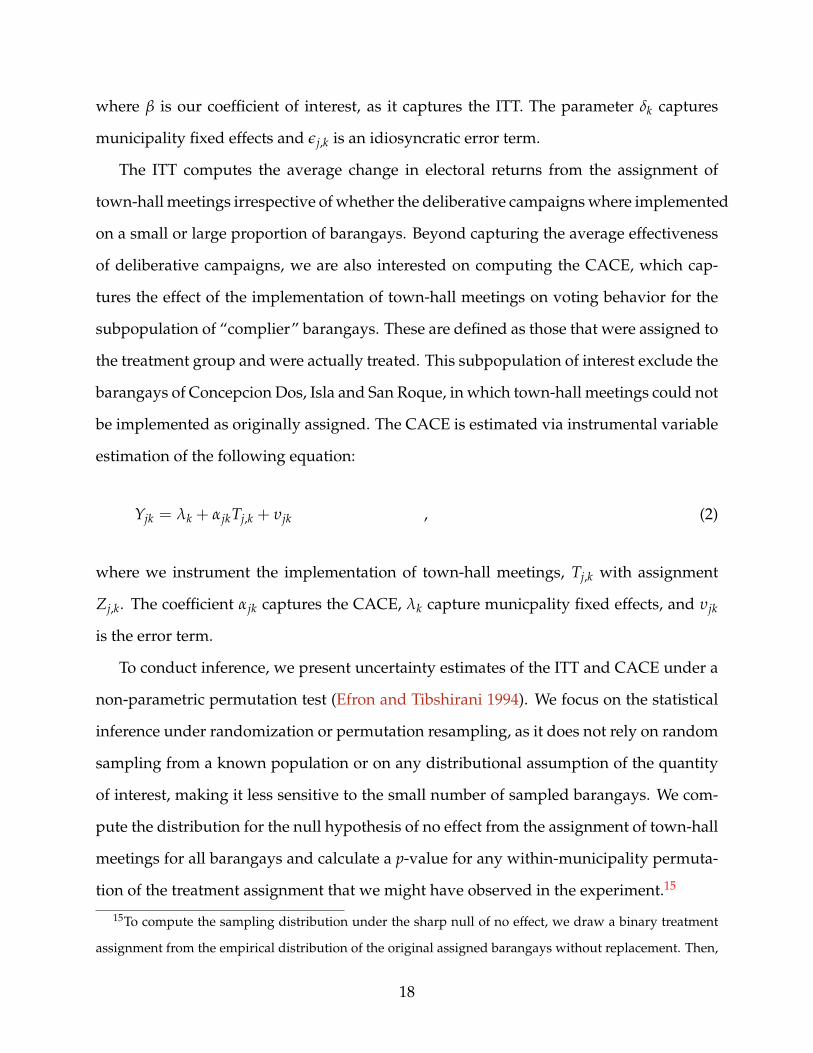
where β is our coefficient of interest, as it captures the ITT. The parameter δk captures
municipality fixed effects and εj,k is an idiosyncratic error term.
The ITT computes the average change in electoral returns from the assignment of
town-hall meetings irrespective of whether the deliberative campaigns where implemented
on a small or large proportion of barangays. Beyond capturing the average effectiveness
of deliberative campaigns, we are also interested on computing the CACE, which cap-
tures the effect of the implementation of town-hall meetings on voting behavior for the
subpopulation of “complier” barangays. These are defined as those that were assigned to
the treatment group and were actually treated. This subpopulation of interest exclude the
barangays of Concepcion Dos, Isla and San Roque, in which town-hall meetings could not
be implemented as originally assigned. The CACE is estimated via instrumental variable
estimation of the following equation:
Yjk = λk + αjkTj,k + υjk , (2)
where we instrument the implementation of town-hall meetings, Tj,k with assignment
Zj,k. The coefficient αjk captures the CACE, λk capture municpality fixed effects, and υjk
is the error term.
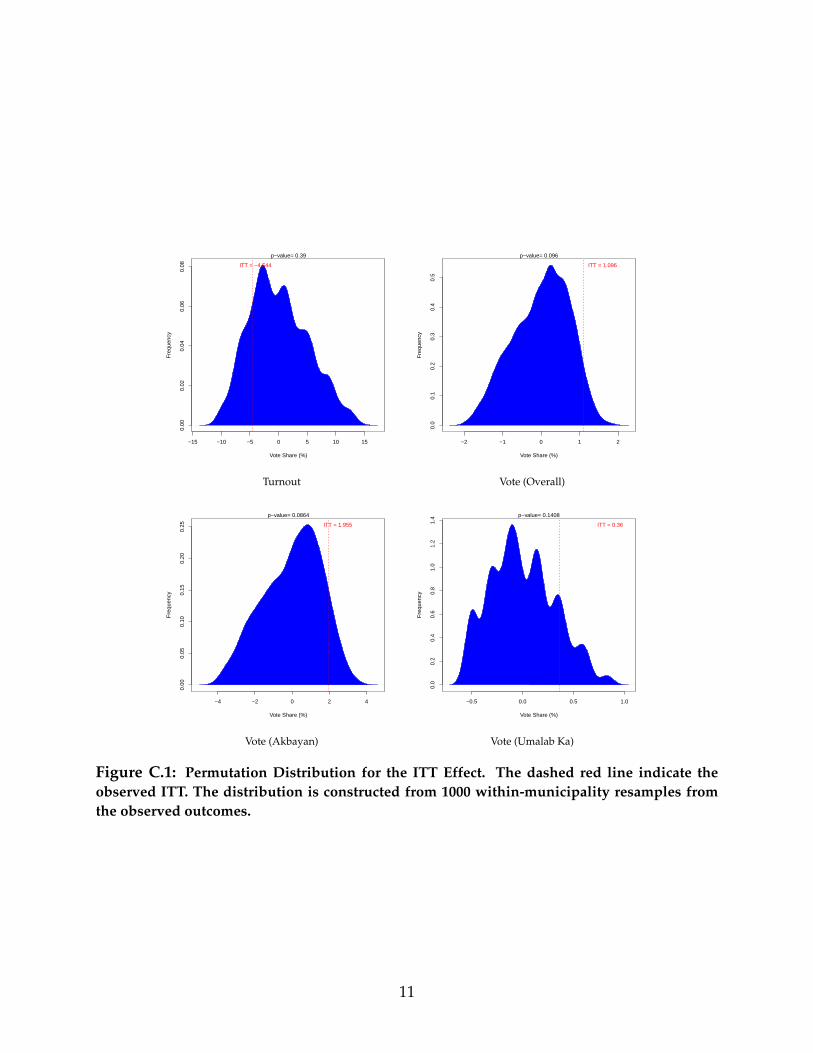
To conduct inference, we present uncertainty estimates of the ITT and CACE under a
non-parametric permutation test (Efron and Tibshirani 1994). We focus on the statistical
inference under randomization or permutation resampling, as it does not rely on random
sampling from a known population or on any distributional assumption of the quantity
of interest, making it less sensitive to the small number of sampled barangays. We com-
pute the distribution for the null hypothesis of no effect from the assignment of town-hall
meetings for all barangays and calculate a p-value for any within-municipality permuta-
tion of the treatment assignment that we might have observed in the experiment.15
15To compute the sampling distribution under the sharp null of no effect, we draw a binary treatment
assignment from the empirical distribution of the original assigned barangays without replacement. Then,
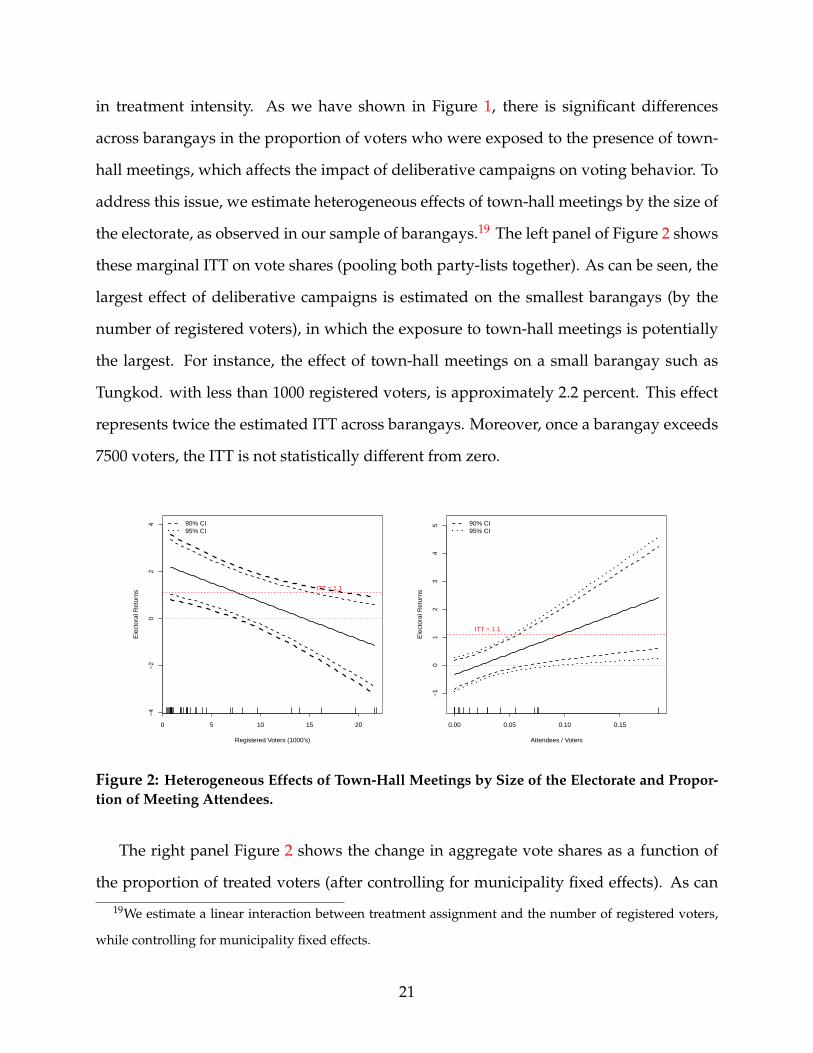
18
Appendix B shows evidence that that the randomization of town-hall meetings suc-
cesfully achieved balance across treatment and control barangays given available pre-
treatment official statistics.
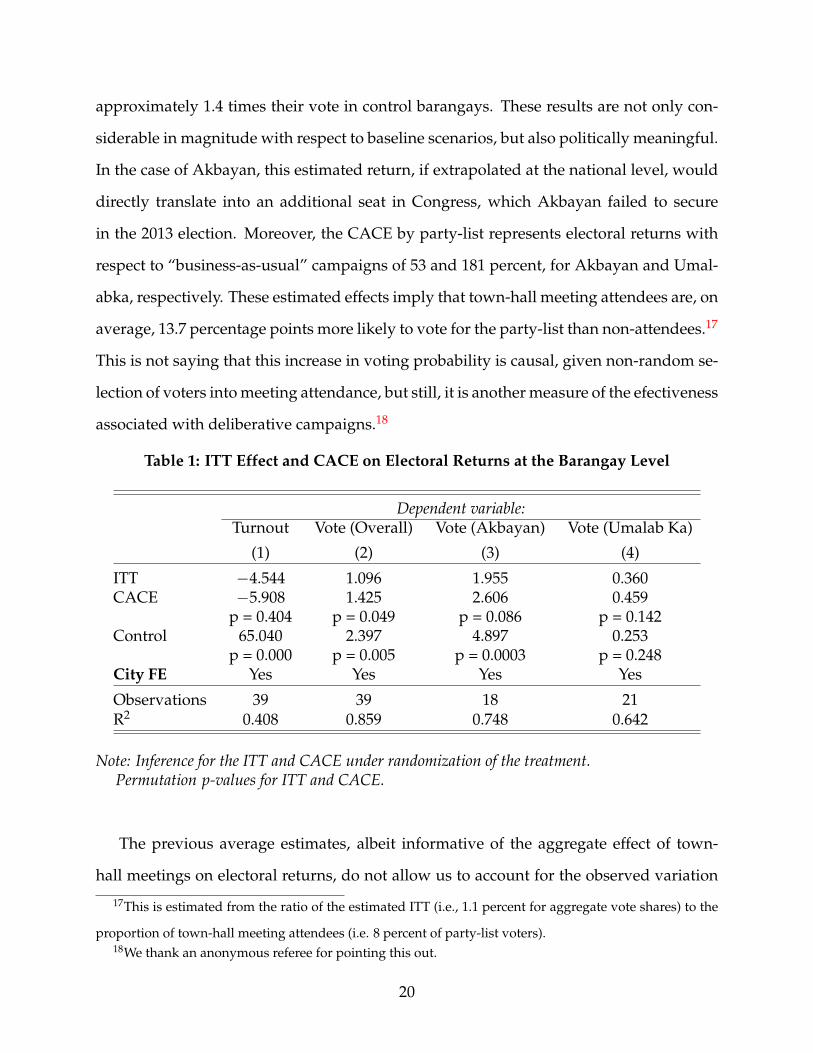
5.1 Effect of Town-Hall Meetings on Electoral Returns
We present the estimates of the ITT and CACE for turnout and vote shares across barangays
in Table 1.16 First, looking at the results on party-list turnout, we can see that the presence
of town-hall meetings does not have a significant effect on voter turnout in the party-list
race. However, conditional on casting a ballot, the presence of town-hall meetings has a
positive and statistically significant effect (p-value < 0.05) on aggregate vote shares when
we pool both party-lists together. These results suggest that the vote shares in barangays
assigned to deliberative campaigns increase 1.1 percent with respect to the baseline of 2.4
percent obtained by “one-way" communication campaigns. This result translates into an
overall electoral return of the assigment of deliberative campaigns of approximately 46
percent. Given the estimated CACE, we find that the effect of implementation of town-
hall meetings on vote shares among “complier” barangays is 1.43 percent or 60 percent
in terms of electoral returns with respect to the control group.
When we split the sample by treatment party-list, we find that both treatment effects
are positive, but the ITT is statistically significant only for Akbayan (p-value< 0.1). In
particular, Akbayan was rewarded, on average, with a 1.96 percent higher vote share
in treatment barangays. Umalab Ka, in turn, obtained an increase of 0.36 percent vote
share in those barangays where town-hall meetings were implemented, which represents
we compute the difference-in-means between treated and untreated barangays. We repeat this procedure
on 1000 samples, randomly shuffling the treatment status within each municipality. In this way, we can
estimate the fraction of simulated difference-in-means that exceeds the observed difference-in-means (i.e.,
permutation p-values).16Figure C.1 in Appendix C presents these results graphically with respect to their empirical null distri-
bution.
19
approximately 1.4 times their vote in control barangays. These results are not only con-
siderable in magnitude with respect to baseline scenarios, but also politically meaningful.
In the case of Akbayan, this estimated return, if extrapolated at the national level, would
directly translate into an additional seat in Congress, which Akbayan failed to secure
in the 2013 election. Moreover, the CACE by party-list represents electoral returns with
respect to “business-as-usual” campaigns of 53 and 181 percent, for Akbayan and Umal-
abka, respectively. These estimated effects imply that town-hall meeting attendees are, on
average, 13.7 percentage points more likely to vote for the party-list than non-attendees.17
This is not saying that this increase in voting probability is causal, given non-random se-
lection of voters into meeting attendance, but still, it is another measure of the efectiveness
associated with deliberative campaigns.18
Table 1: ITT Effect and CACE on Electoral Returns at the Barangay Level
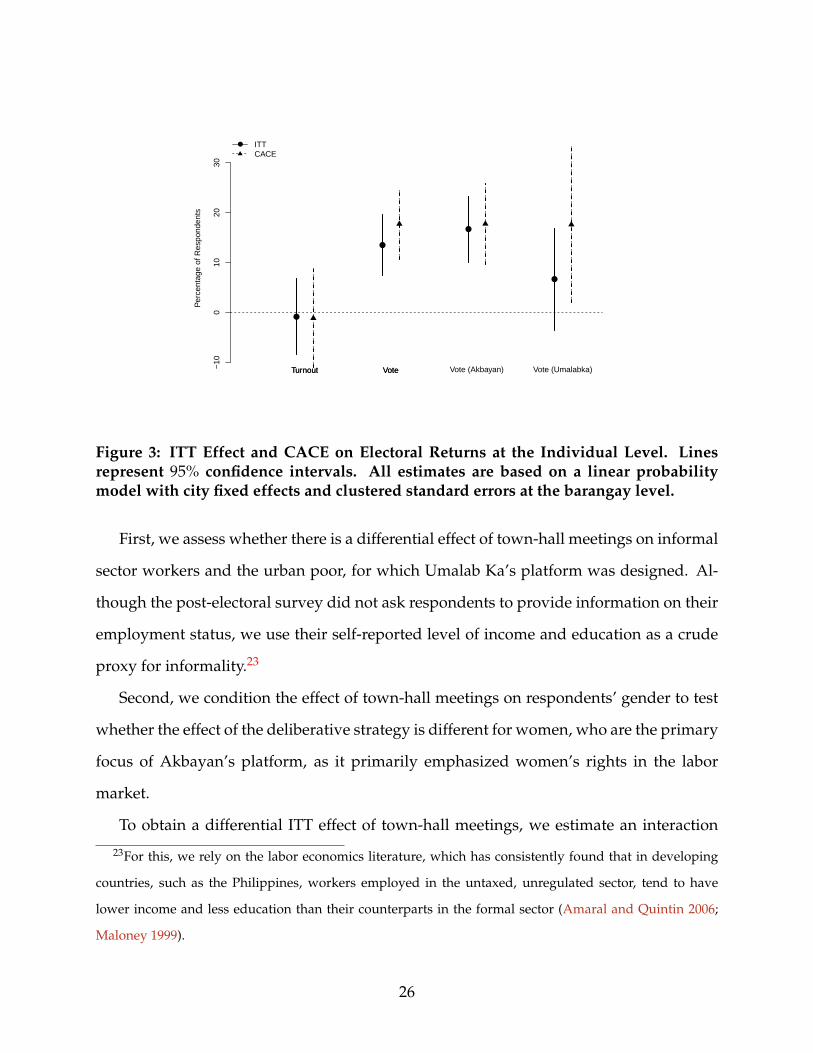
Figure 3: ITT Effect and CACE on Electoral Returns at the Individual Level. Linesrepresent 95% confidence intervals. All estimates are based on a linear probabilitymodel with city fixed effects and clustered standard errors at the barangay level.
First, we assess whether there is a differential effect of town-hall meetings on informal
sector workers and the urban poor, for which Umalab Ka’s platform was designed. Al-
though the post-electoral survey did not ask respondents to provide information on their
employment status, we use their self-reported level of income and education as a crude
proxy for informality.23
Second, we condition the effect of town-hall meetings on respondents’ gender to test
whether the effect of the deliberative strategy is different for women, who are the primary
focus of Akbayan’s platform, as it primarily emphasized women’s rights in the labor
market.
To obtain a differential ITT effect of town-hall meetings, we estimate an interaction
23For this, we rely on the labor economics literature, which has consistently found that in developing
countries, such as the Philippines, workers employed in the untaxed, unregulated sector, tend to have
lower income and less education than their counterparts in the formal sector (Amaral and Quintin 2006;
Maloney 1999).
26
model of the form:
Yi,j,k = γsurveyk + β
survey1 Zj,k + β
survey2 Xi,j,k + β
survey3 (Zj,k × Xi,j,k) + ξi,j,k, (5)
where Xi,j,k denotes the pre-treatment conditioning variable (either income, education
or gender).24 The parameter γsurveyk captures municipality fixed effects and ξi,j,k is an
idiosyncratic error term clustered at the barangay level.
We also estimate a differential CACE, with a similar specification to equation (5), but
instrumenting treatment status with treatment assignment at the barangay level.
Figure 4 graphically depicts the marginal effects of town-hall meetings conditioned by
income, education and gender, along with 95% confidence intervals. In the upper panel
we present the differential effects on Akbayan returns. Consistent with Akbayan’s policy
platform, the positive impact of deliberative campaigns on electoral returns is driven ex-
clusively by women, as both the ITT and CACE are positive only among female voters.
On average, women are 24 percent more likely to vote for Akbayan when their platform is
delivered in town-hall meetings than through “one-way” communication campaigns. We
find no statistically significant differences by income on the effect of town-hall meetings
on electoral returns. Nonetheless, less educated voters in our sample seem to be 9 percent
more likely to vote for Akbayan’s platform under a deliberative campaign, although this
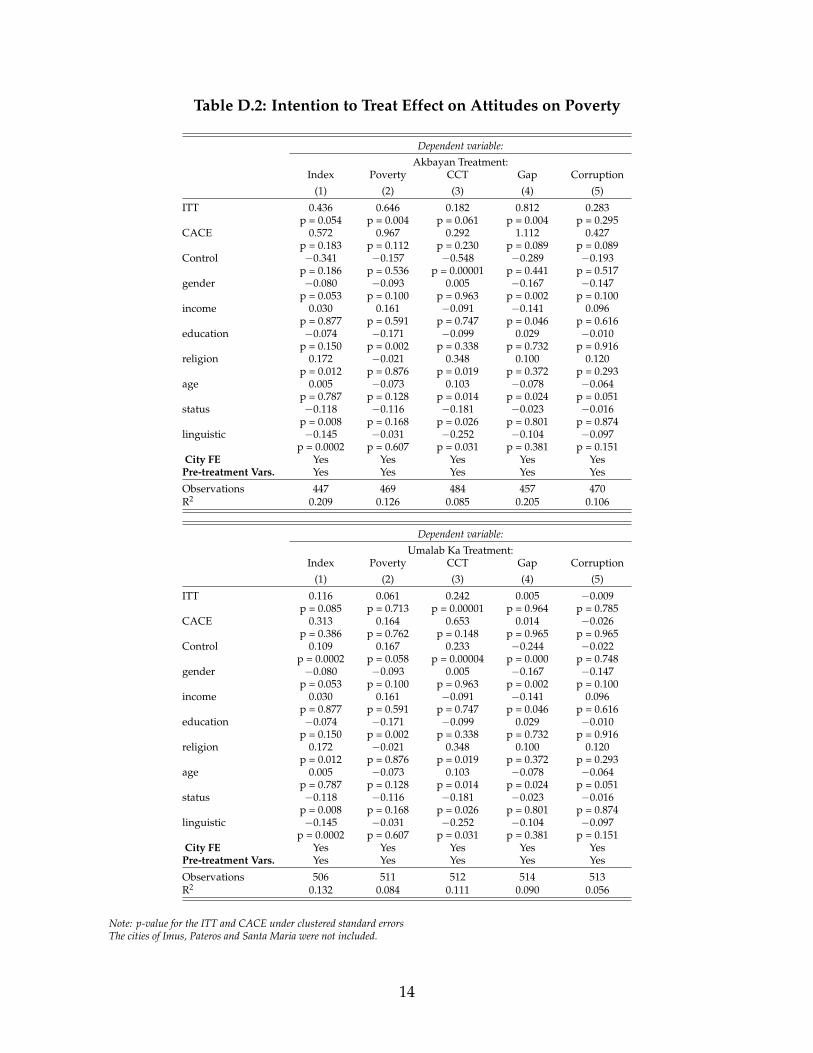
effect is only statistically significant at p-value< 0.05 when we control for pre-treatment
covariates (see Figure D.2 in Appendix D)
The lower panel of Figure 4 shows the differential impact of town-hall meetings on
Umalab Ka electoral returns. As with the estimated average effects shown in Figure
3, differences by voter characteristics are not statistically significant when we focus on
treatment assignment (i.e., ITT). However, when we estimate the CACE, we find het-
erogenous effects by income and education consistent with the policy platform of Umalab
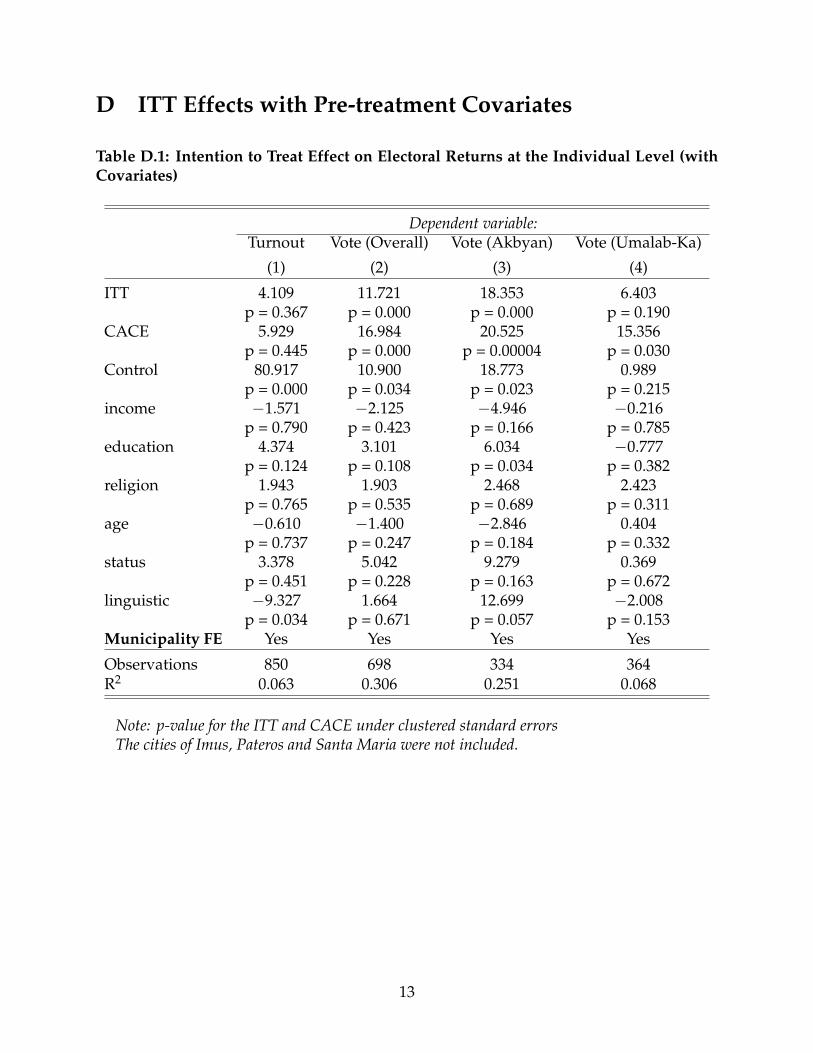
24Appendix D shows that estimates of equation 5 are robust to adding additional pre-treatment covari-
ates.
27
Ka, which focused on the demands of the urban poor. In particular, town-hall meetings
implemented by Umalab Ka increased the probability of voting for that party by 18.5
percent among low income voters, whereas this effect is not statistically different from
zero for survey respondents with an income larger than 10, 000 pesos. Similarly, the ef-
fect of the presence of town-hall meetings on the probability of voting for Umalabka is
19.5 percent for respondents with as much as primary education, whereas the presence of
town-hall meetings does not have a statistical significant effect on the propensity to vote
for Umalabka among respondents with a high-school diploma or more. Finally, we find
no differential treatment effect by gender on Umalab Ka electoral returns.
Overall, the conditional effects of town-hall meetings are consistent with the fact that
the main recipients of the proposed policies contained in the party-list platforms, namely
women and the urban poor, directly rewarded the party-lists to a larger extent when these
platforms were delivered through a deliberative campaign. As the platform content is the
same across treatment conditions, these results imply that the consequences of program-
matic policies are better understood when voters debate with candidates compared to
the scenario in which voters just listen passively to the politician’s message. More impor-
tantly, voters respond to this information and change their vote according to their own
policy priorities.
28
Vote for Akbayan
●
●
●
Conditional Treatment Effect
Per
cent
age
of R
espo
nden
ts
Male Female Difference
−10
010
2030
40
● ITTCACE
●
●
●
Conditional Treatment Effect
Per
cent
age
of R
espo
nden
ts
Low Income High Income Difference
−10
010
2030
40 ● ITTCACE
●
●
●
Conditional Treatment Effect
Per
cent
age
of R
espo
nden
ts
Low Education High Education Difference
−30
−20
−10
010
2030
40 ● ITTCACE
Vote for Umalab Ka
●●
●
Conditional Treatment Effect
Per
cent
age
of R
espo
nden
ts
Male Female Difference
−20
−10
010
2030
40
● ITTCACE
●
●
●
Conditional Treatment Effect
Per
cent
age
of R
espo
nden
ts
Low Income High Income Difference
−40
−20
020
40 ● ITTCACE
●
●
●
Conditional Treatment Effect
Per
cent
age
of R
espo
nden
ts
Low Education High Education Difference
−40
−20
020
40 ● ITTCACE
Effect by Gender Effect by Income Effect by Education
Figure 4: Marginal effect of town-hall meetings on outcomes by income, gender and education.
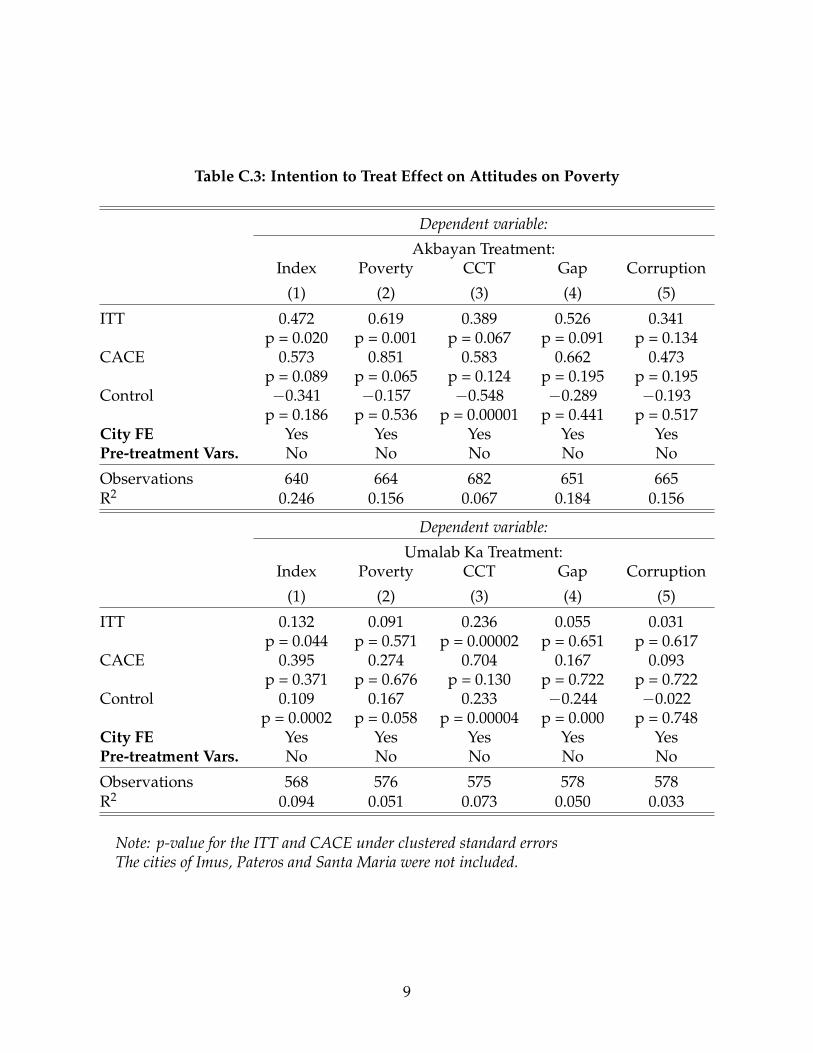
6.3 Causal Mechanisms: The Effect of Town-Hall Meetings on Atti-
tudes about Gender Discrimation and Poverty
Having found differential effects of deliberative campaigns on voting behavior for the
main beneficiaries of party-lists’ platforms, we turn to explore whether town-hall meet-
ings are more effective in changing voters’ attitudes regarding the core policies empha-
sized by both party-lists in the experiment. For Akbayan, we compute attitudinal dif-
ferences on issues related to gender discrimination and sexism. In this way, we assess
whether Akbayan’s message induces a higher awareness of gender inequality and gender
discrimination when platforms are transmitted in town-hall meetings versus “one-way”
communication devices. In the case of Umalab Ka, we compute the ITT and CACE on
29
voters’ attitudes about poverty and income inequality, which were the main priorities of
its policy platform.
Voters’ attitudes on gender discrimination and sexism are constructed from all six
survey questions in which respondents were asked to show their degree of agreement
or disagreement with respect to statements involving gender differences in the quality
of House Representatives (Female Rep.), female representation in politics (Female Pol.),
gender equality (Equality), gender discrimination in the labor market (Discrimation), and
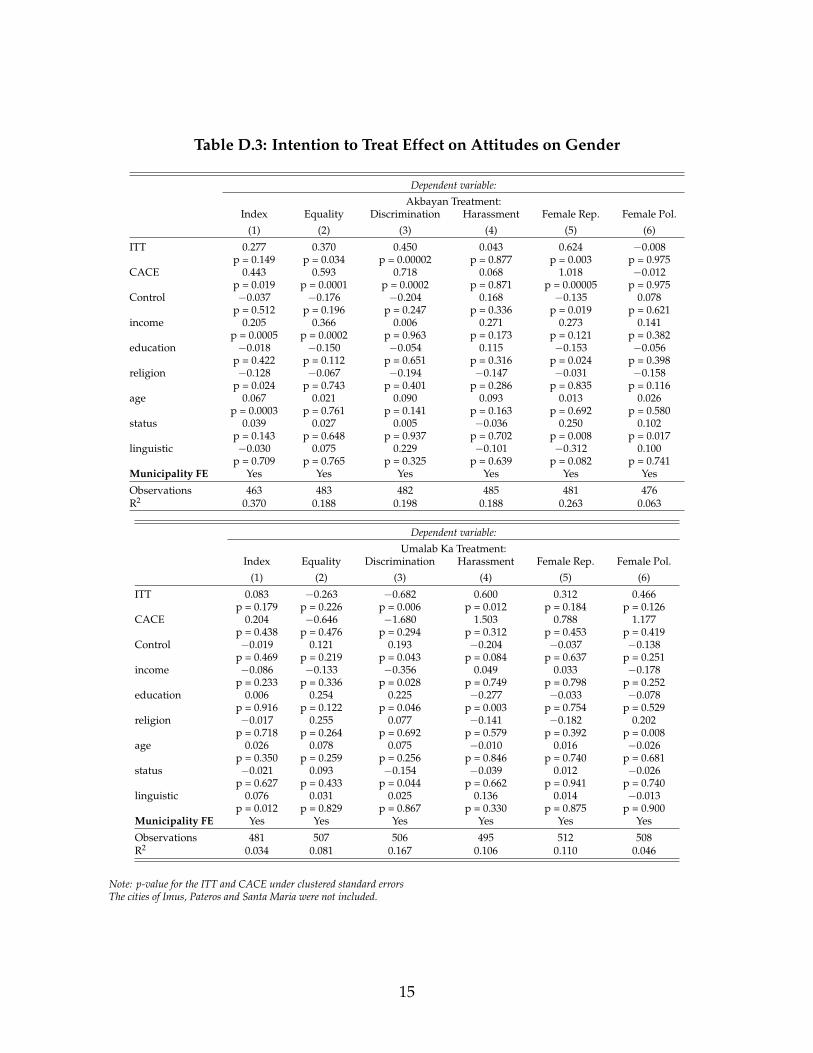
sexual harassment towards women (Harassment).25
To measure voters’ attitudes on issues emphasized by Umalab Ka in their platform, we
use all four survey questions that ask voters about the relevance of issues such as poverty
(Poverty), the income gap between the rich and poor (GAP), a poverty-reducing policy
(CCT), and corruption and graft (Corruption). For poverty, income gap, and corruption
and graft, the survey captures how intensely voters agree with the statement that each of
these issues is one of the Philippines’ most important problems. For the poverty-reducing
policy, the survey asks to rank the policy they would like to be implemented the most
among a conditional cash transfer program, an anti-corruption policy or an increase in
public investment.26
Causal effects are estimated following Anderson [2008]. First, we orient each individ-
ual outcome, so that the positive direction implies more agreement. Next, we demean
all outcomes and standardize them with respect to the control group mean and standard
deviation to use a comparable scale. Since we have multiple measures for each issue,
we construct summary indices in the form of standardized inverse-covariance-weighted
averages of the outcomes. These indices estimate an optimal linear combination of the
individual measures to reflect a common latent factor. By pooling several measures of
an issue into a single index, these indices are robust to overtesting; they also test for
25The six statements used to generate gender-related attitudinal variables can be found in Appendix H.26Appendix H shows the questions used to extract the poverty-related attitudinal variables.
30
whether an issue has a “general effect”; and finally, they have more statistical power than
individual-level tests.
Vote for Akbayan
● ●
●●
●
●
Sta
ndar
d D
evia
tion
Index Equality Discrimination Harassment Female Rep. Female Pol.−1
01
2
● ITTCACE
●
●
●
●
●
Sta
ndar
d D
evia
tion
Index Poverty CCT Gap Corruption
−1
01
2
● ITTCACE
Vote for Umalab Ka
●●
●
●●
●
Sta
ndar
d D
evia
tion
Index Equality Discrimination Harassment Female Rep. Female Pol.−6
−4
−2
02
46
● ITTCACE
● ●
●
● ●
Sta
ndar
d D
evia
tion
Index Poverty CCT Gap Corruption
−2
−1
01
2
● ITTCACE
Gender Discrimination Poverty and Income Inequality
Figure 5: ITT Effects and CACE of Attitudes on Gender Discrimination and Poverty. Linesrepresent 95% confidence intervals. All estimates are based on a linear probability model withmunicipality fixed effects and clustered standard errors at the barangay level. Index refer to thestandard weighted averages across components.
Figure 5 present the results regarding the effects of town-hall meetings on voters at-
31
titudes split by party-list and policy isssue. We present both ITT and CACE estimates
with 95 percent confidence intervals. The upper panel presents the results for Akbayan
municipalities. Consistent with the party’s platform, we show significant effects of town-
hall meetings on voters’ attitudes toward gender discrimination and sexism. Based on
the evidence of the summary index, the presence of town-hall meetings increases aware-
ness on gender-related issues by 0.43 standard deviation (s.d.) units. This attitudinal
change on gender-related issues is mainly driven by a positive and significant increment
in two individual components: female representation in politics (by 0.47 s.d. units) and
discrimination toward women (by 0.78 s.d. units). The effect of town-hall meeting imple-
mentation on gender discrimination issues are significantly larger, with a CACE on the
summary index of 0.63 s.d. units.27 Moreover, voters’ disagreement towards poverty-
related issues also increases significantly when Akbayan implements town-hall meetings
compared to control areas, as can be seen in the upper-right panel of Figure 5. This sig-
nificant effect is present even when the policy platform of Akbayan relegated poverty to
a second-order issue, and instead, stressed women empowerment and gender equality as
their main messages.
In the lower panel of Figure 5 we show the results for Umalab Ka municipalities. We
find a small, but significant ITT of town-hall meetings on the general index of poverty-
related attitudes (0.13 s.d. units), which is driven mainly by voters’ preferences over a
CCT program (0.24 s.d. units). The CACE of the general index and its components are
positive, but statistically insignificant. Hence, in contrast to the robust attitudinal change
caused by the deliberative campaign implemented by Akbayan, the evidence in favor of
an effect of town-hall meetings on poverty-related attitudes, although positive, is weaker.
When we look at differential gender attitudes by treatment status, we cannot reject a null
effect of town hall meetings on the summary index.
The significant effect of town-hall meetings on attitudes related to gender discrimina-
27Table D.3 presents the point estimates and p-values for the overall index and each of its components.
32
tion, and to a smaller extent poverty, provides evidence that deliberative campaigns can
be a more effective communication strategy in improving voters’ knowledge and chang-
ing voters’ beliefs on issues central to the party’s platform. Moreover, these attitudinal
effects are present for men and women and for low and high-income voters. In both
cases we cannot reject that the ITT or CACE for both subset of voters is the same. These
attitudinal effects, however, increase the votes only of women who represent the direct
beneficiaries of the party-list’ platform.
7 Conclusion
In this paper we present deliberative campaigns as a communication strategy that can be
both electorally effective for self-interested politicians and succesful in increasing voters’
knowledge regarding relevant policy issues. The creation of deliberative spaces where
citizens and political elites participate in meaningful conversations with real policy con-
sequences is central to strengthen the quality of weak democracies such as the Philipp-
pines (Curato [2015]; Dressel [2011]; Querubin [2012]). Hence, the impact of deliberative
forums, such as the one presented in this paper, adds to the existing arguments in favor
of institutions that encourage the active engagement of citizens in the decision-making
process.
The positive electoral returns of deliberative campaigns found in this paper are esti-
mated conditional on the observed strategies of the remaining parties that did not partici-
pate in the experiment. The general equilibrium effects allowing other parties to respond
to this strategy are outside of the scope of this paper. However, even if other parties were
to opimally adopt town-hall meetings, potentially diminishing their positive electoral
benefits, their presence would still be a more effective strategy to deliver a policy plat-
form to voters with respect to “one-way” communication strategies, generating a more
informed political environment. Moreover, in weak democratic contexts, such as the one
33
studied in this paper, in which “business-as-usual” campaigns involve the distribution of
cash and other clientelistic goods, as well as a multi-arm campaign requiring canvassers
and rally organizers, town-hall meetings appear to be a cost-effective campaign alterna-
tive.
A future avenue of fruitful research would be to disentangle the effects of town-hall
meetings on attendees from the spillover effects to untreated voters. This would require
carefully tracing meeting attendees’ social networks and the channels through which in-
formation is shared across voters.
34
References
Amaral, Pedro S and Erwan Quintin. 2006. “A competitive model of the informal sector.”
Journal of Monetary Economics 53(7):1541–1553.
Anderson, Michael L. 2008. “Multiple inference and gender differences in the effects
of early intervention: A reevaluation of the Abecedarian, Perry Preschool, and Early
Training Projects.” Journal of the American statistical Association 103(484).
Austen-Smith, David and Timothy J Feddersen. 2006. “Deliberation, preference uncer-
tainty, and voting rules.” American Political Science Review 100(02):209–217.
Ban, Radu, Saumitra Jha and Vijayendra Rao. 2012. “Who has voice in a deliberative
democracy? Evidence from transcripts of village parliaments in south India.” Journal of
Development Economics 99(2):428–438.
Barabas, Jason. 2004. “How deliberation affects policy opinions.” American Political Science
Review 98(04):687–701.
Casey, Katherine, Kelly Glennester and Kelly Bidwell. 2015. “Debates: The Impact of
Voter Knowledge Initiatives in Sierra Leone.” Stanford GSB Working Paper No. 3066 .
Collier, Paul and Pedro C Vicente. 2014. “Votes and violence: Evidence from a field ex-
periment in Nigeria.” The Economic Journal 124(574):F327–F355.
Coughlan, Peter J. 2000. “In defense of unanimous jury verdicts: Mistrials, communica-
tion, and strategic voting.” American Political Science Review pp. 375–393.
Curato, Nicole. 2015. “Deliberative capacity as an indicator of democratic quality: The
case of the Philippines.” International Political Science Review 36(1):99–116.
Dal Bó, Pedro, Andrew Foster and Louis Putterman. 2010. “Institutions and Behavior:
Experimental Evidence on the Effects of Democracy.” The American Economic Review
100(5):2205–29.
35
Dewan, Torun, Macartan Humphreys and Daniel Rubenson. 2014. “The elements of polit-
ical persuasion: Content, charisma and cue.” The Economic Journal 124(574):F257–F292.
Dressel, Björn. 2011. “The Philippines: how much real democracy?” International Political
Science Review 32(5):529–545.
Efron, Bradley and Robert J Tibshirani. 1994. An introduction to the bootstrap. Vol. 57 CRC
press.
Esterling, Kevin M, Michael A Neblo and David MJ Lazer. 2011. “Means, Motive,
And Opportunity In Becoming Informed About Politics A Deliberative Field Experi-
ment With Members Of Congress And Their Constituents.” Public Opinion Quarterly
p. nfr001.
Fujiwara, Thomas and Leonard Wantchekon. 2013. “Can Informed Public Deliberation
Overcome Clientelism? Experimental Evidence from Benin.” American Economic Jour-
nal: Applied Economics, forthcoming .
Gerber, Alan S and Donald P Green. 2000. “The effects of canvassing, telephone calls,
and direct mail on voter turnout: A field experiment.” American Political Science Review
pp. 653–663.
Goeree, Jacob K and Leeat Yariv. 2011. “An experimental study of collective deliberation.”
Econometrica 79(3):893–921.
Green, Donald P, Alan S Gerber and David W Nickerson. 2003. “Getting out the vote in
local elections: results from six door-to-door canvassing experiments.” Journal of Politics
65(4):1083–1096.
Gutmann, Amy and Dennis Frank Thompson. 1996. Democracy and disagreement. Harvard
University Press.
36
Habermas, Jurgen. 1996. Between Facts and Norms: Contributions to a Discourse Theory of
Law and Democracy. Cambridge, MA: MIT Press.
Hicken, Allen, Stephen Leider, Nico Ravanilla and Dean Yang. 2014. “Temptation in Vote-
selling: Evidence from a Filed Experiment in the Philippines.”.
Ho, Daniel E, Kosuke Imai, Gary King and Elizabeth A Stuart. 2007. “Matching as non-
parametric preprocessing for reducing model dependence in parametric causal infer-
ence.” Political analysis 15(3):199–236.
Karpowitz, Christopher F. and Tali Mendelberg. 2014. The silent sex: Gender, deliberation,
and institutions. Princeton University Press.
Kendall, Chad, Tommaso Nannicini and Francesco Trebbi. 2015. “How Do Voters Re-
spond to Information? Evidence from a Randomized Campaign.” American Economic
Review 105(1):322–53.
King, Gary, James Honaker, Anne Joseph and Kenneth Scheve. 2001. “Analyzing incom-
plete political science data: An alternative algorithm for multiple imputation.” Ameri-
can political science review 95(1):49–69.
Macedo, Stephen. 2010. “Why Public Reason? Citizens Reasons and the Constitution of
the Public Sphere.” Unpublished Manuscript .
Maloney, William F. 1999. “Does informality imply segmentation in urban labor mar-
kets? Evidence from sectoral transitions in Mexico.” The World Bank Economic Review
13(2):275–302.
Meirowitz, Adam. 2006. “Designing institutions to aggregate preferences and informa-
tion.” Quarterly Journal of Political Science 1(4):373–392.
Querubin, Pablo. 2012. “Political reform and elite persistence: Term limits and political
dynasties in the Philippines.”.
37
Supplemental Appendix (For Online Publication)
A Sample Selection
Table A.1: Turnout for the National and Party-List Elections (Umalab Ka Barangays)
Muni Barangay Status Turnout (National) Turnout (Party-list) Vote Share (Treatment)Baras Concepcion Control 80.3 62.5 1.70Baras San Juan Treated 76.1 54.8 0.78Baras Santiago Control 80.0 58.8 0.00Imus Anabu II-F Treated 62.3 52.8 0.13Imus Alapan II-A Control 77.2 42.8 0.00Imus Mariano Espeleta II Control 55.9 47.9 0.00Los Banos Lalakay Treated 81.3 66.2 1.00Los Banos Putho Control 83.9 68.5 0.00Los Banos Bayog Control 83.6 66.9 0.00Paranaque Baclaran Treated 68.0 58.8 0.15Paranaque San Dionisio Control 72.8 62.3 0.05Paranaque B.F Homes Control 72.8 58.5 0.18Pasay Barangay 191 Control 78.1 64.1 0.00Pasay Barangay 183 Control 72.1 92.0 0.00Pasay Barangay 178 Treated 73.9 59.8 0.00Pateros San Pedro Control 76.7 128.4 0.09Pateros San Roque Control 77.3 62.9 0.07Pateros San Rosario-Silangan Treated 73.8 59.6 2.25Valenzuela Karuhatan Control 77.8 68.1 0.09Valenzuela Isla Control 57.9 74.6 0.00Valenzuela Punturin Treated 79.6 68.8 1.36Mean 74.36 65.68 0.37S.D. 7.68 17.48 0.65
1
Table A.2: Turnout for the National and Party-List Elections (Akbayan Barangays)
Muni Barangay Status Turnout (National) Turnout (Party-list) Vote Share (Treatment)Luisiana Barangay Zone VI Control - 65.0 11.57Luisiana San Salvador Control 78.2 55.3 1.59Luisiana S.D./S.A. Treated 82.5 29.3 12.22Luisiana San Roque Control - - 9.52Malate Barangay 738 Treated 76.6 67.8 6.83Malate Barangay 190 Control 72.4 60.8 3.51Malate Barangay 609 Control 75.8 63.3 3.45Marikina Parang Control 74.3 75.7 4.46Marikina Barangka Treated 73.6 76.7 3.66Marikina Concepcion Dos Control 73.8 55.2 5.13Quezon City Escopa 4 Control 82.2 66.9 10.56Quezon City Tatalon Control 69.8 60.7 8.41Quezon City Payatas Treated 72.8 60.0 4.44Sta Maria Cabooan Control - 55.2 2.68Sta Maria Tungkod Treated 79.6 54.9 5.91Sta Maria Masinao Control 83.9 53.3 1.47Taguig Hagonoy Control - 55.3 4.28Taguig Upper Bicutan Control 56.0 50.0 3.13Taguig Ususan Treated 60.4 92.7 6.59Mean 74.13 61.01 5.76S.D. 7.7 13.12 3.29
Note: No available general election figures for the barangays of Cabooan, Zone VI and Hagonoy.
OtherCalabarzonNCR (Metro Manila)
OtherAkbayan!Umalab−Ka!
Selected Regions Selected Cities
Figure A.1: Experiment’s Design. Sample Selection of Cities and Barangays.
2
B Balance in Aggregate and Individual Data
B.1 Balance at the Barangay Level
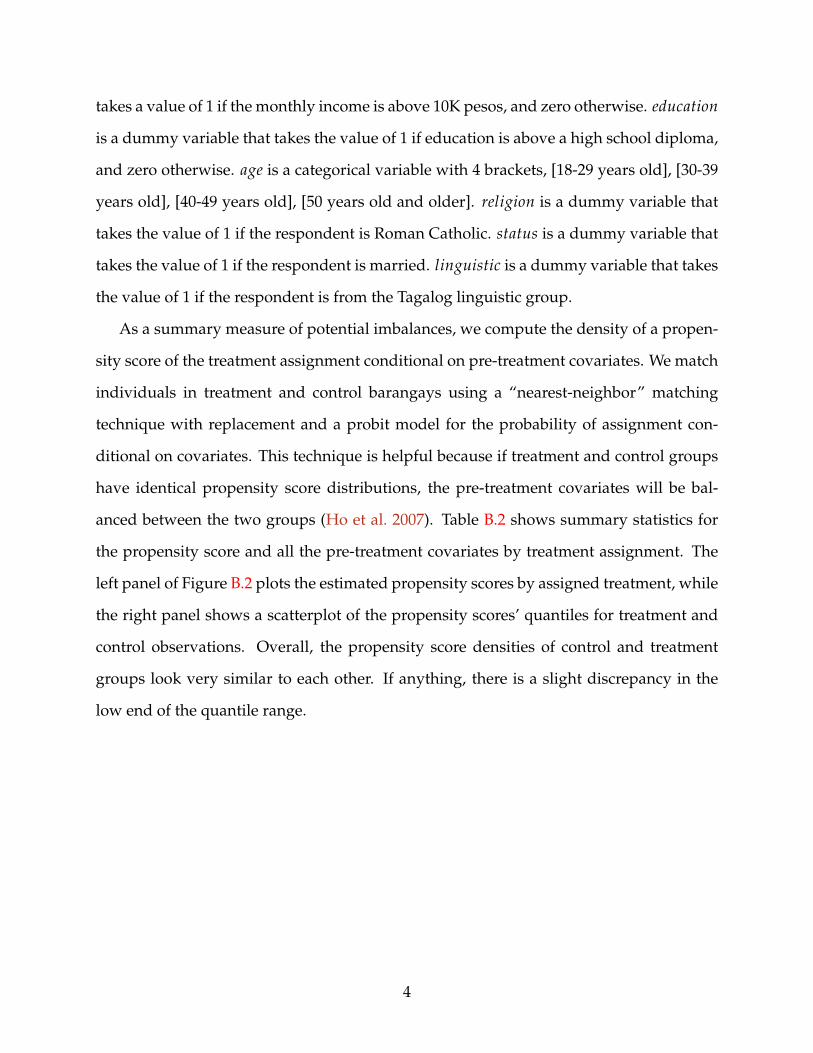
We show evidence that the randomization of town-hall meetings succesfully achieved
balance across treatment and control barangays given available pre-treatment official
statistics, including barangays’ registered voters, the proportion of female voters, as well
as to whether the barangay is classified as urban or rural.28 First, we run a regression
of the assigned treatment on all of the covariates and calculate the joint F-statistic. We
calculate the p-value of the F-statistic via randomization inference under the null that no
covariates have any effect on the assigned treatment. Figure B.1 shows a large p-value
for the F-statistic with respect to the null distribution (p-value= 0.89), indicating that
pre-treatment covariates cannot explain assignment to deliberative campaigns. Table B.1
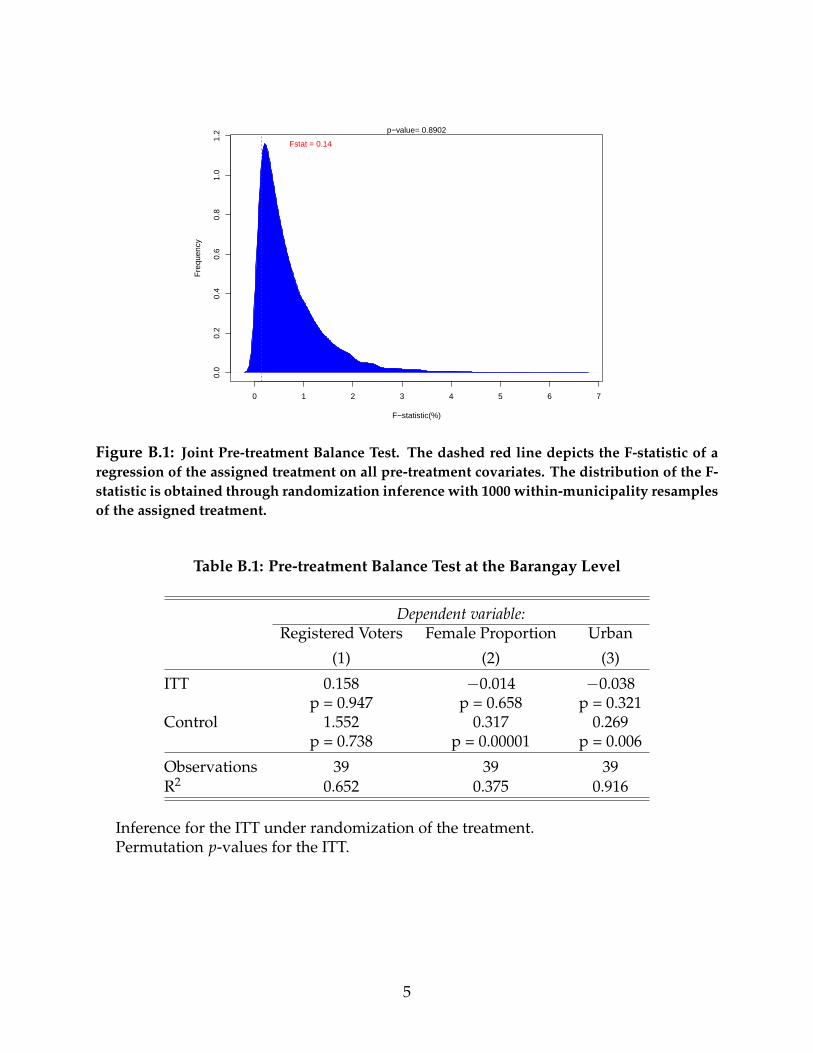
shows additional evidence of balance, by providing evidence of small and statistically
insignificant ITT estimates of town-hall meetings on each pre-treatment covariate.29
B.2 Balance at the Individual Level
We implement a matching estimation of respondents from barangays assigned to treat-
ment and respondents from barangays assigned to control. We include all sociodemo-
graphic characteristics included in the survey questionnaire, such as gender, income, education,
age, religion, marital status, and linguistic group. In particular, gender is a dummy vari-
able that takes the value of 1 if the respondent is female. income is a dummy variable that
28Registered voters is in thousands. Female voters is estimated as a proportion of barangay population.
urban is a dummy variable that takes the value of one if the 2010 Philippines Census denotes the barangay
as urban and zero as rural.29Although ideally we would like to show balance on a broader set of pre-treatment covariates, such
as previous turnout and vote shares, the COMELEC does not have publicly available electoral data at the
barangay level for past party-list elections. Similarly, census data besides population is not available for
lower units of dissagregation than municipalities.
3
takes a value of 1 if the monthly income is above 10K pesos, and zero otherwise. education
is a dummy variable that takes the value of 1 if education is above a high school diploma,
and zero otherwise. age is a categorical variable with 4 brackets, [18-29 years old], [30-39
years old], [40-49 years old], [50 years old and older]. religion is a dummy variable that
takes the value of 1 if the respondent is Roman Catholic. status is a dummy variable that
takes the value of 1 if the respondent is married. linguistic is a dummy variable that takes
the value of 1 if the respondent is from the Tagalog linguistic group.
As a summary measure of potential imbalances, we compute the density of a propen-
sity score of the treatment assignment conditional on pre-treatment covariates. We match
individuals in treatment and control barangays using a “nearest-neighbor” matching
technique with replacement and a probit model for the probability of assignment con-
ditional on covariates. This technique is helpful because if treatment and control groups
have identical propensity score distributions, the pre-treatment covariates will be bal-
anced between the two groups (Ho et al. 2007). Table B.2 shows summary statistics for
the propensity score and all the pre-treatment covariates by treatment assignment. The
left panel of Figure B.2 plots the estimated propensity scores by assigned treatment, while
the right panel shows a scatterplot of the propensity scores’ quantiles for treatment and
control observations. Overall, the propensity score densities of control and treatment
groups look very similar to each other. If anything, there is a slight discrepancy in the
low end of the quantile range.
4
0 1 2 3 4 5 6 7
0.0
0.2
0.4
0.6
0.8
1.0
1.2
F−statistic(%)
Fre
quen
cy
Fstat = 0.14
p−value= 0.8902
Figure B.1: Joint Pre-treatment Balance Test. The dashed red line depicts the F-statistic of aregression of the assigned treatment on all pre-treatment covariates. The distribution of the F-statistic is obtained through randomization inference with 1000 within-municipality resamplesof the assigned treatment.
Table B.1: Pre-treatment Balance Test at the Barangay Level
Figure B.2: Kernel Density and Q-Q Plot of the Survey Sample. On the left panel, the redline depicts the density of the propensity score for individuals from barangays assigned to thecontrol group, whereas the blue line depicts the density of the propensity score for individualsfrom barangays assigned to the treatment group. On the right panel, the red dots represent em-pirical Q-Q estimates for the survey sample. The 45-degree line indicates identical distributionand the dotted lines indicate the width of the propensity score range.
Table B.2: Balanced Statistics of Pre-Treatment Covariates to Predict Treatment andAssignment to Treatment at the Individual Level
AssignmentMeans Assigned Means Control SD Control Mean Diff eQQ Med
Note: p-value for the ITT and CACE under clustered standard errorsThe cities of Imus, Pateros and Santa Maria were not included.
10
−15 −10 −5 0 5 10 15
0.00
0.02
0.04
0.06
0.08
Vote Share (%)
Fre
quen
cy
ITT = −4.544
p−value= 0.39
−2 −1 0 1 2
0.0
0.1
0.2
0.3
0.4
0.5
Vote Share (%)
Fre
quen
cy
ITT = 1.096
p−value= 0.096
Turnout Vote (Overall)
−4 −2 0 2 4
0.00
0.05
0.10
0.15
0.20
0.25
Vote Share (%)
Fre
quen
cy
ITT = 1.955
p−value= 0.0864
−0.5 0.0 0.5 1.0
0.0
0.2
0.4
0.6
0.8
1.0
1.2
1.4
Vote Share (%)
Fre
quen
cy
ITT = 0.36
p−value= 0.1408
Vote (Akbayan) Vote (Umalab Ka)
Figure C.1: Permutation Distribution for the ITT Effect. The dashed red line indicate theobserved ITT. The distribution is constructed from 1000 within-municipality resamples fromthe observed outcomes.
11
Vote (Akbayan)
0 5 10 15 20
−4
−2
02
46
Registered Voters (1000's)
Ele
ctor
al R
etur
ns
ITT = 1.95
90% CI95% CI
0.00 0.05 0.10 0.15
−2
02
46
Attendees / Voters
Ele
ctor
al R
etur
ns
ITT = 1.95
90% CI95% CI
Vote (Umalabka)
5 10 15 20
−3
−2
−1
01
23
Registered Voters (1000's)
Ele
ctor
al R
etur
ns
ITT = 0.36
90% CI95% CI
0.00 0.02 0.04 0.06
−1.
0−
0.5
0.0
0.5
1.0
1.5
Attendees / Voters
Ele
ctor
al R
etur
ns ITT = 0.36
90% CI95% CI
Registered Voters Meeting Attendance
Figure C.2: Heterogenous Effects by Registered Voters and Attendance
12
D ITT Effects with Pre-treatment Covariates
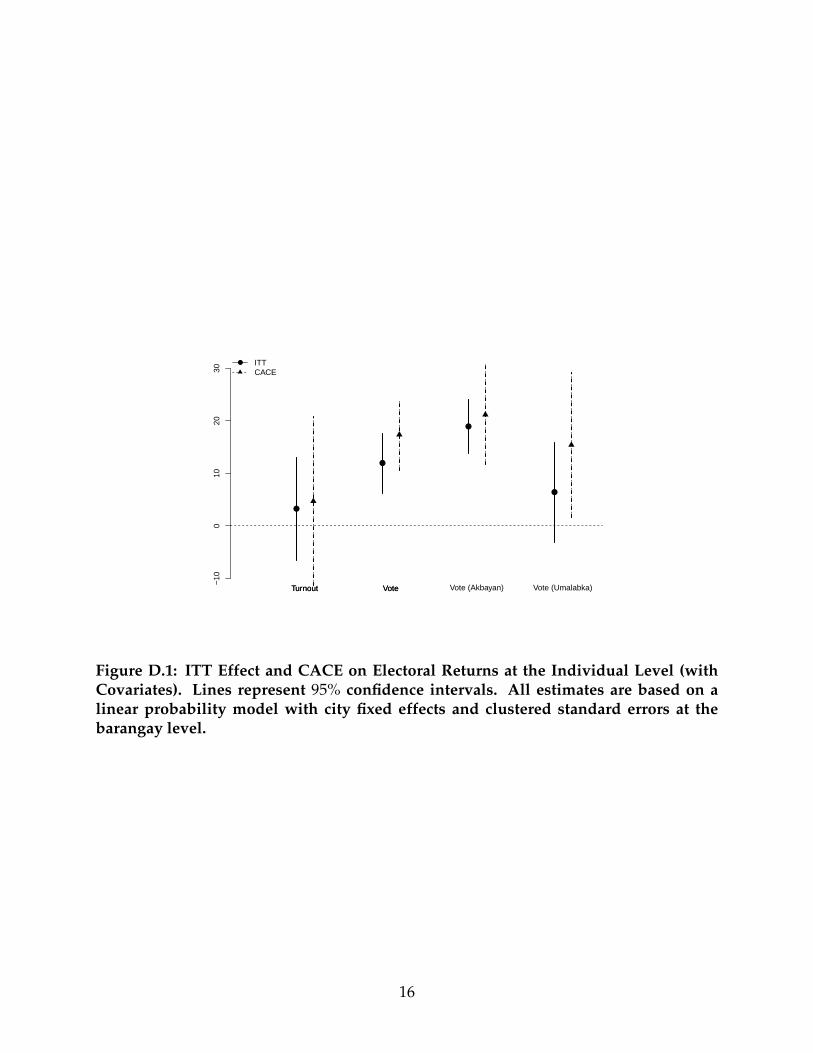
Table D.1: Intention to Treat Effect on Electoral Returns at the Individual Level (withCovariates)
Figure D.1: ITT Effect and CACE on Electoral Returns at the Individual Level (withCovariates). Lines represent 95% confidence intervals. All estimates are based on alinear probability model with city fixed effects and clustered standard errors at thebarangay level.
16
Vote for Akbayan
●
●
●
Conditional Treatment Effect
Per
cent
age
of R
espo
nden
ts
Male Female Difference
−10
010
2030
40
● ITTCACE
●
●
●
Conditional Treatment Effect
Per
cent
age
of R
espo
nden
ts
Low Income High Income Difference
−10
010
2030
40 ● ITTCACE
●
●
●
Conditional Treatment Effect
Per
cent
age
of R
espo
nden
ts
Low Education High Education Difference
−30
−20
−10
010
2030
40
● ITTCACE
Vote for Umalab Ka
●●
●
Conditional Treatment Effect
Per
cent
age
of R
espo
nden
ts
Male Female Difference−20
020
40
● ITTCACE
●
●
●
Conditional Treatment Effect
Per
cent
age
of R
espo
nden
ts
Low Income High Income Difference
−40
−20
020
● ITTCACE
●
●
●
Conditional Treatment Effect
Per
cent
age
of R
espo
nden
ts
Low Education High Education Difference
−40
−20
020
40
● ITTCACE
Effect by Gender Effect by Income Effect by Education
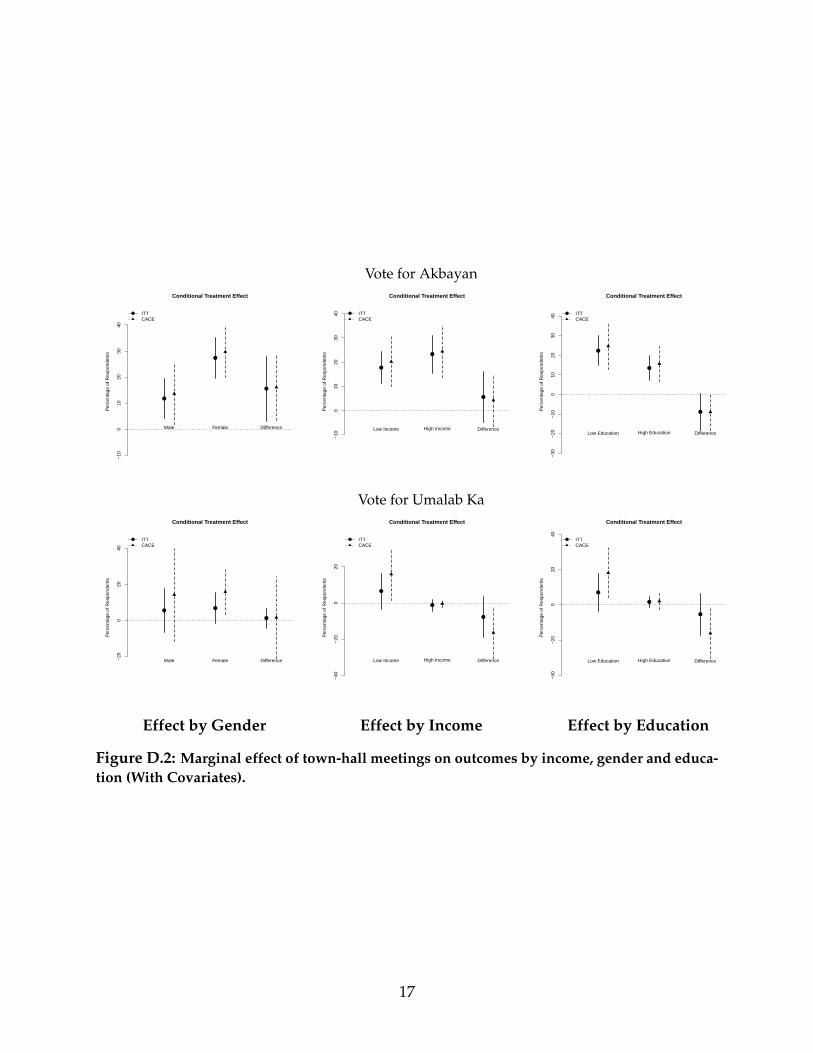
Figure D.2: Marginal effect of town-hall meetings on outcomes by income, gender and educa-tion (With Covariates).
17
Vote for Akbayan
●●
●
●
●
●
Index Equality Discrimination Harassment Female Rep. Female Pol.
−1
01
2 ● ITTCACE
●
●
●
●
●
Sta
ndar
d D
evia
tion
Index Poverty CCT Gap Corruption−1
01
23
● ITTCACE
Vote for Umalab Ka
●●
●
●●
●
Index Equality Discrimination Harassment Female Rep. Female Pol.
−6
−4
−2
02
4
● ITTCACE
●●
●
● ●
Sta
ndar
d D
evia
tion
Index Poverty CCT Gap Corruption
−2
−1
01
2 ● ITTCACE
Gender Discrimination Poverty and Income Inequality
Figure D.3: ITT Effects and CACE of Attitudes on Poverty and Gender (with Covariates).Lines represent 95% confidence intervals. All estimates are based on a linear probability modelwith city fixed effects and clustered standard errors at the barangay level.
18
E ITT Effects with Balanced Panel
Table E.1: Intention to Treat Effect on Electoral Returns at the Individual Level (withBalanced Panel)
Figure E.1: ITT Effect and CACE on Electoral Returns at the Individual Level (withBalanced Panel). Lines represent 95% confidence intervals. All estimates are based ona linear probability model with city fixed effects and clustered standard errors at thebarangay level.
F ITT Effects (Unweighted Results)
20
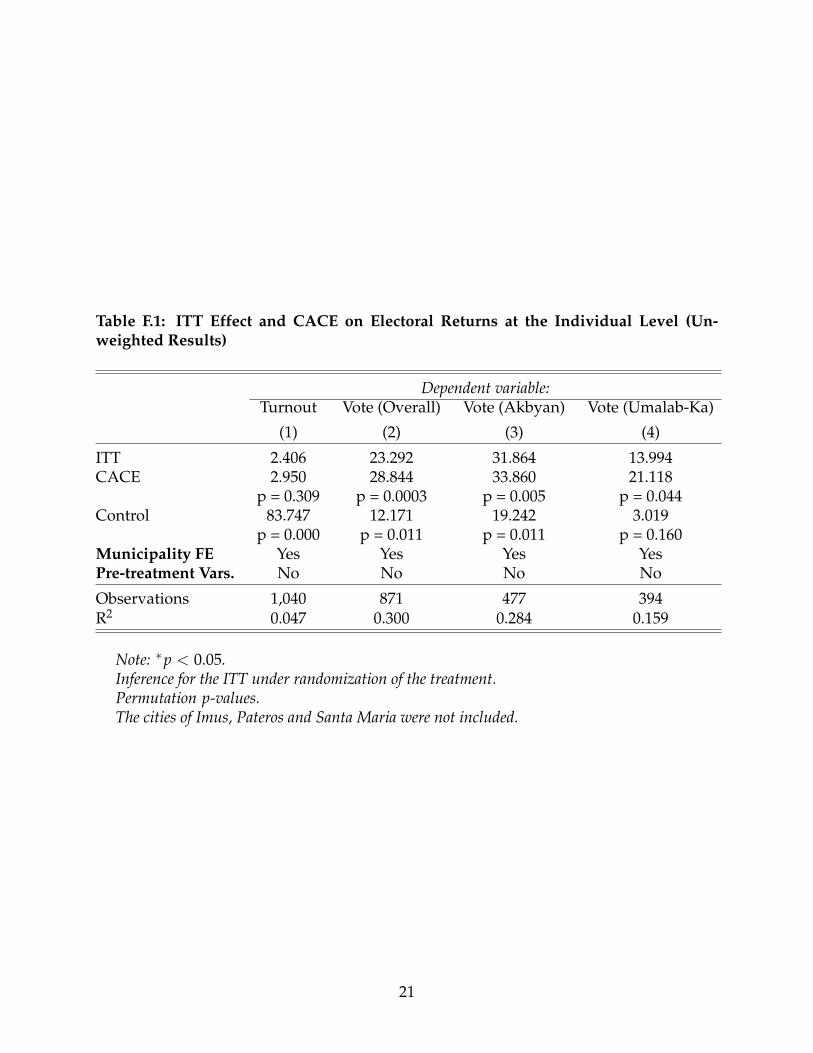
Table F.1: ITT Effect and CACE on Electoral Returns at the Individual Level (Un-weighted Results)
Note: ∗p < 0.05.Inference for the ITT under randomization of the treatment.Permutation p-values.The cities of Imus, Pateros and Santa Maria were not included.
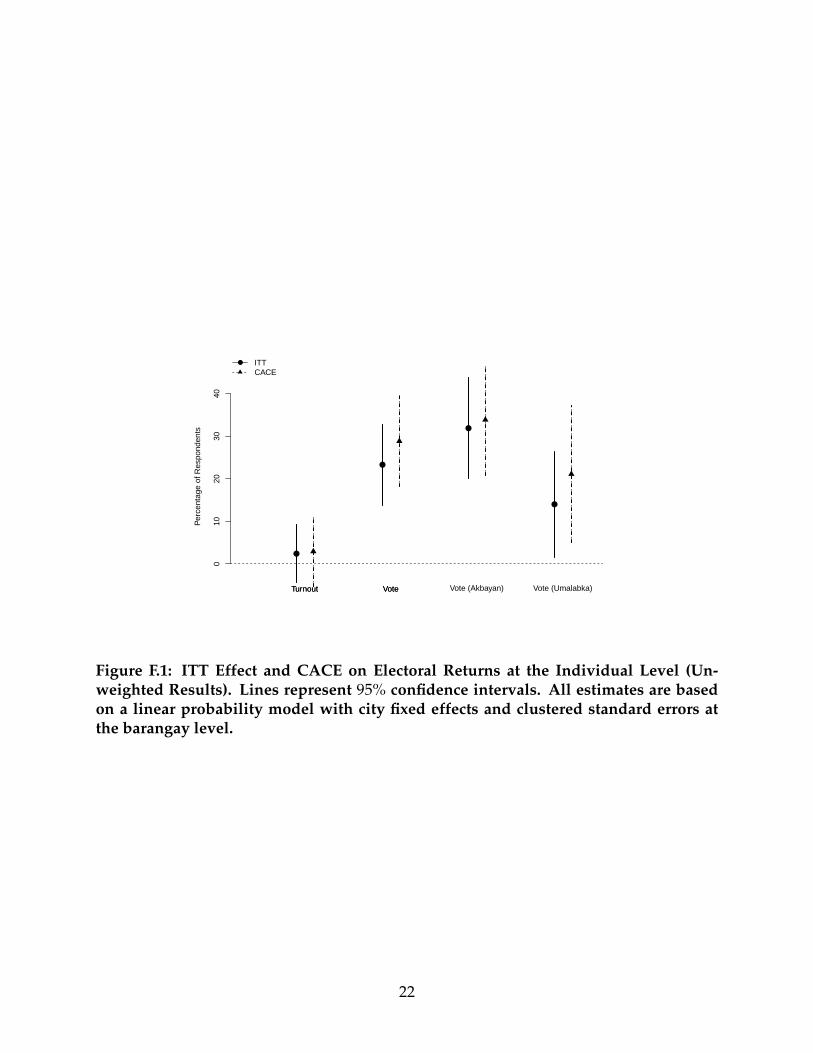
Figure F.1: ITT Effect and CACE on Electoral Returns at the Individual Level (Un-weighted Results). Lines represent 95% confidence intervals. All estimates are basedon a linear probability model with city fixed effects and clustered standard errors atthe barangay level.
22
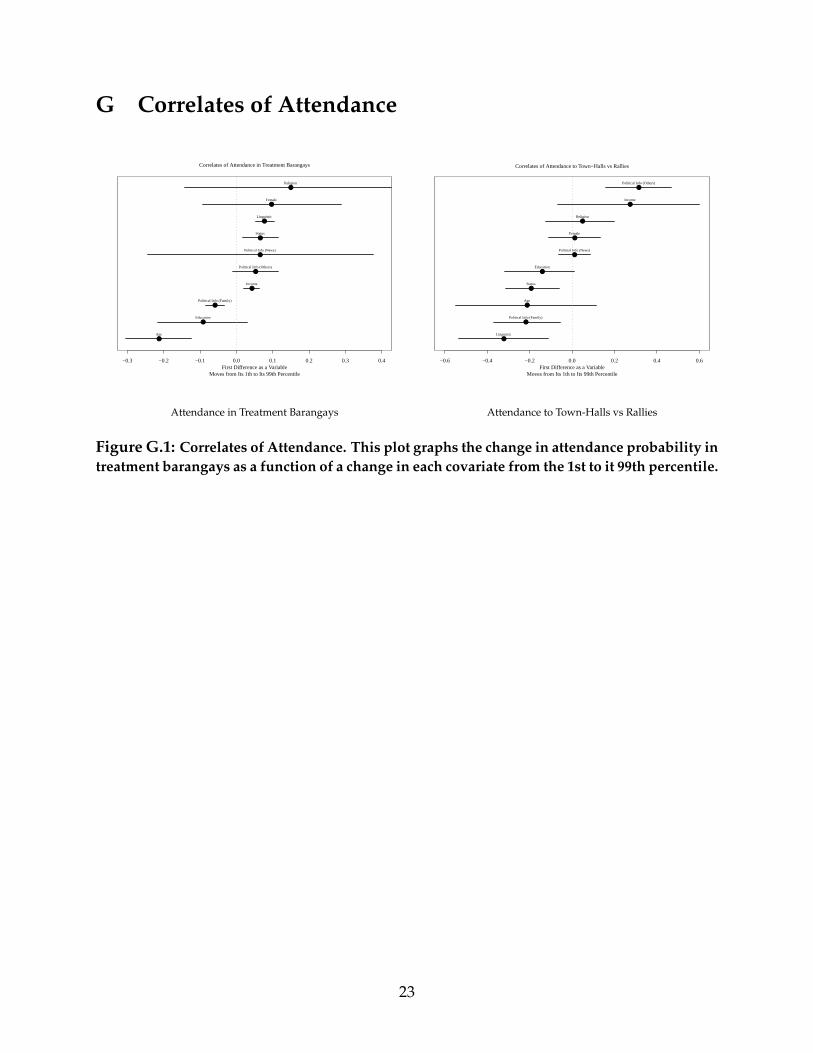
G Correlates of Attendance
●Age
●Education
●Political Info (Family)
●Income
●Political Info (Others)
●Political Info (News)
●Status
●Linguistic
●Female
●Religion
−0.3 −0.2 −0.1 0.0 0.1 0.2 0.3 0.4First Difference as a Variable
Moves from Its 1th to Its 99th Percentile
Correlates of Attendance in Treatment Barangays
●Linguistic
●Political Info (Family)
●Age
●Status
●Education
●Political Info (News)
●Female
●Religion
●Income
●Political Info (Others)
−0.6 −0.4 −0.2 0.0 0.2 0.4 0.6First Difference as a Variable
Moves from Its 1th to Its 99th Percentile
Correlates of Attendance to Town−Halls vs Rallies
Attendance in Treatment Barangays Attendance to Town-Halls vs Rallies
Figure G.1: Correlates of Attendance. This plot graphs the change in attendance probability intreatment barangays as a function of a change in each covariate from the 1st to it 99th percentile.
23
H Survey Questions Used in the Individual-level Analysis
H.1 Demographics
The enumerator will ask the respondent and circle the corresponding choice number.
• (Income) What is your monthly household income in pesos?
1. Below 10K
2. Up to 60K
3. Up to 100K
4. Over 100K
• (Female) Indicate your gender
1. Male
2. Female
• (Age) What is your age?
1. 18-29
2. 30-39
3. 40-49
4. 50 and up
• (Religion) Do you belong to any particular religion?
1. Roman Catholic
2. Protestant
3. Islam
4. Others
• (Status) What is your marital status?
1. Married
2. Single
3. Widowed
4. Separated
5. Other
• (Linguistic) What is the ethnic or linguistic group you identify with?
24
1. Tagalog
2. Cebuano
3. Hiligaynon
4. Waray
5. Bikol
6. Ilokano
7. Kapampangan
8. Pangasinense
9. Others
• (Education) What is your highest level of education?
1. None
2. Elementary
3. High School
4. College
5. Post-Graduate
H.2 Turnout and Vote Choices
• (Turnout) We would like to ask you about the last national elections that happenedon May 13. Did you go to a polling station?
1. Yes
2. No
– (Vote) If yes, which party-list did you vote for in the election of party-list rep-resentatives? (Open Answer).
H.3 Town-Hall Meeting Attendance
For the enumerator in treatment barangays, please ask the next question:
• (Attendance) During the campaign, did you attend town-hall meetings enabled foryou by the party-list (PL NAME) in favor of its candidates?
1. Yes
2. No
25
H.4 Gender Attitudes
• (Female Rep.) Who would do a better job in the House of Representatives? A repre-sentative who is Male, a representative who is Female, or would they do an equallygood or bad job?
1. Male
2. Female
3. Both
• (Female Pol.) Would you say that women have too much influence in Philippinespolitics, just about the right amount of influence in Philippines politics, or too littleinfluence in Philippines politics?
1. Too much
2. Too little
3. Just the right amount
• I am going to read several statements. After each one, I would like you to tell mehow strongly you agree or disagree
– (Equality) “When women demand equality these days, they are actually seek-ing special favors”. Do you: