107
Policy Framework for the Development of Intermodal Interfaces as part of an Integrated Transport Network in Asia

Policy Framework for the Development ofIntermodal Interfaces as part of an Integrated
Transport Network in Asia

ST/ESCAP/2556
The designations employed and the presentation of the material do not imply the expression of any opinion whatsoever on the part of the Secretariat of the United Nations concerning the legal status of any country, territory, city or area or its authorities, or concerning the delimitation of its frontiers or boundaries.
Mention of firm names and commercial products does not imply the endorsement of the United Nations.
This publication has been issue without formal editing.

i
PROMOTING INTERMODAL TRANSPORT IN THE UNESCAP REGION
TABLE OF CONTENTS
PageChapter 1 INTRODUCTION ………………………………………………………….. 1Chapter 2 FREIGHT INTERMODAL INTERFACES: DEFINITIONS …………….. 3 2.1 Trade growth and development of inland trade distribution
systems ………………………………………………………………. 3 2.2 Intermodal transfer terminals : descriptions of facilities and
services ………………………………………………………………. 4
Chapter 3 ROLE OF INTERMODAL TRANSPORT IN OPTIMIZING SUPPLY CHAIN COSTS IN THE UNESCAP REGION ………………………….. 11
3.1 Importance of enhanced logistics …………………………………. 11 3.2 Relationship of logistics, trade and incomes ……………………... 11 3.3 Scope for improvement of logistics within the region ……………. 12 3.4 Exploiting modal complementarity for inland trade distribution … 13 3.5 Importance of measuring logistics performance …………………. 15Chapter 4 RECENT EXPERIENCE OF INTERMODAL FACILITIES AND
INTERMODAL FREIGHT TRANSPORT DEVELOPMENT IN THE UNESCAP REGION ………………………………………………………. 17
4.1 Northern corridor …………………………………………………….. 17 4.2 TAR corridor through Southeast Asia …………………………….. 27 4.3 The North-South corridor …………………………………………… 40 4.4 The Southern Corridor ……………………………………………… 48Chapter 5 RELEVANT INTERMODAL FACILITIES AND INTERMODAL
FREIGHT TRANSPORT DEVELOPMENT OUTSIDE OF THE UNESCAP REGION ………………………………………………………. 61
5.1 Europe ………………………………………………………………... 61 5.2 North America ……………………………………………………….. 67Chapter 6 GUIDELINES FOR DESIGN, FINANCING AND ESTABLISHMENT
OF FREIGHT INTERMODAL FACILITIES ……………………………... 75 6.1 Location ………………………………………………………………. 75 6.2 Type …………………………………………………………………… 76 6.3 Layout and area ……………………………………………………... 76 6.4 Equipment and staffing ……………………………………………... 83 6.5 ICD infrastructure investment costs ……………………………….. 85 6.6 Summarized infrastructure and equipment investment costs ….. 87 6.7 Ownership and method of financing ………………………………. 87Chapter 7 NET ECONOMIC BENEFITS OF FREIGHT INTERMODAL
INTERFACES ………………................................................................ 89
7.1 Measuring the economic benefits of freight intermodal interfaces 89 7.2 Measuring the economic costs of freight intermodal interfaces ... 94 7.3 Establishing and evaluating indicators of economic worth ……… 95

ii
PageChapter 8 DRAFT RECOMMENDATIONS …………………………………………. 96 8.1 Setting up a proper vehicle to promote the development of
intermodal interfaces ………………………………………………... 96 8.2 Initiatives to encourage private sector participation in the
financing, ownership and operation of intermodal interfaces ....... 96 8.3 Initiatives to remove institutional barriers to successful operation
of intermodal interfaces …………………………………………….. 98
ANNEX
Annex 1 Busan Declaration on Transport Development in Asia and the Pacific 100
LIST OF MAPS
Map 1 Location of inland container handling facilities, Malaysia …………….. 33Map 2 Network of CONCOR’S terminals ……………………………………….. 55
LIST OF FIGURES
Figure 2.1 Inland trade distribution system …………………………………………. 3Figure 3.1 Road/rail container freight breakeven analysis - Low rail productivity
case ………………………………………………………………………… 13Figure 3.2 Road/rail container freight breakeven analysis - High rail productivity
case ………………………………………………………………………… 14Figure 4.1 Malaysia-Thailand container land bridge services, volume trend ……. 34Figure 4.2 Road and rail volumes at Lat Krabang ICD in total Laem Chabang
throughput ………………………………………………………………….. 37Figure 5.1 Distribution and Freight Network around Virginia Inland Port ………... 73Figure 6.1 Example of ICD Layout: reach-stacker served CY ……………………. 78Figure 6.2 Example of ICD Layout: RTG-served CY ………………………………. 78Figure 6.3 Example of ICD Layout: RMG-served CY ……………………………… 79Figure 6.4 ICD areas and costs (examples from region) ………………………….. 86Figure 7.1 Container transport cost between Rotterdam and Manheim (500 km) 90
LIST OF TABLES
Table 1 Characteristics of different inland cargo distribution systems ………... 5Table 2 Characteristics of different inland cargo distribution systems
(summary table) …………………………………………………………… 10Table 4.1 Intermodal transport capability of main TAR routes in China ………… 18Table 4.2 Double-stack container services operated by Chinese Railways
(2007) ………………………………………………………………………. 21

iii
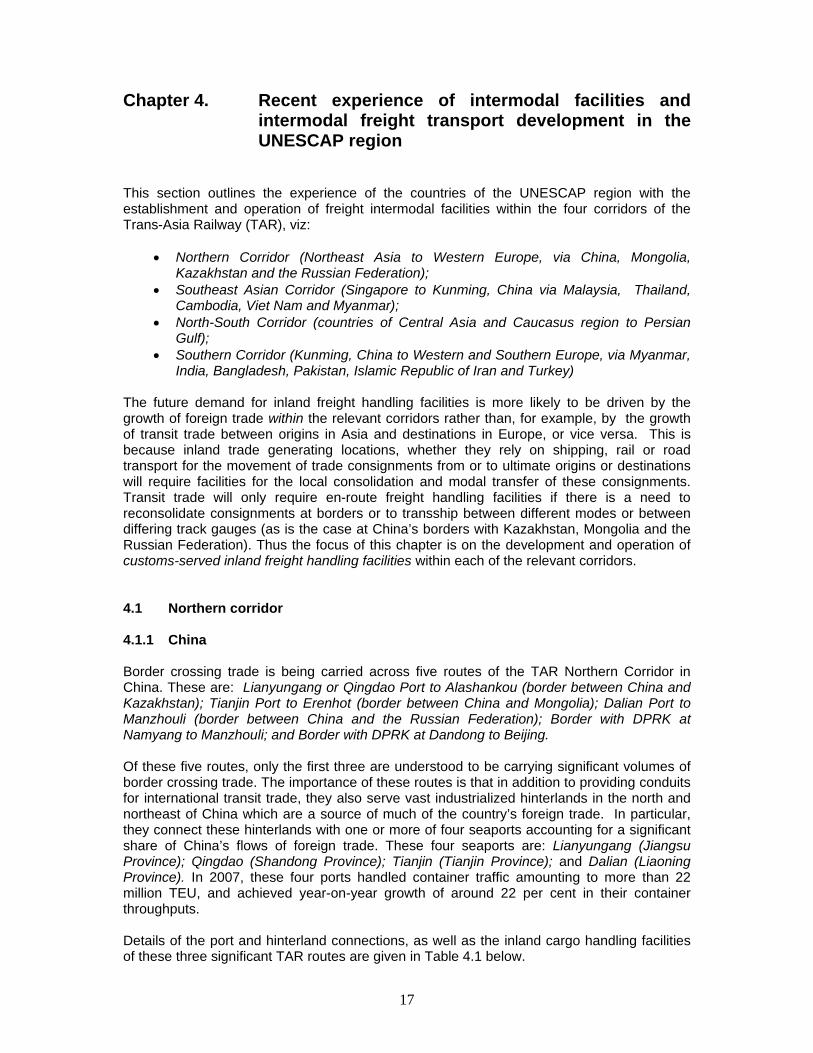
PageTable 4.3 Inland container handling facilities in the Republic of Korea …………. 24Table 4.4 TEU throughput at major ports of the Russian Federation, 2003-2007 25Table 4.5 Facilities and operations of four inland ports, Malaysia ………………. 32Table 4.6 Facilities and operations of ICDs in Myanmar …………………………. 35Table 4.7 Facilities and operations of Lat Krabang Inland Container Depot …… 37Table 4.8 Basic characteristics of Azerbaijan’s intermodal facilities …………….. 42Table 4.9 Basic characteristics of Tajikistan’s rail-served intermodal facilities … 44Table 4.10 Basic characteristics of Tajikistan’s road-served intermodal facilities . 45Table 4.11 Basic characteristics of Turkmenistan’s inland container facilities …... 45Table 4.12 Basic characteristics of Turkey’s planned freight villages …………….. 49Table 4.13 Main characteristics of Tughlakabad ICD ………………………………. 54Table 4.14 CONCOR’s container traffic in TEUs, fiscal year 2003-04 to 2007-08 56Table 4.15 Design characteristics and functions of planned ICDs in Sri Lanka …. 59Table 4.16 Design characteristics and functions of planned ICYs in Sri Lanka …. 59Table 5.1 Characteristics of freight intermodal interfaces in the United Kingdom 63Table 6.1 Determination of CY area ………………………………………………… 80Table 6.2 Determination of CFS area ………………………………………………. 81Table 6.3 ICD area requirements – summary ……………………………………… 83Table 6.4 Productivity factors and costs of container handling equipment ……... 83Table 6.5 Unit cost of ICD development for selected projects in UNESCAP
region ……………………………………………………………………….. 85Table 6.6 ICD infrastructure investment cost ………………………………………. 86Table 7.1 Economic benefits of investment in freight intermodal interfaces ……. 89Table 7.2 Emissions other than CO2 for road and rail transport ………………… 92

1
Chapter 1. Introduction
1.1 There is wide consensus among transport policy-makers in the UNESCAP region that modern transport networks are a condition to political stability, economic growth and social development. Efficient road and rail networks and their connection to international ports are also a concern for industry to reach worldwide markets. Access to mobility also contributes to better quality of life for Asia’s growing population. It is with these principles in mind that UNESCAP and its member countries decided to identify the Asian Highway and Trans-Asian Railway networks as important tools for their economic integration and future prosperity. They carried out related actions within the framework of the Asian Land transport Infrastructure Development (ALTID) project launched in 1992 by the UNESCAP Commission at its 48th session. The project also comprised a transport facilitation component.
1.2 As the networks were taking shape through a series of corridor studies, member countries recognized the ALTID project as a flexible mechanism which stimulated joint and coordinated actions by governments of the region to improve conditions and procedures for international trade and transport across its extensive land borders. This recognition led to the formalization of the networks through two related Intergovernmental Agreements, namely: the “Intergovernmental Agreement on the Asian Highway Network” which entered into force in July 2005 and the “Intergovernmental Agreement on the Trans-Asian Railway Network” which was opened for signature in November 2006 during the Ministerial Conference on Transport held in Busan, Republic of Korea.
1.3 At the Conference, the Ministers acknowledged the progress made by UNESCAP and its member countries since the launch of ALTID and decided to use the popularity of the project with member governments as a thrust towards new achievements. In particular, recognizing that the continuing evolution of logistics had caused transport to become an integral part of the production process of industry, the Ministers requested that the Asian Highway and Trans-Asian Railway networks be used as the two building blocks for an international integrated intermodal transport and logistic system covering the region. To this effect, on 11 November 2006, they adopted the Busan Declaration on Transport Development in Asia and the Pacific(Annex 1).
1.4 The Busan declaration provides strong support for the development of dry ports and logistical activities at intermodal interfaces, by resolving that:
“…in order to meet the growing challenges of globalization effectively, respective government authorities will develop and implement transport policies at the national, sub regional and regional levels in line with the following principles:
a) Formulating integrated policies and decision-making frameworks based on strategic assessments of economic, environmental, social and poverty-related aspects;
(b) Developing an international integrated intermodal transport and logistics system that contributes to the long-term objective of regional cooperation in support of production and distribution networks and of international trade;

2
(c) Giving priority to investment in the Asian Highway and Trans-Asian Railway networks, including intermodal interfaces to link them with water and air transport networks;
(d) Promoting the development of economic and logistical activities at intermodal interfaces, particularly at production and consumption centres, and around seaports and dry ports;
(e) Mobilizing financial resources for the development of the transport system, its maintenance and operation from all possible sources, including public private partnerships and other financial arrangements”.
1.5 Under the title of “Intermodal Interfaces – Focus for Development in the UNESCAP Region” this study is part of a wider programme of action being carried out by UNESCAP to facilitate the development of intermodal transport and logistics in the region under the mandate provided by the Busan Declaration. It has been initiated at a time when world trade volume is at its highest ever. However, the acceleration of international trade in recent years and the globalization process has mainly benefited the coastal areas of the region, with trade to and from the landlocked countries and the more remote hinterland areas of coastal countries trailing behind, due to excessive transport and logistics costs.
1.6 The study examines the potential for alleviating the trade and transit cost disadvantages of landlocked countries and the remote hinterlands of coastal countries by promoting the wider use of intermodal transport and the development of supporting infrastructure - in the form of freight intermodal interfaces and inland ports. Similarly, it considers the advantages of intermodal interface development in terms of stimulating economic growth in regions and countries located far from seaports.
1.7 In particular, the study:
identifies and defines the most suitable forms of infrastructure for this purpose (Chapter 2);
evaluates the role of intermodal transport in optimizing supply chain costs in the region (Chapter 3);
reviews progress in the development and application of intermodal transport and intermodal interfaces in the UNESCAP region (Chapter 4);
reviews international best practices in the application of intermodal transport, intermodal interfaces and logistics management outside of the UNESCAP region (Chapter 5);
develops and recommends guidelines for the design, financing and establishment of intermodal interfaces in inland areas (Chapter 6);
recommends an approach to the measurement of the net economic benefits of intermodal interfaces (Chapter 7); and
recommends policy initiatives and offers guidelines for consideration by governments of the region to formulate their own programmes of action for the expanded application of intermodal transport practices and systems (Chapter 8).
_________

3
Chapter 2. Freight intermodal interfaces: definitions
2.1 Trade growth and development of inland trade distribution systems
Many countries within the UNESCAP region depend on their hinterlands as a source of foreign trade. Rapidly increasing foreign trade in many of these countries, especially over the past decade, has generated a requirement for long distance transport feeder services between major inland trade generating centres and the seaports. Further, the emergence of the landlocked economies of Central Asia after the break-up of the Soviet Union has generated a requirement for the connection of the sources of trade within these countries and seaports in neighbouring countries. Since the distances involved tend to be substantial, rail which can offer cost efficiency over distances greater than 300 km is assuming an increasingly important role in trade feeder transport. It is being supported in this role by truck transport which assumes a local feeder role, involving the local distribution of traded commodities between principal inland transfer stations and the trade originating and terminating locations, designated as Trade Generating Locations (TGL). Effectively these facilities operate respectively as “hub” and “spoke” facilities, as shown in Figure 2.1.
Figure 2.1: Inland trade distribution system
han
Principal inland transfer and consolidation/
de-consolidation station
TGL 1 TGL 2
TGL 3
SEAPORT
Rail or Inland Waterway Transport (possibly also Long Distance Road Haulage): distance 300 km
Local road transport distance, no more than 20-30 km from principal inland transfer station
Note: TGL = trade generating location

4
It is important to note that inland distribution systems of the type illustrated in Figure 2.1 may be, and are being, developed for the handling of all types of cargo, i.e. containerized, non-containerized break-bulk and bulk cargoes – not just for containerized cargoes, although these tend to dominate the composition of foreign trade.
Different types of inland distribution facilities offering a range of different services will be required depending on the type of cargo to be transported. However, all share the common characteristic that their main functions are to complete customs formalities for traded cargo and to transfer this cargo between the different modes used for transportation between a port origin and an ultimate inland destination, or vice versa. The following section provides descriptions of the facilities and services provided by the most commonly encountered inter-modal transfer terminals which are being evaluated in this study.
2.2 Intermodal transfer terminals : descriptions of facilities and services
The focus of this study is on intermodal interface which process border crossing trade and which therefore provide full customs service (i.e. will be staffed by customs inspection personnel on a full-time basis during the operating hours of the facility). Three types of intermodal interface meet these criteria by providing comprehensive services for the processing and intermodal transfer of traded cargo: Dry Ports (DP); Inland Container Depots (ICD); and Freight Villages (FV). In addition to these comprehensive facilities, there are smaller specialized service facilities, such as Container Yards (CY) and Container Freight Stations (CFS) which may either operate as stand-alone facilities or as components of the larger comprehensive facilities. If such facilities operate on a stand-alone basis it is likely that they will be located close to ports and will provide a means of relieving pressure on port facilities. In such cases, it is most unlikely that they would have a permanent customs presence (since this function would be available from the ports).
Dry Ports and ICDs are the most usually encountered facilities in the region which provide comprehensive services to foreign trade. They are distinguished by the fact that whereas ICDs are restricted to processing container traffic, Dry Ports have facilities which allow them to process all forms of cargo.
A third type of intermodal interface, the Freight Village, is gaining increasing acceptance in Europe under this appellation. It also provides comprehensive services related to customs clearance, modal transfer, container stuffing and destuffing, and container and cargo storage, but in addition provides added value logistics services, such as inventory management, high density warehousing, and packaging on behalf of manufacturing, retailing and wholesaling customers. Necessarily, Freight Villages will be located in areas of high demand and will be served by multiple transport modes.
The characteristics of the various inland cargo distribution systems are described in Table 1 and are summarized in Table 2 below.

5
Table 1: Characteristics of different inland cargo distribution systems
Served by ( mode) Type/Brief Description Location Component Facilities Types of cargo handled Linehaul Local
Feeder
Services provided
1. Dry Port (DP). As the name implies, a “Dry Port” provides all of the services of a port except for the loading of cargo to and from seagoing ships. It may be distinguished from an ICD (below) in that it can accommodate all types of cargo, whereas an ICD specializes in the handling of containers and containerized cargo
Usually remote from seaport(s), but close to trade sources.
Examples:
Malaysia - Padang Besar (572 km from Port Klang; 158 km from Penang Port; 339 km from Surat Thani); Ipoh, Nilai and Segamat
Pakistan – Lahore (1,220 km from Port of Karachi);
CY (with or without reefer points)
CFS Access roads,
railway link and sidings, IWT berths
Breakbulk receiving/storage area (open)
Warehouses, bonded and unbonded (for storage of breakbulk cargo)
Bulk receiving and storage area
Administrative office with space for banks, forwarders and cargo agents
Customs office Container light
repair facility Secure fence and
entry point Cargo handling
equipment (RTGs,RMGs,reach-stackers, empty lifters, forklifts, container chassis, prime movers)
Containers international and domestic (ISO and non-ISO)
Breakbulk freight for unloading from or loading into containers
Non- containerized breakbulk freight (e.g. steel, general merchandise on pallets, bagged cement)
Bulk freight *(construction materials including cement, coal, fertilizer, chemicals etc)
Rail (most)
IWT (some)
Road (some)
Road Container handling and storage
Container stuffing and destuffing
Breakbulk cargo handling and storage
Bulk cargo handling and storage
Customs inspection and clearance
Container light repairs
Freight forwarding and cargo consolidation services
Banking/insurance/financial services

6
Table 1: Characteristics of different inland cargo distribution systems (continued)
Type/Brief Description Location Component Facilities Types of cargo handled
Served by ( mode) Services provided
2. Inland Container Depot (ICD) A container terminal located inland from seaport(s), which offers services for the handling, temporary storage and customs clearance of containers and general cargo that enters or leaves the ICD in containers. In essence an ICD has the same functions as a port container terminal except ship to shore transfere.
Usually remote from seaport(s), but close to trade source(s).
Examples:
India - 34 rail served and 4 road served in hinterland (largest Tuklakabad in Delhi, which is 1,510 km from Mumbai area ports);
Malaysia - Prai (Penang) and Seri Setia;
Thailand - Lat Krabang (118 km from Laem Chabang Port; 1,017 km from Padang Besar);
China - Russia
CY (with or without reefer points)
CFS Access roads,
railway link and sidings, IWT berths
Warehouses, bonded and unbonded (for short term storage of breakbulk cargo)
Administrative office with space for banks, forwarders and cargo agents
Customs office Container light repair
facility Secure fence and
entry point Cargo handling
equipment (RTGs,RMGs,reach-stackers, empty lifters, forklifts, container chassis, prime movers)
Containers international and domestic (ISO and non-ISO)
Breakbulk freight for unloading from or loading into containers
Road (all) Rail (some) IWT (some)
Container handling and storage
Container stuffing and destuffing
Breakbulk cargo handling and storage
Customs inspection and clearance
Container light repairs Freight forwarding and
cargo consolidation services
Banking/insurance/financial services

7
Table 1: Characteristics of different inland cargo distribution systems (continued) Type/Brief Description Location Component Facilities Types of cargo
handled Served by ( mode) Services provided
3. Freight Village Depot (FV) An area within a secure perimeter in which all activities relating to transport, logistics and distribution of goods, both for national and international transit, are carried out by various operators.
In the heart of major manufacturing and trade generating cities. Can be on the coast or in the inland, but usually close to major highway/railway intersections and often on the perimeter of airports.
Examples:
None in Asia, but some 40 throughout western and southern Europe. Multimodal International Hub with road rail and air transport connections at Nagpur, India has potential to be developed as Freight Village
CY (usually with reefer points)
CFS Access roads,
railway link and sidings, IWT berths
Warehouses, bonded and unbonded (for short term storage of breakbulk cargo)
High density warehouses for longer term storage of cargo on behalf of manufacturing, retailing or wholesaling customers
Administrative offices with space for banks, forwarders and cargo agents
Customs office Container light repair
facility Secure fence and
entry point Cargo handling
equipment (RTGs,RMGs,reach-stackers, empty lifters, forklifts, container chassis, prime movers)
Containers international and domestic (ISO and non-ISO)
Breakbulk freight for unloading from or loading into containers
Non-containerized breakbulk freight (usually carried on pallets in swap bodies or high cube vans)
Road Rail Air IWT (some)
Container handling and storage
Container stuffing and destuffing
Breakbulk cargo handling and storage
Customs inspection and clearance
Container light repairs Freight forwarding and cargo
consolidation services Banking/insurance/financial
services Value added warehousing,
inventory management and packaging/materials handling services

8
Table 1: Characteristics of different inland cargo distribution systems (continued)
Type Location Component Facilities Types of cargo handled Served by ( mode) Services provided
4. Container Yard (CY)
An open paved area for the storage of laden and empty containers.
May be stand alone facility, usually close to seaport(s) or component facility of DPs or ICDs which are usually remote from seaport(s).
Examples of stand alone facilities:
Thailand – some 15 road served facilities in Bangkok
Paved container storage area (with or without reefer points)
Access roads, rail access lines and sidings, or IWT berths as appropriate
Administrative office for stand alone CY facility
Secure fence and entry point
Empty and loaded containers
One or more modes
Container handling, storage and inter-modal transfer-bonded cargo

9
Table 1: Characteristics of different inland cargo distribution systems (continued)
Type Location Component Facilities Types of cargo handled
Served by ( mode) Services provided
5. Container FreightStation (CFS)
A common user facility providing services for the stuffing and destuffing, transshipment and temporary storage of container cargoes.
May be stand alone facility, usually close to seaport(s) or component facility of DPs or ICDs which are usually remote from seaport(s).
Examples of stand alone facilities:
Thailand – some 15 road served facilities in Bangkok
Under cover facility for stuffing/destuffing of containers
Access roads,
Bonded warehouse for cargo in transit or awaiting clearance
Unbonded warehouse for short term storage of breakbulk cargo
Administrative office for stand alone CFS facility (unlikely to provide space for banks, forwarders and cargo agents)
Breakbulk freight for unloading from or loading into containers
Road Stuffing and destuffing of international and domestic ISO.and non-ISO containers
Cargo customs inspection and clearance
Short term storage of bonded cargo (unlikely if stand alone facility)
Short term storage of un-bonded cargo
Limited freight forwarding, cargo consolidation and banking services

10
Table 2: Characteristics of different inland cargo distribution systems (summary table)
Proximity to seaport(s)
Component facilities Types of cargo handled Type
Remote Near CY CFS B/bulk storage (open)
Bonded Storage (b/bulk)
Unbonded Storage (b/bulk)
Bulk storage
Admin office
Customs office
Cont. light repair facil.
Cont. Int’ll
Cont. Dom.
B/bulk cont.
B/bulk Non- cont.
Bulk
DP ICDFV CY (stand alone) CFS (stand alone)
Served by (mode) Services provided Type Road Rail IWT Air Container
handling and storage
Container stuffing and destuffing
Non-containerized breakbulk cargohandling and storage
Bulk cargo handling and storage
Customs inspection and clearance
Container light repairs
Freight forwarding and cargo consolidation
Banking/financial services
HD storage, inventory
management and materials
handling
DP ICDFV CY (stand alone) CFS (stand alone)
(limited)
_________

11
Chapter 3. Role of intermodal transport in optimizing supply chain costs in the UNESCAP region
3.1 Importance of enhanced logistics
While most countries of the UNESCAP region have experienced a rapid growth in their foreign trade in recent years (especially within the past decade), maintenance of a robust trade performance in future will rely more heavily on the availability of adequate logistics infrastructure and on the adoption of modern systematic approaches to logistics management.
The Chartered Institute of Logistics and Transport has defined logistics management as:
Getting the right product to the right place in the right quantity at the right time, in the best condition and at an acceptable cost… It's an area that embraces purchasing and supplier management, materials management and manufacturing, inventory management and warehousing, distribution and transport, and customer service.1
The objective of logistics management is therefore to optimize the costs of the supply chain, which includes storage, inventory control, distribution and transport. Assertive measures to improve the quality of a country’s logistics system will usually be rewarded with improved access to international markets and increased foreign trade, as well as to higher incomes and poverty reduction.
3.2 Relationship of logistics, trade and incomes
There is a wide body of research which has succeeded in establishing a relationship between reduced logistics costs and trade growth. For example, Hummels (1999) estimated that exporters in East Asia who were able to achieve a one per cent reduction in their shipping costs could realize a 5-8 per cent increase in their market shares.2 Almost identically, a recent study of operational efficiency in the South Asia Subregional Economic Cooperation (SASEC) Corridor used a gravity model based on tariff reduction to estimate that a 1 per cent reduction in transport costs would produce a 5 per cent expansion in trade.3On the other hand, Limao and Venables (2001) concluded that differences in infrastructure quality account for 40 per cent of the variation in transport costs for coastal countries, but up to 60 per cent for landlocked countries.
The relationship between improved access to international markets and higher incomes was addressed by Redding and Venables (2002) who concluded that 70 per cent of the variation in per capita income across countries can be explained by the geography of the market and supplier access to this market. Better access to coasts alone was found to increase incomes by 20 per cent.
In another highly significant study which compared several regions of China, Wei and Yi (2001) showed that trade levels, trade growth and income growth all decline as distance from
1 Website of the Chartered Institute of Logistics and Transport: www.ciltuk.org.uk/pages/whatlogistics.2 Carruthers, Bajpai and Hummels, Trade and Logistics: An East Asian Perspective in East Asia Integrates: A
Trade Policy Agenda for Shared Growth, World Bank, 2005.3 Padeco Consultants, TA No 6112-REG: South Asia Subregional Economic Cooperation (SASEC): Subregional
Corridor Operational Efficiency Study, Draft Final Report Volume III, July 2004.

12
coastal areas increases. The results of this study demonstrate above all the importance of good access to international markets for inland regions.
3.3 Scope for improvement of logistics within the region
The exceptionally high rates of economic growth fuelled by trade growth in China and India within the past decade have emphasized the weaknesses in both the quality and geographical coverage of the logistics services and facilities of the UNESCAP region’s two largest countries. This is not to say that other countries are not also facing deficiencies in their logistics systems and indeed such deficiencies exist throughout every sub-region. However, the problems are accentuated in China and India as a result of their sheer geographical size and their burgeoning economies.
It has been estimated that in China logistics costs account for as much as 21 per cent of national GDP, which is about twice their share of GDP in the United States, Japan and most European countries.4 A recent study for the World Bank concluded, that, on the basis of interviews with freight forwarders in the interior of China, inland transport costs can account for nearly two thirds of the total transport costs from Chinese producers to overseas markets.5 Similarly, in India the average land freight cost has been estimated at more than double that in some developed countries, with an average rate for India at US$ 0.07 per tonne-km, as compared with only US$ 0.02 in Canada, US$ 0.037 in Japan and US$ 0.055 in France.6
The comparative disability experienced by China and India in terms of their high logistics costs is largely explained by the absence, up until recently, of adequate cargo handling infrastructure and distribution services in the principal inland trade generating regions of both countries.
To a major extent, this has reflected the absence of third party logistics providers (3 PLs) which can offer high quality logistics services, including the coordination of all distribution activities on behalf of customers and in many cases can invest in the provision of warehousing and transport facilities. In the United States and Europe, most of the logistics needs of consumer goods firms are outsourced to specialized third party logistics providers, whereas it is estimated that up until recently 3 PLs have handled only about 16 per cent of final product distribution volume in China.7 However, their share of the total distribution task has been growing rapidly following the lifting in December 2005 of foreign ownership restrictions on freight forwarding, express courier, road transport and warehousing and storage services.
Throughout Asia, there is an increasing recognition by consumer goods companies in particular that the outsourcing of their logistics requirements to 3 PL operators can mean significantly lower supply chain costs.
4 Deloitte and Touche (Chinese Services Group), The Yangtze Transport Corridor, July 2006 5 Carruthers, Bajpai and Hummels (2005). Data derived from inland surveys showed that the total cost of moving
a twenty foot container from Chongqing to a final destination on the US West Coast in 2002 was about US$ 3,650, of which US$ 2,300 (63 per cent) represented the cost of land transport to a Chinese Port.
6 G. Vaidyanathan, Current Status of Logistics in India in PIANC Magazine No. 126, February 2007. 7 Morgan Stanley quoted in USDA Foreign Agricultural Service, China Logistics Profile, 18 December 2003.

13
3.4 Exploiting modal complementarity for inland trade distribution
The presence of major trade sources in the interior of many countries of the region, as well as the landlocked nature of some countries, generates a need for cost- effective land transport (or where possible water transport) connections between inland trade sources and the nearest seaports.
In assuming responsibility for coordination of the inland trade distribution task (including the organization of inland transport) on behalf of trading customers, specialized logistics service providers will have the ability to mix and match modes in order to optimize the cost of distributing trade between inland origins/destinations and the seaports. Inevitably, however, the greater the haulage distance, the greater the probability that cost optimization will be achieved by using rail or inland waterway transport (if this option is available) for the major inland transport, or terminal to terminal, task and road transport for the local distribution task. This observation stems from knowledge about the relative behaviour of railway and road transport costs over varying distances and with varying transport volumes.
A study of the relative infrastructure and operating costs of moving containers by rail versus road transport was recently undertaken for a national transport plan, in order to determine the distance and annual transport volume at which rail unit costs would begin to fall below those of road transport. Based on a relatively low productivity operation of single tier container trains each carrying 100 TEU and of container semi-trailers each carrying 2 TEU, it was determined that the “breakeven” point at which rail unit costs would begin to fall below those of road would be about 500 km, but only for very high transport volumes (See Figure 3.1).
Figure 3.1: Road/rail container freight breakeven analysis - Low rail productivity case
Source: Third National Transport Plan, Kingdom of Saudi Arabia, Volume 5, February 2004.
0
0.05
0.1
0.15
0.2
0.25
0.3
0.35
0.4
0.45
0.5
0.55
0.6
0.65
0 200 400 600 800 1000 1200 1400 1600
Distance (Km)
Ope
ratin
g an
d in
frast
ruct
ure
cost
(SR
per
tonn
e-km
)
Rail - 500,000 tonnes p.a.
Rail - 1.5 million tonnes p.a.
Rail - 3.0 million tonnes p.a.
Rail - 7.0 million tonnes p.a.
Truck - 500,000-7.0mill.tonnes p.a.
Power (Rail - 500,000 tonnes p.a.)
Power (Rail - 500,000 tonnes p.a.)
Power (Rail - 1.5 million tonnes p.a.)
Power (Rail - 3.0 million tonnes p.a.)
Power (Rail - 7.0 million tonnes p.a.)
Power (Rail - 500,000 tonnes p.a.)
Power (Truck - 500,000-7.0mill.tonnes p.a.)

14
When a more efficient rail operation is assumed, involving operation of double tier container trains (each carrying up to 360 TEU), the point of breakeven with road transport reduces to only 200-300 km, depending on the annual transport volume, as is shown in Figure 3.2.
Figure 3.2: Road/rail container freight breakeven analysis - High rail productivity case
0
0.05
0.1
0.15
0.2
0.25
0.3
0.35
0 200 400 600 800 1000 1200 1400 1600
Distance (Km)
Ope
ratin
g an
d in
frast
ruct
ure
cost
(SR
per
tonn
e-km
)
Rail - 500,000 tonnes p.a.
Rail - 1.5 million tonnes p.a.
Rail - 3.0 million tonnes p.a.
Rail - 7.0 million tonnes p.a.
Truck - 500,000-7.0mill.tonnes p.a.
Pow er (Rail - 500,000 tonnes p.a.)
Pow er (Rail - 500,000 tonnes p.a.)
Pow er (Rail - 1.5 million tonnes p.a.)
Pow er (Rail - 3.0 million tonnes p.a.)
Pow er (Rail - 7.0 million tonnes p.a.)
Pow er (Rail - 500,000 tonnes p.a.)
Pow er (Truck - 500,000-7.0mill.tonnes p.a.)
Source: Third National Transport Plan, Kingdom of Saudi Arabia, Volume 5, February 2004.
While it is reasonable to expect some inter-country variation in these results, owing to differences in local operating and cost conditions, they nevertheless suggest that a better cost result will be achieved if the use of rail for long hauls of containers between inland terminals and the ports can be combined with the use of road for local distribution of deconsolidated cargo to and from inland terminals.
Actual container haulage operations within the region tend to reinforce the above conclusion. For example, the rail haulage of some 400,000 TEU of containers (more than 4 million tonnes) per year between New Delhi (Tughlakabad ICD) and Mumbai Ports, a distance of some 1,500 km, is likely to be achieved at a relatively low linehaul cost, as is the rail haulage of containers over 1,200 km between Lahore Dry Port and the Port of Karachi. However, there are some exceptions to the rule that in general rail haulage of containers can optimize costs only over longer distances. For example, in 2006 the State Railway of Thailand (SRT) carried about 430,000 TEU (more than 4.3 million tones) between Lat Krabang ICD and Laem Chabang Port, a distance of only 118 km, demonstrating perhaps that rapid train turnarounds over short distances can achieve acceptable operating economy at high levels of traffic. By contrast, there are examples where road hauliers are moving containers over distances which would normally suggest the use of rail – for example over 800-1,000 km between the Baltic Ports and Moscow – but in some cases these aberrations are explained by the absence of suitable inland container handling facilities for rail.
In other cases, the combination of short haulage distances and low traffic volumes tend to suggest that it might be very difficult to sustain rail haulage of containers between the ports and inland trade generating centres. One such case is that of the container haul between the Port of Sihanoukville and Phnom Penh in Cambodia, a distance of only 230 km. The fact that
15
the port handles only about 210,000 TEU per year, most of which is directly road hauled to and from consignee/consignor premises in Phnom Penh, makes it unlikely that a rail haulage service integrated with local trucking can provide a competitive level of cost. Nevertheless, the imminent restoration of the missing rail link between Cambodia and Thailand8 could well change the outlook for intermodal container services to and from Phnom Penh.
3.5 Importance of measuring logistics performance
Geography adds dramatically to the development challenges. In some cases, long distances within individual countries create vast far-away hinterland areas, such as in China, India or the Russian Federation. In other cases, the fact of being landlocked poses an even greater challenge, especially as these countries are also often categorized as Least Developed Countries. In 2007, the World Bank estimated that an inland location frequently results in high trade transaction costs, with logistics costs accounting for 30% of the GDP of Landlocked Least Developed Countries, i.e. double that of other emerging economies and three times that for developed countries.
Until recently solutions mainly focused on addressing these high costs by improving infrastructure and cross-border cooperation. However, in many cases, the lack of infrastructure is no longer a binding constraint and cross-border cooperation has improved thanks to a number of policies promoting a corridor-based approach. Efficient door-to-door transit nevertheless remains exposed to a number of potential weaknesses such as inter alialack of adequate intermodal facilities, insufficient access to these facilities, and difficulty to acquire land at a reasonable price for their development.
To deal with the issue of efficient transit and highlight bottlenecks in the process, the World Bank has launched a “Logistics Performance Index” (LPI) initiative. The index is based on a survey of operators on the ground worldwide (global freight forwarders and express carriers), combining in-depth knowledge of the countries in which they operate with informed perceptions of other countries with which they trade, and experience of global logistics environment. The Bank supplements the information with data on the performance of key components of the logistics chain in the home country. The LPI is the simple average of the country scores on the following seven key indicators:
(i) efficiency and effectiveness of the clearance process by Customs and other border control agencies;
(ii) quality of Transport and IT infrastructure for logistics;
(iii) ease and affordability of arranging shipments;
(iv) competence in the local logistics industry (e.g., transport operators, customs brokers);
(v) ability to track and trace shipments;
(vi) domestic logistics costs (e.g., local transportation, terminal handling, warehousing); and
(vii) timeliness of shipments in reaching destination.
With transport-related cost affecting an industry’s productivity and competitiveness, corporate executive officers will locate units where the “dead weight” cost of inefficient transport and logistics has the “least-felt” impact. In this regard, the Bank already highlighted in the past the high standards that multi-national corporations have for the logistics performance of each
8 The Asian Development Bank is providing loan assistance for the rehabilitation of the Cambodian Railway (including restoration of the Cambodia to Thailand railway link).

16
country and stressed the relationship between a country’s logistics performance and its ability to attract foreign investment9.
__________
9 “The Role of Logistics in Stimulating Economic Development”, logistics seminar, Beijing, November 1999.
17
Chapter 4. Recent experience of intermodal facilities and intermodal freight transport development in the UNESCAP region
This section outlines the experience of the countries of the UNESCAP region with the establishment and operation of freight intermodal facilities within the four corridors of the Trans-Asia Railway (TAR), viz:
Northern Corridor (Northeast Asia to Western Europe, via China, Mongolia, Kazakhstan and the Russian Federation);Southeast Asian Corridor (Singapore to Kunming, China via Malaysia, Thailand, Cambodia, Viet Nam and Myanmar);North-South Corridor (countries of Central Asia and Caucasus region to Persian Gulf);Southern Corridor (Kunming, China to Western and Southern Europe, via Myanmar, India, Bangladesh, Pakistan, Islamic Republic of Iran and Turkey)
The future demand for inland freight handling facilities is more likely to be driven by the growth of foreign trade within the relevant corridors rather than, for example, by the growth of transit trade between origins in Asia and destinations in Europe, or vice versa. This is because inland trade generating locations, whether they rely on shipping, rail or road transport for the movement of trade consignments from or to ultimate origins or destinations will require facilities for the local consolidation and modal transfer of these consignments. Transit trade will only require en-route freight handling facilities if there is a need to reconsolidate consignments at borders or to transship between different modes or between differing track gauges (as is the case at China’s borders with Kazakhstan, Mongolia and the Russian Federation). Thus the focus of this chapter is on the development and operation of customs-served inland freight handling facilities within each of the relevant corridors.
4.1 Northern corridor
4.1.1 China
Border crossing trade is being carried across five routes of the TAR Northern Corridor in China. These are: Lianyungang or Qingdao Port to Alashankou (border between China and Kazakhstan); Tianjin Port to Erenhot (border between China and Mongolia); Dalian Port to Manzhouli (border between China and the Russian Federation); Border with DPRK at Namyang to Manzhouli; and Border with DPRK at Dandong to Beijing.
Of these five routes, only the first three are understood to be carrying significant volumes of border crossing trade. The importance of these routes is that in addition to providing conduits for international transit trade, they also serve vast industrialized hinterlands in the north and northeast of China which are a source of much of the country’s foreign trade. In particular, they connect these hinterlands with one or more of four seaports accounting for a significant share of China’s flows of foreign trade. These four seaports are: Lianyungang (Jiangsu Province); Qingdao (Shandong Province); Tianjin (Tianjin Province); and Dalian (Liaoning Province). In 2007, these four ports handled container traffic amounting to more than 22 million TEU, and achieved year-on-year growth of around 22 per cent in their container throughputs.
Details of the port and hinterland connections, as well as the inland cargo handling facilities of these three significant TAR routes are given in Table 4.1 below.

18
Table 4.1: Intermodal transport capability of main TAR routes in China
Customs-served inland cargo handling facilities TAR route Primary portconnections
Hinterland connections Location/
(number) Type Served by
(mode) Annual throughput, TEU/tonnes
Lianyungang Port to Alashankou
Lianyungang
Qingdao
Shandong Jiangsu Lanzhou Urumqi Bengbu Xian Zhengzhou
Hebei Shanxi Shandong
Cangzhou Handan Tangshan Quinghuangdao (all Hebei Prov) Total: 4
ICDICDICDICD
Road, Rail Road, Rail Road, Rail Road, Rail
}} Approx. } 70,000 TEU* }
Tianjin Port to Erenhot
Tianjin Beijing
Heibei
Inner Mongolia
Chaoyang Inland Port Feng Tai Wulidian
Erenhot
Ceke Ganqinmaodao Jining Hohot Baotou Bayannao’er Linhe Total: 10
ICD
DP?
DP
DPDPICDICDICDICDICD
Road
Road, Rail
Road, Rail
Road, Rail Road, Rail Road, Rail Road, Rail Road, Rail Road, Rail Road, Rail
160,000 TEU
Not known
3.5 mill.tonnes/ 23,000 TEU 878,000 tonnes 80,100 tonnes Not known Not known Approx. 12,000 TEU Not known Not known
Dalian Port to Manzhouli
Dalian Liaoning Jilin Heilingjiang
Inner Mongolia
Harbin
Manzhouli Total: 2
DP
DP
Road, Rail
Road, Rail
Not known
10.89 mill.tonnes
Total 16
Sources: 1. World Bank: Implementation Completion Report on Loan for Container Transport project (2005)
2. ADB Technical Assistance Consultant’s Report, Inner Mongolia Autonomous Region – Logistics Development Strategy, September 2006
3. Integrated Shipping website: www.islcn.com
Despite significant progress over the past decade in the establishment of inter-modal freight terminals, northern China remains seriously deprived of adequate logistical facilities and services to support its surging volume of foreign trade. Within Beijing, for example, there are only two inland terminals (other than the airport) which can process container trade: a road served ICD, the Beijing Chaoyang Inland Port, with a current throughput of about 160,000 TEU per year and a rail freight terminal at Feng Tai Wulidian, which handles both international and domestic cargo (including both container and non-container cargo).10
Of the administrative regions of northern China, the Autonomous Region of Inner Mongolia is best equipped with intermodal terminal facilities. There are three dry port facilities located along the border with Mongolia (at Erenhot, Ceke and Ganqimaodao) and another dry port
10 Integrated Shipping website www.islcn.com

19
on the border with the Russian Federation at Manzhouli. In addition, ICDs have been established at four major centres within the Autonomous Region (Jining, Hohot, Baotou and Bayannao’er).
By contrast, the far northeast region, comprising the provinces of Heilongjiang, Jilin, and Liaoning remains undersupplied with intermodal terminal facilities, with only one facility, the Harbin Inland Port which entered service in 1997, appearing to offer comprehensive logistical services (including customs inspection and clearance) on an adequate scale. It is likely that the foreign trade transport needs of this region are currently being met by non-container transport or by stuffing/destuffing of containers in the Port of Dalian, but this would be at a significant additional cost.
China’s widespread distribution of population and economic activity across a vast geographical area suggests that the development of an adequate inland trade distribution system will depend crucially on an improvement of the inter-modal transport capability of the national rail system, especially for the long distance transportation of containers.
The extent of the required improvement can be seen from the fact that container transport volume now accounts for only 3 per cent of all railway freight volume and from the observation that a major investment in expanding the container handling capacity of the railway network will be required if this share is to be increased. While it has been claimed that some 600 railway stations throughout China are available for container loading and unloading11, in reality most of these facilities lack adequate equipment for container handling and, in any case, do not provide customs inspection and clearance services for the duration of the station operating hours.
Within the past decade, initiatives taken by Chinese Railways, alone or in collaboration with railway organizations and freight forwarding companies in neighbouring countries, have shown what is possible in terms of the development of efficient intermodal services by rail. Two such initiatives are the inauguration of a container block train service between Hong Kong and Beijing, and, in June 2007, the trial run of a train of fifty-two 40’ containers with computer components from Shenzhen to Pardubice, near Prague in the Czech Republic. The train covered the 12,220-km distance in 17 days.
Other initiatives recently taken to advance China’s transformation into a country with a modern logistical system have included:
A container transport project initiated by the World Bank in December 1999, which resulted in the construction by 2003 of 8 ICD facilities, of which 5 (Cangzhou, Handan, Tangshan and Quinghuangdao in Hebei Province and Baotou in the Autonomous Region of Inner Mongolia) are located within the TAR Northern corridor.12 A post-completion review of this project indicated that it had failed to meet its objectives in terms of volume generation but had contributed to an increase in the value of foreign trade in the target locations.
The creation in late 2003 of the China Railway Transportation Company, with a brief to undertake the specialized management and administration of railway container transport in China.
A programme launched by the Ministry of Railways in 2003 to invest with joint venture private partners in the construction of 18 new inland hub container handling facilities
11 Proceedings of the Eastern Asia Society for Transportation Studies, 2005, Vol 5, pages 304-315: On the Task assignment and Management Mode of Railway Network Container Freight Stations.
12 World Bank Report No. 33620: Implementation Report on a Loan in the Amount of US$ 71 Million to the People’s Republic of China for a Container Transport Project, 18 November 2005.

20
throughout China. These facilities will be developed and subsequently operated by a special-purpose entity set up by the Ministry of Railways in 2007. This entity, China United International Rail Container Co., Ltd., involves a number of outside investors among which China International Marine Containers (Group) Co. Ltd. owning 10 per cent of the equity and Hong Kong-based NWS Holdings Ltd. and Promisky Investment Ltd. controlling 22 per cent and 10 per cent of the shares, respectively. Three international investors are also active in the joint venture; they are: France’s shipping company CMA CGM, Germany’s state railway group, Deutsche Bahn, and Israel’s shipping firm Zim, each owning 8 per cent of the stock. The remaining and dominant 34 per cent is in the hands of CRTC. The facilities are to be developed by 2010 at an overall cost of US$ 2 billion. Two terminals have already been inaugurated in Kunming and Shanghai, while four more are under construction at Chongqing, Zhengzhou, Qingdao and Dalian. Finally, the remaining 12 are under planning and are to be located in Beijing, Chengdu, Guangzhou, Harbin, Lanzhou, Ningbo, Shenyang, Shenzhen, Tianjin, Urumqi, Wuhan and Xi’an.13 Each facility will reportedly be among the largest freight stations in Asia covering an area of 6-12 sq. km (1,500-3,000 acres) each and with the capacity to handle between 200,000 to 300,000 containers a year14.
The hub facilities to be built by the Railway organization and its private sector partners will provide comprehensive container and container cargo handling services, including15;
Container receiving and dispatching; Customs declaration; Container loading and unloading; Cargo consolidation; Warehousing and storage; Container repair; Transshipment (i.e. both inter-modal transfer and where relevant inter-gauge
transfer); Customs clearance and inspection; Container trucking; Distribution and logistics; International Freight Forwarding; Intermodal transportation; and Contracting of container block train service.
The operating economy of the proposed new facilities will be enhanced considerably once they are connected by double stack container train services to and from the main coastal ports. In 2007, Chinese Railways operated 680 double-stack trains, up from 454 trains in 2006, which carried 53,161 TEU, up from 39,437 TEU in 2006. These services which are confined to domestic routes (Table 4.2) have been made possible by the introduction of new specialized wagons and the development of more powerful locomotives.
13 Ministry of Railways of China and Containerisation International, “On the gravy train”, July 2008. 14“The Yangtze River Transport Corridor”, Deloitte & Touche USA LLP, July 2006. 15 Press Release by NWS Holdings, Hong Kong, 28 September 2006: NWS Holdings to Develop and Operate
Large-scale Pivotal Rail container Terminals in Mainland China.

21
Table 4.2. Double-stack container services operated by Chinese Railways (2007)
2006 2007 From To Number of
TrainsNumber of
TEUs Number of
Trains Number of
TEUsDahongmen Yangpu 141 16,687 136 13,457 Wuxi South Dahongmen 132 7,679 137 9,432
Zhengzhou East Huangdao 93 7,779 219 17,000 Huangdao Zhengzhou East 88 7,292 188 13,272
Total: 454 39,437 680 (+ 49.8%)
53,161 (+ 34.8%)
Source: Chinese Railways
4.1.2 Democratic People’s Republic of Korea
It is understood that no container handling facilities exist outside of the main ports in the Democratic People’s Republic of Korea.
4.1.3 Kazakhstan
Given Kazakhstan’s vast territory, low population density and uneven spatial distribution of production centres and natural resources, efficient transport plays a crucial role in the development of the country’s freight-intensive economy. As a result, an extensive network of container handling stations was built at key population and production centres in the cities of Aktau, Aktobe, Almaty, Astana, Atyrau, Dostyk, Karaganda, Kokshetau, Kostana ,Kyzylorda, Oskemen, Pavlodar, Semei, Shymkent, Taldykorgan, Uralsk, and Zhambyl. Formerly managed by Soviet Railways, the terminals fell under the management of Kazakhstan Railways in 1991 before being transferred to the state enterprise “Kedentransservice” founded in December 1997 under the purview of the Customs Committee of the Ministry of Finance.
In 1999, Kedentransservice was restructured into a 100% state-owned closed joint stock company controlled by the Ministry of State Revenues before being transferred back to the National Railway Company “Kazakhstan Temir Zholy” in 2002. Since then it has evolved into its present form of a joint stock company with 33 per cent of shares controlled by Kazakhstan Railways and the rest divided among two private investors, i.e. Helmes Operations of the UK which controls 46.9 per cent of the shares and Transeco-A Locomotive Service which controls 20.1 per cent.
While Kedentransservice has had a relatively monopolistic position as a provider of intermodal facilities, the “Transport Strategy-2015” of the Government of Kazakhstan is adopting a more diversified approach. The Strategy provides for the development of transport-logistic centres along priority routes and at the port of Aktau (Phase I: 2006-2010) and in all major cities and at key railway junctions (Phase II: 2011-2015) under a different kind of management arrangement.
The “Transport Strategy-2015” is supplemented by a decree issued on 25 June 2005 by which the Government of the Republic of Kazakhstan recognized the clustering of Transport Logistics as a priority sector of the economy and approved the development of transport and logistics centres in the country. In line with the Decree, the JSC "Astana-Contract" and "Paragon Development" Ltd., adopted a 5-year plan for the development of a national transport and logistics network, in particular, in the cities of Almaty, Astana, Karaganda, Shymkent, Aktobe (Kandyagash), Dostyk station, Khorgos, and Aktau.

22
The first phase of the plan provides for the development of ICDs in Almaty and Astana cities, for which an investment fund of US$ 96.2 millions has already been approved. The "Astana-Contract" ICD in Almaty with a handling capacity of up to 80,000 TEUs per year, started operation in September 2007. The construction of a transport-logistics centre in Astana was due to start in 2008, while the establishment of an ICD at Dostyk, the rail border crossing point with China, is being considered.
Intermodal development in Kazakhstan is also being driven by private sector and regional authorities (‘oblast’). Some of the most significant projects are summarized hereafter:
In 2008, a consortium of companies "Amanat-invest" is to complete and put in service three industrial and logistic centres in Astana, Almaty and Aktobe.
In the city of Astana, three ICDs of international standards are planned to be built within the territory of the Metropolitan Industrial Park. A US$ 27 million project for a 20-ha ICD, proposed by the "Apple City Llc", has been approved and recommended by the Coordinating Council for the pilot cluster "Construction materials". In addition, "Synergy Cargo" plans to build a Class A ICD “Synergy Astana" covering an area of 2 ha in the proximity of the Ondiris village (Astana).
The Mangistau Oblast Administration plans to expand the Free Economic Zone around the “Sea port Aktau" with the construction of a transport logistics centre. To attract companies to locate at the centre warehousing services will be provided free of charge over a grace period. Land lease agreements are currently being negotiated prior to the start of the construction of the facilities.
The Almaty Oblast Administration is working on the establishment of transport and logistics centres at Pervomaisky and Otegen Batyr in the Iliysk region.
The Aktyubinsk Oblast Administration has developed a project for the establishment of an International Centre for cross-border cooperation at Zhaisan, in the Martuk region at the border with the Russian Federation.
Under the project "Khorgos – the Eastern Gate", a cross-border trade and economic zone with a dry port area of international importance and a transport-logistics centre is to be established at "Khorgos" at the border with China.
Another private investment project will see the development of an ICD at the Mankent station in south Kazakhstan by "Cargo Control Kazakhstan Ltd. Co. " The objective of the ICD is to provide a range of transport options and logistics services for the local cotton industry.
Through Kazakhstan the Northern Corridor also gives access to the other countries of Central Asia. Intermodal developments for other Central Asian countries are highlighted below under the North-South Corridor.
4.1.4 Mongolia
The main border crossing facility for the movement of bilateral and transit trade between Mongolia and China is located at Zamyn Uud on the border with the Inner Mongolia Autonomous Region of China, about 710 km by rail south of Ulaanbaatar. The functions of the border railway station at Zamyn Uud (which is opposite the Chinese border station of Erenhot) include the transfer of rail vehicles, cargo and passengers between the 1,520 mm railway gauge of Mongolia and the 1,435 mm gauge of China, in addition to the transaction of full border crossing formalities. For the passage of cargo, the latter include: border security checks; customs inspection and clearance; and health, agriculture and quarantine inspection.

23
There are limited facilities at Zamyn Uud for crane transfer of containers from wagons of one gauge to wagons of another, as well as bogie exchanging facilities for the transfer of non-container wagons between the gauges and some small warehouses for de-consolidated cargo. These were installed with assistance from the Government of Japan in the early 1990s and are operated and maintained by the International Freight Forwarding Centre, the freight forwarding subsidiary of Mongolian Railway.
In 2006, an ADB study observed that transit traffic from the Russian Federation to China, comprising mainly oil and timber, accounts for 70 per cent of all border-crossing trade through Zamyn Uud16. In addition, in 2007, a container volume of 57,248 TEU was processed in Zamyn Uud en-route to/from the Port of Tianjin. This volume was mostly carried by 267 westbound and 238 eastbound international container block-trains17. Recently, a new Asia-Europe Land bridge service between Hohhot, China and Frankfurt, Germany (a distance of 9,814 km) commenced as a cooperative venture between the Inner Mongolia Hohhot Railway Foreign Economic and Technological Group Co.Ltd and Mongolia’s Tuushin Freight Forwarding Company. The service which can link Jining, Hohhot and Baotou by rail transport to various markets in Western Europe takes 14 days to complete the journey. While railway landbridge costs are higher than the costs of sea transport via Tianjin by about US$ 1,000 per TEU, the addition of inland trucking costs from Hohhot to Tianjin and from Germany to Poland makes the sea route more expensive.
A number of problems with operational procedures and border crossing formalities in Mongolia were identified in the recent ADB study. These include delays caused by crane transshipment of containers and the bogie exchanging of other traffic, by the lack of tariff harmonization between China and Mongolia and by a reported detention of consignments in Zamyn Uud by up to one day owing to the excessive numbers of documents which have to be processed by the Mongolian customs authorities.18
While there is at least one station in Ulaanbaatar at which containers may be stuffed/unstuffed and loaded to/from wagons, the volume of bilateral trade requiring processing is apparently too small to justify permanent customs inspection and clearance services at this location. Given the lengthy transshipment and other operational procedures which must be carried out at the border with China, it is evident that there is a preference to transact all customs inspection and clearance procedures at the border, rather than at the cargo source. Although there is a common railway gauge between Mongolia and the Russian Federation, and hence no requirement for inter-gauge transfer of vehicles and/or cargo at the northern border station of Hoit, there are other lengthy operational procedures to be carried out there (such as locomotive exchanges, brake tests, etc). This may strengthen the argument to continue the transaction of all customs procedures there as well.
4.1.5 Republic of Korea
The majority of the Republic of Korea’s foreign trade is shipped through the Ports of Busan, Gwangyang (located 170 km west of Busan) and Incheon (located 30 km west of Seoul). Busan with 13.3 million TEUs of container throughput in 2007 ranked number 5 among the world’s top container ports. Meanwhile, that same year, Gwangyang and Incheon handled 1.74 million and 1.66 million TEUs, respectively and ranked number 62 and 65. It is likely that Gwangyang will soon be overtaken by Incheon whose TEU throughput has in recent years been growing at 20 per cent per year.
16 ADB TA-6058: Inner Mongolia Autonomous Region: Trade Facilitation and Logistics Development Strategy,September 2006.
17 Ministry of Railways, China. 18 As reported to the ADB consulting team by a Chinese logistics provider.

24
The Korean Maritime Institute has forecast that the total container throughput of the ports of the ROK will grow from 17.5 million TEUs in 2007 to 21.8 million TEUs by 2010, an effective increase of 24 per cent (or nearly 7.5 per cent per annum).19 In 2007, transshipped containers accounted for 35.1 per cent of all TEUs handled by ROK ports. If it could be assumed that this share would also apply in 2010, then the net number of containers in the ROK’s foreign trade would be about 14.15 million TEUs (i.e. 21.8 million less 7.65 million). After adjustment for containers sourced within the vicinity (i.e. within 20-30 km) of the ports, it is this figure which might be expected to drive the demand for inland container handling facilities throughout the ROK in that year.
The container ports of the ROK serve a trade generating hinterland dominated by the capital Seoul, but also including a number of large industrial cities in the central and southern parts of the country. As identified in Table 4.3, six large-scale inland container depots (ICDs) exist, or are under development, to distribute trade between the country’s main ports and the hinterland. All facilities are rail connected both to Busan and Gwangyang ports. All, except Yangsan, which was intended to relieve congestion at Busan, either have or will be provided with full customs service.
Table 4.3: Inland container handling facilities in the Republic of Korea
Sources: (1) Korea Maritime Institute (December 2005). (2) UNESCAP staff
The first of these facilities, the Uiwang ICD, was completed in 1993 with funding provided through a Build-Operate-Transfer (BOT) contract with a private concessionaire (Kyeong-In
19 Korea Maritime Institute: Inland Transport and Logistics in the ESCAP Region – Republic of Korea, China and Uzbekistan Cases, December 2005, page 11.
Region Facility Type
Location Distance from seaport/ capital
Area (m2)
In operation?
(Yes/No)
Estimated annual
throughput capacity
(TEU)
Project Development
Basis
Seoul ICD Uiwang, Kyunggi-do Province
Busan, 400 Km, Gwangyang, 360 km, Seoul, 30 Km
753,127 Yes 1,300,000 BOT
Busan ICD Yangsan, Kyungsanam-do Province
Busan, 30 Km Gwangyang, 161 km Seoul, 400 km
951,940 Yes 1,412,000 BOT
Honam ICD Jangsung, Chollanam-do Province
Busan, 284 km Gwangyang, 132 km Seoul, 270 km
138,843 Yes – in partial
operation, (10 %)
without a customs office.
Expected full
operation by 2010
340,000 BOO
Jungbu ICD Chungboo,Chungchungbuk-do Province
Busan, 274 km Gwangyang, 254 km Seoul, 121 km
277,687 No –expected in operation by 2009
470,000 BOO
Youngnam ICD Chilgok, Kyungsangbuk-do Province
Busan, 127 km Gwangyang, 197 km Seoul, 248 km
171,901 No –construction
started 2004.
Expected in operation by 2009
330,000 BOO
Pajoo ICD Pajoo, Kyunggi-do Province
Busan, 429 km Gwangyang, 443 km Seoul, 54 km
178,513 No – Expected in operation by 2011
230,000 BOO

25
ICD Ltd). Recent traffic data suggest that this facility is now operating close to its designed capacity. Similarly, high rates of throughput growth have resulted in the Yangsan ICD nearing its designed annual handling capacity of 1.4 million TEU.
The Uiwang ICD is designed for container handling by reachstackers in the rail loading/unloading area and by RTG’s (Rubber tyred gantry cranes) in the CY.
4.1.6 Russian Federation
Since the break-up of the Soviet Union, the Russian Federation has experienced high rates of growth in its trade with other countries, especially with countries of the European Union and with China. Although, at first, this growth was slow to be reflected in increased containerization of a magnitude similar to that enjoyed by China, container traffic passing through Russian ports has been growing steadily in the period 2003 - 2007 as shown in the following Table 4.4. In 2007, the total container throughput of the Russian ports serving the foreign trade needs of the country (excluding international transshipment volumes) recorded a year-on-year growth of 28 per cent – a much faster pace than the average rate of growth recorded worldwide – and amounted to 2.9 million TEU. Of this volume: 1.7 million TEU (or 59 per cent) was handled in the Port of St Petersburg; 371,000 TEU (or 13 per cent) in the Port of Vostochny; 342,000 TEU (or 12 per cent) in the Port of Novorossiisk; and 252,000 TEU and 223,000 TEU in the ports of Kaliningrad and Vladivostok respectively. In addition, it must be noted that a still sizable portion of the Russian Federation’s international trade is handled through ports in neighbouring countries, in particular Tallin in Estonia, Riga in Latvia and Hamina, Helsinki and Kotka in Finland. However, overall volumes of containerized freight are still relatively small for a country with the size of the Russian Federation and its GDP growth of 6.30 per cent over the period 1996-200620 (8.10 per cent in 2007). In 2007, the country’s population of 142 million accounted for 0.02 TEU per capita21.
Table 4.4: TEU throughput at major ports of the Russian Federation, 2003-2007 (thousands)
2007 2006 2005 2004 2003
TEU change TEU change TEU change TEU change TEU
St Petersburg 1,709 17.9% 1,500 29.3% 1,121 44.9% 773 19.0% 650
Kaliningrad 252 66.9% 151 34.2% 113 66.1% 72 61.3% 45
Novorossisk 342 51.0% 227 40.1% 162 19.5% 135 185.6% 47
Vostochny 371 27.3% 291 7.1% 272 - 0.2% 273 33.2% 205
Vladivostock 223 52.2% 147 17.7% 125 21.6% 103 n.a.
Total: 2,898 27.9% 2,266 26.4% 1,792 32.2% 1,356
Source: Containerisation International, October 2008
In terms of distribution, Moscow receives and dispatches 80 per cent of the country’s containerized cargo volume but, while the distance between the city and the ports in the northwestern part of the Russian Federation or in neighbouring countries are amenable to the operating economics of rail – i.e. in the range of in the range of 800-1,000 km – the lack of adequate logistical facilities in the city (and indeed throughout the entire major consuming region of northwestern Russia) is an impediment to container handling, exchange and transport by rail 22. As a result, inland container movements from ports in Estonia, Finland
20 The Economist, World in Figures – 2008 Edition. 21 Containerisation International, October 2008. 22 Logistic Centers Badly Needed, in RZD Partner International, September-November 2006.

26
and Latvia are dominated by road transport. The same applies for traffic sourced in the port of Novorossiisk, the Russian Federation’s main container port on the Black sea.
Rail container business in the Russian Federation occurs mostly along the Trans-Siberian main line (TSR). Traffic is sourced in the ports in the Russian Far-East region as well as at connecting points along the route via feeder lines from China, Kazakhstan and Mongolia. In 2007, container traffic transported via the TSR reached 620,831 TEUs, up 48 per cent over 2006. Out of this 235,100 TEUs moved between China and the Russian Federation, 206,200 TEUs moved between the Republic of Korea and the Russian Federation, and 43,600 TEUs moved between Japan and the Russian Federation23.
Container trade between China and the Russian Federation is a growing source of container volume for Russian Railways. In the period 2000-2005 it grew at a rate averaging 15 per cent per year to reach 135,000 TEUs in 2005. It further jumped to 235,100 TEUs in 2007, an increase of 46 per cent over 2006, and recorded a further growth of 41 per cent in the first quarter of 2008 over the same period in 2007. While this trade is overshadowed by the massive volumes of bulk commodity trade, especially of timber and petroleum24, between the two countries, it nevertheless holds a promise of strong revenue growth for Russian Railways, provided the latter can develop adequate facilities for the handling of this traffic within the TAR corridor. To this end, US$ 60 million has been invested on increasing the capacity of the Zabaikalsk container terminal, at the border between the Chinese and Russian rail networks, from 164,000 TEUs per year to 600,000 TEUs per year. In addition, to facilitate transit via the Trans-Siberian main line, the feeder line from Zabaikalsk to Karimskaya (364 km) has been double-tracked and the construction of a new border crossing between the two railways is envisaged at Nizhneleninskoe. Similar investments are also being considered to upgrade facilities at Naushki, border station with Mongolia, and Khasan, border station with the Democratic People's Republic of Korea.
The main intermodal operator along the TSR is TransContainer which is mostly owned by Russian Railways. The company has 23,800 container wagons and operates about 47 inland container terminals in the country. It is followed by DVTG Far Eastern Transport Group which is privately-owned and has a fleet of 4,300 container wagons, and Russian Troika which is half-shared between TransContainer and Russia’s Far Eastern Shipping Company (FESCO), and has a fleet of 1,200 container wagons. Other operators include Eurosib and Trans-Siberian Express Service (TSES). As the Government of the Russian Federation does not encourage the import of finished vehicles, the movement of “Cars Knocked Down” (CKD) are an important source of containerized freight by rail. In 2008, TransContainer and Volkswagen signed an agreement for the carriage of car components from Kosice in Slovakia and Mlada in the Czech Republic to the assembly plant in Kaluga, outside Moscow. Meanwhile, Russian Troika runs regular services along the TSR between the port of Vostochny and a number of CDK assembly plants in the western part of the Russian Federation such as the Hyundai plant in Taganrog near the city of Rostov, the SsangYong plant in Krugloe Pole and KIA plant in Vozhoy, both near the city of Izhevsk.
Demand for high quality logistics facilities in the Northern Corridor of the TAR in the Russian Federation will be driven by the need to serve major producing and consuming centres along the entire length of the corridor. In the context of this need, regional estimates of container trade were generated by the Agency of Special Research, Administration of St Petersburg. These indicate a current annual demand of about 850,000 to 1 million TEUs for Moscow, 350,000 to 450,000 TEUs for Ekaterinburg and 300,000 to 350,000 TEUs and 200,000 to
23 Containerisation International, October 2008. 24 In 2005, the volume of commodity trade transported by rail between Russia and China amounted to 43.4
million tonnes, of which export flows from Russia to China accounted for 94 per cent. Timber (35 per cent) and bulk oil (21 per cent) comprised the majority of this trade (Railway to China in RZD Partner International, September-November 2006).

27
250,000 TEUs for Novosibirsk and Samara respectively.25 To these regional estimates of domestic demand would have to be added estimates of bilateral container trade moving by rail between the Russian Federation, China, the Central Asian states and Mongolia, in order to estimate the need for new logistics infrastructure. In the past, the predominance of TransContainer over container movements and its ownership of most of the fleet of dedicated container wagons are reported as a factor that may have discouraged private investment in container equipment, including wagons and inland terminal facilities26. In 2007, Russian Railways sold a 15 per cent stake in TransContainer and in late 2008 another fifth of the company was put up for sale. The objective is to sell up to 49 per cent of the company in stages over the period 2007-201027. The impact of this on the future development of intermodal facilities will therefore take some time to materialize.
It is evident that Russian Railways has recently made significant progress in modernizing its container terminals to international standards and in equipping some 36 stations on the Trans-Siberian line for the transshipment of heavy containers (of which 13 can transship 40 ft containers).28 However, details have not yet emerged as to the level of logistics support and customs that will be provided.
The efficiency of future intermodal services is also behind the “Transib-7” initiative which Russian Railways plan to implement in the period to 2030 with the ultimate goal of reaching a fivefold increase in the volumes of containers between Asia and Europe along the Trans-Siberian main line. The related programme of action includes inter alia an increase in line capacity, the purchase of dedicated rolling-stock, the development of terminal facilities and customs stations. Currently, transit times along the TSR offer a comparative advantage to rail over maritime shipping. From Vostochny, transit times are in the order of 12 days to Moscow and Buslovskaya (border between the Russian Federation and Finland), 12.5 days to Brest (border between Belarus and Poland), 14.5 days to Berlin (Germany), 17.5 days to Chop (border between Hungary and Ukraine), 10 days to Lokot (border between the Russian Federation and Kazakhstan) and 5 days to Naushki (border between the Russian Federation and Mongolia)29.
4.2 TAR corridor through Southeast Asia
4.2.1 Brunei Darussalam
Brunei Darussalam’s main container terminal is the Muara Container Terminal located at the country’s main port. The terminal has a capacity of over 200,000 TEU. The port department also operates the Muara Conventional Terminal for non-containerized cargo with 50,000 square metres of open area and 12,950 square-meters of transit warehousing.
The government of Brunei Darussalam plans to develop Muara Port into a Regional Distribution Center (RDC) and Regional Logistics Center (RLC) that would provide a wide range of services such as customs clearance, electronic transaction and warehousing. The facilities would be developed in conjunction with an intermodal transport link to the provinces of eastern Malaysia.
25 RZD Partner International, September-November 2006, page 44. 26 Containerisation International, October 2008. 27 International Railway Journal, June 2007, May and September 2008. 28 Website JSC Russian Railways, Transsiberian Railway. 29 Website Vostochny International Container Services and Containerisation International, October 2008.

28
4.2.2 Cambodia
Cambodia’s foreign trade is handled through the major coastal port of Sihanoukville as well as through the river port of Phnom Penh. In 2006, the combined container throughput of these ports was 260,723 TEU, of which Sihanoukville handled 221,490 TEU, or 85 per cent.
Phnom Penh’s share of the national container throughput increased from only 990 TEU (0.6 per cent) in 2002 to 39,233 TEU (15 per cent) in 2006. This reflects the strong growth in trade with China the majority of which moves via the Mekong River. More than 90 per cent of Cambodia’s foreign trade is sourced in Phnom Penh which is 230 km by road and 263 km by rail from Sihanoukville. Trade handled through Sihanoukville Port is mostly transshipped in Singapore, while trade handled through Phnom Penh Port for destinations other than in China and Viet Nam is double transshipped in Saigon Port (Ho Chi Minh City) and Singapore, Hong Kong or Kaoshiung.
Currently, all container trade consignments are transported to and from the Port of Sihanoukville by road as the present condition of rail infrastructure and the lack of intermodal transfer facilities prevent container carriage by rail. There is no container stuffing and destuffing activity in the port. Consignments of garments which account for some 80 per cent of all containerized export trade are loaded into containers on road chassis at the factories and then moved directly to the port.
The Port of Sihanoukville owns and operates a dry port facility on National Road 4, about 14 km west of Phnom Penh. This facility, known as the Cambodia CWT Dry Port, has a total developed area of 13 hectares (130,000 square metres), with another 6 hectares available for future expansion. It is located adjacent to, but as yet has no direct connection with, the Southern Line of the Cambodian Railway. Although the dry port has a CY, warehouses and an administration building, it has limited equipment and no permanent customs presence. It was initially developed as a joint venture with a Singaporean investor but this joint venture has now lapsed.
Given the fact that the majority of trade consignments move directly by road between Phnom Penh and Sihanoukville, the role of the Dry Port is currently limited to the storage of empty containers (the throughput of the Dry Port being estimated at around 6,000 TEU per year). Nevertheless, it is well located to serve as a rail to road (and vice versa) transfer facility, should the planned rehabilitation of the Cambodian Railway result in container trade being transported between Sihanoukville and Phnom Penh and indeed between Bangkok and Phnom Penh as well as Port Klang in Malaysia and Phnom Penh. The latter traffic could eventuate following the restoration of the missing rail section of 48 km between Sisophon and the Thai Border. In 2008, following an economic evaluation of the railway rehabilitation project, the ADB awarded a track rehabilitation contract to TSO of France and a concession contract to Toll Holdings Ltd. of Australia.30
In the longer term, the Dry Port will also be well located to serve as a rail to road transfer facility for traffic moving between Cambodia and Viet Nam, although this requires the construction of the 385-km missing link between Bat Deng (Cambodia) and Ho Chi Minh City (Viet Nam).
The railways of Cambodia expect that the revitalization of the network under the Toll concession will lead to the introduction of container services by rail together with the completion of a number of projects aiming to connect main lines with existing or planned
30 The evaluation of the rehabilitation project was carried out under TA 6251-REG and coincided with another project to formulate a plan for the restructuring of the railway under TA 4645-CAM.

29
facilities such as the construction of a loop line within the port of Sihanoukville and the rehabilitation of a spur line to Phnom Penh Port, 8 km from the city.
4.2.3 China
By 2008, over 2,000 foreign companies had invested in Kunming, the capital city of China’s Yunnan Province. The Province has benefited from the country’s trade expansion with the ASEAN subregion which grew from US$ 105.88 billion in 2004 to US$ 202.5 billion in 200731
and is set to reach higher levels after the Free Trade Agreement between China and ASEAN is fully in place.
The China-ASEAN Free Trade Agreement in goods (TIG) – the first Free Trade Agreement for the two sides – was signed at the 10th ASEAN summit held in Lao PDR in November 2004. It came into effect in July 2005, reducing tariff rates on 7,000 commodities. A key feature of the TIG is the non-maintenance of quantitative restrictions and the elimination of non-tariff barriers. The removal of these trade impediments will lower the costs of trade transactions, further increase ASEAN-China trade and enhance economic efficiency in the subregion. Eventually, under the pact, China and the older ASEAN members -- Brunei, Indonesia, Malaysia, the Philippines, Singapore and Thailand -- will impose zero tariffs on most goods in 2010, and Cambodia, Laos, Myanmar and Vietnam will follow suit in 2015.
Kunming will be the ultimate destination of cross-border railway traffic moved on any one of six routes being evaluated for construction as part of the Singapore-Kunming Railway Link (SKRL) project. As such it has been designated as one of the 18 cities in China which will in future be provided with large scale rail-linked inland container handling facilities, or hubs.
The Kunming terminal is one of the two already completed32. It is located in Wangjiaying, Chenggong County, 20 km from Kunming City. The site covers an area of 800,000 square meters. Construction started in July 2004 and was completed in October 2006. Operation started in November 2006. The initial capacity is reported to be 330,000 TEUs per year to be gradually enhanced to 520,000 TEUs by year 2010. Investment cost of the new facility was about RMB 500 million (US$ 55.6 million)33.
4.2.4 Indonesia
In Indonesia the development of ICDs was initiated in 1987 with the issuance of Presidential Decree 52. To date the country’s main rail-served inland container handling facility and the only one of any note is the ICD at Gedebage, near Bandung in West Java. It exists mainly to serve export industries based in and around Bandung which must dispatch their containers for shipment through the Port of Tanjung Priok, near Jakarta. The rail distance is 185 km and container volumes moved by rail have recently been under threat from road transport which has benefited from the completion of the Jakarta-Bandung toll road.
Other ICDs include Surakarta, Rambipuji, Kertapati and Tebingtinggi serving Semarang, Surabaya, Panjang and Belawan ports, respectively. These ICDs are operated by PT Kereta Api Indonesia, the country’s state-owned railway organization.
31 China Daily, “China-ASEAN Expo propels FTA construction”, 29 August 2008. 32 The status of development of the other facilities is highlighted in the above para. 4.1.1 of the report. 33 Chinese language website of China Railway Container Transport Co. and “Connecting Asia” in EuroBiz
Magazine, September 2006.

30
4.2.5 Lao PDR
As a landlocked country, Lao PDR’s trade with foreign countries rely heavily on transit channels through Laem Chabang port in Thailand, Sihanoukville port in Cambodia, and Ho Chi Minh port in Vietnam. 50 per cent of Lao PDR’s imports and 27 per cent of its exports cross the Friendship Bridge at Nongkhai, the border crossing point between Lao PDR and Thailand. However, while the State Railway of Thailand (SRT) operates a line to Nongkhai, virtually no Lao freight traffic is handled at that station and movements to and from Thailand, mostly Bangkok area, have so far been by road.
During 2005, a total of 894,447 tons of freight traffic crossed the Friendship Bridge. Imports are predominant with 561,102 tons. Between 1995 and 2005 the number of vehicles crossing the border increased at an average 7.4 per cent per year. However, it only increased by 2.2 per cent in the period 2005-2007. In 2007, the single most important import is petroleum products (57 per cent) followed by general commodities (22 per cent), while the most important export is wood and wood products (71 per cent). The distance between Bangkok and Nongkhai is 620 km by road and 625 km by rail. Petroleum products are transported to storage tanks at locations near Thanalaeng from where distribution is made throughout the country. Other commodities are brought by truck from the Nongkhai customs depot in Thailand to the Thanalaeng customs depot in Lao PDR from which distribution is made throughout the country.34
Up until now, a warehouse complex for the handling and storage of bilateral and transit cargoes exists at the private logistics centre at Thanaleng near the approaches to the Friendship Bridge, about 20 km south-east of Vientiane. The facility covers an area of 3.5 hectares and its main function is the customs clearance, as well as the consolidation and deconsolidation of trade consignments. The latter activities are necessary at Thanaleng since the large trucks which bring cargoes to/from Thailand are not permitted on the section of National Road 13S (corresponding with AH 11), between Thanaleng and Vientiane. The facility is operated under a 15-year concession from the Government of Lao PDR which provides the land, while the private operator provides the facilities and pays to the government a monthly fee of Baht 700,000 (ca US$ 20,000).
The removal, as from March 2004, of the prohibition on the operation of Laotian trucks in Thailand, coupled with the simplification of customs documentation and the adoption of joint customs inspection by both sides, has resulted in a significant reduction (of up to 20 per cent) in the costs of transit trade handled through Thanaleng.35
The recent conclusion of an agreement with Viet Nam for the use of Vung Ang deep sea port is likely to open up the possibility of more land-based trade through the Thanaleng facility.
In 2008, work was completed on the construction of a metre gauge railway link of approximately 3.5 km between Nongkhai Station and Thanaleng, across the Friendship Bridge. This link, the first stage of a project to provide a rail connection between Vientiane and Nongkhai, was financed in part by the Thai Government and is expected to be officially put into service in 2009. The project study team estimated that the provision of adequate
34 “Train Traffic Operation Thanaleng-Nongkhai Railway”, paper presented by Lao Railway Authority at 30th
Conference of CEOs of ASEAN railways, Bangkok, 24-26 November 2008. 35 Previously, transit trade moving between Thanaleng and the Port of Laem Chabang was monopolized by just
five Thai truck operators. Under a new bilateral transit agreement with Thailand cargo haulage has been opened up to all transport operators on both sides of the border. However, the full potential for savings in transit costs is not yet being realized owing to the fact that many Laotian drivers are still prevented from proceeding into Thai territory beyond Nongkhai as a consequence of their lack of familiarity with Thai road laws, signage and signals.

31
services by the railways concerned could result in 58 per cent of petroleum traffic being diverted to rail. For other traffic the team estimated a conservative diversion of 50 per cent for non-containerized cargo and 60 per cent for containerized commodities36. Ultimately, it should be possible for containers to be loaded onto flat cars at Thanaleng and transported directly for shipment through Laem Chabang Port or to the Lat Krabang ICD for further consolidation and processing before shipment. At Bangkok, traffic will also be able to connect with the existing container landbridge to Port Klang in Malaysia. Profreight International Co. Ltd. which already operates its own container block-trains, i.e. the Asean Rail Express, between Malaysia and Thailand has expressed interest in running container services to Lao PDR. In addition to reducing transport costs for Lao importers and exporters, the use of rail for the movement of freight to and from Lao PDR falls in line with the policy of the Government of Thailand to promote energy-efficient transport modes, i.e. rail and water transport.
In conjunction with the construction of the railway line to Thanaleng, the Government of Lao PDR is planning to develop the Vientiane Logistics Park (VLP) south of Thanaleng station. VLP is expected to serve as one-stop point for cargo handling and transfer, cargo storage, custom clearance as well as intermodal linkages between road and rail transport. The park will be developed in two phases representing a total investment of US$ 10 million with an additional US$ 2.64 million allocated for the construction of access road and rail tracks to allow direct road and rail movements to the site from the Friendship Bridge.
4.2.6 Malaysia
Containers account for 55 per cent of the total throughput tonnage of Malaysian ports and by 2020 this share is expected to exceed 60 per cent37. It is likely that containers will have an even greater representation in the volume of cargo which is distributed inland.
Container terminals at five ports in Peninsula Malaysia – Butterworth (Penang), Westport and Northport (Port Klang), Pasir Gudang and Tanjung Pelepas – process container volume for inland distribution, but of these Westport, Northport and Tanjung Pelepas account for more than 90 per cent of this volume. Northport recently expanded its distripark to provide more than 93,000 square-metres of closed and open storage space, plus a free zone processing area.
In 2007, Port Klang and the port of Tanjung Pelepas ranked number 16 and number 18 in the world’s top container ports, with throughput volumes of 7.12 million and 5.5 million TEUs respectively 38. Both ports (but particularly the Port of Tanjung Pelapas) have established a leading role as container transshipment ports, competing with the Port of Singapore for transshipment feeder business to and from South Asia, Cambodia, Thailand and Viet Nam. Over the past decade, container throughput growth for these two ports has averaged about 10 per cent per annum.
Currently, KTMB, the Malaysian Railways, provides rail services to (see Map 4.1):
four port container terminals - at Butterworth, Port Klang, Pasir Gudang and Tanjung Pelepas;
four inland ports – at Padang Besar, Ipoh, Nilai and Segamat;
four inland container depots (ICD’s) – three at Prai and one at Seri Setia;
36 “Train Traffic Operation Thanaleng-Nongkhai Railway”, paper presented by Lao Railway Authority at 30th
Conference of CEOs of ASEAN railways, Bangkok, 24-26 November 2008. 37 9th Malaysia Plan, Chapter 25 Logistics. 38 Containerisation International, March 2008.
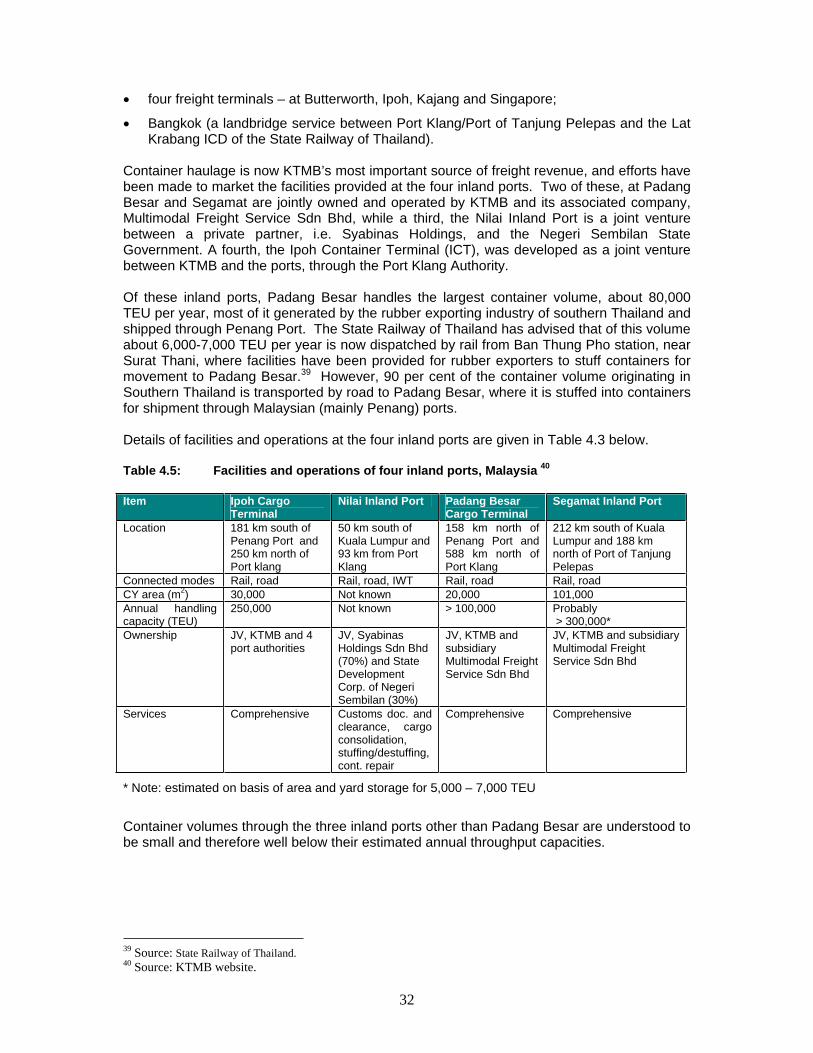
32
four freight terminals – at Butterworth, Ipoh, Kajang and Singapore;
Bangkok (a landbridge service between Port Klang/Port of Tanjung Pelepas and the Lat Krabang ICD of the State Railway of Thailand).
Container haulage is now KTMB’s most important source of freight revenue, and efforts have been made to market the facilities provided at the four inland ports. Two of these, at Padang Besar and Segamat are jointly owned and operated by KTMB and its associated company, Multimodal Freight Service Sdn Bhd, while a third, the Nilai Inland Port is a joint venture between a private partner, i.e. Syabinas Holdings, and the Negeri Sembilan State Government. A fourth, the Ipoh Container Terminal (ICT), was developed as a joint venture between KTMB and the ports, through the Port Klang Authority.
Of these inland ports, Padang Besar handles the largest container volume, about 80,000 TEU per year, most of it generated by the rubber exporting industry of southern Thailand and shipped through Penang Port. The State Railway of Thailand has advised that of this volume about 6,000-7,000 TEU per year is now dispatched by rail from Ban Thung Pho station, near Surat Thani, where facilities have been provided for rubber exporters to stuff containers for movement to Padang Besar.39 However, 90 per cent of the container volume originating in Southern Thailand is transported by road to Padang Besar, where it is stuffed into containers for shipment through Malaysian (mainly Penang) ports.
Details of facilities and operations at the four inland ports are given in Table 4.3 below.
Table 4.5: Facilities and operations of four inland ports, Malaysia 40
Item Ipoh Cargo Terminal
Nilai Inland Port Padang Besar Cargo Terminal
Segamat Inland Port
Location 181 km south of Penang Port and 250 km north of Port klang
50 km south of Kuala Lumpur and 93 km from Port Klang
158 km north of Penang Port and 588 km north of Port Klang
212 km south of Kuala Lumpur and 188 km north of Port of Tanjung Pelepas
Connected modes Rail, road Rail, road, IWT Rail, road Rail, road CY area (m2) 30,000 Not known 20,000 101,000 Annual handling capacity (TEU)
250,000 Not known > 100,000 Probably > 300,000*
Ownership JV, KTMB and 4 port authorities
JV, Syabinas Holdings Sdn Bhd (70%) and State Development Corp. of Negeri Sembilan (30%)
JV, KTMB and subsidiary Multimodal Freight Service Sdn Bhd
JV, KTMB and subsidiary Multimodal Freight Service Sdn Bhd
Services Comprehensive Customs doc. and clearance, cargo consolidation, stuffing/destuffing, cont. repair
Comprehensive Comprehensive
* Note: estimated on basis of area and yard storage for 5,000 – 7,000 TEU
Container volumes through the three inland ports other than Padang Besar are understood to be small and therefore well below their estimated annual throughput capacities.
39 Source: State Railway of Thailand. 40 Source: KTMB website.

33
Map 1: Location of inland container handling facilities, Malaysia
Source: Keretapi Tanah Melayu Berhad website: www.ktmb.com.myKeretapi.com © All Rights Reserved
Tanjung Pelepas 30 KM
Legend
Port container terminal Inland port Inland container depot (ICD)
NilaiSeri Setia
Pasir Gudang

34
Container land bridge services between Port Klang and Lat Krabang ICD, near Bangkok, were started in 1999. Four operators are involved in providing the services. They are Freight Management (Malaysia) Sdn Bhd of Malaysia, Profreight International Co., Ltd of Thailand, T.S. Transrail and Infinity Logistics. Freight Management Sdn Bhd and Profreight International Co., Ltd jointly market the ARX (ASEAN Rail Express) service between Port Klang, Ipoh and Penang in Malaysia and the Lat Krabang ICD in Bangkok. Currently ARX is offering four weekly fixed-day services each way. The ARX services offer transit times that are three days shorter and rates 10 per cent cheaper compared with shipping via Singapore. Meanwhile, T.S. Transrail landbridge services connect Kontena National’s ICD at Sungai Way in Setia Jaya in Penang and the Ipoh Cargo terminal with Bangsue ICD in Bangkok. Shippers receive door-to-door deliveries. Transit times are half a day slower than by road but rates are about 30 per cent cheaper. Infinity Logistics cater for traffic between Klang, Ipoh and Penang to Hat Yai and Surat Thani in the south of Thailand.
The operators base their services on the platforms of the two railways of Malaysia and Thailand. As such some of the characteristics of the services are similar. However, there are differences in terms of pricing, container type, terminal services, availability of specialized equipment and provision of information and communication technology. Up until 2004, the container volume carried on land bridge services grew rapidly year-by-year, in fact almost trebling in 4 years from 2000 to 2004 (see Figure 4.1, below). However, beginning in 2005, increasing locomotive failures (a reflection of the ageing locomotive fleets of both systems) began to plague the services and the volume of containers carried began to plummet. While there was a slight recovery in 2006, the land bridged container volume still remains about 27 per cent below its peak level in 2004.
Figure 4.1: Malaysia-Thailand container land bridge services, volume trend
0
10000
20000
30000
40000
50000
60000
70000
TEU
-40.0%
-30.0%
-20.0%
-10.0%
0.0%
10.0%
20.0%
30.0%
40.0%
50.0%
Landbriged containervolume
21640 29742 36350 44496 58224 41558 42520
% change 37.4% 22.2% 22.4% 30.9% -28.6% 2.3%
2000 2001 2002 2003 2004 2005 2006
Source: State Railway of Thailand
4.2.7 Myanmar
Myanmar has three ICDs, all of which are in close proximity to Yangon, the largest city. Two ICDs are located at Botataung, about 10 km from the Asia World Port terminal in Yangon and the third about 4 km from the same port facility. Botataung No. 1 ICD, run by MPA-Allied

35
Yangon Inland Container Terminal Ltd, a joint venture between Myanmar Port Authority and Allied Container Services Pte, has total container storage capacity at 4,387 TEUs41.Botataung No. 2 ICD is a state-own ICD with container storage capacity of 2,822 TEUs42.None of these ICDs is accessible by rail. Of the three ICD’s, Myanmar Industrial Port ICD is the largest with a handling capacity of 7,200 TEU. There is private sector participation in the ownership and operation of all three ICDs.
Table 4.6: Facilities and operations of ICDs in Myanmar
MPA-Allied Yangon Inland Container Depot Ltd ItemICD - 1 ICD -2
Myanmar Industrial Port Inland Container Depot
Location Botahtaung, about 10 km from Asia World Port terminal in Yangon and about 25 km from Myanmar International Terminal Thilawa
Close to City of Yangon, 4km from Asia World Port terminal and about 25 km from Myanmar International Terminal Thilawa
Connected modes Road, Inland Waterway Road, Inland Waterway Road, Inland Waterway Container storage capacity (TEU)
1,800 5,000 7,200
Annual handling capacity (TEU)
Not known Not known 50,000 (estimate)
Ownership Joint venture between MPA (Myanmar Port Authority) and Allied Container Services Pty.Ltd.
BOT agreement and a land lease between Myanma Ceramic Industries (state-owned) and Myanma Anawah Swanahshin Group Co.Ltd.
Services Cargo consolidation, distribution, warehousing, customs clearing, empty container storage
Cargo consolidation, distribution, warehousing, customs clearing, empty container storage
Source: UNESCAP study
4.2.8 Philippines
Given the country’s geography, coastal transport is one of the main transport systems in the country. Philippines have 2,415 ports in which 1,607 of them are public commercial ports, 423 are private-own ports and 421 are fishery ports. The country’s major port for international cargo is the Port of Manila which handled almost 2.8 millions TEUs in 2007.
At the port, Manila International Container Terminal (MICT) is the country’s largest container terminal with a terminal area of 677,000 square-metres and an annual capacity of 1.5 million TEUs. The terminal is operated by International Container Terminal Services Inc. (ICTSI) under a 25+25 year concession awarded in 1988. This was the Philippine Government’s first port privatization effort. ICTSI’s responsibilities include Port management, operations and administration, Port construction and development, including port planning and programming, and investment responsibilities. Since it started operating at the port, ICTSI has more than tripled the terminal’s annual capacity and throughput, and expanded cargo handling fleet to make it the largest and most modern in the country.
In 1997, ICTSI introduced short-range railway cargo transport service over the 50-km distance between MICT and the Calamba ICD, south of Manila. However, in 2003, ICTSI discontinued services and closed down the 20-hectare facility. The decision was based on poor reliability of the rail movements due to bad infrastructure, i.e. track and bridges. Another factor was that industrial growth in the Cavite-Laguna-Batangas-Rizal-Quezon growth area, i.e. Calamba ICD's main market, had not been as fast as expected and the anticipated investments and trade volumes had failed to materialize.
41 Ministry of Transport, Myanmar website (http://www.mot.gov.mm/mpa/port_dev.html) 42 Ministry of Transport, Myanmar website (http://www.mot.gov.mm/mpa/port_dev.html)

36
4.2.9 Singapore
Port of Singapore’s container throughput in 2007 was 27.9 million TEUs43. Operated by PSA Marine (Pte) Ltd, PSA Singapore Terminal is the world’s leading container transshipment hub, handling about one-fifth of the world’s total container transshipment. PSA is currently working on the second phase expansion of Pasir Panjang terminal which is expected to be completed in 2009. The third and fourth phases are expected to add another 16 berths by 2019.
With the relatively small size of the country, the role of ICDs may not be as prominent.
4.2.10 Thailand
Nearly all of Thailand’s container trade is handled by its two gateway ports: Laem Chabang International Port, on the Eastern Seaboard, about 130 km southeast of Bangkok and Bangkok Port on the Chao Phraya River, near the city centre. In 2007 the two ports handled 4.65 million and 1.56 million TEU, respectively.
Thailand’s cargo handling facilities at inland locations can be categorized into four different types listed as follows:
- Truck Terminals, which provide service for conventional goods such as cross-docking and warehousing. There are 3 such terminals, all located close to Bangkok at Khlong Luang, Rom Klao and Phuta Mon Thon.
- Off-Dock Container Freight Stations (Off-Dock CFS), which provide loading area for cargo and cargo inspection. Currently, there are 16 such off-dock CFS located close to industrial estates.
- Container Yards (CY), which typically handle empty and loaded containers and provide services such as the storage of containers and inter-modal transfer-bonded cargo. There are 21 such CYs in service. As part of its effort to promote rail transport, the State Railways of Thailand (SRT) is implementing a number of CY construction projects in several provinces.
- Inland Container Depots (ICD), which offers services for the handling, temporary storage and Customs clearance of containers and general cargo that enters or leaves the ICD in containers. A range of other services are also offered. There are four ICDs in operation in Thailand, namely: the Ekachai Container Co. Ltd., the N.H. Properties Co. Ltd., the Kerry Siam Container Transport and Terminal Co. Ltd.,and the Lat Krabang ICD detailed below.
The Kerry Siam Container Transport and Terminal Co. Ltd.,and the Lat Krabang ICD are the two ICDs serving Laem Chabang International Port. Kerry Siam ICD is a road-served facility which is close to the port and is wholly owned and operated by Kerry Siam, the Thai subsidiary of Kerry EAS, an international logistics company. Meanwhile, the Lat Krabang ICD is a road and rail-served facility located about 27 km east of Bangkok and 118 km north of Laem Chabang Port. The Lat Krabang ICD was developed and is managed by the State Railway of Thailand (SRT), but with terminal operations contracted out to six operating concessionaires from the private sector (most of them offshoots of the shipping lines). It was opened for service in 1996.
Details of the facilities and operation of the Lat Krabang ICD are given in Table 4.7 below.
43 Maritime and Port Authority website (http://www.mpa.gov.sg/infocentre/pdfs/container-throughput.pdf)
37
The annual throughput of this facility has now grown well beyond its initial design capacity of 500,000 TEU, as is shown in Figure 4.2. The main reason for this is that most of the containers which enter the ICD container yard are now by-passing the CFS and are being stuffed and de-stuffed outside the facility, either at other (road-served) logistics establishments or at consignor/consignee premises. Thus containers are spending a minimum amount of time in the CY before being dispatched to outside locations for stuffing/destuffing. This is a development which was not anticipated when the original design for the ICD was finalized. Another recent development which will affect the planned second phase of the ICD expansion project is that an increasing proportion of Laem Chabang’s container throughput is now by-passing Lat Krabang altogether and proceeding direct to external locations for stuffing and destuffing. This may also be observed from Figure 4.2. Still another factor which will affect long term planning of the ICD expansion project is that road transport dominates the movement of containers to and from the ICD.
Table 4.7: Facilities and operations of Lat Krabang Inland Container Depot
Name Lat Krabang Inland Container Depot Location 27 km east of Bangkok and 118 km north of Laem Chabang
International Port Connected modes Rail, Road Annual handling capacity (TEU)
Design: 500,000. Last year (2006) the facility handled 1.4 million TEU.
Ownership Royal Thai government. SRT has overall responsibility for planning and management and six private operators (including the shipping lines Maersk and Evergreen) operate the six modules comprising the terminal.
Services Cargo consolidation, distribution, warehousing, customs clearing, empty container storage, full EDI link
Sources: (1) UNESCAP study; (2) State Railway of Thailand
Figure 4.2: Road and rail volumes at Lat Krabang ICD in total Laem Chabang throughput
0
0.5
1
1.5
2
2.5
3
3.5
4
4.5
Million TEU
Rail to Lat Krabang 0.262 0.257 0.287 0.340 0.393 0.430
Road to Lat Krabang 0.615 0.736 0.796 0.878 0.842 0.970
By-pass Lat Krabang 1.335 1.663 1.963 2.312 2.53 2.759
2001 2002 2003 2004 2005 2006
Sources: (1) SRT presentation: Extending and Ensuring Intermodal Connectivity, 25 November 2005 (2) Laem Chabang Port presentation to 3 rd Trans Asia 2006 China Exhibition and Conference,
Dalian, China 26 April 2006 (3) Meeting with SRT Finance Director 09 July 2007.

38
Between 2001 and 2006, Laem Chabang’s container throughput almost doubled from 2.2 million TEU in 2001 to 4.2 million in 2006, equivalent to annual growth averaging 15.6 per cent. However, the proportion of this port throughput which went through Lat Krabang by road or rail declined from 39.6 per cent to only 33.7 per cent over the same period, suggesting that a growing proportion of containers was moving direct to consignor/consignee premises or to other logistics centres for stuffing/destuffing or storage as empties. Of the TEU volume which did pass through Lat Krabang, there was some improvement in the portion moved by rail (from 262,000 TEU or 30 per cent in 2001 to 430,000 TEU or 31 per cent in 2006), although there was again some rail share loss in 2006, possibly as a result of locomotive and wagon shortages.
The dilemma now facing the Thai authorities is how to respond to these trends in planning the future expansion of the Lat Krabang facility. If it is to be expanded, what sort of facilities are to be provided? Will the leakage of containers away from Lat Krabang be contained as roads become more congested and shippers return to using rail, and if so, will there be a greater demand for stuffing/destuffing containers at Lat Krabang than in the recent past?
Elsewhere in an effort to attract more container business to rail, the SRT has been establishing small CYs at strategic locations. Four of these small CYs have been constructed at: Ban Tung Pho near Surat Thani in Southern Thailand; at Sila At, near Denchai in Northern Thailand; at Tha Phra in Northeastern Thailand; and at Kut Chik at the approach to the Eastern Seaboard. In most cases, establishing these CYs has involved building low cost pavements in station yards, enabling forwarders or shippers to stuff or de-stuff their own containers beside the tracks. Customs inspection is usually carried at these locations on an ‘as required’ basis. These arrangements have met with success in some cases. For example, at Ban Thung Po, the SRT has succeeded in securing as container traffic export rubber which might otherwise have been moved to Padang Besar as breakbulk cargo in trucks.
At the Sadao border crossing on Asian Highway route AH2, an ICD with an annual capacity of 300,000 TEU has been in operation since 1996. This facility, known as the KPB Sadao ICD, is operated as a joint venture between Thai and Malaysian logistics companies. It is connected only to road transport but offers among its services customs clearance and container repair.
The Kerry Siam Seaport ICD adjacent to Laem Chabang Port has an annual capacity of 150,000 TEU, but given its location is likely to be of greatest benefit to local importers and exporters.
In its White Paper on “Multimodal Transport System for Thailand’s Sustainable Development”, the Ministry of Transport has stressed its desire to enhance the country’s logistics capabilities through the development of intermodal facilities aiming to induce a modal shift from road to more environmentally-friendly and fuel-efficient modes of transport, i.e. rail and inland water transport. The Paper also mentions the development of a Hub-and-spoke system aiming to integrate transport infrastructure and facilities to transform the country into a regional transport hub for the Indochina subregion. Under the “Logistics Roadmap 2007-2011” the Ministry of Transport is implementing a three-prong approach in the areas of (i) Network Integration, (ii) Transport Management for Energy Saving and (iii) New Trade Lane Development. It also supervises the implementation of 99 related projects for a total investment of Baht 253,144 million.

39
4.2.11 Viet Nam
The main gateways for Viet Nam’s international containerized trade are the ports of Ho Chi Minh in the south and Haiphong in the north. In 2006, the two ports handled 2.33 million and 0.46 million TEU, respectively. Given the country’s geographical structure, distances for container haulage between the ports and major trade generating locations in the interior are, on the whole, quite short, making them generally suitable for road transport. 95 per cent of cargo coming through the ports of Haiphong and Cai Lan in the north are transported by road and 5 per cent by rail. In the south cargo coming through the port of Ho Chi Minh is transported by road, 65 per cent, and river transport, 35 per cent44. Yet, concern has already been expressed by the authorities that limited road building capacity will result in roads becoming easily and quickly congested as the country’s international trade continues to develop.
As an example, the road distance between the Port of Haiphong and Hanoi, along National Road No.5 is only just over 100 km. Hanoi receives and dispatches about 90 per cent of the containers handled in the Port of Haiphong, which were estimated to have amounted to 420,000 TEUs last year (2006).45 Total container throughput through the Port of Haiphong grew by an average of 13.5 per cent per year over the decade from 1995 to 2005 and if container traffic on NR 5 continues to grow at this rate NR 5 could be gridlocked within 10 years, even with the completion of committed road expansion works.
To date there is a total of 9 ICDs in the country, i.e. 3 in the northern part and 6 in the southern part. The Phuoc Long and Transimax in the south are the largest two in terms of cargo volume. In 2006, they handled 365,000 and 178,000 TEUs, respectively. Of the three ICDs in the north, only one is rail-connected, i.e. the Thuy Van ICD in Phu Tho from where the distance to the nearest seaport is 200 kilometres. Meanwhile, the ICDs in the south can be accessed only by road transport and inland water transport.
Efforts have been made to encourage container shippers to use rail transport and for this purpose, in 1997, a rail-served container yard was established at Yen Vien (on the eastern outskirts of Hanoi) where the standard gauge railway from China and the indigenous metre gauge converge. Shippers are able to stuff and de-stuff containers in the yard under Customs supervision on an “as required” basis. However, the present structure of railway tariffs does not provide sufficient incentive for shippers to use rail between Haiphong and Hanoi, and local road delivery charges are prohibitively expensive, with the result that container volumes moving by rail have been negligible. In the longer term, ADB initiatives to develop the rail corridor between Yunnan Province of China and Northern Viet Nam may result in rail haulage of containers between Kunming and Haiphong or Cai Lan Ports.
Other initiatives are being taken by the Vietnam Inland Waterways Administration (VIWA) with assistance from the Government of Flanders to evaluate the provision of inland container port facilities on the Luoc and the Duong branches of the Red River, near Hanoi.
With the projection that container cargo will increase to 4.3 million TEUs in 2010 and 7.5 million TEUs in 2020, the Government of Viet Nam plans to increase the country’s intermodal capabilities by developing a series of new ICDs to meet the volumes forecasted for these two target years. By 2010 four ICDs are to be built in the north with a total capacity of 350,000 TEU and another four in the south with a capacity of 1,450,000 TEUs. Meanwhile, by 2020, another seven ICDs with a total capacity of 900,000 TEUs will be added in the north and six in the south with a total capacity of 2.300.000 TEUs.
44 Source: Country paper, 2007. 45 Flanders Engineering for Vietnam Inland Waterway Administration: Solution research for container transport
development by inland waterway on the Hanoi – Hai Phong route, March 2007.

40
At present the Government of Viet Nam recognizes the need to strengthen the institutional framework relating to the development of intermodal transport and facilities in order to establish a comprehensive development plan and attract the necessary resources, including from private sector. Two main objectives are to achieve greater coordination among related ministries and agencies, and develop human resources qualified to evaluate projects and negotiate public-private partnerships.
4.3 The North-South corridor
The International North-South Transport Corridor (INSTC) is a multimodal transportation corridor formerly established in September 2000 in St. Petersburg. The countries initially behind the project are India, the Islamic Republic of Iran and the Russian Federation. The project was later extended to other countries in Central Asia, Europe and the Middle East deemed to be located within the anticipated geographic sphere of the corridor’s economic benefits. The corridor, which connects ports on the Baltic Sea, mainly Saint Petersburg, to ports on the Persian Gulf, mainly Bandar Abbas and the future port of Chabbahar, is considered as the shortest, cheapest and most suitable route for trade between Asia and Europe. It is an important one for the landlocked countries of Central Asia and the Caucasus region as some of the sections in the corridor offer access to the port of Bandar Abbas in the Islamic Republic of Iran.
While all routes within the corridor start from and end at locations in either the Islamic Republic of Iran or the Russian Federation, transit can follow three different routing options, namely:
a route east of the Caspian Sea via Central Asian countries, i.e. Kazakhstan, Turkmenistan and Uzbekistan,
a route through the Caspian Sea with ferry connections between ports in the Russian Federation (Astrakhan, Makhachkala, Olya) and ports in the Islamic Republic of Iran (Bandar-e-Amirabad, Bandar-e-Anzali, Nowshahr), and
a route west of the Caspian Sea through the Caucasus region.
The latter option is the most promising and shortest land route but requires the completion of a 375-km missing section from the city of Qazvin in the Islamic Republic of Iran to Astara in Azerbaijan. Work is under way on the Qazvin-Rasht section in the Islamic Republic of Iran. When completed the distance between Saint Petersburg and the Port of Bandar Abbas will be 4,200 km.
In Baku, the North-South Corridor will also eventually connect with the Baku-Tbilisi-Kars (BTK) project involving the construction of a 105-km missing link between Kars in Turkey and Akhalkalaki in Georgia, and the upgrading of existing tracks in Georgia and Azerbaijan. The link which is expected to be completed in 2011 will give access to the Turkish ports of Iskenderun and Mersin on the Mediterranean Sea and to Europe via the Bhosphorus Tunnel currently under construction.
In addition to the North-South Corridor, the Northern Corridor can also give access to the Caucasus and Central Asian countries through entry points in the Russian Federation or Kazakhstan. However, reaching the Caucasus region through Central Asia necessitate a ferry transfer across the Caspian Sea from the ports of Aktau in Kazakhstan or Turkmenbashi in Turkmenistan to Baku in Azerbaijan. The TAR Southern Corridor also provides access, although direct rail access will only be possible upon completion of the missing link between Qazvin and Astara or a link between Marand, on the Tabriz-Jolfa line in the Islamic Republic of Iran, and Gagarin in Armenia. Intra-Caucasus rail routes also provide

41
access to Georgia’s ports at Poti and Batumi from where shipping connections exist across the Black Sea to ports in Bulgaria, Romania and Ukraine.
Apart from the missing links and the requirements for transfer to short sea shipping on some routes, the efficiency of transport in the region is beset with a number of political issues. The direct link between Armenia and Azerbaijan has been out of operation since the conflict over the province of Nagorno-Karabak in the late 1980s and early 1990s. Meanwhile, the rail link between Georgia and the Russian Federation goes through the disputed region of Abkhazia and services have been temporarily suspended.
Despite the above, countries in both the Caucasus region and Central Asia as well as the Islamic Republic of Iran and Turkey are undertaking projects to develop efficient trade routes, including the development of intermodal facilities. These initiatives are particularly important in view of the number of landlocked countries in the region, i.e. Armenia, Azerbaijan, Kazakhstan, Kyrgyzstan, Tajikistan, Turkmenistan and Uzbekistan. that, with the exception of Georgia, all of the Caucasus and Central Asian countries are landlocked.
4.3.1 Armenia
Landlocked Armenia is linked to its neighbouring countries by road and rail. Given the country’s mountainous topography (the average altitude above sea level is 1,800 metres) and geopolitical situation, most of Armenia’s intermodal traffic flows through Georgia. The most utilized route crosses the Armenian/Georgian border at Ayrum / Sadakhlo and further connects Armenia with third countries through the Black Sea ports of Poti and Batumi.
The major inland intermodal facility in Armenia is the Karmir Blur ICD in Yerevan which comprises of a container yard with an area of 1,151 sq. meters46 and has a daily handling capacity of 120 TEUs. The ICD is owned and operated by the Closed Joint Stock Company “Armenian Railways”. In 2000, the European Union invested Euro 1 million47 within the framework of its TRACECA programme to modernize the facility. The ICD handles ISO 20ft and 40ft containers, and is located within 630 km from the port of Poti. Current annual throughput is 73,000 tonnes.
The ICD is open to both road and rail transport, provides on-site customs clearance as well as a range of logistics services.
Within the development of a multimodal terminal at Yerevan international airport, the Government of Armenia plans to link the airport facilities with the Karmir Blur ICD via a 12-km fast railway connection with the possibility of developing surrounding land into a Free Economic Zone. The preliminary cost of the project is estimated to be in the order of US$ 25 to 30 million.
A fully-equipped railway terminal also exists at Gyumri at the border between Armenia and Turkey. However, the facility has not been used since the conflict between Armenia and Azerbaijan over the province of Nagorno Karabakh which resulted in the closing of transit routes with Azerbaijan and Turkey.
46 Country report 47 http://www.transport.polpred.ru/news.html?country=13

42
4.3.2 Azerbaijan
The Government of Azerbaijan attaches great importance to the development of a network of modern logistics centres in major economic centres and along the TRACECA international transport corridors. The design and development of the network is being carried out by the Warehouse Project Management Company, under the supervision of the State Coordinating Logistics Council, and financed by KB “Bank Standard”, the largest private bank of Azerbaijan. Current priority is given to the development of an ICD serving Baku, the country’s capital48, which at present enjoys the availability of Baku city cargo station, Kurdalan container terminal and the Baku international sea trade port. Outside Baku, intermodal terminals are also available in Gyanja in the western part of the country and Astara in the south at the border between Azerbaijan and the Islamic Republic of Iran.
The Baku International Sea Trade Port is a state-owned entity handling both passengers and cargo. Containerised freight and bulk cargo are handled at dedicated terminals. The container terminal handles 20ft and 40ft ISO containers and has a handling capacity of 15,000 TEU per year. Finally, on the site of the port, the Dyubendi Oil Terminal handles petroleum products.
The inland container terminals at Gyanja, Baku and Astara are owned by Azerbaijan State Railways. Development plans include the purchase of equipment to handle 40ft containers at the Baku City Cargo Station, to further exploit the synergy between the Baku terminal and the port and to capitalize on the proximity of the Astara terminal to the port of Lenkoran on the Caspian Sea. Basic characteristics of Azerbaijan’s intermodal facilities are summed up hereafter:
Table 4.8: Basic characteristics of Azerbaijan’s intermodal facilities
Name Technical charateristics Equipment
Baku International Sea Trade Port
Handling Capacity: 15,000 TEU/year, CY 5,000 sq m, CFS 1200 sq m
Gantry crane (capacity 42 t), Reach stacker (capacity 40 t)
Baku City Cargo Station CY 15,000 sq m, CFS 1,000 sq m, Stacking height 2 rows
Plans to expand CY, purchase 40 foot container equipment
Kurdalan Container terminal
CY 6,400 sq m, stacking height 2 rows
Astara CY 2,821 sq m, CFS 221 sq m
Gandja CY 4,890 sq m
4.3.3 Georgia
Among countries of the Caucasus region, Georgia has the unique advantage of being a coastal country and can therefore plays an important role as a bridge between Europe and its landlocked neighbours in the Caucasus and Central Asia. To enhance its transit potential, Georgia prioritizes the development of its two Black Sea ports at Poti and Batumi, along with the inland container terminal in Tbilisi, the country’s capital.
Tbilisi. In 2005, the Government of Georgia announced a tender for the long-term lease of the "Yuzhny Park" terminal, the only inland railway container terminal in Tbilisi. Based on the
48 http://www.lightfreighs.com/news/104821/

43
tender’s outcome, the terminal, with an area of 19,305 sq. m49, was leased for 10 years to the Intertrans Ltd. Co. Within a year of operation, Intertrans had raised TEU volumes handled at the site from 3,000 to 10,000 TEU, i.e. half the volume targeted by the end of the 10-year lease period. The achievement owes much to a series of measures taken by Intertrans to modernize the site and make it more functional. Access to two main railway lines and a motorway was built, video surveillance was installed at the site to enhance cargo safety and the terminal compound received new fencing in accordance with Customs requirements. New equipment was also purchased such as 50-ton container-handling cranes and a modern 60-ton weighing device.
Development was supported by the launch of regular container block-train services between the capital and the country’s two ports at Poti and Batumi, where Intertrans also owns bonded warehouses. In addition, the ICD is a logistic centre for trucks hauling cargo between Georgia and Europe.
Batumi. On 24 September 200750, the Batumi Port Administration signed an agreement with the International Container Terminal Company for the development of a container terminal at the port. With this objective in mind, the Batumi International Container Terminal (BICT) Company was established to oversee the project developed at berths no. 4 & 5 with a length of 284 meters and draught of 11 meters. The terminal officially started operation in March 2008 with the arrival of the container ship MSC Granada which was the first container ship to dock at BICT. Mediterrenean Shipping Company which operates the vessel is starting with a weekly call.
Poti. In 2007, eleven companies participated in the tender for the long-term lease of the only container terminal at the port of Poti. However, the tender was cancelled in view of the decision of the Government of Georgia to establish a free industrial zone and to construct a container terminal and new port facilities adjacent to the existing port, for which a 100 hectares area has been allocated. The Government achieved a preliminary agreement with Dubai World Holding from the United Arab Emirates and expects, that the free industrial zone will attract USD 200 million of investments and create 20,000 jobs within the next four years.
In 2007 the combined TEU throughput of Poti and Batumi reached over 180,000 TEU, up 40 per cent over 2006. This growth in containerised volumes substantially outpaced the growth in general cargo, which stood at 2.7 per cent, and shows the impact of the actions implemented by the government of Georgia to develop the country’s intermodal transport.
4.3.4 Kazakhstan
The initiatives being undertaken by the Government of Kazakhstan to develop intermodal transport have been outlined in para. 4.1.3 above.
4.3.5 Kyrgyzstan
The mountainous topography of Kyrgyzstan is a severe impediment for intermodal transport in the country, which confines intermodal traffic mostly to the Chu Valley in the North and the Fergana Valley in the South. The pattern may change, however, with construction of the planned Chinese-Kyrgyz-Uzbek railway line.
49 Country report 50 http://cars-news.ru/2007/09/25/v-batumi-budut-razvivat-kontejnernyj-terminal/

44
The Alamedin container terminal is conveniently located in the middle of the northern branch of Kyrgyz railways in the vicinity of Bishkek, the country’s capital. The acquisition of a container reach stacker Fantuzzi for more than Euros 390,000 enabled the ICD to handle 20/40F containers and led to a significant growth in the container turnover. Throughput increased further with the introduction of a container block train service between Bishkek and Dostyk (border between Kazakhstan and China) in January 2008. The through service reduced transit times and cost to a third of those offered by road transport and it is thought that the service could soon expand to carry more consumer and electronic goods from China and the Republic of Korea.
The ICD at Osh in the south of the country has also increased its handling capabilities with the recent acquisition of a 64-ton crane giving the site the possibility to handle both 20ft and 40ft containers.
Both Osh and Alamedin container terminals are state-owned and operated by “Kyrgyz Temir Zholu”, the country’s national railways.
Efficient intermodal transport is crucial to landlocked Kyrgyzstan. The country mostly uses the port of Shanghai in China and Valdivostock in the Russian Federation for its international trade. However, distances are two to three times longer than to the ports of Bandar Abbas or Chabahar in the Islamic Republic of Iran. Aware of the importance of efficient transit to international ports for is future economic development and adequate interfaces between land transport and maritime shipping, the Government of Kyrgyzstan is negotiating with the Ports and Maritime Organization of the Islamic Republic of Iran the long-term rental of land in the Shahid Rajaee Special Economic Zone which encompasses the port of Bandar Abbas.
4.3.6 Tajikistan
Similarly to Kyrgyzstan, the mountainous terrain of Tajikistan has been an obstacle to the development of intermodal transport. At the same time the configuration of the network inherited from the Soviet Union has left the rail network divided into three short lines, namely: two lines in the south-western part of the country travelling to Bukhara in western Uzbekistan via Turkmenistan, and one line in the north going to Uzbekistan in either direction. “Pohi Ohani Tojikiston”, the national railways of Tajikistan, plays a dominant role in the country’s international transport, servicing around 92% of the country’s export and 87% of its import. The organization also owns three of the country’s main container terminals at Khudjant in the North, Dushanbe ICD in the Central part and Kurgan Tube in the South. The following table sums up the area and equipment available at the main three facilities:
Table 4.9: Basic characteristics of Tajikistan’s rail-served intermodal facilities
Name Area of container yard Equipment
Dushanbe 7,875 square meters 2 gantry cranes, 2 reachstackers
Khudjant 30,000 square meters 8 gantry cranes, 2 reachstackers
Kurgan-Tube 10,000 square meters 2 gantry cranes
Road-served terminals are located in Dushanbe, Khudjant, Tursunzade, Murghob, and Istaravshan. All of these facilities operate 24 hours a day and offer on-site customs clearance. In recent times the increased volumes of trade between Tajikistan and China has put pressure for the development of a logistic terminal in the city of Khorog, the westernmost allowed destination for trucks crossing the border from China as per the bilateral agreement

45
between the two countries. Table 4.10 sums up the storage areas available at these facilities.
As railways and highways serve specific non-overlapping markets intermodal interfaces have not yet received a high priority. However, the Government of Tajikistan recognizes the importance of logistic centres situated at the country’s borders. In 2002, it passed a decree to promote the establishment of Specialized Border Complexes at all border crossing points of international importance. In view of the limited financial resources, only one Specialized Border Complex has so far been established at a cost of US$ 19.9 million.
Table 4.10: Basic characteristics of Tajikistan’s road-served intermodal facilities
Name Open storage area Covered storage area
Dushanbe 3,500 square meters 2,700 square meters
Khudjant 4,200 square meters 7,776 square meters
Tursunzade 4,800 square meters 2,600 square meters
Murghob 2,200 square meters 600 square meters
Istaravshan 1,600 square meters 800 square meters
4.3.7 Turkmenistan
The geopolitical location of Turkmenistan is important in connecting Central Asian countries with the Islamic Republic of Iran and Turkey via road and rail. Its territory is also important for transit from Central Asia to countries in the Caucasus region via the port of Turkmenbashi and to the port of Bandar Abbas in the Islamic Republic of Iran for maritime connections to South, South-East and North-East Asia.
The Caspian Sea port of Turkmenbashi is owned and operated by “Turkmen-denizderyaellary”, the sea and inland waterways authority of Turkmenistan. The modernization of the port started in 1998 and was completed in 2003 at a cost of US$ 39.4 million, including a US$ 27.5 million loan from the European Bank for Reconstruction and Development. The container handling facility at the port was upgraded in 1999 with a grant provided by the European Commission within the framework of its TACIS programme.
Inland container facilities in the country are also state-owned, and operated by Turkmendemiryellary (Turkmen Railways). The Government of Turkmenistan plans to convert these container terminals into trade-logistics centres. The following table sums up the areas available at these facilities for container yards and container freight stations:
Table 4.11: Basic characteristics of Turkmenistan’s inland container facilities
Name Area of container yard Area of container freight station
Zerger 26,800 square meters 10,000 square meters
Mayskaya 10,000 square meters 7,500 square meters
Ashgabat 26,930 square meters 4,500 square meters Long-term warehouse: 6,000 square meters

46
4.3.8 Uzbekistan
In Uzbekistan, intermodal operation is in the hands of an Open Joint Stock Company ,“Uztemiryulcontainer", established in 2002 as the outcome of the restructuring of "Uzjeldorcontainer", a subsidiary of the state-owned railway organization "Uzbekistan Temir Yullari". The restructuring was initiated with the objective of facilitating the development of container transportation in the country, enhancing the quality of services and cost-effectiveness of container operations, and improving the tracking and accounting of the container fleet.
As of now, "Uzbekistan Temir Yullari" owns 51% of the equity of “Uztemiryulcontainer”, while 39% belong to foreign investors and 10% are controlled by the company’s employees. “Uztemiryulcontainer” is now the official freight forwarding arm of "Uzbekistan Temir Yullari" providing export, import and transit services as well as the domestic transport of goods on the territory of Uzbekistan, CIS countries, Europe and Afghanistan; as well as warehousing, customs broking, container leasing, cleaning and repair services.
Since its creation "Uztemiryulcontainer" has established 7 branches in Tashkent, Ferghana, Bukhara, Termez, Horezm, Karshi, and Nukus, through which it manages an extensive network of 27 railway container terminals, out of which 14 terminals are equipped to handle ISO 20/40F containers. The company owns 86 gantry cranes of various capacity, 8 auto cranes, 19 tractor loaders, 22 forklifts, 45 trucks, as well as 1,779 units of ISO 20/40F and 7,059 units of other non-ISO domestic containers.
In 2006, Uztemiryulcontainer joined forces with Far East Transport Group to form the Asia Trans Terminal with the objective of developing and operating the Tashkent-Tovarnaya terminal. The first phase of the project saw US$ 0.5 million invested into the construction of the facility over an area of 42,250 square meters. Completed in May 2007, the terminal has an annual handling capacity of 2,000 TEU and a storage capacity of 400 TEU. Phase 2 of the project which started in 2008 is a US$ 2.5 million package aiming to upgrade the terminal equipment and facilities, and increase its storage capacity to 1,200 TEU.
In the first quarter of 2008 the terminal handled 3,500 TEUs, a marked increase over the 2,500 TEU handled in its first 8 months of operation between May and December 2007. The project showcases the priority afforded by the Government of Uzbekistan to the development of modern intermodal transport and logistics centres and its efforts to attract private investment.
4.3.9 Islamic Republic of Iran
The Islamic Republic of Iran is strategically located on a number of international corridors with access to international waters via ports on the Persian Gulf and the Sea of Oman, and to Eurasia via the Caspian Sea. As a result the Government of the Islamic Republic of Iran is giving high priority to intermodal transport to support the development of efficient long-distance and transit transport with special focus on the movement of containers. It has initiated policies to facilitate private sector involvement in intermodal transport and promote the development of multimodal transport operators/forwarders.
The main actors in the development of intermodal interfaces in the country are: the Ports and Shipping Organization, the Iranian Islamic Republic Railways (RAI), the Road Maintenance and Transportation Organization, the Customs Administration and the High Council for Trade-industrial Free Zones.

47
Ports. At present, container terminals are located in the ports of Khorramshahr, Emam Khomeini and Bandar Abbas. Another terminal is currently under construction at Shahid Beheshti port in Chabahar under the Iranian government’s policy to build container terminals in every port in the country. This policy is supported through the establishment of special economic zones, such as in Bushehr, Bandar Abbas and Amirabad, or free zones such as in Khorramshahr, Chabahar and Anzali.
Currently, the Islamic Republic of Iran’s main container gateway is the port of Bandar Abbas which has two container terminals handling 90% of the country’s container throughput. In July 2008, the port was officially renamed “Shahid Rajaee Special Economic Zone” upon completion of phase I of the Shahid Rajaee expansion project which saw 67 hectares of land being reclaimed for a future container terminal, the expansion of the port’s operational areas and a deepening of draught levels to accommodate larger container vessels with a view to boosting the port’s annual container capacity from 1.8 to 3 million TEUs. Phase II of the project will target the installation of 6th generation gantry cranes and equipment of the “transtainer” type to allow the port to reach an annual capacity of around 6 million TEUs by 2011.
Inland Container Depots. Railway container terminals in the country are owned and operated by RAI. In line with the company’s 2008-2009 plans, two projects for the establishment of multimodal transportation centres at Sarakhs and Bafq stations have been approved for a total investment of US$ 21 million and US$ 35 million, respectively. The project at Sarakhs includes the development of a US$ 8 million container terminal. The station, located at the border between the Islamic Republic of Iran and Turkmenistan, is the rail access for traffic to and from Central Asia and handles 88 per cent of Iran’s rail transit. RAI is also developing the 700-ha Aprin Central Terminal near Tehran. Two other terminals named West and Shahriar are also being developed near Tehran by the Customs Administration.
4.3.10 Turkey
Over the years Turkey has developed an extensive transportation network covering both rail and road, including access to the country’s major international ports on the Black Sea in the north, the Mediterranean Sea in the south and the Aegean Sea in the west. The location of the country at the crossroads between Asia and Europe gives it substantial potential to play an important logistics role in international trade. Turkey’s expectations with regard to its accession to the European Union and its growing transit importance for countries of Central Asia and the Caucasus have enhanced this potential and placed the development of intermodal transport high on the agenda of the Turkish government.
The major priorities, set out by the Ministry of Transport in the country’s Strategic Transport Plan, include (i) establishing greater balance between transport modes, (ii) aligning national regulation pertaining to combined transport with international legislations, (iii) enhancing the role of rail and maritime transports, (iv) integrating all modes into a comprehensive multimodal transport system, and (v) seeking greater complementarities between modes.
At present, intermodal interfaces are mainly used for transshipments between rail, road and water transport. While sea ports in Turkey are widely used for intermodal transport, the country’s rivers have not yet been developed into a network of inland waterways. Most intermodal transport operations are currently centered in Halkali and Haydarpasa (serving Istanbul), Kosekoy (serving Izmit), Ankara, Alsancak, Bogazkopru (serving Kayseri), Iskenderun, Mersin and Gaziantep (Baspinar), where container depots of the Türkiye Cumhuriyeti Devlet Demiryollari (TCDD), the state-owned railway organization, are located.

48
In line with TCDD’s transport development strategy, these container depots are destined to be upgraded into logistic villages – a defined areas within which all activities relating to transport, logistics and distribution of goods, both for domestic and international transit, will be carried out. By TCDD’s definition all logistics villages must allow access to all companies involved in intermodal transport activities, be equipped with all the public facilities for its operations, include a range of public services, and preferably be served by multiple transport modes (road, rail, deep sea, inland waterway, air). Turkey’s first freight village started operation in July 2007 at Samsun and work has already started to construct the Halkali freight village in the vicinity of Istanbul. Meanwhile, the design of the logistics villages at Kosekoy (Izmit), Bogazkopru (Kayseri), Hasanbey (Eskisehir), and Gokkoy (Balıkesir) has been completed. In addition, proposals for the development of four additional villages in Usak, Yenice (Mersin), Palandoken (Erzurum) and Konya have been submitted to the State Planning Organisation. These villages will all provide on-site customs clearance, their basic characteristics are given in Table 4.13.
In determining the appropriate location of freight villages, the Turkish government developed a set of criteria, namely: the proximity to the Organized Industrial Zones, the area’s freight potential, the contribution to economic and technological developments, easy access to the local road network and the capability to meet the logistic needs of industry.
Along with the development of facilities, TCDD is also enhancing the efficiency and quality of rail services through the expansion of container block-train services. To date, it operates a daily number of 170 block-trains, both domestic and international, that connect Turkey with countries in Europe (Austria, Germany, Hungary, the Netherlands, Romania and Slovenia), the Middle East (Iraq, Islamic Republic of Iran and Syria) and Central Asia (Kazakhstan and Turkmenistan).
4.4 The Southern Corridor
While the Southern Corridor was studied by UNESCAP with the idea of providing ultimately a continuous rail connection between South-East Asia (including southern China) and Europe as well as facilitating movements within the corridor, it also serves a connectivity function for the hinterland regions of the countries that it crosses. This is particularly important for the landlocked countries along the corridor such as Afghanistan, Bhutan and Nepal.
4.4.1 Afghanistan
As a landlocked country, Afghanistan depends on neighbouring transit countries for its access to seaports. As a transit country, Afghanistan itself plays a vital role in the region to connect Central Asian with South Asian countries. By combining its own foreign trade with transit traffic, Afghanistan could become an important regional logistics hub. For this to happen, Afghanistan requires a modern transit system, dry ports and efficient border operations.
Afghanistan has borders with the Central Asian republics of Tajikistan, Turkmenistan and Uzbekistan, as well as with the Islamic Republic of Iran, Pakistan and China. Currently, there are eight border points which are operational and provide some facilities for trucks. They are located at: Torkham and Spin Boldak (border with Pakistan), Islam Qala and Zaranj (border with the Islamic Republic of Iran), Aqina and Torghundi (border with Turkmenistan), and Ai Khanum and Shirkhan Bandar (border with Tajikistan).

49
Table 4.12: Basic characteristics of Turkey’s planned freight villages
Name Location CY area (m2)
Equipment Investment cost
(Turkish Lira)
Expected annual
throughput(Tonnes)
Details of services to be provided
1 Halkali 28 km to Haydarpasa seaport 45,000 47,553,175 1,500,000
2 Kosekoy 16 km to Derince seaport 30,000 36,816,825 1,150,000
3 Bogazkopru 328 km to Mersin seaport 45,000 47,928,420 1,500,000
4 Hasanbey 239 km to Derince seaport 25,000 54,478,000 750,000
5 Gokkoy 110 km to Bandirma seaport 54,000 51,701,078 1,000,000
6 Usak 287 km to Alsancak seaport 20,000 14,636,443 500,000
7 Yenice 44 km to Mersin seaport 81,950 44,324,857 1,000,000
8 Palandoken 940 km to Samsun seaport 37,500 28,742,620 800,000
9 Konya 390 km to Mersin seaport n.a.
Forklifts, container cranes, rubber-tyred cranes, automatic unloading system, dynamic wagon scales
44,544,880 1,000,000
Container handling and storage, intermodal transfer, customs inspection and clearance, container stuffing and shipping, container light repair, cargo consolidation, transport booking, banking and insurance services, inventory management
Source: country report

50
Among these border points, Torkham has been newly constructed based on a model of border point establishments supported by the European Commission. It has modern warehouses and equipment. In addition, a refurbished road links this border point with Jalalabad and Kabul. UNCTAD's Automated SYstem for CUstoms DAta (ASYCUDA) started its first pilot project at this border, where it is now fully operational. UNCTAD conducted surveys in February and October 2007, reporting a 40 per cent increase of trucks between the first and the second survey. The two surveys also indicate that the average time for trucks to cross the border was cut from 55 minutes to 43 minutes during the period of February to October.
Islam Qala has a large transshipment area for cargo which requires transshipped into local trucks. The area doubles as a parking lot for trucks which do not transship their goods at the border. Warehousing facilities are also available for goods awaiting customs clearance.
In 2007, the construction of a new bridge was completed over the Pyandzh river near Shirkhan Bandar. The bridge is expected to facilitate trade and transit between Afghanistan and Central Asia. The European Commission has financed the construction of a new road coming from the bridge to the border customs control zone. The construction of additional installations is planned at Shirkan Bandar to further facilitate cross-border movements.51
Afghanistan’s nascent rail infrastructure does not yet play any significant role and the transport sector strategy outlined in the “Afghanistan National Development Strategy” currently places emphasis on the development and rehabilitation of highways with the support of international donors. The only existing rail links are two short cross-border extension of the rail networks of neighbouring countries, namely: 2 km of the 10-km section from Gushgy (Turkmenistan) to Torghundi and 10 km of the 15-km section from Termez (Uzbekistan) to Khairaton across the Amu Darya river. Transshipment yards with road and rail access exist at Torghundi and Khairaton; they are equipped with warehouses and handling equipment.
The railways of the Islamic Republic of Iran (RAI) have started work to construct a 191-km standard-gauge single-track line from Khaf in the eastern part of the Islamic Republic of Iran to Herat the main city in Afghanistan’s western region. The line is made up of a 77-km section and a 114-km section in Iranian and Afghan territories, respectively. The new line will give access to the Port of Bandar Abbas on the Persian Gulf via the Bafq-Mashhad line that was inaugurated by the Government of the Islamic Republic of Iran in May 2005.
RAI sees the Herat line as the embryo of a future 700-km extension across Afghanistan’s north-western region to Shirkhan Bandar on the border with Tajikistan and to Khairaton from where a rail access to Termez (Uzbekistan) is already in place. In November 2008, the Governments of Afghanistan, Uzbekistan and the Asian Development Bank signed a Memorandum of Understanding (MOU) to expand trade and economic opportunities through railway transport. With the MOU in place, the Government of Afghanistan has requested technical and financial assistance from ADB in order to prepare a pre-feasibility study for the proposed link with the Government of Uzbekistan promising its full cooperation in the conduct of the study. Meanwhile, long-standing proposals to extend the route from Khairaton southward to Mazar-e Sharif, Pol-e Komri, Kabul and ultimately through to Pakistan are once again being discussed. In 2007, the authorities in Pakistan announced their readiness to start work on the Chaman - Spin Boldak cross-border section in the south of the country conditional to an agreement between the two governments.
51 Above information from United Nations Conference on Trade and Development (UNCTAD), December 2008.

51
At this stage, however, the international situation in the region as well as institutional and project management capacities are major challenges for the development of intermodal transport in Afghanistan.
4.4.2 Bangladesh
In Bangladesh containerisation started in 1976 with the first arrival of containers at the port of Chittagong. In 2006 the port handled 882,411 TEUs, i.e. 96 per cent of the country’s containerized international trade52. An estimated 75 per cent of this traffic is destined for or originates in Dhaka. Other containerised traffic is handled in the port of Mongla. While the number of TEUs handled at Mongla is marginal, the port specializes in the handling of reefer containers with round-the-clock power supply facilities.
As opposed to what takes place in most other countries where long distance road transits are normally undertaken by heavy goods vehicles in order to obtain economies of scale, Bangladesh faces specific road infrastructure constraints due to the presence of a large number of rivers without high-capacity bridges. As a result of these topographical constraints logistics services rely on small trucks for distribution hence a high degree of stuffing and destuffing of containers at the ports and higher unit costs. Inland waterways play an important role for the movement of goods to inland destinations but the mode has not yet sufficiently developed to meet the requirements of modern supply chain management. Bangladesh Railways (BR) introduced dedicated container services in 1987 between the port of Chittagong and the ICD in Dhaka. The number of TEU transported by rail rose steadily year on year from 29,953 TEUs in 1996-97 to 81,270 TEUs in year 2005-06. However, these volumes represent only 10 to 11 per cent of the overall volumes being transported between the two cities. The other 90 per cent are stuffed or de-stuffed at the port and travel mostly in small 7-ton capacity trucks. This system creates congestion at the port, generates low productivity per unit and places capacity constraints on the country’s road infrastructure.
The Government of Bangladesh is now aware of the need to redistribute the share of passenger and freight traffic among all modes to release pressure on highways and unleash further economic growth. The development of intermodal facilities will be a step towards this objective. The industrial hubs are increasingly being connected to the country’s road network with railway and Inland Water Transport (IWT) also being available. The construction of the Jamuna Multipurpose Bridge has improved road and rail connectivity between the western and eastern parts of the country and the planned construction of the Padma Bridge on the Mongla-Dhaka corridor will further enhance connectivity within the country as well as with India.
Currently, there are a number of ICDs in the country. A public sector ICD and a number of private sector ICDs. The main and lone public sector ICD is the Kamalapur ICD adjacent to the main railway station at Dhaka. It covers an area of 100,000 square-meters, including a Container Freight Station of 8,182 square-metres and four warehouses with the largest covering an area of 54,000 square-metres. Annual capacity is reported to be 90,000 TEUs. Containers can be stored in three stacks. The ICD can only handle dry boxes as no reefer plugs are available on the premises. The ICD is operated by the Chittagong Port Authority (CPA) with train operation carried out by BR. Revenues are shared between CPA and BR. Although the ICD is under public ownership, handling equipment and operation is in the hands of private sector. In recent times equipment failure from the private sector put severe constraint on operation and the Ministry of Planning of Bangladesh recently issued tenders for a new operator. The ICD also faces problem due to its location. Located close to Dhaka
52 Source: Containerisation International Yearbook, 2008.

52
main railway station it is surrounded by busy town markets and commercial buildings. This complicates access to the site and precludes future expansion.
In 1998, the National Board of Revenue issued guidelines for the construction of private sector Container Yards (CY) as a result of which 11 CYs became operational. However, following the regulation in place, all these CYs are located within a 20-km radius from the port of Chittagong.
Subsequently, in 2001, with a view to developing intermodal transport and boost the country’s logistics capabilities, the Government of Bangladesh established Bangladesh Sthala Bandar Kartipaksha (BSBK) under the Ministry of Shipping with the objectives of:
facilitating trade with neighboring countries, e.g. India, Nepal, Bhutan and Myanmar;
raising national income through increased import and export; reducing the trend of smuggling; enabling private enterprises to participate in the operation port services for higher
level of efficiency; strengthening PPP (Public Private sector Partnership) for future development and
poverty alleviation; promoting economic activities in remote areas53.
At the time, out of 181 land customs stations, 13 were designated as Land Ports and placed under the control of BSBK. Out of these 13 land ports Benapole port is operated by the Authority itself and other ports are operated or to be operated by private operators on a BOT basis. Benapole Land Port started operation in 2001, while the ports at Teknaf, Sonamosjid and Hilli started operation in 2004, 2006 & 2007, respectively. Nine other ports will be developed in stages at Akhaura, Banglabandha, Bohmra, Bibir Bazar, Birol, Burimari, Haluaghat, Darsana and Tamabil. Under the BOT system, BSBK acquires the land and leases it to an investor selected through a bidding process in accordance with the country’s “Private Sector Infrastructure Guidelines”. The selected investor develops, operates and maintains the port for a period of 25 years against payment of a royalty fee to BSBK. After expiry of the lease, land and assets will return to BSBK.
BSBK recognizes the potential economic benefits of efficient inland intermodal facilities in terms of increased economic activities and employment opportunities. Within the first six years of operation, the land ports already in operation have earned BSBK an estimated Tk 3095 lakh, i.e. US$ 4.5 million, and generated employment opportunities for more than ten thousand families, directly or indirectly.
Not included in the above land ports is the new ICD for Dhaka which the Government of Bangladesh plans to develop under its Multimodal Transport Policy aiming to strengthen the country’s competitiveness on the export market and reduce the cost of imports. The new ICD will be located at Dhirasram, north of Dhaka on the main Dhaka-Mymensingh rail line and close to highways. It will shorten the distance from Chittagong and will also serve bilateral trade with India due to the extension of dual gauge track to Dhirasram. The ICD will be close to the garment factories at Mirpur. It will serve current container traffic from Dhaka Export Processing Zone and Tongi as well as the future industrial development around Tangail and Mymensingh.
53 Website of Bangladesh Land Port Authority at www.bsbk.gov.bd

53
4.4.3 Bhutan
Bhutan is facing unique challenges in developing transport infrastructure due to its geographical location and mountainous terrain. Road and air transport are the only two modes of transport for international trade. A 167-km-long highway (AH 48), which is now being upgraded to double lane standard, connects the capital Thimphu with the border town at Phuentsholing which sees 82 per cent of the country’s international trade. The rest goes through Samdrupjongkhar, Samtse and Gelephu. The country’s main trading partner is India which accounts for 69 per cent of imports and 77 per cent of exports. There is a Free Trade Agreement between Bhutan and India. Transit cargo from Kolkata and Haldia, Bhutan’s main maritime gateways in India, is subject to minimum checks and Bhutanese-registered vehicles enjoy free movement in India54. Distances from Phuentsholing to Kolkata and Haldia are 735 km and 960 km, respectively.
Import and export cargo are processed at three small isolated customs yards depending on whether it is (i) cargo from India, (ii) cargo from a third country with a single commodity; or (iii) cargo from a third country with mixed commodities. Foreign trucks entering Bhutan are directed to the designated area in each respective border town. After clearance, goods are re-loaded into Bhutanese trucks or small vans depending on the size and volumes of the consignments. Containerised cargo is moved in small capacity trucks or in 20-ft containers. 40 ft containers are rare due to fragmented imports and small volumes. The small capacity vehicles used for cargo movement are owner-driven with few fleet-operating companies. This structure explains the slow modernization of the fleet.
There is recognition among transport policy makers that the country is in urgent need of an ICD or dry port in Phuentsholing or a nearby alternative location. At present, the combined area for customs, the parking of trucks and warehousing is about 2,000 square-meters. In the absence of a proper parking area trucks are required to park on the road-sides, causing congestion and delays. Moreover, the absence of cargo handling equipment such as fork-lifts and cranes result in the employment of manual labour for the transshipment of cargo causing further delays. A feasibility study, completed in 2004, determined the cost of an ICD or dry port at US$ 3.1 million and up to US$ 19 million for the parallel development of an industrial estate. However, the construction has not yet started due to funding constraint as well as limited land area available at the proposed site, .i.e. only 7 acres are currently available against an estimated requirement of 20 acres. Bhutan is very much dependent on India for its access to international markets and the two countries are cooperating to improve transport infrastructure and services. The Government of India is providing assistance for the development of road infrastructure on both sides of the border and has financed a feasibility study to connect five borders towns to the nearest railheads on Indian Railways. The extension of the rail link from Hashimara (India) to the Phuentsholing dry port would provide direct rail connection from the ports of Haldia/Kolkata.
4.4.4 India
India’s high-paced economic growth has been accompanied with a sharp increase in the country’s international trade passing through Indian ports which now handle 95 per cent of the country’s total volume of trade and 70 per cent in terms of value. India’s port container throughput has also been rising at a steady pace, especially at Jawaharlal Nehru Port (JNPT) in Mumbai which controls nearly 60 per cent of total container traffic. From fiscal year 1998-99 to fiscal year 2007-08, container traffic at major ports rose from 1.93 million TEUs to 6.71 million TEUs out of which JNPT handled 3.89 million TEUs and ranked number 24 among the world’s top container ports.
54 Source: Country paper.

54
Given India’s vast territory and growing population, efficient port connectivity to the hinterland areas is critical. In 2007, it was estimated that congested ports as well as roads and power shortages added to the cost of operations for companies and shaved off 2 percentage points from growth in Asia's third-largest economy55.
Indian Railways (IR) carries 30 per cent of international container trade, mostly through its intermodal arm CONCOR which was corporatized in 1988 taking over 7 ICDs which have now been extended to 58 terminals, of which 48 are export-import container depots, and 9 exclusive domestic container depots. CONCOR’s customs bonded Inland Container depots are dry ports in the hinterland, and serve the purpose of bringing all port facilities including customs clearance to the customer's doorstep. The terminals are almost always linked by rail to IR’s network - unless their size or location dictates that they be linked by road - and provide a spectrum of facilities in terms of warehousing, container parking, repair facilities, and even office complexes. Map 2 shows the network of CONCOR’s terminal.
The Northern region is most prominent in CONCOR’s activities. The region is rich in agriculture and industrial development, and provides a natural concentration of both demand and supply for both international trade as well as domestic traffic. It enjoys a natural cost and transit advantage for rail movement due to the long lead to the gateway ports and major consumption centers. As much as 40% of CONCOR’s throughput and revenues are contributed by the 14 terminals that the company operates in the region. Among these terminals is the Tughlakabad ICD near Delhi. The ICD, which was commissioned in 1993, has a capacity of 300,000 TEUs per year and is equipped with modern handling equipment and facilities. Its main characteristics are shown in Table 4.13.
Table 4.13: Main characteristics of Tughlakabad ICD
Warehouse space Total area
Export ImportRail sidings Equipment
60 hectares 10,000 m2 6,000 m2 4(full train length)
- 6 Rubber-Tyred Gantrie - 2 rail-mounted gantries - 16 Reach-stackers for loaded
containers - reach-stacker for empty cont-
ainers - 50 internal movement trailers - cargo handling forklifts
Source: CONCOR’s website at http://www.concorindia.com
As CFS operator, CONCOR adds value to the logistics chain by offering value added services such as (i) transit warehousing for import and export cargo, (ii) bonded warehousing, enabling importers to store cargo and take partial deliveries, thereby deferring duty payment, (iii) Less than Container Load (LCL) consolidation, and reworking of LCL cargo at nominated hubs, and (iv) air cargo clearance using bonded trucking. CONCOR’s network of terminals and range of services has allowed continued year-on-year growth since the company was established. The following Table 4.14 shows the business trend over the period FY 2003-04 to 2007-08.
55 “India Needs to Boost Infrastructure”, Bloomberg - 31 October 2007.

55
Map 2. Network of CONCOR’S terminals
Source: CONCOR’s website at http://www.concorindia.com

56
Table 4.14: CONCOR’s container traffic in TEUs, fiscal year 2003-04 to 2007-08.
2003-04 2004-05 2005-06 2006-07 2007-08
International 1,251,618 1,376,516 1,556,714 1,715,661 1,977,399
Domestic 350,501 351,460 373,848 389,605 470,370
Total handling 1,602,119 1,727,976 1,930,562 2,105,266 2,447,769
Source: CONCOR’s website at http://www.concorindia.com
Key to CONCOR’s success has been the policy to invest in a modern fleet of 7,200 dedicated container platforms allowing higher operating speed and develop an advanced information system that facilitates terminal management, makes e-business applications available for customers and tracks both containers and trains.
Recent developments have been marked by the introduction of double-stack container services between Kanakpura (Jaipur) and Pipavav, as well as Kankakpura and Mundra. Another recent development has been the opening of rail container operations to a number of private railways. So far 14 private operators have been granted licences to operate container services on IR’s network. In July 2007, APL India Lynx (APLIL) started operation between Loni ICD near Delhi and Jawaharlal Nehru Port in Mumbai. APLIL is a joint venture between Hindustan Infrastructure Projects and Engineering (HIPE) and the Singapore-based shipping line Neptune Orient Line which is a parent company of American President Line (APL). APLIL plans to invest in new equipment, start services on other corridors and develop its own ICD in the northern state of Haryana56.
Future development will be the construction of a 1,483-km Dedicated Freight Corridor from JNPT port to CONCOR’s flagship ICD at Tughlakabad near New Dehli. CONCOR will also seek higher hinterland penetration of container traffic. This is particularly important in view of the fact that India is the intermodal gateway for Bhutan and Nepal which are both landlocked, least-developed countries.
The future development of intermodal transport in India calls for specific measures to increase rail and road capacity as well as establish modern intermodal facilities to serve the national needs and facilitate transit to Bhutan and Nepal. To solve current impediments to smooth cross-border intermodal traffic, including along the routes of the Asian Highway and Trans-Asian Railway networks, the Government of India is planning to build four Integrated Check Posts (ICPs) at (i) Petrapole on AH1 and NH35 for traffic with Bangladesh, (ii) Moreh on NH39 for traffic with Myanmar, (iii) Raxaul on AH42 and NH28A for traffic with Nepal and (iv) Wagah on AH1 and NH1 for traffic with Pakistan.
The investment envisaged to accommodate the expected increase in international trade needs involvement of both public and private sector. To this effect, India is developing a series of partnerships with state authorities or private sector partners. Some examples of large scale projects initiated by the private sector include the Mumbai Offshore Container Terminal with an annual capacity of 1.2 million TEUs and draught of 13.5 m; the Gateway Terminals India at JNPT; Star Track Terminals – CFS at Dadri ICD with an annual capacity of 75,000 TEUs capacity; and the India Gateway Terminal-International Container Transshipment Terminal (ICTT) at Vallarpadam.
However, the most ambitious project being currently contemplated by the Government of India is the Delhi-Mumbai Industrial Corridor project to be implemented by an ad hoc
56 “APL India Lynx invests more, adding another train to JNP/Lori service”, Containerisation International,August 2007.

57
autonomous corporation made up of government agencies and private sector entities. The project will see major expansion of infrastructure and industry, including industrial clusters and rail, road, port and airport connectivity in the six states that the corridor will cross, i.e. Dehli, Maharashtra, Gujarat, Haryana, Uttar Pradesh and Rajasthan. It will be within a band of 150 km on either side of the 1,483-km dedicated freight corridor between JNPT port in Mumbai and Tughlakabad ICD near Delhi and will cover an area housing 180 million people. The project is modeled after the Tokyo-Osaka corridor developed in Japan which is said to have contributed two-thirds of Japan's gross domestic product in its 30 years of existence. It will be implemented in two phases, i.e. 2008-2012 and 2012-2016, at a cost of US$ 90 billion. Included in the work are the construction of airports, ports, roads and a 4,000 MW power plant, the establishment of special economic zones and the creation of several industrial parks. The project is expected to deliver a “2-3-4-5” benefit, i.e. double employment, triple industrial output and quadruple exports from the region in five years.
4.4.5 Nepal
Nepal is a landlocked country with only two neighbouring countries, namely: China in the north and India in the west, east and south. Transportation is essentially via road and air. The country’s rail system is in at an embryonic stage with only 40 km of line dedicated to passenger traffic and a 12-km connection between Birgunj ICD and the nearest railhead in India. Currently, there are three ICDs operating in Nepal, one is the rail-served ICD at Birgunj and the other two are the road-served ICDs at Biratnagar and Bhairahawa. All three are located within 500 metres across the border with India. These ICDs were developed by the Government of Nepal at a cost of US$ 28.5 million with assistance from the World Bank. A dry port has also been constructed at Kodari on the Nepalese side of the border with China to facilitate bi-lateral trade. A fourth ICD is under construction at Kakarbhitta in the eastern part of the country to facilitate trade with Bangladesh, Bhutan and India. Except Bhairahawa, all these ICDs are located on Asian Highway routes AH2 or AH42. They are also on the highway corridors No 10, No 7, No 2 and No 4 developed by the South Asia Association for regional Cooperation (SAARC).
The Birgunj ICD which was commissioned in July 2004 is leased to private sector for operation. The ICD facilities includes broad gauge railway yard with 6 full length lines, a container stacking yard, a covered container freight station, goods shed, and parking space. It is fitted with the Automated SYstem for CUstoms DAta (ASYCUDA) developed by UNCTAD. In May 2004, an agreement was signed between India and Nepal to regulate rail traffic between the Birgunj ICD and India. In December 2008, the agreement was amended to facilitate the movements of tank wagons for liquid cargo and flat wagons for bilateral break-bulk cargo.
There have been many policy statements regarding Nepal, the need to utilize transit potential and be developed as a transit country to facilitate trade between China and India, the two emerging economic powerhouse in Asia. But much remains to be done to exploit the potential of transit trade between China and India. The feasibility study for a 60-km long Kathmandu-Birgunj rail link has been completed. Furthermore, talks are underway to extend the railway line from Lhasa in the Tibet region of China to the dry port at Kodari and further south to Kathmandu. However, the project still is at a conceptual stage. Finally, four rail connections to the nearest railheads in India are being studied, these are: (i) Jogbani (India) to Biratnagar (Nepal) -15 kms; (ii) Nepalgunj road (India) to Nepalgunj (Nepal) - 10 kms; (iii) Nautanwa (India) to Bhairahawa (Nepal) via Sunauli-15 kms; and (iv) New Jalpaiguri (India) to Kakarbhitta (Nepal) via Panitanki -35 kms.
Financing, difficult terrain, and political stability remains the main challenges for Nepal in its efforts to develop an efficient intermodal transport system.

58
4.4.6 Pakistan
The transport system of Pakistan plays an important role for the national economy given that a number of major cities are located in the north of the country and are virtually landlocked. It also plays a crucial transit role for landlocked Afghanistan and beyond to the Central Asian republics. These two factors constitute a strong incentive to develop intermodal facilities as an extension of the ports of Karachi and Qasim in the south. In 2006, the two ports handled 1.1 million and 0.63 million TEUs, respectively. The development of intermodal transport in Pakistan dates back to 1974 with the establishment of the Lahore Dry Port at Mughalpura, 1,240 km from Karachi. The ICD has a capacity of 1,900 TEUs in single-tier configuration. The container yard covers an area of 38,513 square-metres. In 2006-07, it handled 41,082 TEUs. A range of services are available, including round-the-clock on-site customs clearance, banking facilities and rail/road interchange. Pakistan’s other ICDs are located at Peshawar and Islamabad 1,763 km and 1,620 km from the port of Karachi, respectively. The Peshawar ICD was established in 1986, it has a container yard area of 12,000 square-metres. Traffic congestion and the lack of space are impeding future expansion and the Government of Pakistan plans to relocate it. In 2006, it handled 9,350 TEUs. The ICD at Islamabad is of a smaller size with a container yard area of only 4,582 square-metres. In 2006-07, it handled 4,680 TEUs. All three ICDs are owned and operated by Pakistan Railways.
Two private sector dry ports also exist at Sambrial and Faisalabad. The Sambrial facility is exclusively served by road and caters for exports of the manufacturing sector in the area. The Faisalabad facility is served by both road and rail and caters for export from the local textile industry and import of machinery. Meanwhile, a dry port at Sust on the Karakoram highway has been constructed to facilitated trade with China.
The Government of Pakistan is taking measure to infuse private sector investment and management into intermodal transport. The Prem Nagar Inland Container Terminal (ICT) is a Rupees 1.7 billion public private sector project being co-financed by Pakistan Railways and two private companies. The site is scheduled to commence operation in 2008-2009.
A number of other projects are also being developed to increase the country’s intermodal capabilities. They are mostly taking place in the Lahore area such as the ICT established by the Bulley Shah Paper Mills at Kot Radha Kishen railway station, 60 km south of Lahore, with a future annual capacity of 20,000 TEUs; the additional terminal at Lahore dry ports being established by the firm Mega Rail with an annual capacity of 12,000 TEUs or the ICT planned to be developed by the Sheikhupura Dry Port Trust at Chichoki Mallian railway station, north of Lahore.
Finally, the construction of a railway container terminal at Gwadar port has been approved. The terminal will cover an area of 600 acres. The port is seen as a gateway for trade with Afghanistan and Central Asia. A future railway line to China has also been discussed.
4.4.7 Sri Lanka
The transport system of Sri Lanka consists of roads, railways, airports and sea ports. Colombo Port with a draught to 15 m has established its position as a dominant transshipment port for the Indian subcontinent. The port is connected to the national rail network; however virtually all cargo movements in and out of the port is by road transport. The majority of container traffic at Colombo is handled at three container terminals, namely: the Jaya Container Terminal with a design capacity of 2 million TEUs, the South Asian Gateway Container Terminal with a design capacity of 1 million TEUs and the Unity Container Terminal with a design capacity of 300,000 TEUs. The South Asian Gateway

59
Terminal is leased out to private sector and the other two are under the administrative control of Sri Lanka Port Authority57. In 2007, the port of Colombo handled 3.38 million TEUs and ranked number 29 among the world’s top container ports. Transshipment traffic accounts for 70 per cent of the port container traffic.
The policy of the Government of Sri Lanka aims to boost the country’s intermodal capability through a specific strategy driven by a Strategic Enterprise Management Agency (SEMA) and involving the development of an Integrated Multimodal Cargo and Logistics Centre (IMCLC), four ICDs at Veyangoda, Ratmalana, Sapugaskanda and Hambantota, and six inland container yards at Ragama, Polgahawela, Anuradhapura, Colombo City, Kalutara South and Koggala. The design details and functions of each are described in the following tables 4.15 and 4.16.
Table 4.15: Design characteristics and functions of planned ICDs in Sri Lanka
Veyangoda ICD Ratmalana ICD Sapugaskanda ICD Hambantota
Distance from Colombo Port
23 km 18 km 8 km 245 km
Area (m2) 35,000 35,000 40,000 45,000
Annual handling capacity (TEU)
45,000 45,000 45,000 60,000
Handlingequipment
Rubber Tyre Gantry Rubber Tyre Gantry Rubber Tyre Gantry Rail Mounted Gantry
Investment cost US$ 10.5 millions Not known Not known Not known
Services Container handling and intermodal transfer, customs inspection and clearance
Container handling and intermodal transfer, customs inspection and clearance
Container handling and intermodal transfer, customs inspection and clearance
Container handling and intermodal transfer, customs inspection and clearance
Table 4.16: Design characteristics and functions of planned ICYs in Sri Lanka
Ragama ICY Polgahawela ICY
Colombo City ICY
Kalutara South ICY
Koggala ICY
Distance from Colombo Port
14 km 71 km 5 km 44 km 131 km
Area (m2) 3,800 3,000 3,800 3,000 3,500
Annual handling capacity (TEU)
6,000 3,000 6,000 3,000 4,500
Handlingequipment
Prime mover Prime mover Prime mover Prime mover Rail Mounted Gantry
Investment cost US$ 0.6 million US$ 0.5 million US$ 0.6 million US$ 0.5 million US$ 0.2 million
Services Container handling, storage and intermodal transfer, bonded warehouse
Container handling, storage and inter-modal transfer, bonded warehouse
Container handling, storage and inter-modal transfer, bonded warehouse
Container hand-ling, storage and intermodal transfer, bonded warehouse
Container hand-ling, storage and intermodal trans-fer, bonded warehouse
Source: Sri Lanka Railways
57 SAARC Regional Multimodal Transport Study, SAARC secretariat, 2006.

60
The establishment of a Special Purpose Vehicle (SPV) to finance and operate intermodal facilities and services between the port of Colombo and the IMCLC has been initiated. The Government of Sri Lanka is also investing into the upgrading of the country’s rail system to give rail a more prominent role in the future of intermodal transport. Funding, however, remains a major constraint to the development of intermodal transport in Sri Lanka.
__________

61
Chapter 5. Relevant intermodal facilities and intermodal freight transport development outside of the UNESCAP region
Within the past 10-15 years, several developed countries have experienced very rapid growth in the application of intermodal transport for long distance inland freight movement within their territories. This growth has been made possible by the widespread adoption of advanced logistics management principles and concepts, supported by government policies aimed at achieving sustainable distribution through the increased use of rail transport.
In the United Kingdom, several countries of Western and Southern Europe and in the United States, among others, supply chains have been shortened and associated distribution costs thereby dramatically reduced through the creation of intermodal interface and freight storage facilities at strategic, rail connected locations. These facilities are described differently in different countries, e.g. Strategic Rail Freight Interchanges in the United Kingdom, Freight Villages in Europe and Inland Ports or Multimodal Transport and Distribution Hubs in the United States. However, they all have essentially the same function: to consolidate modal interchange, customs clearance, storage and distribution and in some cases, even manufacturing, activity at a single location. Given this function and the fact that these facilities accommodate companies and government agencies comprising the trading and distribution community, they may also be characterized as trade and distribution clusters.
There are differences in the ownership, financing and management methods applying to intermodal interfaces in the different countries surveyed and these differences are highlighted for each country (or region in the case of Europe) in the following sections. However, these countries provide examples of best international practice in the development of freight intermodal interfaces and in the application of intermodal transport principles, and hence can provide suitable models for similar initiatives in Asian countries.
5.1. Europe
5.1.1. United Kingdom
While the commercial opening of the Channel Tunnel in 1994 provided the impetus for the development of large-scale freight intermodal interfaces in the United Kingdom, the British Government has only comparatively recently enunciated a policy on “Strategic Rail Freight Interchanges”.
(i) Strategic Rail Freight Interchange Policy58
The policy document defines Rail Freight Interchanges and Strategic Rail Freight Interchanges, as follows:
Rail Freight Interchanges (RFI) are defined as facilities at which freight can be transferred between transport modes, mainly to facilitate its primary trunk journey from A to B;
Strategic Rail Freight Interchanges (SRFI) are defined as facilities which optimize the use of rail in the freight journey and minimize the secondary distribution leg by road.
58 Strategic Rail Authority (SRA) : Strategic Rail Freight Interchange Policy, May 2004.
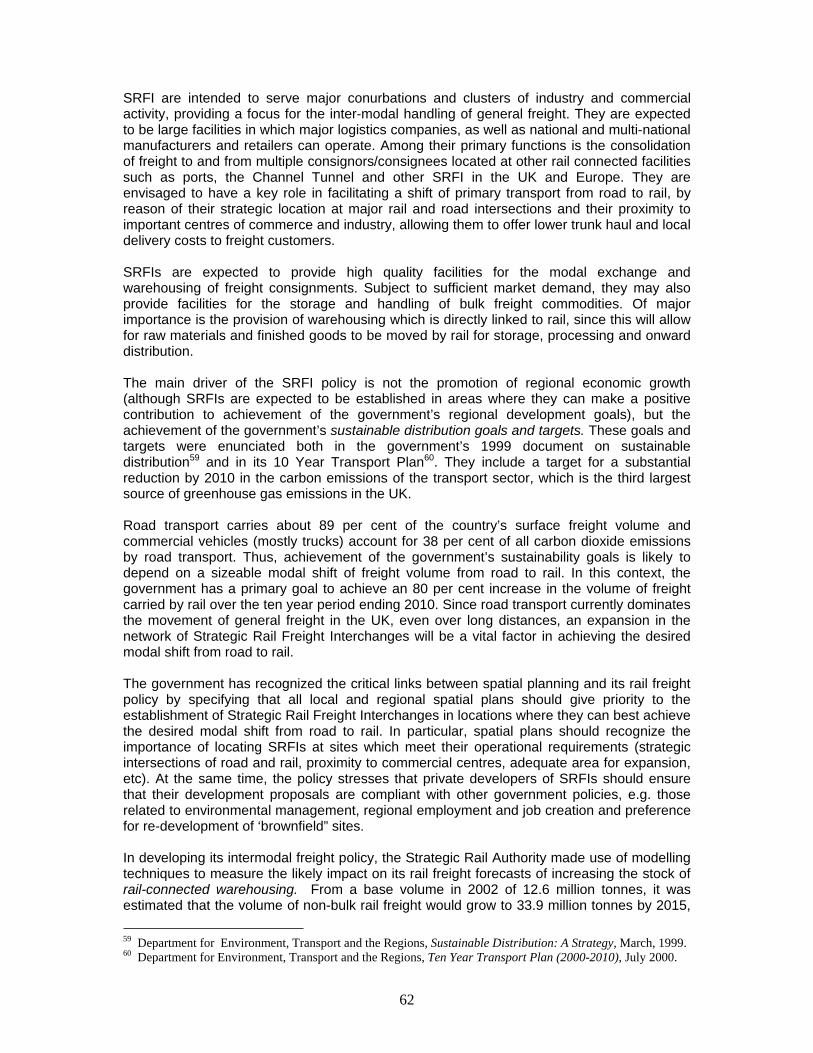
62
SRFI are intended to serve major conurbations and clusters of industry and commercial activity, providing a focus for the inter-modal handling of general freight. They are expected to be large facilities in which major logistics companies, as well as national and multi-national manufacturers and retailers can operate. Among their primary functions is the consolidation of freight to and from multiple consignors/consignees located at other rail connected facilities such as ports, the Channel Tunnel and other SRFI in the UK and Europe. They are envisaged to have a key role in facilitating a shift of primary transport from road to rail, by reason of their strategic location at major rail and road intersections and their proximity to important centres of commerce and industry, allowing them to offer lower trunk haul and local delivery costs to freight customers.
SRFIs are expected to provide high quality facilities for the modal exchange and warehousing of freight consignments. Subject to sufficient market demand, they may also provide facilities for the storage and handling of bulk freight commodities. Of major importance is the provision of warehousing which is directly linked to rail, since this will allow for raw materials and finished goods to be moved by rail for storage, processing and onward distribution.
The main driver of the SRFI policy is not the promotion of regional economic growth (although SRFIs are expected to be established in areas where they can make a positive contribution to achievement of the government’s regional development goals), but the achievement of the government’s sustainable distribution goals and targets. These goals and targets were enunciated both in the government’s 1999 document on sustainable distribution59 and in its 10 Year Transport Plan60. They include a target for a substantial reduction by 2010 in the carbon emissions of the transport sector, which is the third largest source of greenhouse gas emissions in the UK.
Road transport carries about 89 per cent of the country’s surface freight volume and commercial vehicles (mostly trucks) account for 38 per cent of all carbon dioxide emissions by road transport. Thus, achievement of the government’s sustainability goals is likely to depend on a sizeable modal shift of freight volume from road to rail. In this context, the government has a primary goal to achieve an 80 per cent increase in the volume of freight carried by rail over the ten year period ending 2010. Since road transport currently dominates the movement of general freight in the UK, even over long distances, an expansion in the network of Strategic Rail Freight Interchanges will be a vital factor in achieving the desired modal shift from road to rail.
The government has recognized the critical links between spatial planning and its rail freight policy by specifying that all local and regional spatial plans should give priority to the establishment of Strategic Rail Freight Interchanges in locations where they can best achieve the desired modal shift from road to rail. In particular, spatial plans should recognize the importance of locating SRFIs at sites which meet their operational requirements (strategic intersections of road and rail, proximity to commercial centres, adequate area for expansion, etc). At the same time, the policy stresses that private developers of SRFIs should ensure that their development proposals are compliant with other government policies, e.g. those related to environmental management, regional employment and job creation and preference for re-development of ‘brownfield” sites.
In developing its intermodal freight policy, the Strategic Rail Authority made use of modelling techniques to measure the likely impact on its rail freight forecasts of increasing the stock of rail-connected warehousing. From a base volume in 2002 of 12.6 million tonnes, it was estimated that the volume of non-bulk rail freight would grow to 33.9 million tonnes by 2015,
59 Department for Environment, Transport and the Regions, Sustainable Distribution: A Strategy, March, 1999. 60 Department for Environment, Transport and the Regions, Ten Year Transport Plan (2000-2010), July 2000.

63
without any additional rail connected warehousing. With delivery of 50 per cent of the rail connected warehousing capacity proposed as part of the modal interchange projects current in 2004 (about an additional 1.49 million square metres), non-bulk rail volume was estimated to reach 59.0 million tonnes by 2015. However, with 100 per cent delivery of the additional rail connected warehousing being proposed in 2004 (an additional 3.0 million square metres), non-bulk rail volume in 2015 would be almost double its level without any increase in the stock of rail co0nnected warehousing (i.e. 66.3 million tonnes vs. 33.9 million tonnes).
By contrast with the equivalent intermodal interfaces in Europe (but in common with those in the United States), the facilities being developed in the United Kingdom are all wholly financed, owned and managed by the private sector. In most cases, the owner-investors are major property investors who “contract-in” the necessary specialized logistics companies to manage their properties.
(ii) Characteristics of UK intermodal interfaces
The SRA intermodal freight policy identifies six different types of freight intermodal interface. Two of these are specialized in the distribution of bulk and automotive freight and are of limited relevance to the type of facilities evaluated in this study. The characteristics of the remaining types are described in Table 5.1 below.
Table 5.1: Characteristics of freight intermodal interfaces in the United Kingdom
Type of intermodal interface
Function Indicative size
(hectares)
Indicative transport
requirements
Examples
Strategic Rail Freight Interchange
Major interchange with significant intermodal handling and warehouse capacity, located at nationally strategic sites in proximity to major conurbations. Capacity to receive 775 metre integral freight trains.
100-400 Requires high quality links to motorway and trunk road network. Rail links need high capacity and generous loading gauge.
Hams Hall (Birmingham-Nuneaton) Daventry International Rail Freight Terminal Mossend Cluster, Glasgow Approx. five such facilities in the UK.
Non-strategic (sub-regional) Rail Freight Interchange
Large interchange with significant intermodal handling and warehouse capacity, located at important sites within regions. Designed to receive trains shorter than 775 metres..
20-250 Requires high quality links to motorway and trunk road network. Rail links need sufficient capacity and good loading gauge.
Potter Group, Selby Malcolm Group, Grangemouth
Intermodal only Modal exchange only (limited or no warehousing). Often located at key points in urban areas
10-30 Requires good links to urban and trunk road network. Rail links require sufficient loading gauge
Feightliner Terminals O’Connor Group, Widnes
Rail linked warehouse
Single warehouse unit providing rail services
3-10 Requires good links to urban and trunk road network.
Carlisle Warehousing Tibbet & Britten, Neasden
Source: Strategic Rail Authority: Strategic Rail Freight Interchange Policy, March 2004, page 31.

64
(iii) Daventry International Rail Freight Terminal
The Daventry International Rail Freight Terminal (DIRFT) is an example of a state-of-the-art freight intermodal interface which was developed in the post Channel Tunnel era, for the main purpose of distributing freight to and from Europe. DIRFT, with an initial area of 147 hectares, was developed and financed by a major property developer, Severn Trent Properties, and entered service in 1997.
It is located in the Midlands beside the West Coast Mainline linking London with Manchester, Liverpool and Glasgow and is close to the intersection of the M1, M6 and A14 motorways, providing fast road connections with West Yorkshire, Scotland and Felixstowe Port, respectively. Rail times for connections to Europe are given as: Metz, 15 hours; Milan, 32 hours; Barcelona, 42 hours; and Paris, 10 hours.
The complex offers 214,000 square metres of distribution and manufacturing floorspace and has attracted major distribution and retailing occupiers including Tesco, Tibbet & Britten, Ingram Micro, the WH Malcolm Group, Eddie Stobart Transport, Wincanton, and Excel. Three warehouses are directly connected to rail and the complex also has an international rail terminal (known as the Daventry International Railport). This terminal has connections to/from the Channel Tunnel and the Port of Felixstowe provided on an open access basis by four rail operating companies: Direct Rail Services, EWS, Freightliner and GB Railfreight.
A second phase development of the complex has commenced. This has an overall area of 54 hectares, of which 181,000 square metres will be rail connected warehousing to be let to commercial operators.
5.1.2. Continental Europe
The Freight Village concept has been applied in Europe since the mid-late 1980s. A Freight Village is defined by the European Association of Freight Villages, Europlatforms, as:
“…a defined area within which all activities relating to transport, logistics and distribution of goods, both for national and international transit are carried out by various operators. A freight village must be equipped with all the public facilities to carry out the above-mentioned operations. In order to encourage intermodal transport for the handling of goods, a freight village must preferably be served by a multiplicity of transport modes (road, rail, deep sea, inland waterway, air).” 61
Europlatforms was established in 1991 when the national freight village associations of France, Italy and Spain joined together to form a Europe-wide association, which would promote the development of freight villages and represent the interests of freight village developers and operators throughout Europe. Europlatforms currently represents 60 freight villages in 10 countries of Europe (Denmark, France, Germany, Greece, Hungary, Italy, Luxembourg, Portugal, Spain and Ukraine), served by 2,400 transport operators. There are in addition many freight villages which are not members of Europlatforms, neither as members of national associations nor as individual members.
Unlike in the United Kingdom and in the United States, where freight villages or intermodal exchange facilities have been developed almost wholly by private sector investors, in Europe public sector agencies have participated in, and in some cases have driven, freight village
61 Gilberto Galloni, President of Europlatforms, presentation: Best Practices in Europe: the example of freight villages, Thessaloniki, November 2006.

65
development. The form of their participation has usually been as shareholders in joint venture companies or as partners with the corporate sector in Public Private Partnerships (PPPs).
While individual freight villages may differ in terms of their ownership, management and financing structures, the national legislative and spatial planning regimes under which they operate and indeed in terms of their usage of different transport modes, they nevertheless conform to a common model in terms of their functions and the types of facilities and services they offer.
A recent assessment of the European concept of freight villages listed their essential functional characteristics as follows:
Intermodal operations; Integrated distribution (i.e. integration of storage and transport); Smart warehousing (i.e. high density/high technology storage); Logistics (including value added services such as inventory management); Showrooms (for display of warehoused products); Customs services; and Support services (including security, truck stop and vehicle maintenance, office
space, hotel accommodation, meeting/conference facilities, banking, mail, and public transportation)62
The same assessment identified inappropriate uses of freight villages as follows:
Passive (i.e. low turnover) storage; Empty container storage; Uncontrolled public use (e.g. some retail, car rental); Heavy manufacturing.
The main public benefit claimed for European freight villages is that they have reduced urban traffic congestion by moving warehousing, distribution and some processing activities outside of cities to locations which can make maximum use of more cost effective transport modes, such as rail.63
Best practice examples of freight villages operating at inland locations and involving a high degree of modal integration are to be found in Bologna Freight Village or Interporto Bologna in Bologna, Italy, as well as Cargo Centre Graz and Duisport Complex, two strategic multimodal facilities located respectively in Graz, Austria, and Duisburg, Germany.
(i) Interporto Bologna
This is an example of a very large facility providing integrated logistics, rail and road infrastructures at a strategic location near the intersection of major rail and road freight routes in the north of Italy. The complex was developed and financed by a joint stock company, Interporto Bologna S.p.A, of which 52 per cent of the shareholding is owned by public organizations (mainly local and provincial government authorities, but also including the Italian Railways) with the rest shared amongst a number of financial institutions, the Chamber of Commerce of Bologna, and various industrial entities. It covers a vast area of 2.0 million square metres (200 hectares), of which 650,000 square metres is occupied by the
62 Presentation by Roberta Weisbrod, Partnership for Sustainable Ports: Freight Villages – Context Sensitive Design, 18 May 2005.
63 Galloni (2006)

66
facilities of the Italian Railways. Development of an additional area of 227 hectares is underway. Warehousing covers an area of 300,000 square metres and comprises 22 warehouses of which 4 have direct rail connections.64 Other facilities provided include a customs office, vehicle maintenance and cleaning facilities, banks, a post office, a management and service centre and the Italian Railways intermodal terminal.
The freight village accommodates about 100 national and international transport and distribution companies. There are two international rail services per day (to Chiasso on the border with Switzerland and to Modane in France) and there are at least daily rail services to the major seaports at La Spezia, Genova, Livorno and Taranto.
The freight volume throughput of the complex has grown by nearly 5 per cent per year, from 3.56 million tonnes in 2000 to 5 million tonnes in 2006 (up 10% from 2005), including 3.5 million tones of intermodal traffic.65 In 2006, the rail terminal alone is estimated to have handled 2.43 million tonnes of freight (up 13% from 2005) through 7,371 trains. This is the equivalent of 97,200 trucks, which would have been removed from national, provincial and urban roads.
Highlighting the European Union’s strong environmental concern as a driver of intermodal development, Interporto Bologna has set aside 30% of the site area for green spaces and 1.3 million Euro have been invested into equipping one of the warehouses with solar panels with a production capacity of 235MWh a year estimated to represent a saving of 50 tonnes of petroleum.
(ii) Cargo Centre Graz
Cargo Centre Graz is a new facility opened in 2003. It was financed as a PPP with participation by a consortium of private transport companies, forwarding agents, the three largest banks in Styrian Province of Austria, the Styrian Provincial Government, and the Federal Government of Austria. It is directly connected to rail and has proximate access to the Southern Freeway (A2) and to the Graz-Thalerhof Airport.
The cargo handling complex is managed by a logistics company contracted by the consortium and railway services are provided on an open access basis.
The facility covers a total area of 50 hectares, of which warehousing, open storage, office space and a container trailer park occupy 63,000, 130,000, 11,000, and 25,000 square metres, respectively. It incorporates an intermodal rail terminal with four 700 metre loading/unloading tracks, served by 2 gantry cranes and a reachstacker with a combined capacity of 80 transshipments per hour. 66
(iii) Duisport
Duisport is the transport and logistics hub of the Rhine/Ruhr region and has become Europe's largest inland port and international logistics center. The development of the site illustrates how an early vision to revitalize the declining economy of a region and capitalize on the eastward expansion of the European Union has been turned into a success story.
In 1988 with the heavy industry of the North-Rhine Westphalia region in sharp decline the central government of Germany approved a package of 1 billion German Marks (US$ 850 million) to restructure the local economy. At the same time 17 cities and two counties
64 Interporto Bologna website: www.bo.interporto.it.65 Galloni (2006) and www.promobologna.it 66 Details provided in Strategic Rail Freight Interchange Policy, March 2004, page 51.

67
initiated a ten-year project to transform abandoned buildings and sites from the coal-steel era for modern uses. A river port was developed as well as a rail station for combined transportation with connection to the main north-south line. Gradually, logistics companies came to the site and contributed to its development through the construction of new facilities such as a packing center, or the Eurologistic Centre by the freight forwarding company Khüne & Nagel and the New Wave Logistics Co. by the shipping line NYK. Now, over 300 mainly specialized in transportation and logistics offer their services at Duisport.
With 30 millions consumers and 300,000 enterprises within a 150-km radius, the site is in the heart of Europe’s largest market and at the junction of Europe’s most important North/South and East/West major rail lines and highways. It also has access to 10,000 km of inland waterways. The site harbours comprises five intermodal terminals and 1.5 million square-metre of covered storage area.
In 2007, the total cargo volume of Duisport topped 100 million tons, with 1.6 million annual container handlings. Over the years, the role of rail in moving containers has become more prominent and the site has now become a major railway hub with over 330 container block-trains dispatched each week to over 80 destinations in Europe. These efficient rail connections and services have contributed to making Duisport the main inland container hubs for the ports of Rotterdam in the Netherlands and Antwerp in Belgium.
Direct or indirect employment supported by the site is estimated at 36,000 jobs and the value added to the economy is over 2.2 billion Euros (US$ 2.9 billion) per year.
Recognizing that transport is a major contributor to climate change and the region of North-Rhine Westphalia is among the ten largest CO2 emitters in the European Union, Duisport management has also stimulated projects to shift cargo to environmentally friendly waterway and rail transportation. For example, in 2007, duisport rail started a daily Ost-Westfalen-Xpress container block-train service between Duisburg and Unna on a short 82-km route which had previously been served exclusively by trucks. The initiative reduced the number of truck movements by 36,000.
5.2 North America
Although the term “dry port” is used by a majority of countries and international organizations, the term “inland port” is the terminology most widely adopted in North America. The Center for Transportation Research at the University of Texas defines an inland port as
“a physical site located away from traditional land, air and coastal borders with the vision to facilitate and process international trade through strategic investment in multi-modal transportation assets and by promoting value-added services as goods move through the supply chain.”
In simple terms, an inland port signifies a location with significant population, multiple modes of transportation and manufacturing / distribution facilities surrounded by land. Examples of inland port locations in the US include Atlanta, Chicago, Columbus, Dallas FW, Kansas City, Memphis, Norfolk and Savannah/Charleston.
A review of common literature suggests the following characteristics for an effective and successful inland port, many of which have been incorporated in existing as well as planned facilities across Canada, Mexico and the United States:

68
location near a rail-based intermodal terminal; access to sea and/or airports; a high quality transport system, preferably consisting of all three modes – rail, road
and airway; advanced technology in information-sharing (such as EDI), and in security and
control processes/ systems; presence of a large local population as a market and/or labour pool. A minimum base
population of three million people has been estimated to be needed for an inland port;
availability of a large area of land for development, estimated at 5,000 to 10,000 acres (approximately 2025 to 4050 hectares);
a full range of integrated services appropriate to an inland logistics port, including access to all modes of transport, transloading (between international and domestic transport), warehousing, distribution, consolidation, container services (empty storage, maintenance and repair), customs clearance, other logistics services, and manufacturing;
designation as a free trade zone; proximity to substantial manufacturing capacity or to large shippers; and effective cooperation between public and private entities, possibly through councils
formed to address the problems of interested parties such as shippers and logistics providers.
5.2.1 United States
Intermodal freight transport is increasingly becoming a preferred choice in the United States. It consists of the movement of entire truck trailers and shipping containers by both road and rail, with due cognizance of (i) the economic and environmental efficiencies of trains for long haul movement, and (ii) the speed and reach of trucks for local pick up and delivery. Indeed, the availability of, and/ or the access to intermodal service(s) is a major deciding factor for many transportation-dependent companies when looking for locations in which to establish or expand their operations.
Efficient intermodalism is key to the US economy and is supported by an enormous network of highways, ports (both seaports and inland ports), airports, freight and passenger railroads, and transit systems. However, this leading transportation super-structure is in need of substantial investment in order to: (i) meet current transportation needs, (ii) ease rising congestion, (iii) reduce pollution and emissions, and (iv) promote fuel-efficient design and use of transport systems. The Federal Commission on Transport estimates an infrastructure investment need of US$225 billion p.a. over next 50 years to be equipped with the tools it needs for sustaining and ensuring strong economic development.
(i) Background legislation
Support for developing inland ports, or so-called “freight gateways” was noted in the legislation pertaining to the North American Free Trade Agreement (NAFTA), in the “Intermodal Surface Transportation Efficiency Act” (ISTEA) of 1991, and in the “Transportation Equity Act for the 21st Century” enacted in 1998, and abbreviated to TEA2167. The 1991 ISTEA sought greater coordination and efficiency of transportation movement among modes for both passengers and freight, stating in its section2 that:
67 Adapted from Walter and Poist, 2003

69
“It is the policy of the United States to develop a National Intermodal Transportation System that is economically sound, provides the foundation for the nation to compete in the global economy, and will move people and goods in an energy efficient manner. The National Intermodal Transportation System shall consist of all forms of transportation in a unified, interconnected manner, including a transportation system of the future.”
ISTEA sought the following improvements68:
lower overall transport costs by using the best mode for each stage; increased economic productivity and efficiency; reduced congestion and less strain on infrastructure; higher returns from public and private infrastructure investments; improved mobility for the elderly, disabled, isolated, and economically
disadvantaged; and reduced energy consumption, and improved air quality and environmental conditions.
Yet despite these stated objectives and the rapid growth in container movements and efficiencies through economies of scale, the US National Commission on Intermodal Transportation (NCIT) found that significant barriers still hinder the full integration of the national transport system into an advanced intermodal system. Although these barriers refer to the situation in the US, the two key stumbling blocks are common to many countries. They are:69
(i) the Federal Government is organized according to transport modes and is therefore not suitably structured to encourage intermodalism, and
(ii) intermodal projects must compete with long-established highways projects that traditionally receive most of the available federal funding.
A key objective of ISTEA was that the intermodal system should be profit-making for private transport companies, and that intermodal partnerships should play to the strengths of each participant. ISTEA required each US state to develop a plan based on 23 planning factors stipulated, and covering social, environmental, financial and coordinating factors. This approach was continued in the subsequent legislation TEA21.
(ii) Types of Inland Port models in the United States
In the United States, recent developments of, or proposals for, intermodal facilities for cargo handling at inland locations have been classified into six separate Inland Port models, listed as follows:
Satellite Marine Terminals, which have been developed mainly to reduce cargo and traffic congestion at the principal seaport with which they are associated (examples are the Virgina Inland Port and the Agile Port); Logistics Parks, which are large industrial parks combining manufacturing, storage and distribution activities, providing export trade processing facilities and served by multiple modes of transport (examples are Alliance Texas and Joliet Illinois);
68 Adapted from Owens and Lewis, 200269 Adapted from Owens and Lewis, 2002

70
Crossroads, or facilities strategically located on major trade routes (an example is Puerto Nuevo in Southern Arizona); Trade Processing Centres, which specialize in the handling and clearance of foreign trade (an example is Kingman, Arizona); Logistics Airports, which are usually retired military facilities redeveloped as air freight hubs (an example is the Southern California Logistics Airport, formerly the George Air force Base); and Economic Development vehicle, such as KC SmartPort, developed to promote Kansas City as a logistics hub.70
Most recently developed and/or proposed projects in the US have benefited from investment finance provided wholly by large property developers or investment companies. Notable exceptions such as the Alliance Texas Project and the Rickenbacker Intermodal Terminal (a beneficiary of the Heartland Rail Corridor) serve as useful references for successful public-private partnerships in intermodal development projects. The case of the Dallas Logistics Hub, a 6,000 acre facility, which got a Free Trade Zone (FTZ) designation (effective March 2008), reflects a growing move by US federal and state governments to attract larger sections of private industry and shippers towards such intermodal facilities offering an array of integrated onsite services with a significant cost-saving potential.
(iii) The Alliance Texas Logistics Park
The Alliance Texas Logistics Park near Fort Worth, Texas perhaps represents the ultimate development of a multi-modal inland logistics facility in the United States, or indeed in the world. It covers a huge area (17,000 acres 6,880 hectares) and is unique in that it incorporates both a purpose built airport and a major rail terminal. Since 1989, private sector investors, led by the project promoter, the Hillwood Development Company (a major real estate developer), have committed an investment of US$ 5.8 billion (95 per cent) to the development of this facility, with the contribution of another US$ 323 million (5 per cent) by public authorities for associated airport and highway development.
The project commenced with the development in the late 1980s of the Fort Worth Alliance Airport as a public-private partnership between the Federal Aviation Agency, the city of Fort Worth and Hillwood. A similar public-private partnership was formed between Hillwood and the Texas Department of Transportation for the construction of State Highway 170, which provides a strategic east-west artery for the project.
Further investment was committed by the Burlington Northern and Santa Fe Railway Company (BNSF) for the construction of an intermodal terminal covering an area of 300 hectares (with another 131 hectares planned for future development). This facility has been developed into one of the largest rail intermodal terminals in the country, performing between 500,000 and 600,000 container lifts annually. Most of the freight handled at this terminal is moving from Asia through the West Coast ports and on to the complex by rail.
Currently, the complex contains some 25 million square feet (2.3 million square metres) of warehouse and industrial floorspace. It accommodates 140 transport, distribution and manufacturing companies, supported by a free trade zone and comprehensive customs service. These companies include third party logistics providers, such as Excel, Ryder System, UPS Supply Chain Solutions, FedEx and DSC Logistics, as well as retailers and manufacturers performing their own distribution, including JC Penney (retailing), Coca-Cola,
70 The Tioga Group: presentation to Southern California Association of Governments on Inland Port Feasibility Study, 21 June 2006

71
Nokia, SC Johnson and Co, Ford Motor Co., General Motors and General Mills. Recently, Hillwood has moved into hotel, residential and office building on the site.
The project’s net economic benefits over the fifteen year period 1990-2005 have been valued at US$ 28.5 billion (and for 2005 alone were estimated at US$ 2.4 billion). Over the same period the project was estimated to have generated 25,000 jobs and to have contributed US$ 456.8 million to local government property tax revenues.71
(iv) The Rickenbacker Intermodal Terminal
Spread across 175 acres, developed at a cost of US$ 68.5 million, and opened in March 2008, the Rickenbacker Intermodal Terminal is located within the 20 million square-feet expanse of development in the Rickenbacker Global Logistics Park, near Columbus, Ohio. It has good road access through IS-270, US-23 and US-33, and major urban areas within a 800-km radius include Atlanta, Chicago, Toronto, and New York. It is served by six trains per day (four to Chicago, Illinois, and two to Norfolk, Virginia).
The Columbus Regional Airport Authority has partnered with Norfolk Southern Corporation (NS), a class I railroad operator, to create this intermodal facility, adjacent to the Rickenbacker International Airport terminal (a major port of entry for textiles into the US). It is intended to provide shippers with improved service and increased capacity, and replaces the much smaller Discovery Park Terminal in Ohio. As one of five NS intermodal terminals in Ohio, the Rickenbacker intermodal terminal will support the “Heartland Corridor”,which runs between the Port of Hampton Roads, Virginia and Chicago (expected to be completed by early 2010). Once completed, the Heartland Rail Corridor will speed up the movement of containerized freight between the East Coast and the Midwest, via a shortening of distance from1,300 miles to 1,000 miles and an increase in capacity made possible by raising vertical clearances in 28 tunnels along the route and enabling NS to serve its market with double-stack container trains.
This pioneering corridor project is a result of a public-private partnership (PPP) among NS, the states of Virginia, Ohio, and West Virginia, and the US Federal Government. These three US states have already authorized funds, i.e. West Virginia (for setting up an
71 Source of most data: Alliance Texas website, www.alliancetexas.com.
__________________________________
Box. 5.1 Optical Village at Rickenbacker
Recognizing the consumers’ need for speedy service along the need for cost efficiency for eyeglass manufacturers, Airborne Logistics Services (ALS), a subsidiary of Airborne Express, partnered with six eyeglass companies and a development company to form Optical Village at Rickenbacker. Prior to the Optical Village concept, a person ordering a pair of glasses would have to wait weeks until they were assembled. Retail outlets would store enormous amounts of inventory to meet the prescription and design needs of the customer base, but this style of inventory management often failed because popular frames would change.Drawing partly on the model of the automotive industry ALS began to envision a production and distribution complex where all makers of raw materials, manufacturing equipment, lenses, frames and finished eyewear would operate in one place, supplying retailers and customers on a nationwide basis. The optical industry was an ideal candidate for ALS first vertical outreach. The business generates mostly small, light packages shipped overnight, Airborne’s forte. Eyewear makers are also under pressure from managed-care health plans to cut costs, even as they produce a huge variety of frame styles and lenses for the fashion-driven retail market. By grouping together, manufactures are able to cut costs. Source: www.rickenbacker.org/realestate/success.asp ______________________________________

72
intermodal terminal in Prichard), Virginia (for an intermodal terminal in the Roanoke region), and Ohio (for development of Rickenbacker, as an intermodal terminal, near Columbus). For its part, the US Federal Government has already committed US$ 95 million towards the US$ 151 million cost for raising tunnel clearances, and an additional US$ 30.4 million towards the US$ 62 million cost for the Columbus facility.
The Rickenbacker intermodal terminal has an initial capacity of 250,000 container / trailer lifts per year (with a provision to expand to 400,000 lifts per year as per market demand). The presence of a Free Trade Zone, with more than 70 companies and onsite US Customs and Border Protection facilities also help to make this terminal a preferred choice for shippers and the industry at large. Success stories have already resulted from the clustering of industrial activities at the site (see Box 5.1).
According to an independent study, key benefits realized after the first 10 years of Rickenbacker’s intermodal operations are expected to be:
US$ 660 million in transportation cost savings to shippers; a reduction of 49 million truck miles in Ohio; significant reduction of emissions.
This same study showed that over the next 30 years, the new intermodal facility and resulting development will produce:
9,500 direct jobs; 10,900 indirect jobs; 34 million additional square feet of industrial-building development; US$ 1.2 billion of building construction; US$ 1.37 billion invested in machinery and equipment; US$ 15.1 billion economic impact; over US$ 800 million in direct local, state and school district tax revenues; US$ 1.26 billion of indirect tax revenues.
(v) Virginia Inland Port
An intermodal container transfer facility located in Warren County, Virginia, and developed with an investment of over US$ 747 million, the Virginia inland port covers 161 acres (with 17,820 feet of rail adjacent to Norfolk Southern Main Line) and contains over 8.5 million square feet of buildings (with more than 8,000 people employed). It offers convenient and easy access to I-81 and I-66, and services to Atlanta, Chicago, LA, Long Beach, Dallas, Miami and New Orleans. It serves as an interface between truck and rail for transport of containers to/ from the Port of Virginia.
The presence of a Free Trade Zone, vast warehousing infrastructure and a US Customs Port of Entry, with Customs Inspection Facilities (at Richmond) also add to the ease and convenience for leading US retailers, manufacturers, freight operators and/ or shippers as illustrated in figure 5.1.
In a recent development, a new US$ 450 million 291-acre inland container terminal to serve the Hampton Roads region in Virginia was opened in September 2007. This is one of the largest privately owned container terminals in the United States, with a capacity of handling 1 million TEUs annually with room for further expansion.

73
Figure 5.1. Distribution and Freight Network around Virginia Inland Port 72
(vi) The Alameda Corridor
The Alameda Corridor is another example of a recent and a successful intermodal interface in the United States73. The Corridor is a 20-mile-long rail cargo expressway linking the ports of Long Beach and Los Angeles to the transcontinental rail network near downtown Los Angeles. It consists in a series of bridges, underpasses, overpasses and street improvements that separate rail freight movements from passenger trains as well as road traffic, thereby facilitating a more efficient transportation network. The project’s centerpiece is the Mid-Corridor Trench, which carries freight trains in an open trench that is 10 miles long, 33 feet deep and 50 feet wide between State Route 91 in Carson and 25th Street in Los Angeles. Construction began in April 1997 and operations began in April 2002.
International trade accounts for one of every 15 jobs in the southern California region, according to the Los Angeles County Economic Development Corporation. The ports of Long Beach and Los Angeles are the two busiest container ports in the US and form together the fifth busiest port complex in the world. The ports handled more than US$ 200 billion in cargo in 2001. The rail network serving the ports was not sufficient to accommodate rapidly increasing cargo volumes. The Alameda Corridor thus consolidated four low-speed branch rail lines, eliminating conflicts at more than 200 at-grade crossings, providing a high-speed
72 Source: Virginia Port Authority 73 Logistics Sector Developments: Planning Models for Enterprises and Logistics Clusters, p. 116.

74
freight expressway, and minimizing the impact on communities. The resultant benefits include the following:
more efficient freight rail movements; reduced traffic congestion by eliminating at-grade crossings; improvements to Alameda Street; multiple community beautification projects; cut train emissions; reduced delays at railroad crossings; cut noise pollution from trains; reduced emissions from idle automobiles and trucks.
The US$ 2.4 billion Alameda Corridor was funded through a unique blend of public and private sources. Revenues from user fees paid by the railroads will be used to repay borrowings. Railroads initially paid US$ 15.00 for each loaded 20-foot equivalent unit (TEU) container; US$ 4.00 for each empty container and US$ 8 for other types of loaded rail cars such as tankers and coal carriers. Over a 30-year period, fees will increase between 1.5 per cent and 3 per cent per year, depending on inflation. Effective January 1, 2006, fees were US$ 16.75, US$ 4.47 and US$ 8.93 respectively.
Through its contractors and various community partnerships, ACTA (Alameda Corridor Transportation Authority) administered several programmes designed to provide local residents and businesses with direct benefits that will long outlive actual construction. Such benefits include:
construction industry-specific job training for 1,281 local residents, including 637 placed in union apprenticeships;
30 percent of all labor hours for Mid-Corridor Trench were performed by local residents living in adjacent zip codes;
through aggressive outreach and technical assistance, ACTA helped disadvantaged (primarily small and woman or minority-owned) businesses compete for and earn contracts worth more than US$ 285 million, meeting the programme goal of 22 per cent of all contracts;
on-the-job training and education credits for more than 420 young adults (ages 18-23), who performed community beautification work through the Conservation Corps programme;
one-on-one technical consulting for 25 local import-export companies and entry-level, international trade-specific job training for 20 local residents through a joint programme with the World Trade Center Association Los Angeles-Long Beach.
The above has attempted to illustrate how informed policy-making, detailed planning and significant investment in infrastructure can collectively help to augment network-capacities, eliminate current supply chain bottlenecks, cater to higher shipment volumes, and benefit the public. It also shows that development of efficient intermodal transport is the result of concerted efforts by central and/or local governments in close collaboration with private sector in planning, financing and implementing projects.
__________

75
Chapter 6. Guidelines for design, financing and establishment of freight intermodal facilities
The guidelines presented in this chapter are intended for use by member countries as a source of the broad planning factors which need to be considered in planning the development of intermodal freight terminals. They are intended to apply to the development of terminals which are primarily rail-served and are fed by local road transport. Thus, it is expected that the proposed terminals will be located beside railway lines, but ideally will also be accessible by existing roads of adequate standard to permit local feeder movement of container, breakbulk and other cargoes by truck transport. The guidelines provide an approach to determining the location, type, area, equipment, cost and financing/management arrangements for inter-modal freight terminal development projects.
6.1 Location
The choice of a location for an intermodal terminal, whether for the handling of containers, breakbulk or bulk cargo, must satisfy two requirements:
(i) the need to build the facility at a site beside a railway line which will allow easy access/egress to/from the running tracks and will avoid the need to break up or re-form trains; and
(ii) the need to minimize the local road haulage distance to/from the main cargo sources.
A suitable layout for a rail access is shown in Figures 6.1-6.3. The most important feature of the rail loading/unloading sidings which are linked as loops to the mainline is that they may be accessed from both sides of the intermodal terminal, without the need to break up train formations.
As observed in Chapter 2, it is expected that intermodal terminals with full logistical services and facilities will be located close to cargo sources in the hinterland and at some considerable distance from seaports. Unless border areas have the potential to generate trade or unless there is a need to transfer transit or bilateral trade between modes, or indeed between railway gauges, at the border, there would not normally be a need to establish fully equipped intermodal terminals at borders.
To take as an example, there are three dry port facilities located at the border between the Inner Mongolia Autonomous Region (IMAR) of China and Mongolia (at Erenhot, Ceke and Ganginmaodao), as well as one dry port facility at Manzhouli on the border between IMAR and the Russian Federation. Two out of four of these dry ports have facilities to transfer cargo between the Russian and Chinese railway gauges, while one is equipped to transfer cargo from rail to road and vice versa, and the last is a pure road – to – road transfer facility. Transit containers can, for example, be loaded with cargo and customs cleared in Ulaanbataar for transport to the Port of Tianjin for overseas shipment, with only a minimal inspection of the container customs seals at the Erenhot/Zamyn Ud border. However, since there is a break of gauge at the border the containers will require lifting from wagons of the Mongolian Railway system to wagons of the Chinese Railway system. Thus only container lifting equipment would be required at the border and the focus of customs inspection would be at the cargo source in Ulaanbaatar. This would be in conformity with the International Convention of the Harmonization of Frontier Control of Goods (1982), which specifies that inspection of transit cargoes at borders should be restricted to inspection of customs seals.

76
6.2 Type
The choice of facility type will mainly reflect the cargo mix available for handling and transportation. If there is potential for sizeable volumes of break-bulk or bulk cargoes, in addition to container cargoes, specialized open or enclosed storages will have to be provided within the area of the terminal to accommodate these cargoes.
If the facility is to serve only container demand, an early decision must be made about the type of handling equipment or system, which will be used to transfer containers between rail/road and the container yard (CY). This is because the equipment choice is a determinant (along with projected container volume and average dwell time) of the land area required for construction of the facility and hence has a major influence on land acquisition costs. Different types of handling systems have different container stacking densities and different requirements for a circulating area between stacks.
6.3 Layout and area
The land area required for a container handling facility should be determined for each of the facility components: rail loading/unloading sidings; container yard (CY); container freight station (CFS); bonded warehouse; administration and forwarder offices; customs office; and security gate and guardhouse.
6.3.1 Railway loading/unloading sidings
The optimum length of trains to be operated to and from the terminal must be determined at an early stage, since this will determine the required length of the clear standing trackage in the rail loading/unloading sidings and hence the width of the facility. A primary requirement of the facility design should be that full length container trains will arrive directly into the loading/unloading sidings, be discharged and loaded there by container handling equipment, and then depart directly for their next destination without the need for splitting or re-formation.
Optimum train lengths are those which will minimize train operating costs, given prevailing limitations on motive power availability and gross tonnage (i.e. haulage) capacity.
Typically, single tier container trains operating on metre gauge tracks within the region will comprise 30-35 wagons each with an overall length of 15 metres, for a total train length including a single locomotive of about 510 metres. On the standard and broad gauge systems of the region, the optimum length of single tier container trains tends to be about 40-45 wagons for a train length, including a single locomotive, of about 660 metres.
Double tier container trains are in the process of being introduced to the region, especially in Australia and China (both standard gauge systems), as well as in India (a predominantly broad gauge 1,676 metre system). These trains will probably comprise the same number of wagons, but will be slightly longer than, the single tier trains, given the use of well-type wagons with longer overall lengths and the need to attach two or more locomotives to trains (owing to higher train gross weights). For metre gauge networks, typical train lengths are likely to be of the order of 560 metres and for standard/broad gauge networks of the order of 730 metres.
The width required in the rail loading/unloading area will depend on the number of sidings to be provided, and this in turn depends on train turnaround time and the daily number of train arrivals and departures. Typically, for a facility handling up to 400,000 TEU per year in a two shift 16 hours per day operation, four full length sidings with crossovers or engine escape

77
tracks will be required. The width of the rail loading/unloading area in this case, including allowance for paved areas either side of the tracks would be about 60 metres, giving an overall area for rail loading and unloading of 34,000-50,000 square metres. In fact, the Lat Krabang ICD in Thailand has a rail loading unloading facility with an area of 48,000 square metres.
6.3.2 Container yard
The container yard will be a paved area within the terminal for the short term storage of loaded and empty containers. There will be heavy paved areas to allow the stacking of loaded containers and light paved areas to allow the stacking of empty containers. The height of the container stacks, in terms of the number of tiers, will be a function of pavement strength and the type of handling system employed, and hence of overall cost.
Typical facility layouts for the three handling systems reviewed in this study (reach-stackers, RTGs and RMGs) are shown in Figures 6.1 – 6.3.
If a high density system, such as an RTG (Rubber Tyred Gantry crane) or RMG (Rail Mounted Gantry crane) system is to be used, then there has to be allowance for the gantries to span the width of the rail sidings and the roadways on both sides of the loading/unloading tracks. This is because these systems involve the use of gantries plus yard chassis (prime movers and trailers) to lift and move containers to and from the stacks. If a lift truck system (such as a reachstacker) is used, adequate areas have to be provided between the stacks for the manoeuvering of the lift trucks. In addition since a reachstacker can place loaded containers in the first row of each stack to a height of 3-4 containers, but only to a height of 2-3 containers in the second row, this type of handling system will require a proportionately greater paved area in the CY for a given throughput level.
The choice of handling system therefore implies a trade-off between the cost of CY construction versus the purchase and operating cost of the handling equipment. If land acquisition costs are low (unlikely in most cases), then the lift truck system may provide a better solution since its acquisition, installation and operating costs are low relative to those of high density handling systems, such as RTGs and RMGs.
The required land area of the CY must be determined by reference to the following factors:
(i) forecast container throughput volumes for the facility; expected traffic peaking patterns;
(ii) expected average container dwell time (in days);
(iii) desired average stacking height in CY;
(iv) type of handling system to be employed and associated CY area allowance per TEU groundslot.

78
Figure 6.1: Example of ICD Layout: reach-stacker served CY
Source: China Intermodal Transport Services to the Interior Project (ITSIP): Inland Container Depot Operation Manual, August 2003
Figure 6.2: Example of ICD Layout: RTG-served CY
Source: China Intermodal Transport Services to the Interior Project (ITSIP): Inland Container Depot Operation Manual, August 2003
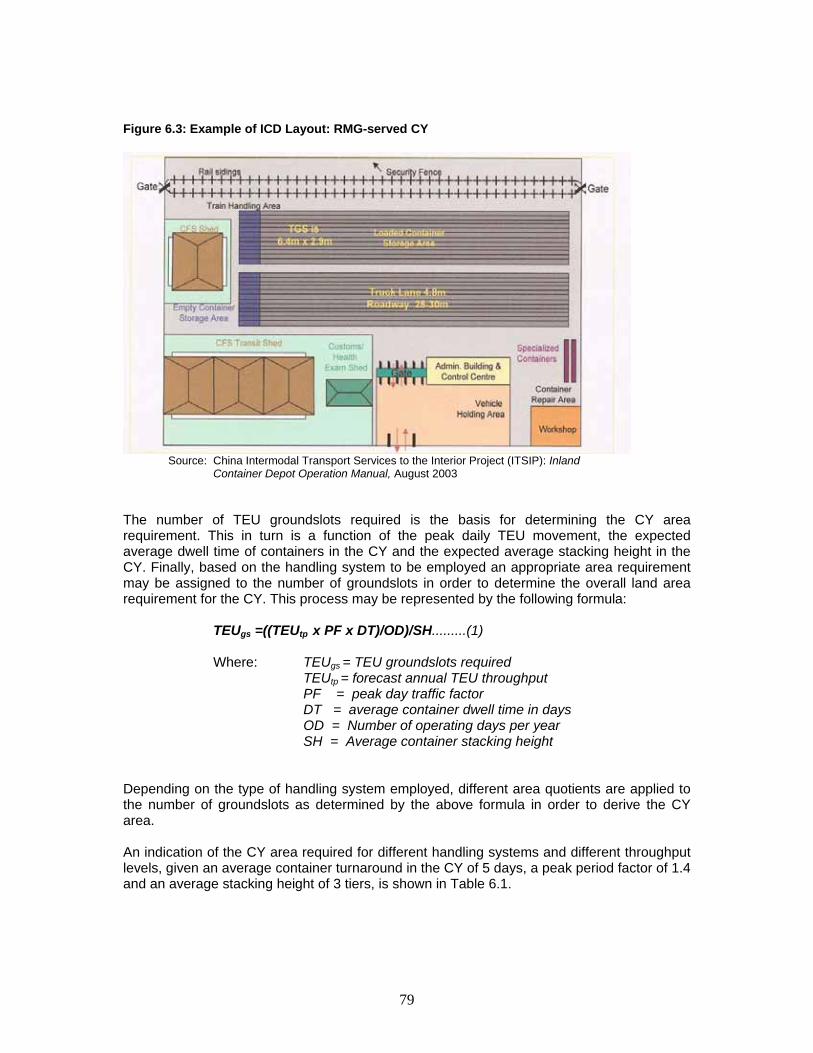
79
Figure 6.3: Example of ICD Layout: RMG-served CY
Source: China Intermodal Transport Services to the Interior Project (ITSIP): Inland Container Depot Operation Manual, August 2003
The number of TEU groundslots required is the basis for determining the CY area requirement. This in turn is a function of the peak daily TEU movement, the expected average dwell time of containers in the CY and the expected average stacking height in the CY. Finally, based on the handling system to be employed an appropriate area requirement may be assigned to the number of groundslots in order to determine the overall land area requirement for the CY. This process may be represented by the following formula:
TEUgs =((TEUtp x PF x DT)/OD)/SH.........(1)
Where: TEUgs = TEU groundslots required TEUtp = forecast annual TEU throughput PF = peak day traffic factor DT = average container dwell time in days
OD = Number of operating days per year SH = Average container stacking height
Depending on the type of handling system employed, different area quotients are applied to the number of groundslots as determined by the above formula in order to derive the CY area.
An indication of the CY area required for different handling systems and different throughput levels, given an average container turnaround in the CY of 5 days, a peak period factor of 1.4 and an average stacking height of 3 tiers, is shown in Table 6.1.

80
Table 6.1: Determination of CY area
CY area requirement (m2)Annual CY throughput
(TEU)
Required CY storage capacity
(TEU)
Required number of
TEUgroundslots
Reachstacker served CY
(average area per groundslot: 82 m2)
RTG served CY (average area per groundslot:
30 m2)
RMG servedCY (average
area per groundslot:
22 m2)
60,000 1,167 389 31,889 11,667 8,556
400,000 7,778 2,593 212,593 77,778 57,037
1,000,000 19,444 6,481 531,481 194,444 142,593
Sources: Details of selected ICD facilities in the UNESCAP region; Transmark, Lat Krabang Phase I Plan, September 1993, China Intermodal Transport Services to the Interior Project, Inland Container Depot Operating Manual, August 2003.
As may be observed, CYs employing reachstacker handling systems are likely to require an area of 3-4 times that of the high density RMG or RTG systems, but the equipment costs of the reachstacker systems are likely to be much lower than those of the crane-based systems.
Greater precision in the estimate of the overall CY area requirement can be obtained if the requirement can be determined for each container trade category, i.e. LCL import, FCL import, LCL export, FCL export and empties. This is because each category will have a different dwell time (with import containers generally spending more time in the CY than export containers) as well as a different stacking height (e.g. empty containers can be stacked more than 5 high, whereas loaded containers will rarely be stacked more than 3 high) in the CY.
6.3.3 Container Freight Station (CFS)
The primary function of the CFS is to load export breakbulk cargo into containers for shipment to foreign trading partners or to unload import cargo from containers, for dispatch as breakbulk freight to local consignees. A subsidiary function is the short term storage of breakbulk container cargoes for export or import. Thus a CFS will need to provide: Loading/unloading bays for trucks conveying breakbulk cargo; Loading/unloading bays for yard chassis bringing containers to/from the CY, an area for short-term storage of export cargo awaiting stuffing into containers and of de-stuffed import cargo awaiting dispatch to or collection by consignees; and circulation areas for forklifts within the CFS.
The throughput of cargo in the CFS may (and ideally should) be linked to the CY throughput, since containers for stuffing or destuffing in the CFS will be sourced from containers passing through the CY. It should be noted that not all loaded containers arriving at and departing from the CY will be processed in the CFS – some will be moved directly by road transport to or from importers’ and exporters’ premises for processing there.
The formula for calculating the CFS area requirement is as follows:
CFSarea = ((TEUtp x CFS% x PF x DT)/OD)*ATEU
Where: TEUtp = forecast annual TEU throughput CFS% = percentage of CY throughput for processing in CFS

81
PF = peak day traffic factor DT = average breakbulk cargo dwell time in CFS (days) OD = Number of operating days per year ATEU = Average ground area occupied by breakbulk cargo (m2 per TEU)
The average ground area assumption for breakbulk cargo discharged from a container will also depend on the height at which cargo may be stacked in the CFS, as well as on the circulation area to be allowed for forklift operation and the area required for parking of container chassis and trucks in loading bays. Based on the average area requirement assumed by Transmark consultants for the Lat Krabang ICD Phase I project in Thailand (50 m2 per TEU)74, as well as an assumption of a cargo turn time in the CFS of 3 days, of a traffic peaking factor of 1.4 and that 30 per cent of the CY throughput would be processed in the CFS, the following CFS area requirements were determined for different CY throughput levels:
Table 6.2: Determination of CFS area
Annual CY throughput (TEU)
Annual CFS throughput CFS area requirement (m2)
60,000 24,000 10,500
400,000 160,000 70,000
1,000,000 400,000 175,000
Sources: Details of selected ICD facilities in the UNESCAP region; Transmark, Lat Krabang Phase I Plan, September 1993, China Intermodal Transport Services to the Interior Project, Inland Container Depot Operating Manual, August 2003.
Again, a greater level of precision can be achieved in estimation of the overall area requirement for the CFS if the area requirements for different types of container trade are estimated separately, taking into account differing cargo dwell times and the differing percentages of CY throughput to be processed in the CFS.
The data in Table 6.2 reflect a situation in which the CFS accommodates not only container stuffing and destuffing activity, but also the short term storage of break-bulk cargo. However, there is a tendency in the design of many ICD facilities to separate these two activities, by providing a separate warehouse, an overtime cargo warehouse, for cargo (such as transit cargo) which is likely to spend a longer period in storage than just 2-3 days. Such an approach is illustrated in the ICD layouts shown in Figures 6.1-6.3.
6.3.4 Administration complex
Administration buildings are provided not merely to accommodate the terminal management and operating staff and the computer and communications installations needed to plan and to execute the various activities comprising the functions and services of the facility, but also to provide offices out of which the various “external” service providers in the facility may operate. These service providers can include: freight forwarder and consolidator organizations; customs brokers; shipping lines and agents; rail and road transport coordination staff; banking, insurance and other financial service providers. The size of the building will depend to a major extent on use to be made of office space by such external
74 Transmark for State Railway of Thailand: Lat Krabang Inland Container Depot Project, Phase I Report, September 1993. A rather generous CFS cargo area allowance of three times the area of a twenty foot container (15 square metres) was made by Transmark on the basis that there was a limited possibility of high rise stacking of cargo in Thai warehouses.

82
service providers, and this in turn is likely to be broadly related to the designed throughput capacity of the overall facility.
The rail served Uiwang ICD near Seoul, with an annual throughput capacity of 1.37 million TEU has two operating terminals, one with five 3-4 storey office buildings and another with three 3-4 storey office buildings. These buildings cover a combined ground area of 14,026 square metres, giving an average ground area of 1,753 square metres per building, which represents less than 2 per cent of the total surface area of the ICD.
The modularized75 rail served ICD at Lat Krabang, near Bangkok, which in 2006 handled some 1.4 million TEU, has a four floor central administration building This building houses the ICD (not the concessionaires’) administration, the SRT (railway) operating superintendent’s office, as well as offices for the banks, the post office, shipping lines and forwarding agents, customs brokers, and haulage and trucking companies. The overall ground area occupied by this building is about 755 square metres.
6.3.5 Customs office
Since the ICD will be required to have the permanent presence of customs staff for the routine inspection and clearance of all container and cargo consignments, it will be necessary to provide an office building to accommodate these staff. The size of the building is wholly dependant on the number of customs staff to be based at the ICD, but it will in any case cover a ground area of not less than about 200 square metres. In fact, the customs offices at Uiwang (Republic of Korea) and Lat Krabang (Thailand) cover an area of 2,363 square metres and of 2,352 square metres respectively. At Lat Krabang, one four floor customs office is provided for each of the six operating modules. These buildings are also used to accommodate health and quarantine department inspection staff as well as the administration and operations management of each ICD module.
6.3.6 Workshop for light repair of containers
ICD facilities will normally include a workshop to carry out only light repairs to containers. In cases where heavier duty repairs were required the containers would be moved to off-site specialized workshops. Depending on the size of the ICD and its throughput, the repair facility will typically cover a ground area of 200-2,000 square metres. In fact, the Uiwang ICD in the republic of Korea has two repair facilities with a total area of 2.942 square metres. The container repair workshop at Lat Krabang, on the other hand, has an area of only 584 square metres.
6.3.7 Security gate and guardhouse
A security gate and guardhouse must be provided at the road entrance to the ICD facility. This office will usually cover an area of not less than 100 square metres. The Lat Krabang ICD has a security gate and guardhouse covering an area of 300 square metres.
75 The total operating area of 657,183 square metres at Lat Krabang has been subdivided into six operating modules or sub-terminals, each operated by a private concessionaire and with its own CY and CFS facilities and customs/administration offices. In addition to these modularized facilities, the ICD has common facilities comprising rail and road accesses, a container repair workshop and a central administration office.

83
6.3.8 Overall area of ICD
The overall land area requirement for an ICD, given varying levels of throughput, is likely to be as shown in Table 6.3. It has been assumed that a reachstacker served CY would only be suitable in the case of a terminal with smaller annual throughput volumes. Larger throughputs will require application of higher density container handling systems, in order minimize land costs.
Table 6.3: ICD area requirements - summary
Annual ICD throughput (TEU)
60,000 400,000 1,000,000
Component Unit of area
RS RTG RTG RMG RTG RMG
Rail loading/unloading area m2 24,000 24,000 48,000 48,000 48,000 48,000
CY m2 31,900 11,700 77,800 57,000 194,400 142,600
CFS m2 10,500 10,500 70,000 70,000 175,000 175,000
Administration building m2 800 800 2,000 2,000 3,000 3,000
Customs office m2 500 500 1,500 1,500 2,000 2,000
Container light repair w/shop m2 600 600 2,000 2,000 3,000 3,000
Security gate and guardhouse m2 300 300 300 300 300 300
Total m2 68,600 48,400 201,600 180,800 425,700 373,900
Note: RS = reachstacker - RTG = rubber tyred gantry crane - RMG = rail mounted gantry crane
6.4 Equipment and staffing
Given the daily number of operating hours, the equipment handling rates or productivity, and the average equipment utilization, both the cargo handling equipment and operational staffing levels of the ICD may be scaled in accordance with peak day throughput volumes.
For planning purposes, it is should be assumed that ICD terminals will be operated for at least two shifts, or 16 hours per day.
6.4.1 Equipment requirements and costs
Typical handling rates in terms of container lifts or moves per hour, together with typical acquisition costs, are shown for the various items of container lifting equipment in Table 6.4.
Table 6.4: Productivity factors and costs of container handling equipment
Item of handling equipment
Employed for: Handling rate (lifts or moves per hour)
Typical landed cost (US$, 2007 prices)
Rail-mounted gantry crane Lifting loaded containers at railhead and/or in CY
22 2,000,000
Rubber-tyred gantry crane Lifting loaded containers at railhead and/or in CY
16 650,000

84
Table 6.4: Productivity factors and costs of container handling equipment (Cont’d)
Item of handling equipment
Employed for: Handling rate (lifts or moves per hour)
Typical landed cost (US$, 2007 prices)
Reach-stacker Lifting loaded containers at railhead and/or in CY
Lifting and moving loaded containers from rail-head to CY and vice versa
17
10
325,000
Empty stacker Lifting empty containers at railhead and/or in CY
Lifting and moving empty containers from rail-head to CY and vice versa
20
12
150,000
Units required per item of primary handling equipment at railhead
Prime mover Moving containers from railhead to CY and vice-versa
3 80,000
Trailer/Yard chassis Moving containers from railhead to CY and vice-versa
3 10,000
Units required per working gang in CFS
Prime mover Moving containers from CY to CFS and vice-versa
0.5 80,000
Trailer/Yard chassis Moving containers from CY to CFS and vice-versa
2 10,000
Forklift (2-3 tonne) Loading, unloading and stacking cargo in CFS
1 40,000
Source: Belgian Technical Cooperation (BTC): Design of the Master Plan for Waterborne Transport on the Mekong River System in Cambodia, September 2006; UNESCAP: Transport Financial and Economic Planning Model, Inland Container Depots Module, December 1992.
The Uiwang ICD in the Republic of Korea, with a container throughput of nearly 1 million TEU annually, is reported to have the following equipment in its rail loading/unloading area and in its CY:
Rubber tyred gantry cranes 3 Reachstackers 29 Tophandlers (for empties) 11 Other heavy duty forklifts 2
The overall capital cost of this equipment (at current replacement values) is likely to be of the order of US$ 13.2 million. With the addition of light forklifts for the CFS and of chassis and prime movers for transport of containers between the rail loading/unloading and the CY, as well as between the CY and the CFS, this cost is likely to increase to around US$ 16.5 million. If rail mounted gantry cranes rather than rubber tyred gantry cranes were used the overall equipment capital cost would increase to about US$ 21.6 million.

85
6.4.2 Staffing requirement
The number of staff to be allowed for at the railhead and in the CY should be two per item of primary handling equipment per shift with appropriate allowance for relief during holidays or for sickness etc.
In calculating the number of gangs required to operate in the CFS, a normal assumption is a productivity rate of 6-8 TEU per gang per shift for loading, unloading and stacking cargo in the CFS. A gang could comprise 6-7 persons.
Other personnel to be allowed for in the ICD could include the following:
A general manager
Operations, administration and maintenance managers
Supervisors in the Traffic, Operations, CFS and Maintenance Departments
Clerks (Accounts, Personnel, Claims, etc)
Other office staff
General labourers/cleaners etc
Security guards
It is likely that a very large ICD (with capacity to handle up to about 1 million TEU per year) could require a workforce of about 2,000.
6.5 ICD infrastructure investment costs
The cost of ICD development will be sensitive to local conditions, especially to the cost of land and local costs of labour and construction materials. A review of recent and planned projects in the UNESCAP region was undertaken to determine whether there was any consistency in the actual or estimated unit investment costs across the projects reviewed and whether these data could provide a valid basis for measuring the likely investment cost of ICD development. The resulting unit investment costs (expressed in US dollars per square metre of developed land area) are given in Table 6.5. The total investment amounts from which these unit values were derived are understood to include amounts the costs of: land acquisition (where applicable), pavement of container movement and storage areas, construction of rail access and loading/unloading tracks, and construction of buildings and perimeter fencing. The total area shown for each facility is the total developed area of land which may be directly related to the total investment cost.
Table 6.5: Unit cost of ICD development for selected projects in UNESCAP region
Country Location Facility type
Project status
Total area (m2)
CY capacity
(TEU)
Total invest. cost
(US$ mil.)
Cost per m2 (US$)
Bangladesh Pangaon ICD, IWT served
Underconstruction
242,820 3,000 51.28 211
Cambodia Phon Penh Port Terminal, IWT served
In planning 83,900 5,800 24.62 293
China Wangjaying ICD, rail served
In operation 160,000 n.a. 55.60 348

86
Table 6.5: Unit cost of ICD development for selected projects in UNESCAP region (Cont’d)
Country Location Facility type
Project status
Total area (m2)
CY capacity
(TEU)
Total invest. cost
(US$ mil.)
Cost per m2 (US$)
India Gurgaon, near Dheli
ICD, rail served
Underconstruction
45,000 2,000 17.95 399
India Nagpur, (Multimodal International Hub, Sical)
ICD, air and rail served
Underconstruction
102,920 n.a. 32.05 311
Nepal Birgunj ICD, rail served
In operation 163,840 1,600 30.00 183
Thailand Lat Krabang (Phase II development)
ICD, rail served
In planning 423,140 9,000 155.38 367
Source: Press announcements, facility websites, feasibility studies
Plotting of the area against the actual or estimated investment cost for each ICD reviewed (see Figure 6.1) shows that costs are reasonably well correlated with area.
Figure 6.4: ICD areas and costs (examples from region)
R2 = 0.8447
0
20
40
60
80
100
120
140
160
180
0 50000 100000 150000 200000 250000 300000 350000 400000 450000
ICD area (square metres)
ICD cost (US$ mill.)
Thus it can be concluded with some confidence that unit investment costs are likely to fall within the range of US$ 300-400 per square metre of developed land area. If an average rate of US$ 350 is applied to the likely area requirement for different levels of TEU throughput, then the probable investment costs will be as shown in Table 6.6.
Table 6.6: ICD infrastructure investment cost
Possible investment cost (US$ million) Annual ICD throughput (TEU) RS served CY RTG served CY RMG served CY
60,000 24.01 16.94
400,000 70.56 63.28
1,000,000 149.00 130.87
Note: RS = reachstacker - RTG = rubber tyred gantry crane - RMG = rail mounted gantry crane

87
6.6 Summarized infrastructure and equipment investment costs
In summary, for a very large ICD (e.g. one able to handle upwards of about 1 million TEU per year), the infrastructure and equipment investment costs, depending upon the type of handling system employed are likely to be as follows:
Infrastructure US$ 130.87 – 149.00 million
Equipment US$ 16.53 – 21.59 million
Total investment US$ 147.40 – 170.59 million
6.7 Ownership and method of financing
Given the heavy levels of investment required for the construction and equipment of intermodal terminal facilities and in light of other pressing demands on their limited budgetary resources, governments of the region will have a strong incentive to enter into collaborative arrangements or partnerships with the private sector for the development of such facilities.
The two forms of public private partnership (PPP) most commonly applied throughout the region are the Build-Operate-Transfer (BOT) contract and the operating concession contract.
BOT contracts involve commitments by private sector contractors to construct, equip, manage and operate terminals for a period of usually not less than 30 years, at the conclusion of which ownership of the terminal assets will revert to the government. Undersuch arrangements, the financial obligations of the government party are usually limited to the provision of state owned land, but may also include an obligation to provide road and rail accesses up to the gate of the terminal. The private sector developers will recover their investment in terminal assets from operating revenues generated over the term of the contract. Large-scale ICD facilities at Uiwang (near Seoul) and Yangsan (near Pusan) were developed under BOT contracts between the government of the Republic of Korea and private investors (most of whom were from the shipping and logistics sector). A similar approach has been adopted in Bangladesh for the development of the country’s 13 major land ports, although for a period of 25 years.
Operating concessions are usually concluded between governments and private investor/operators for periods of less than 30 years. Under these types of arrangement, governments commit to invest in the provision of all terminal infrastructure and private partners commit to investing in the cargo handling and transport equipment needed to operate the terminal. Operation of the terminal will then be the responsibility of the private sector partners, but ownership of the terminal assets will remain with the government, which will recover its investment from concession fees paid by private partners for the duration of the concession contract. The Lat Krabang ICD near Bangkok was developed under such an arrangement, with concession contracts signed with six private partners.
The form of private participation selected will invariably depend on the government’s financial capacity and desired level of exposure to risk (see additional observations on this subject in Chapter 8). From the standpoint of minimizing government risk exposure, the BOT arrangement has certain advantages, but its main limitation is that it will not encourage competition in the operation of the terminal. On the other hand, an operating concession will expose governments to a high level of investment risk, but to the extent that this arrangement will allow the operation of individual terminals to be split among two or more

88
operators, exporters and importers will have the potential to derive strong benefits from competition among operators.
One of the problems associated with the encouragement of private sector participation in intermodal terminal development and operation is that in many countries the laws and procedures related to private sector participation are complex and numerous and have no fixed time-frame for completion. In some cases, a project may require some 25 to 30 authorizations from 10 to 15 different government agencies, concerning such matters as: approval of investment incentives; import and corporate tax exemptions; land use; environmental impact assessments; and building design and construction permits. The transaction of such complicated authorization processes can take years to complete and its outcome has a high degree of uncertainty. In many cases, it will simply not be possible to “fast-track” approvals for private investment in transport infrastructure projects, such as intermodal terminal development. This is something which both the public and private sector parties need to take into account in setting their priorities. It is also an issue which governments will have to address in the longer term in order to make private sector participation a more realistic and achievable goal.
__________

89
Chapter 7. Net economic benefits of freight intermodal interfaces
The governments of the region may strengthen the case for funding assistance to invest in the logistics infrastructure needed to support the growth of intermodal transport in their countries, by measuring the net economic benefits, which will be generated both directly and indirectly by such investments.
As observed in preceding sections (section 3 in particular), the principle objective of developing freight intermodal interfaces near major inland trade generating locations is to facilitate a modal shift for the primary or trunk journey from high cost to low cost transport modes, and so achieve a reduction in the overall supply chain cost. If such a cost reduction can be passed on to shippers in the form of reduced transport/distribution charges, then clearly the shippers stand to gain a financial benefit, but there will also be a benefit to the wider community from the trade creation effect of the cost reduction. The wider community also stands to gain two additional benefits from the modal transfer, in the form of reduced environmental impacts and associated costs, and in the form of the multiplier effect of new economic activity creation. These economic benefits must be offset against the economic costs of the project, in order to establish its net economic worth.
While an assessment of the net economic benefits of a project will depend upon the specific characteristics of the project and its associated costs, the main purpose of this chapter is to provide an indication of the broad methodology which can be applied in such an assessment.
7.1 Measuring the economic benefits of freight intermodal interfaces
Table 7.1 identifies and classifies the main economic benefits which might be expected to flow from an investment in inland freight intermodal interfaces and a resulting modal shift from road to rail.
Table 7.1: Economic benefits of investment in freight intermodal interfaces
Item No.
Primary impact Associated direct benefits Associated indirect benefits
(i). Modal shift, road to rail Reduced transport cost (shadow priced)
Increased value of trade and GDP
(ii) Increased direct investment (local economy)
Increased direct employment Induced economic activity (through cluster development) and associated employment growth
(iii) Reduced fuel consumption
Reduced CO2 and other atmospheric emissions and associated value
(iv) Reduced road traffic Reduced road traffic accidents and associated costs
Reduced road maintenance costs
Reduced travel time (in urban areas) and associated saving
The following sections outline a suggested methodology for measuring the direct and indirect benefits of an investment in freight intermodal interfaces.

90
7.1.1 Direct benefits
(i) Reduced transport cost
Construction of an intermodal interface will make possible a modal shift, from road to rail, for the primary, or trunk, journey between the facility and seaports. This will result in a reduced cost for this journey, owing to the lower unit fuel consumption, maintenance and staffing costs for rail as compared with road transport. This reduced cost should be converted to an economic value by applying the relevant shadow pricing factor. Shadow pricing is necessary to ensure that all cost inputs are valued at border prices (for traded inputs) and at resource costs (for domestic inputs). Effectively, this will mean excluding from economic costs all government taxes and charges and adjusting the costs of some inputs to eliminate non-market distortions (e.g. when wage rates are fixed by fiat rather than by the interaction of market forces). Typically, application of shadow prices will involve a downward adjustment of financial costs by 15-20 per cent.
An example of the relationship between road, rail and inland waterway costs for the transportation of a forty foot container between Rotterdam and Mannheim (a 500 km journey) is given in Figure 7.1. This indicates that the rail haulage cost (with allowance for final delivery by road) is likely to be about 11 per cent below the cost of direct haulage by road, while the IWT cost will be about 20 per cent below the direct road cost.
Figure 7.1: Container transport cost between Rotterdam and Manheim (500 km)
460
300 260
110110
0
50
100
150
200
250
300
350
400
450
500
Road Rail IWT
Cost (charge) in Euro
per FEU
Final transportby road
Main haultransport
Source: Bruno Vergobbi, Managing Director French Ports Association: Integration of logistics supply chain: cooperation between ports and freight villages, Europlatforms Conference, Paris, 18 December 2006
Evaluations of major railway investment projects in the region have shown that transport cost savings account for by far the largest portion of the measurable direct economic benefits of these projects.76 One reason for this, especially during periods when world oil
76 In the case of a recent railway rehabilitation project in Cambodia transport cost savings were estimated to account for more than 90 per cent of the direct economic benefits of the project.

91
prices are high, as they have been for the past three years, is that fuel savings can typically comprise about half the transport cost savings estimated for railway.
As an example of the calculation of transport cost savings, it is assumed that the development of a rail-served ICD at a location 500 km inland from a port will result in a transfer of an annual transport volume of 60,000 TEU (equivalent to 660,000 tonnes) from road to rail, resulting in the transfer of 330 million tonne-km per year. If it could be assumed that the relationship between the shadow priced rail and road costs were the same as indicated Figure 7.1 (giving a saving in favour of rail of about US$ 0.0042 per tonne-km), then the economic saving would be about US$ 1.4 million per year.77
(ii) Increased direct employment
The benefits of a project will usually be judged by its direct employment generating effects. In this case the direct employment effects related to the number of jobs created in the new facility less the number of jobs lost by the road haulage industry plus the number of jobs created in the rail industry as a consequence of a modal shift from road to rail. This economic benefit will be valued at the relevant average wage rates for various job categories. It should be noted that increased direct employment could represent a large benefit for local communities where intermodal interfaces are established, since a large facility could provide employment for upwards of 2,000 persons.
(iii) Reduced CO2 and other atmospheric emissions
The diversion of road traffic to rail resulting from the project will reduce the emission of greenhouse gases, which are a product of fuel combustion. The UK Department for Transport recently published data showing that the average CO2 emission per tonne-km of rail freight is 23 g, whereas for Heavy Goods Vehicles (HGVs) it is 178 g.78 Thus, the reduction in CO2 emission resulting from the project may be estimated as: TK x (178-23), where TK is annual tonne-km displaced from road to rail. The saving may be valued at the prevailing market value of carbon certificates (recently in range of Euro 15-18, i.e. US$ 19-24, per tonne on the European market).
As an example of this calculation, it is estimated that the modal shift facilitated by the development of the rail-served ICD identified above would save of the order of 51,000 tonnes79 of CO2 emissions which if valued at US$ 24 per tonne would be equivalent to an economic saving of US$ 1.22 million per year. Clearly, the longer the distance between the seaport and the ICD, the greater will be the saving for any given transport volume.
To the extent that valid data may be obtained in respect of other emissions (e.g. NOx ,SO2), the value of a reduction in these emissions may also be measured. As a guide, the UK Department of Transport has published the following data on emissions other than CO2.
77 The unit cost saving was calculated as the difference between the road and rail costs in Figure 7.1 assuming an average load of 24 tonnes per FEU in Europe. 78 Strategic Rail Authority: Strategic Rail Freight Interchange Policy, March 2004, page 14.79 Calculated as: 330 million tonne-km per year x (178-23) = 51,000.

92
Table 7.2: Emissions other than CO2 for road and rail transport
Rail Road (HGVs) Emission type
Grams per tonne-km Grams per tonne-km
Fine particulates (PM10) 0.005 0.061
Carbon Monoxide (CO) 0.031 0.400
Nitrogen Oxide (NOX) 0.110 2.050
Sulphur Dioxide (SO2) 0.017 0.005
Volatile Organic Compounds (VOC) 0.023 0.190
Source: Strategic Rail Authority: Strategic Rail Freight Interchange Policy, March 2004, page 15.
While in theory it is possible to ascribe savings in noise emission to a modal shift from road to rail, such benefits are likely to be confined to urban areas, which would not feature strongly in the majority of trips between seaports and inland modal exchange facilities.
(iv) Reduced road traffic accidents and associated costs
To the extent that both vehicle-km and accident and casualty rates (e.g. number of fatalities and injuries per million vehicle-km) are available in respect of the relevant road routes, the number of road accidents and casualties which would be avoided as a result of a traffic shift from road to rail can be calculated. From this figure would have to be deducted the number of casualties in rail accidents which might occur after this traffic shift. The valuation of the net number of casualties avoided can be undertaken on the basis of a “value of lost output”80 in the case of fatalities and long term disabling injuries, and on the basis of typical medical costs in the case of lesser injuries (see Box 7.1).
(v) Reduced road maintenance costs
The reduction of traffic on the major roads accessing the facility after a modal shift from road to rail will result in a reduction in the annual costs of maintaining these roads. Road authorities in most countries will maintain data on the cost of pavement maintenance per vehicle-km on main routes. The difficulty arises from the allocation of these costs to different road vehicle types – clearly bulk loading vehicles (which in many countries are prone to overloading) will bear a proportionately greater share of road maintenance costs than container trucks (which are comparatively lightly loaded). Advice on a method for allocating these costs should be sought from the relevant road authorities.
80 Lost output can be valued at per capita GDP (the gross value of output per capita).
________________________________
Box 7.1. Cost of road accidents in Thailand
In Thailand a study from the Highways Department found that in 2007 road accidents cost the country 232.8 billion baht in financial terms, or 2.8% of GDP, and put the cost of a single traffic fatality in Bangkok at as much as 11.08 million baht, and that of a disability at 12.44 million baht. Nationwide, the average was 5.32 million for a fatality and 6.17 million for a single disability. Source: Bangkok Post, “Putting a price on accidents”, 31 March 2008. ________________________________

93
7.1.2 Indirect benefits
(i) Increased value of trade and increased regional GDP
All things being equal, a reduction in transport costs resulting from a traffic shift from road to rail will be reflected in reduced prices for traded goods, which in turn should provide a stimulus to trade and regional GDP growth. In their analysis for ADB of transport efficiency gains in the SASEC corridor, Padeco Consultants used results from a gravity type model related to tariff adjustment to estimate the stimulus to trade from a reduction in transport costs. 81
Application of the tariff related model suggested that a 1 per cent reduction in tariffs would generate a 5 per cent increase in trade. The consultants postulated that reductions in transport costs could have benefits similar to tariff reductions. Hence for every 1 per cent decrease in the prices of traded goods a 5 per cent increase in the value of trade might be expected.
Of course, the actual relationship between a change in the prices of traded goods and a change in the value of trade would first have to be established for the trade corridor under evaluation. However, using the SASEC example as a guide, if establishment of an ICD could stimulate a reduction in inland transport costs of 10 per cent (of the same order of the relationship between rail and road costs in the Rotterdam to Manheim case, above) and inland transport costs represent about 8 per cent of the value of cargo, then the resulting reduction in the latter would be about 0.8 per cent. This reduction could cause imports to and exports from the ICD location to grow in value by 4 per cent and would lead to a further stimulus for regional GDP growth. The final calculation of the increase in regional GDP should be based on the local relationship between the value of trade and regional GDP. However, it may be seen that this is likely to be a very large number.
(ii) Induced economic activity benefits
Investment in an inland freight intermodal interface is likely to stimulate the growth of other economic activities in its vicinity. These activities can be related to the provision of additional logistical support or transport services, or they can be related to the establishment of new retailing, wholesaling or manufacturing businesses. The result will be an induced growth in local employment and gross product, leading to poverty reduction.
The proposed application in the region of the enterprise cluster concept, as developed by UNCTAD, will support the realization of the wider economic benefits of inland freight intermodal interfaces. If inland intermodal interfaces can be developed as enterprise clusters, in the same manner as freight villages and logistics parks have been developed respectively in Europe and in the United States, then they can have fairly immediate multiplier benefits. This is because related businesses or industries will soon be attracted to the cluster by the promise, or better still, the delivery of high quality logistical support.
An assessment of the economic multiplier benefits of investments in inland intermodal interfaces can be based on estimates of the likely increase in local employment resulting from the attraction of new businesses and on the valuation of this increased employment at the level of the existing per capita regional product.
81 Padeco Co., Ltd: TA 6112-REG, South Asia Subregional Economic Cooperation (SASEC): Subregional Corridor Operational efficiency Study, Draft Final Report – Volume III, July 2004.

94
As is the case with increased trade and GDP benefits, the economic multiplier benefits of intermodal interface projects are likely to be large. An example is to be found in the case of the Alliance Logistics Park near Fort Worth, Texas. The total investment in this facility over the 18 years since it first opened for business is about US$ 6.1 billion, but it is claimed to have generated economic benefits over this period of US$ 28.5 billion, or nearly five times the level of investment, as well as to have created 25,000 jobs. Since the facility has grown well beyond its initial focus on logistics (also attracting for example aerospace and other manufacturing industry), it is likely that economic multiplier benefits account for much of its overall economic benefits.
(iii) Reduced travel time in urban areas and associated savings
Where intermodal interfaces are to be located near to heavily congested industrial cities, they can have the beneficial effect of reducing the level of road traffic congestion by re-locating freight distribution activity away from these cities and into the enterprise clusters formed at strategic locations by the interfaces themselves. Reduced road traffic congestion will then have other benefits in terms of reducing travel times of commuters, etc. The measurement of such benefits can be based on road traffic counts and flow data before and after establishment of the intermodal facilities and the benefits can be valued at an appropriate local indicator of the value of travel time.
7.2 Measuring the economic costs of freight intermodal interfaces
7.2.1 Shadow price adjustment of investment costs
Just as the benefits of intermodal interface projects have to be valued at shadow prices or in terms of resource costs, so the financial investment costs of such projects have to be adjusted to reflect these values.
In the case of construction costs, the rule of thumb which is usually applied is that if construction materials or equipment are imported they must be valued at border prices (i.e. prices which exclude import duties and value added taxes), whereas if construction inputs are supplied domestically, their prices should reflect fair market values and exclude value added tax. Typically, the factors used to adjust costs to border or resource values will lie in the range of 80-85 per cent, unless there is a high level of imported content attracting high levels of duty, in which case adjustment factors could lie within the range of 70-75 per cent.
In the case of the investments required for cargo handling equipment, it is likely most equipment will need to be imported and could attract high rates of import duty. Consultations with equipment supplier organizations will usually establish what rates of duty and taxes will apply, and therefore need to be excluded.
7.2.2 Project scheduling
The scheduling of construction costs should follow realistic works schedules established by competent civil engineers. In general, the rule of thumb used for scheduling the acquisition of cargo handling equipment is that this should be in step with projected throughput growth, with major items of equipment being purchased 3-4 months before they are needed in service.

95
7.3 Establishing and evaluating indicators of economic worth
Measures of the economic worth, or net economic benefits, of the project should be established in the form of an Economic International Rate of Return (EIRR) and an Economic Net Present Value (ENPV). These measures will result from a comparison of economic inflows (i.e. benefits) with economic outflows (costs). For the purposes of ENPV calculations, future flows of costs and benefits should be discounted back to the present at a discount rate of 12 per cent, representing the cut-off long term rate of return, beyond which the international development banks will consider the investment justified.
Recent post-evaluations of ICD development projects funded by the World Bank in China have established EIRRs of about 23-24 percent, well within the “zone of viability”.
___________

96
Chapter 8. Draft recommendations
This chapter identifies a number of policy initiatives which are suggested to be taken by the governments of the region in order to create conditions favourable for the establishment of modal interchange facilities in their country. These initiatives are essentially of two types: (i) initiatives to encourage private sector participation in the financing, ownership and operation of such facilities and (ii) initiatives needed to remove institutional (including customs) barriers to the successful operation of modal interchange facilities at inland locations.
8.1 Setting up a proper vehicle to promote the development of intermodal interfaces
The implementation of the study has shown that member countries lack a specific agency/body at the governmental level responsible for dealing with issues relating to the development of intermodal transport and intermodal interfaces. The result is a lack of coordination between various national agencies dealing independently with highways, railways and shipping. This impacts the definition and overall costs of projects related to intermodal transport and intermodal interfaces.
In this connection, the study recommends that:
Efforts at developing intermodal transport and intermodal interfaces be the responsibility of an “Office of Intermodalism” established within the ministries of transport. The most important duties of this office will be to:
As a matter of priority:
(i) formulate a government policy relating to the encouragement and establishment of intermodal interfaces within their territory (a model for which may be found in the policy established by the Department for Transport of the United Kingdom);
(ii) outline the policy of their governments to facilitate private sector participation in the development and operation of intermodal transport and intermodal interfaces.
Once the above have been accomplished:
(iii) maintain and disseminate data related to intermodalism; (iv) coordinate national research on intermodalism, including
technologies as well as socio-economic impact; (v) draft policies aimed at facilitating the development of
intermodalism; and (vi) evaluate projects and allocate finances for their implementation.
8.2 Initiatives to encourage private sector participation in the financing, ownership and operation of intermodal interfaces
As may be observed from Chapter 4 and 5 of the studies, the development of intermodal interfaces lends itself well to public private partnerships. However, as shown in Chapter 6,

97
large inland freight handling facilities are both land and capital intensive, requiring in some cases huge amounts of debt to service loans for investment in these facilities.
One of the major cost items which can be expected to inflate the overall financial burden on prospective private investors is the purchase price of land. Land is one of the factors of production within the power of governments to control. In this respect:
In the case of land allocation for the development of intermodal interfaces it is suggested that the above-suggested “Office of Intermodalism” consider the following options to soften the impact of expensive land acquisition and development on potential private investors:
(i) the transfer, free of charge, of government-owned land to private partners or operating concessionaires in exchange for a share of the operating profits of the terminal;
(ii) as a variation on (i), governments could agree, as part of their contribution to public-private partnership (PPP) or operating concession arrangements, to finance the entire infrastructure development cost of the project;
(iii) the waiver of statutory taxes and charges on the purchase of “brownfield” sites for development as intermodal interfaces; and
(iv) the granting of tax holidays (especially in relation to business taxes) for some pre-agreed period up until which the terminal can be expected to generate sufficient net revenue to cover debt service and some reasonable return on investment.
While government assistance for infrastructure financing now appears to be a commonly applied strategy for intermodal terminal development in the region, the extent of this assistance very much depends upon the risk exposure governments are prepared to accept. Governments may consider the following:
Minimizing risk exposure
If they wish to minimize their risk exposure, governments may opt for BOT (Build-Operate-Transfer) contracts with private developers, in which their contribution will be limited to the provision of land and/or basic road and rail accesses to terminals.
(Such an approach was used in the case of the development of the Uiwang ICD, near Seoul in the Republic of Korea.)
Higher risk of exposure
If governments are prepared to accept a greater exposure to risk they may choose to provide all the required land and infrastructure (including rail and road accesses and buildings) and conclude operating agreements or other type of PPP contracts with private developers and/or logistics providers.
(The development of the Lat Krabang ICD near Bangkok is an example of this approach. In this case, the Government of Thailand, through the State Railway of Thailand (SRT), provided the land and all of the infrastructure (including rail and road accesses and buildings) for operation under concession contracts by six independent logistics providers. For their part, the six operating concessionaires

98
were required to provide cargo handling equipment for their terminals and to pay a concession fee to the government over the term of their operating concessions.)
Risk-free government assistance
Tax-related measures/incentives represent the most risk free forms of government assistance for the development of intermodal interfaces. This approach may usefully be considered for application in the UNESCAP region and indeed is likely to be beneficial in cases where intermodal terminals are to be located on the outskirts of densely populated and heavily industrialized cities (such as those for example in northeastern China and parts of India) where containerized consumer goods are in high demand and old industries earmarked for reconversion are most likely to be found.
(This approach of encouraging intermodal terminal developers to convert already developed land from other (mainly industrial) uses has been applied successfully in the United Kingdom and in some European countries. One example is the conversion of a decommissioned thermal power station at Hams Hall, in the United Kingdom, for the operation of a Strategic Rail Freight Interchange is a case in point 82
Once governments have put in place the institutional framework for the development of intermodal interfaces, including legislation relating to private sector participation, set up the full framework they may wish to:
Set up an agency responsible for promoting the site to logistics providers/transport operators and planning its future development.
The involvement of professional property developers has contributed to the successful development of intermodal interfaces in the United States.
8.3 Initiatives to remove institutional barriers to successful operation of intermodal interfaces
If intermodal interfaces are to work effectively, especially if they are located in inland areas at a considerable distance from seaports, they will require reliable and frequent mainline transport services to/from other cargo generating and transshipment locations. In this connection, the study recommends that:
Governments:
(i) provide at these facilities the full time presence of inspection staff from customs and other government agencies (e.g. border security, agriculture and quarantine, etc) with a role in trade inspection and clearance; and
(ii) ensure that trade consignments dispatched from these facilities are authorized to proceed to their final destinations without interruption for inspection at en-route locations (including at borders), other than for minimal inspection of customs seals and trade/transit documentation.
82 Strategic Rail Authority (SRA) : Strategic Rail Freight Interchange Policy, May 2004, page 39.

99
In the interests of making most efficient use of intermodal facilities and of minimizing supply chain costs, it is also highly desirable that cargo inspection practices should not unduly delay consignments in CYs, break-bulk/bulk open storage areas, or in warehouses.
The governments of the region will have a particularly important role in ensuring greater efficiency in the transaction of customs and other border crossing formalities.
A good example of what can be achieved in terms of minimizing delays to trade consignments is to be found in the Malaysia to Thailand container rail land-bridging services, operating between Port Klang and Bangkok (Lat Krabang). Under arrangements concluded between the private sector operators of these services, and the railway and customs authorities of both countries, containers moved on these services are rarely detained for inspection at the Padang Besar border and then only for checking of container seals which have been affixed at the originating terminal. Under these arrangements, border inspection procedures if indeed they have to be carried out at all, are made more efficient by the fact that the customs authorities of both countries operate from a single inspection point in the Padang Besar yard.
__________

100
Annex 1
Busan Declaration on Transport Development in Asia and the Pacific
__________
We, the Ministers of transport of the members and associate members of the Economic and Social Commission for Asia and the Pacific attending the Ministerial Conference on Transport, held at Busan, Republic of Korea, from 6 to 11 [on 10 and 11] November 2006,
Recognizing the increasing impact of globalization, and the substantial growth in output, trade and investment being experienced by many countries in the Asian and Pacific region,
Stressing the crucial role of efficient, reliable and cost-effective transport services, including infrastructure, facilitation and logistics, in supporting continued growth through improved competitiveness of exports and reduced cost of imports,
Noting that growth has taken place mainly in coastal areas that have well-developed regional and interregional maritime transport linkages with international sourcing and production networks,
Convinced of the important role of “dry ports” in the development of an international integrated intermodal system and their potential to become centres for economic development, particularly in landlocked countries and wider domestic hinterlands,
Welcoming the successful regional cooperation that led to the formalization of the intergovernmental agreements on the Asian Highway83 and Trans-Asian Railway84 networks, which are the major building blocks in the development of an international integrated intermodal transport system, which the region needs in order to meet the growing challenges of globalization,
Recognizing that the full benefits of an international integrated intermodal transport system will not be realized unless the physical infrastructure issues, including road, rail, inland waterways, maritime transport, dry ports, airports, seaports and information and communication technology, as well as the non-physical issues, including multimodal transport operations, customs clearance, and banking and other commercial networks, are addressed comprehensively,
Noting that the issues relating to the identification of any national shortfalls in the areas of transport security and the provision of assistance upon request to address them are being dealt with by the International Maritime Organization, the World Customs Organization and the International Civil Aviation Organization,
Recognizing the need to mobilize financial resources and improve organizational arrangements for the development of the necessary physical and non-physical infrastructure,
Stressing that a long-term regional transport development strategy can promote regional cooperation and development effectively, as demonstrated by the New Delhi Action Plan on Infrastructure Development in Asia and the Pacific, 1997-2006,85
83 See Commission resolution 60/4 of 28 April 2004. 84 Commission resolution 62/4 of 12 April 2006, annex. 85 Commission resolution 51/8 of 1 May 1995, annex.

101
Recalling the United Nations Millennium Declaration86 and the 2005 World Summit Outcome,87
in which Heads of State and Government reiterated their determination to ensure the timely and full realization of the development goals and objectives agreed at the major United Nations conferences and summits, including those agreed at the Millennium Summit, described as the Millennium Development Goals,
Stressing in this context the important contribution of transport infrastructure and services in achieving the Millennium Development Goals,
Recalling the Almaty Programme of Action: Addressing the Special Needs of Landlocked Developing Countries within a New Global Framework for Transit Transport Cooperation for Landlocked and Transit Developing Countries,88
Encouraged by the profound impact of the Seoul Declaration on Infrastructure Development in Asia and the Pacific,89 which resulted in the active and constructive participation of members and associate members of the Commission in promoting regional cooperation for the development of transport infrastructure and services,
1. Resolve that, in order to meet the growing challenges of globalization effectively, our respective government authorities will develop and implement transport policies at the national, subregional and regional levels in line with the following principles:
(a) Formulating integrated policies and decision-making frameworks based on strategic assessments of economic, environmental, social and poverty-related aspects;
(b) Developing an international integrated intermodal transport and logistics system that contributes to the long-term objective of regional cooperation in support of production and distribution networks and international trade;
(c) Giving priority to investment in the Asian Highway and Trans-Asian Railway networks, including intermodal interfaces to link them with water and air transport networks;
(d) Promoting the development of economic and logistic activities at intermodal interfaces, particularly at production and consumption centres, and around seaports and dry ports;
(e) Mobilizing financial resources for the development of the transport system, its maintenance and operation from all possible sources, including private sector partnerships and other financial arrangements;
2. Adopt the Regional Action Programme for Transport Development in Asia and the Pacific, phase I (2007-2011), as contained in the annex to the present declaration;
3. Reiterate our support for the implementation of the Almaty Programme of Action for the benefit of landlocked and transit developing countries;
4. Invite the members and associate members of the Commission, international financing institutions, donor countries, concerned agencies of the United Nations, other relevant international organizations, subregional organizations, and the private sector to participate in and extend financial support to the implementation of the Regional Action Programme;
5. Request the Executive Secretary:
86 General Assembly resolution 55/2 of 8 September 2000. 87 General Assembly resolution 60/1 of 16 September 2005. 88 Report of the International Ministerial Conference of Landlocked and Transit Developing Countries and Donor
Countries and International Financial and Development Institutions on Transit Transport Cooperation, Almaty, Kazakhstan, 28 and 29 August 2003 (A/CONF.202/3), annex I.
89 E/ESCAP/1249, chap. IV.

102
(a) To assist regional member and associate member countries in realizing the long-term vision of an international integrated intermodal transport and logistics system, which is needed in order to meet the growing challenges of globalization;
(b) To accord priority to the implementation of phase I (2007-2011) of the Regional Action Programme, including the mobilization and deployment of resources;
(c) To ensure effective coordination with other United Nations and multilateral agencies as well as subregional organizations, including the Association of Southeast Asian Nations, the Economic Cooperation Organization, the Pacific Islands Forum Secretariat, the South Asian Association for Regional Cooperation and the Shanghai Cooperation Organization;
(d) To collaborate effectively with international and regional financing institutions, multilateral and bilateral donors and international organizations and, if necessary, determine other possible innovative sources of financing for the implementation of the Regional Action Programme;
(e) To assess and evaluate the impact of the Regional Action Programme continuously and submit reports with recommendations to the Commission at its sixty-fourth session and subsequent sessions until the end of the Regional Action Programme;
(f) To carry out in 2011 an evaluation of the implementation of phase I of the Regional Action Programme as an important and necessary step in the preparation of phase II (2012-2016).


