+ All Categories
Home > Documents > Policy, legislation and advanced treatment technologies...

Policy, legislation and advanced treatment technologies...

Date post: 17-Oct-2020
Category:
Upload: others
View: 3 times
Download: 0 times
Share this document with a friend
35
Policy, legislation and advanced treatment technologies for industrial-environmental symbiosis within the Lagoon of Venice Francesco Fatone Laboratory of Bioprocess and Chemical-Environmental Engineering Department of Biotechnology, University of Verona, Italy
Transcript

Policy, legislation and advancedtreatment technologies for

industrial-environmental symbiosiswithin the Lagoon of Venice

Francesco Fatone

Laboratory of Bioprocess and Chemical-Environmental EngineeringDepartment of Biotechnology, University of Verona, Italy

Contents

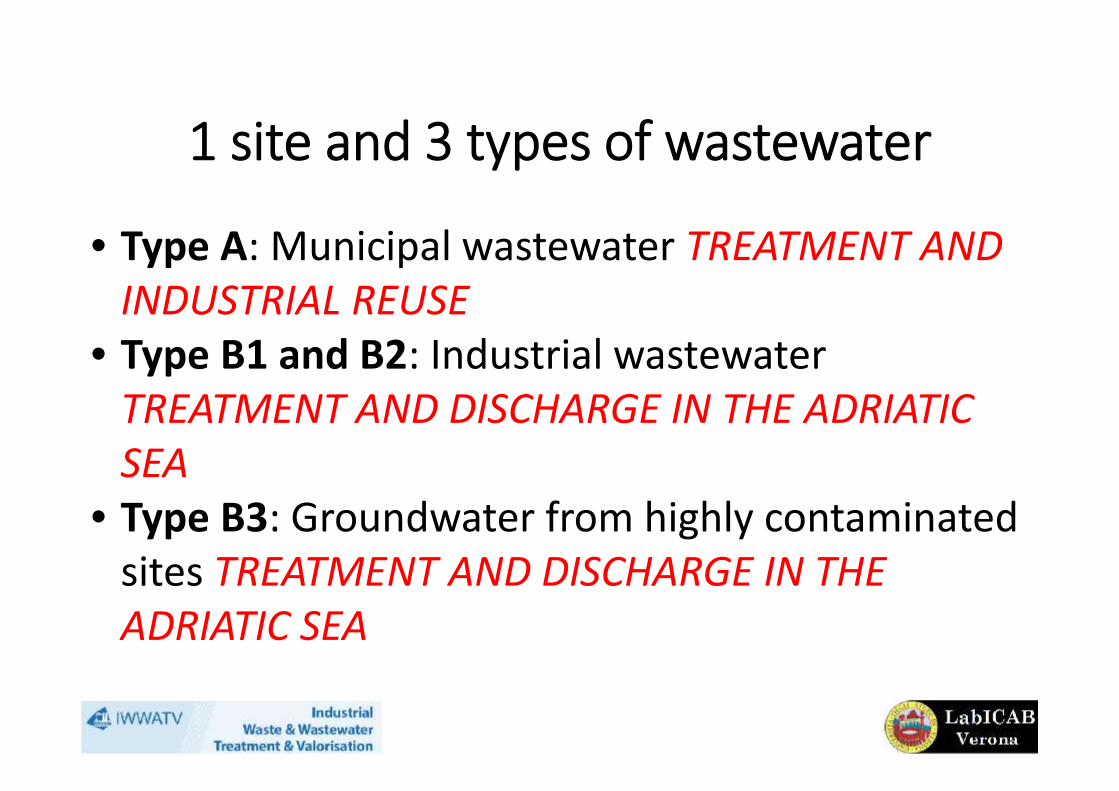
• Porto Marghera: growth, potential tobecome Eco-Industrial Park and decline

• Lagoon of Venice: environmentalmanagement and focus on (waste)water

• Porto Marghera: focus on the petrochemicalwastewater treatment

• Final considerations…to stimulate thediscussion

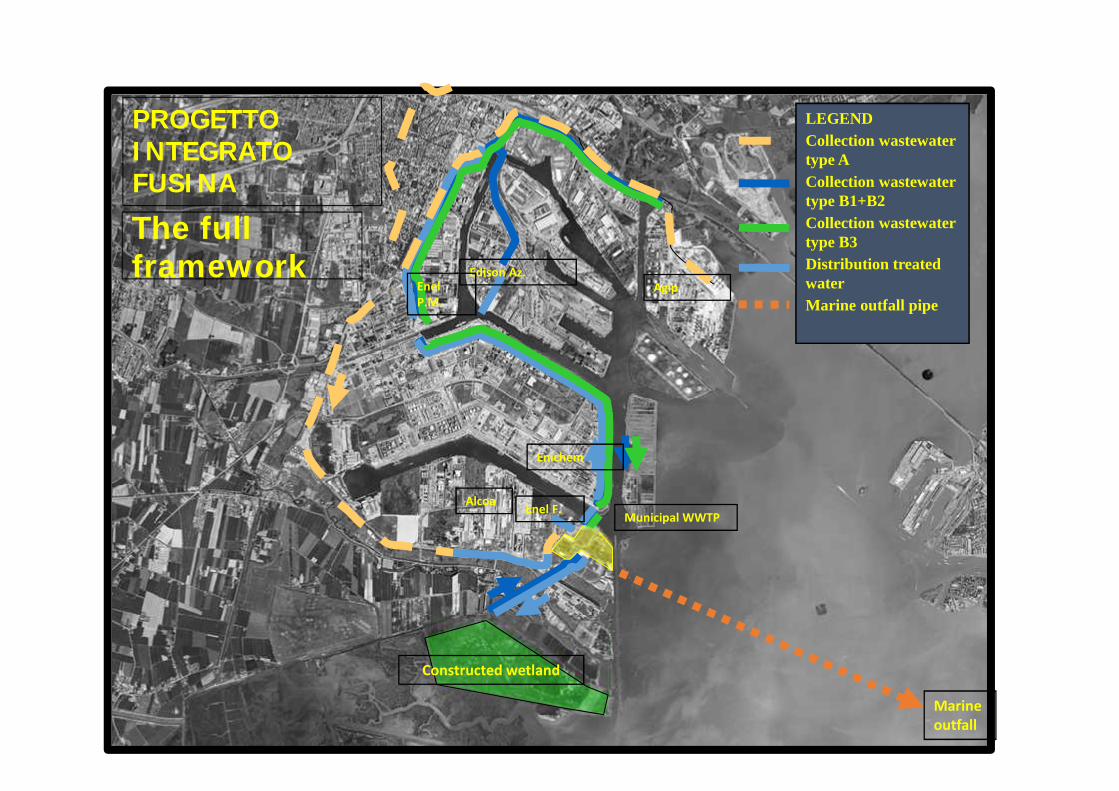
Venice and Porto Marghera…within the Lagoon of Venice

Porto MargheraLarge Indutstrial Site

Venice historical centre

2000 hectares

History of and large industrial site, withina very fragile environmental context

• 1917: insufficient infrastructure in the old port ofVenice, new commercial port in the mainland

• 1917-1940: development of the 1st industrial area• 1955-1965: development and saturation of the 2nd

industrial area• 1965: planning of the 3rd industrial area• 1966: Venetian flood (194 cm) and booming of the

public concern about the environmentalmanagement of the Lagoon

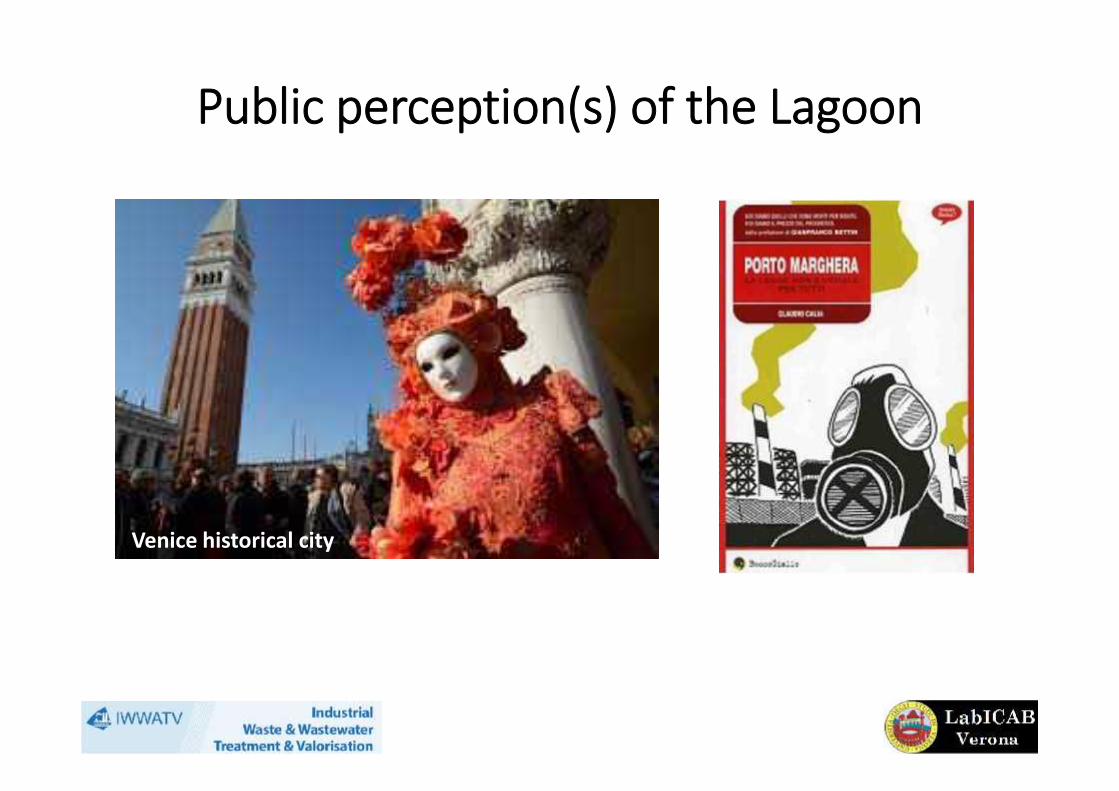
Public perception(s) of the Lagoon

Venice historical city

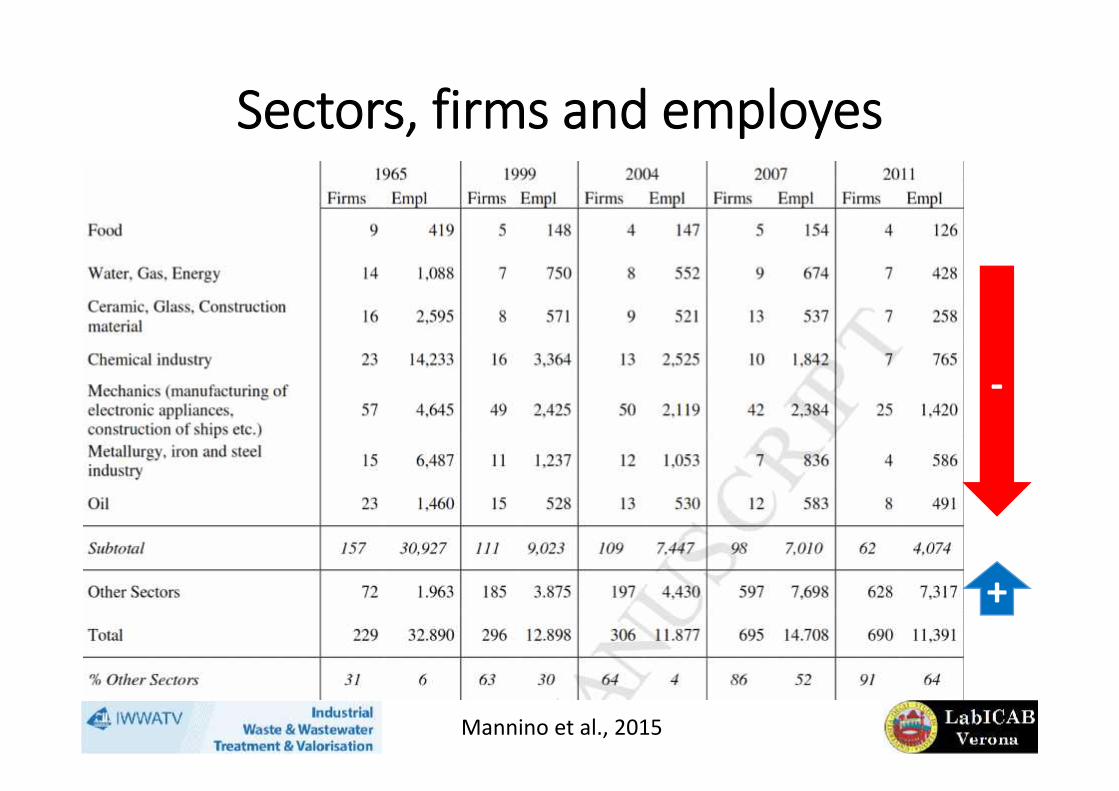
Firms and employes in the industrial site

Firms

Employes

Sectors, firms and employes

Mannino et al., 2015

-

+

Industrial symbiosis

Industrial Symbiosis engagestraditionally separate industries in acollective approach to competitive

advantage involving physical sharingof materials, energy, water, and/or

by products

Certow, 2000

Conditions for the survival and thedevelopment of eco-industrial parks

• Synergies among the firms• Availability of infrastructure• Presence of a flexible regulatory

framework and favorable policies• Presence of information management

system

1998: Agreement for chemicalindustry in Porto Marghera -

aiming at the Eco-Industrial Park• Develop an environmental management systems

among the firms• Annual environmental accounting• Improve processes and develop research to this aim• Reduce and rationalize the use and transportation of

raw material• Replace the hazardous substances with less polluting

compounds

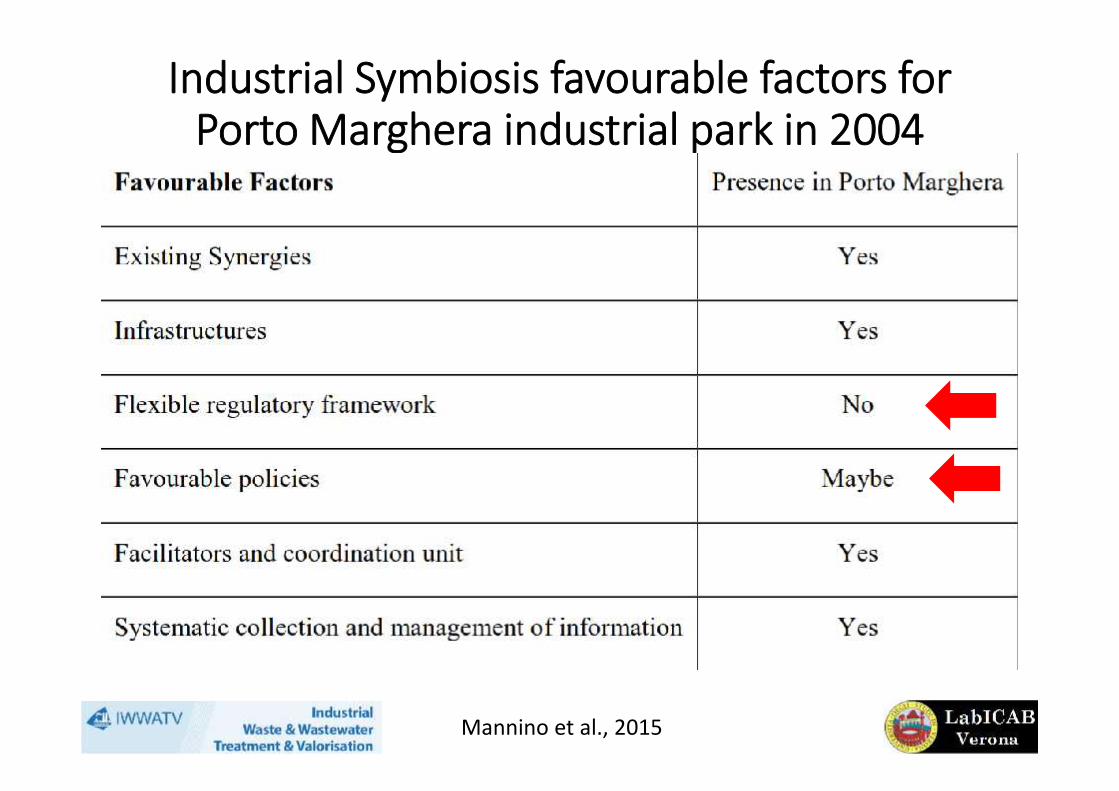
Industrial Symbiosis favourable factors forPorto Marghera industrial park in 2004

Mannino et al., 2015

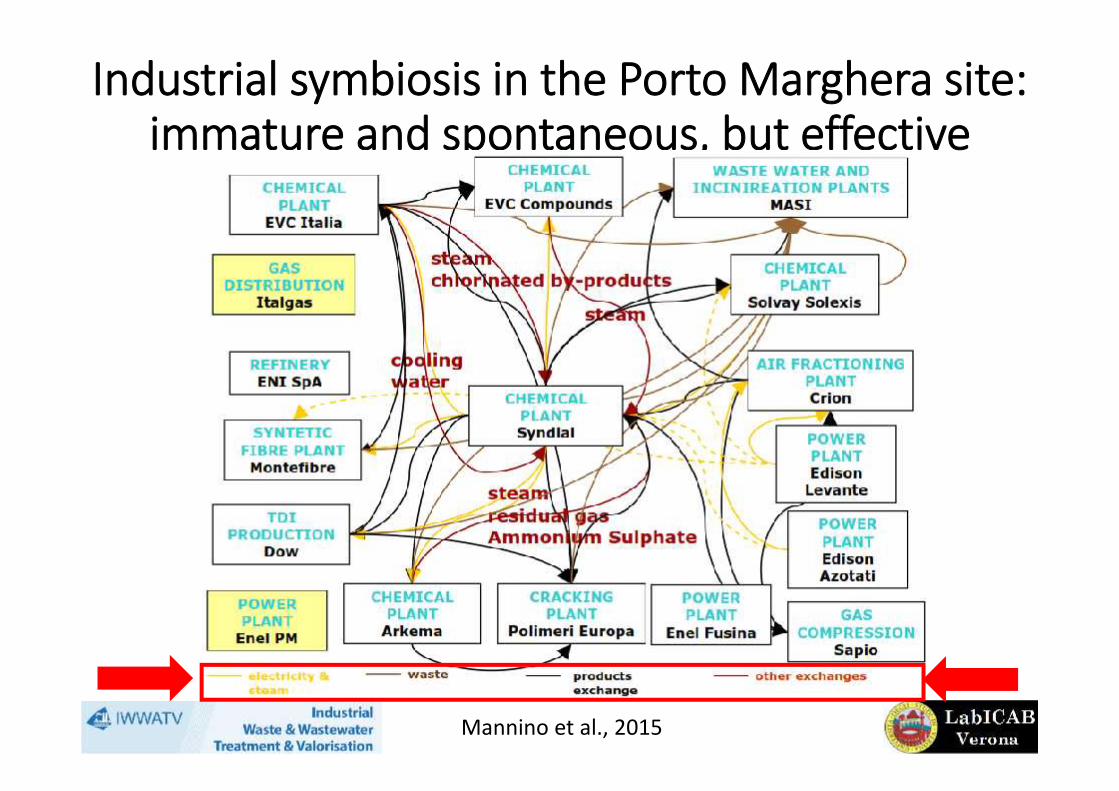
Industrial symbiosis in the Porto Marghera site:immature and spontaneous, but effective

Mannino et al., 2015

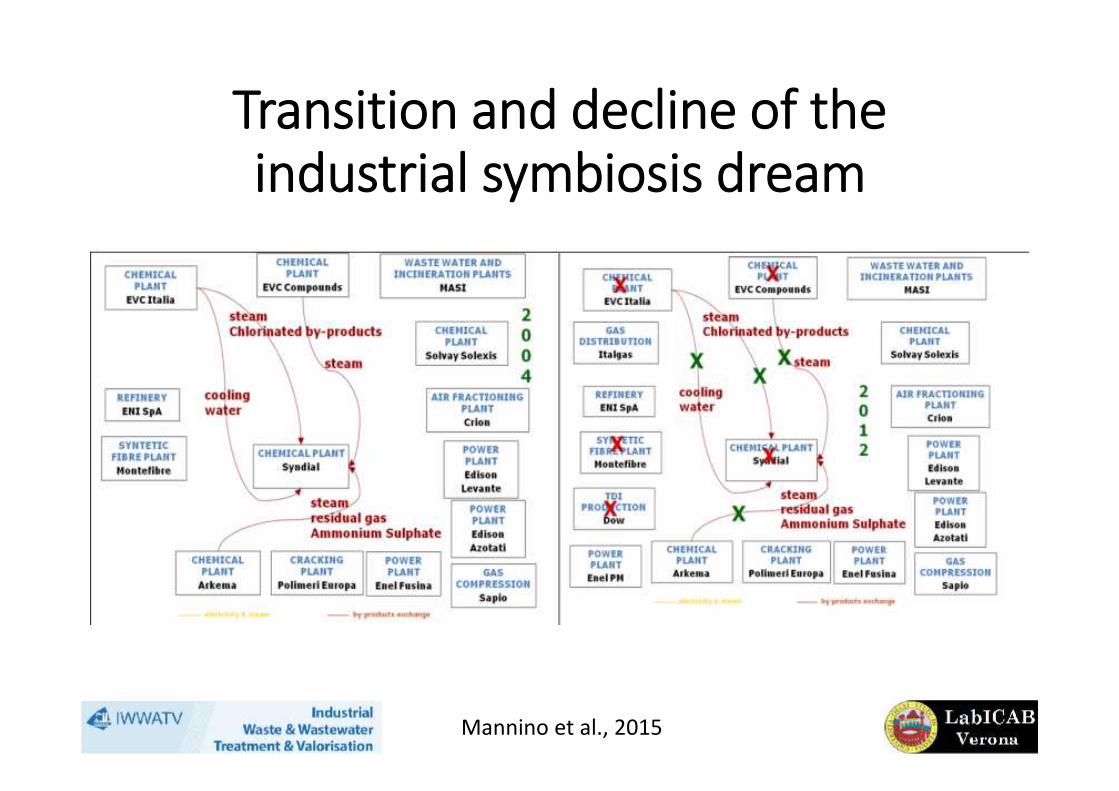
Transition and decline of theindustrial symbiosis dream

Mannino et al., 2015

The unique case of the Lagoon of Venice

Main special national laws to protect and safeguardthe Lagoon form pollution:• Law 16 April 1973• Decree 24 Apr 1998• Decree 16 Dec 1998• Decree 09 Feb 1999• Decree 26 May 1999• Decree 30 Jul 1999

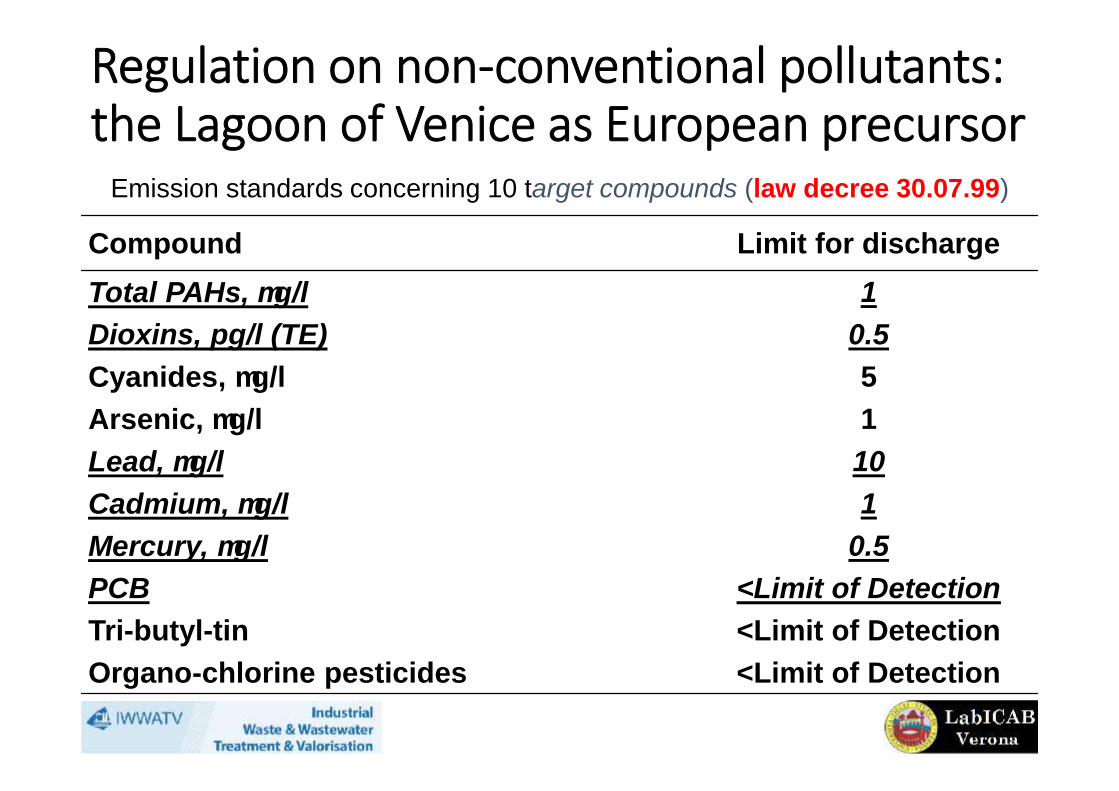
Regulation on non-conventional pollutants:the Lagoon of Venice as European precursor

Compound Limit for dischargeTotal PAHs, g/l 1Dioxins, pg/l (TE) 0.5Cyanides, g/l 5Arsenic, g/l 1Lead, g/l 10Cadmium, g/l 1Mercury, g/l 0.5PCB <Limit of DetectionTri-butyl-tin <Limit of DetectionOrgano-chlorine pesticides <Limit of Detection

Emission standards concerning 10 target compounds (law decree 30.07.99)

Study site: Industrial WWTP Porto Marghera, Venice, Italy

Porto Margherapetrochemical MBR

MBR-SG31

Clari-flocculation SG31

MBR-Pilot

PVDF HF Membrane 100 109 m2 Influent flowrate 45 720 m3/d

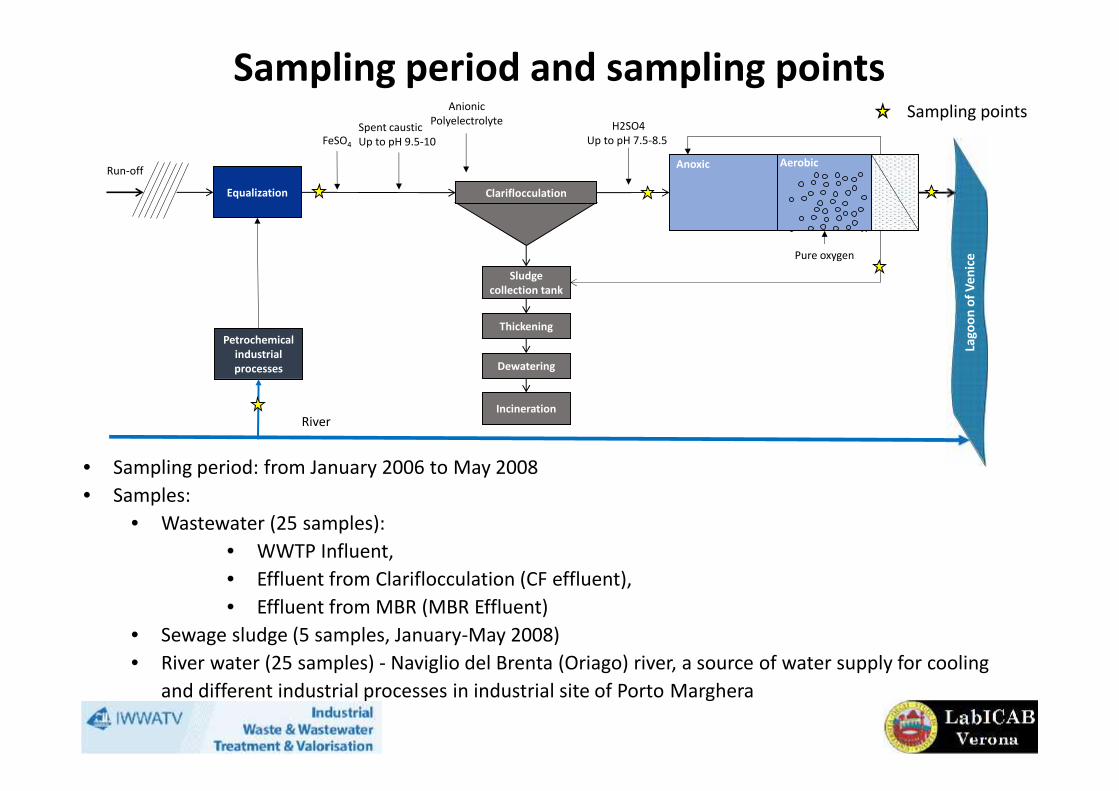
• Sampling period: from January 2006 to May 2008• Samples:

• Wastewater (25 samples):• WWTP Influent,• Effluent from Clariflocculation (CF effluent),• Effluent from MBR (MBR Effluent)

• Sewage sludge (5 samples, January-May 2008)• River water (25 samples) - Naviglio del Brenta (Oriago) river, a source of water supply for cooling

and different industrial processes in industrial site of Porto Marghera
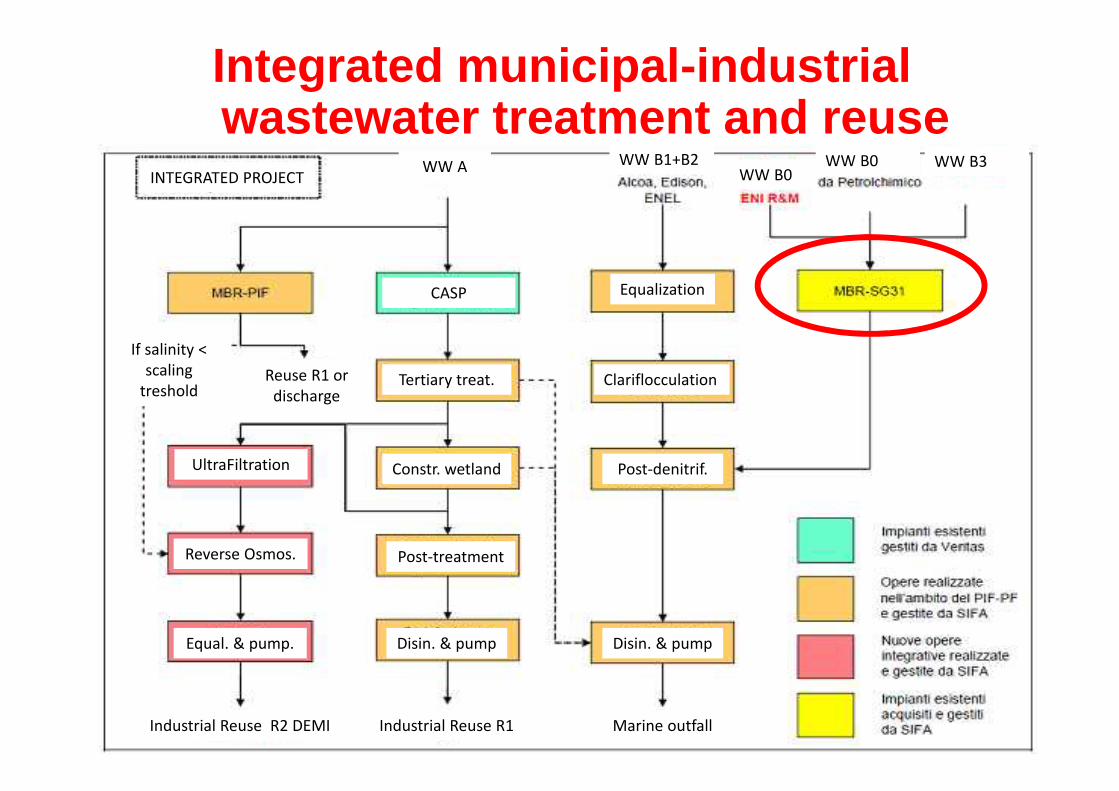
FeSO4

Spent causticUp to pH 9.5-10

AnionicPolyelectrolyte

ClariflocculationEqualization

Sludgecollection tank

Thickening

Anoxic Aerobic

Pure oxygen

H2SO4Up to pH 7.5-8.5

Petrochemicalindustrialprocesses

Run-off

River

Dewatering

Incineration

Lago

on o

f Ven

ice

Sampling points

Sampling period and sampling points

PCBs in wastewater: DL-PCBsINFLUENT

• Out of 12 DL-PCBs, 6 detected• Penta-CB 105 (150 pg/L) and 118 (510 pg/L), and hexa-CB 156 and 167: 100 % FQ• Tetra-CB 77 and hepta-CB 189: FQ of 72% and 48%, respectively

MBR EFFLUENT• Only 2 PCBs > LOQ: 118 (40 pg/L, FQ 64 %) and 156 (30 pg/L, FQ 28 %)

OVERALL REMOVAL of ΣDL-PCB: 93 %• 90 % (PCB 118) – 100 % (PCB 189)

0

50

100

Primary Secondary Overall

156

Rem

oval

(%)

0

100

200

300

400

500

600

700

800

77 118 105 167 156 189

Con

cent

ratio

n of

PC

B-D

L (p

g/L)

0

50

100

Primary Secondary Overall

118

Rem

oval

(%)

118

0

50

100

Primary Secondary Overall

105

Rem

oval

(%)

105

Max

Min

Mdn

Q1

Q3

Inf EffPhCh EffMBR

Removal 1ry treatment

Removal 2ry treatmentOverall removal

156

• Toxicity equivalency factor (TEF) = the toxicity of PCBs relative to a reference compound - 2,3,7,8-tetrachlorodibenzo-p-dioxin (TCDD)

• Total toxic equivalent (TEQ) = the sum of the products of the concentration of each compound multiplied by its TEF value and is an estimate

of the total TCDD–like activity of the mixture

World Health Organization (WHO) TEFs to calculate dioxin-like TEQ(WHO, 2005.) 0

0,01

0,02

0,03

0,04

0,05

0,06

WHO

-TEQ

mixt

ure

(pg

WHO

-TEQ

/L)

Dioxin-like PCBs

Homologs Congeners WHO-TEF 2005.

Tetra-CB PCB 77 0.0001Tetra-CB PCB 81 0.0003Penta-CB PCB 105 0.00003Penta-CB PCB 114 0.00003Penta-CB PCB 118 0.00003Penta-CB PCB 123 0.00003Penta-CB PCB 126 0.1Hexa-CB PCB 156 0.00003Hexa-CB PCB 157 0.00003Hexa-CB PCB 167 0.00003Hexa-CB PCB 169 0.03

Hepta-CB PCB 189 0.00003

80 % 95 %

75 %

Total dioxin–like activity: wastewater

TEQmixture = Σ(Ci × TEFi)

PCBs in wastewater: DL-PCBs

0.3 pgTEQ/L

0.0015 pgTEQ/L

FeSO4

Spent causticUp to pH 9.5-10

AnionicPolyelectrolyte

ClariflocculationEqualization

Sludgecollection tank

Thickening

Anoxic Aerobic

Pure oxygen

H2SO4Up to pH 7.5-8.5

Petrochemicalindustrialprocesses

Run-off

Dewatering

Incineration

Lago

on o

f Ven

iceINDUSTRIAL WWTP PORTO MARGHERA

River

19000 m3/h

1500 m3/h

ΣPCB 2.1 ng/L (1.0 – 4.4 ng/L)

ΣPCB 0.5 ng/L (0.2 – 1.1 ng/L)

ΣPCB mass flow rate:0.75 mg/h (0.3-1.7 mg/h)

ΣPCB mass flow rate:40 mg/h (19 - 84 mg/h)

Effluent

PCB (river) >> PCB (river)

! Total PCB mass flow rate of river has a more important impact on the Lagoon of Venice

than the WWTP effluent

PCBs in river vs. PCBs in WWTP effluent: mass flow rate

FeSO4

Spent causticUp to pH 9.5-10

AnionicPolyelectrolyte

ClariflocculationEqualization

Sludgecollection tank

Thickening

Anoxic Aerobic

Pure oxygen

H2SO4Up to pH 7.5-8.5

Petrochemicalindustrialprocesses

Run-off

Dewatering

Incineration

Lago

on o

f Ven

iceINDUSTRIAL WWTP PORTO MARGHERA

River

ΣPCB 2.1 ng/L (1.0 – 4.4 ng/L)

ΣPCB 0.5 ng/L (0.2 – 1.1 ng/L)

Effluent

WHO-TEQPCB (River) > WHO-TEQPCB (WWTP Effluent)

! Total DL-PCB in river has a more important impact on the Lagoon of Venice

than the WWTP effluent! The highest contribution to the total TEQ in both the river and the MBR effluent samples was observed

for mono-ortho-substituted PCB 118 (WHO-TEF of 0.00003)

PCBs in river vs. PCBs in WWTP effluent: TEQmixture

0.0015 pg WHO-TEQ/L(0.001 - 0.0141)

0.0053 pg WHO-TEQ/L(0.001 - 0.0337)

1 site and 3 types of wastewater

• Type A: Municipal wastewater TREATMENT ANDINDUSTRIAL REUSE

• Type B1 and B2: Industrial wastewaterTREATMENT AND DISCHARGE IN THE ADRIATICSEA

• Type B3: Groundwater from highly contaminatedsites TREATMENT AND DISCHARGE IN THEADRIATIC SEA

The flowratesDesign flowrate - WW Type A Dry weather average flowrate 4’600 m³/h Dry weather average flowrate 6’000 m³/h Peak wet flowrate 12’000 m³/h ( fitodepurazione)

Design flowrate - WW Type B WW B1 – average flowrate 2’300 m³/h WW B2 – average flowrate 700 m³/h Design average flowrate B1+B2 3’000 m³/h

WW B3 – average flowrate about 5’000 m³/d

Reuse

•FUSINA WWT Plant

WETLAND TREATMENT

Marine outfall

•MARGHERA WWT Plant

Type A wastewater

Type B1+B2 wastewater

Type B3 wastewater

Treated water to reuse

Sea outfall

SG31 SPM industrial WWTP

The full plan for wastewater treatment and reuse

MPPORTO

MARGHERA“B type” flowPre-treatment

Ca’ Solaro

Sile River

PIF

MoSAV(drinking water

supply)

“A type” flowpre-treatment

“A type” flowbiological treatment

“A type” flowPost-treatment

”B type” flowPost-treatment

“A type” flowfrom wetlands

Dischargeto sea

Watertreatmentand reusegeneral

plan

Integrated municipal-industrialwastewater treatment and reuse

Equalization

Clariflocculation

Post-denitrif.

WW B1+B2

Disin. & pump

Post-treatment

Constr. wetland

Tertiary treat.

CASP

UltraFiltration

Reverse Osmos.

Equal. & pump. Disin. & pump

Marine outfallIndustrial Reuse R1Industrial Reuse R2 DEMI

WW B0WW B0 WW B3

Reuse R1 ordischarge

If salinity <scaling

treshold

INTEGRATED PROJECT WW A

Municipal WWTP

Constructed wetland

The fullframework

LEGENDCollection wastewatertype ACollection wastewatertype B1+B2Collection wastewatertype B3Distribution treatedwaterMarine outfall pipe

LEGENDCollection wastewatertype ACollection wastewatertype B1+B2Collection wastewatertype B3Distribution treatedwaterMarine outfall pipe

Marineoutfall

Alcoa Enel F.

Enichem

Edison Az.EnelP.M.

Agip

PROGETTOINTEGRATOFUSINA

Constructed wetland120 hectares

Final considerationsThe industrial symbiosis in the large petrochemical area of

Porto Marghera spontanously triggered, but endogenous andexogenous social, legal and economic factors inhibited thedevelopment of the Eco-Industrial Park

The concentration of ubiquitous persistent compounds (e.g.PCBs) in industrial WW and sludge were lower than thosereported elsewhere, while the PCB loading of the river wasmore relevant than the treated industrial wastewater

The efforts to reach the environment-industry symbiosis shouldbe flexible with exogenous drivers of the industrial decisions

Thank you for your attention

Francesco Fatone

Laboratory of Bioprocess and Chemical-Environmental EngineeringDepartment of Biotechnology, University of Verona, Italy

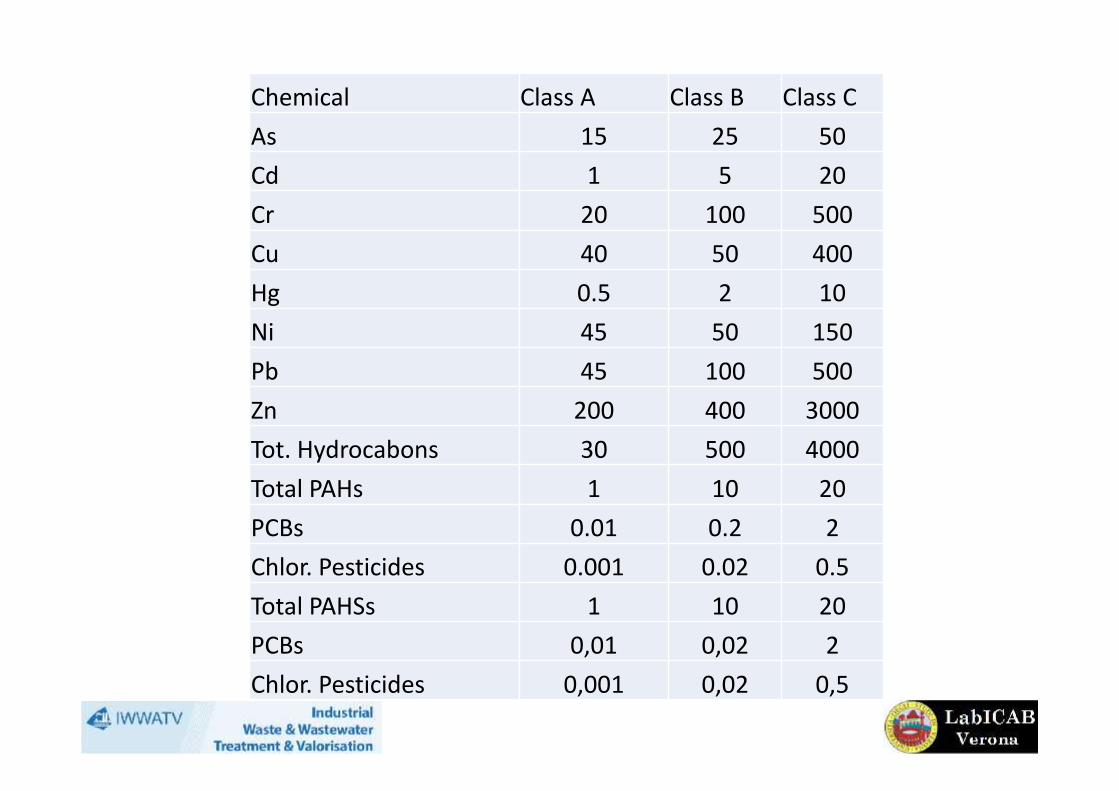
Additional slides: sedimentsmanagement in the Lagoon of Venice

Chemical Class A Class B Class CAs 15 25 50Cd 1 5 20Cr 20 100 500Cu 40 50 400Hg 0.5 2 10Ni 45 50 150Pb 45 100 500Zn 200 400 3000Tot. Hydrocabons 30 500 4000Total PAHs 1 10 20PCBs 0.01 0.2 2Chlor. Pesticides 0.001 0.02 0.5Total PAHSs 1 10 20PCBs 0,01 0,02 2Chlor. Pesticides 0,001 0,02 0,5


Recommended