Ricardo-AEA provided technical support to the European Commission in assessing the environmental, social and economic impacts of policy proposals to reduce GHG emissions from the international shipping sector. Despite some recent progress in the IMO negotiations with respect to technical measures for new ships, the emissions of existing vessels are still not regulated. At the European level, a range of targets have been set concerning economy-wide GHG emission reductions. International shipping is the only sector not included in EU level GHG reduction targets. The modelling projections developed for this project show that under the baseline scenario CO2 emissions from European maritime transport would increase by over 50% between 2010 and 2050. As such, there is a pressing need to take action to control the growing GHG emissions from the international maritime sector.
255
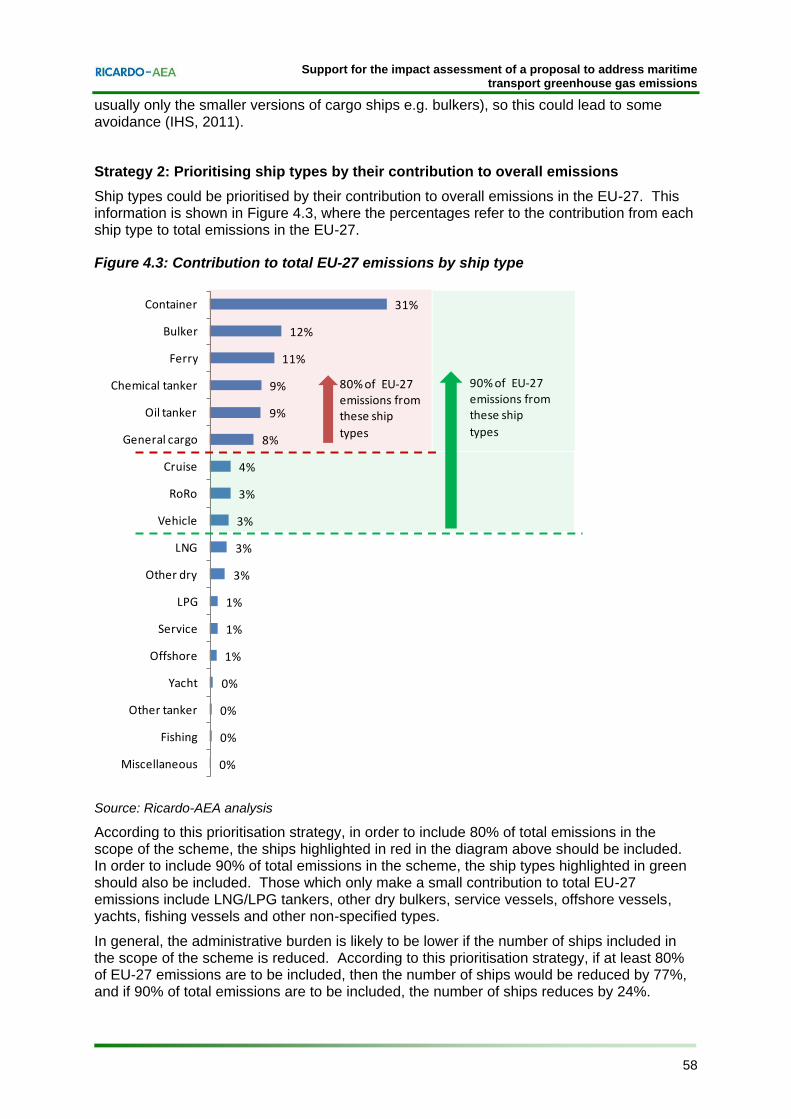
Support for the impact assessment of a proposal to address maritime transport greenhouse gas emissions Ref: CLIMA.B.3/SER/2011/0005 Report for European Commission – DG Climate Action Ricardo-AEA/R/ED56985 Issue Number 5 Date: 13/01/2013
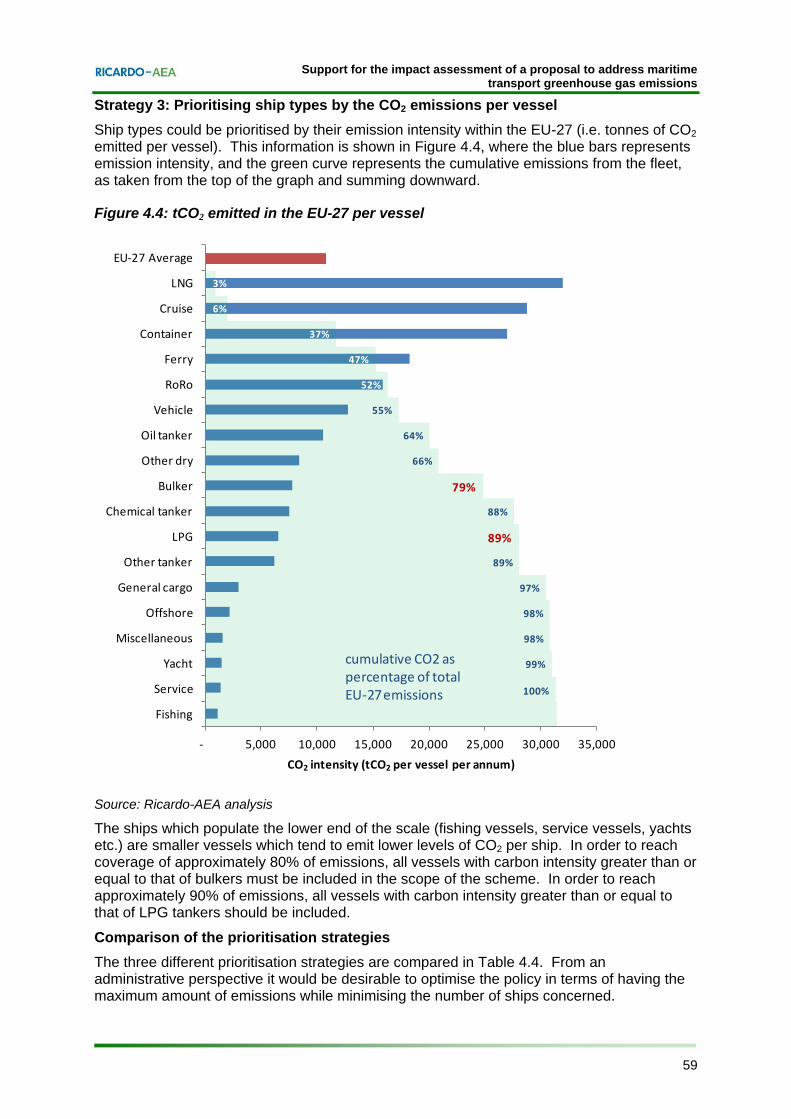
Transcript
Support for the impact assessment of a proposal to address maritime transport greenhouse gas emissions
Ref: CLIMA.B.3/SER/2011/0005
Report for European Commission – DG Climate Action
Ricardo-AEA/R/ED56985 Issue Number 5 Date: 13/01/2013
Support for the impact assessment of a proposal to address maritime transport greenhouse gas emissions
i Ref: Ricardo-AEA/R/ED56985/Issue Number 5
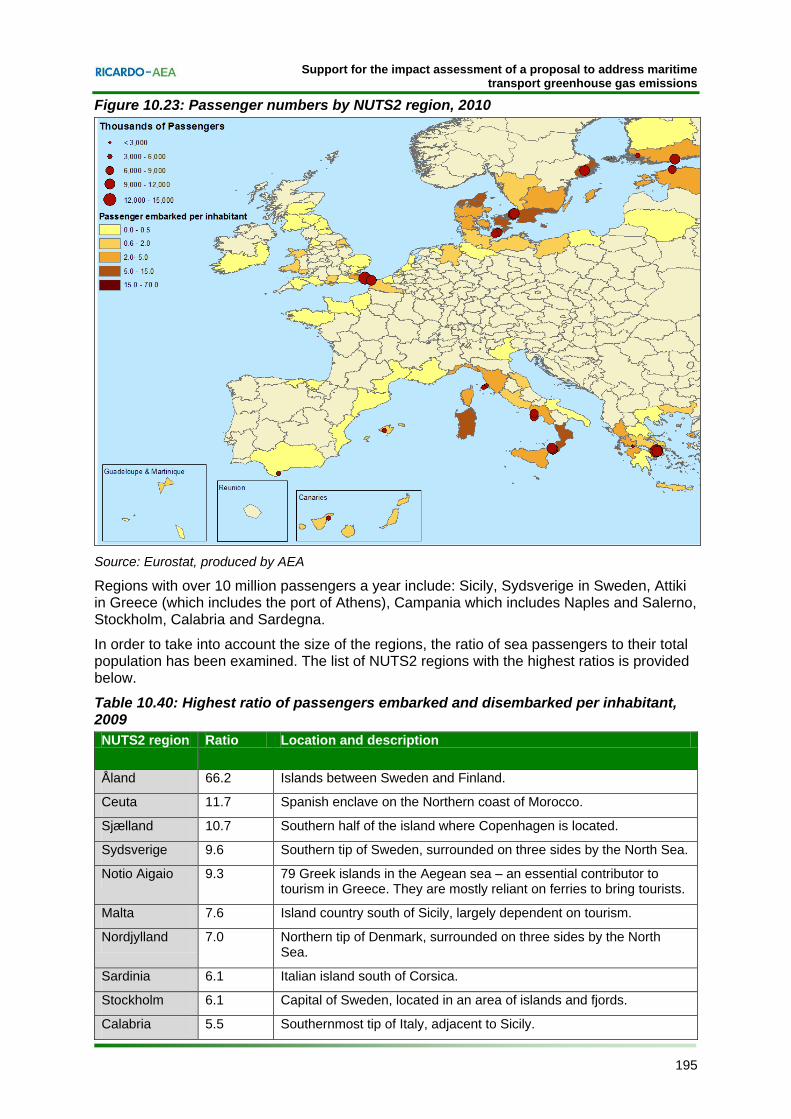
Customer: Contact:
European Commission – DG Climate Action Sujith Kollamthodi
Ricardo-AEA is certificated to ISO9001 and ISO14001
Customer reference:
CLIMA.B.3/SER/2011/0005
Confidentiality, copyright & reproduction:
This report is the Copyright of the European Commission and has been prepared by Ricardo-AEA Ltd under a contract with DG Climate Action dated 12/09/2011. The contents of this report may not be reproduced in whole or in part, nor passed to any organisation or person without the specific prior written permission of the European Commission. Ricardo-AEA Ltd accepts no liability whatsoever to any third party for any loss or damage arising from any interpretation or use of the information contained in this report, or reliance on any views expressed therein.
Authors:
Sujith Kollamthodi, Ana Pueyo, Gena Gibson, Rasa Narkeviciute, Adam Hawkes, Stephanie Cesbron, Robert Milnes, James Harries (Ricardo-AEA)
Tony Zamparutti, Guillermo Hernandez, Styliani Kaltsouni, Sophie Vancauwenbergh and Gretta Goldenman (Milieu)
Christopher Pålsson. Niklas Bengtsson, Torbjörn Rydbergh, Lennart Nilsson, Andreas Krantz, Kristina Weber (IHS)
Tim Scarbrough, Chris Whall, Chris Green, Jenny Hill, Jin Lee, Richard Noden, Ben Grebot (AMEC)
Haakon Lindstad (Marintek)
Approved By:
Sujith Kollamthodi
Date:
13 January 2013
Signed:
Ricardo-AEA reference:
Ref: ED56985- Issue Number 5
Support for the impact assessment of a proposal to address maritime transport greenhouse gas emissions
ii Ref: Ricardo-AEA/R/ED56985/Issue Number 5
Executive summary
Shipping activity makes a substantial contribution to GHG emissions (3.3% of global CO2 emissions in 2007). Global maritime transport (including international and domestic shipping) emitted around 1,070 Mt of CO2-equivalent in 2007, of which 98% (1050 Mt) were CO2 emissions (IMO, 2009). The demand for shipping is closely linked to the development of the world economy, as maritime transport carries around 90% of international world trade. Between 1990 and 2007 CO2 emissions from global maritime transport increased by 87%. Over the same period, world GDP increased by around 65% and world seaborne trade increased by over 100% (by volume) (UNCTAD, 2011).
The international regulatory context for shipping emissions is set by the Marine Environmental Protection Committee (MEPC) of the International Maritime Organization (IMO). In 2003, the IMO adopted Resolution A.963(23), which “urges the MEPC to identify and develop the mechanism or mechanisms needed to achieve the limitation or reduction of GHG emissions from international shipping’. Despite some recent progress in the IMO negotiations, the emissions of existing vessels are still not regulated. Progress when discussing market-based measures has stalled mainly due to the conflict between the principle of equal treatment (under the IMO principle that regulations should be flag neutral) and respecting the UN’s Kyoto Protocol principle of lesser responsibilities for developing countries under the concept of “common but differentiated responsibility”.
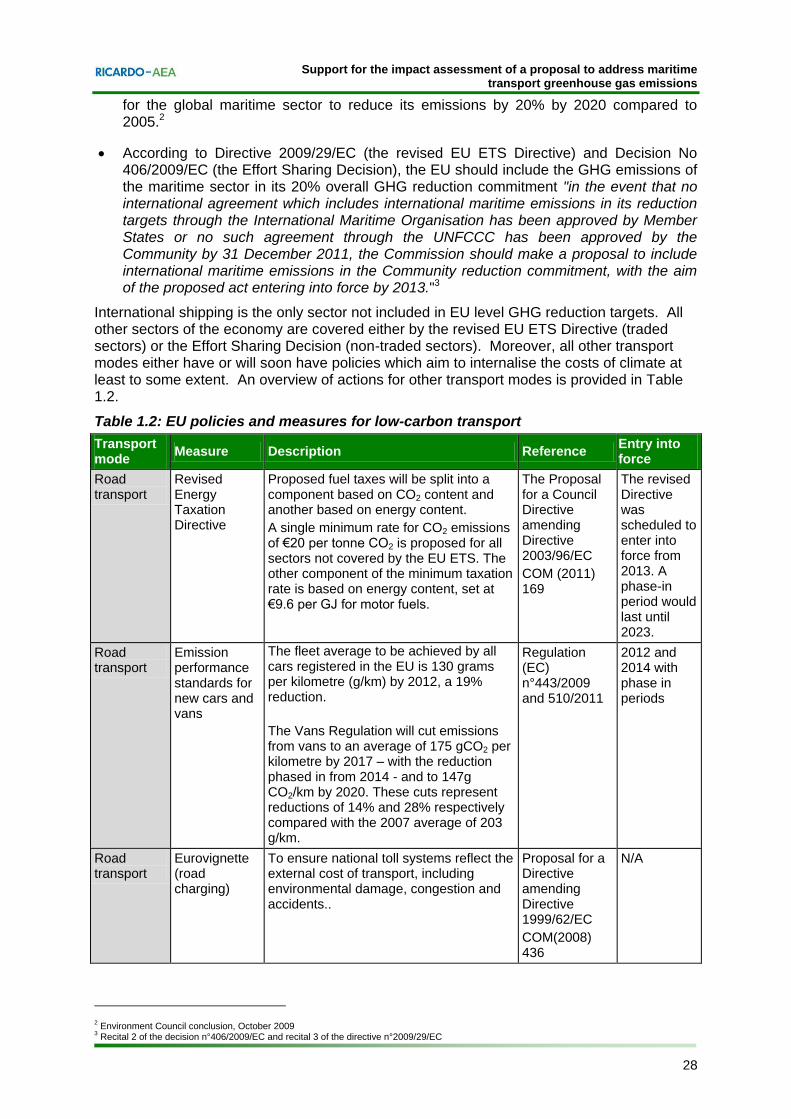
At the European level, a range of targets have been set, or are being discussed, concerning economy-wide GHG emission reductions. These include specific targets for the transport sector, but to date, GHG emissions from international shipping have not been included in EU climate policy. According to the revised EU ETS Directive (2009/29/EC) and the Effort Sharing Decision (406/2009/EC), the EU should make a proposal to include international maritime emissions in the Community reduction commitment, with the aim of the proposed act entering into force by 2013 in the event that no international agreement which includes international maritime emissions in its reduction targets through the International Maritime Organisation has been approved by Member States or no such agreement through the UNFCCC has been approved by the Community by 31 December 2011. Any proposal of this nature must be subject to a formal Impact Assessment, and this study was commissioned to provide comprehensive technical support to this Impact Assessment.
The need for EU action
Shipping is an international sector and many ships have the option to choose which ports to use. Consequently, there is a high risk of activity moving between Member States if individual national action is taken. To this end, individual Member States have been reluctant to develop legislation to reduce emissions in this area as it may lead to reduced business for their ports without a corresponding increase in environmental integrity. If emissions from international shipping are not included in an international agreement's reduction commitments, harmonised action to reduce the GHG emissions from the maritime sector based on traffic into and out of EU ports could be secured by adopting legislation at the EU level (thereby largely avoiding the risk of leakage within the EU Member States while tackling the environmental issue). This justifies action to reduce GHG emissions from shipping on the basis of the principle of subsidiarity. There are also regulatory and market failures which justify the need for EU-level action; in particular, the cost of carbon emissions from this sector is not currently internalised and there are barriers preventing the widespread uptake of technological and operational abatement measures that are considered to be cost effective.
Support for the impact assessment of a proposal to address maritime transport greenhouse gas emissions
iii Ref: Ricardo-AEA/R/ED56985/Issue Number 5
Policy objectives for EU-level action
EU action against climate change has been translated into a GHG reduction target as adopted in the Climate and Energy Package and included in the headline target of the EU 2020 Strategy. The target set in the EU 2020 Strategy is to reduce GHG emissions by at least 20% by 2020 compared to 1990 levels, or by 30% in the context of a global deal1.
In the context of the EU 2020 Strategy and its flagship initiatives, the Commission's Transport White Paper introduced a specific target of a reduction in EU CO2 emissions from maritime bunker fuels by 40% (if feasible 50%) by 2050 compared to 2005 levels. Furthermore, due to the global nature of the maritime sector, international regulation is always preferred. Therefore, another important specific objective for the EU is to develop regional policies that can support the IMO process and that can take forward action to reduce maritime emissions within the EU and globally.
Legal feasibility of EU action to reduce GHG emissions from shipping
A fundamental consideration is whether any proposed options to regulate maritime CO2 emissions would be compatible with international law. The key pieces of international legislation that need to be taken into account are the United Nations Framework Convention on Climate Change (UNFCCC) and the UN Convention on the Law of the Sea (UNCLOS). With respect to the UNFCCC, whilst Article 2(2) expresses the preference to wor4k through the IMO to find a multilateral solution to the reduction of maritime GHG emissions, it does not prohibit actions under other international legal frameworks. Under UNCLOS, the provisions for port state jurisdiction give large prescriptive powers which the EU could apply to regulate GHG emissions from ships.
Design elements common to all proposed policy options
Four specific policy options were considered in this study, namely:
Emissions trading;
Taxes;
A compensation fund; or
Mandatory emission reductions.
However, there are several design elements common to all of the policy options. These elements relate to the methods used to monitor, report and verify emissions, and to the scope of the policy.
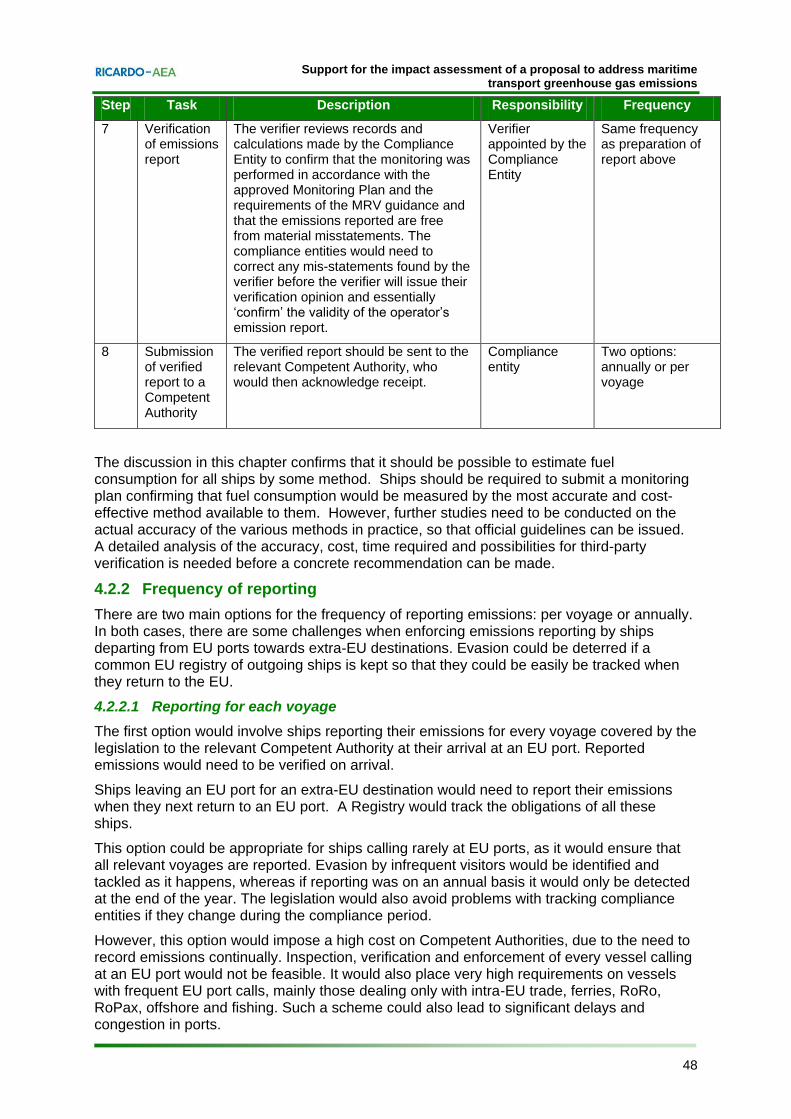
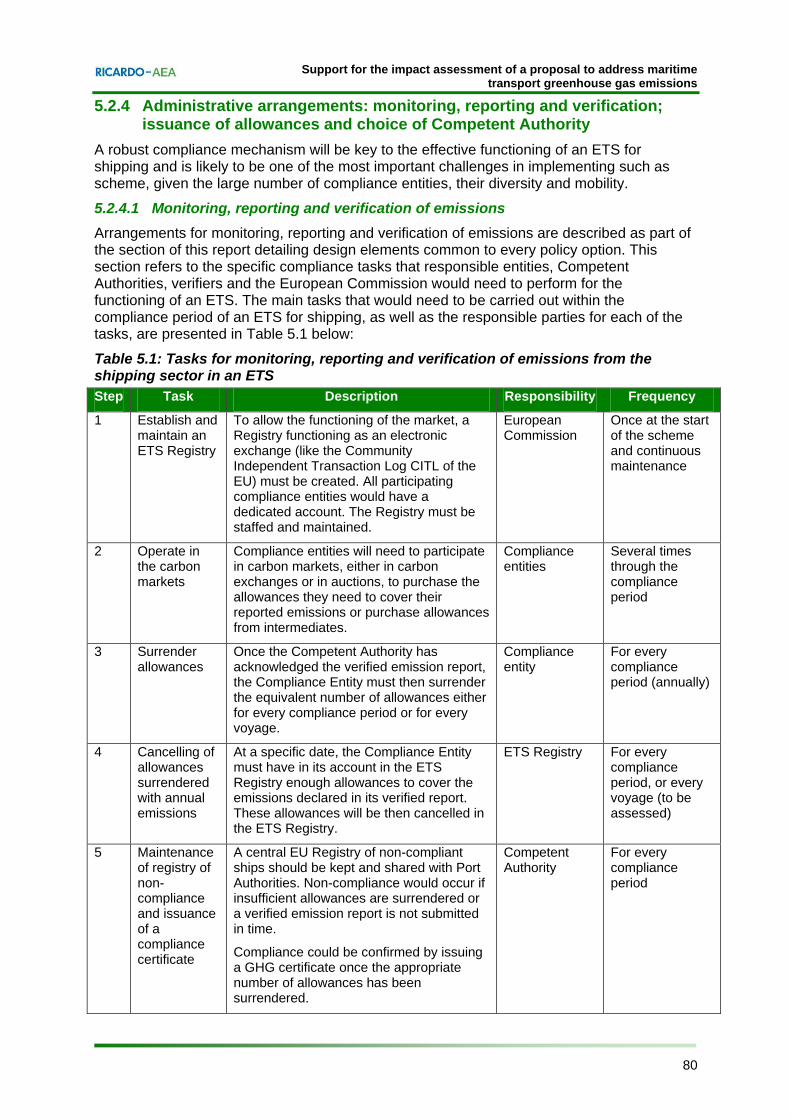
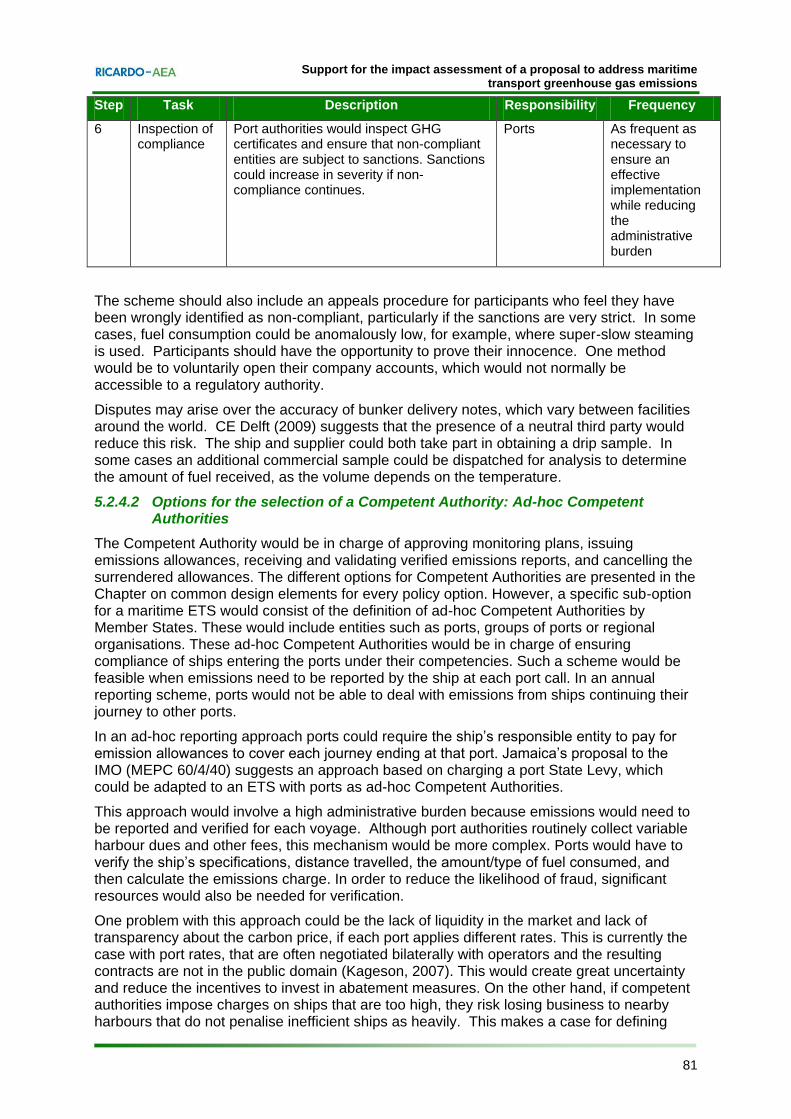
Monitoring, reporting and verification of emissions would need to be based on measurements of fuel consumption. Fuel consumption data can then be readily converted to provide estimates of CO2 emissions. The study has confirmed that it should be possible to estimate fuel consumption for all ships (e.g. using log books, fuel flow meters, bunker delivery notes, fuel inventories or movement data). Ships should be required to submit a monitoring plan confirming that fuel consumption would be measured by the most accurate and cost-effective method available to them. However, further studies need to be conducted on the actual accuracy of the various methods in practice, so that official guidelines can be issued. A detailed analysis of the accuracy, cost, time required and possibilities for third-party verification is needed before a concrete recommendation can be made. Due to the high administrative burden of reporting emissions for each voyage, it is recommended that annual
1 COM(2010)2020, 3.3.2010
Support for the impact assessment of a proposal to address maritime transport greenhouse gas emissions
iv Ref: Ricardo-AEA/R/ED56985/Issue Number 5
reporting is allowed for ships engaging in intra-EU trade and ships that call frequently at EU ports wherever possible. Ships calling infrequently at EU ports may need to report emissions for each voyage, although even in such cases, it should still be possible to allow annual reporting. Verification of fuel consumption is possible using a variety of methods; further studies are needed on the relative accuracy, costs and time implications of these options; therefore it is not possible to recommend a best choice at this stage.
With respect to the scope of emissions to be covered by potential EU policy action in this area, there are three elements that need to be considered:
Geographical scope, or the scope of journeys covered;
Scope of ship types covered;
Scope of ship sizes covered.
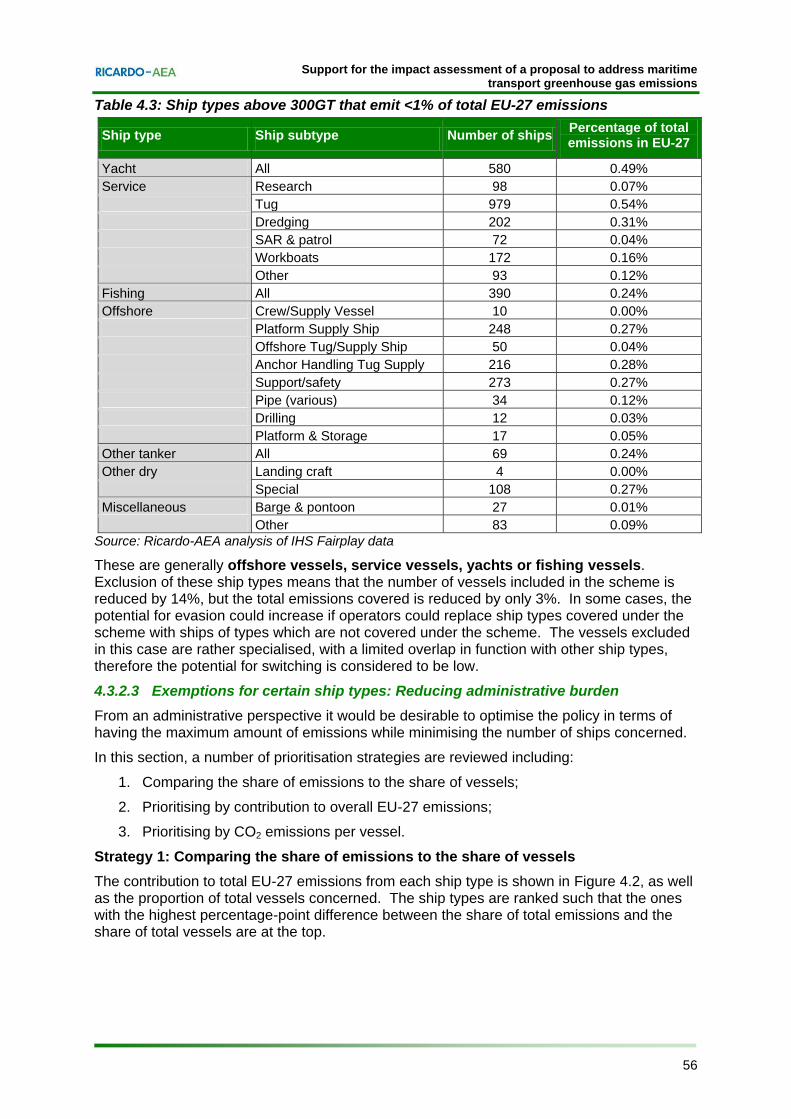
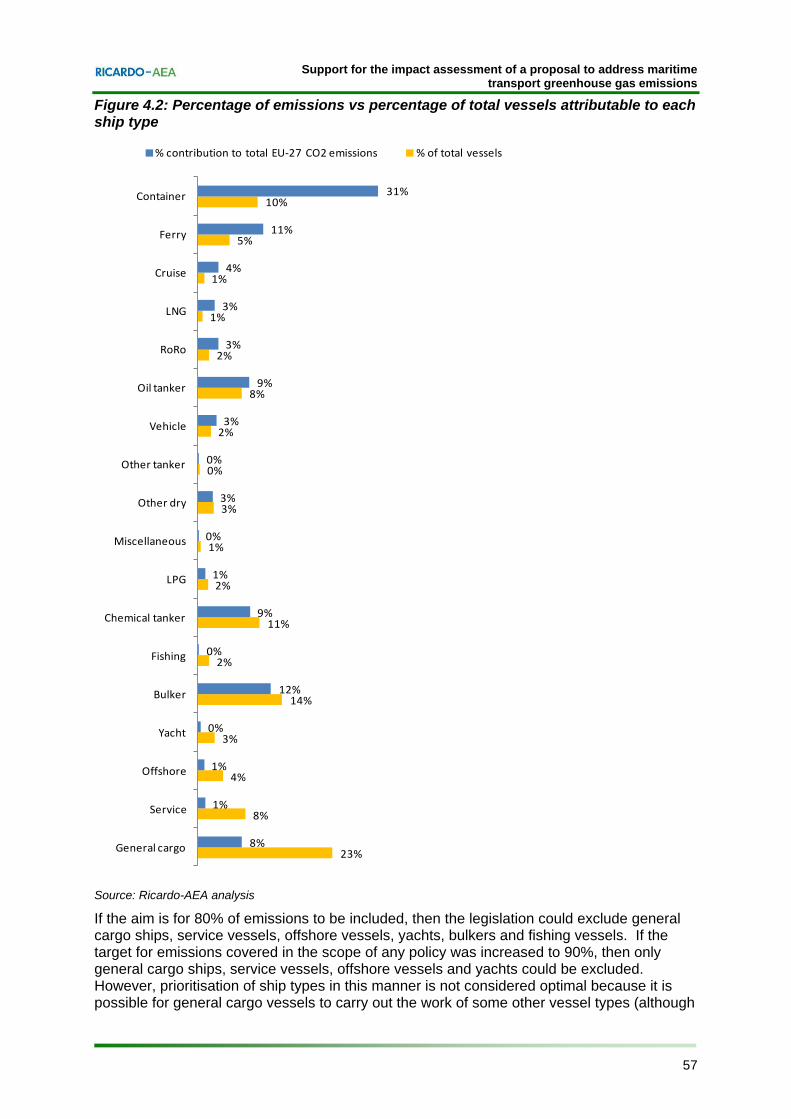
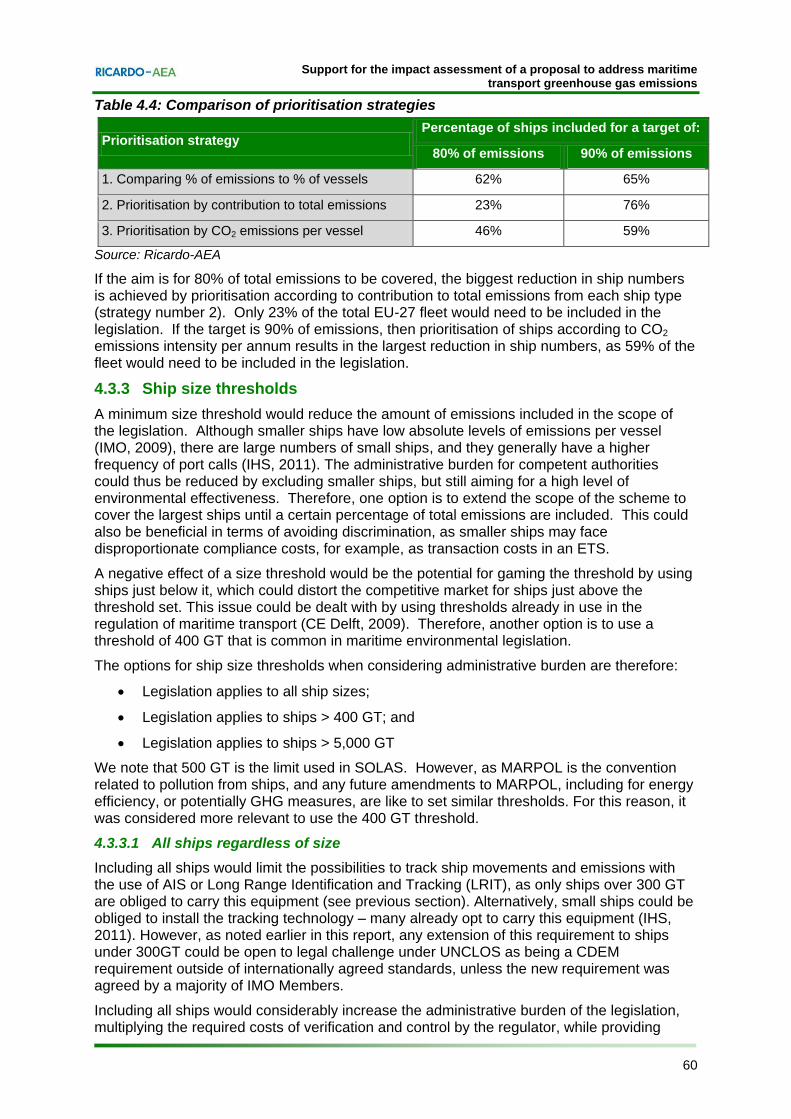
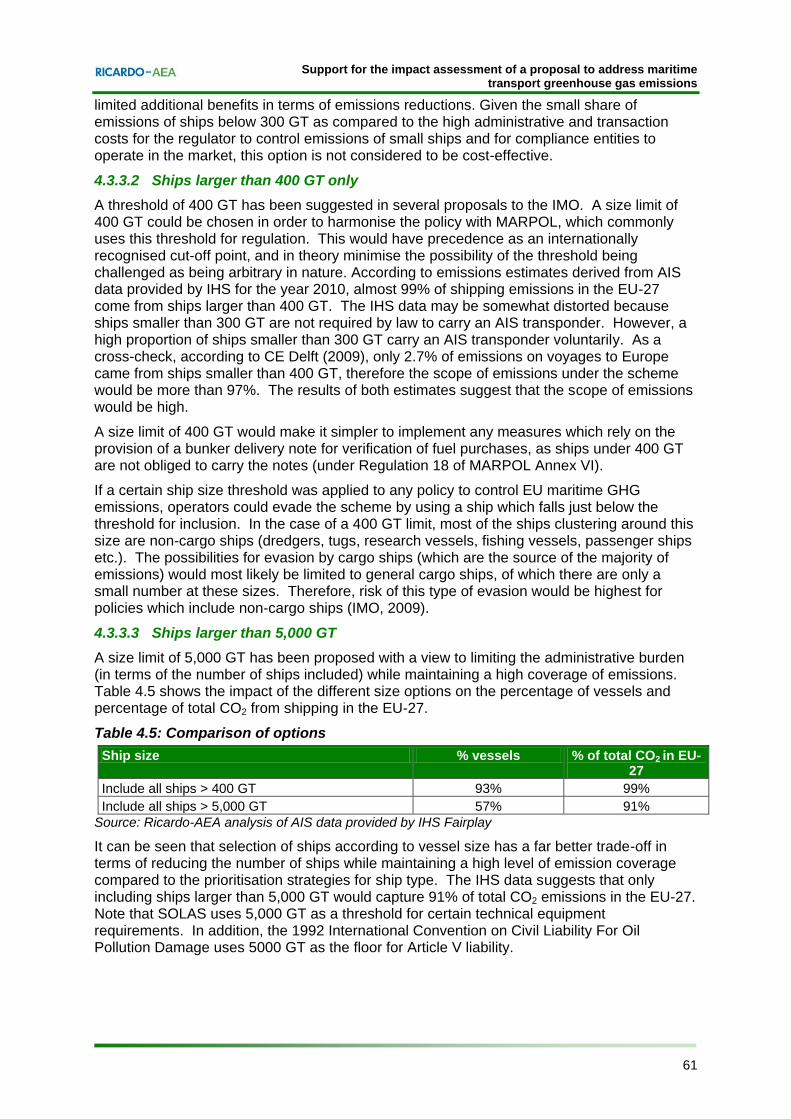
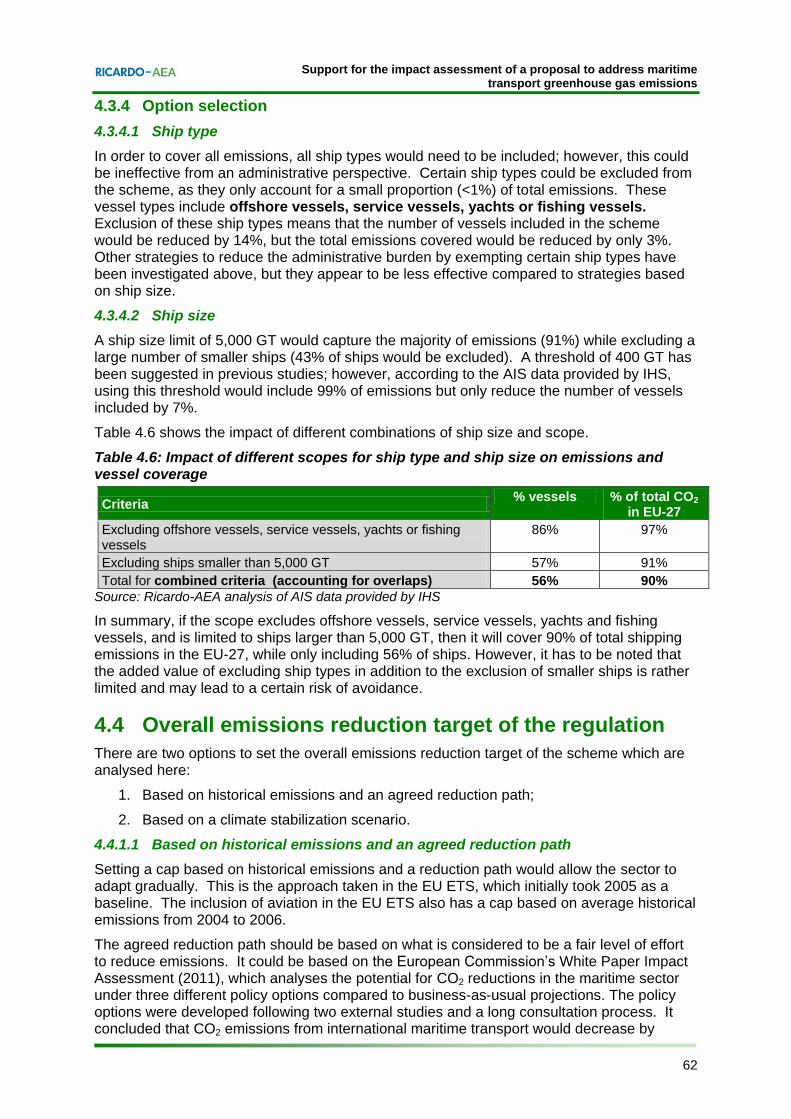
With respect to the scope of journeys covered, the preferred option would be to cover emissions to EU ports from the last port of call, and from EU ports to the next port of call (plus all intra-EU voyages). In order to cover all emissions, all ship types would need to be included; however, this could be ineffective from an administrative perspective. Certain ship types could be excluded from the scheme, as they only account for a small proportion (<1%) of total emissions (e.g. offshore vessels, service vessels, yachts or fishing vessels). Exclusion of these ship types means that the number of vessels included would be reduced by 14%, but the total emissions covered would be reduced by only 3%. A ship size limit of 5,000 GT would capture the majority of emissions (91%) while excluding a large number of smaller ships (43% of ships would be excluded). A threshold of 400 GT has been suggested in previous studies; however, according to the AIS data provided by IHS, using this threshold would include 99% of emissions but only reduce the number of vessels included by 7%. In summary, if the scope excludes offshore vessels, service vessels, yachts and fishing vessels, and is limited to ships larger than 5,000 GT, then it will cover 90% of total shipping emissions in the EU-27, while only including 56% of ships. However, it has to be noted that the added value of excluding ship types in addition to the exclusion of smaller ships is rather limited and may lead to a certain risk of avoidance.
Policy option 1: Emissions trading
A cap and trade Emissions Trading Scheme (ETS) operates by setting a cap on aggregate emissions from a defined group of emitters in a certain compliance period. The cap defines the overall limit on the emissions from all of the participants in the scheme and therefore certainty is provided over the amount of emission reductions that will be achieved. Each participant must monitor and report their emissions to the appropriate authority, and submit to the regulator a number of allowances equal to their emissions during the compliance period. Allowances can be auctioned and/ or allocated free of charge to the participants.
All technical and operational measures that reduce greenhouse gas emissions (by reducing fuel consumption or switching to low-carbon fuels) would be rewarded for both new and existing ships which suits the diverse nature of the industry. Emission reductions could be directly financially supported if allowances were auctioned and the revenue was hypothecated to promote low-carbon innovation in the shipping industry or climate change mitigation actions in other sectors.
Policy option 2: Tax
A tax would levy a charge on some defined basis (e.g. fuel supplied or CO2 emitted) which would apply to fuel suppliers or vessels (as appropriate) operating within the scope of the scheme.
Support for the impact assessment of a proposal to address maritime transport greenhouse gas emissions
v Ref: Ricardo-AEA/R/ED56985/Issue Number 5
The tax would increase the cost of voyages, either through taxing on the basis of fuel use or emissions. The cost incurred would be fixed per unit of fuel consumed or CO2 emitted, and therefore would scale with the activity of the emitter. The Compliance Entity would have the option to pay the additional tax charges without modifying their fuel consumption / emission levels, or to operate more efficiently in order to reduce the amount of tax they pay under the scheme. This would provide a price incentive to adopt fuel-efficient behaviours and technologies. The policy would reward all measures that reduce fuel consumption as well as switching to low-carbon fuels (provided the tax is wholly or partly based on CO2 intensity of fuel). The tax would apply both to new and existing ships. The fundamental property of a tax is that it provides cost certainty, not certainty of emission reductions. The tax would reduce emissions only to the extent that it encourages vessels to be operated in a more fuel efficient manner, so overall emissions may not decline, i.e. if vessels opt to pay the additional charges without modifying their operations.
Policy option 3a: Mandatory EU-level compensation fund
A maritime sector GHG Compensation Fund would entail setting an emissions reduction target for international shipping and offsetting emissions above the target largely through the purchase of approved emission reduction offsets. Such a scheme could be funded either by a levy on all EU maritime sector fuel purchases or via contributions from ship owners/operators based on the emissions from their ships on voyages to and from Europe. The design of this policy option is based on the proposal for an “International GHG Fund” submitted to the IMO (MEPC 59/4/5), which would raise funds through a levy on bunker fuel. The Fund would be managed and administered centrally by (for example) an EU-level Competent Authority. Responsible entities would need to become registered members of the Fund. As a condition of membership, vessel owners/operators would need to submit a plan that elaborates on how they propose to reduce their emissions over a defined time period (e.g. five years). Fund members would pay into the Fund monetary amounts in line with their emissions performance on all journeys to and from Europe. The contributions collected in the Fund would be used largely to finance emission reduction measures in the maritime sector and to purchase recognised offset credits from the international carbon market to count towards the reduction target
Policy option 3b: Industry managed compensation fund
This policy option is a variation on the design of the EU-level mandatory Compensation Fund, but because of significant differences in the way in which such a policy would operate, it has been treated as a separate policy option. The design of this policy option draws on the design of the voluntary, industry-led Norwegian NOx fund. A fund for reducing EU maritime sector CO2 emissions would need to be set up as a legal entity responsible for ensuring that emissions reductions are achieved in line with any reduction targets in force; this would mean that individual vessels would not be liable for ensuring reductions in emissions, but the industry as a whole, via the legal entity of the Fund, would have responsibility in this area. Two different sub-options were developed for the proposed industry-managed Compensation Fund:
Contributions-based compensation fund. Fund members would pay monetary amounts into the Fund in line with their emissions performance on all journeys to and from Europe, and the membership cost per tonne of CO2 would need to be set in advance. Revenues would be re-invested by the Fund. The Fund would not be obliged to comply with emissions reduction targets. Targets could be indicative, but not compulsory.
Target-based compensation fund. This would work in the following way: an emission reduction target for the sector would be estimated by the European Commission. Vessel owners/operators would be required to register with the
Support for the impact assessment of a proposal to address maritime transport greenhouse gas emissions
vi Ref: Ricardo-AEA/R/ED56985/Issue Number 5
Compensation Fund. Vessels that are not registered members of the Fund would be required to pay a penalty each time they arrive at and/or depart from an EU port. Penalties would be higher than the cost of Fund membership. The Fund as a whole would have to comply with the emission reduction target set at the EU level.
Policy option 4: mandatory emissions reductions
The option involves specifying a mandatory emission reduction (in either absolute or relative terms) per ship, which would apply both to new and existing vessels. There are two sub-options under this measure:
Sub-option 4a – Mandatory emission reduction per ship. This option is a command-and-control measure. Ships that meet the emission requirements would be allowed to operate in Europe without paying recurring activity charges under the scheme. The means to achieve emission reductions could be either technical or operational, or a combination of the two. Early action could be rewarded under the scheme.
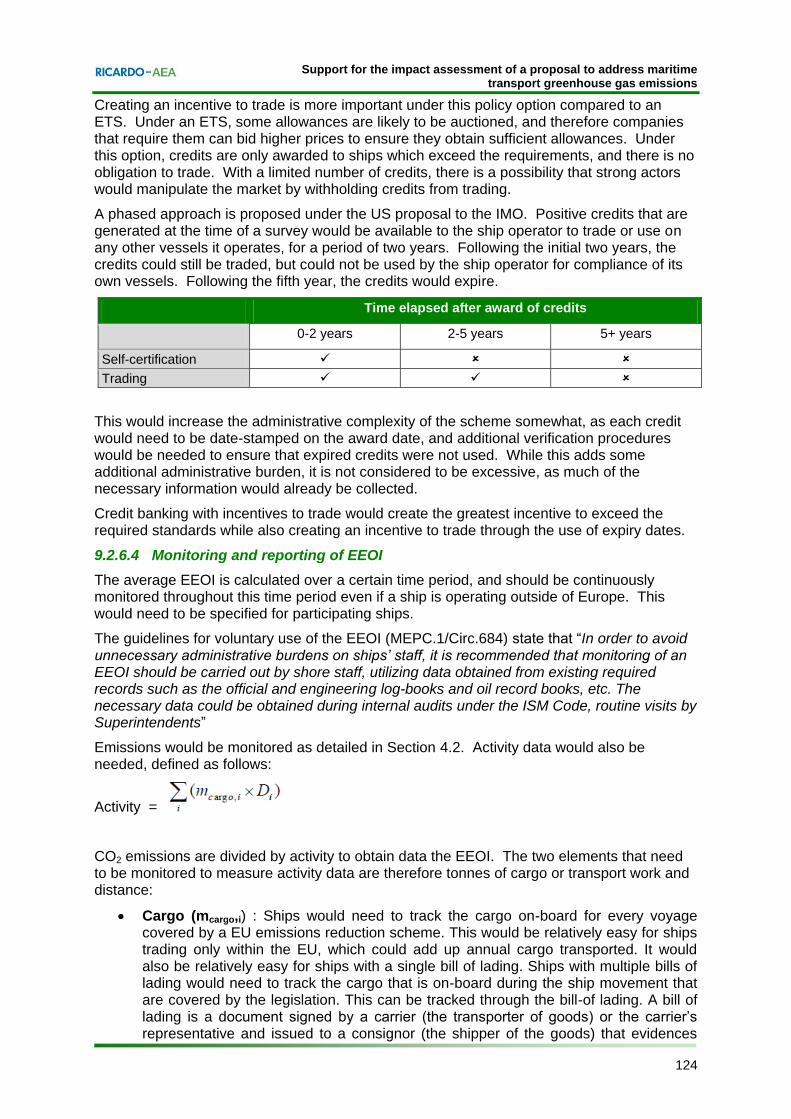
Sub-option 4b - Mandatory emission reduction per ship with credit trading. This sub-option is equivalent to a “baseline and credit” trading scheme, where emissions reductions above the requirements are rewarded with tradable credits. Ships unable to meet the required emission reductions would be able to buy credits from efficient ships. Otherwise, they would have to face penalties for non-compliance. Hence, the revenue to ship owners from selling credits would encourage them to install additional abatement measures if they could do so cost-effectively, instead of seeking to just meet the standards. In terms of economic efficiency, the mandatory emission reduction per ship with incentives would be superior to the measure without incentives, provided the administrative costs related to the trading market do not cancel out the cost-efficiency gains. This is because the flexible trading mechanism should allow emission reductions to be made where they are most cost-effective, while allowing credits to be traded so that they cover the emissions that would be most expensive to reduce.
Analysis of the impacts of each policy option
The study team developed a model to assess the impacts of policy instruments for reducing CO2 emissions from EU international shipping. The implemented solution is a TIMES energy system model, which was built specifically for this project. The TIMES model characterises the available routes within/into/out of Europe and available technological and logistical choices out to 2050. The outputs from the TIMES model were used to assess some of the environmental, economic and social impacts of each policy option; this was supplemented where required with off-model analysis.
Environmental impacts
Changes in emissions of CO2 A policy to reduce CO2 emissions from the maritime sector directly aims to reduce the environmental impact of shipping in terms of its impact on global warming. A CO2 reduction policy could result in lower fuel consumption or switching to cleaner fuels, thereby also resulting in reductions in air quality pollutants, changes in the use of energy and changes in resource consumption.
The main GHG from shipping is CO2. According to IMO (2009), CO2 accounts for over 98% of total shipping GHG emissions (in terms of CO2-equivalent). Therefore, only the impacts of
Support for the impact assessment of a proposal to address maritime transport greenhouse gas emissions
vii Ref: Ricardo-AEA/R/ED56985/Issue Number 5
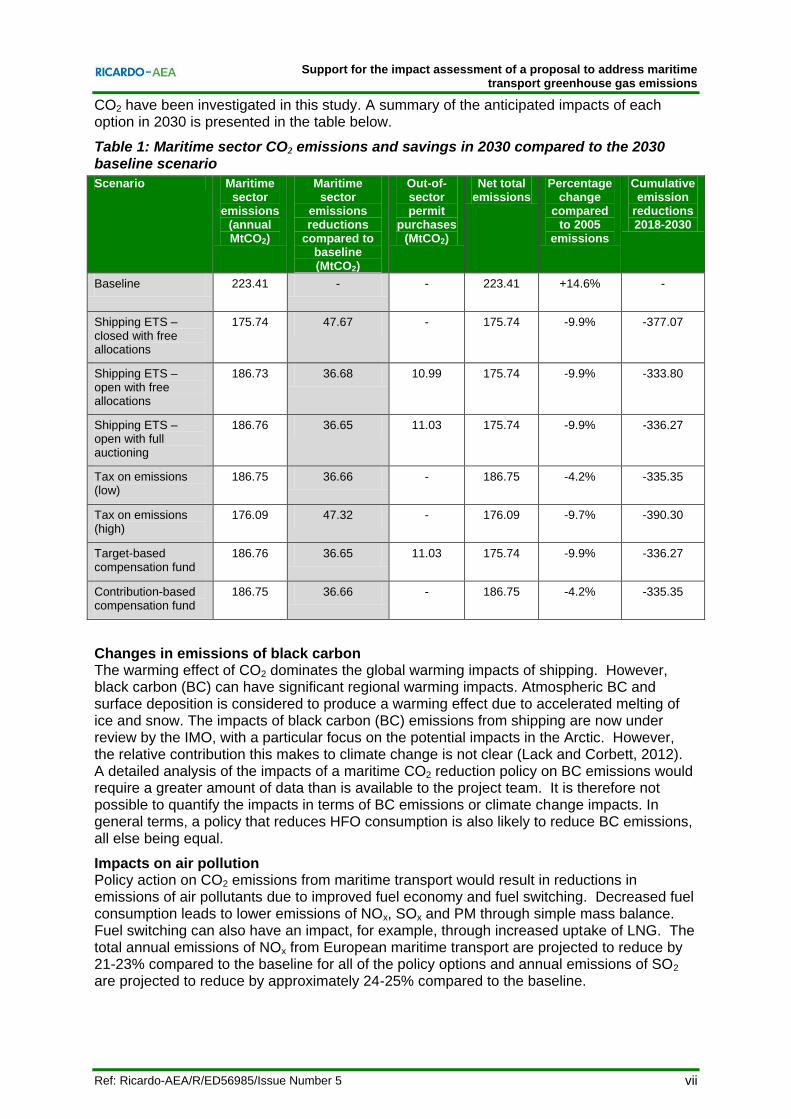
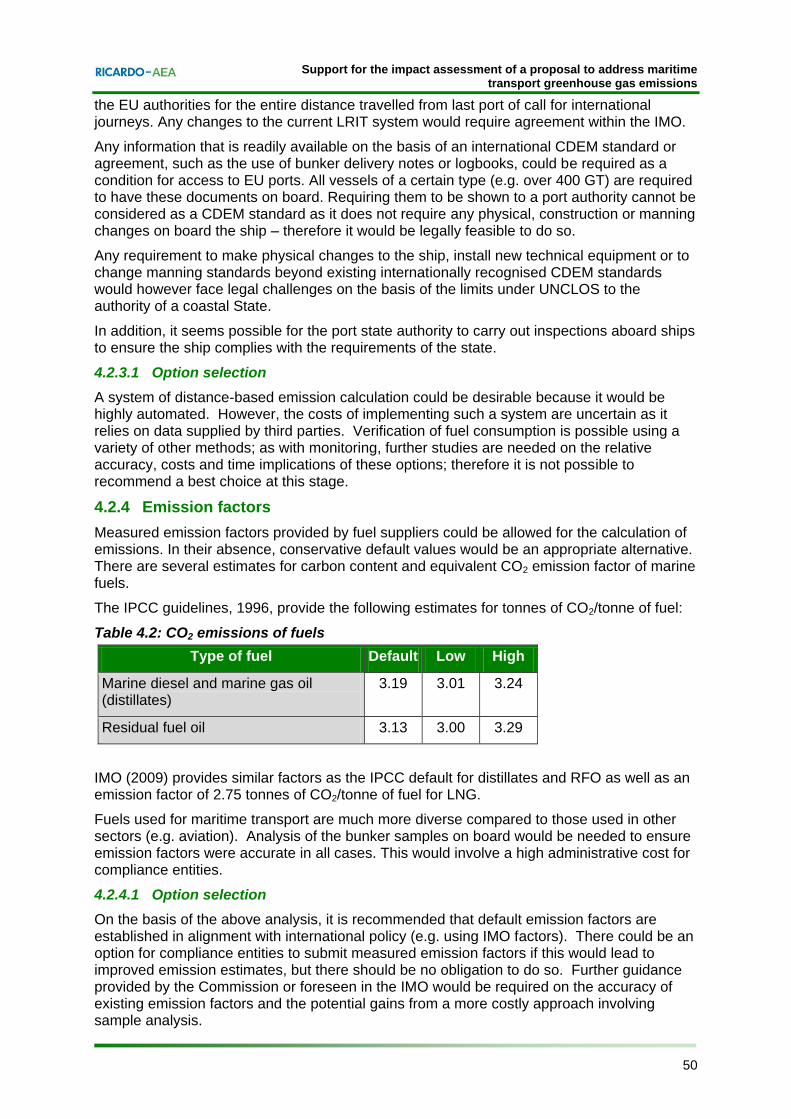
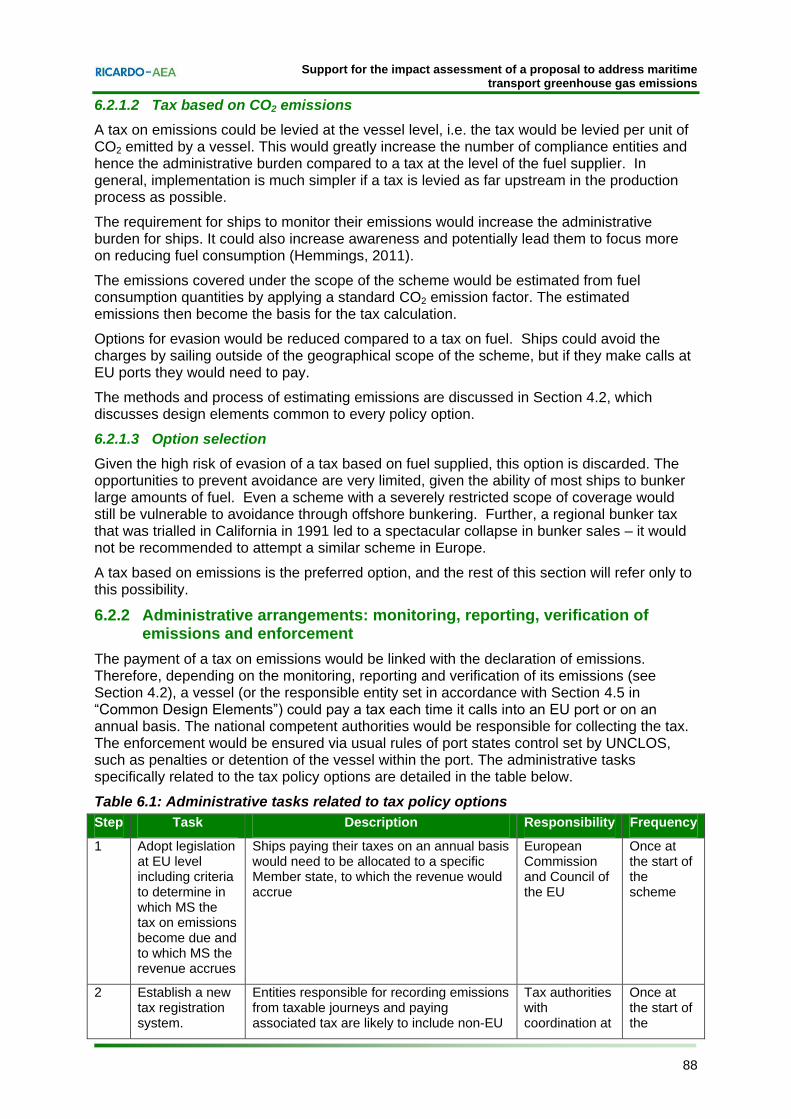
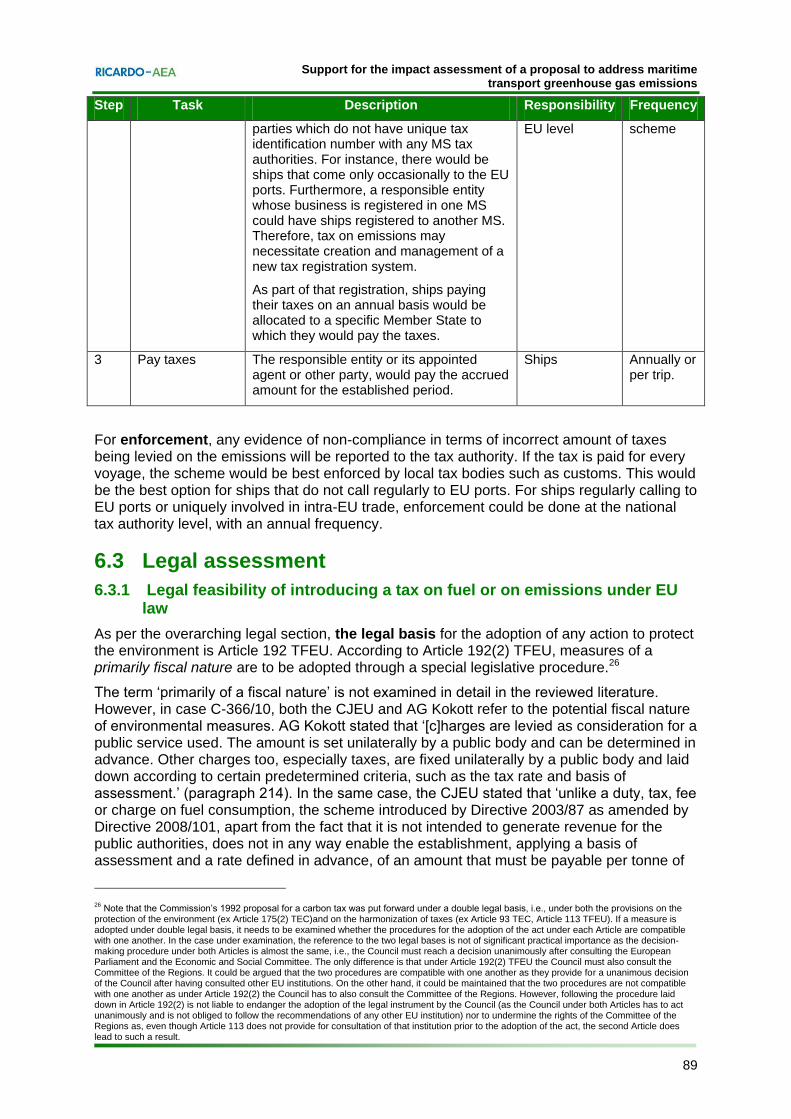
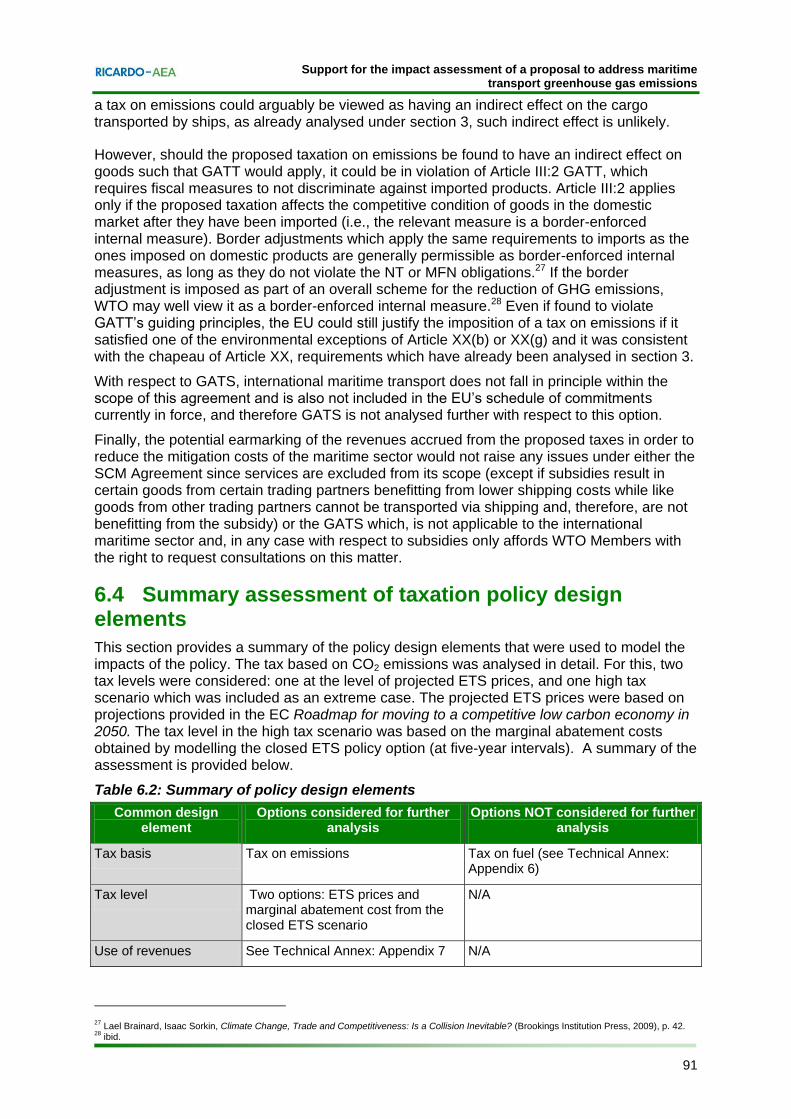
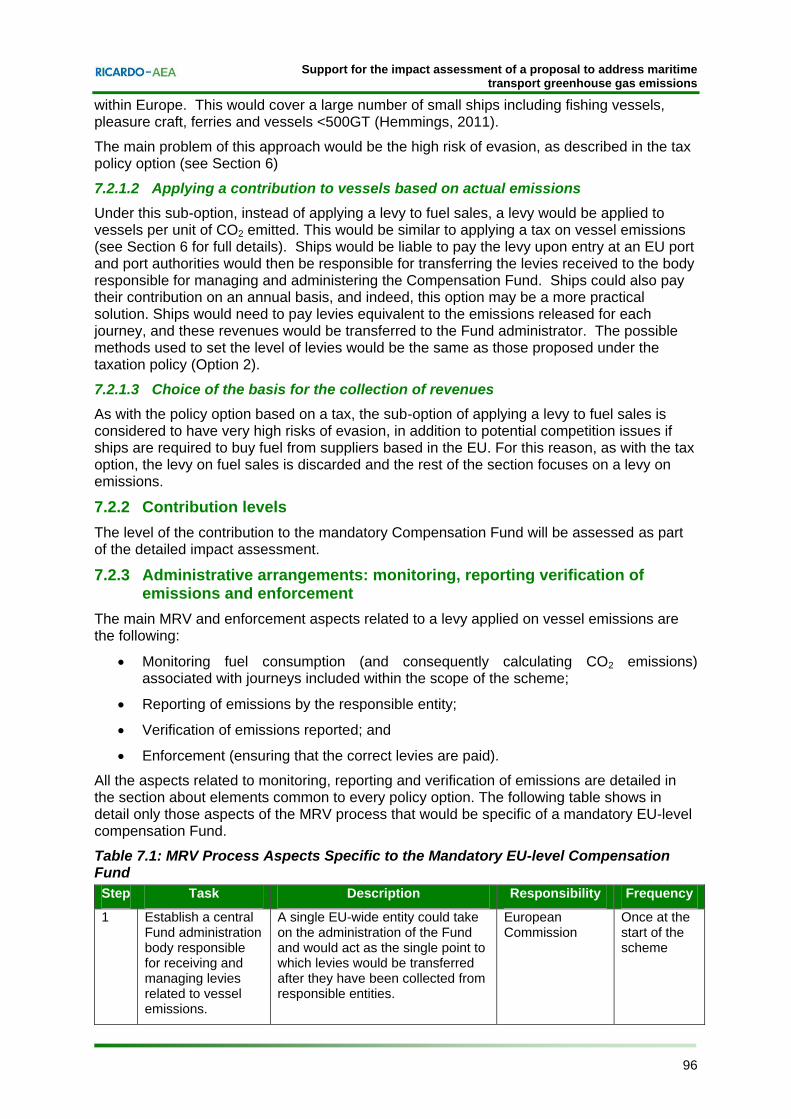
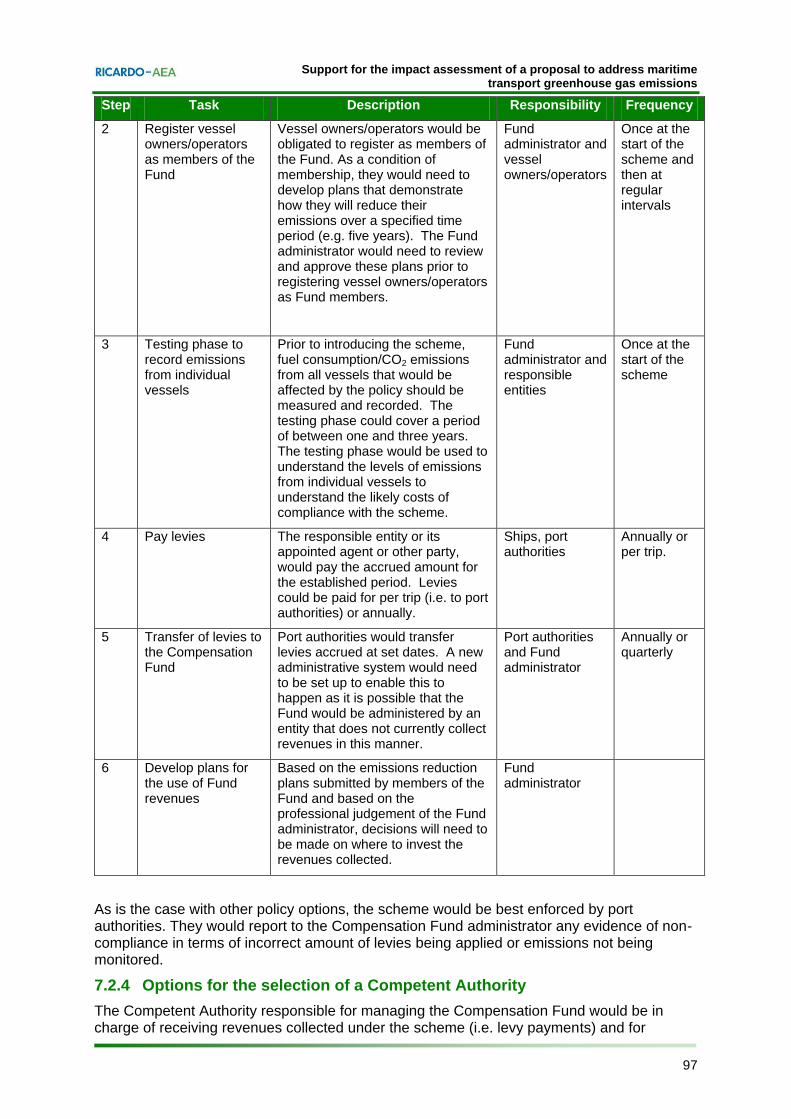
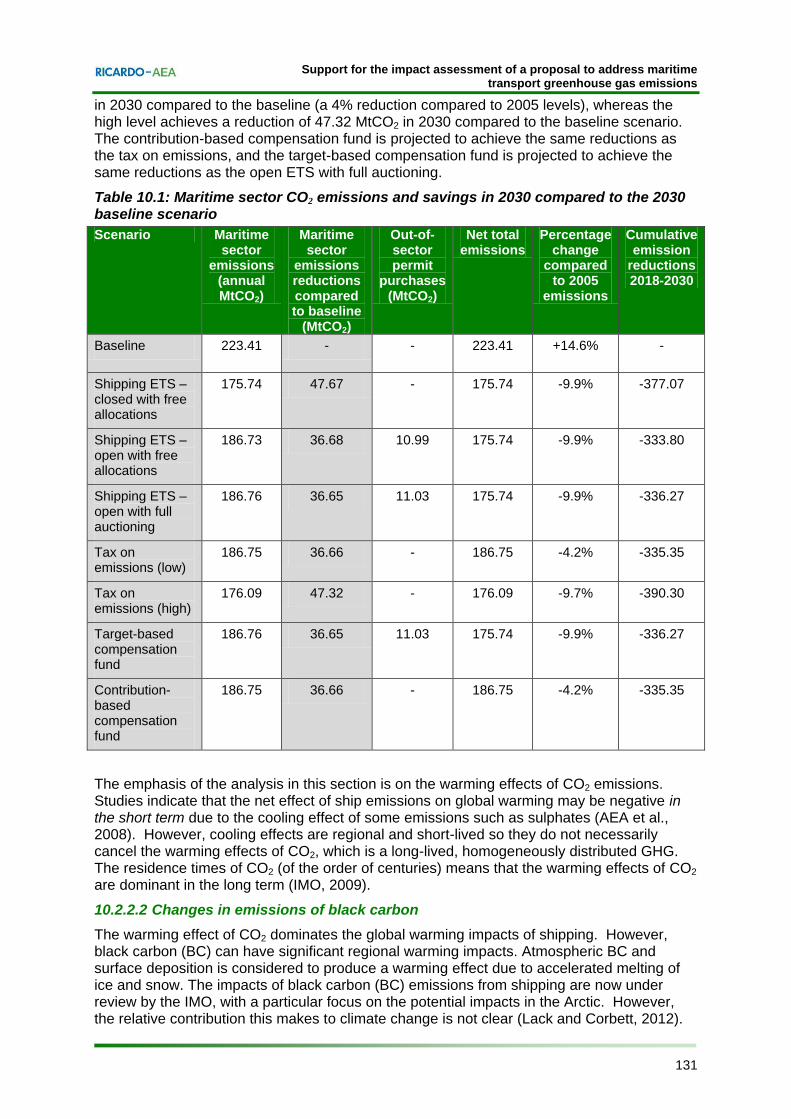
CO2 have been investigated in this study. A summary of the anticipated impacts of each option in 2030 is presented in the table below.
Table 1: Maritime sector CO2 emissions and savings in 2030 compared to the 2030 baseline scenario
Scenario Maritime sector
emissions (annual MtCO2)
Maritime sector
emissions reductions
compared to baseline (MtCO2)
Out-of-sector permit
purchases (MtCO2)
Net total emissions
Percentage change
compared to 2005
emissions
Cumulative emission
reductions 2018-2030
Baseline 223.41 - - 223.41 +14.6% -
Shipping ETS – closed with free allocations
175.74 47.67 - 175.74 -9.9% -377.07
Shipping ETS – open with free allocations
186.73 36.68 10.99 175.74 -9.9% -333.80
Shipping ETS – open with full auctioning
186.76 36.65 11.03 175.74 -9.9% -336.27
Tax on emissions (low)
186.75 36.66 - 186.75 -4.2% -335.35
Tax on emissions (high)
176.09 47.32 - 176.09 -9.7% -390.30
Target-based compensation fund
186.76 36.65 11.03 175.74 -9.9% -336.27
Contribution-based compensation fund
186.75 36.66 - 186.75 -4.2% -335.35
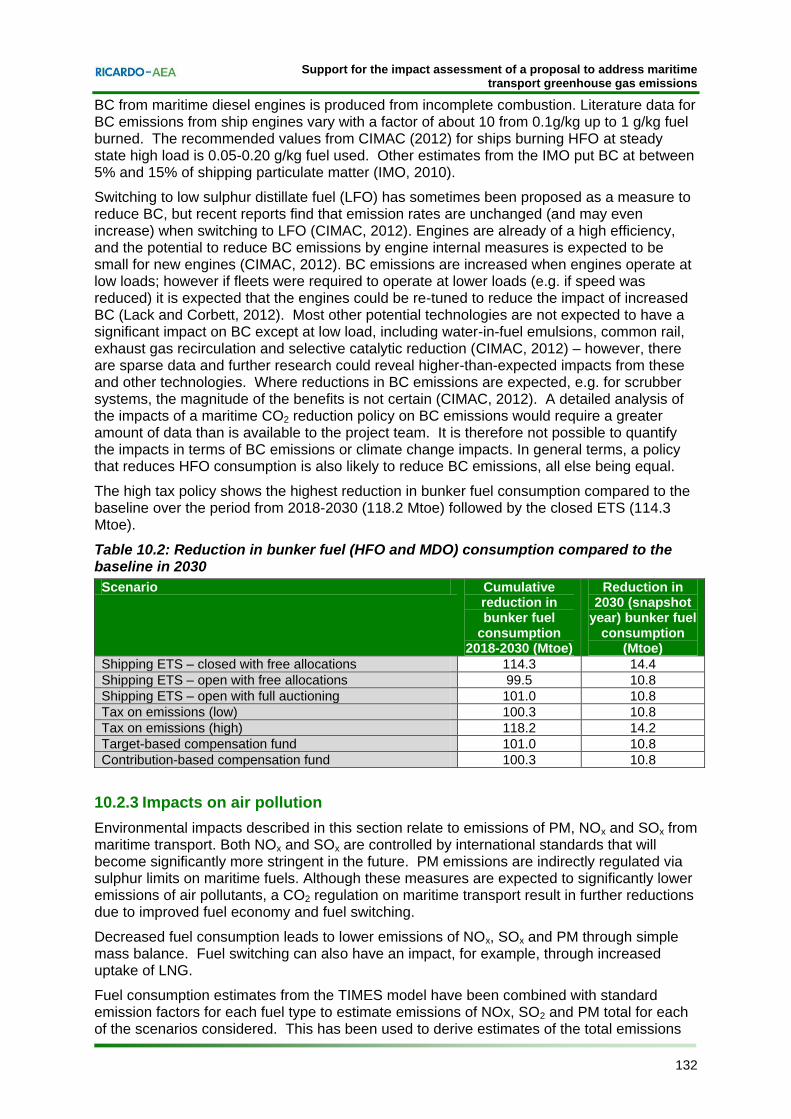
Changes in emissions of black carbon The warming effect of CO2 dominates the global warming impacts of shipping. However, black carbon (BC) can have significant regional warming impacts. Atmospheric BC and surface deposition is considered to produce a warming effect due to accelerated melting of ice and snow. The impacts of black carbon (BC) emissions from shipping are now under review by the IMO, with a particular focus on the potential impacts in the Arctic. However, the relative contribution this makes to climate change is not clear (Lack and Corbett, 2012). A detailed analysis of the impacts of a maritime CO2 reduction policy on BC emissions would require a greater amount of data than is available to the project team. It is therefore not possible to quantify the impacts in terms of BC emissions or climate change impacts. In general terms, a policy that reduces HFO consumption is also likely to reduce BC emissions, all else being equal.
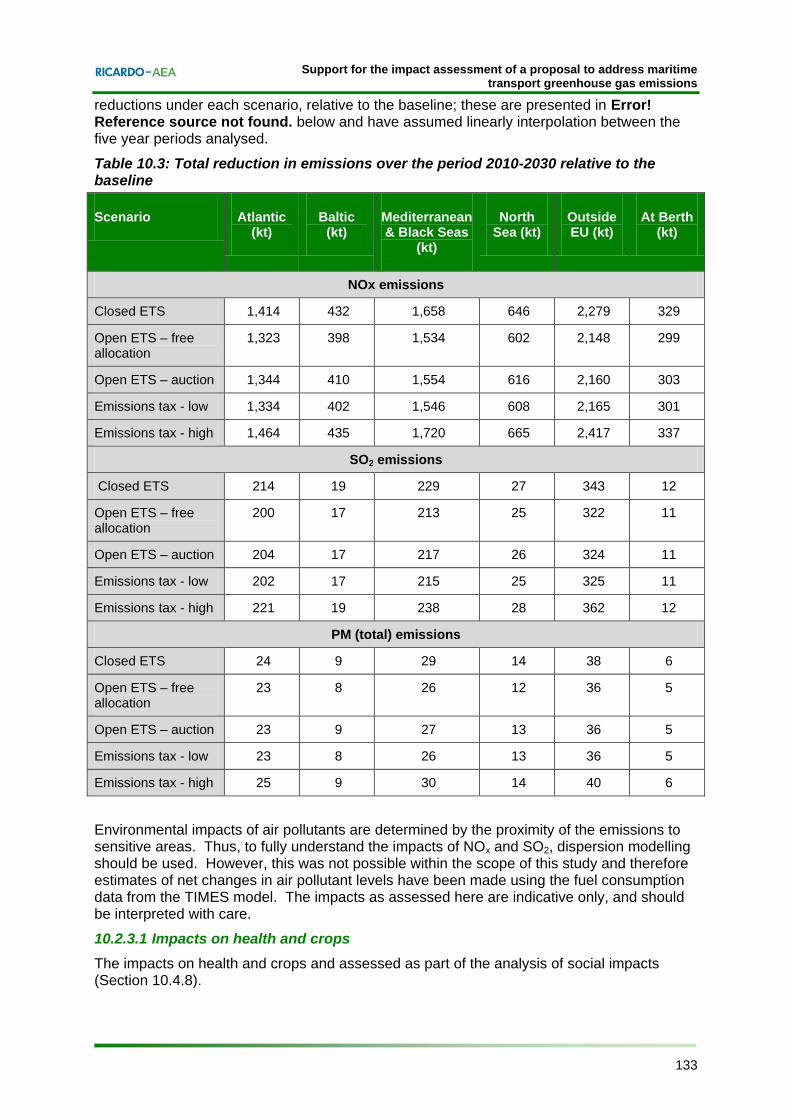
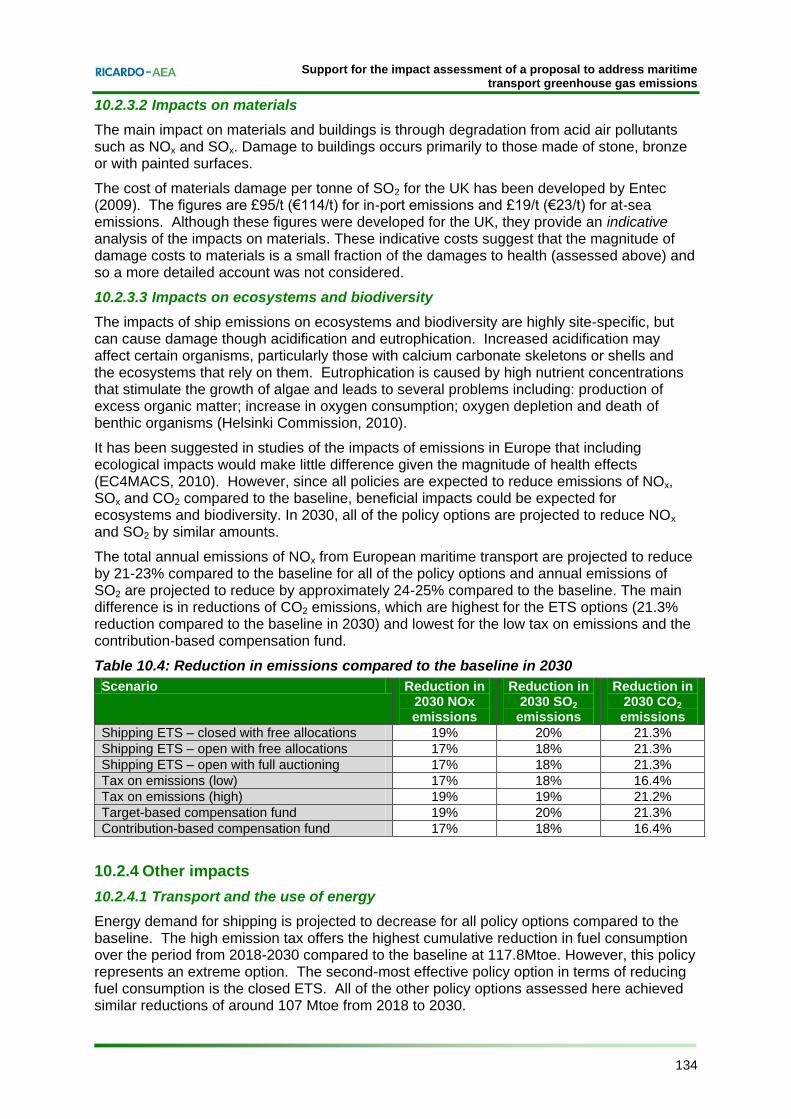
Impacts on air pollution Policy action on CO2 emissions from maritime transport would result in reductions in emissions of air pollutants due to improved fuel economy and fuel switching. Decreased fuel consumption leads to lower emissions of NOx, SOx and PM through simple mass balance. Fuel switching can also have an impact, for example, through increased uptake of LNG. The total annual emissions of NOx from European maritime transport are projected to reduce by 21-23% compared to the baseline for all of the policy options and annual emissions of SO2 are projected to reduce by approximately 24-25% compared to the baseline.
Support for the impact assessment of a proposal to address maritime transport greenhouse gas emissions
viii Ref: Ricardo-AEA/R/ED56985/Issue Number 5
Impacts on ecosystems and biodiversity The impacts of ship emissions on ecosystems and biodiversity are highly site-specific, but can cause damage though acidification and eutrophication. Since all policies are expected to reduce emissions of NOx, SOx and CO2 compared to the baseline, beneficial impacts could be expected for ecosystems and biodiversity. In 2030, all of the policy options are projected to reduce NOx and SO2 by similar amounts.
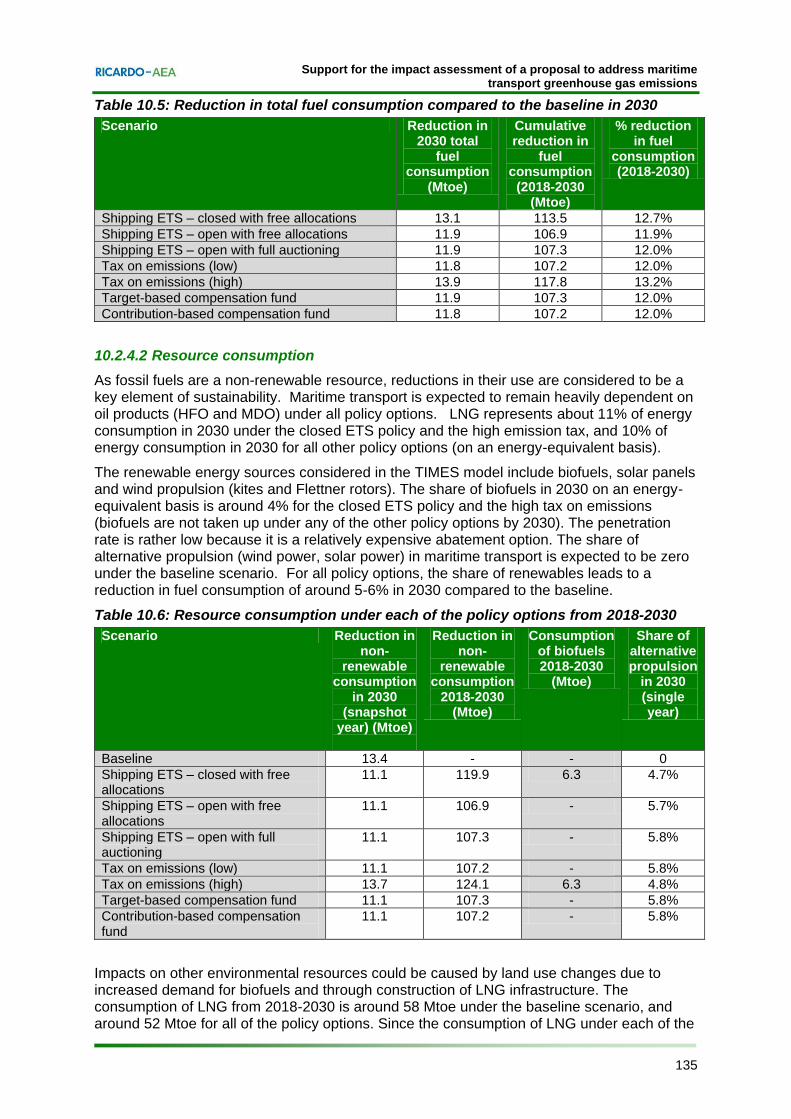
Transport and the use of energy Energy demand for shipping is projected to decrease for all policy options compared to the baseline. The high emission tax offers the highest cumulative reduction in fuel consumption over the period from 2018-2030 compared to the baseline at 117.8Mtoe. However, this policy represents an extreme option. The second-most effective policy option in terms of reducing fuel consumption is the closed ETS. All of the other policy options assessed would achieve similar reductions of around 107 Mtoe from 2018 to 2030.
Resource consumption As fossil fuels are a non-renewable resource, reductions in their use are considered to be a key element of sustainability. Maritime transport is expected to remain heavily dependent on oil products (HFO and MDO) under all policy options. For all policy options, the deployment of renewable energy technologies in the shipping sector (biofuels, wind propulsion and solar energy) leads to a reduction in fuel consumption of around 5-6% in 2030 compared to the baseline.
Waste production While the effects of waste production have not been quantified, it is noted that policies that lead to increased scrappage of ships could have negative environmental impacts if ships are not scrapped in an environmentally sound manner.
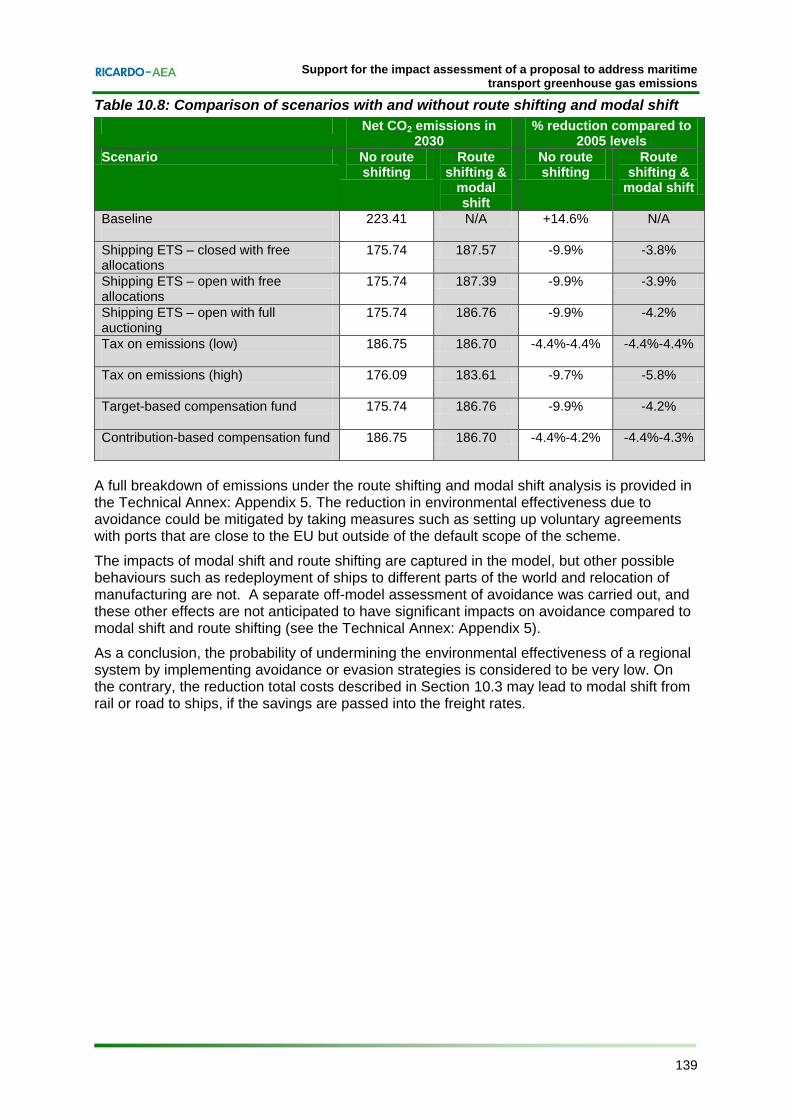
Probability of undermining the environmental effectiveness of a regional system by implementing avoidance or evasion strategies The maritime sector is global and therefore, it may be possible to undermine the environmental effectiveness of a regional system by implementing avoidance or evasion strategies.
With respect to the potential for avoiding the scheme, several options are available to reduce the proportion of a given voyage that would be subject to policy action:
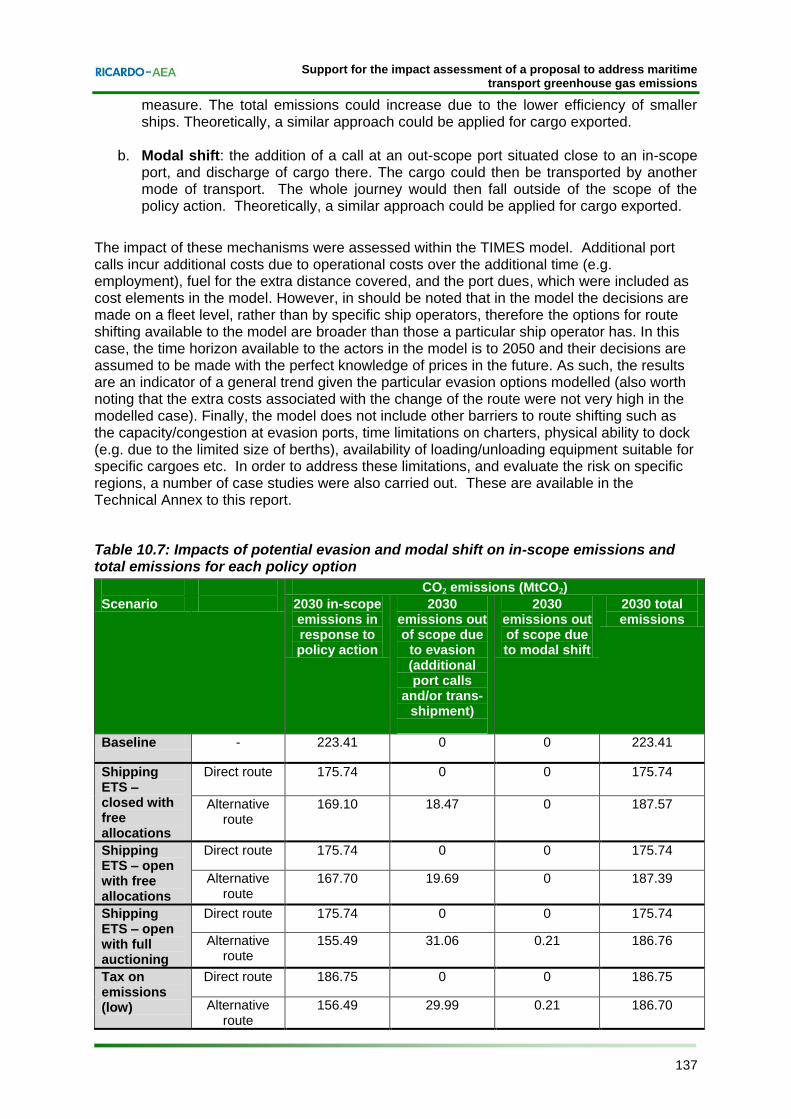
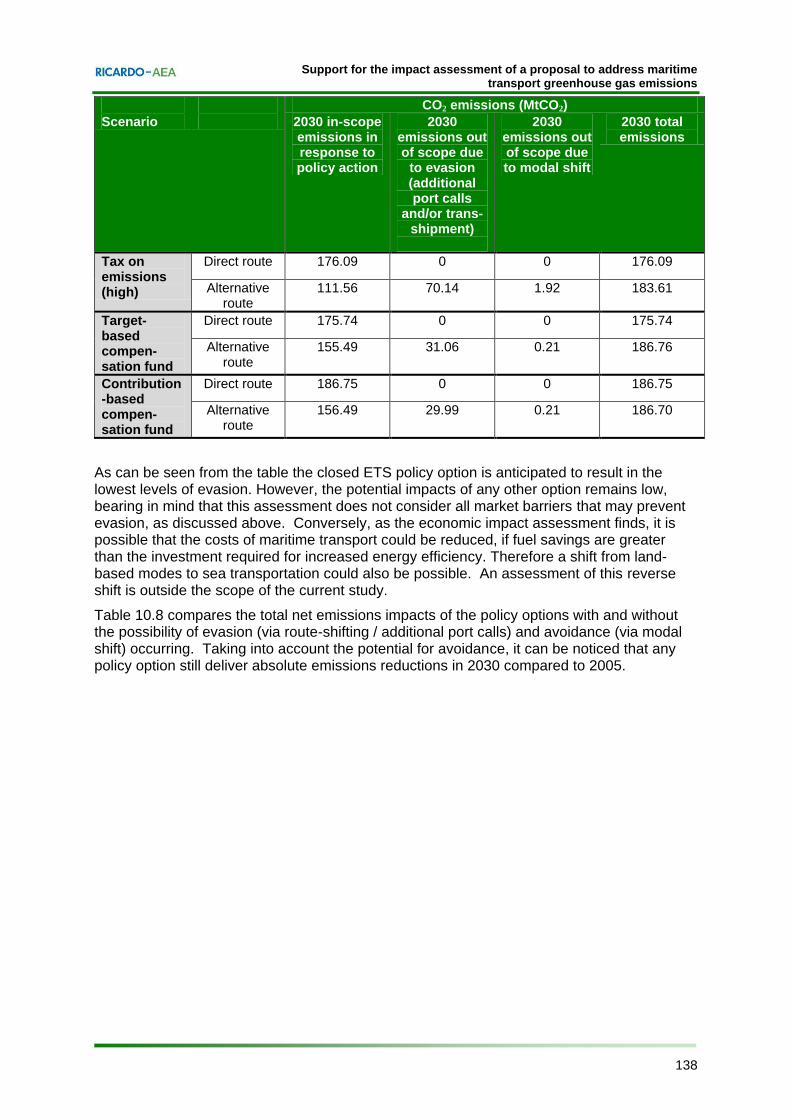
a. Addition of port calls or ship-to-ship transfers: the addition of a port call to the route or a ship-to-ship transfer for the sole purpose of minimizing the distance from the last port of call before arriving at an in-scope port or minimizing the distance to the next port of call after leaving an in-scope port and therefore reducing the emissions covered by an EU measure. Alternatively, the cargo could then be transported by smaller vessels to EU ports. This would reduce the emissions covered by an EU measure. The total emissions could increase due to the lower efficiency of smaller ships. Theoretically, a similar approach could be applied for cargo exported.
b. Modal shift: avoidance of a regional system via the addition of a call at an out-scope port situated close to an in-scope port, and discharge of cargo there. The cargo could then be transported by another mode of transport. The whole journey would then fall outside of the scope of the policy action. Theoretically, a similar approach could be applied for cargo exported.
The analysis found that the risk of evasion through the addition of port calls of ship-to-ship transfers is low, and that is before even considering that there are market barriers that may prevent evasion. Conversely, it is possible that the costs of maritime transport could be reduced through the introduction of policy action, if fuel savings are greater than the investment required for increased energy efficiency. Therefore a shift from land-based
Support for the impact assessment of a proposal to address maritime transport greenhouse gas emissions
ix Ref: Ricardo-AEA/R/ED56985/Issue Number 5
modes to sea transportation could also be possible. An assessment of this reverse shift was outside the scope of this study. Overall, the probability of undermining the environmental effectiveness of a regional system by implementing evasion or avoidance strategies is considered to be very low.
Economic impacts
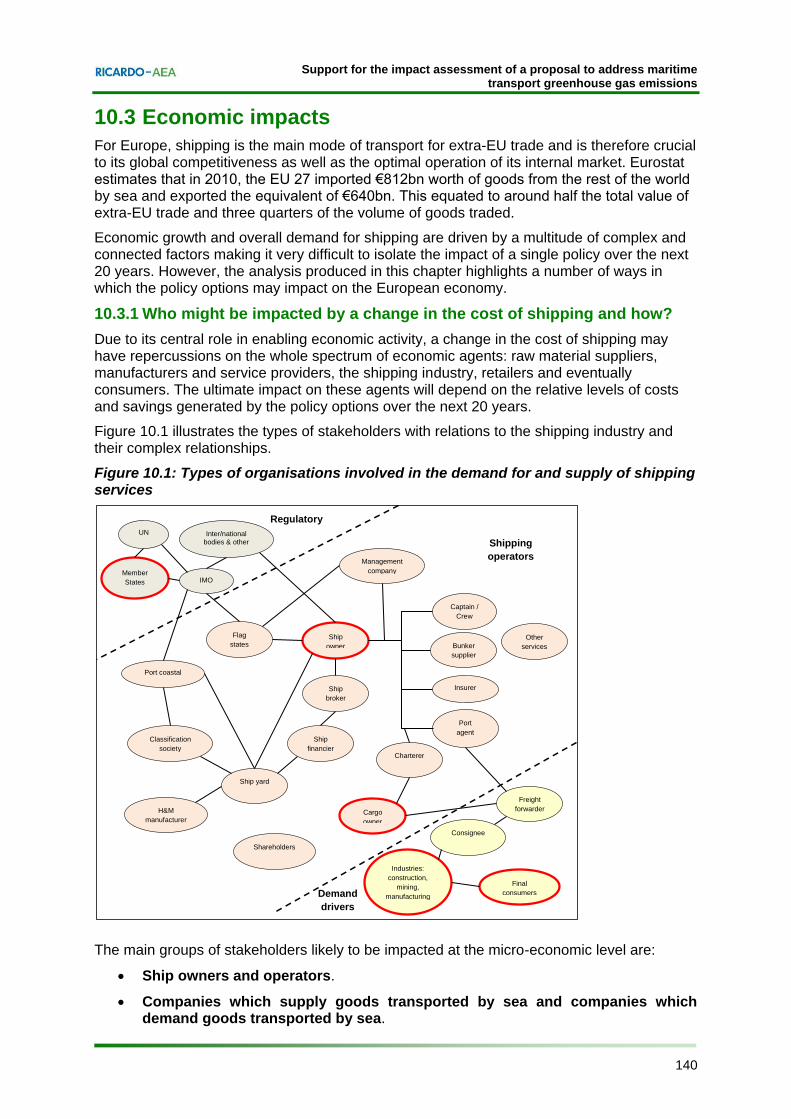
Due to its central role in enabling economic activity, a change in the cost of shipping may have repercussions on the whole spectrum of economic agents: raw material suppliers, manufacturers and service providers, the shipping industry, retailers and eventually consumers. The ultimate impact on these agents will depend on the relative levels of costs and savings generated by the policy options over the next 20 years. The direct change in costs resulting from the selected policy will in turn impact on freight rates. The scale of this impact will depend on the ability to pass these additional costs or savings through the maritime supply chain by changing freight rates. Final consumers will only bear the portion of any cost variation that is passed-through by manufacturers and retailers.
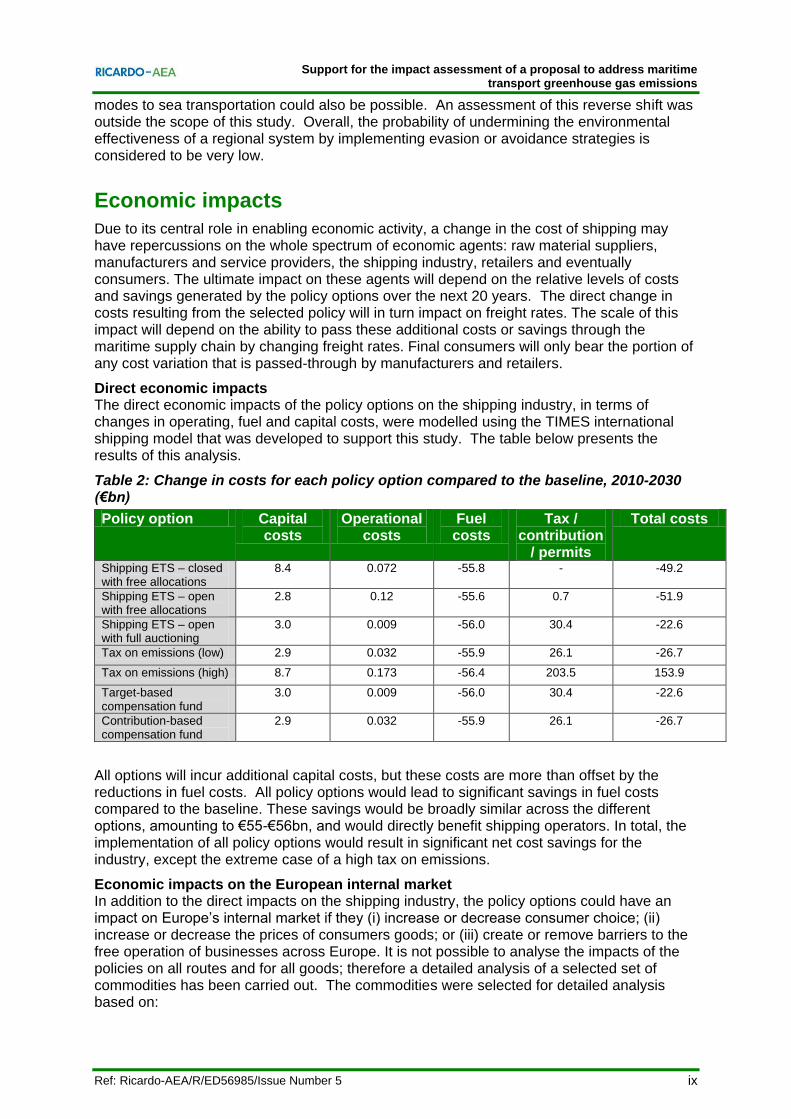
Direct economic impacts The direct economic impacts of the policy options on the shipping industry, in terms of changes in operating, fuel and capital costs, were modelled using the TIMES international shipping model that was developed to support this study. The table below presents the results of this analysis.
Table 2: Change in costs for each policy option compared to the baseline, 2010-2030 (€bn)
Policy option Capital costs
Operational costs
Fuel costs
Tax / contribution
/ permits
Total costs
Shipping ETS – closed with free allocations
8.4 0.072 -55.8 - -49.2
Shipping ETS – open with free allocations
2.8 0.12 -55.6 0.7 -51.9
Shipping ETS – open with full auctioning
3.0 0.009 -56.0 30.4 -22.6
Tax on emissions (low) 2.9 0.032 -55.9 26.1 -26.7
Tax on emissions (high) 8.7 0.173 -56.4 203.5 153.9
Target-based compensation fund
3.0 0.009 -56.0 30.4 -22.6
Contribution-based compensation fund
2.9 0.032 -55.9 26.1 -26.7
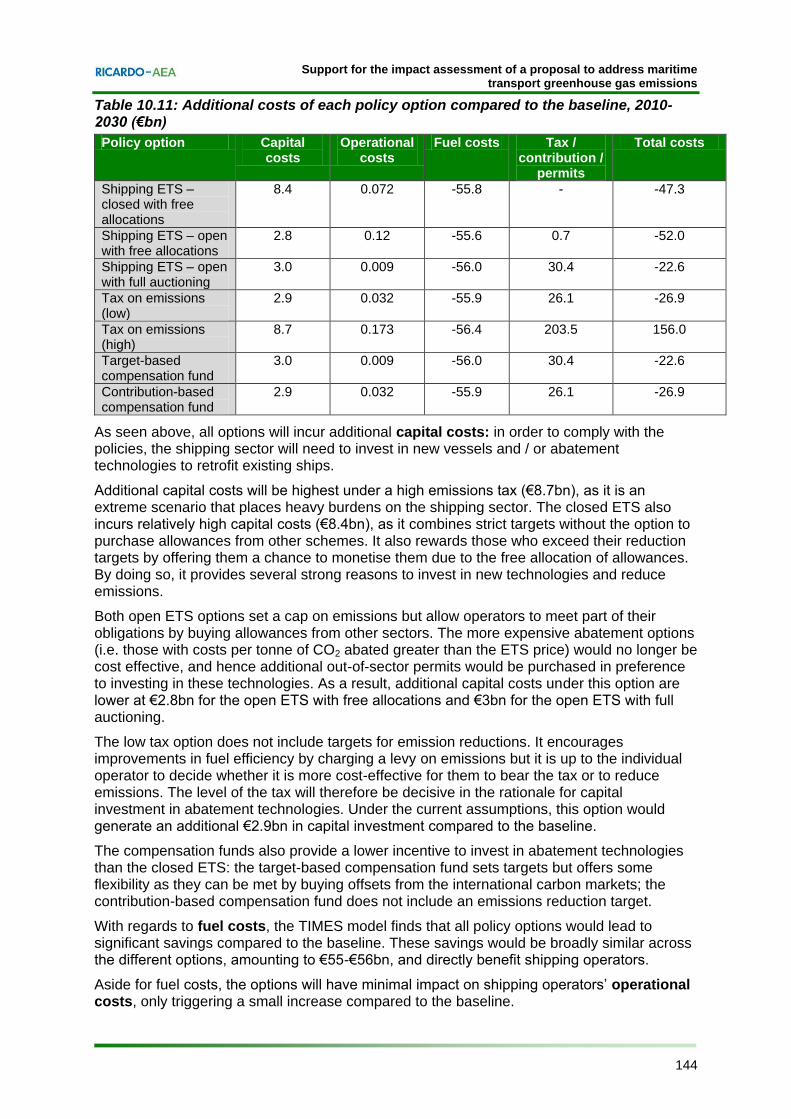
All options will incur additional capital costs, but these costs are more than offset by the reductions in fuel costs. All policy options would lead to significant savings in fuel costs compared to the baseline. These savings would be broadly similar across the different options, amounting to €55-€56bn, and would directly benefit shipping operators. In total, the implementation of all policy options would result in significant net cost savings for the industry, except the extreme case of a high tax on emissions.
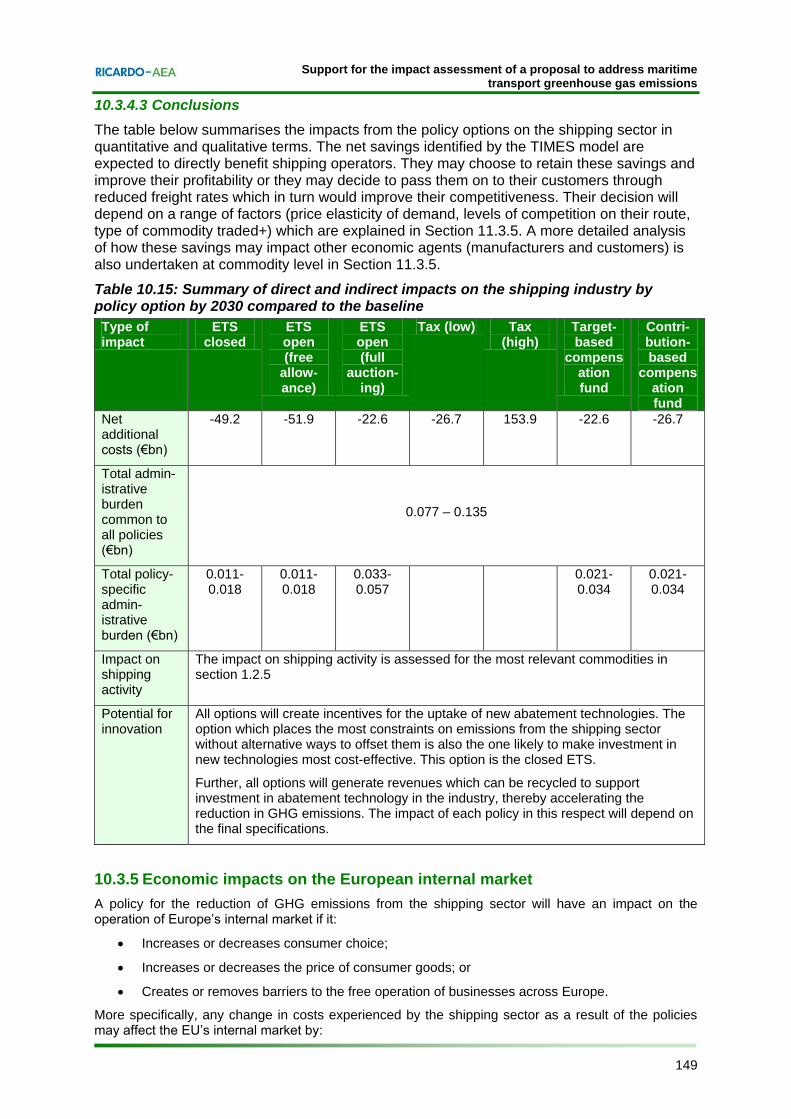
Economic impacts on the European internal market In addition to the direct impacts on the shipping industry, the policy options could have an impact on Europe’s internal market if they (i) increase or decrease consumer choice; (ii) increase or decrease the prices of consumers goods; or (iii) create or remove barriers to the free operation of businesses across Europe. It is not possible to analyse the impacts of the policies on all routes and for all goods; therefore a detailed analysis of a selected set of commodities has been carried out. The commodities were selected for detailed analysis based on:
Support for the impact assessment of a proposal to address maritime transport greenhouse gas emissions
x Ref: Ricardo-AEA/R/ED56985/Issue Number 5
The relevance of the commodity in terms of its importance for EU competitiveness (e.g. share of exports and imports, profit margins, transport costs).
The technical feasibility of the analysis, in terms of readily available data on historical and predicted trade flows, freight rates, freight rate elasticities, own price elasticities, costs pass-through rates, quantities sold and market shares of domestic and overseas producers.
Furthermore, the commodities were selected to reflect a range of possible economic impacts from the policy options. They relate to the three main potential risks for the EU: the competitiveness loss of its exports, the competitiveness loss of local industries heavily dependent on imports of intermediate goods by sea and the increase in prices for final consumer goods. The full set of commodities included in this analysis was as follows:
crude petroleum
refined products
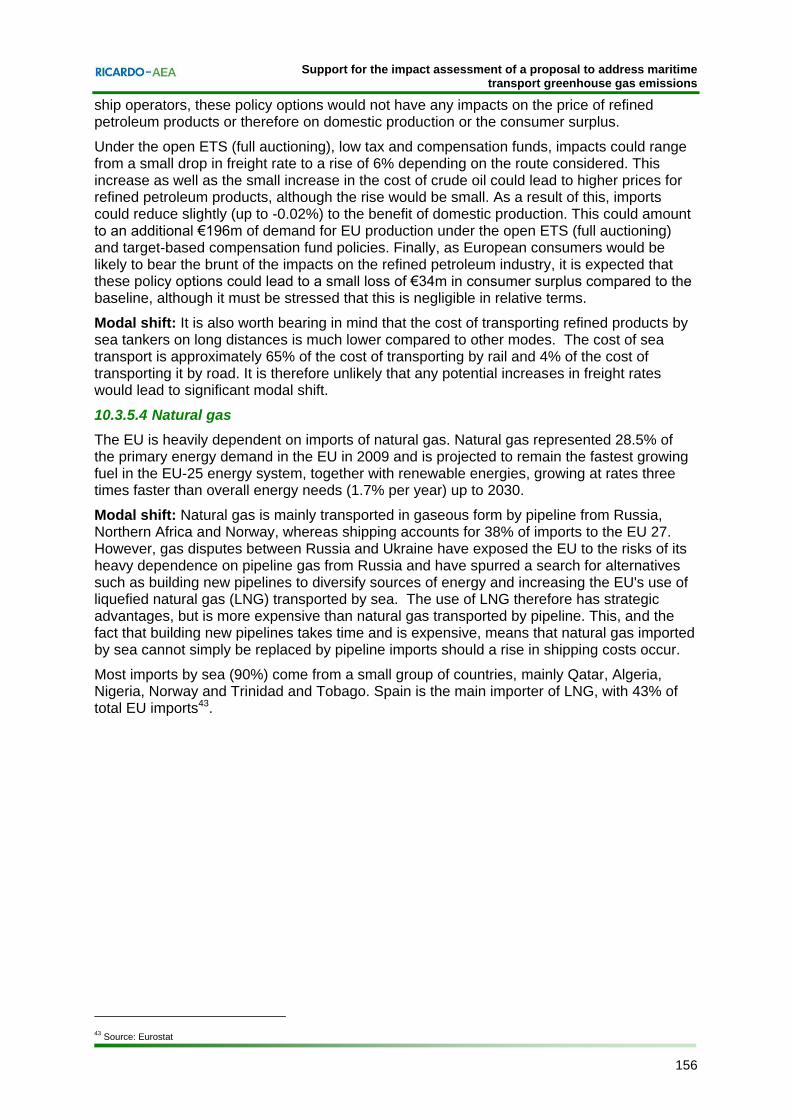
natural gas
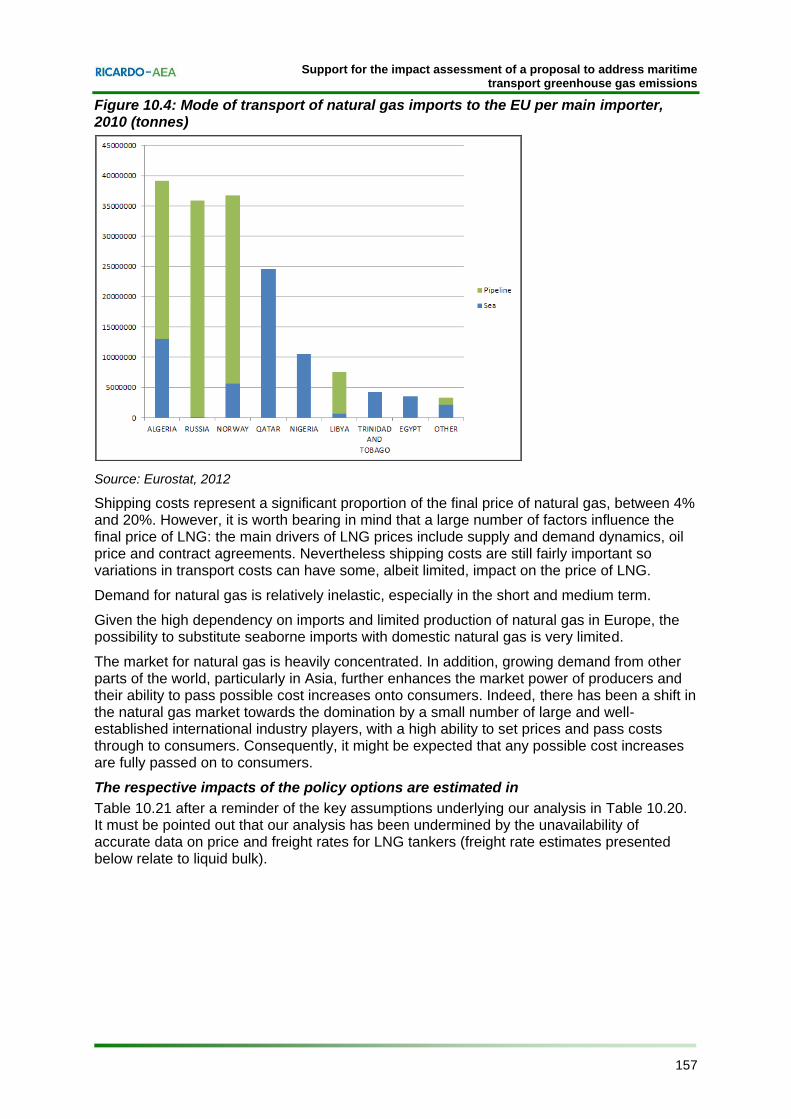
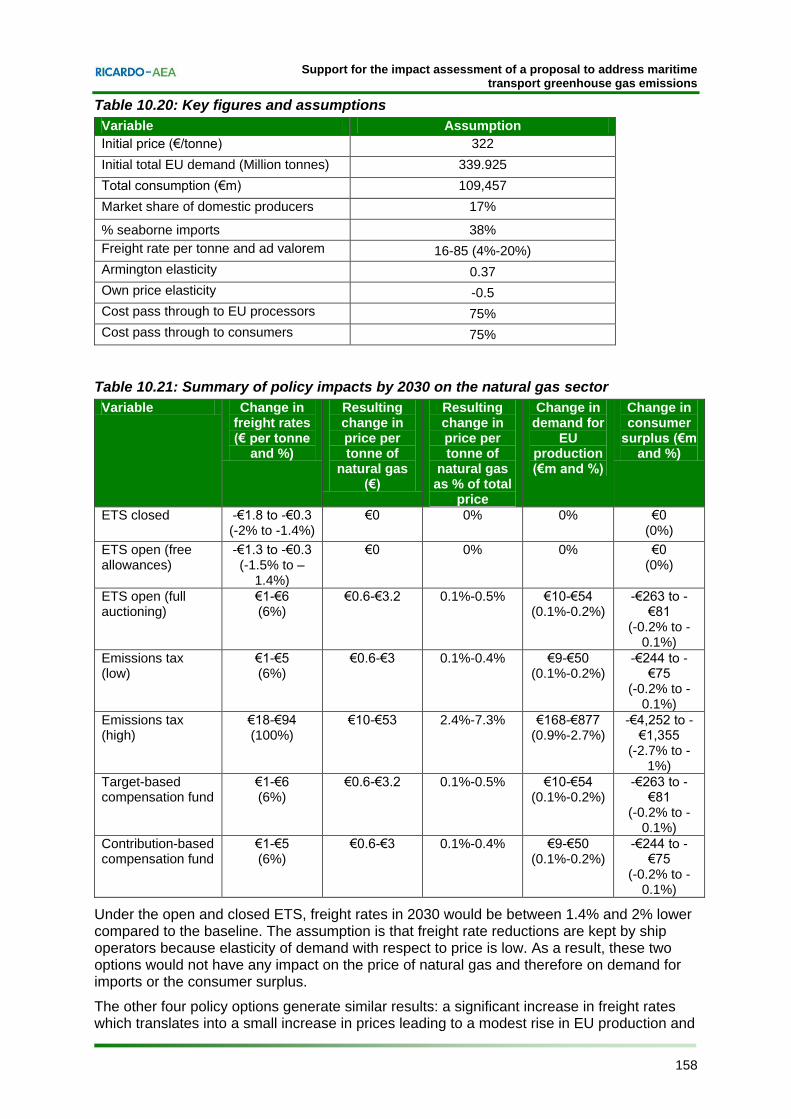
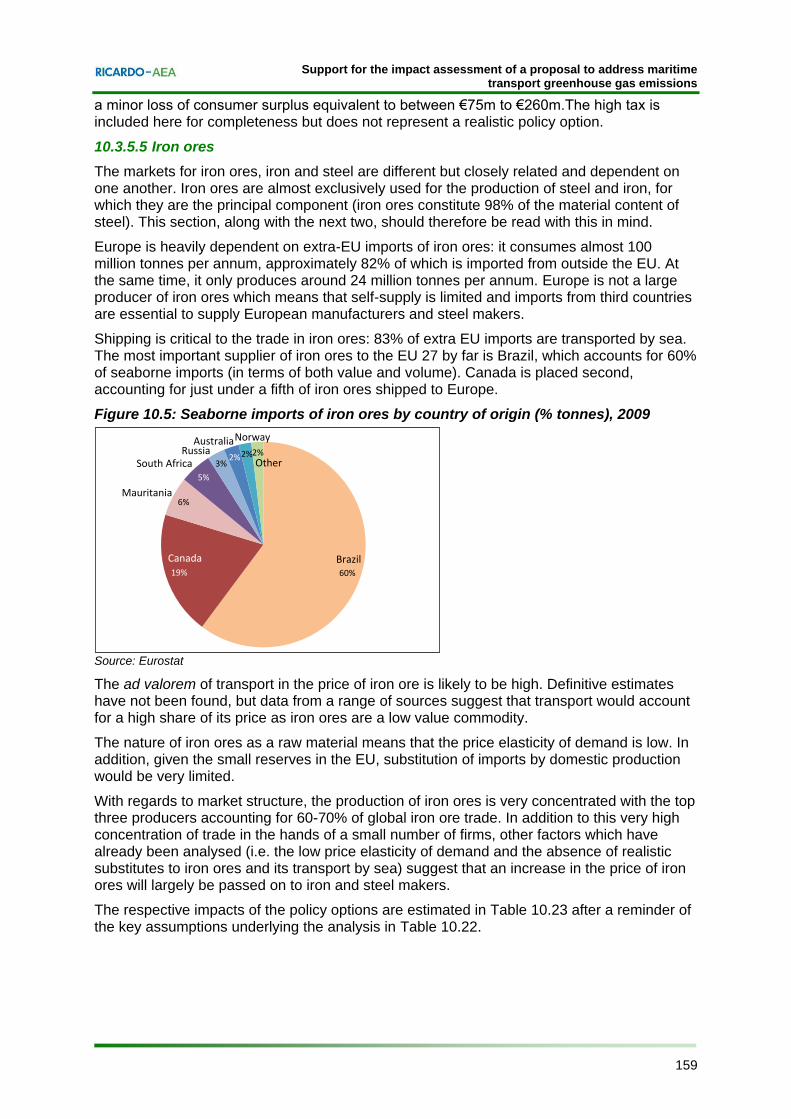
iron ores
iron and steel
wearing apparel
grain
office and IT equipment
motor vehicles
chemicals
paper and pulp
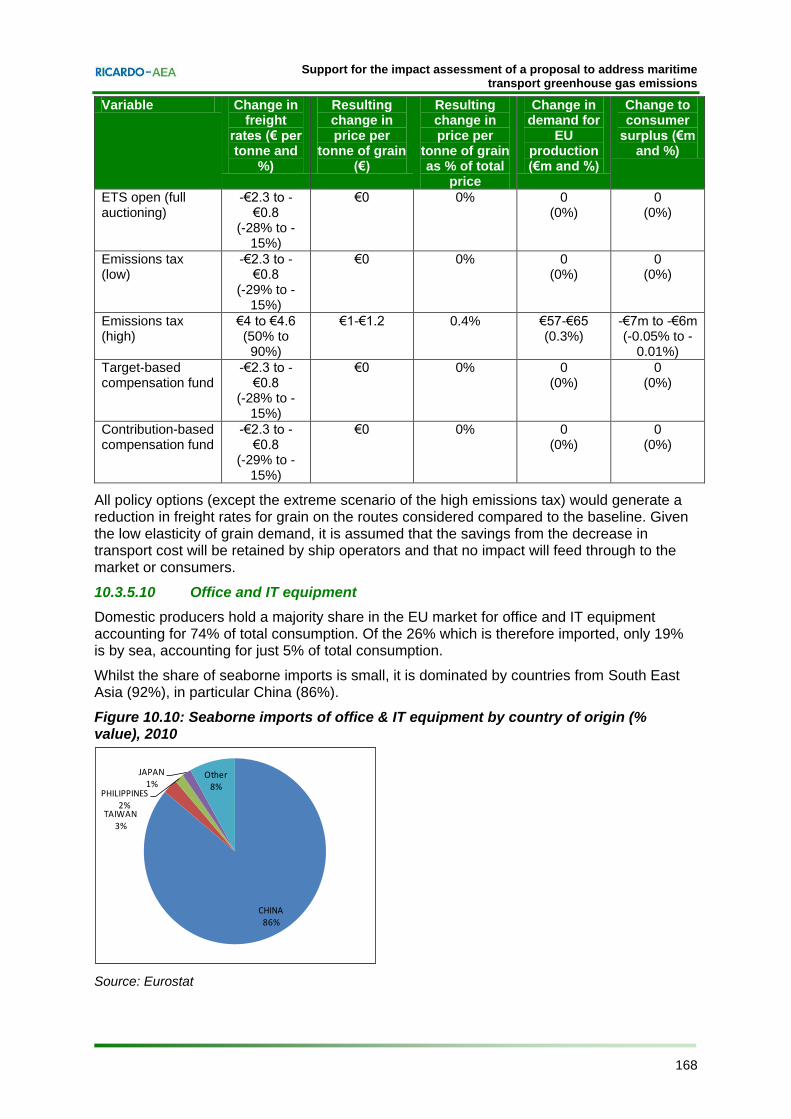
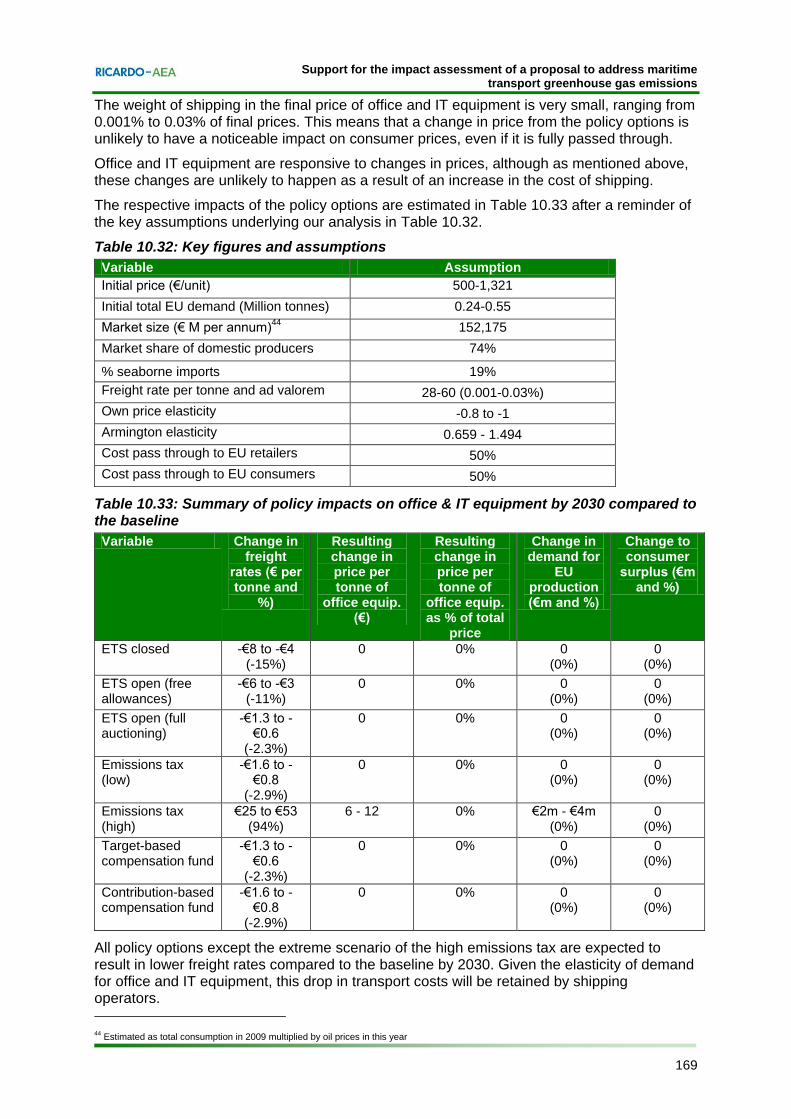
The analysis of selected commodities shows that the policy options can be split into two groups. The first group comprises the closed ETS and open ETS with free allowances. These two options consistently lead to lower freight rates than the baseline in 2030. In most cases those savings are retained by shipping operators and there is no impact on EU producers or consumers. Where increases in freight occur, they are smallest under these two options.
The second group is composed of the open ETS with full auctioning; the target-based compensation fund (which use the same modelling approach as the ETS with full auctioning); the emissions tax (low tax rate); and the contribution-based compensation fund which follows the same model as the emissions tax. The effects of these four options tend to be broadly similar. For consumer goods (wearing apparel, motor vehicles, office and IT equipment), these four policy options lead to reductions in freight rates with no impact on EU producers and consumers. For energy resources and raw materials, these options can generate effects ranging from a small drop in freight rates to an increase of up to 15%. In all cases however, this does not translate into a perceptible impact on EU producers and consumers.
It also important to bear in mind that, even under the extreme scenario of the emissions tax using high tax rates, the impact on commodities prices remains moderate.
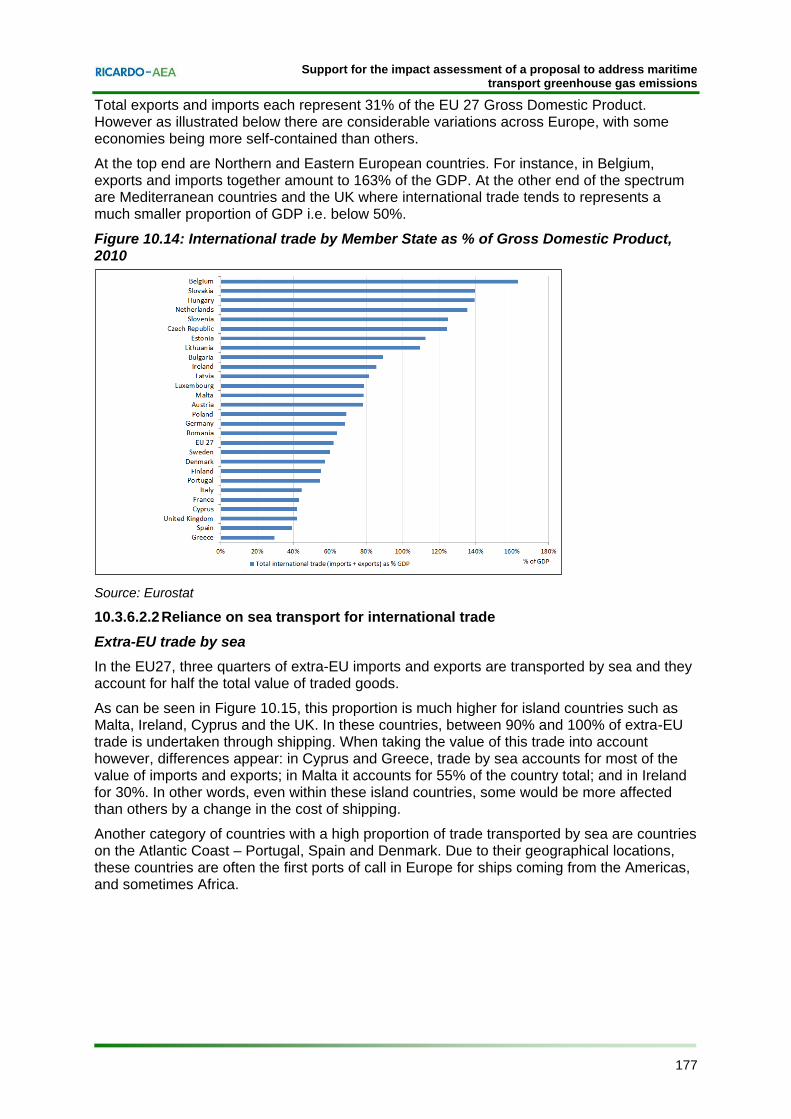
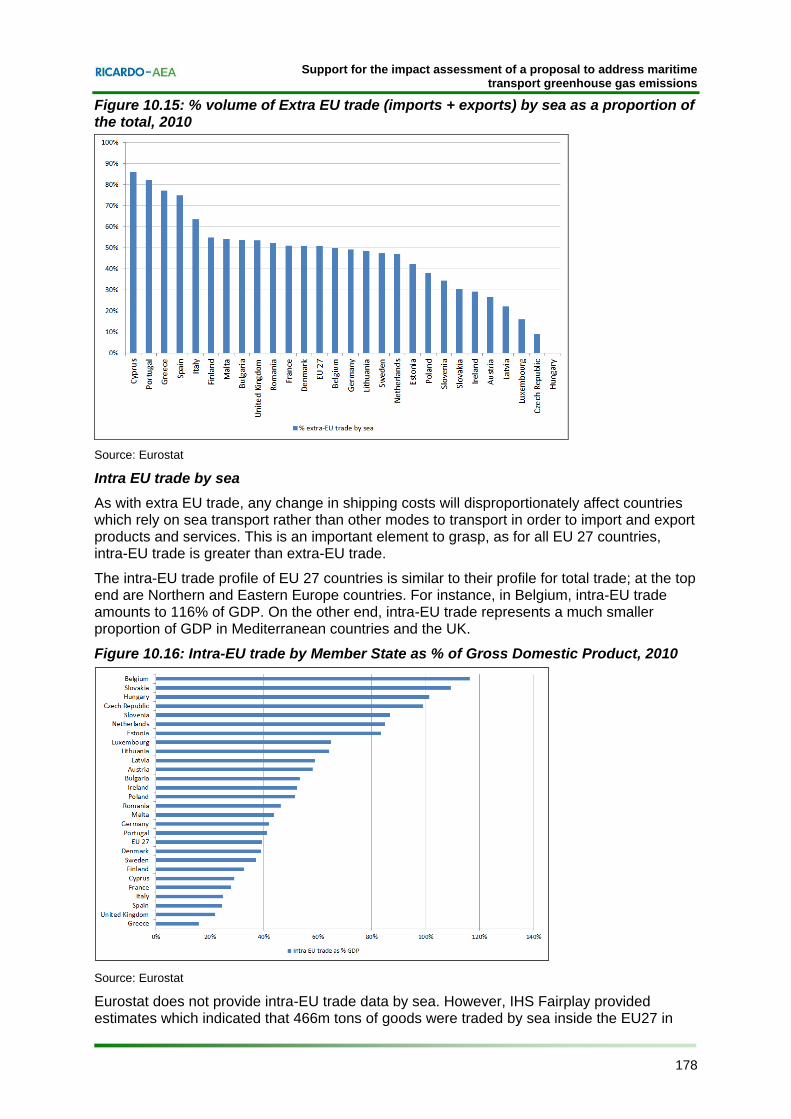
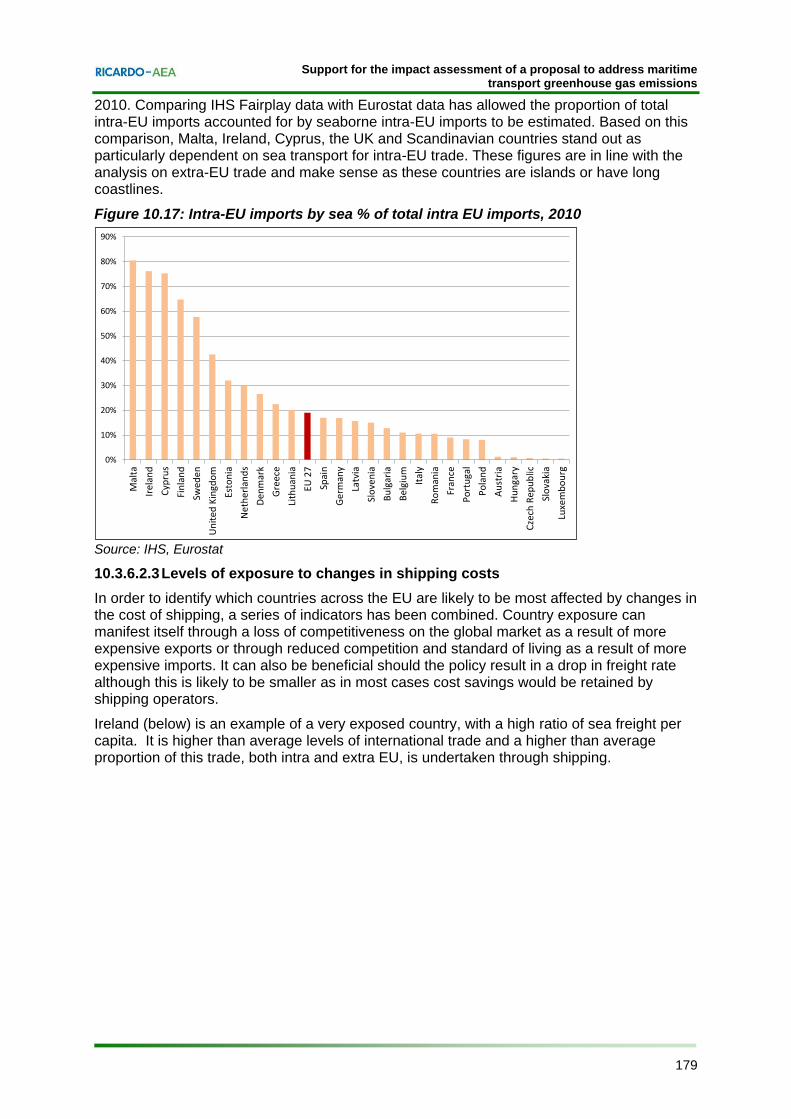
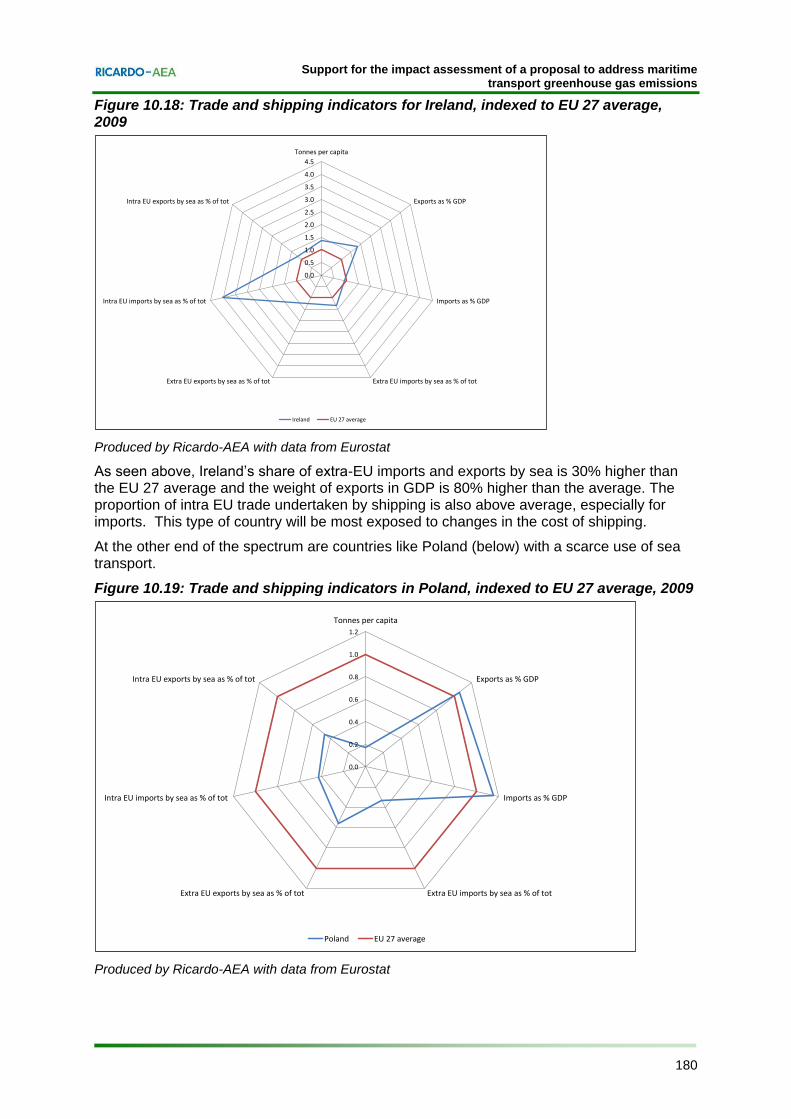
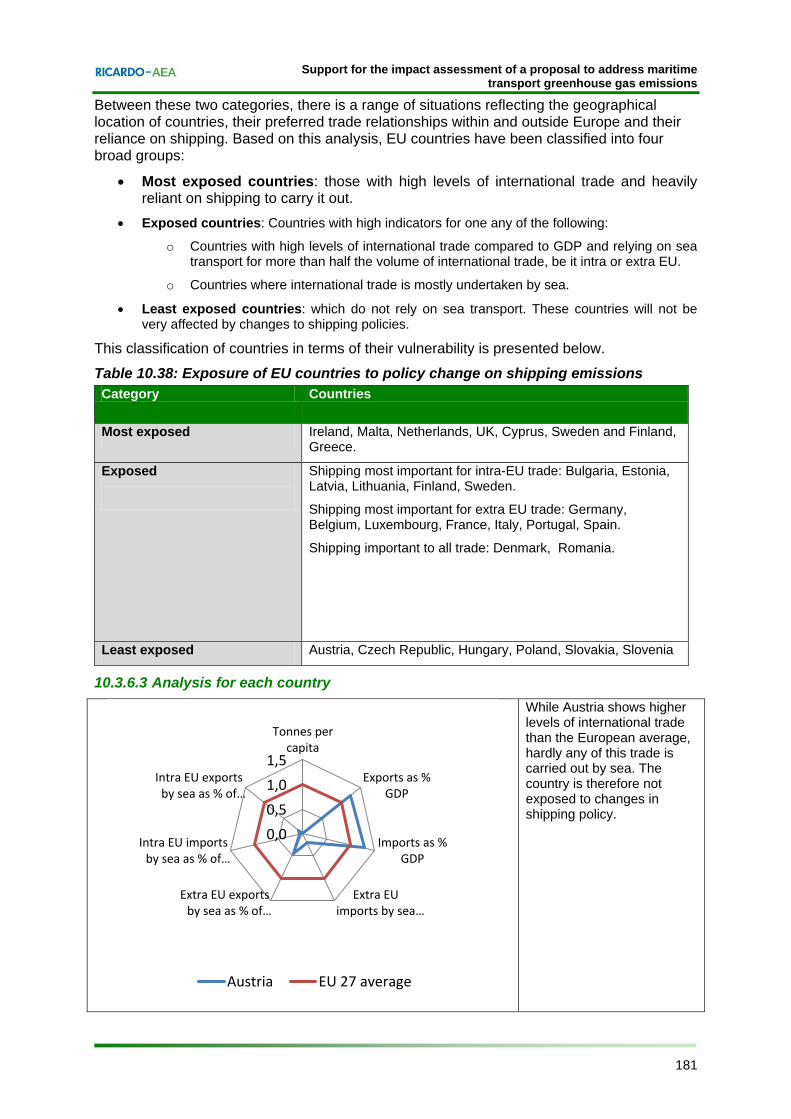
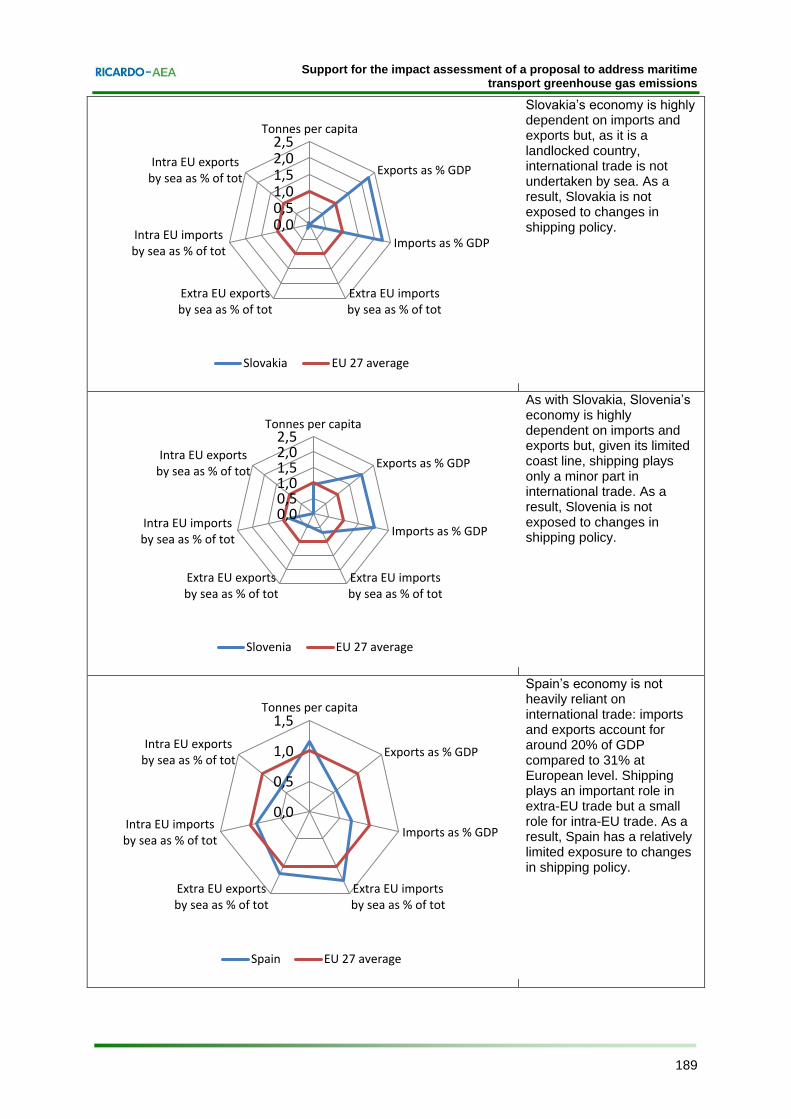
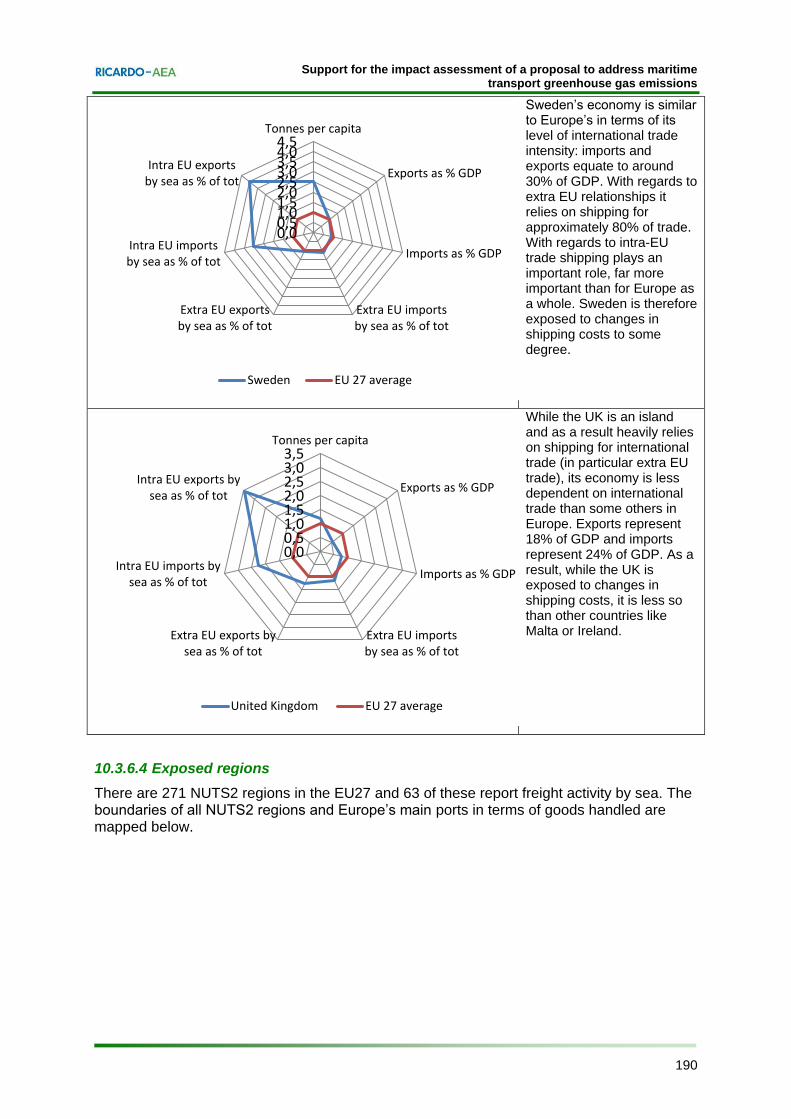
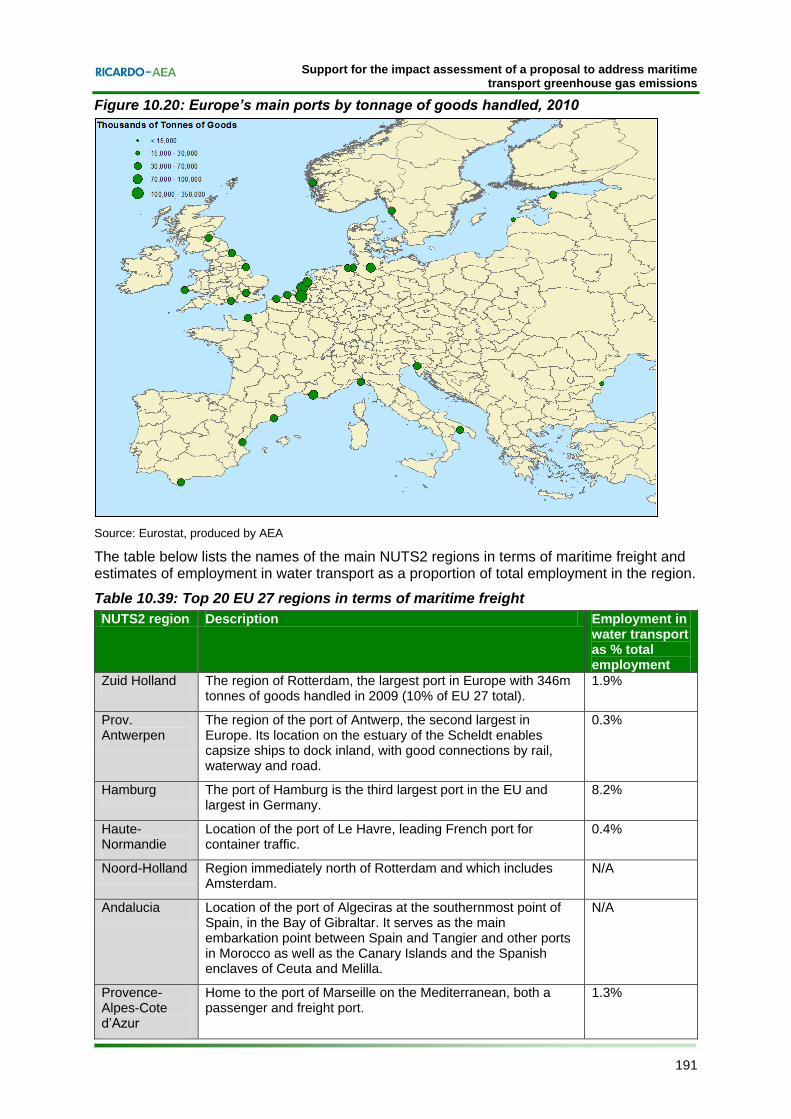
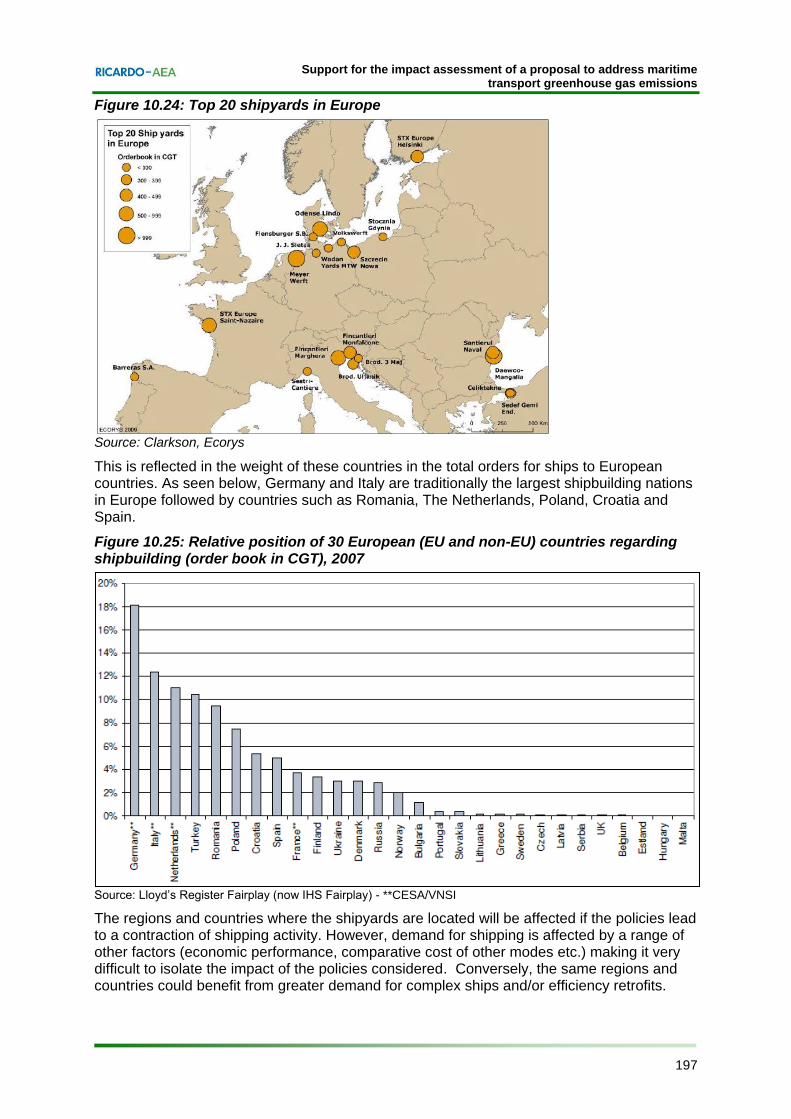
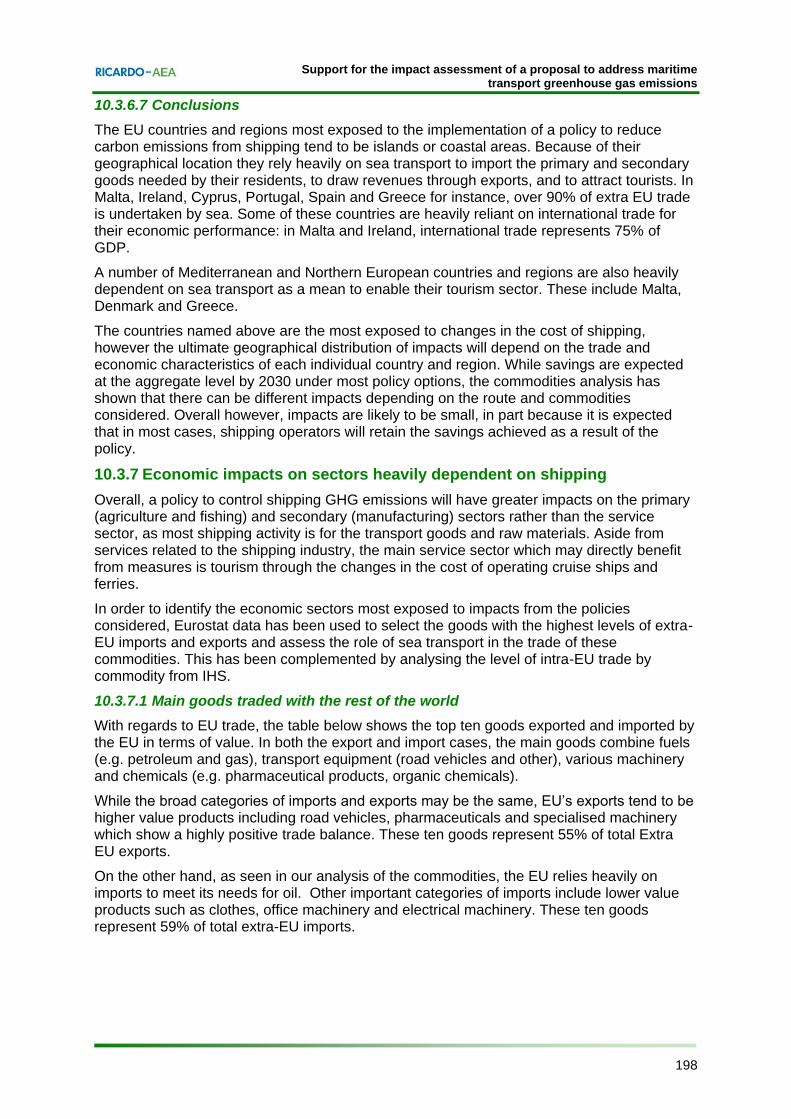
Economic impacts on EU regions heavily dependent on shipping While sea transport is critical to the competitiveness and economic operation of the EU as a whole, shipping activity is concentrated in specific regions and countries. The presence of a freight and/or passenger port attracts a range of shipping-related activities, creating a cluster of businesses and jobs which in turn support the local economy through their spend in goods and services. With this in mind, the parts of the EU 27 which are likely to be most affected by changes in the shipping sector have been identified.
The EU countries and regions most exposed to the implementation of a policy to reduce carbon emissions from shipping tend to be islands or coastal areas. Due to their geographical locations they rely heavily on sea transport to import the primary and secondary goods needed by their residents, to draw revenues through exports, and to attract tourists. In
Support for the impact assessment of a proposal to address maritime transport greenhouse gas emissions
xi Ref: Ricardo-AEA/R/ED56985/Issue Number 5
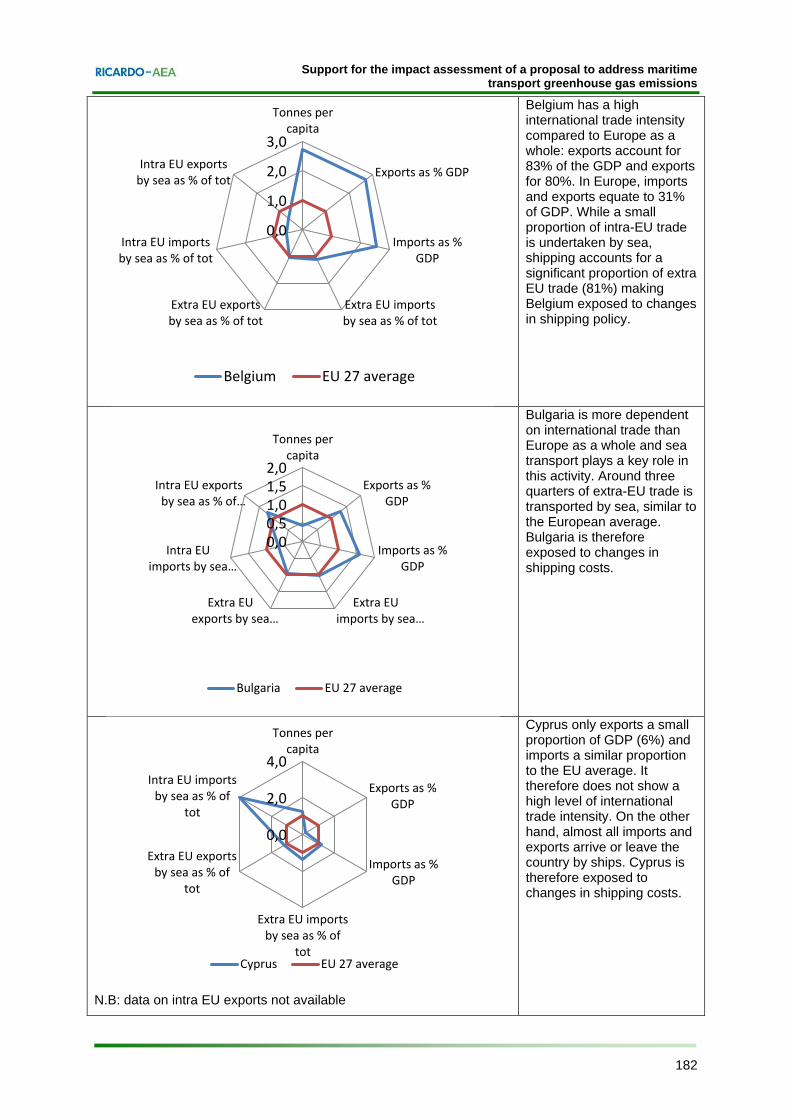
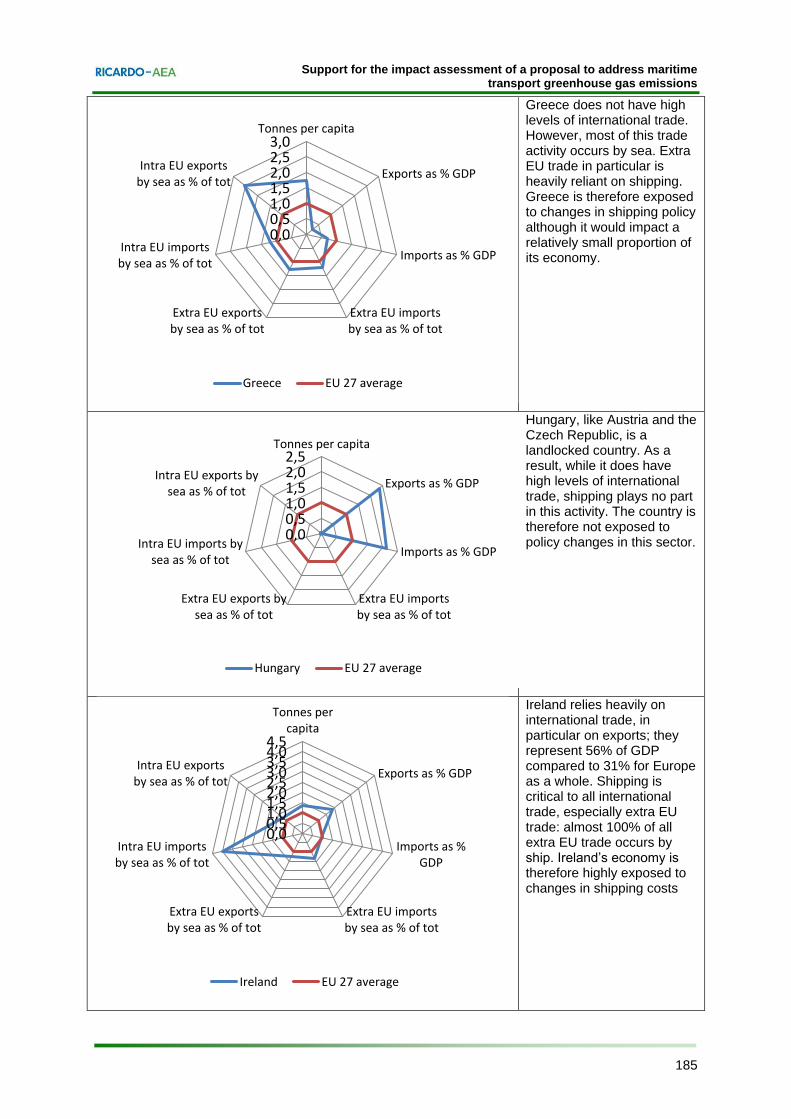
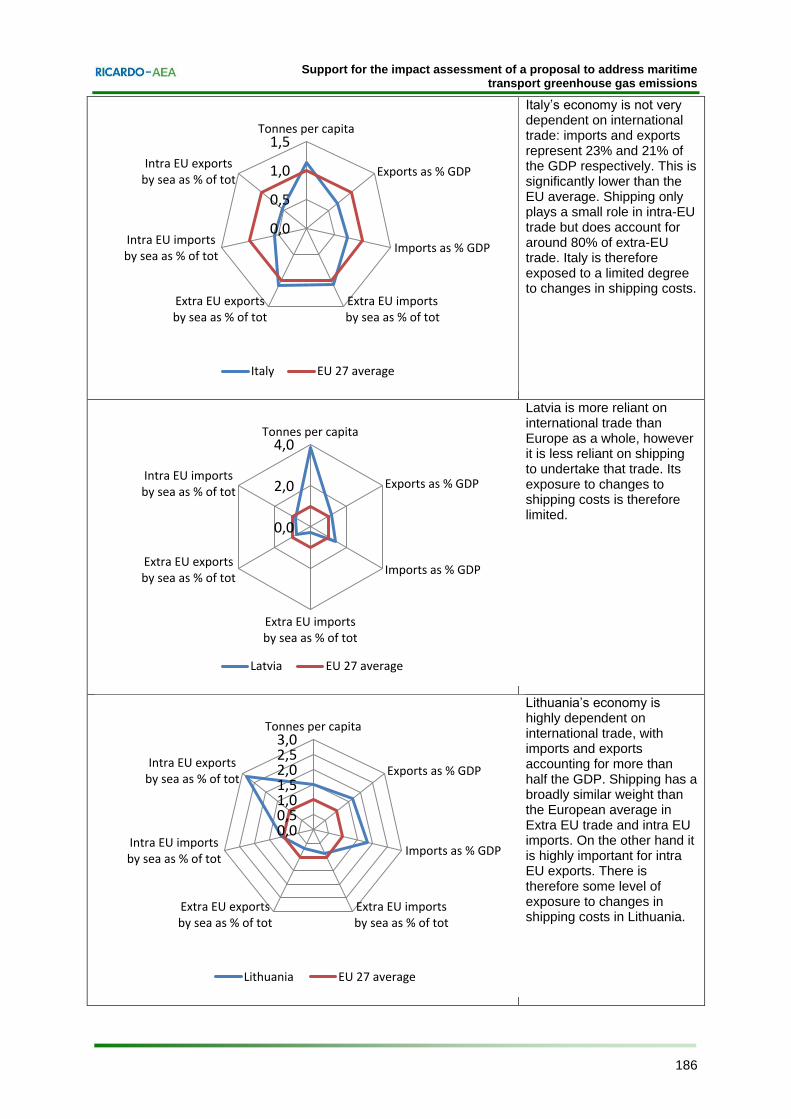
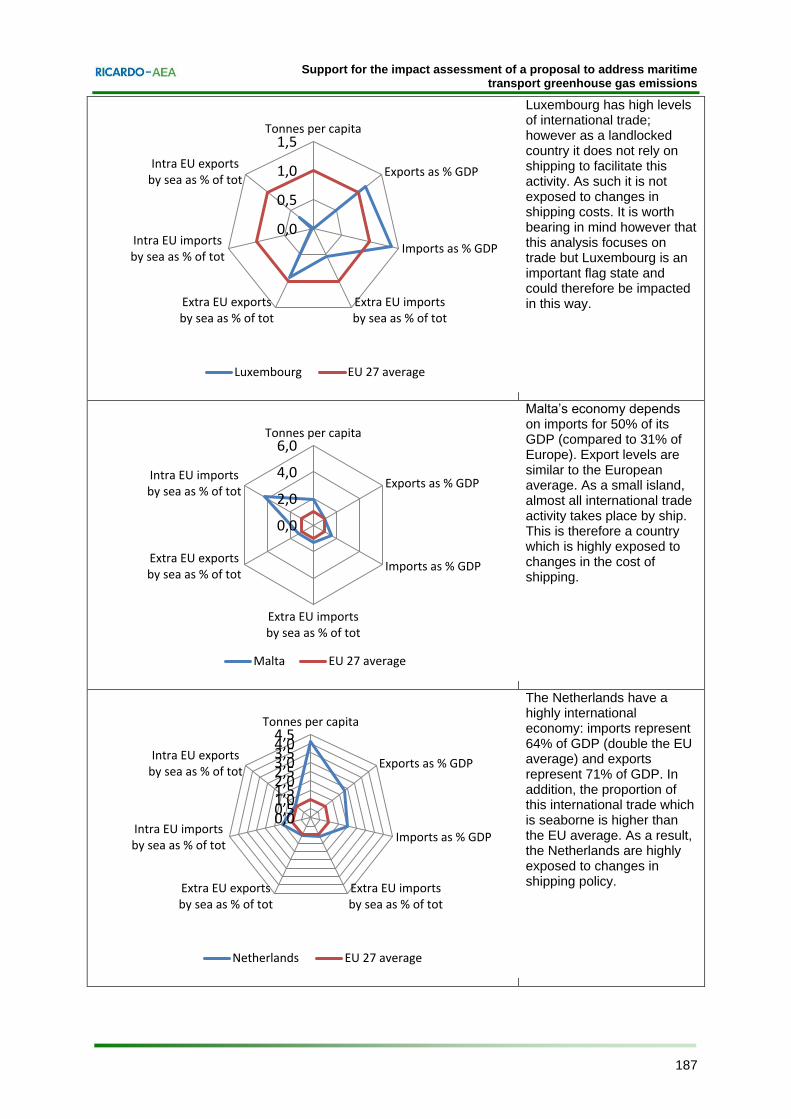
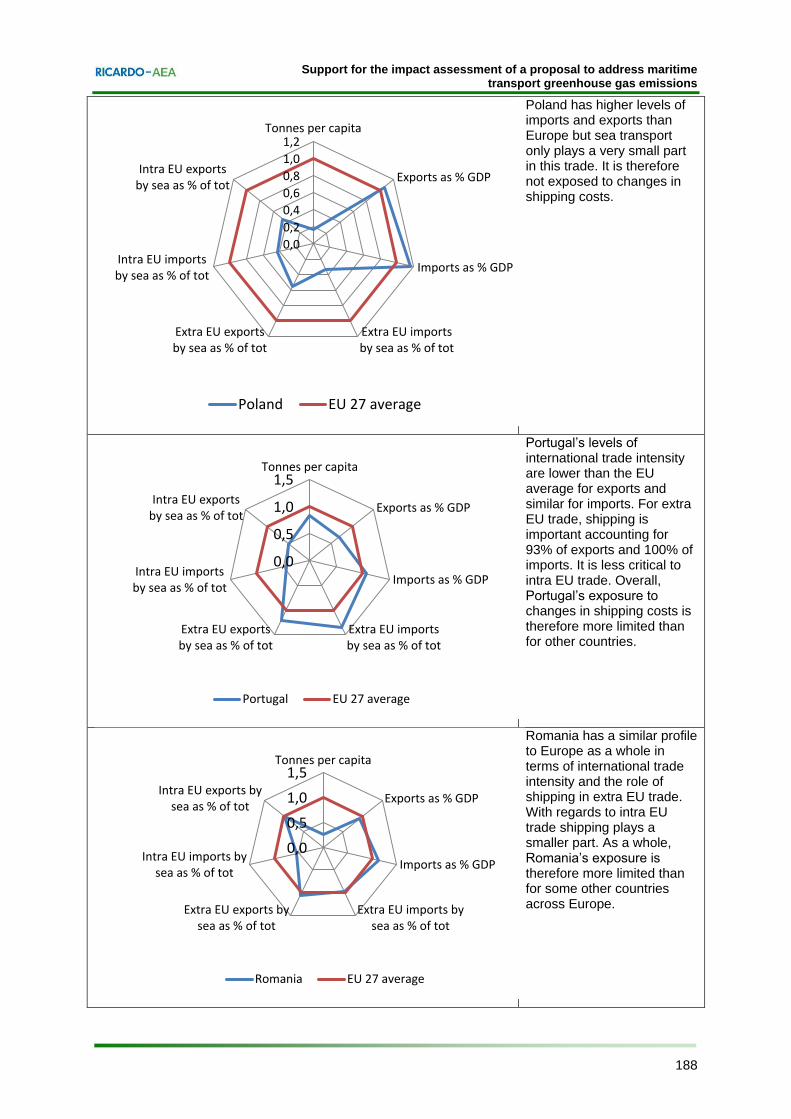
Malta, Ireland, Cyprus, Portugal, Spain and Greece for instance, over 90% of extra EU trade is undertaken by sea. Some of these countries are heavily reliant on international trade for their economic performance: in Malta and Ireland, international trade represents 75% of GDP. A number of Mediterranean and Northern European countries and regions are also heavily dependent on sea transport as a mean to enable their tourism sector. These include Malta, Denmark and Greece.
The countries named above are the most exposed to changes in the cost of shipping, however the ultimate geographical distribution of impacts will depend on the trade and economic characteristics of each individual country and region. While savings are expected at the aggregate level by 2030 under most policy options, the commodities analysis has shown that there can be different impacts depending on the route and commodities considered. However, overall the impacts are likely to be small, in part because it is expected that in most cases, shipping operators will retain the savings achieved as a result of the policy.
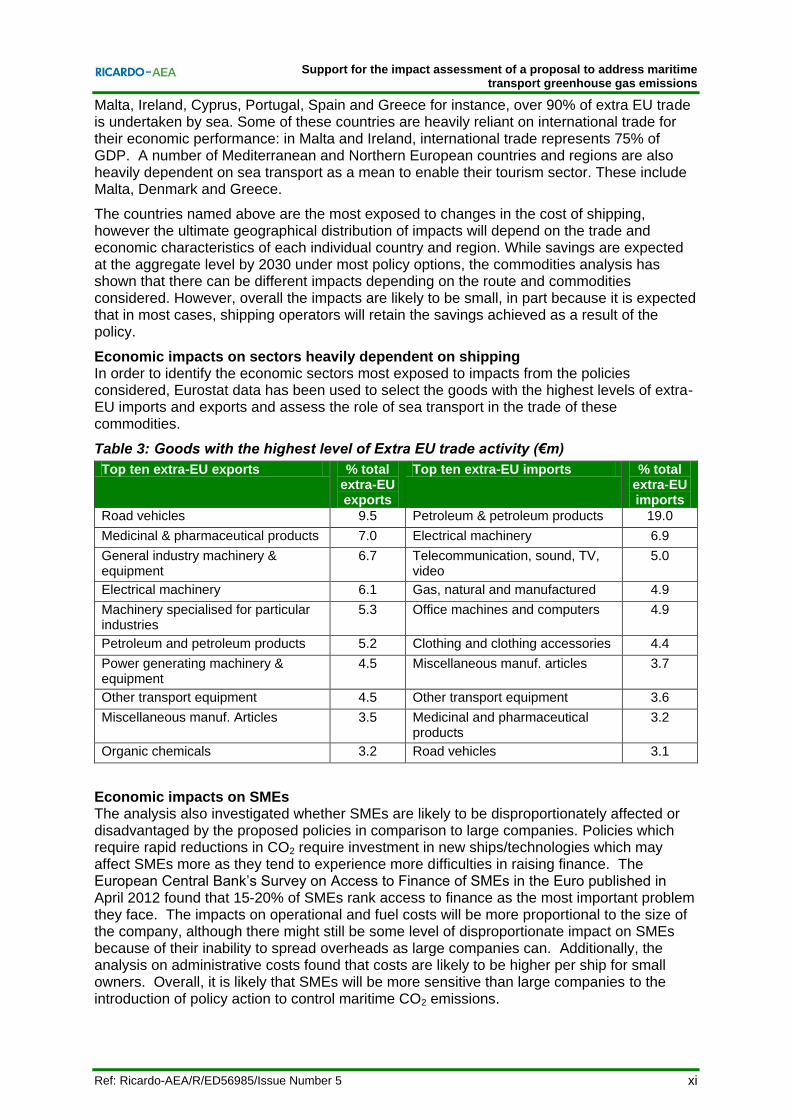
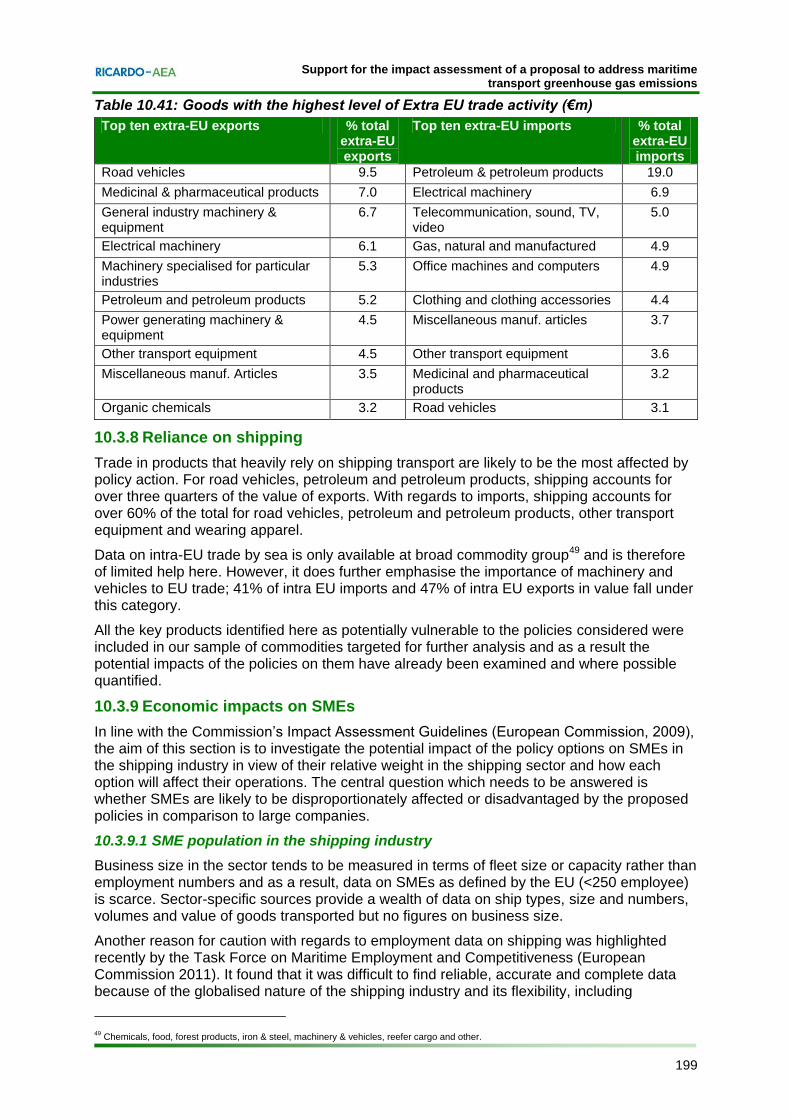
Economic impacts on sectors heavily dependent on shipping In order to identify the economic sectors most exposed to impacts from the policies considered, Eurostat data has been used to select the goods with the highest levels of extra-EU imports and exports and assess the role of sea transport in the trade of these commodities.
Table 3: Goods with the highest level of Extra EU trade activity (€m)
Electrical machinery 6.1 Gas, natural and manufactured 4.9
Machinery specialised for particular industries
5.3 Office machines and computers 4.9
Petroleum and petroleum products 5.2 Clothing and clothing accessories 4.4
Power generating machinery & equipment
4.5 Miscellaneous manuf. articles 3.7
Other transport equipment 4.5 Other transport equipment 3.6
Miscellaneous manuf. Articles 3.5 Medicinal and pharmaceutical products
3.2
Organic chemicals 3.2 Road vehicles 3.1
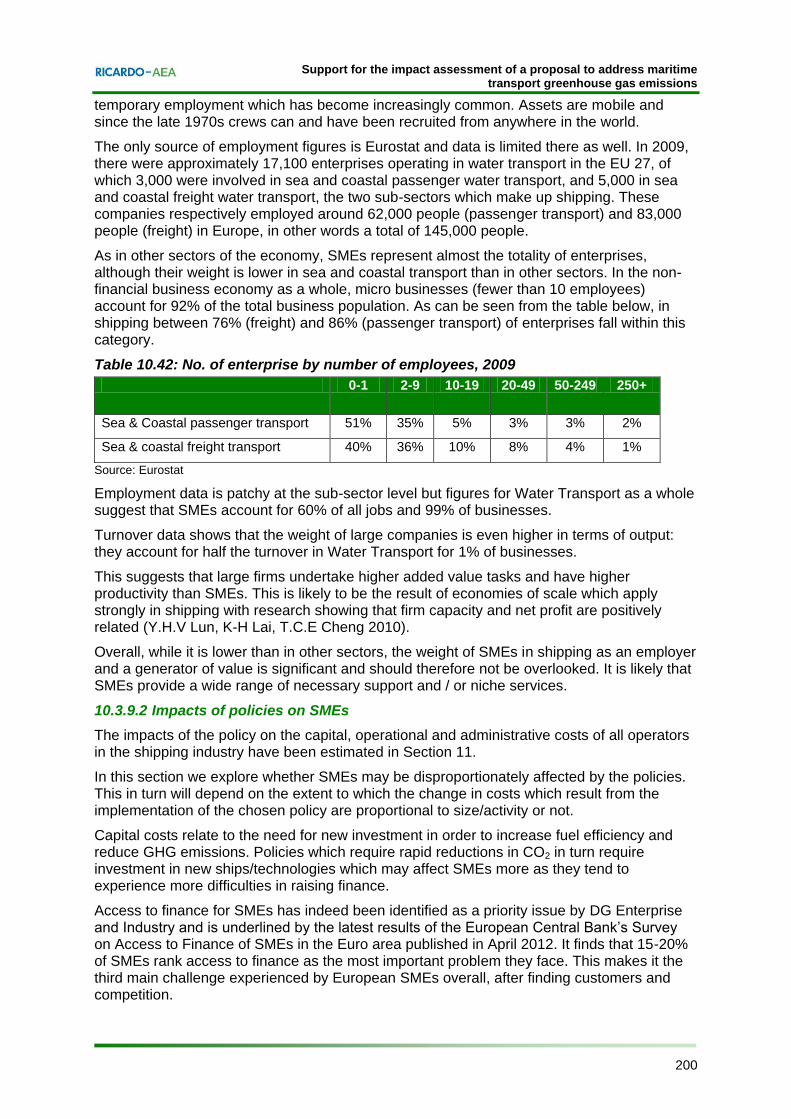
Economic impacts on SMEs The analysis also investigated whether SMEs are likely to be disproportionately affected or disadvantaged by the proposed policies in comparison to large companies. Policies which require rapid reductions in CO2 require investment in new ships/technologies which may affect SMEs more as they tend to experience more difficulties in raising finance. The European Central Bank’s Survey on Access to Finance of SMEs in the Euro published in April 2012 found that 15-20% of SMEs rank access to finance as the most important problem they face. The impacts on operational and fuel costs will be more proportional to the size of the company, although there might still be some level of disproportionate impact on SMEs because of their inability to spread overheads as large companies can. Additionally, the analysis on administrative costs found that costs are likely to be higher per ship for small owners. Overall, it is likely that SMEs will be more sensitive than large companies to the introduction of policy action to control maritime CO2 emissions.
Support for the impact assessment of a proposal to address maritime transport greenhouse gas emissions
xii Ref: Ricardo-AEA/R/ED56985/Issue Number 5
Economic impacts on European international competitiveness and relationships Implementing policy action on shipping emissions to and from Europe may have an impact on Europe’s relationships with the rest of the world for the following reasons:
By changing the freight cost from and to Europe. This has been assessed, where relevant, as part of the commodity analysis and the key findings are provided here.
Given the geographical distribution of extra-EU trade, some countries are more important markets and suppliers for Europe than others. These countries have been identified through Eurostat and OECD data, with a particular focus on least developed countries.
Overall, the pattern of trade between the EU and the rest of the world is one where imports supply energy, raw materials, intermediary products and lower value consumer goods, while in return Europe exports high value manufactured products. Importers to the EU are more likely to be affected by possible changes in the cost of maritime transport than exporters from the EU.
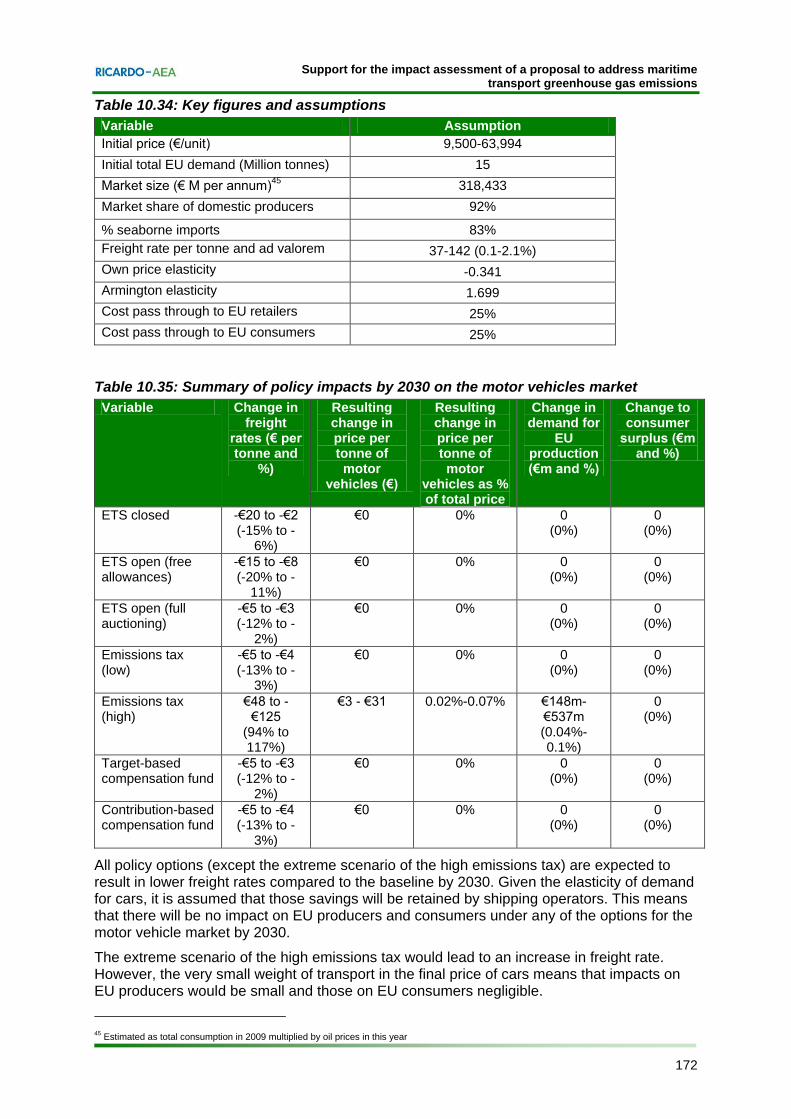
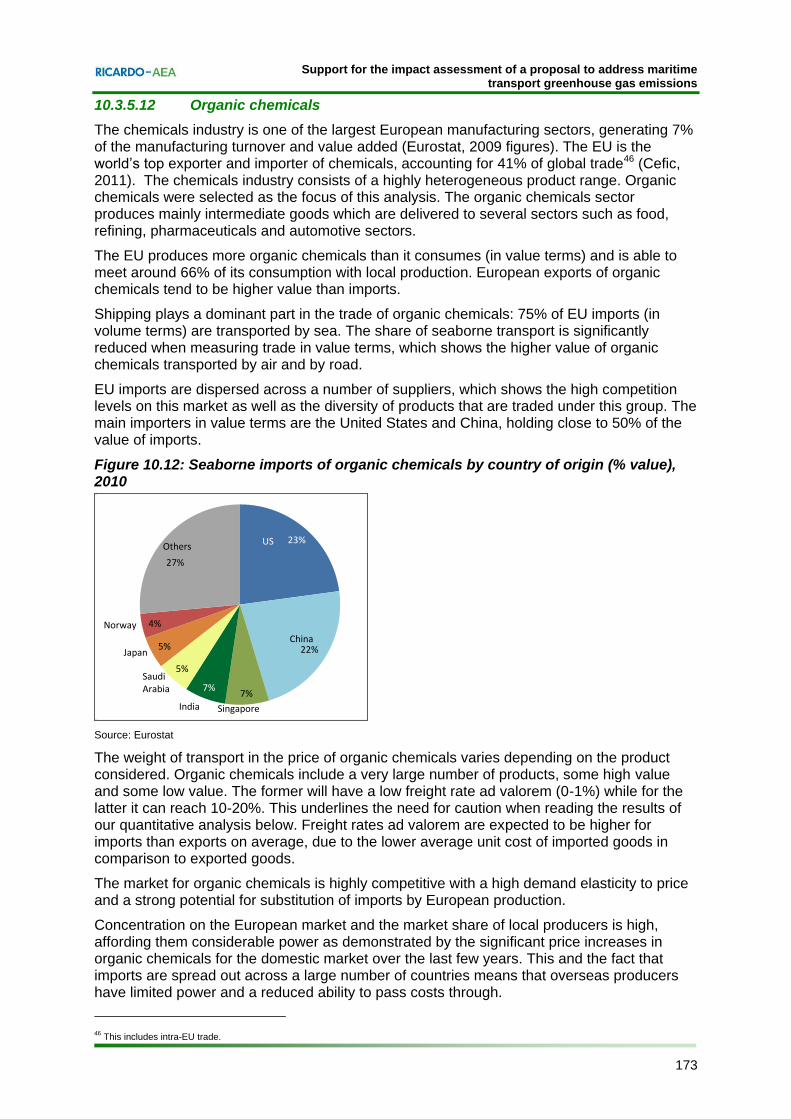
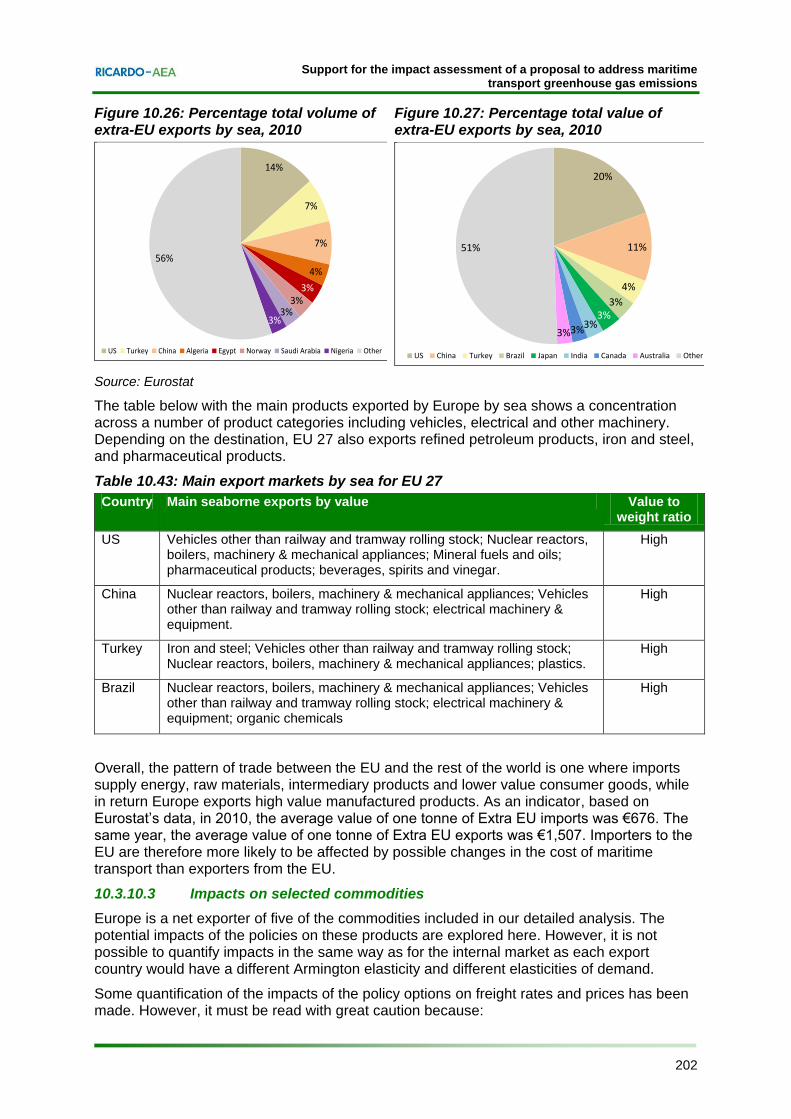
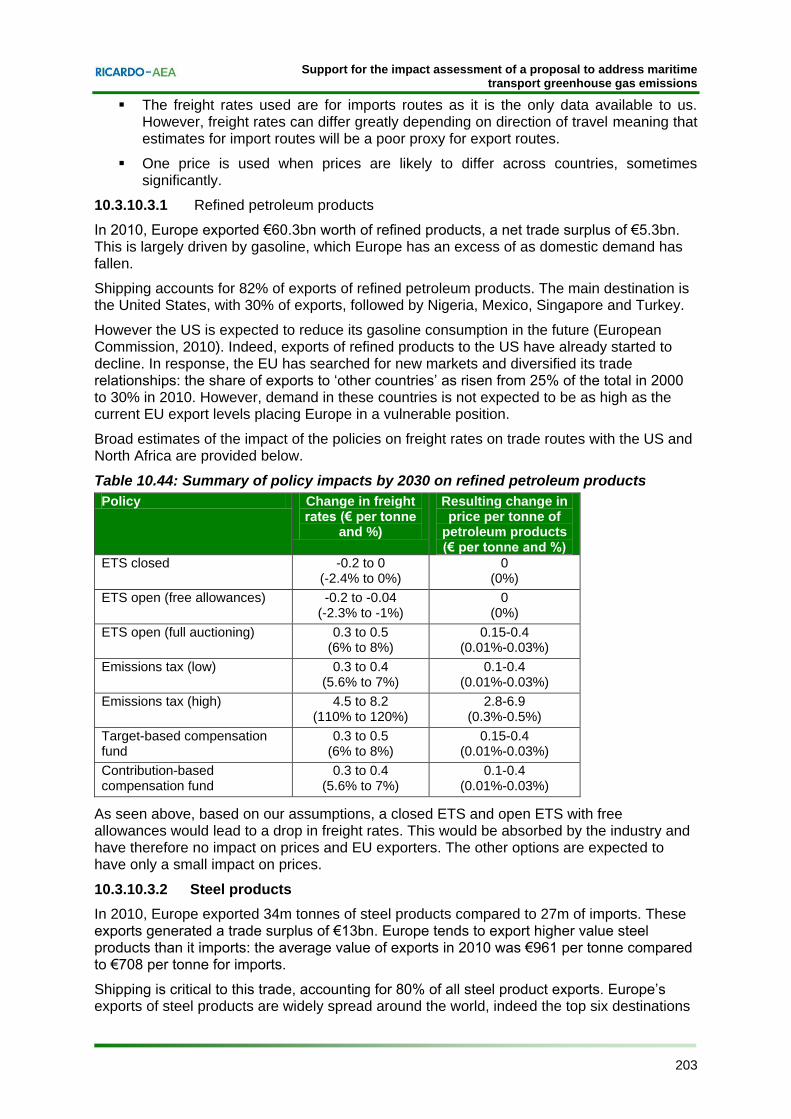
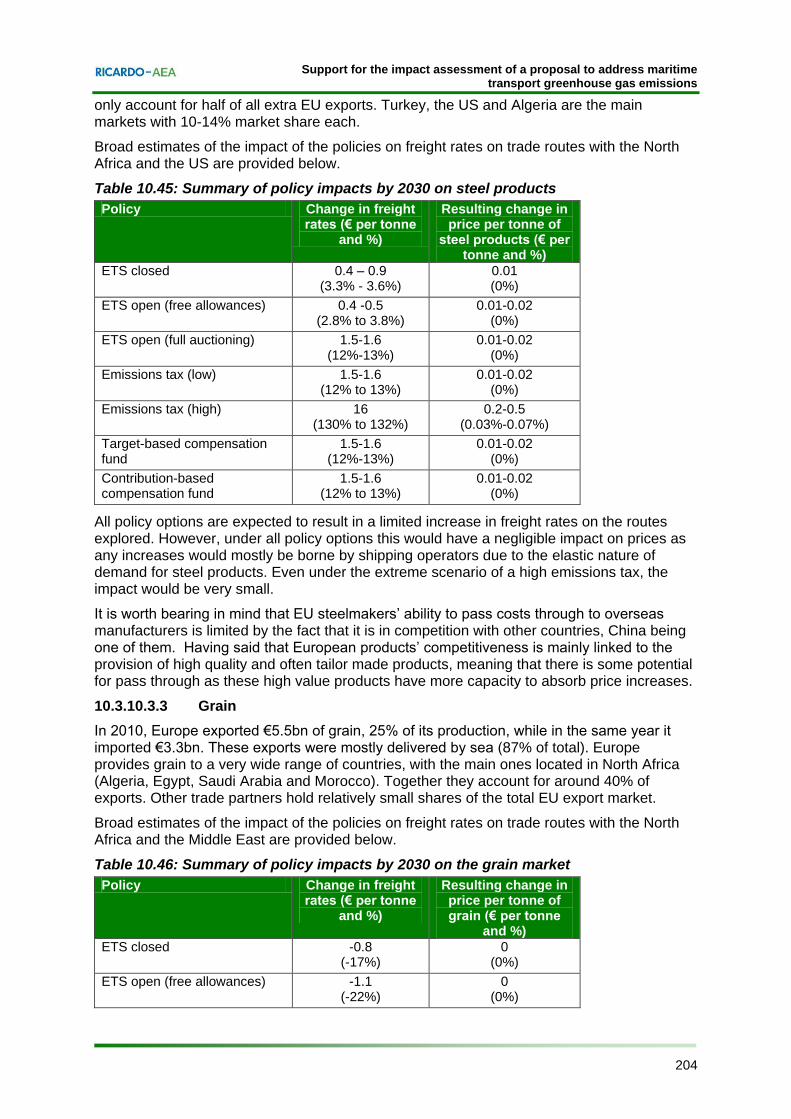
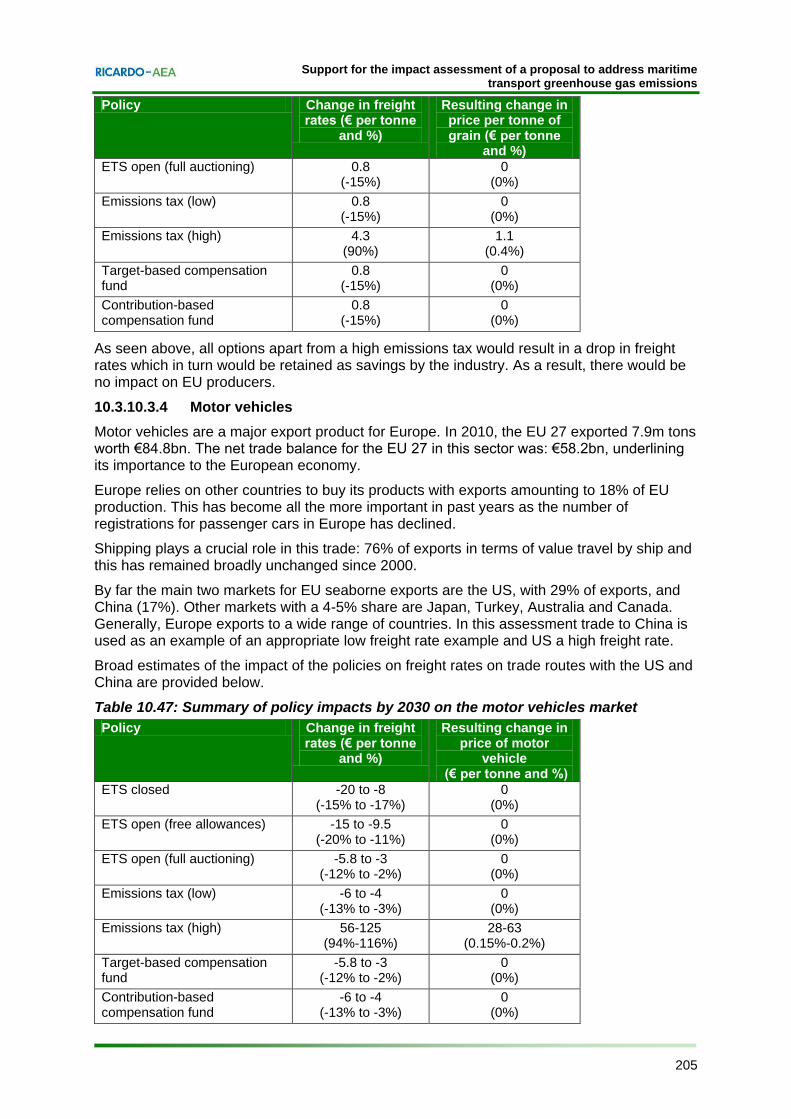
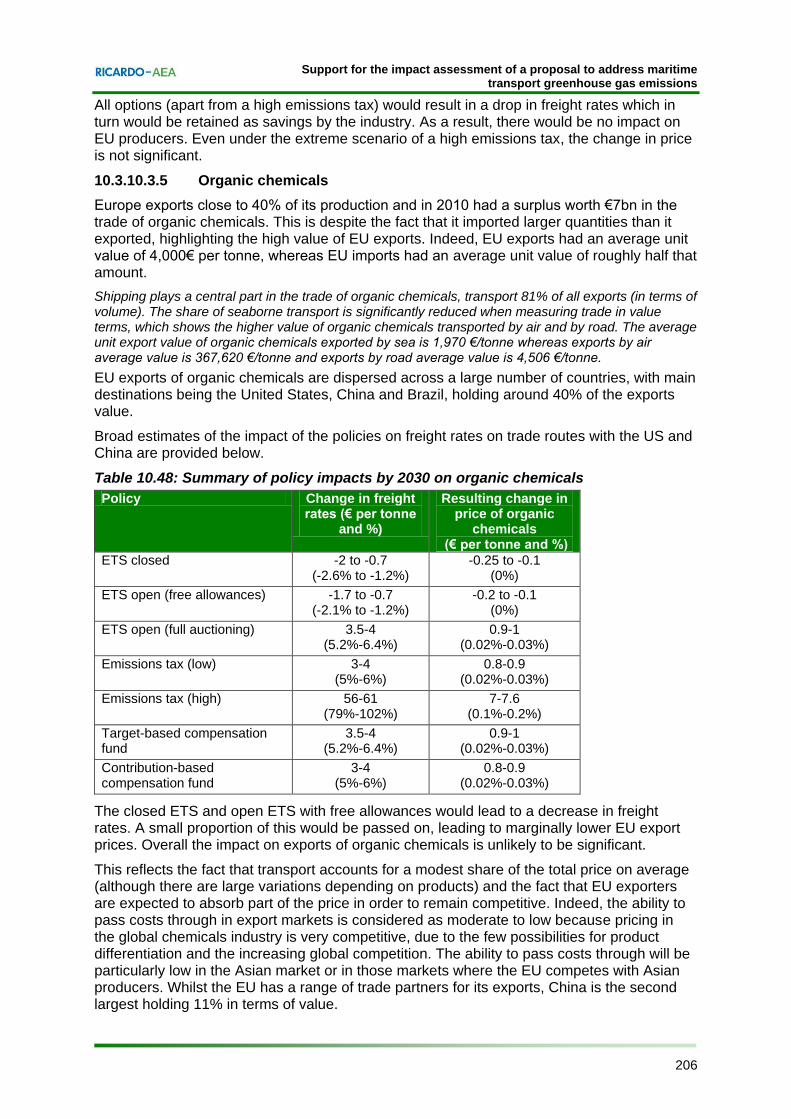
For EU exports, the potential impacts of the policy options were investigated for five commodities (refined petroleum products, steel products, grain, motor vehicles and organic chemicals). For grain, and motor vehicles, all policy options (except for the high tax on emissions) would lead to a reduction in freight rates, which would be retained as savings by shipping industry. As a result, there would be no impact on EU producers. For refined petroleum products and organic chemicals, a closed ETS and an open ETS with free allowances would lead to a reduction in freight rates. This would be absorbed by the industry and have therefore no impact on prices and EU exporters. The other options are expected to have only a small impact on prices. For steel products, all policy options are expected to result in a limited increase in freight rates on the routes explored. However, under all policy options this would have a negligible impact on prices as any increases would mostly be borne by shipping operators due to the elastic nature of demand for steel products.
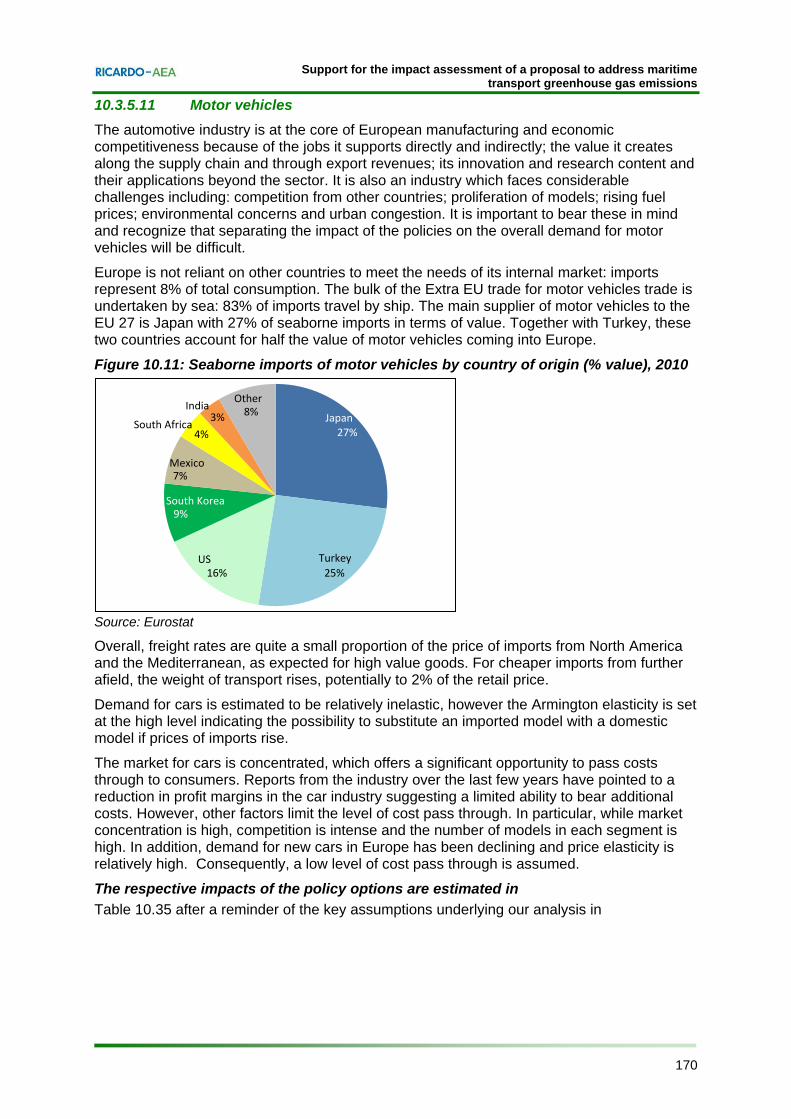
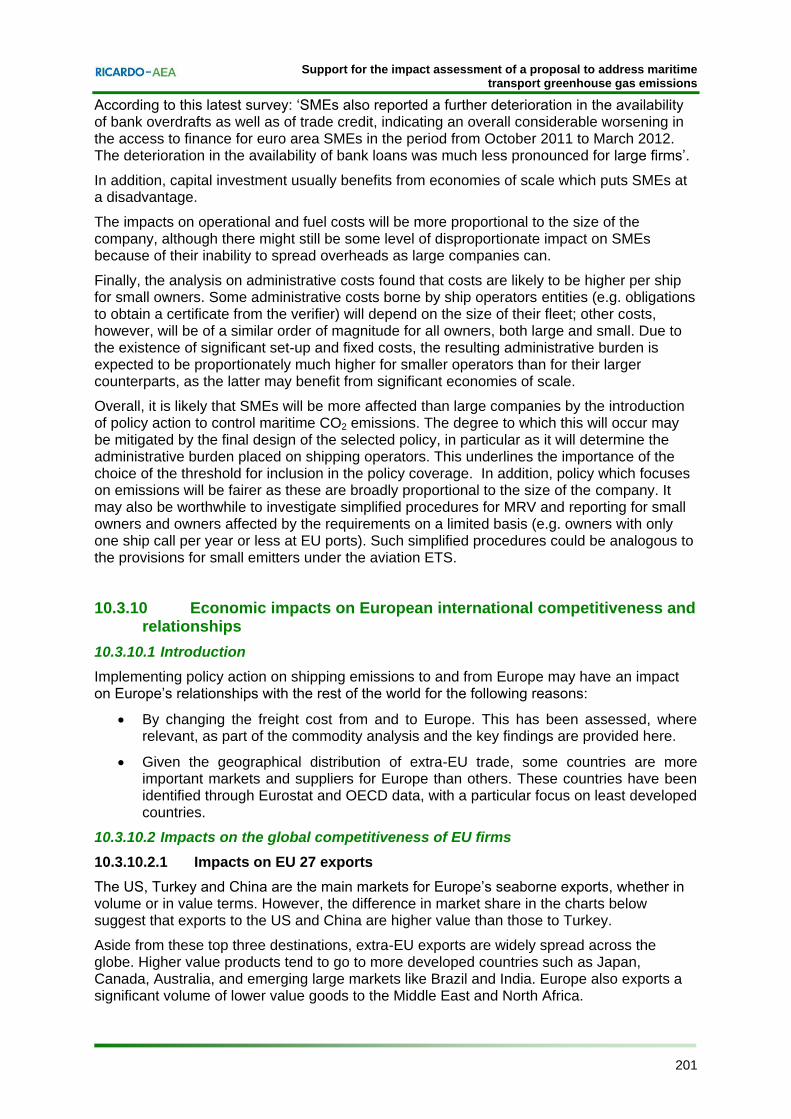
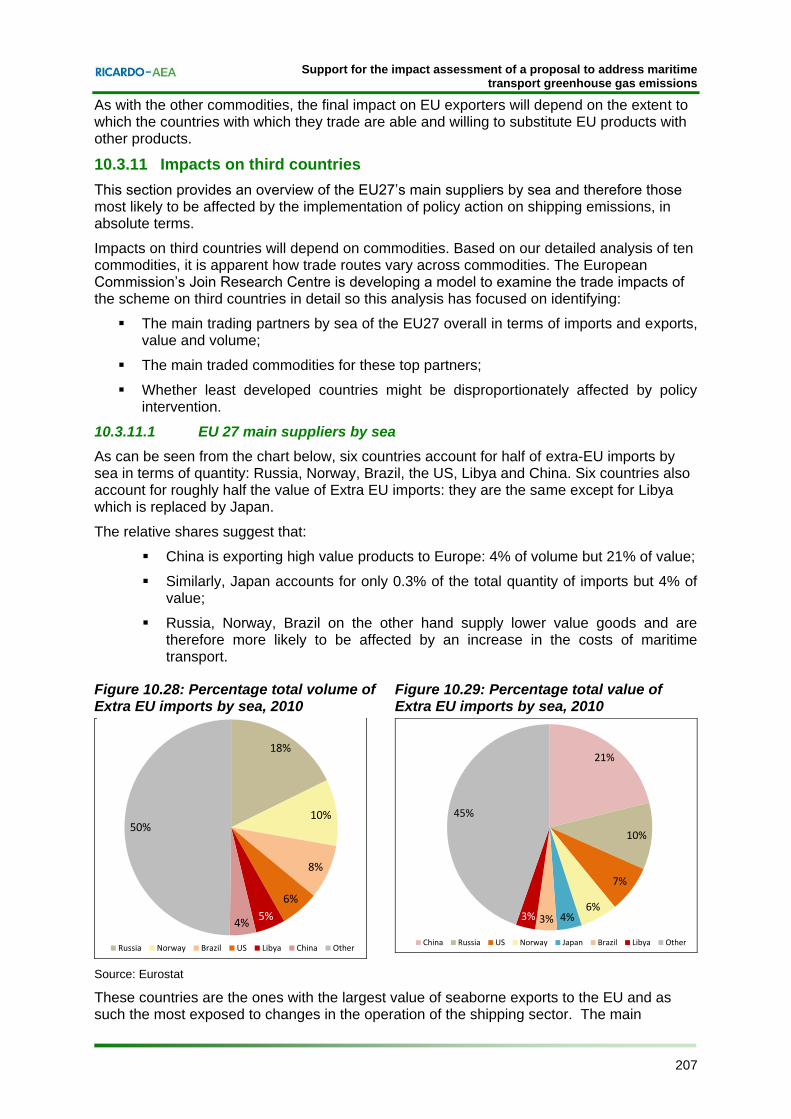
Impacts on third countries Six countries account for half of extra-EU imports by sea in terms of quantity: Russia, Norway, Brazil, the US, Libya and China. Six countries also account for roughly half the value of Extra EU imports: they are the same except for Libya which is replaced by Japan.
The relative shares suggest that:
China is exporting high value products to Europe: 4% of volume but 21% of value; Similarly, Japan accounts for only 0.3% of the total quantity of imports but 4% of
value; Russia, Norway, Brazil on the other hand supply lower value goods and are
therefore more likely to be affected by an increase in the costs of maritime transport.
These countries are the ones with the largest value of seaborne exports to the EU and as such the most exposed to changes in the operation of the shipping sector. The final impact will depend on a range of factors including: the commodity traded; the routes; the elasticity to freight rate and prices; levels of competition and the ability to pass costs through to along the supply chain and to consumers. In the majority of cases, no significant impacts on prices are expected as a result of the policy options.
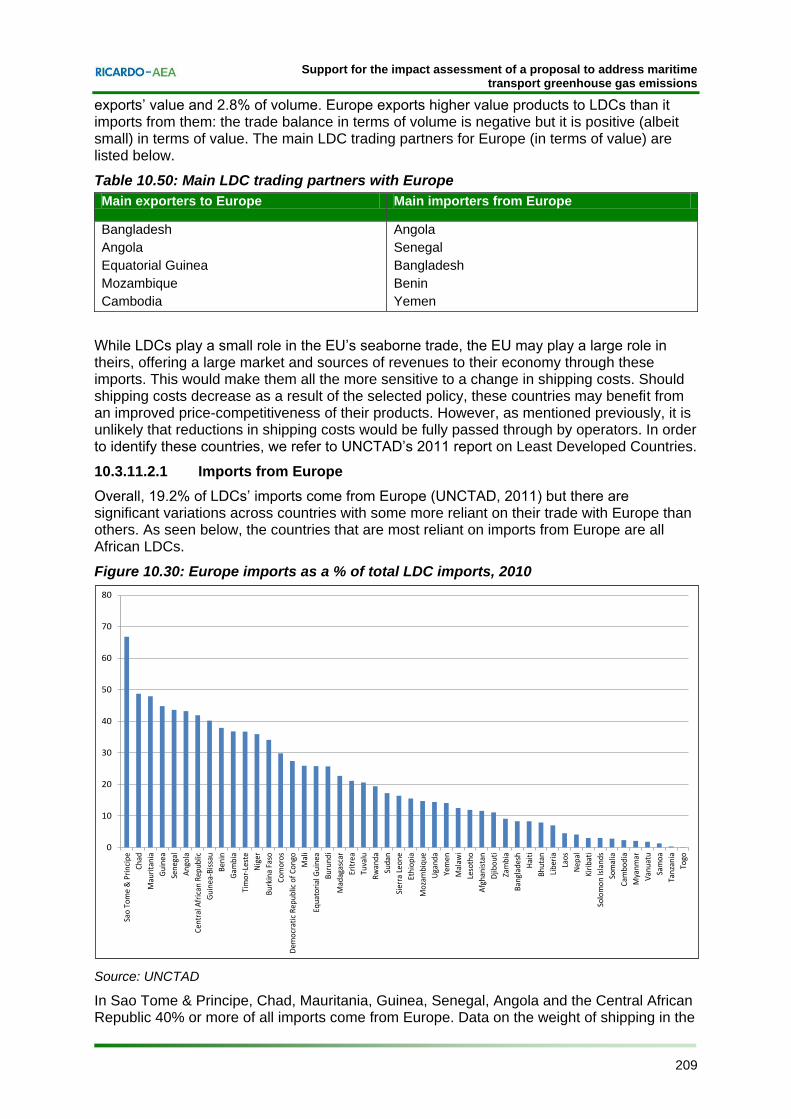
in 2010, least developed countries (LDCs) represented a very small proportion of EU seaborne imports (2% of the value and 2.9% of the total volume). They also accounted for 4.7% of extra-EU seaborne exports’ value and 2.8% of volume. While LDCs play a small role in the EU’s seaborne trade, the EU may play a large role in theirs, offering a large market and sources of revenues to their economy through these imports. This would make them all the more sensitive to a change in shipping costs. Bangladesh, Angola, Equatorial Guinea, Mozambique and Cambodia are the main LDC exporters to Europe, whilst Angola, Senegal, Bangladesh, Benin and Yemen and the main importers from Europe.
Support for the impact assessment of a proposal to address maritime transport greenhouse gas emissions
xiii Ref: Ricardo-AEA/R/ED56985/Issue Number 5
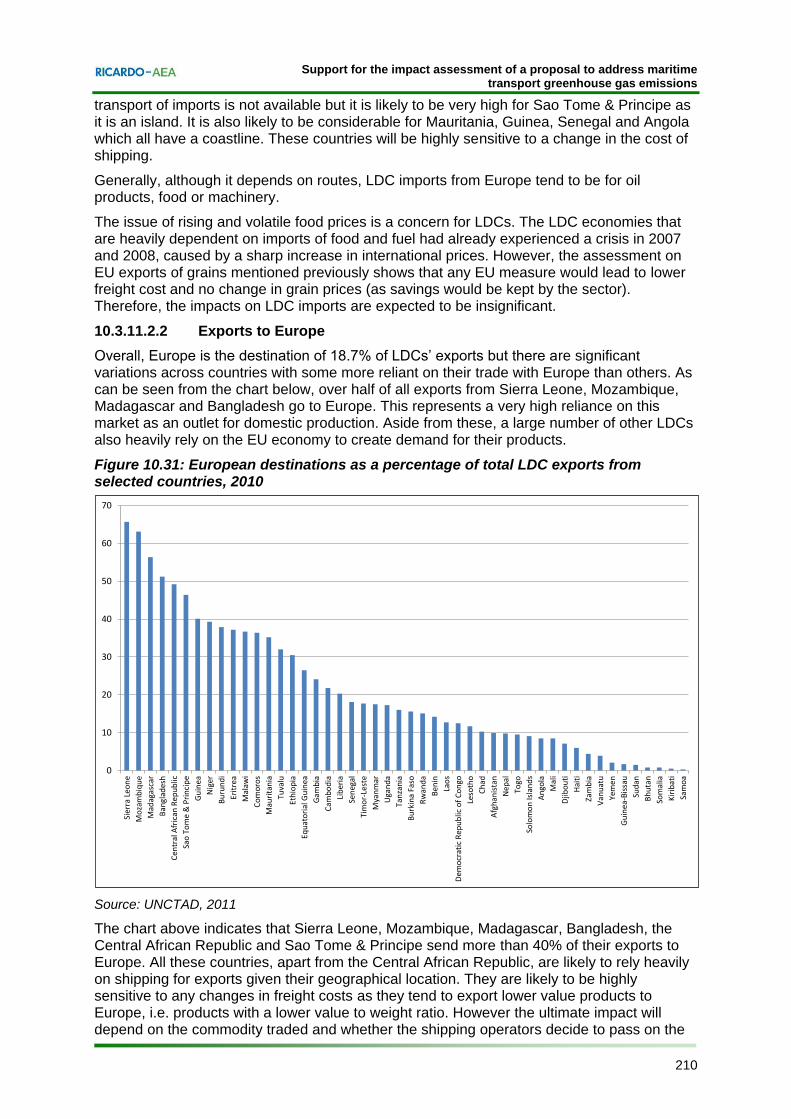
Generally, although it depends on routes, LDC imports from Europe tend to be for oil products, food or machinery. The issue of rising and volatile food prices is a concern for LDCs. The LDC economies that are heavily dependent on imports of food and fuel had already experienced a crisis in 2007 and 2008, caused by a sharp increase in international prices. However, the assessment on EU exports of grains mentioned previously shows that any EU measure would lead to lower freight cost and no change in grains prices (as savings would be kept by the sector). Therefore, the impacts on LDCs imports are expected to be insignificant. For LDC exports to Europe, those countries that send a high proportion of their exports to the EU are likely to be highly sensitive to any changes in freight costs. However the ultimate impact will depend on the commodity traded and whether the shipping operators decide to pass on the savings to their customers – in most cases the impacts for the commodities analysed earlier in this section were found to be insignificant.
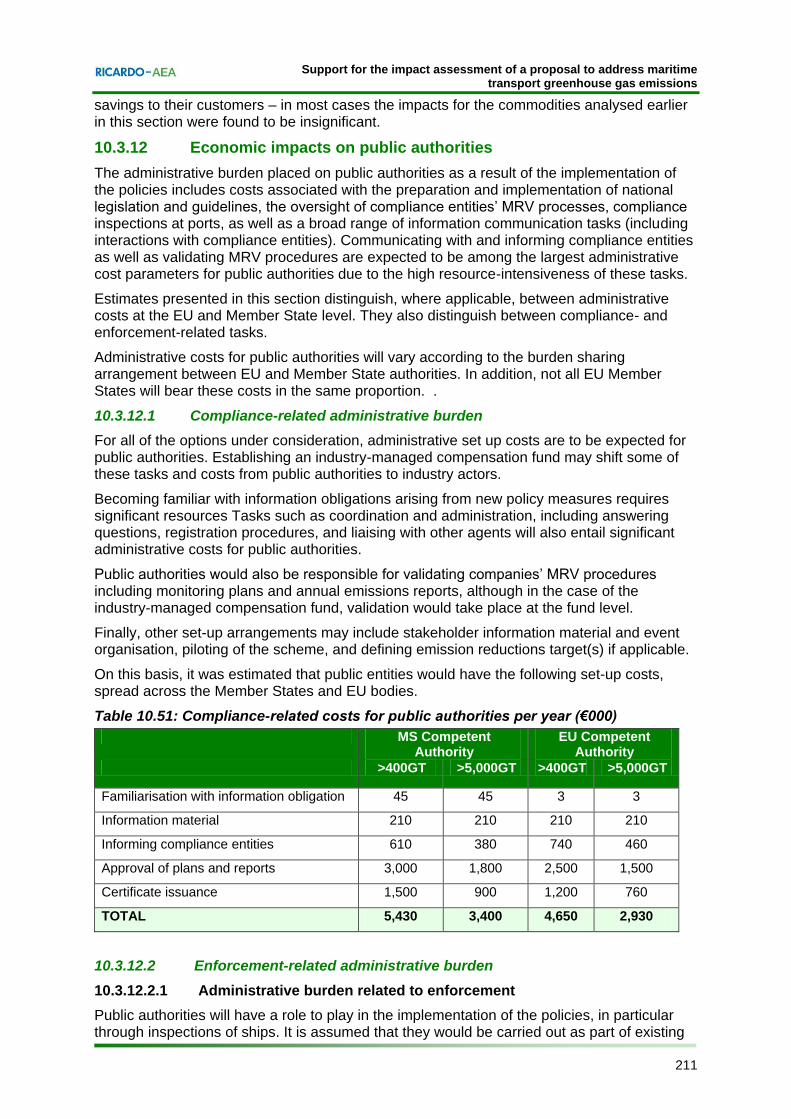
Economic impacts on public authorities The administrative burden placed on public authorities as a result of the implementation of the policies includes costs associated with the preparation and implementation of national legislation and guidelines, the oversight of compliance entities’ MRV processes, compliance inspections at ports, as well as a broad range of information communication tasks (including interactions with compliance entities). Administrative costs for public authorities will vary according to the burden sharing arrangement between EU and Member State authorities. In addition, not all EU Member States will bear these costs in the same proportion. A significant share of the administrative costs for public authorities would stem from the need to get acquainted with the policy, understand its implications and follow up on any updates. Inspections and enforcement have also been identified as an important cost parameter. The order of magnitude of costs is unlikely to vary significantly across the different policy options.
Social impacts
The shipping sector employs a significant number of people in various sub-sectors. Total maritime employment in the EU is estimated at approximately 250,000. In addition to seafarers, there are a number of sectors that are directly linked to the shipping industry, such as shipping services, port services, maritime works, shipbuilding, ship management and brokerage, marine equipment, fisheries and seafood processing, recreational boating and offshore oil, gas and wind energy industries. Banking and financial services, research and development, education and marine equipment are sectors that are indirectly linked to the maritime sector.
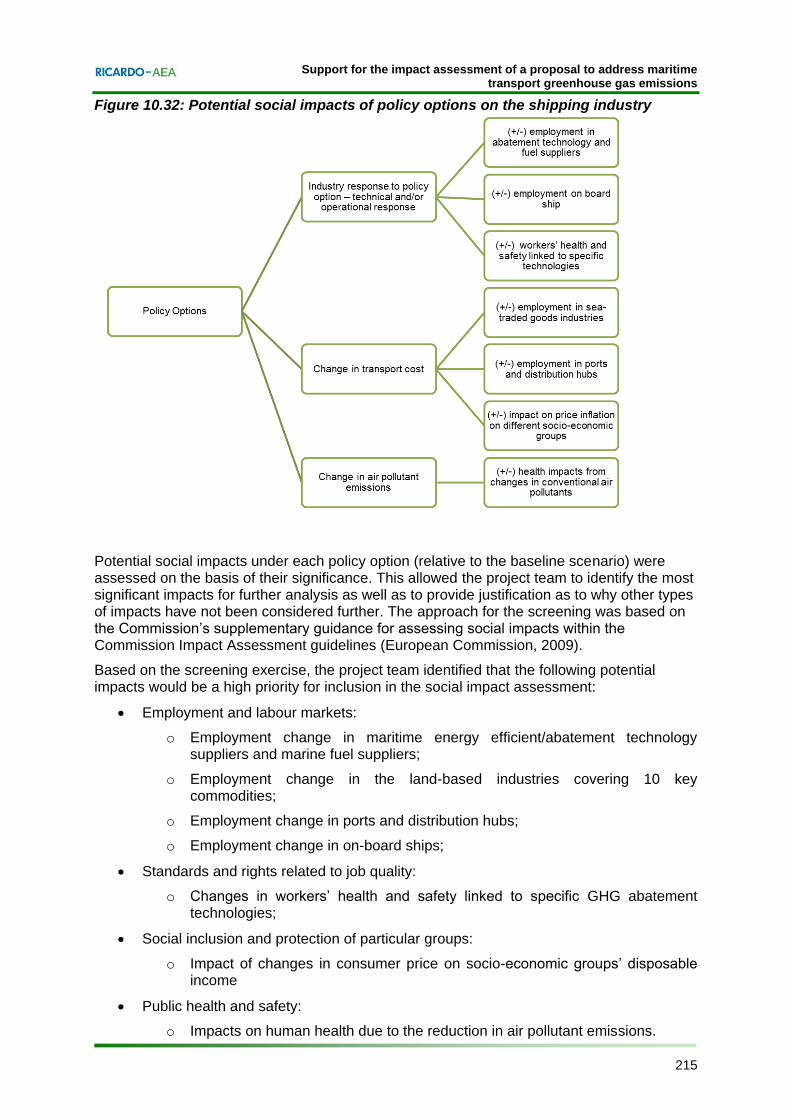
The policy options for reducing GHG emissions from shipping could place an additional cost on the operation of the sector, and this may have repercussions on the whole spectrum of economic agents including the raw material suppliers, manufacturers and service providers, the maritime transport industry, retailers and consumers. A screening exercise was used to identify the potential high priority impacts for inclusion in the social impact assessment. These were as follows:
Employment and labour markets:
o Employment change in maritime energy efficient/abatement technology suppliers and marine fuel suppliers;
o Employment change in the land-based industries covering 10 key commodities;
o Employment change in ports and distribution hubs;
o Employment change in on-board ships;
Standards and rights related to job quality:
Support for the impact assessment of a proposal to address maritime transport greenhouse gas emissions
xiv Ref: Ricardo-AEA/R/ED56985/Issue Number 5
o Changes in workers’ health and safety linked to specific GHG abatement technologies;
Social inclusion and protection of particular groups:
o Impact of changes in consumer price on socio-economic groups’ disposable income
Public health and safety:
o Impacts on human health due to the reduction in air pollutant emissions.
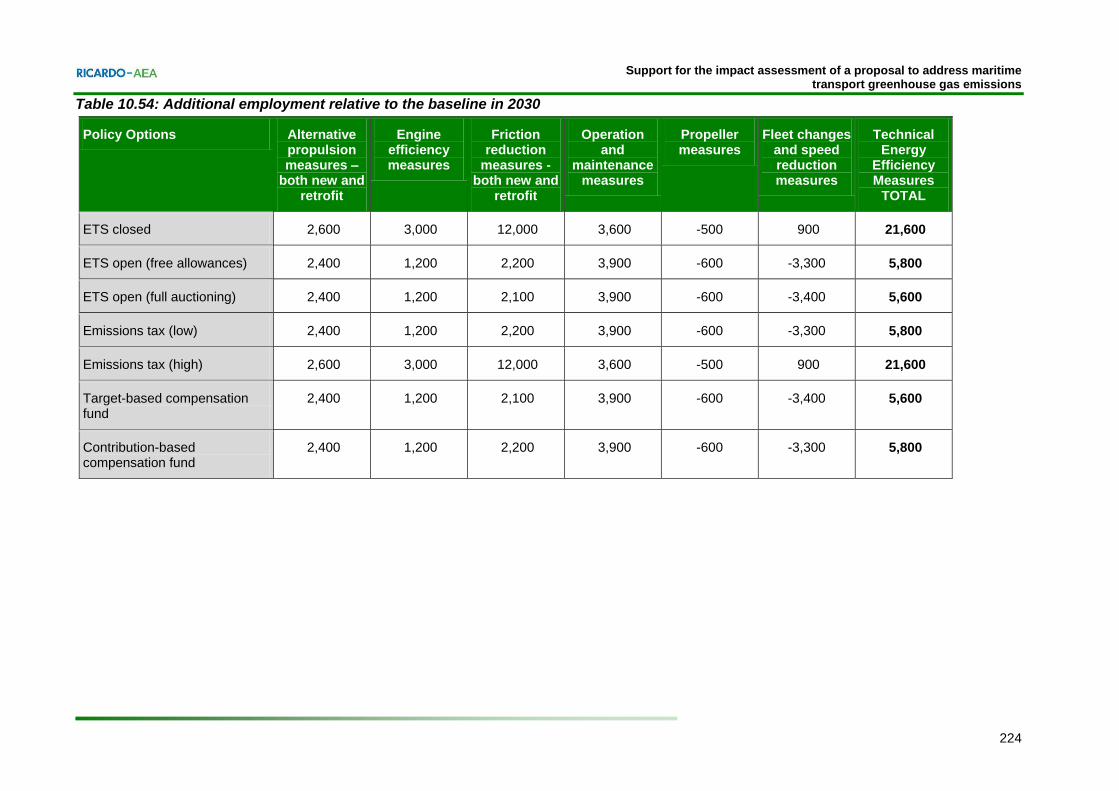
Employment change in the maritime sector Policy options which increase expenditure on energy efficiency measures, new ships and engines will contribute to the growth of the global market for these products and companies operating in the EU will benefit as the markets grow. There is evidence that some of the policy options could create the necessary conditions (i.e. regulations that are strict enough) to stimulate the development and wide-scale adoption of new technologies.
The key evidence for policy options stimulating innovation, market development and ultimately employment is as follows:
All policy options increase revenue for the suppliers of energy efficiency measures;
Certain policy options require significantly larger increases in investment, particularly in the early years, in the measures where the market is least developed. Suppliers of technologies which are at an early stage of development are more likely to realise first-mover advantages from early investment;
There is evidence that EU companies have a competitive advantage in new, more specific technology measures and are therefore more likely to benefit from growth in these markets.
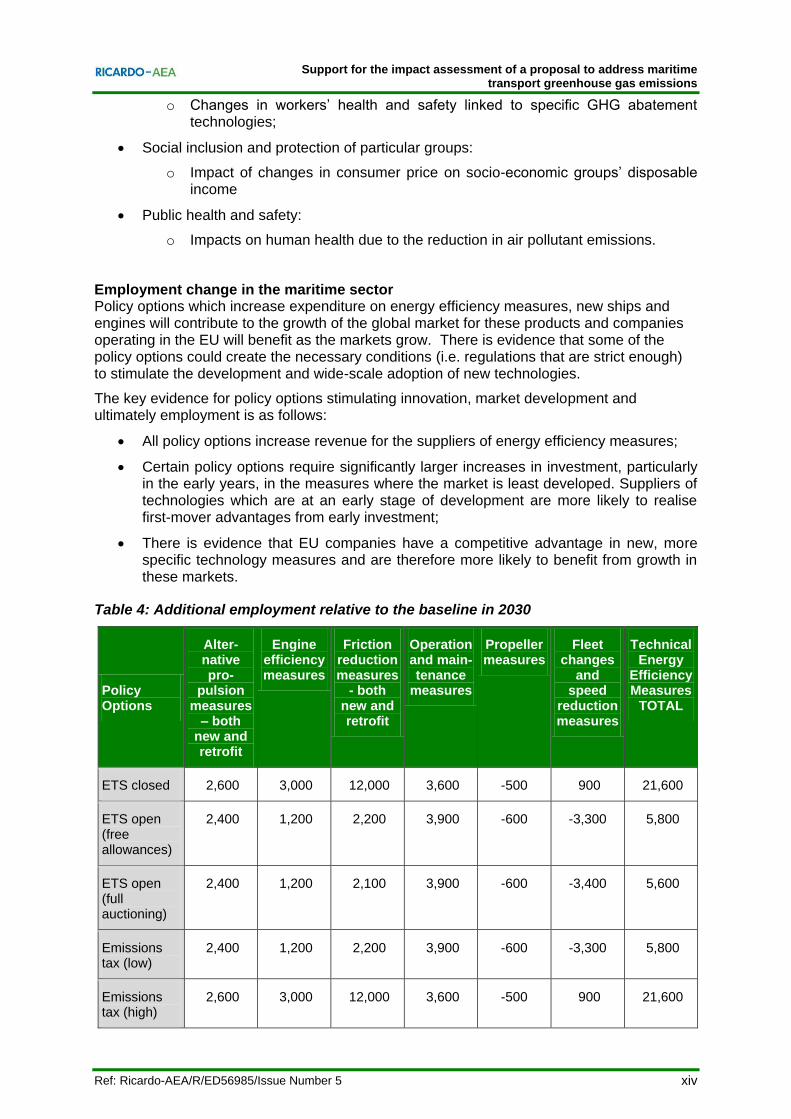
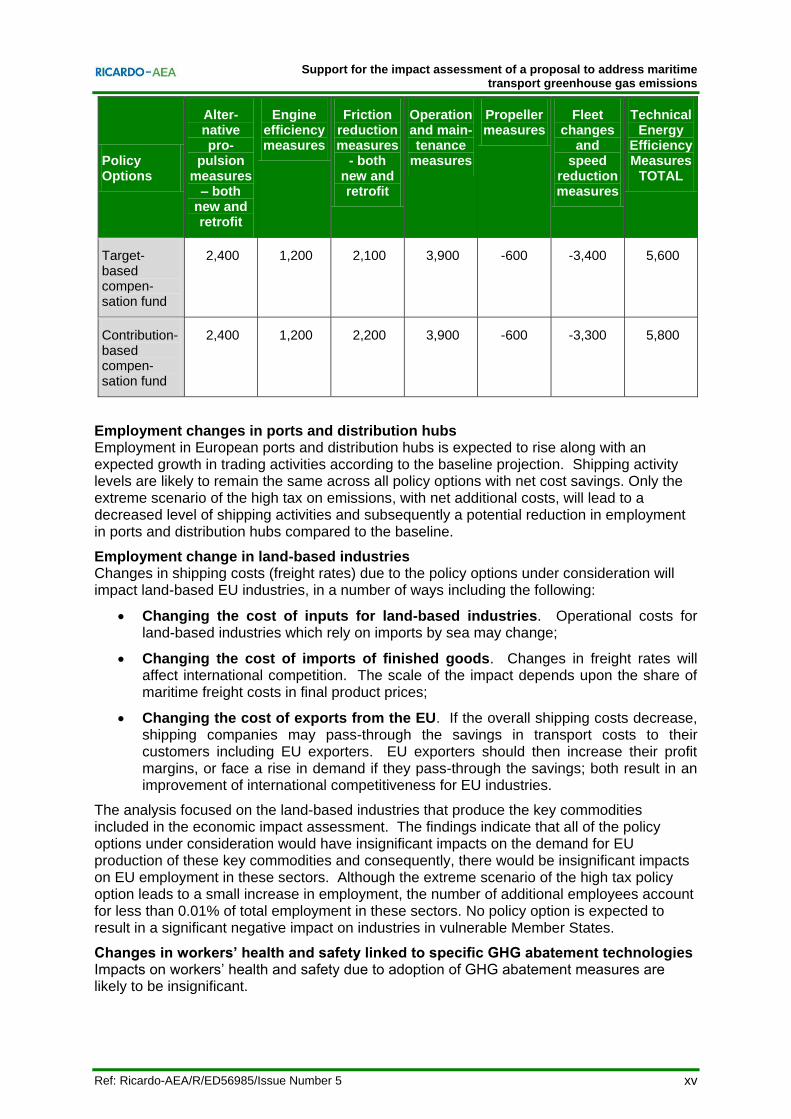
Table 4: Additional employment relative to the baseline in 2030
Support for the impact assessment of a proposal to address maritime transport greenhouse gas emissions
xv Ref: Ricardo-AEA/R/ED56985/Issue Number 5
Policy Options
Alter-native pro-
pulsion measures
– both new and retrofit
Engine efficiency measures
Friction reduction measures
- both new and retrofit
Operation and main-tenance
measures
Propeller measures
Fleet changes
and speed
reduction measures
Technical Energy
Efficiency Measures
TOTAL
Target-based compen-sation fund
2,400 1,200 2,100 3,900 -600 -3,400 5,600
Contribution-based compen-sation fund
2,400 1,200 2,200 3,900 -600 -3,300 5,800
Employment changes in ports and distribution hubs Employment in European ports and distribution hubs is expected to rise along with an expected growth in trading activities according to the baseline projection. Shipping activity levels are likely to remain the same across all policy options with net cost savings. Only the extreme scenario of the high tax on emissions, with net additional costs, will lead to a decreased level of shipping activities and subsequently a potential reduction in employment in ports and distribution hubs compared to the baseline.
Employment change in land-based industries Changes in shipping costs (freight rates) due to the policy options under consideration will impact land-based EU industries, in a number of ways including the following:
Changing the cost of inputs for land-based industries. Operational costs for land-based industries which rely on imports by sea may change;
Changing the cost of imports of finished goods. Changes in freight rates will affect international competition. The scale of the impact depends upon the share of maritime freight costs in final product prices;
Changing the cost of exports from the EU. If the overall shipping costs decrease, shipping companies may pass-through the savings in transport costs to their customers including EU exporters. EU exporters should then increase their profit margins, or face a rise in demand if they pass-through the savings; both result in an improvement of international competitiveness for EU industries.
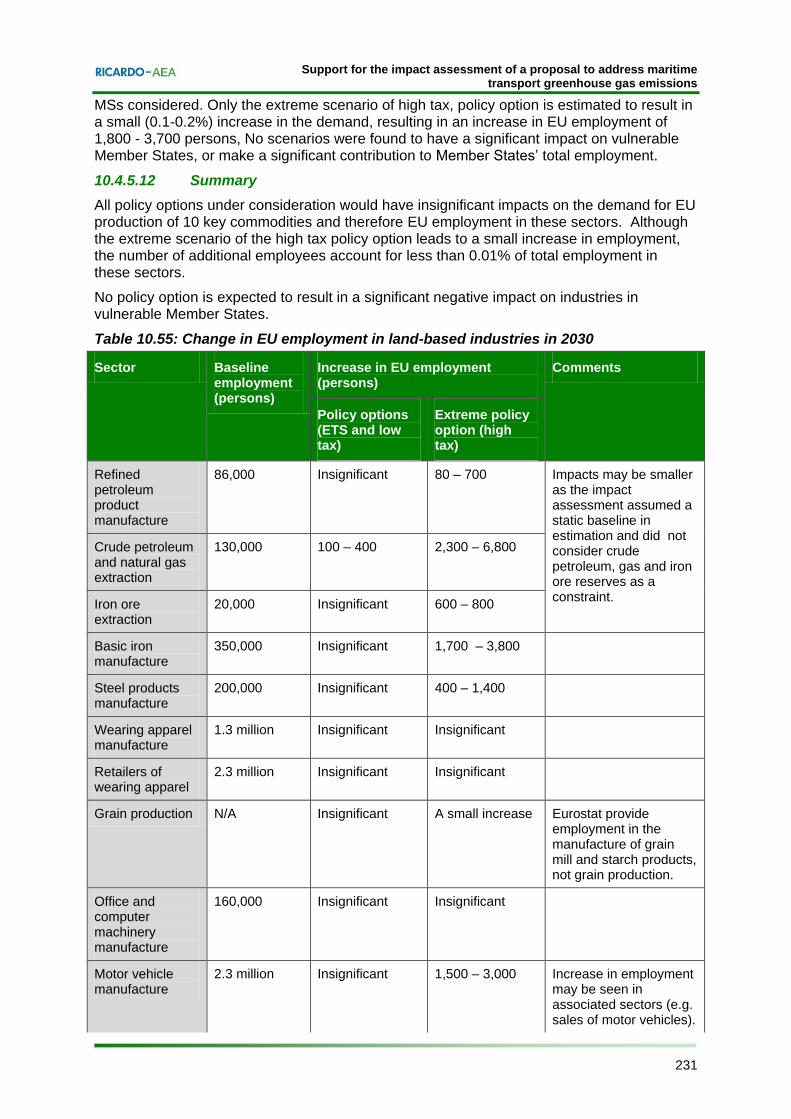
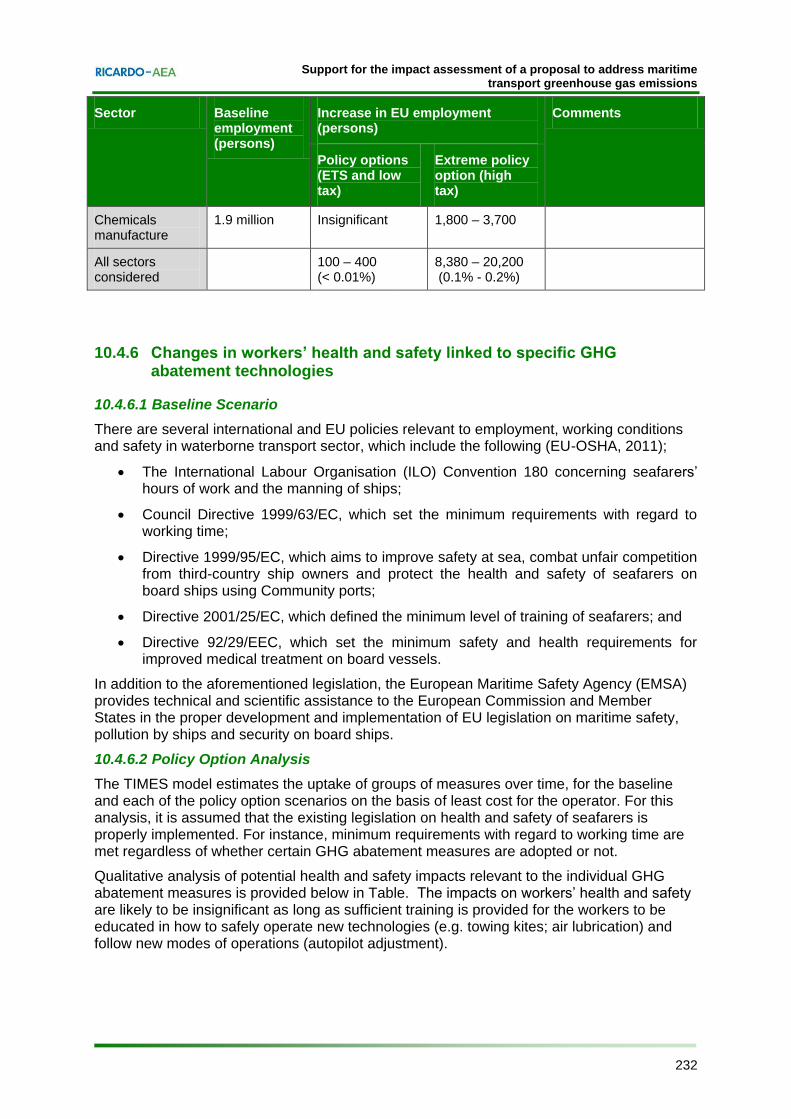
The analysis focused on the land-based industries that produce the key commodities included in the economic impact assessment. The findings indicate that all of the policy options under consideration would have insignificant impacts on the demand for EU production of these key commodities and consequently, there would be insignificant impacts on EU employment in these sectors. Although the extreme scenario of the high tax policy option leads to a small increase in employment, the number of additional employees account for less than 0.01% of total employment in these sectors. No policy option is expected to result in a significant negative impact on industries in vulnerable Member States.
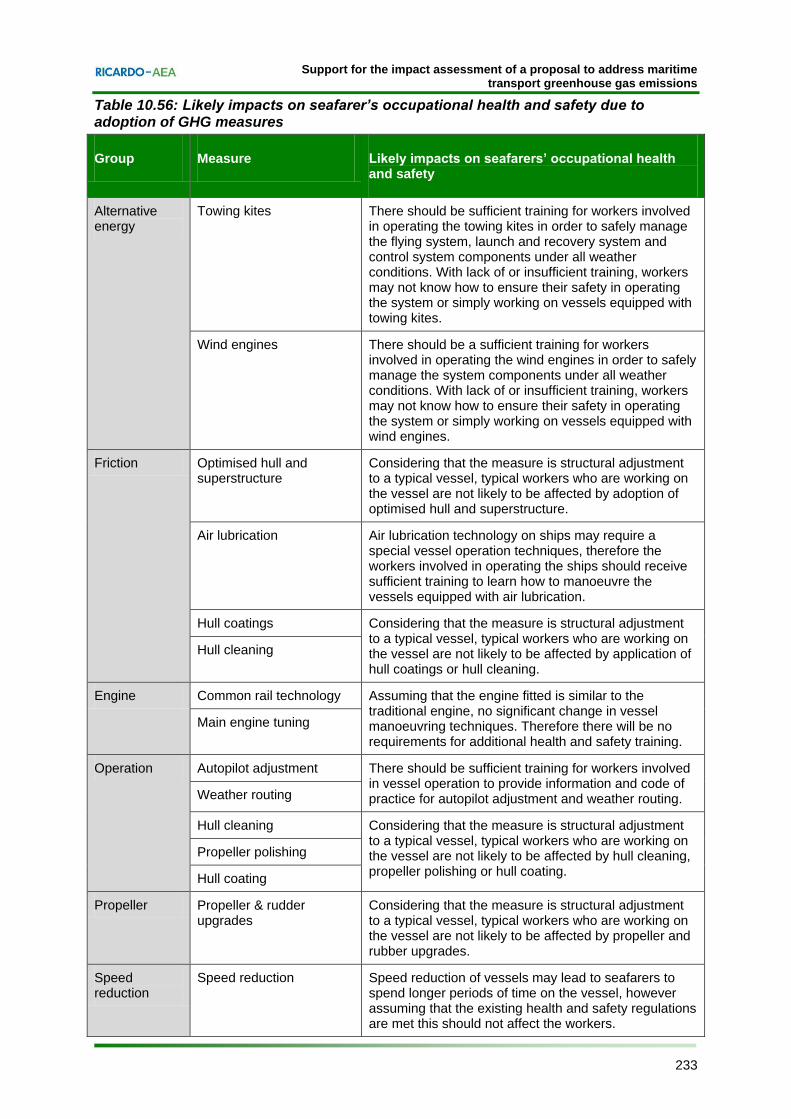
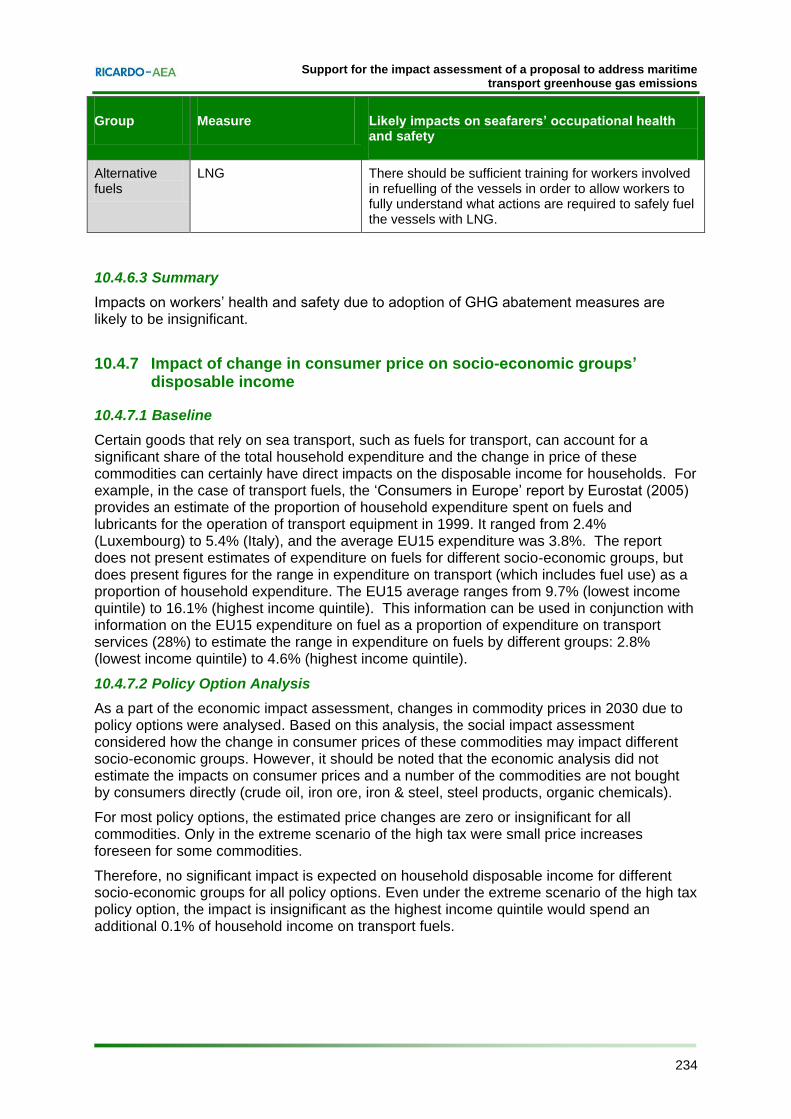
Changes in workers’ health and safety linked to specific GHG abatement technologies Impacts on workers’ health and safety due to adoption of GHG abatement measures are likely to be insignificant.
Support for the impact assessment of a proposal to address maritime transport greenhouse gas emissions
xvi Ref: Ricardo-AEA/R/ED56985/Issue Number 5
Impact of change in consumer prices on socio-economic groups’ disposable income For most policy options, the estimated price changes are zero or insignificant for all commodities. Only in the extreme scenario of the high tax, were small price increases for some commodities foreseen. Therefore, no significant impact is expected on household disposable income for different socio-economic groups for all policy options. Even under the extreme scenario of the high tax policy option, the impact is insignificant as the highest income quintile would spend an additional 0.1% of household income on transport fuels.
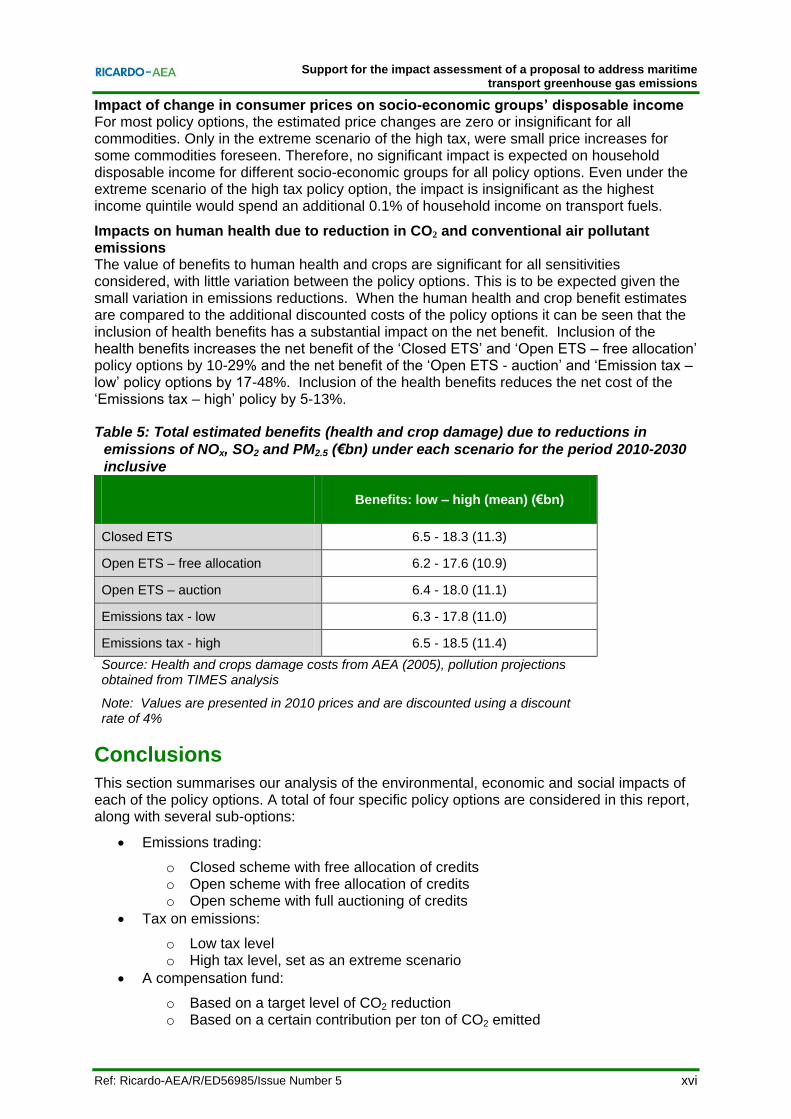
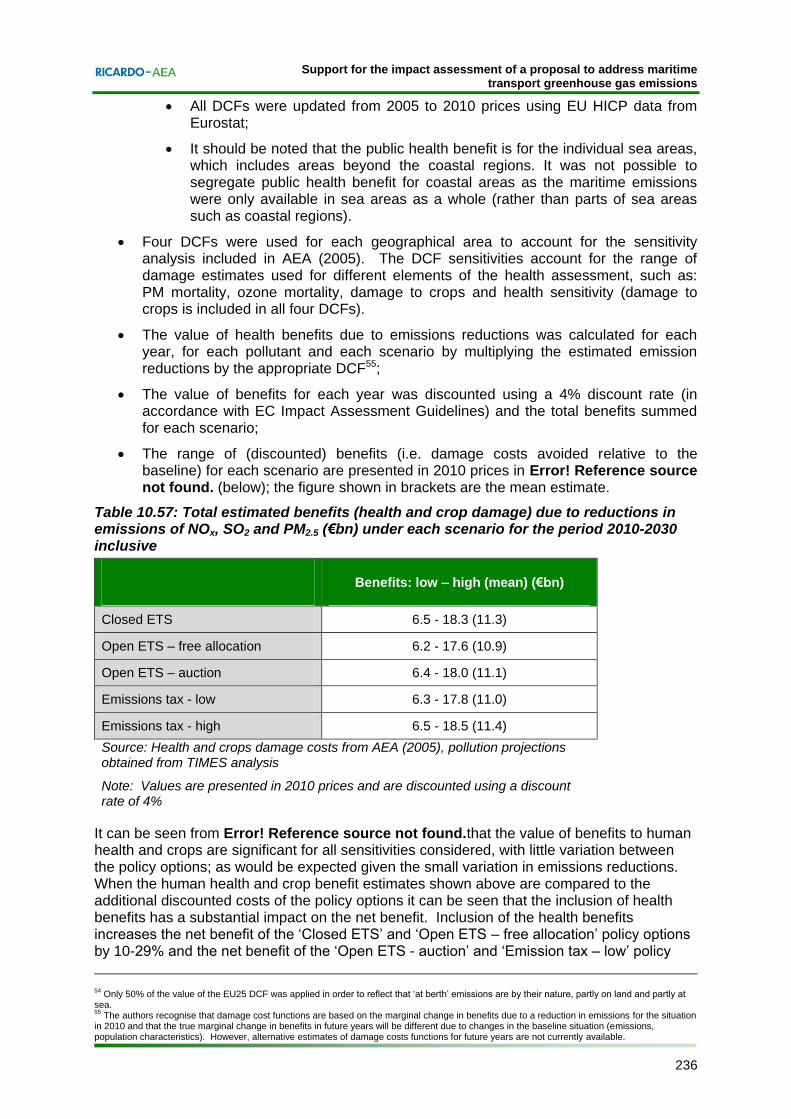
Impacts on human health due to reduction in CO2 and conventional air pollutant emissions The value of benefits to human health and crops are significant for all sensitivities considered, with little variation between the policy options. This is to be expected given the small variation in emissions reductions. When the human health and crop benefit estimates are compared to the additional discounted costs of the policy options it can be seen that the inclusion of health benefits has a substantial impact on the net benefit. Inclusion of the health benefits increases the net benefit of the ‘Closed ETS’ and ‘Open ETS – free allocation’ policy options by 10-29% and the net benefit of the ‘Open ETS - auction’ and ‘Emission tax – low’ policy options by 17-48%. Inclusion of the health benefits reduces the net cost of the ‘Emissions tax – high’ policy by 5-13%.
Table 5: Total estimated benefits (health and crop damage) due to reductions in
emissions of NOx, SO2 and PM2.5 (€bn) under each scenario for the period 2010-2030
inclusive
Benefits: low – high (mean) (€bn)
Closed ETS 6.5 - 18.3 (11.3)
Open ETS – free allocation 6.2 - 17.6 (10.9)
Open ETS – auction 6.4 - 18.0 (11.1)
Emissions tax - low 6.3 - 17.8 (11.0)
Emissions tax - high 6.5 - 18.5 (11.4)
Source: Health and crops damage costs from AEA (2005), pollution projections obtained from TIMES analysis
Note: Values are presented in 2010 prices and are discounted using a discount rate of 4%
Conclusions
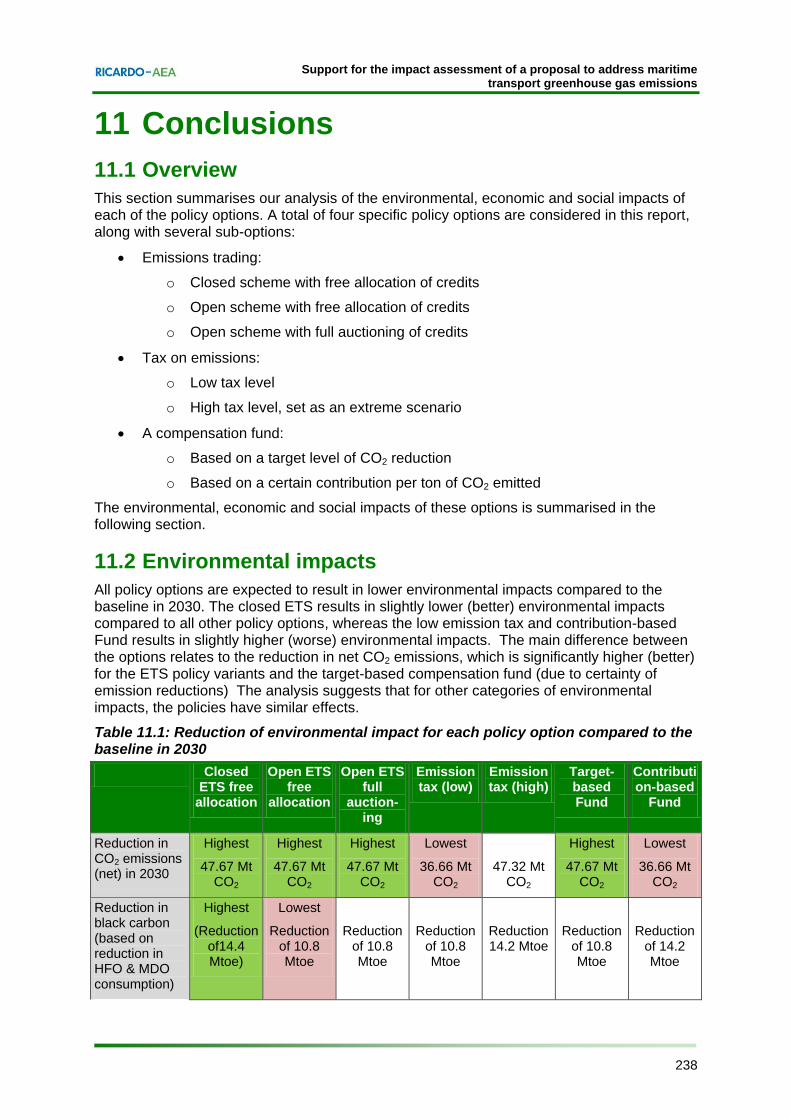
This section summarises our analysis of the environmental, economic and social impacts of each of the policy options. A total of four specific policy options are considered in this report, along with several sub-options:
Emissions trading:
o Closed scheme with free allocation of credits o Open scheme with free allocation of credits o Open scheme with full auctioning of credits
Tax on emissions:
o Low tax level o High tax level, set as an extreme scenario
A compensation fund:
o Based on a target level of CO2 reduction o Based on a certain contribution per ton of CO2 emitted
Support for the impact assessment of a proposal to address maritime transport greenhouse gas emissions
xvii Ref: Ricardo-AEA/R/ED56985/Issue Number 5
A summary of the key findings from the assessment of environmental, economic and social impacts is presented below.
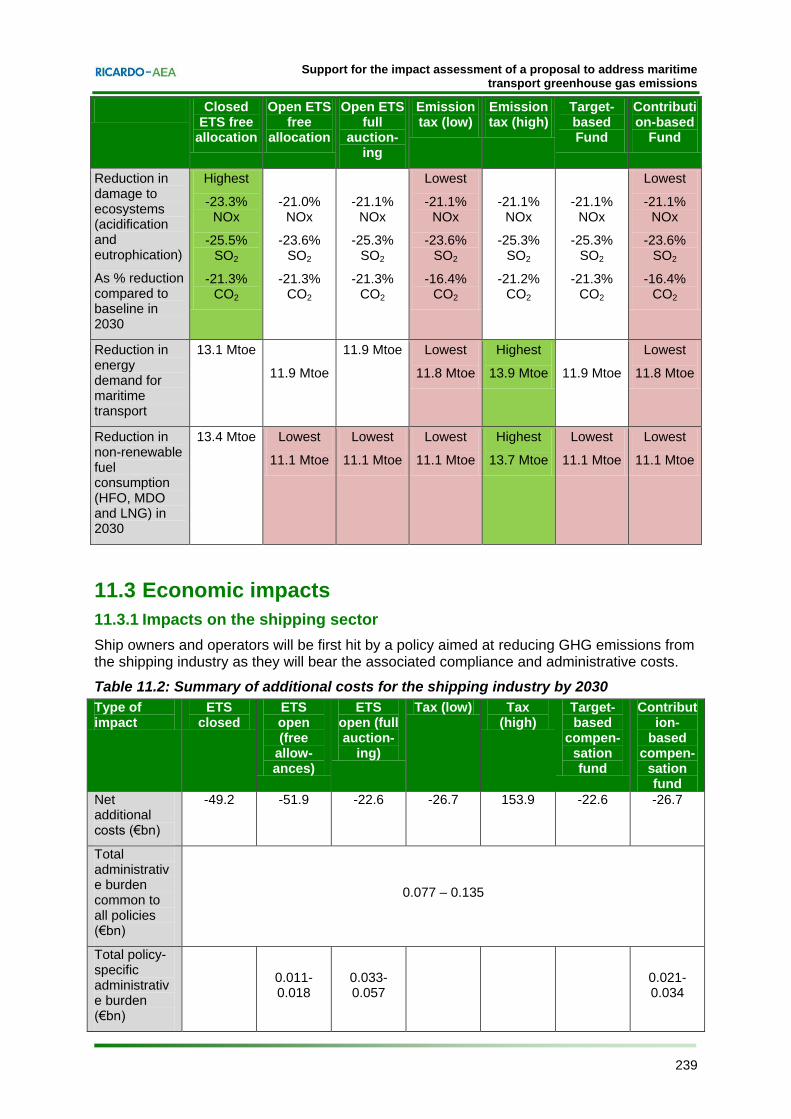
Environmental impacts All policy options are expected to result in lower environmental impacts compared to the baseline in 2030. The closed ETS results in slightly lower (better) environmental impacts compared to all other policy options, whereas the low emission tax and contribution-based Fund results in slightly higher (worse) environmental impacts. The main difference between the options relates to the reduction in net CO2 emissions, which is significantly higher (better) for the ETS policy variants and the target-based compensation fund (due to certainty of emission reductions) The analysis suggests that for other categories of environmental impacts, the policies have similar effects.
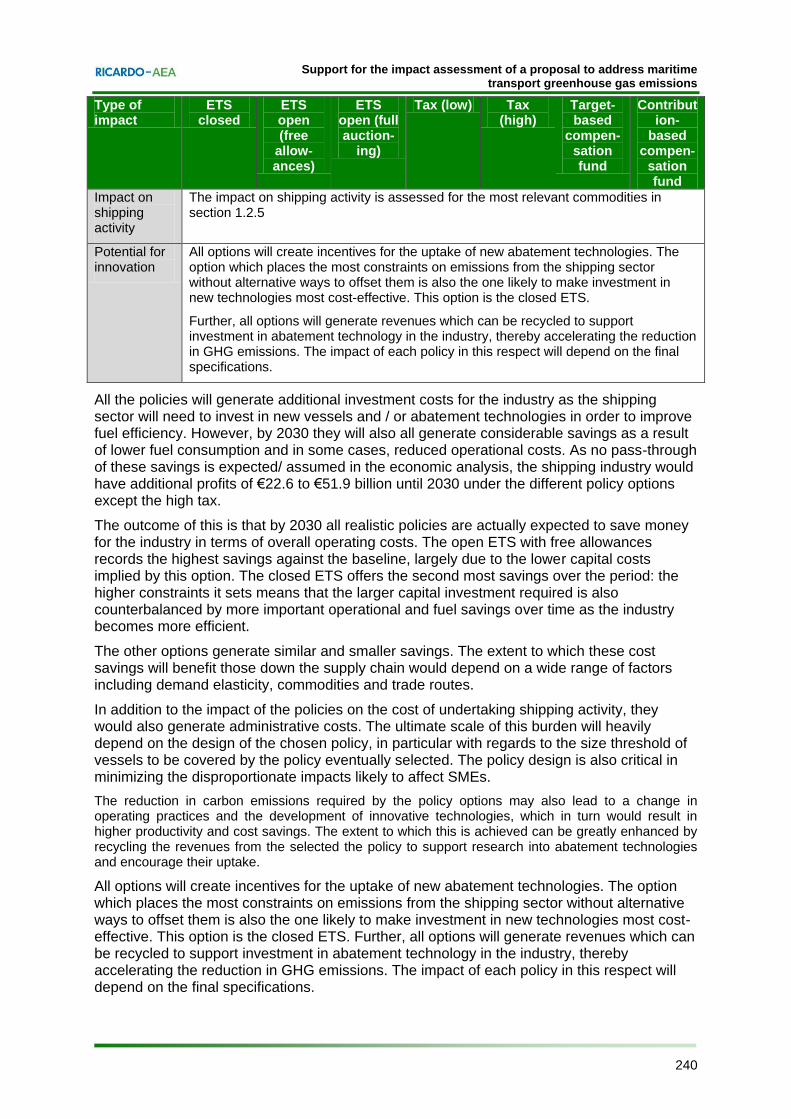
Economic impacts All the policies will generate additional investment costs for the industry as the shipping sector will need to invest in new vessels and / or abatement technologies in order to improve fuel efficiency. However, by 2030 they will also all generate considerable savings as a result of lower fuel consumption and in some cases, reduced operational costs. As no pass-through of these savings is expected/assumed in the economic analysis, the shipping industry would have additional profits of €22.6 to €51.9 billion until 2030 under the different policy options except the high tax.
The outcome of this is that by 2030 all realistic policies are actually expected to save money for the industry in terms of overall operating costs. The open ETS with free allowances records the highest savings against the baseline, largely due to the lower capital costs implied by this option. The closed ETS offers the second most savings over the period: the higher constraints it sets means that the larger capital investment required is also counterbalanced by more important operational and fuel savings over time as the industry becomes more efficient. The other options generate similar and smaller savings. The extent to which these cost savings will benefit those down the supply chain would depend on a wide range of factors including demand elasticity, commodities and trade routes.
All options will create incentives for the uptake of new abatement technologies. The option which places the most constraints on emissions from the shipping sector without alternative ways to offset them is also the one likely to make investment in new technologies most cost-effective. This option is the closed ETS. Further, all options will generate revenues which can be recycled to support investment in abatement technology in the industry, thereby accelerating the reduction in GHG emissions. The impact of each policy in this respect will depend on the final specifications.
The analysis of selected commodities suggests that while policies are unlikely to increase or decrease the price of commodities, and therefore change the consumer choices, the decrease or increase of freight rates may have an impact on the profit margin of the ship operator or trigger some avoidance of the scheme. To summarise the findings from this analysis, the realistic policy options can be split into two groups:
The first group comprises of the closed ETS and open ETS with free allowances. These two options consistently lead to lower freight rates than the baseline. In most cases those savings are retained by the industry and there is no impact on EU producers or consumers. Where increases in freight occur they are smallest under these two options.
The second group is composed of: the open ETS with full auctioning and the target-based fund which uses the same modelling approach; the low emission tax and the compensation-based fund which follows the same model. The effects of these four options tend to be broadly similar.
Support for the impact assessment of a proposal to address maritime transport greenhouse gas emissions
xviii Ref: Ricardo-AEA/R/ED56985/Issue Number 5
Aside from the impacts at EU level, this report also considers how they will be distributed geographically. The countries and regions most sensitive are those which rely most on shipping for their international trade. As expected, these countries are mostly islands or countries with long coastlines. The most vulnerable of all are Ireland, Malta and the Netherlands.
Overall, the implementation of a policy to reduce GHG emissions from the shipping sector is expected to have broadly positive or negligible economic impacts through cost savings to the industry; the development and uptake of innovative technologies and more productive practices; and limited impacts on the trade of most commodities and the competitive position of Europe.
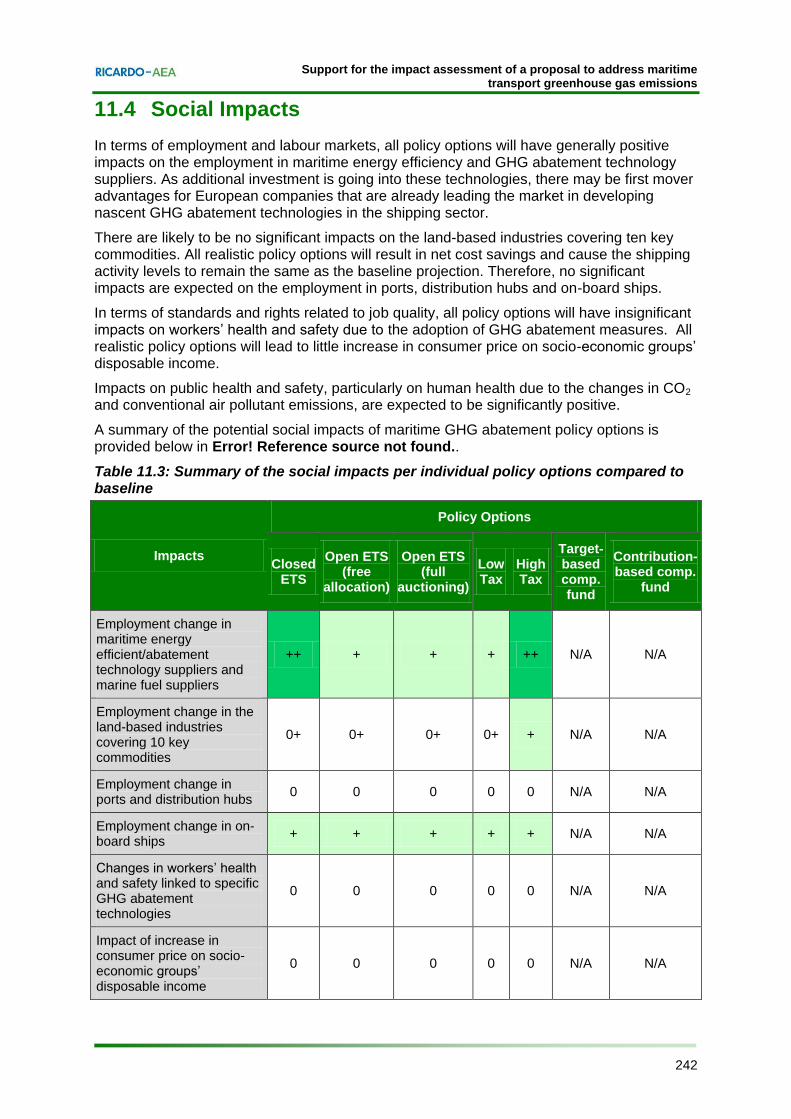
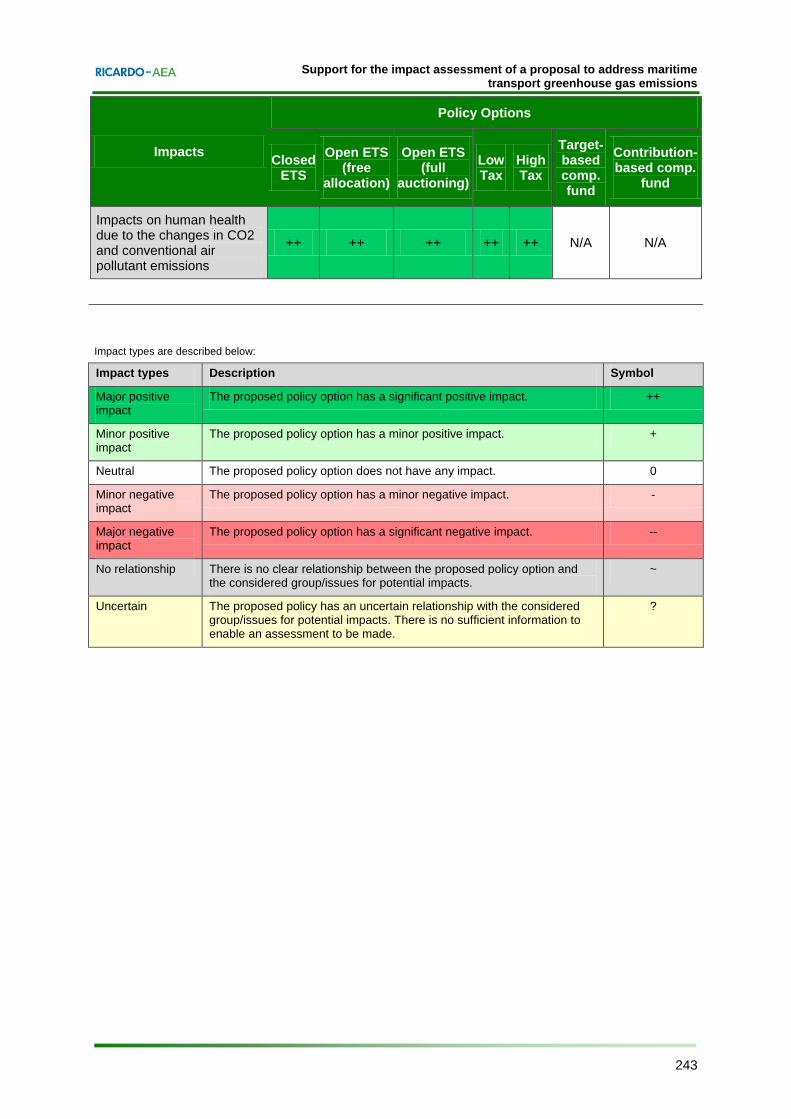
Social Impacts In terms of employment and labour markets, all policy options will have generally positive impacts on the employment in maritime energy efficiency and GHG abatement technology suppliers. As additional investment is going into these technologies, there may be first mover advantages for European companies that are already leading the market in developing nascent GHG abatement technologies in the shipping sector. There are likely to be no significant impacts on the land-based industries producing the key commodities assessed as part of this study. All realistic policy options will result in net cost savings and shipping activity levels will remain the same as in the baseline projection. Therefore, no significant impacts are expected on employment in ports, distribution hubs and on board ships.
Support for the impact assessment of a proposal to address maritime transport greenhouse gas emissions
xix Ref: Ricardo-AEA/R/ED56985/Issue Number 5
Table of contents
1 Introduction ................................................................................................................. 21 1.1 Nature and scale of the problem ......................................................................... 21 1.2 Policy background .............................................................................................. 24 1.3 Baseline scenario ............................................................................................... 29 1.4 The need for EU action ....................................................................................... 31
3 Legal feasibility of EU action to reduce GHG emissions from shipping ............... 34 3.1 Compatibility of proposed EU measures with EU law ......................................... 34 3.2 Compatibility of proposed EU measures with international law .......................... 35
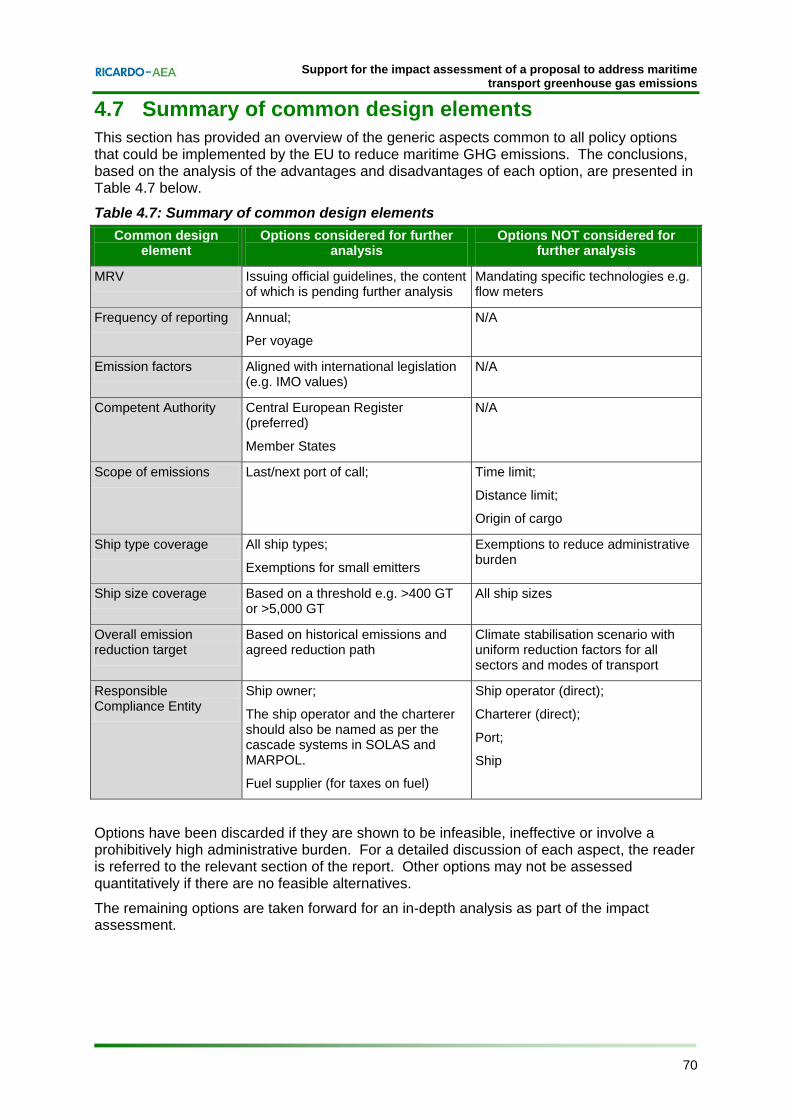
4 Design elements common to every policy option ................................................... 42 4.1 Overview ............................................................................................................. 42 4.2 Monitoring, reporting and verification of emissions ............................................. 42 4.3 Scope of emissions covered ............................................................................... 51 4.4 Overall emissions reduction target of the regulation ........................................... 62 4.5 Responsible Compliance Entity .......................................................................... 63 4.6 Enforcement ....................................................................................................... 69 4.7 Summary of common design elements .............................................................. 70
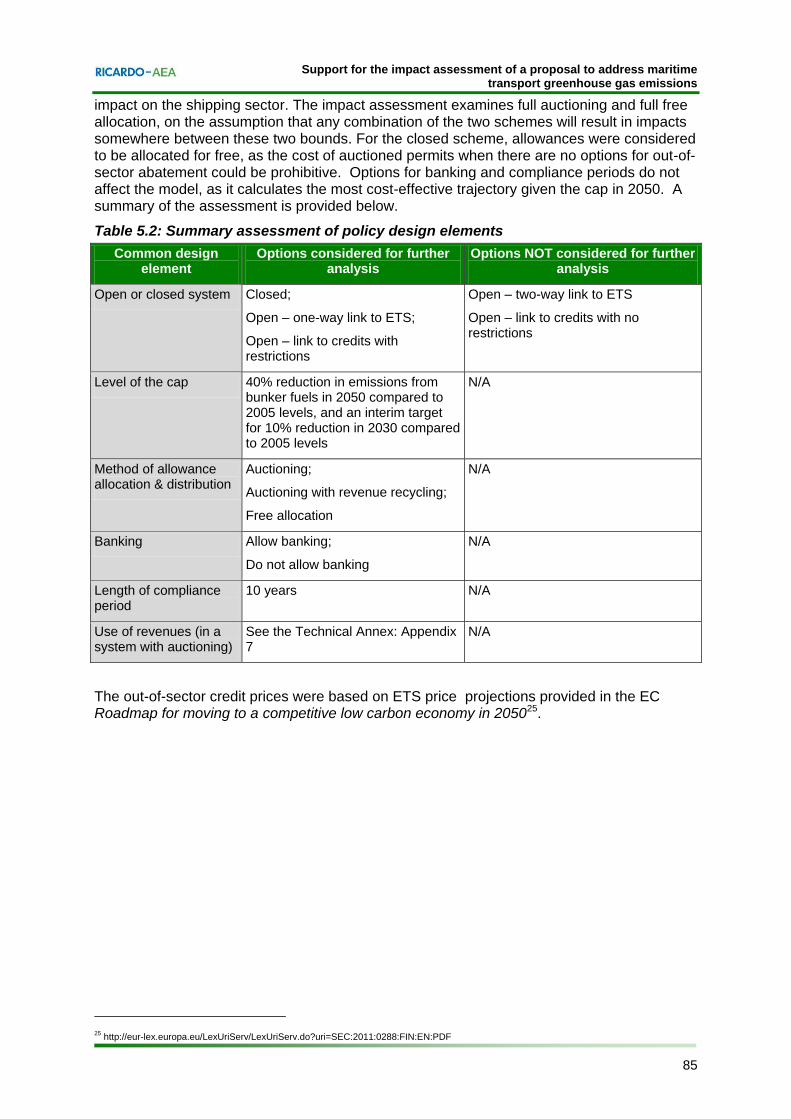
5 Policy option 1: Emissions trading scheme ............................................................. 71 5.1 Description of the policy option ........................................................................... 71 5.2 Design elements specific to an ETS ................................................................... 71 5.3 Legal assessment ............................................................................................... 83 5.4 Summary assessment of ETS design elements ................................................. 84
6 Policy option 2: Tax .................................................................................................... 86 6.1 Description of the policy option ........................................................................... 86 6.2 Design elements specific to a tax ....................................................................... 86 6.3 Legal assessment ............................................................................................... 89 6.4 Summary assessment of taxation policy design elements ................................. 91
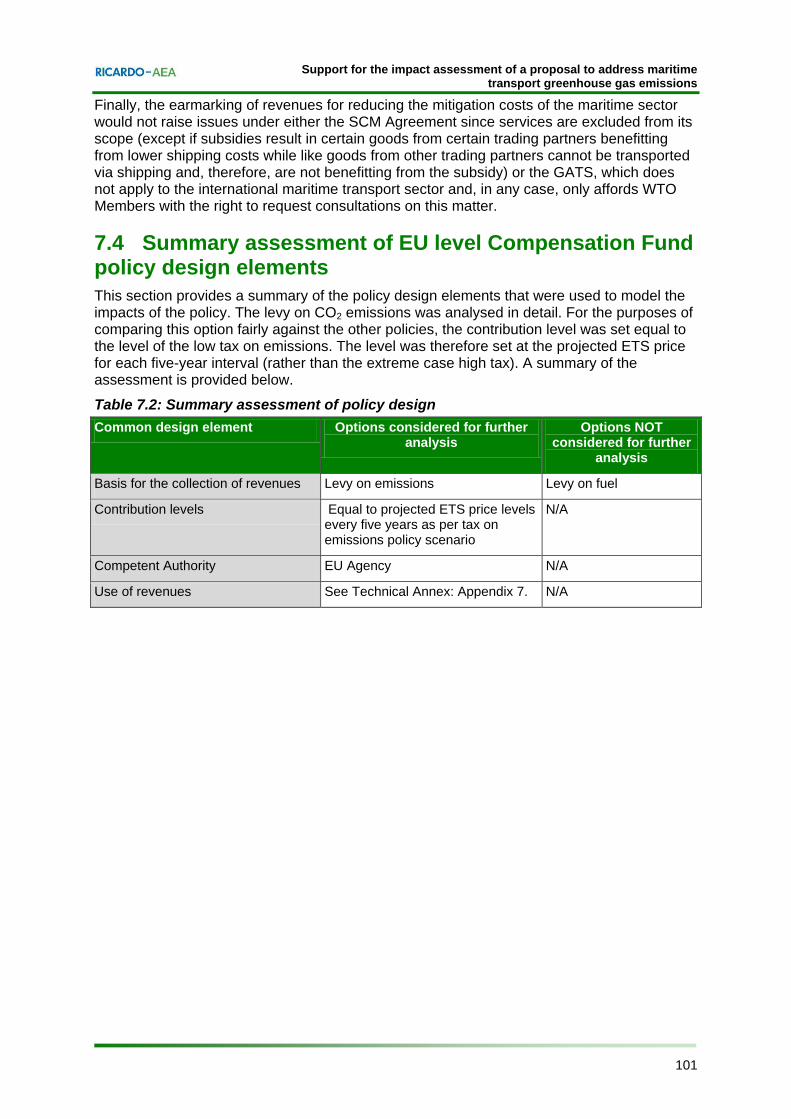
7 Policy option 3a: Mandatory EU-level compensation Fund .................................... 93 7.1 Description of the policy option ........................................................................... 93 7.2 Design elements specific to a mandatory EU-level compensation Fund ............ 95 7.3 Legal assessment ............................................................................................... 98 7.4 Summary assessment of EU level Compensation Fund policy design elements 101
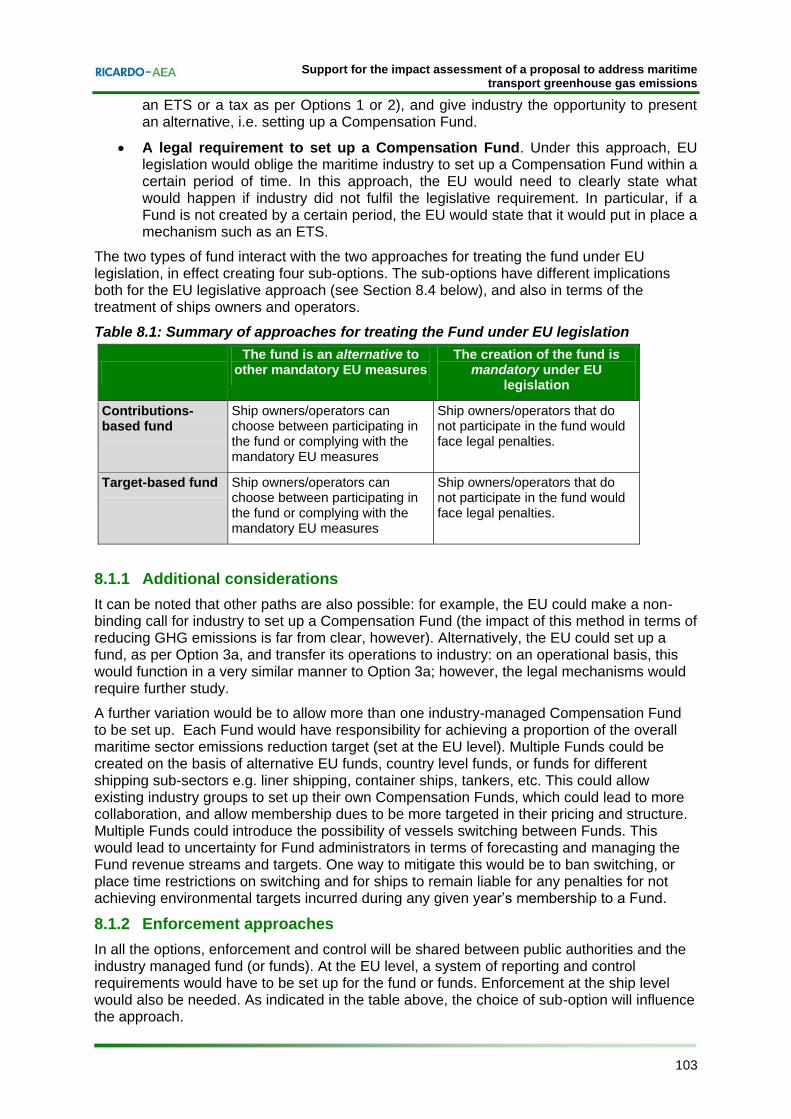
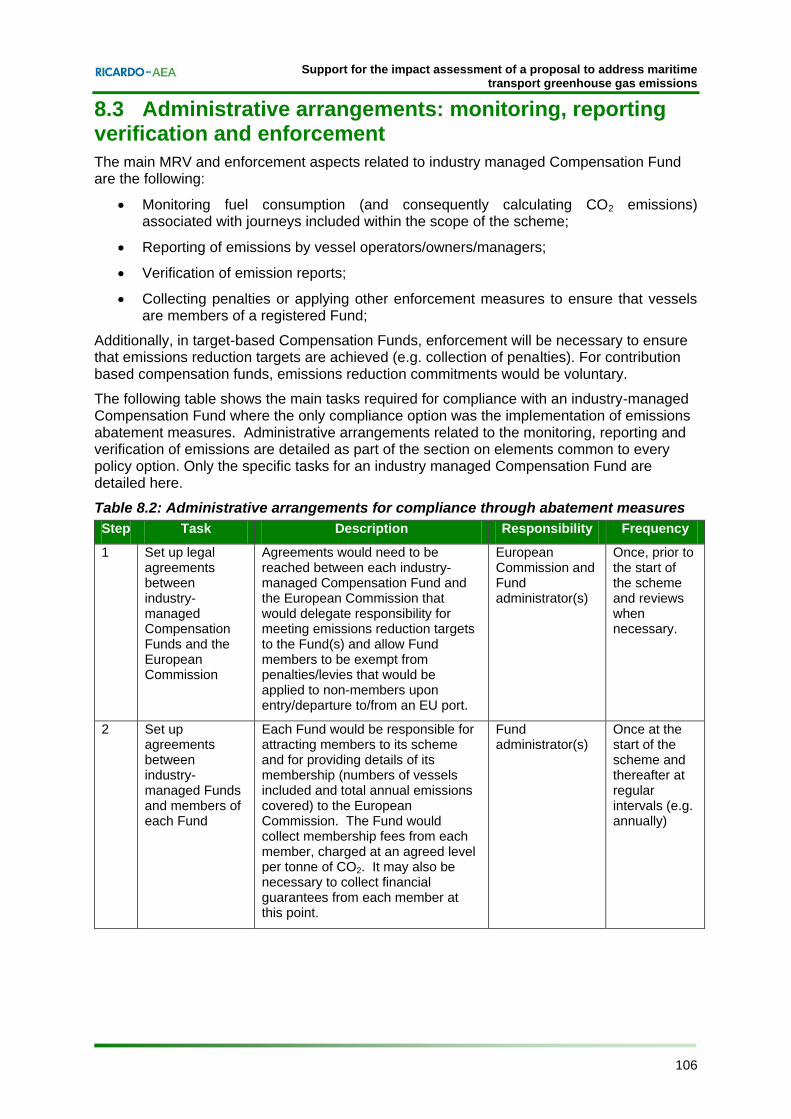
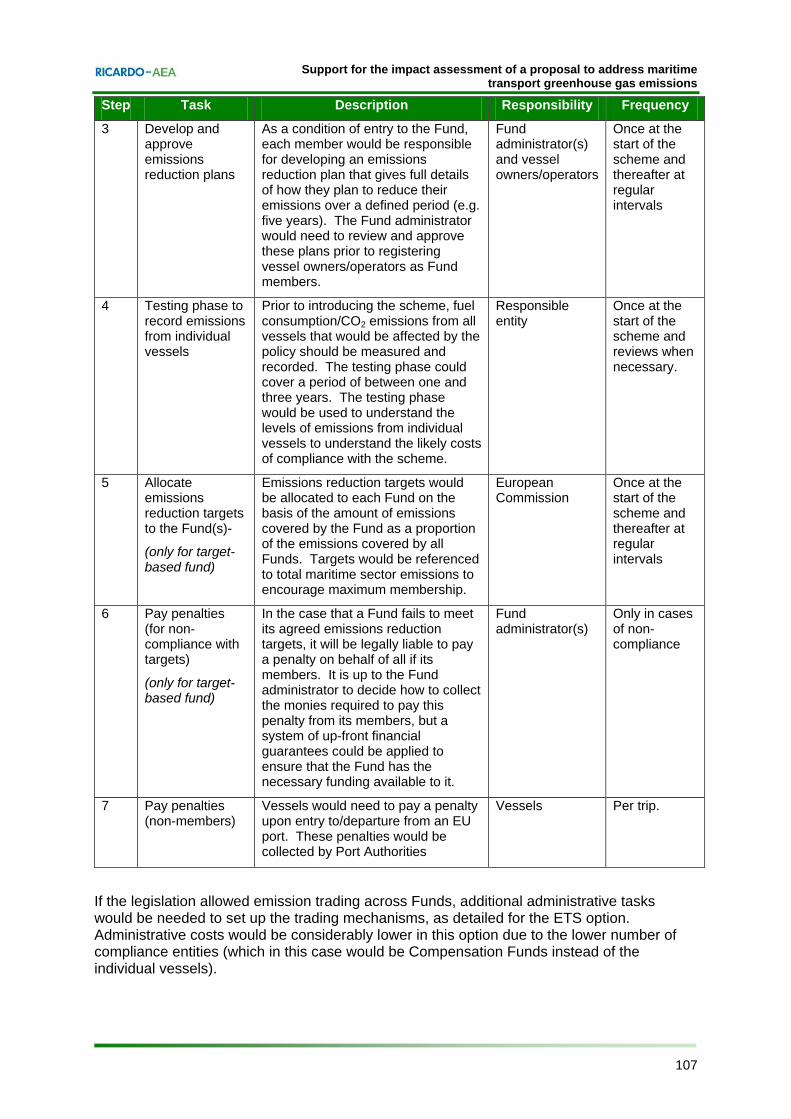
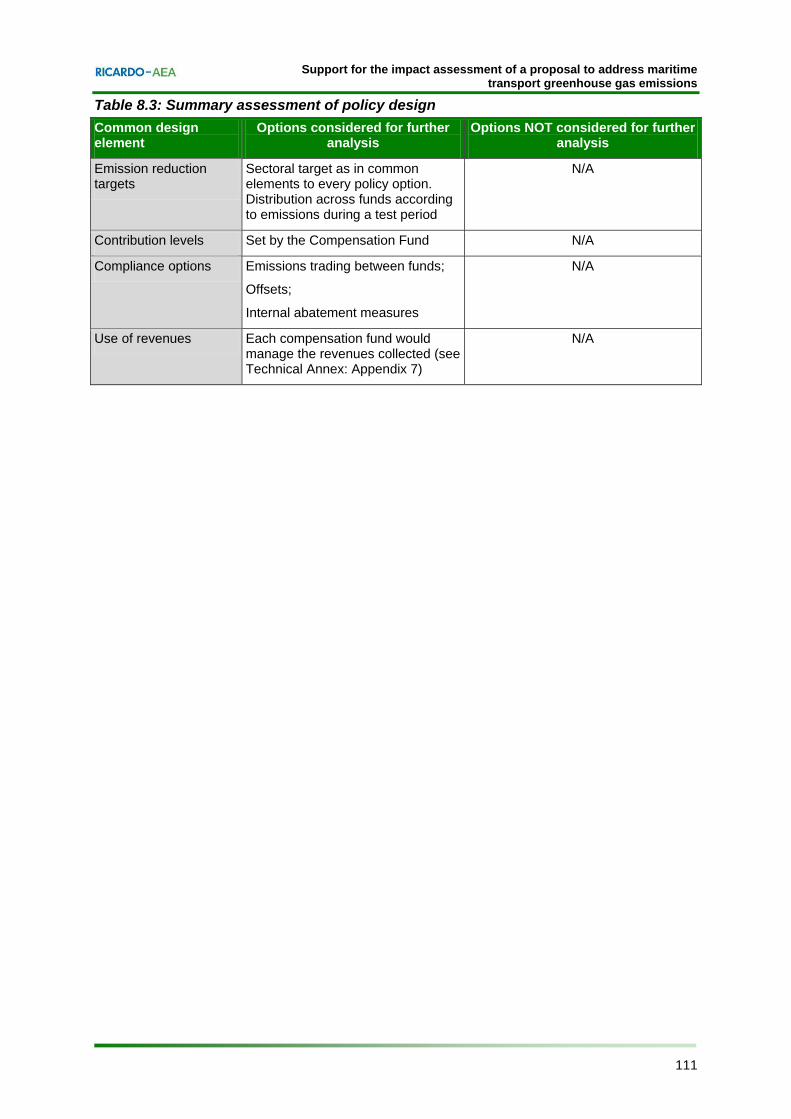
8 Policy option 3b: Industry managed compensation Fund .................................... 102 8.1 Description of the policy option ......................................................................... 102 8.2 Design elements specific to target-based industry managed compensation fund 104 8.3 Administrative arrangements: monitoring, reporting verification and enforcement 106 8.4 Legal assessment ............................................................................................. 108 8.5 Summary assessment of Industry-managed Compensation Fund policy design elements ..................................................................................................................... 110
9 Policy option 4: Mandatory emission reductions .................................................. 112 9.1 Description of the policy option ......................................................................... 112
Support for the impact assessment of a proposal to address maritime transport greenhouse gas emissions
xx Ref: Ricardo-AEA/R/ED56985/Issue Number 5
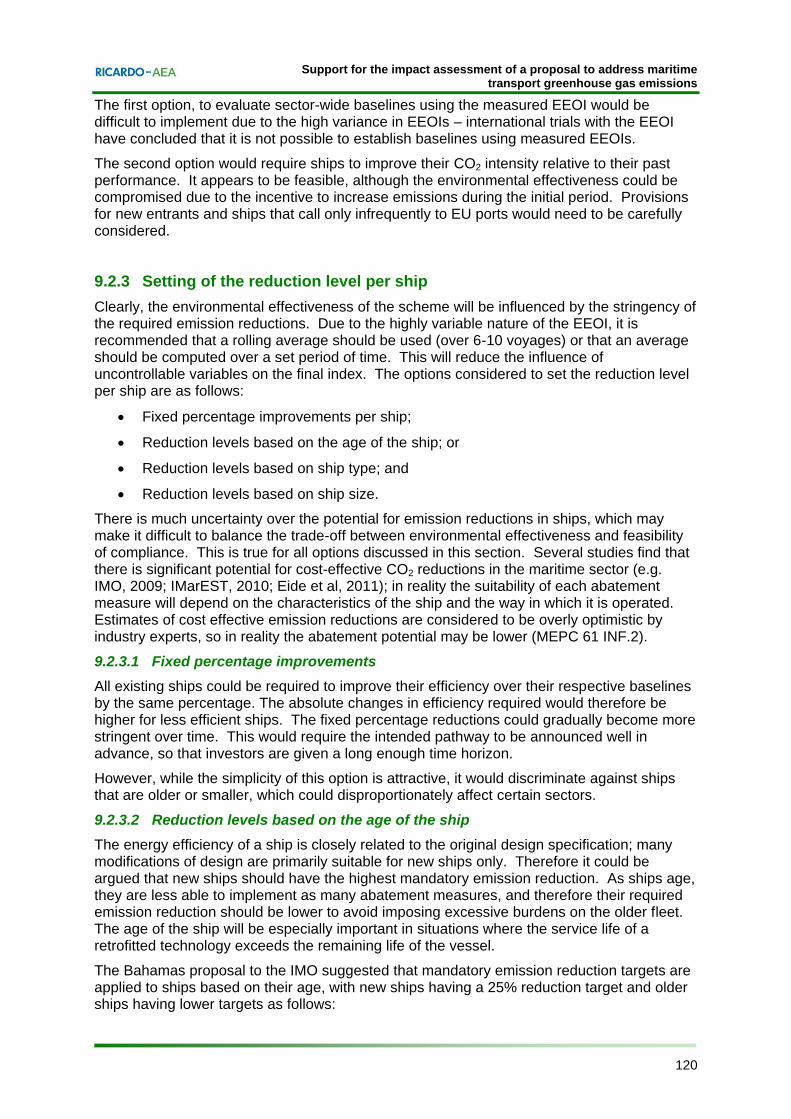
9.2 Design elements specific to mandatory emission reductions ........................... 113 9.3 Legal assessment ............................................................................................. 127 9.4 Summary assessment of policy design elements ............................................. 129
10 Analysis of the impacts of each policy option ....................................................... 130 10.1 Introduction ....................................................................................................... 130 10.2 Environmental impacts ..................................................................................... 130 10.3 Economic impacts ............................................................................................. 140 10.4 Social impacts ................................................................................................... 214
Appendix 1 Description of the TIMES international shipping model and its results
Appendix 2 Description of the IHS Fairplay model and its results
Appendix 3 Methodology and quantitative assessment of relevant historical emissions
Appendix 4 Administrative burden
Appendix 5 Analysis of fuel tax policy option
Appendix 6 Use of revenues and rents
Appendix 7 Economic impacts on the pulp and paper sector
Support for the impact assessment of a proposal to address maritime transport greenhouse gas emissions
21
1 Introduction
1.1 Nature and scale of the problem
The first impacts of climate change can already be seen in Europe and worldwide, and these are predicted to intensify in the coming decades. It is evident that global average temperatures are rising, rainfall patterns are shifting, there is widespread melting of snow and ice, sea levels are getting higher and extreme weather events are becoming more frequent. According to the IPCC (2007a), most of the observed increase in global average temperatures since the mid-20th century is very likely due to the increase in anthropogenic greenhouse gas (GHG) concentrations.
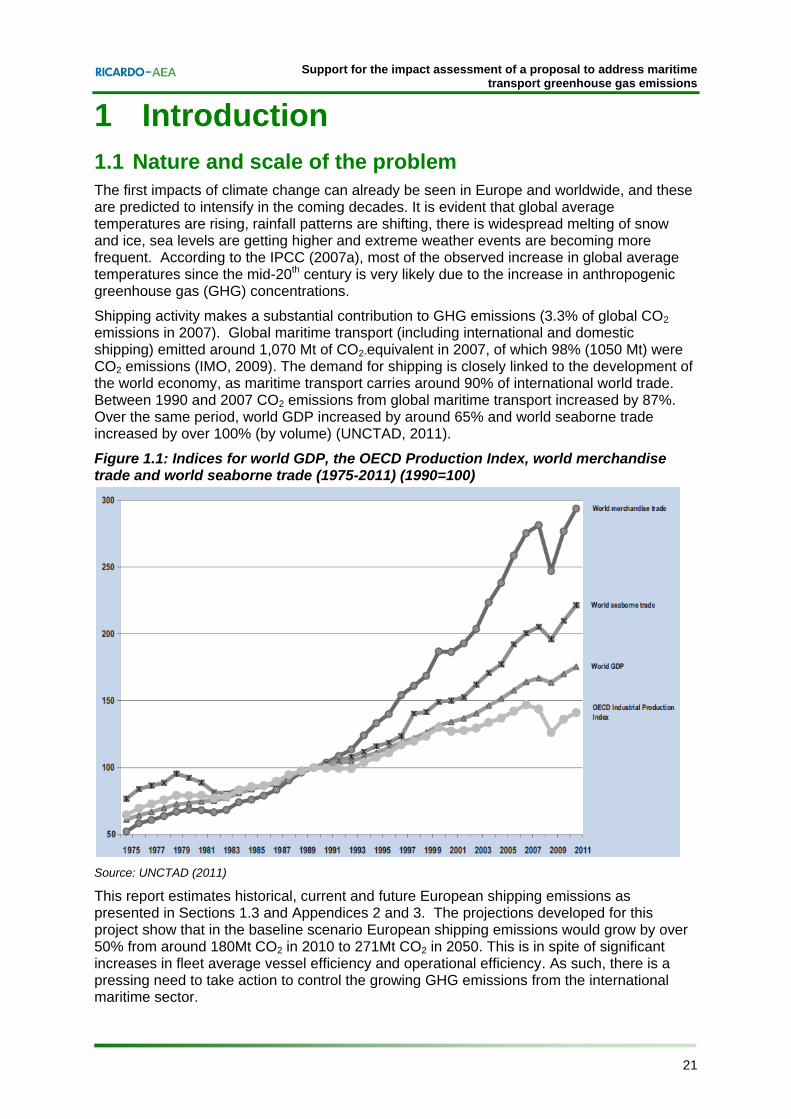
Shipping activity makes a substantial contribution to GHG emissions (3.3% of global CO2 emissions in 2007). Global maritime transport (including international and domestic shipping) emitted around 1,070 Mt of CO2-equivalent in 2007, of which 98% (1050 Mt) were CO2 emissions (IMO, 2009). The demand for shipping is closely linked to the development of the world economy, as maritime transport carries around 90% of international world trade. Between 1990 and 2007 CO2 emissions from global maritime transport increased by 87%. Over the same period, world GDP increased by around 65% and world seaborne trade increased by over 100% (by volume) (UNCTAD, 2011).
Figure 1.1: Indices for world GDP, the OECD Production Index, world merchandise trade and world seaborne trade (1975-2011) (1990=100)
Source: UNCTAD (2011)
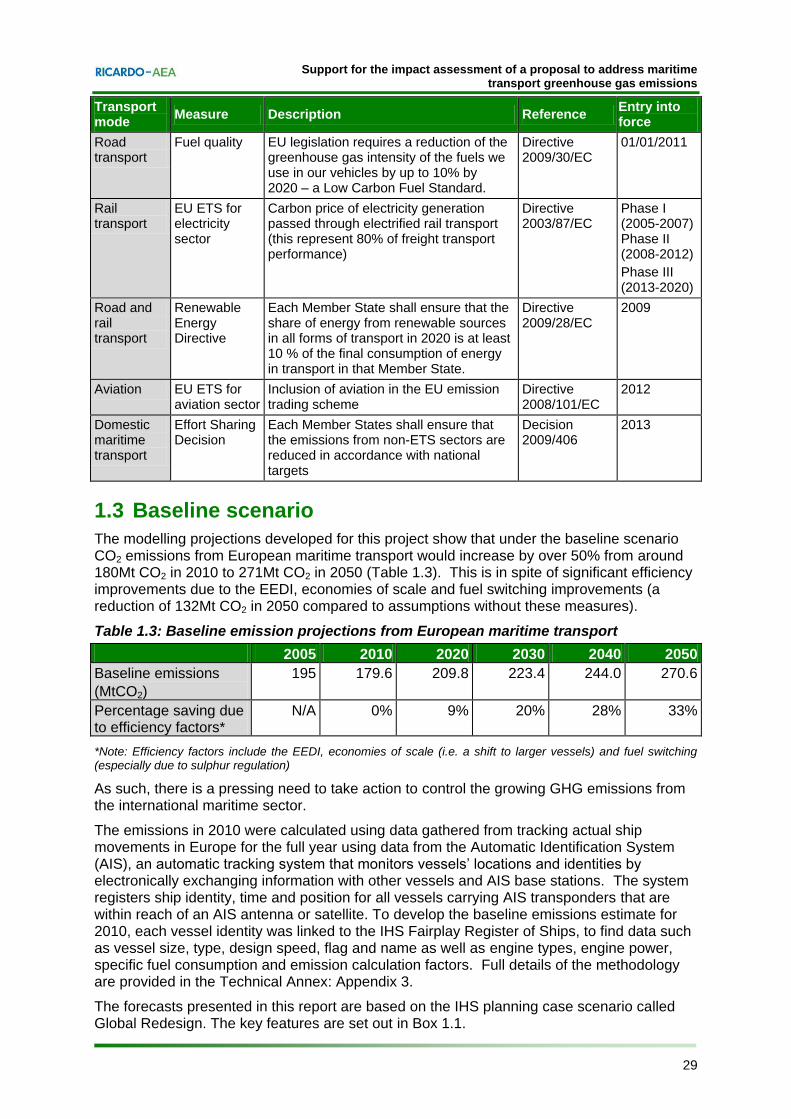
This report estimates historical, current and future European shipping emissions as presented in Sections 1.3 and Appendices 2 and 3. The projections developed for this project show that in the baseline scenario European shipping emissions would grow by over 50% from around 180Mt CO2 in 2010 to 271Mt CO2 in 2050. This is in spite of significant increases in fleet average vessel efficiency and operational efficiency. As such, there is a pressing need to take action to control the growing GHG emissions from the international maritime sector.
Support for the impact assessment of a proposal to address maritime transport greenhouse gas emissions
22
Emissions from the shipping sector have been recognised as a growing environmental problem as they affect climate, have direct impacts on human health, as well as contributing to ocean acidification and eutrophication. In addition to GHG emissions discussed above, shipping is responsible for emissions of other pollutants, mainly oxides of nitrogen (NOx), sulphur dioxide (SO2), carbon monoxide (CO), non-methane volatile organic compounds (NMVOCs), primary particles, heavy metals and waste discharges. Emissions of black carbon contribute to global warming and are particularly damaging in Polar Regions.
Fuel costs represent a major portion (50-60%) of a ship’s operating cost (WSC, 2008). In light of anticipated increased fuel costs, many potential abatement options are assumed not only to reduce emissions but help operators reduce fuel consumption and thus fuel costs. Maritime propulsion relies heavily on oil, which means that, at least in the short term, dependence on a finite energy source that is becoming increasingly costly to produce is certain. Residual fuels have been the main bunker fuel for ocean-going ships since the 1950s; however, the continued reliance on residual fuels has been called into question by future sulphur limits introduced under MARPOL Annex VI. In addition, the EC Directive (2005/33/EC) implements sulphur limits of 1.5% for fuels used by passenger vessels on regular service between EU ports, and 0.1% on all fuels used by ships at berth in EU ports. Considering the developments in the IMO, the European Commission adopted a proposal on 15 July 2011 to align the Directive with the latest IMO provisions on the sulphur content of marine fuels (COM(2011) 439). The current 1% sulphur limit in emission control areas is largely satisfied by using low sulphur fuel oil, but the forthcoming 0.1% limit in 2015 would necessitate a switch to low sulphur fuels such as marine gas oil, which is predicted to lead to fuel prices which are on average 80% higher (Entec, 2010). Switching to low sulphur fuels is expected to drastically increase fuel costs. While recent oil price spikes have resulted in operational changes such as slow steaming, they have not yet driven more radical technological change (AEA et al., 2008).
1.1.1 Drivers of the problem
The main drivers of shipping transport CO2 emissions are demand for transport, transport fuel efficiency and the carbon content of fuels used. These general factors can be further disaggregated as shown in Figure 1.2.
Support for the impact assessment of a proposal to address maritime transport greenhouse gas emissions
23
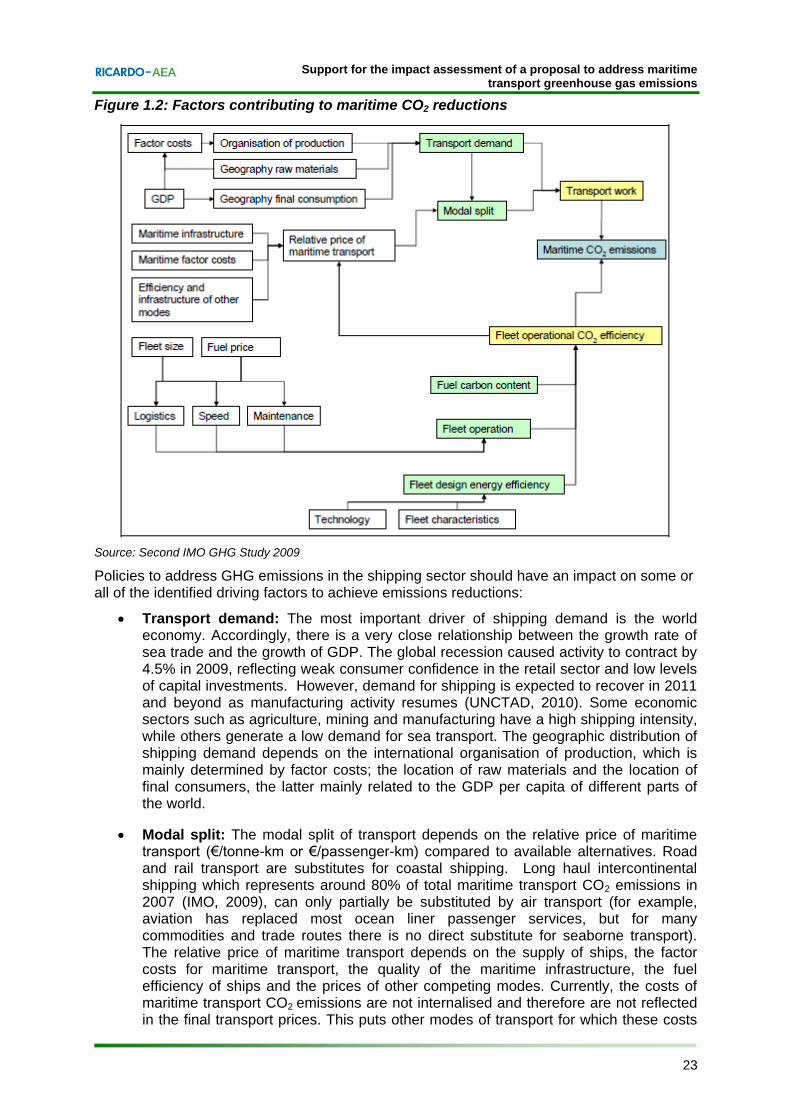
Figure 1.2: Factors contributing to maritime CO2 reductions
Source: Second IMO GHG Study 2009
Policies to address GHG emissions in the shipping sector should have an impact on some or all of the identified driving factors to achieve emissions reductions:
Transport demand: The most important driver of shipping demand is the world economy. Accordingly, there is a very close relationship between the growth rate of sea trade and the growth of GDP. The global recession caused activity to contract by 4.5% in 2009, reflecting weak consumer confidence in the retail sector and low levels of capital investments. However, demand for shipping is expected to recover in 2011 and beyond as manufacturing activity resumes (UNCTAD, 2010). Some economic sectors such as agriculture, mining and manufacturing have a high shipping intensity, while others generate a low demand for sea transport. The geographic distribution of shipping demand depends on the international organisation of production, which is mainly determined by factor costs; the location of raw materials and the location of final consumers, the latter mainly related to the GDP per capita of different parts of the world.
Modal split: The modal split of transport depends on the relative price of maritime transport (€/tonne-km or €/passenger-km) compared to available alternatives. Road and rail transport are substitutes for coastal shipping. Long haul intercontinental shipping which represents around 80% of total maritime transport CO2 emissions in 2007 (IMO, 2009), can only partially be substituted by air transport (for example, aviation has replaced most ocean liner passenger services, but for many commodities and trade routes there is no direct substitute for seaborne transport). The relative price of maritime transport depends on the supply of ships, the factor costs for maritime transport, the quality of the maritime infrastructure, the fuel efficiency of ships and the prices of other competing modes. Currently, the costs of maritime transport CO2 emissions are not internalised and therefore are not reflected in the final transport prices. This puts other modes of transport for which these costs
Support for the impact assessment of a proposal to address maritime transport greenhouse gas emissions
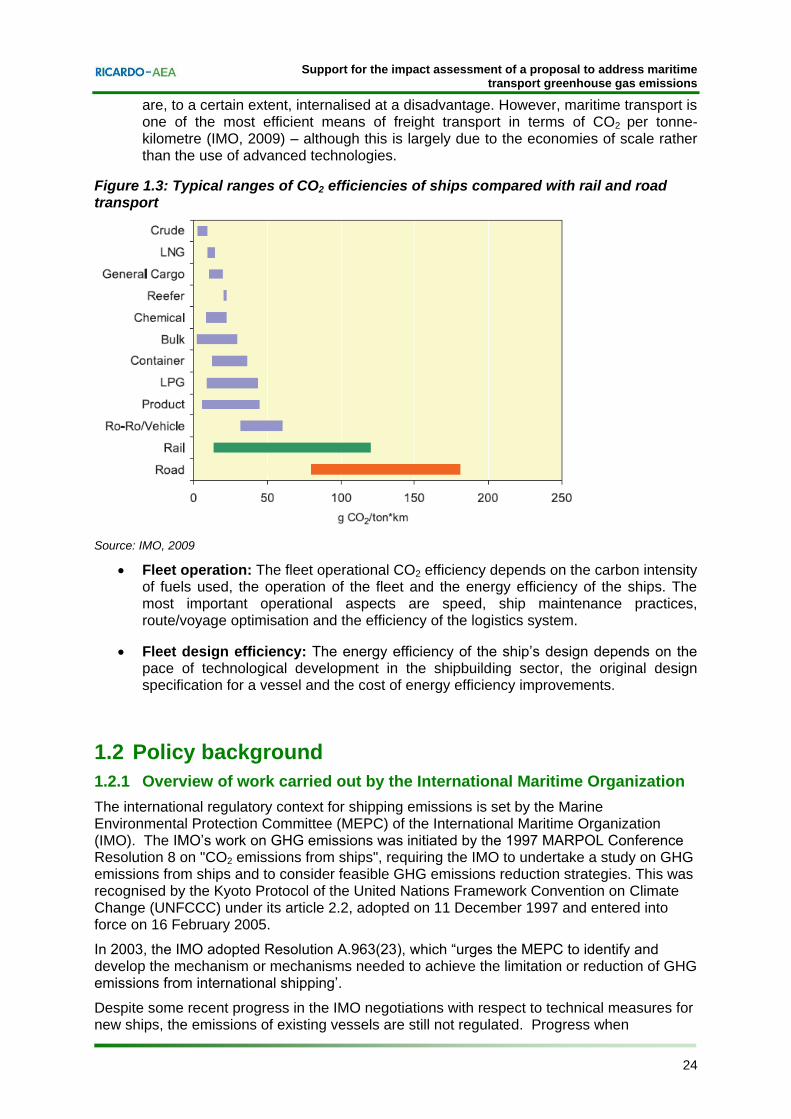
24
are, to a certain extent, internalised at a disadvantage. However, maritime transport is one of the most efficient means of freight transport in terms of CO2 per tonne-kilometre (IMO, 2009) – although this is largely due to the economies of scale rather than the use of advanced technologies.
Figure 1.3: Typical ranges of CO2 efficiencies of ships compared with rail and road transport
Source: IMO, 2009
Fleet operation: The fleet operational CO2 efficiency depends on the carbon intensity of fuels used, the operation of the fleet and the energy efficiency of the ships. The most important operational aspects are speed, ship maintenance practices, route/voyage optimisation and the efficiency of the logistics system.
Fleet design efficiency: The energy efficiency of the ship’s design depends on the pace of technological development in the shipbuilding sector, the original design specification for a vessel and the cost of energy efficiency improvements.
1.2 Policy background
1.2.1 Overview of work carried out by the International Maritime Organization
The international regulatory context for shipping emissions is set by the Marine Environmental Protection Committee (MEPC) of the International Maritime Organization (IMO). The IMO’s work on GHG emissions was initiated by the 1997 MARPOL Conference Resolution 8 on "CO2 emissions from ships", requiring the IMO to undertake a study on GHG emissions from ships and to consider feasible GHG emissions reduction strategies. This was recognised by the Kyoto Protocol of the United Nations Framework Convention on Climate Change (UNFCCC) under its article 2.2, adopted on 11 December 1997 and entered into force on 16 February 2005.
In 2003, the IMO adopted Resolution A.963(23), which “urges the MEPC to identify and develop the mechanism or mechanisms needed to achieve the limitation or reduction of GHG emissions from international shipping’.
Despite some recent progress in the IMO negotiations with respect to technical measures for new ships, the emissions of existing vessels are still not regulated. Progress when
Support for the impact assessment of a proposal to address maritime transport greenhouse gas emissions
25
discussing market-based measures has stalled mainly due to the conflict between the principle of equal treatment (under the IMO principle that regulations should be flag neutral) and respecting the UN’s Kyoto Protocol principle of lesser responsibilities for developing countries under the concept of “common but differentiated responsibility”.
Little progress was achieved until the adoption on 15 July 2011 of revisions to MARPOL Annex VI which make the Energy Efficiency Design Index (EEDI) and the Ship Energy Efficiency Management Plan (SEEMP) mandatory for new ships in several categories. The mandatory EEDI is expected to enter into force on 1 January 2013 for all new ships of 400 GT or above.
The EEDI is a non-prescriptive, performance-based mechanism that specifies a minimum energy-efficiency level. It is currently developed for the most energy-intensive ship types – oil tankers, gas tankers, bulk carriers, general cargo and container ships – with a view to extending it to cover other ship types such as passenger ships in the future. The SEEMP establishes a mechanism for ships to improve the energy performance of their operations. It aims to record the operational measures taken to enhance the energy efficiency of the ship. However, the implementation of measures described in the SEEMP is not mandatory.
The IMO estimates that the emissions savings due to the EEDI implementation and the use of SEEMP will be in the range of 100-180 Mt CO2 (9-16% reduction from BAU) in 2020 and around 220-415 Mt CO2 (17-25% reduction from BAU) by 2030. Given that the IMO's general estimates of the BAU scenario for emissions from international shipping range from 925 to 1085 Mt CO2 in 2020, additional measures are required to address GHG emissions from the sector. However progress on market-based measures (MBM) has, so far, been slow.
This section provides a brief overview of the current status of the negotiations linked to MBMs. It can also be underlined that no monitoring, reporting and verification system has been implemented through the IMO. Such system is a prerequisite for setting targets.
The IMO has identified nine fundamental principles that regulations on GHG emissions from international shipping should meet. Namely, policies should be:
1. Effective in contributing to the reduction of global greenhouse gas emissions;
2. Binding and equally applicable to all flag States in order to avoid evasion;
3. Cost-effective;
4. Able to limit – or at least – effectively minimise competitive distortion;
5. Based on sustainable environmental development without restricting global trade and growth;
6. Goal-based approach that is not prescriptive in nature;
7. Supportive of promoting and facilitating technical innovation and R&D in the entire shipping sector;
8. Facilitating new technologies in the field of energy efficiency; and
9. Practical, transparent, fraud free, and easy to administer.
These nine principles should be taken into account in order to support the continuing work of the IMO, and to ensure that a future European system is compatible with a potential future global agreement, as indeed a European system could lay the groundwork for a global mechanism.
In 2010, the MEPC conducted a feasibility study and impact assessment of market-based measures to reduce GHG from maritime transport. An Expert Group evaluated ten proposals submitted by various countries against nine criteria, namely:
1. Environmental effectiveness;
Support for the impact assessment of a proposal to address maritime transport greenhouse gas emissions
26
2. Cost effectiveness;
3. Incentives to technological change and innovation;
4. Practical feasibility;
5. Support technology transfer;
6. Compatibility with other conventions;
7. Administrative burden;
8. Other costs incurred; and
9. Compatibility with the IMO’s legal framework.
The proposals target GHG reductions through in-sector emission reductions from shipping, or out-of-sector emissions reductions through use of funds for mitigation in other sectors. There are eight types of mechanism, which are used in various combinations by the proposals. Table 1.1 presents a summary of the proposals:
Table 1.1: Summary of market-based measures (MBM) evaluated by the MEPC (62nd session)
Proposed market-based measures
Proponent(s)
Mechanism for GHG reduction
In-sector emission reductions
Out-of-sector emission reductions
An International Fund for Greenhouse Gas emissions from ships (GHG Fund)
Cyprus, Denmark, the Marshall
Islands, Nigeria and IPTA
(MEPC 60/4/8,
GHG-WG 3/2/1
GHG WG 3/3/4)
Price incentive on fuel use
Prescribed purchase of out-of-sector project offset credits by a fund;
Potential for supplementary reductions from use of remaining proceeds
Consolidated proposal of the Efficiency Incentive Scheme (EIS) based on the Leverage Incentive Scheme (LIS) and the Vessel Efficiency System (VES)
Japan & World Shipping Council
(MEPC 60/4/37
MEPC 60/4/39
GHG-WG 3/3/2)
Mandatory EEDI;
Existing ship standard with fuel-based charge
Leveraged refund incentive
Potential for supplementary reductions from use of remaining proceeds
Port State arrangements utilizing the ship traffic, energy and environment model, STEEM (PSL)
Jamaica
(MEPC 60/4/40)
Price incentive on fuel use
Potential for supplementary reductions from use of remaining proceeds
Ship Efficiency and Credit Trading (SECT)
US
(MEPC 60/4/12
MEPC 61/5/16
MEPC 61/INF.24)
Mandatory EEDI;
Efficiency trading
Support for the impact assessment of a proposal to address maritime transport greenhouse gas emissions
27
Proposed market-based measures
Proponent(s)
Mechanism for GHG reduction
In-sector emission reductions
Out-of-sector emission reductions
Global Emission Trading System (ETS)
Norway, United Kingdom, France & Germany
(MEPC 60/4/22
MEPC 60/4/26
MEPC 60/4/41
MEPC 60/4/54
GHG-WG 3/3/5
GHG-WG 3/3/6
GHG-WG 3/3/8)
Price incentive on fuel use
Purchase out-of-sector project offset credits by shipping sector;
Potential for supplementary reductions from use of remaining proceeds
How technical and operational measures are the only direct and effective means to deliver cuts in CO2 emissions
Bahamas
(MEPC 60/4/10, GHG-EG 3/2)
Mandatory emission reduction target
A Rebate Mechanism (RM) for a market-based instrument for international shipping
IUCN
(MEPC 60/4/55
MEPC 61/5/33)
Price incentive on fuel use
Prescribed purchase of out-of-sector project offset credits by a fund;
Potential for supplementary reductions from use of remaining proceeds
The MEPC has agreed a work plan to develop the EEDI framework for other ship types, with a view to finalisation at MEPC 65. The EEDI standards become more stringent over time, with the aim of a 10% improvement for ships built in 2015-2019, 15% or 20% by 2020-2024 depending on the ship type, and 30% for ships built after 2024. However, the measure will only apply to new vessels coming into service rather than affecting the existing global fleet. As such the EEDI may just slow the growth of emissions rather than bringing about absolute reductions.
In pursuit of the goal set in the Copenhagen Accord to reach a GHG emissions reduction "required according to science, and as documented by the IPCC Fourth Assessment Report with a view to reduce global emissions so as to hold the increase in global temperature below 2 degrees Celsius", further action is needed. The IMO is still working towards the introduction of market-based measures, with the continued support of the EU.
1.2.2 European policy
At the European level, a range of targets have been set, or are being discussed, concerning economy-wide GHG emission reductions.
In the European Union (EU) Climate Change Package, the EU has committed to reducing its emissions by 20% (based on 1990 levels) by 2020, which may be increased to 30% if considered appropriate. The EU also agreed on a long-term objective of a reduction of 80 to 95% by 2050 compared to 1990, in accordance with the EU roadmap for moving to a low carbon economy in 2050.
The European Commission’s Transport White Paper (2011) included an ambitious target to reduce transport sector emissions by 60% against 1990 levels by 2050. Of particular relevance is the target for the maritime sector that states: EU CO2 emissions from maritime transport should be cut by 40% (and if feasible 50%) by 2050 compared to 2005 levels. This target aims to contribute to the objective set by the Council of the EU
Support for the impact assessment of a proposal to address maritime transport greenhouse gas emissions
28
for the global maritime sector to reduce its emissions by 20% by 2020 compared to 2005.2
According to Directive 2009/29/EC (the revised EU ETS Directive) and Decision No 406/2009/EC (the Effort Sharing Decision), the EU should include the GHG emissions of the maritime sector in its 20% overall GHG reduction commitment "in the event that no international agreement which includes international maritime emissions in its reduction targets through the International Maritime Organisation has been approved by Member States or no such agreement through the UNFCCC has been approved by the Community by 31 December 2011, the Commission should make a proposal to include international maritime emissions in the Community reduction commitment, with the aim of the proposed act entering into force by 2013."3
International shipping is the only sector not included in EU level GHG reduction targets. All other sectors of the economy are covered either by the revised EU ETS Directive (traded sectors) or the Effort Sharing Decision (non-traded sectors). Moreover, all other transport modes either have or will soon have policies which aim to internalise the costs of climate at least to some extent. An overview of actions for other transport modes is provided in Table 1.2.
Table 1.2: EU policies and measures for low-carbon transport
Transport mode
Measure Description Reference Entry into force
Road transport
Revised Energy Taxation Directive
Proposed fuel taxes will be split into a component based on CO2 content and another based on energy content.
A single minimum rate for CO2 emissions of €20 per tonne CO2 is proposed for all sectors not covered by the EU ETS. The other component of the minimum taxation rate is based on energy content, set at €9.6 per GJ for motor fuels.
The Proposal for a Council Directive amending Directive 2003/96/EC
COM (2011) 169
The revised Directive was scheduled to enter into force from 2013. A phase-in period would last until 2023.
Road transport
Emission performance standards for new cars and vans
The fleet average to be achieved by all cars registered in the EU is 130 grams per kilometre (g/km) by 2012, a 19% reduction.
The Vans Regulation will cut emissions from vans to an average of 175 gCO2 per kilometre by 2017 – with the reduction phased in from 2014 - and to 147g CO2/km by 2020. These cuts represent reductions of 14% and 28% respectively compared with the 2007 average of 203 g/km.
Regulation (EC) n°443/2009 and 510/2011
2012 and 2014 with phase in periods
Road transport
Eurovignette (road charging)
To ensure national toll systems reflect the external cost of transport, including environmental damage, congestion and accidents..
Proposal for a Directive amending Directive 1999/62/EC
COM(2008) 436
N/A
2 Environment Council conclusion, October 2009
3 Recital 2 of the decision n°406/2009/EC and recital 3 of the directive n°2009/29/EC
Support for the impact assessment of a proposal to address maritime transport greenhouse gas emissions
29
Transport mode
Measure Description Reference Entry into force
Road transport
Fuel quality EU legislation requires a reduction of the greenhouse gas intensity of the fuels we use in our vehicles by up to 10% by 2020 – a Low Carbon Fuel Standard.
Directive 2009/30/EC
01/01/2011
Rail transport
EU ETS for electricity sector
Carbon price of electricity generation passed through electrified rail transport (this represent 80% of freight transport performance)
Directive 2003/87/EC
Phase I (2005-2007) Phase II (2008-2012)
Phase III (2013-2020)
Road and rail transport
Renewable Energy Directive
Each Member State shall ensure that the share of energy from renewable sources in all forms of transport in 2020 is at least 10 % of the final consumption of energy in transport in that Member State.
Directive 2009/28/EC
2009
Aviation EU ETS for aviation sector
Inclusion of aviation in the EU emission trading scheme
Directive 2008/101/EC
2012
Domestic maritime transport
Effort Sharing Decision
Each Member States shall ensure that the emissions from non-ETS sectors are reduced in accordance with national targets
Decision 2009/406
2013
1.3 Baseline scenario
The modelling projections developed for this project show that under the baseline scenario CO2 emissions from European maritime transport would increase by over 50% from around 180Mt CO2 in 2010 to 271Mt CO2 in 2050 (Table 1.3). This is in spite of significant efficiency improvements due to the EEDI, economies of scale and fuel switching improvements (a reduction of 132Mt CO2 in 2050 compared to assumptions without these measures).
Table 1.3: Baseline emission projections from European maritime transport
2005 2010 2020 2030 2040 2050
Baseline emissions
(MtCO2)
195 179.6 209.8 223.4 244.0 270.6
Percentage saving due to efficiency factors*
N/A 0% 9% 20% 28% 33%
*Note: Efficiency factors include the EEDI, economies of scale (i.e. a shift to larger vessels) and fuel switching (especially due to sulphur regulation)
As such, there is a pressing need to take action to control the growing GHG emissions from the international maritime sector.
The emissions in 2010 were calculated using data gathered from tracking actual ship movements in Europe for the full year using data from the Automatic Identification System (AIS), an automatic tracking system that monitors vessels’ locations and identities by electronically exchanging information with other vessels and AIS base stations. The system registers ship identity, time and position for all vessels carrying AIS transponders that are within reach of an AIS antenna or satellite. To develop the baseline emissions estimate for 2010, each vessel identity was linked to the IHS Fairplay Register of Ships, to find data such as vessel size, type, design speed, flag and name as well as engine types, engine power, specific fuel consumption and emission calculation factors. Full details of the methodology are provided in the Technical Annex: Appendix 3.
The forecasts presented in this report are based on the IHS planning case scenario called Global Redesign. The key features are set out in Box 1.1.
Support for the impact assessment of a proposal to address maritime transport greenhouse gas emissions
30
Box 1.1: Key features of the baseline scenario
General characteristics (covering the time period 2010-2050)
• Macroeconomic dialogue among major powers prevents protectionism from taking root;
• Sustained and pronounced shift in economic and political power to China, India, as well Brazil and other emerging markets
— In Europe and the United States, governments forced to raise taxes and cut spending.
• Threat of hyper-nuclear proliferation creates crisis environment
— Convergence of interest among major powers on proliferation only takes place under a severe crisis.
• Development of global agreement on greenhouse gas emissions is muddled and ineffective relative to announced targets.
• Innovation is incremental – there is no technology revolution.
Key economic trends
Strong, sustainable expansion in emerging markets.
Monetary policy gradually adjusted in line with growth prospects. Asia starts tightening first, followed by the United States and Europe/Japan.
Inflation is kept at bay.
Large developed economies adopt measures to reduce budget deficits.
After shrinking in 2009, US trade deficits widen again.
As consumer demand expands in emerging markets a process of global rebalancing begins.
Trade liberalization continues, but troubled by occasional disagreements and conflicts.
US dollar depreciates mostly against emerging markets currencies, especially the renminbi.
By 2030 China’s economy accounts for a significant share of global trade, including key commodities and manufactured goods.
The relative change in real GDP per capita is much quicker in the emerging markets than in the developed countries.
Maritime activity is predicted to grow in line with trade forecasts, derived from the GDP forecasts in the Global Redesign scenario. The forecast for export growth between 2011 and 2029 is 3% per annum. After that growth is assumed to slow down to 2% per annum. The forecast for import growth between 2011 and 2029 is 2.3% per annum. After that, annual growth is projected to slow down to 1.7%.
The calculation of the economy of scale factor in the fleet transporting EU27 cargoes has been derived from the forecasted global fleet development in the Global Redesign scenario. The fleet forecast is the net development of new ship deliveries and existing ship removals. Thereafter, the average deadweight sizes have been calculated for the five main ship categories.
It must be stressed that forecasts of this nature are uncertain. The largest uncertainty in the forecasts above relate to the current financial turmoil in the Euro-zone. Should the efforts to save the most troubled nations fail and the financial challenges spread to more and larger economies then the forecasts for the period up to 2020 would be too optimistic.
It is, however, believed that some of the lost growth in this current decade would be recovered in the following decade. This would mean that the forecast for 2050 emissions should not be affected significantly. It is more the route leading up to that point that would
Support for the impact assessment of a proposal to address maritime transport greenhouse gas emissions
31
look different. Full details of the calculations involved in creating the baseline scenario are provided in the Technical Annex: Appendix 2.
1.4 The need for EU action
The principle of subsidiarity as defined in the Treaty on European Union (Article 5(3) – (4) TEU) allows the Union to act if a problem cannot be adequately settled by the Member States acting on their own. The purpose of including this principle in European Treaties is to bring decision-making within the Union as close to the citizen as possible. The principle of conferral, as set up for the first time in the Treaty Establishing a Constitution for Europe and afterwards in the Treaty of Lisbon states that the Union can only act within the limits of the competences conferred on it by the Member States in the Treaties so as to attain the objectives set out therein while all other competences remain with the Member States (Article 5(2) TEU).
Since shipping is an international sector and many ships have the option to choose which ports to use, there is a high risk of activity moving between Member States if individual national action is taken. To this end, Member States at the individual level have been reluctant to develop legislation to reduce emissions in this area as it may lead to reduced business for their ports without a corresponding increase in environmental integrity. If emissions from international shipping are not included in an international agreement's reduction commitments, harmonised action to reduce the GHG emissions from the maritime sector based on traffic into and out of EU ports could be secured by adopting legislation at the EU level (thereby largely avoiding the risk of leakage within the EU Member States while tackling the environmental issue). This justifies action to reduce GHG emissions from shipping on the basis of the principle of subsidiarity.
Among the objectives set out in Treaty on the European Union is the “sustainable development of Europe, based on balanced economic growth and price stability, a highly competitive social market economy, aiming at full employment and social progress, and a high level of protection and improvement of the quality of the environment” (Article 3(3) TEU). According to Article 4(2)(e) and (g) TFEU, the Union has shared competence with the Member States in the areas of environment and transport; as a consequence, both the Union and the Member States may legislate and adopt legally binding acts in these areas. However, the Member States shall exercise their competence to the extent that the Union has not exercised its own. Moreover, the Member States shall exercise again their competence to the extent that the Union has decided to cease exercising its own (Article 2(2) TFEU). As a consequence, based on the principle of conferral, the EU is justified to take action to reduce GHG emissions from shipping transport.
The reasons that European policy action is required to reduce the increasing GHG emissions of the shipping sector are:
Regulatory failures. Current shipping prices do not reflect the real costs to society, as the cost of carbon emissions is not internalised. Policies and measures are already in place to internalise the cost of carbon for other modes of transport (see Table 1.2). Therefore, an equal treatment for shipping is required to ensure a level playing field in the transport sector.
Moreover, unlike domestic maritime emissions, international maritime emissions have not yet been included in the 20% commitment that is a headline target of the Europe 2020 Strategy, nor have specific EU measures relevant to GHG emissions in this sector been implemented. This is incompatible with the current scientific assessment that the increase in GHG emissions will have to be reversed within ten years in order to limit global warming to 2°C. The European Union is pursuing action at the international level, but international negotiations both through the UNFCCC and the IMO, have not so far resulted in any agreement on a legally binding mechanism to include these emissions in binding reduction commitments.
Support for the impact assessment of a proposal to address maritime transport greenhouse gas emissions
32
Market failures. A number of technological and operational abatement measures are considered to be cost-effective for the shipping sector. The IMO (2009) identified over 49 abatement options, which in combination could have the potential to reduce CO2 emissions by 25-75% by 2020. In principle all opportunities for reducing emissions which are truly cost-effective (i.e. lead to cost savings) will be exploited without encouragement, i.e. in a perfect market these savings would already have been realised.
Certain barriers impede investment flows into these areas, including:
1. Split of incentives: Several entities are involved in the operation of ships. As a result of this, a coherent long-term strategy to improve of the energy efficiency is difficult to implement as neither owner nor operator or charter could expect a pay back of their investments.
2. Lack of information: Ship-owners, ship operators and charterers may not be aware of the energy efficiency of a ship, may not be able to compare this energy efficiency amongst other ships or may not be aware of technologies delivering cost-effective emissions reductions;
3. Access to finance: Ship-owners or ship operators do not have access to private finance to invest in low carbon technologies.
Previous work (see for example: AEA et al, 2008) has identified these barriers at a generic level, but more work is required to understand the actors affected by market barriers, how these barriers impede uptake of cost-effective abatement measures, and what interventions could be introduced to remove market barriers. This is the subject of an ongoing European Commission study (CLIMA.B.3/SER/2011/0014), which is analysing interventions which could be used to overcome market barriers, thereby unlocking emissions abatement potential in the maritime transport sector
Given these market and regulatory failures, it is very unlikely that any significant reductions will be achieved before 2020 (beyond any reductions achieved via the introduction of the EEDI for new vessels) if no further action is taken.
Support for the impact assessment of a proposal to address maritime transport greenhouse gas emissions
33
2 Policy objectives EU action against climate change has been translated into a GHG reduction target as adopted in the Climate and Energy Package and included in the headline target of the EU 2020 Strategy. The target set in the EU 2020 Strategy is to reduce GHG emissions by at least 20% by 2020 compared to 1990 levels, or by 30% in the context of a global deal4.
In the context of the EU 2020 Strategy and its flagship initiatives, the Commission's Transport White Paper introduced a specific target of a reduction in EU CO2 emissions from maritime bunker fuels by 40% (if feasible 50%) by 2050 compared to 2005 levels.
Under the EU 2020 objectives, the European Council5 has identified that action against climate change will bring opportunities for growth and employment through building expertise in eco-efficient technologies. Currently, European shipbuilders are technology leaders in the passenger ship segment, for special purpose ships (e.g. dredgers) and in large parts of the equipment industry. Shipyards and equipment suppliers will play a vital role in providing the technical solutions to meet GHG reduction targets. It is important that Europe retains its expertise in this area. The policy objectives therefore promote technological development by supporting continued innovation in the EU maritime-related industries.
Furthermore, due to the global nature of the maritime sector, international regulation is always preferred. Therefore, another important specific objective for the EU is to develop regional policies that can support the IMO process and that can take forward action to reduce maritime emissions within the EU and globally.
4 COM(2010)2020, 3.3.2010
5 Conclusion of the European Council (17 June 2010), EUCO 13/10
Support for the impact assessment of a proposal to address maritime transport greenhouse gas emissions
34
3 Legal feasibility of EU action to reduce GHG emissions from shipping
This section considers the legal compatibility of the proposed policy options with EU and international law.
3.1 Compatibility of proposed EU measures with EU law
The EU can only act within the limits of the powers assigned to it, as per Article 5(2) of the Treaty on European Union (TEU). Under the Lisbon Treaty, the EU shares the competence with the Member States to adopt measures for environmental protection. The proposed EU measures for the regulation of GHG emissions from the maritime sector qualify as a measure for environmental protection.
When the EU has competence to act, its actions still need to comply with the principles of subsidiarity and proportionality laid out in Article 5 of the Treaty of the European Union. EU action to reduce GHG emissions from the maritime sector complies with the principle of subsidiarity as the need to address climate change and protect the environment is well recognised and action is considered to be more effective if employed at a wider, EU level than at national level6.
Under the principle of proportionality, as defined in Article 5(4) TEU, the content and form of Union action must not exceed what is necessary to achieve the objectives of the Treaties. As documented in this report, the proposed measures are suitable to reduce GHG emissions from the maritime sector as their implementation will lead to a substantial reduction of emissions. They are necessary to achieve this goal, especially considering the lack of action at the international level.
The legal basis for the EU’s legislative powers is found in specific Treaty provisions which also set out the scope of EU legislation in the area and determine the legislative procedure to be followed. In addition to Article 11 of the TFEU, which mentions environmental protection as one of the fields for EU action, the TFEU contains a separate chapter on the environment. Article 192 TFEU provides a strong legal basis for EU actions to regulate greenhouse gas emissions from the maritime sector. Article 192(1) TFEU states that the European Parliament and the Council, acting in accordance with the ordinary legislative procedure and after consulting the European Economic and Social Committee (ECOSOC Committee) and the Committee of the Regions, shall decide what action the Union should take to achieve a high level of environmental protection. Article 192(2) TFEU requires environmental measures of a primarily fiscal nature to be adopted in accordance with a special legislative procedure which requires the Council to act unanimously, after consulting the European Parliament, ECOSOC and the Committee of the Regions. The appropriate legal basis will have to be assessed for each individual policy option.
The proposed EU legislative measures must comply with other EU legal requirements including the EU rules on State aid (Article 107 TFEU). The objective of State aid control is to ensure that government interventions do not distort competition and trade within the internal market, by conferring any advantage on undertakings on a selective basis. Under certain circumstances and conditions set forth in guidelines7, State aid is allowed, e.g., for environmental protection. In the context of the policy options under consideration, State aid
6 This was recognized in the adoption of Directive 2003/87/EC (EU ETS Directive) and its amendments.
7 Relevant State aid guidelines include the Community guidelines on State aid for environmental protection 2008/C 82/01, available at http://eur-
lex.europa.eu/LexUriServ/LexUriServ.do?uri=OJ:C:2008:082:0001:0033:EN:PDF (last accessed on 9 February 2012);Commission Communication C(2004) 43 - Community guidelines on State aid to maritime transport, OJ C 013, 17.01.2004, p.3; and Framework on State aid to shipbuilding, OJ C 364, 14.12.2011, p. 9–13.
Support for the impact assessment of a proposal to address maritime transport greenhouse gas emissions
35
rules may come into place regarding the allocation by Member States of revenues accrued through the implementation of certain policy options; or the free allocation of allowances under specific policy options. If the allocation of revenues to the maritime sector or if decisions on the free allocation of allowance took place at EU level, no State aid issues would arise.
The system of monitoring, reporting and verification (MRV) of GHG emissions currently in place is the Monitoring Mechanism, established under Decision No. 280/2004/EC8. The Decision does not state that maritime GHG emissions are within its scope. A legislative proposal presented by the Commission in November 2011 would replace the Monitoring Mechanism with a new Regulation9that proposes a Union-wide inventory of GHG and is designed such that reporting on new sectors, such as the maritime sector, can easily be included. The proposal is currently in the legislative process and may be subject to significant change.
3.2 Compatibility of proposed EU measures with international law
A fundamental consideration is whether the proposed options to regulate maritime CO2 emissions would be compatible with international law. Article 216(2)(TFEU) provides that agreements concluded by the Union are binding upon the institutions of the Union and on its Member States. CJEU case law confirms that the EU must respect international law in the exercise of its powers.
3.2.1 The UNFCCC and the Kyoto Protocol
The UN Framework Convention on Climate Change (UNFCCC)10 provides an overall instrument to tackle the challenge of climate change. Article 3 of the UNFCCC provides that the Parties should protect the climate for the benefit of present and future generations in accordance with the principle of common but differentiated responsibilities and respective capabilities. This principle is based upon both the historical responsibility of States and the different capacities of States to address climate change. Accordingly, developed country Parties as set out in Annex I of the UNFCCC must take the lead in combating climate change and its adverse effects while adopting precautionary measures to anticipate, prevent and minimise its causes and mitigate its adverse effects.
The Convention does not set mandatory limits on GHG emissions for individual countries, but provides for limits to be set by protocols. This was achieved through the 1997 Kyoto Protocol11. Article 2(2) of that Protocol states ‘The Parties included in Annex I shall pursue limitation or reduction of emissions of greenhouse gases not controlled by the Montreal Protocol from aviation and marine bunker fuels, working through the International Civil Aviation Organization and the International Maritime Organization, respectively’.
The question here is whether the EU is obliged to act only through the IMO or whether it could adopt the relevant measures unilaterally. In Case C-366/10 on the legality of including aviation in the EU ETS, Advocate General Kokott analysed the EU’s competence to act unilaterally to regulate GHG emissions from the aviation sector, pointing out that even though the UNFCCC encourages cooperation between Parties, it clearly accommodates the possibility of national and regional action, and indeed urges developed countries to take the lead in combating climate change.
While Article 2(2) expresses the Parties’ preference to work through the IMO to find a multilateral solution to the reduction of maritime GHG emissions, it does not prohibit actions
8 Decision No 280/2004/EC of the European Parliament and of the Council of 11 February 2004 concerning a mechanism for monitoring
Community greenhouse gas emissions and for implementing the Kyoto Protocol, OJ L 49, 19.2.2004, p. 1–8. 9 The draft proposal is available athttp://ec.europa.eu/clima/policies/g-gas/docs/regulation_20111123_en.pdf(last accessed on 11 May 2011).
10 UN General Assembly, United Nations Framework Convention on Climate Change : resolution / adopted by the General Assembly, 20 January
1994, A/RES/48/189. 11
‘Kyoto Protocol’, UNFCCC website, available at http://unfccc.int/kyoto_protocol/items/2830.php (last accessed on 25 June 2012).
Support for the impact assessment of a proposal to address maritime transport greenhouse gas emissions
36
under other international legal frameworks. Considering that the EU and its Member States have participated for many years in negotiations under the auspices of the IMO on measures to reduce maritime GHG emissions, the EU could not reasonably be required to give the IMO unlimited time to develop a multilateral solution. This is especially the case since the Kyoto Protocol imposes time constraints on the EU and other Parties to achieve quantified objectives for the limitation of GHG emissions. Given that the EU and its Member States will continue to seek an agreement on global measures to reduce maritime GHG emissions through the IMO/UNFCCC, and can be expected to promptly adopt measures to avoid double regulation if such an agreement is reached, no legal incompatibility problems were found concerning the proposed options and the UNFCCC/Kyoto Protocol.
3.2.2 UN Convention on the Law of the Sea (UNCLOS)
The EU and its Member States have acceded to the United Nations Convention on the Law of the Sea (UNCLOS). Under UNCLOS, the EU has the competence to regulate maritime transport to protect and preserve the marine environment.
UNCLOS includes provisions on the power to regulate pollution that are pertinent for the regulation of GHG. In granting jurisdiction to regulate pollution, UNCLOS distinguishes between pollution from vessels (Article 211) and pollution from or through the atmosphere, including from vessels (Article 212). Article 1 defines ‘pollution of the marine environment’ as ‘the introduction by man, directly or indirectly, of substances or energy into the marine environment, including estuaries, which results or is likely to result in such deleterious effects as harm to living resources and marine life, hazards to human health, hindrance to marine activities, including fishing and other legitimate uses of the sea, impairment of quality for use of sea water and reduction of amenities.’ This broad wording indicates that the objective was to capture a full range of possible threats to the marine environment rather than limiting the definition to specific threats identified at the time12. While the specific issue of GHG emissions may not have been in the minds of the drafters, it can be argued that GHG emissions from ships qualify as pollution of the marine environment. Though some IMO Members have contested the view that GHGs qualify as pollutants, acceptance of this interpretation is growing within the international maritime community, as indicated by the recent adoption of amendments to the International Convention for the Prevention of Pollution from Ships (MARPOL)13. The amendments introduce a new chapter 4 to Annex VI MARPOL on Regulations on energy efficiency for ships. The chapter aims to reduce maritime GHG emissions through mandatory introduction of the Energy Efficiency Design Index (EEDI) for new ships, and the Ship Energy Efficiency Management Plan (SEEMP) for all ships
UNCLOS delineates five sea zones and defines the rights and responsibilities of nations in their use of these zones. Four zones are relevant for the regulation of maritime GHG: (1) internal waters (all water and waterways landward of the baseline including ports); (2) territorial sea (up to 12 nautical miles measured from the baselines); (3) exclusive economic zone (EEZ) (up to 200 nautical miles from the baselines); and (4) high seas.
The Convention also divides states into three categories, each with distinct rights: (1) flag States, (2) coastal States and (3) port States. Flag States have full jurisdiction over all ships flying their flag or registered with their registry for the prevention, reduction and control of pollution of the marine environment as long as these laws and regulations are not below international standards (Article 211(2) UNCLOS). In addition, they have exclusive jurisdiction over ships flying their flag in the high seas.
Coastal States may adopt laws and regulations for their territorial seas for the conservation of living resources of the sea and the preservation of the coastal State’s environment as well as to prevent, reduce and control the pollution thereof (Article 21(1) of UNCLOS). They are
12
MeinhardDoelle, ‘Climate Change and the Use of the Dispute Settlement Regime of the Law of the Sea Convention’, available at http://law.dal.ca/Files/Climate_Change_and_the_use_of_the_Dispute_Settlement_Regime_.pdf (last accessed on 11 May 2012) at.p. 7. 13
Support for the impact assessment of a proposal to address maritime transport greenhouse gas emissions
37
however restricted concerning the measures they may adopt. Laws and regulations for the prevention, reduction and control of marine pollution from foreign vessels in coastal waters cannot hamper the innocent passage of such vessels (Article 211(4) UNCLOS). Nor can such measures apply to the design, construction, manning or equipment (CDEM) of foreign ships, unless they are realising generally accepted international rules or standards (Article 21(2) UNCLOS). No charge may be levied upon foreign ships by reasons only of their passage through the territorial sea; such charges may be levied only as payment for specific services rendered to the ship and must not be discriminatory. Finally, within its EEZ, a coastal State can take measures to protect and preserve the marine environment (Article 56(1)(b)(iii) UNCLOS) provided that such measures give effect to generally accepted international rules and standards established through the competent international organisation or general diplomatic conference (Article 211(5) UNCLOS). The EU is not considered as the competent international organisation in the context of UNCLOS.
The rights of port States are broad, as ports form part of a State’s internal waters and therefore a State has full sovereignty over them. UNCLOS does not define any limits to the conditions a port State may impose for entry into its ports or internal waters. Port States may adopt measures for the prevention, reduction and control of pollution of the marine environment as a condition for the entry of ships into their ports or internal waters (Article 211(3) UNCLOS). The one condition is that they must give due publicity to such requirements and communicate them to the competent international organisation, in this case the IMO14. This wide discretion of a port State to impose and enforce its national rules on foreign ships in its ports is however subject to limits, such as treaty commitments, principles of general international law, reasonableness and proportionality requirements and safeguards for enforcement.
Regardless of whether a flag, coastal or port State, States must comply with the general principles of non-discrimination (Article 227 UNCLOS), good faith (Article 300 UNCLOS) and non-abuse of right (Article 300 UNCLOS). While the EU itself is not a flag State, coastal State or port State, it can impose obligations on those EU Member States which are flag States, coastal States or port States. On the basis of this relationship, this analysis henceforth treats the EU as a flag State, coastal State or port State, as the case may be, and considers that the EU could adopt measures under any of these competences.
Given the lack of limits imposed by UNCLOS on the conditions a port State may impose for entry into its ports, the EU’s authority to legislate on the basis of port State jurisdiction is potentially far-reaching. Nonetheless, the proposed policy options would cover the ship’s passage in waters beyond the port State’s territorial jurisdiction, including periods on the high seas and to and from ports in the territorial waters of third countries. This raises the issue of extraterritoriality, one of the core issues addressed in case C-366/10 on the legality of including aviation within the EU ETS. In its judgment, the CJEU ruled that the EU measure ‘does not infringe the principle of territoriality or the sovereignty which the third states, from or to which such flights are performed have over the airspace above their territory, since those aircraft are physically in the territory of one of the Member States of the European Union and are thus subject on that basis to the unlimited jurisdiction of the European Union’ (paragraph125). The Court further clarified that the EU legislature ‘may in principle choose to permit a commercial activity, in this instance air transport, to be carried out in the territory of the European Union only on condition that operators comply with the criteria that have been established by the European Union and are designed to fulfil the environmental protection objectives which it has set for itself, in particular where those objectives follow on from an international agreement to which the European Union is a signatory, such as the Framework Convention and the Kyoto Protocol’ (paragraph 128).
While similar reasoning can be followed for an EU measure regulating ships’ GHG emissions for their entire voyage from and to EU ports, it should be noted that that UNCLOS sets the principle of exclusive jurisdiction of flag states on the high seas for ships, a principle that
14
MeinhardDoelle,footnote 9, p.7.
Support for the impact assessment of a proposal to address maritime transport greenhouse gas emissions
38
does not exist in aviation. Third countries could challenge options which involve responsibility for emissions of GHG that were released on the high seas claiming that those emissions are the sole responsibility of flag States15. Note however that a legal report by ClientEarth16 argued that even if measures on GHG emissions were considered to have extraterritorial effect, they could still be acceptable under UNCLOS as part of the rights of a port State, as under general international law, a state may adopt regulations with extraterritorial effects if ‘there is a substantial and genuine connection between the subject-matter of the jurisdiction and the territorial base and reasonable interests of the jurisdiction sought to be exercised.’
Moreover, precedents exist of States which have exercised unilateral extraterritorial jurisdiction in the field of environmental protection as a condition for entry into their ports. For example, following the Exxon Valdez accident in 1989, the United States (US), dissatisfied with the ineffectiveness of the international standards on the prevention of pollution from ships, adopted an Oil Pollution Act in 1990 (OPA 90). This act unilaterally imposed double hull requirements on both new and existing oil tankers and prohibited entrance in Prince Williams Sound for unauthorized tankers. Faced with this unilateral measure, the International Maritime Organisation (IMO) had to take action and established double hull standards in 1992 in the International Convention for the Prevention of Pollution from Ships (MARPOL).In conclusion, port State jurisdiction under UNCLOS gives large prescriptive powers which the EU could apply to regulate GHG emissions from ships. For those proposed options that would cover the full length of a ship’s voyage, including segments on the high seas or in the territorial waters of third States, claims of extraterritorial effect or double regulation of emissions could be made.
If the EU and its Member States take action to regulate maritime GHG emissions, it is important to examine how compliance with the EU requirements can be enforced. Although the EU has extensive enforcement powers, in maritime law the EU institutions themselves could not institute proceedings against an operator/vessel since in this area the EU cannot act against natural or legal persons before the CJEU. Thus the necessary enforcement measures against operators violating any EU rules in this area would have to be taken by the EU Member States.
Article 25(2) UNCLOS provides a port State with the right in its internal waters or at its port facilities outside its internal waters to take enforcement action to prevent any breach of the conditions to which admission of ships to internal waters or such a call at port is subject. Port States can carry out enforcement measures such as inspections and withholding of benefits (e.g., prohibition to use port services) within the port and in territorial waters. Where port entry conditions are set unilaterally, it is not yet settled whether this right of enforcement can extend to the EEZ and the high seas. While such inspections could be viewed as violating the right of innocent passage in the territorial waters and the EEZ as well as the freedom of navigation on the high seas it can be argued that a port State could undertake such enforcement measures outside its territorial waters, i.e. by making acceptance of such inspections a condition for entry into its ports17.
Article 218(1) UNCLOS supports the right of a State to take enforcement measures against certain polluting activities outside its territory. According to this article, ‘when a vessel is voluntarily within a port or at an off-shore terminal of a State, that State may undertake investigations and, where the evidence so warrants, institute proceedings in respect of any discharge from that vessel outside the internal waters, territorial sea or exclusive economic zone of that State in violation of applicable international rules and standards established through the competent international organization or general diplomatic conference’. However, this provision only allows port State enforcement of internationally established
15
Article 92 UNCLOS. 16
ClientEarth, ‘Legal implications of EU action on GHG Emissions from the International Maritime Sector’ (November 2011), p. 19. 17
ClientEarth, ‘Legal implications of EU action on GHG Emissions from the International Maritime Sector’ (November 2011), p. 24.
Support for the impact assessment of a proposal to address maritime transport greenhouse gas emissions
39
standards, and does not provide the unilateral right to adopt measures covering polluting incidents on the high seas or in another State’s waters18.
3.2.3 WTO Agreements
The proposed measures to reduce GHG emissions from the maritime sector need to be in compliance with WTO instruments. Every EU Member State is a member of the World Trade Organisation (WTO) as is the EU itself but they work together to act as a single block.
The aim of the 1947 General Agreement on Tariffs and Trade (GATT) is to reduce barriers to trade in the form of tariffs and other obstacles to trade in goods. The proposed EU measures to control maritime GHG emissions aim at regulating the emissions produced by ships that call at EU ports (i.e., during the provision of a service) and not the cargo they transport; consequently, the GATT is not directly relevant to the options reviewed for this study. Since the costs of the goods transported to and from EU ports could be indirectly affected in that shippers’ cost of compliance with the EU measures could be passed on in the prices they charge, the relevant GATT articles are nevertheless outlined below. In any case, the options under consideration should be designed to apply equally to shippers transporting products from other trading partners to the EU and from the EU to other trading partners.
A key principle of GATT is non-discrimination, one element of which is the Most-Favoured Nation (MFN) principle(article I:1). The other element is the principle of national treatment (Article III). Article I:1 of GATT prohibits discrimination between like products from different trading partners. The principal purpose of the MFN obligation is equality of opportunity to import from, or export to, all WTO Members. The MFN principle covers de facto as well as de jure discrimination. If measures that are on their face ‘origin neutral’ in reality enable certain countries to trade in more beneficial terms than others, they may violate the non-discrimination obligation. While the proposed policy options would apply equally to all EU trading partners, partners located further from the EU may argue that their shipping costs would be higher than those nearer to the EU. Similarly, EU trading partners could argue that imported goods are at disadvantage since the additional cost imposed on them is bigger than that on domestic goods which travel shorter distances. These arguments can be rebutted. The costs do not relate to distance but to the emissions and thus to efficiency: the costs incurred on a longer voyage could be lower than on a shorter voyage depending on the particular ship’s efficiency. Moreover, domestic goods may still travel further than imported ones. In any case, it is not clear that the price of the measure will be passed on and the EU is not responsible for the distance of an exporter from a chosen market or for the choice of transport means.
Even if GATT were found to apply and the EU measure considered being inconsistent with one of the GATT principles, the EU would likely to be able to justify its measure under the Article XX exceptions. Application of Article XX of the GATT requires a two-tier test: first, whether the measure falls under at least one of the exceptions in Article XX, and second, whether it is compatible with the chapeau of Article XX.
Article XX provides two exceptions of relevance to the environment under both of which the proposed EU measures can likely be justified if GATT were found to apply and the proposed measure to be inconsistent with one of the GATT principles. Paragraph (b) (‘necessary to protect human, animal or plant life or health’) covers public health and environmental measures while paragraph (g) refers to measures relating to the conservation of exhaustible natural resources.
The chapeau of Article XX provides that measures must not constitute ‘arbitrary or unjustifiable discrimination’ and cannot amount to 'disguised restrictions on international trade'. Elements for assessing if arbitrary or unjustifiable discrimination or disguised restrictions exists include whether there have been good faith efforts for the conclusion of an international agreement, whether there has been an inquiry into the appropriateness of the
18
Alan Khee – Jin Tan, Vessel Source Pollution: The Law and Politics of international regulation(Cambridge University Press, 2006) p. 219.
Support for the impact assessment of a proposal to address maritime transport greenhouse gas emissions
40
regulatory program for conditions prevailing in exporting countries, and whether the discriminatory policies were based on objective criteria. The EU has already made and continues to make serious good faith efforts for the conclusion of an international agreement aimed at the reduction of GHG emissions from ships. The EU would also have to inquire into the appropriateness of the regulatory program for conditions prevailing in exporting countries and ensure that the policy is based on objective criteria. Under those circumstances; a decision to act unilaterally could be argued as not constituting unjustifiable or arbitrary discrimination.
The General Agreement on Trade in Services (GATS) is the only set of multilateral rules governing international trade in services. The key requirement is not to modify the conditions of competition in favour of the Member’s own service industry. The GATS (like the GATT) gives prominence to the MFN principle. Individual countries list in their ‘schedules of commitments’ the sectors they open to free trade of services, the extent of market access given in those sectors (Article XVI) and any limitations on national treatment (Article XVII). In the sectors inscribed in its schedule of commitments and subject to the terms and conditions contained therein, a Member must provide treatment no less favourable to all WTO Members.
Concerning GATS and maritime shipping, the Decision of the Council of Trade in Services of 28 June 1996 (S/L/24) suspends application of the MFN principle to this sector19. However, this does not apply to any commitments already undertaken by WTO Members. According to its current schedule of commitments, the EU has undertaken commitments only in the internal waterways transport subsector, with regard to rental services with operators and rental of vessels with crew (CPC 7213, 7223)20. Therefore, it appears the EU has not decided to ‘open’ the international maritime transport sector within the context of GATS. Indeed, some observers have argued that the international maritime sector remains de facto outside of GATS21.
Although it is unlikely that GATS will be considered to apply, it provides similar exceptions in its article XIV as GATT article XX.
The Agreement on Subsidies and Countervailing Measures (SCM) provides more detailed rules concerning Articles VI and XVI of GATT, which cover anti-dumping and countervailing duties, and subsidies. It covers (i) Members’ power to unilaterally impose duties to counteract subsidised imports and (ii) the principles WTO Members must observe when granting subsidies that have cross-border effects. Two types of design elements in the proposed policy options could be considered subsidies: the award of monetary assistance by the EU or the Member States to the shipping sector to reduce its emissions (under options 1, 2 and 3); and the free allocation of allowances (under option 1). Since these subsidies would be available to the maritime services sector, they would not fall within the scope of the SCM Agreement, which only applies to tradable goods.
The Agreement on Technical Barriers to Trade (‘TBT Agreement’) aims to ensure that technical regulations, standards, testing and certification procedures do not create unnecessary obstacles to trade. Its rules apply to all technical regulations, standards and conformity assessment procedures relevant to trade in goods, i.e., all agricultural and industrial products. While one of the policy options (option 4 - compliance with specific performance requirements) includes a technical standard as a design element, the standard is not a prerequisite for the ship’s import into the EU market as a good, but rather a prerequisite for it to deliver a service which entails calling at an EU port. Given that services
19
Decision on Maritime Transport Services of the Council for Trade in Services (S/L/24 dated 3 July 1996). 20
Note that the GATS schedule of commitments in force is the one preceding the EU enlargements, i.e., there is a schedule of commitments for EC-12 and individual schedules for the other 15 Member States. A certified, consolidated schedule of commitments for EU-25 exists but has not yet entered into force as some Member States have delayed its ratification. 21
Dr. Benjamin Parameswaran, ‘Maritime Transport Services within the WTO / GATS Framework’ (In Went Government Consulting Project in Hanoi and HaiPhong, Vietnam, 2005), available at: www.nciec.gov.vn/doc/inwent/Final_Pres2_Parameswaran_GATS_MTS.ppt(last accessed on 14 May 2012).
Support for the impact assessment of a proposal to address maritime transport greenhouse gas emissions
41
are explicitly excluded from the scope of the TBT Agreement, this analysis concludes that the TBT Agreement does not apply to the policy options under consideration.
3.2.4 Bilateral trade agreements between the EU and third countries
In addition to the trade-related commitments within the framework of the WTO, the EU and its Member States have entered into bilateral trade agreements with third countries. These may also have commitments relevant to the policy options under consideration here.
The Free Trade Agreement between the EU and the Republic of Korea (EU-Korea FTA)22is an example of the new generation of free trade agreements between the EU and its partners and is considered the most comprehensive free trade agreement ever negotiated by the EU. It mirrors the key principles and objectives of the WTO Agreements, including liberalising trade in goods, services and investment. This FTA contains a separate section regulating international maritime transport services which provides for the application of the principle of unrestricted access to the international maritime markets and trades on a commercial and non-discriminatory basis. In addition, it notes that Parties must apply the national treatment principle concerning ships’ access to ports and use of infrastructure. Finally, the chapter on trade in services provides for exceptions, essentially incorporating the provisions similar to those of Article XX GATT. Where the proposed measures are considered as affecting indirectly the goods transported by ships, the analysis under GATT also holds. As far as the FTA provisions on international maritime transport services are concerned, they do not seem to raise any issues within the context of the proposed policy options.
22
Available at http://eur-lex.europa.eu/LexUriServ/LexUriServ.do?uri=OJ:L:2011:127:0006:1343:EN:PDF (last visited on 9 August 2012). It was officially signed in October 2010 and provisionally applied since July 2011.
Support for the impact assessment of a proposal to address maritime transport greenhouse gas emissions
42
4 Design elements common to every policy option
4.1 Overview
A total of four specific policy options are considered in this report:
Emissions trading;
Taxes;
A compensation fund; or
Mandatory emission reductions.
However, there are several design elements common to all of the policy options that are discussed in this section. These aspects relate to the methods used to monitor, report and verify emissions, and to the scope of the policy.
The objective of this section is to perform an initial screening of the options. Options that are shown to be ineffective, legally infeasible or impractical (e.g. if administrative arrangements are extremely complex) are discarded. The reasons for doing so are discussed in detail in the relevant sections. The remaining options are taken forward for in-depth impact analysis in the detailed impact assessment in the next chapter.
4.2 Monitoring, reporting and verification of emissions
The effectiveness of any policy option will depend on the accuracy with which emissions can be monitored and verified. Most policy options require robust estimates of CO2 emissions based on fuel consumed on voyages that fall within the scope of the legislation. Emissions could be estimated using the following formula:
The different options for measuring emissions and the general administrative aspects are presented in this chapter. Compliance requirements specific to each policy option are described individually in the relevant chapters.
4.2.1 Measuring fuel consumption
It should be technically feasible to require that fuel consumption is monitored for compliance, as most ships already do so for their commercial operations. The potential methods for measuring fuel consumption include:
Log books;
Flow meters;
Bunker delivery notes;
Fuel inventories;
Distance-based calculations.
A brief overview of each of these methods is provided in the following sections. There are no current international regulations mandating the use of specific equipment or a certain level of accuracy in fuel consumption measurements and CDEM constraints in UNCLOS would prevent European legislation from requiring vessels to install technical equipment to measure fuel consumption. However, the EU can require vessels entering EU ports to report on their fuel consumption as long as it does not impose the use of specific technical equipment that is not required by international standards. If the uncertainty of current methods was found to
Support for the impact assessment of a proposal to address maritime transport greenhouse gas emissions
43
be too high, European legislation could contemplate pursuing the development and use of international standards for fuel monitoring (CE Delft, 2010).
4.2.1.1 Log books
Log books contain data that could be used to derive fuel consumption. Information includes fuel purchases and consumption, ports visited, cargo loaded and distances sailed.
The disclosure of information in log books is not currently required by any regulation; however, no legal issues are foreseen in making it mandatory for ships to show their log books. This could be required by the Port State authority as part of its discretion to establish conditions for entry into the port. Directive 2009/16/EC on port state control does not currently regulate conditions for entry into EU ports, but focuses on the enforcement of international and Community rules of safety and environmental protection, primarily through the development of specific rules for inspections to be carried out on board ships to ensure they comply with minimum safety standards. The Directive focuses on inspections of sub-standard vessels. Therefore, the systematic conditioning of entry into an EU port to the presentation of certain documentation, such as a logbook, would not require amending the current Port State Control Directive, but could be included in the EU instrument regulating reporting of greenhouse gas emissions from ships.
4.2.1.2 Flow meters
Fuel flow meters can measure the net fuel flow to the engine. For commercial reasons, ships using fuel flow meters would be expected to record fuel consumption for each of their trips. Thus, the additional administrative burden should be low in these cases.
New vessels and large vessels usually have these devices. However, it is not mandatory for a ship to use flow meters, and many older and smaller vessels may use less precise methods to measure fuel flow. Moreover, it is not legally feasible to require foreign vessels to install such a flow meter unless this has been internationally agreed as a CDEM standard. Prices for fuel flow meters in small vessels are estimated between €150 (for the simplest ones) and €550. The accuracy of these flow meters could not be checked as part of this project, but estimates are available from other sources. According to Jamaica’s proposal to the IMO (MEPC 60/4/40), larger vessels have fuel flow meters that can record fuel consumption with an accuracy of ±0.2%. Turbine-type flow meters are also common, but their precision depends on accurate information on viscosity and density of the fuel. Measurements could be taken on the basis of geographic positioning information (GPS), which would capture fuel flow between the start and end of a journey. The environmental effectiveness of this option is considered to be high due to the high accuracy of measurements.
The risk of fraud would be low because the moment when the measurement started and ended could be verified. This should be recorded in fuel consumption log books for every voyage and the procedure should be straightforward for legislation covering inbound movements to EU ports from the last port call outside the EU and outbound movements from EU ports to the first port call outside the EU.
4.2.1.3 Bunker delivery notes
This option would estimate fuel consumption according to the records of fuel purchases in bunker delivery notes. The main advantage of this approach is its simplicity and the availability of compulsory bunker delivery notes for ships engaged in international transport over 400 GT, as requested by Regulation 18 of MARPOL Annex VI and mandatory as of mid-2008. The bunker delivery note includes the name and IMO number of the ship receiving the fuel, the port of bunkering, the marine bunker supplier contact information, fuel quantity and density. Information on the carbon intensity of the fuel is not included, but could be calculated using agreed emission factors. It would not seem legally possible for the EU to extend this requirement to keep bunker fuel delivery notes for types of ships other than those covered by Regulation 18.
Support for the impact assessment of a proposal to address maritime transport greenhouse gas emissions
44
Ships solely engaged in European trade could report emissions based primarily on bunker delivery notes. Total fuel purchases for the compliance period would need to be adjusted to reflect annual consumption by adding the amount of fuel in tanks at the beginning of the compliance period and subtracting the amount of fuel remaining in tanks at the end of the compliance period (see below). The environmental effectiveness of this option would be considered high for intra-EU shipping, as bunker delivery notes are compulsory and they are expected to be highly accurate. Ships falling into this category would need to provide evidence that they have not been involved in extra-EU categories and potentially, evidence of the location of all their fuel purchases. The administrative burden would be very low.
However, this method would not be appropriate for ships involved in extra-EU trade, as it would be not be possible to verify the proportion of fuel purchased that was consumed during activities covered by the legislation unless the routes/speeds of these vessels was tracked. Ships could therefore claim that fuel consumption occurred outside of the scope of the scheme. This would allow significant scope for fraud, which would undermine the environmental effectiveness of the legislation. The administrative burden would be much higher for this option.
4.2.1.4 Fuel inventories
This method would measure fuel consumption on the basis of fuel in tanks at the start and end of each journey and additionally measuring any fuel purchased in between (if relevant).
Fuel use per journey = Fuel in tanks at start of journey + Fuel purchased - Fuel in tanks at the end of the journey
Environmental effectiveness, based on accuracy of measurements would be lower compared to measurements taken using flow meters. Fuel tank levels can be determined by tank soundings, which may be accurate up to 1-5% (CE Delft, 2010). Tank soundings are a common way of measuring fuel levels, and can be directly verified by third parties. Modern ships often use built-in automatic systems to measure fuel tank levels such as pitot tubes or radar tank level indication systems (CE Delft, 2009). The accuracy of these devices relies on regular calibration. Tank soundings can also be manually conducted, although this is much more time consuming. They may be very inaccurate if conducted at sea if the ship is moving. Alternatively, fuel mass can be measured by taking pressure readings from the bottom of a tank.
The responsible entity would ensure that tank level measurements were taken at the start and end of every journey covered by the legislation and that the accuracy of these measurements could be verified by third parties. Fuel purchased during the course of the journey would be recorded in the bunker delivery note (see above).
4.2.1.5 Based on ship movement data
This option would estimate fuel consumption using data from commercial databases on ship movements, port calls and other sources.
Distance travelled, combined with a fuel efficiency index for each type of ship, could be used to estimate CO2 emissions. This would require data from third party providers, which would incur a cost. The automatic generation of estimates is a significant benefit of these systems, although the legality of requesting access to this information remains to be established.
Commercial databases often rely on the information transmitted by an automatic identification system (AIS). These systems are fitted in all ships over 300 GT engaged in international voyages, all cargo ships over 500 GT and all passenger ships. This is a requirement under Regulation 19 SOLAS V, which became effective in December 2004. AIS data is not freely available, because the Maritime Safety Committee agreed that publication of such data could be detrimental to the safety and security of ships and ports. It is now possible to receive AIS signals by satellite in many parts of the world, but coverage is not complete. Besides, SOLAS states that the use of a Vessel Tracking System can be made mandatory only in areas within the limits of the territorial sea of a state. This suggests that
Support for the impact assessment of a proposal to address maritime transport greenhouse gas emissions
45
there could legal challenges to requirements on non-EU ships to provide route information for their journey away from EU ports.
Measures involving AIS data would be limited to ship sizes over 300 GT (with the exception of passenger ships). There is no data that quantifies the amount of emissions from ships <300 GT. However, CE Delft (2009) suggests that only 2.7% of emissions on routes to Europe were from ships <400 GT so this represents the upper limit of emissions that would be excluded. Therefore, a technical constraint of ships >300 GT is not considered to be a problem in terms of reduced environmental effectiveness.
Figure 4.1 summarises the approach followed to estimate emissions from ships by IHS Fairplay. The received identity of each vessel, its location coordinates and speed transmitted through AIS are linked to the information IHS holds in the Register of Ships. Relevant information is retrieved such as type of vessel, number and type of engines, cruise speed, installed power and fuel consumption at cruise speed. The Register of Ships contains fields with information on the type of fuels the main engines are designed for. Together with data on the type of engine, this gives guidance on which types of fuel are possible for use in a particular vessel. The Main Engine(s) often run on Heavy Fuel Oil, which is available in different qualities. On-board power generation and heating is handled by Auxiliary Engines and generators that often run on Marine Diesel Oil, especially on smaller vessels. Ships are checked against a list of ships known to have installed emissions abatement equipment. The reduction factors of the equipment are considered in the calculations for the vessels concerned.
Figure 4.1: Principal methodology for the calculation of fuel consumption and emissions
The environmental effectiveness of this approach would be lower than that of actual fuel consumption measurements provided by ships, if this were the only option for monitoring. This is because they do not take into account the carbon content of different fuels, or provide incentives for operational measures such as slow steaming. Other parameters such as weather conditions and routing would have an effect on overall fuel use. Accordingly, ships would not have an incentive to reduce emissions further below the estimates provided by data suppliers.
GPS sattelites
GPS information:Position, Course, Speed
Ship’s identity
Ship’s database
AIS information
Propulsion power, type of enginesAux engine power, type of enginesType of ship
Fuel consumption=
f( )Speed,Propulsion power, type of engines,type of ships
Support for the impact assessment of a proposal to address maritime transport greenhouse gas emissions
46
One method to improve environmental effectiveness would be to allow ships to submit verified monitoring information if they believe their actual emissions are lower than those calculated (but there would be no obligation to do so). This would restore the incentive to implement measures that are not captured by the distance-based calculation.
The administrative burden would be low for ships and Competent Authorities, but the overall cost would depend on the fees of using this commercial service. The cost could be lower if the crew recorded fuel consumption data themselves.
The risk of fraud is low, as emissions from every ship with an AIS transponder could be tracked. Legally, the information collected on distance travelled would face the same legal constraints as any other option and would thus have to be in line with existing CDEM standards. Moreover, there is an ongoing legal debate as to whether commercially obtained data can be used for regulatory purposes and whether it is legally acceptable for commercial companies to provide this information against the payment of a fee. Given the legal uncertainty, it is an option that would be in great risk of being legally challenged.
4.2.1.6 Option selection
The method depends on the available equipment on board a ship and on the types of movements covered by the legislation (only intra-EU or also to and from third countries). There are currently no international regulations mandating the use of specific equipment or a certain level of accuracy in fuel measurements. Constraints in UNCLOS would prevent European legislation from prescribing a particular method to measure fuel consumption. Therefore, there are limitations as to the type of information or reporting a ship can be required to provide. Additional mandatory reporting requirements can be adopted by a State, though it seems that this would only be possible if the requirement is in line with guidelines developed by IMO.
From a legal point of view (see Section 3), the EU and its Member States on the basis of their authority as port States can set up a mandatory reporting mechanism that requires ships calling at EU ports to report any information gathered on the basis of existing equipment, if no construction, design or manning changes are required to be undertaken. Any requirement to make physical changes to the ship, install new technical equipment or to change manning standards beyond existing internationally recognised CDEM standards would face legal challenges on the basis of the limits under UNCLOS to the authority of a coastal State. However, a state can require reporting to be performed on the basis of all existing technical equipment and can require additional reporting requirements that do not require any physical or manning changes of the ship.
All ships will need to register, either in a registry at the level of one Member State or in an EU-wide registry, and submit the data required by the EU. To enable cross checks of the data submitted, various types of relevant data will need to be submitted to the Competent Authority. The information collected by the Competent Authority will then be included in a national inventory and could be transferred to a Union-wide inventory in line with the legislative proposal for a Regulation on a new monitoring mechanism for greenhouse gas emissions.
The sequence of tasks for monitoring, reporting and verifying emissions to comply with the policies are summarised in Table 4.1 below.
Table 4.1: Tasks for monitoring, reporting and verification of emissions from the shipping sector
Step Task Description Responsibility Frequency
1 Issue MRV guidance
Official guidelines for fuel monitoring should be issued, which all participants of the legislation must follow.
European Commission
Once at the start of the legislation and reviews when necessary.
Support for the impact assessment of a proposal to address maritime transport greenhouse gas emissions
47
Step Task Description Responsibility Frequency
2 Establish and maintain a registry of emission sources
The registry should include all ships and link them to the responsible entity. All compliance entities would have a dedicated account. The registry will keep track of emissions reported and verified of each emission source as well as payments for compliance, if relevant. The Registry should be staffed and maintained.
European Commission
Once at the start of the legislation and continuous maintenance
3 Submit monitoring plan to a Competent Authority
The plan should provide details of the Compliance Entity, including the ship’s IMO number, details about the ship, type of cargo, frequent routes, expected frequency of calls to EU ports, etc. When the plan is prepared jointly for a fleet, it should detail the members and characteristics of the fleet. The Monitoring Plan (MP) will identify the Compliance Entity for the legislation.
The plan will also detail how fuel use will be measured, including uncertainty levels and methodologies. It will also provide information on the documents that could be used by verifiers to cross-check accuracy of the information.
Compliance entity
For every time significant changes occur. For ships making their first call once the measure has started, the MP would be submitted at their first EU port of arrival.
4 Approve monitoring plan
The Competent Authority will approve the monitoring plan which will set the methodology for emissions monitoring against which emissions reports will be verified.
Competent Authority
When an updated MP is sent. For new entrants, approval would be made after the MP is submitted with the first call to an EU port.
5 Monitor GHG emissions
Compliance entities will make sure that emissions are monitored for every voyage covered by the ETS. To do so, they will follow one of the options detailed in the section of this report about monitoring fuel consumption.
Compliance entity
For every ship movement covered by the legislation
6 Prepare emissions report
After the end of each reporting year, or for every ship movement covered by the legislation (to be discussed), responsible entities must submit an emissions report for verification by an accredited external verifier. The European Commission could provide a standard emissions report template or an EU on-line tool that would be compulsory, to ensure harmonisation across Member States.
Compliance entity
Two options: per compliance period (annually) or per voyage (to be assessed)
Support for the impact assessment of a proposal to address maritime transport greenhouse gas emissions
48
Step Task Description Responsibility Frequency
7 Verification of emissions report
The verifier reviews records and calculations made by the Compliance Entity to confirm that the monitoring was performed in accordance with the approved Monitoring Plan and the requirements of the MRV guidance and that the emissions reported are free from material misstatements. The compliance entities would need to correct any mis-statements found by the verifier before the verifier will issue their verification opinion and essentially ‘confirm’ the validity of the operator’s emission report.
Verifier appointed by the Compliance Entity
Same frequency as preparation of report above
8 Submission of verified report to a Competent Authority
The verified report should be sent to the relevant Competent Authority, who would then acknowledge receipt.
Compliance entity
Two options: annually or per voyage
The discussion in this chapter confirms that it should be possible to estimate fuel consumption for all ships by some method. Ships should be required to submit a monitoring plan confirming that fuel consumption would be measured by the most accurate and cost-effective method available to them. However, further studies need to be conducted on the actual accuracy of the various methods in practice, so that official guidelines can be issued. A detailed analysis of the accuracy, cost, time required and possibilities for third-party verification is needed before a concrete recommendation can be made.
4.2.2 Frequency of reporting
There are two main options for the frequency of reporting emissions: per voyage or annually. In both cases, there are some challenges when enforcing emissions reporting by ships departing from EU ports towards extra-EU destinations. Evasion could be deterred if a common EU registry of outgoing ships is kept so that they could be easily be tracked when they return to the EU.
4.2.2.1 Reporting for each voyage
The first option would involve ships reporting their emissions for every voyage covered by the legislation to the relevant Competent Authority at their arrival at an EU port. Reported emissions would need to be verified on arrival.
Ships leaving an EU port for an extra-EU destination would need to report their emissions when they next return to an EU port. A Registry would track the obligations of all these ships.
This option could be appropriate for ships calling rarely at EU ports, as it would ensure that all relevant voyages are reported. Evasion by infrequent visitors would be identified and tackled as it happens, whereas if reporting was on an annual basis it would only be detected at the end of the year. The legislation would also avoid problems with tracking compliance entities if they change during the compliance period.
However, this option would impose a high cost on Competent Authorities, due to the need to record emissions continually. Inspection, verification and enforcement of every vessel calling at an EU port would not be feasible. It would also place very high requirements on vessels with frequent EU port calls, mainly those dealing only with intra-EU trade, ferries, RoRo, RoPax, offshore and fishing. Such a scheme could also lead to significant delays and congestion in ports.
Support for the impact assessment of a proposal to address maritime transport greenhouse gas emissions
49
4.2.2.2 Reporting for each compliance period
The option of reporting emissions once for each compliance period (e.g. annually) would reduce the administrative burden for Competent Authorities and for ships calling frequently at EU ports. Compliance entities could collate emissions data once a year and prepare a single emissions report, to be verified by a third party. However, this option has a greater scope for evasion if the Compliance Entity changes during the compliance period or in the case of ships that do not call frequently to EU ports. The application of additional financial penalties or the risk of being denied entry on their next call to the EU may act as a deterrent to evasion. However, this implies that ships must be tracked or that coordination between various ports in Europe is ensured.
4.2.2.3 Option selection
Due to the high administrative burden of reporting emissions for each voyage, it is recommended that annual reporting is allowed for ships engaging in intra-EU trade and ships that call frequently at EU ports wherever possible. Ships calling infrequently at EU ports may need to report emissions for each voyage, although even in such cases, it should still be possible to allow annual reporting.
4.2.3 Verification of fuel consumption
The accuracy of fuel consumption reported by responsible entities could be cross-checked by using ship location tracking data provided by AIS (as described above). Distance-based measures are suitable for identifying gross misreporting of fuel consumption. In areas beyond national jurisdiction, many vessels even switch off their AIS transponders for reasons of security. Unilaterally making the use of a vessel tracking system mandatory beyond its territorial waters would be an infringement of UNCLOS, unless agreement were reached within the IMO by a majority among all Parties. In any case, there could be legal challenges to requirements on non-EU ships to provide route information for their journey away from EU ports, though foreign vessels could provide this information on a voluntary basis. The possibility of using AIS data for a vessel could thus be included in reporting guidelines, but should not be made mandatory.
Long-Range Identification and Tracking (LRIT) allows ships to be tracked globally. It was established in 2006 as resolution MSC.202(81). The regulation applies to all ships engaged in international voyages which are passenger ships, cargo ships of 300GT or above and mobile offshore drilling units. Ships must communicate their identity, position, the data and time worldwide and continuously. Contrary to AIS, which does not transmit information globally, the LRIT would be suitable for global monitoring of ships. The regulation allows for the information to be used, by SOLAS Contracting Governments, for security and other purposes as agreed by the Organisation. Other purposes have been said to include search and rescue operations, but also marine environment protection purposes (Resolution MSC 242(83), adopted in 2007. The LRIT requires information to be reported by certain types of ships, every six hours. The specific standards for LRIT reporting have been adopted by the IMO. Any other information than that required by those IMO standards could not be required unilaterally by the EU. The LRIT Regulation requires the types of vessels mentioned above to report automatically, through the use of Vessel Traffic Services (VTS), to their National LRIT Data Centre. This centre will then, in accordance with the data-sharing rules of the regulation, through the International Data Centre, make data available to the Data Centres of other States, to which a vessel with their flag is directing itself. However, Regulation V/19-1 clearly states that it maintains the right of a Flag State to protect information about the ships flying their flag, while allowing coastal States to access information about ships navigating off their coasts. SOLAS Contracting Governments will be entitled to receive information about ships navigating within a distance not exceeding 1000 nautical miles off their coast and on ships that have indicated they will board in the port of a state. Therefore, the national data centre has the right to make available only the information relating to a part of the journey or for those ships that have indicated from their last port of call that they are heading to the EU with the intention of entering an EU port. As a consequence, data would not be available to
Support for the impact assessment of a proposal to address maritime transport greenhouse gas emissions
50
the EU authorities for the entire distance travelled from last port of call for international journeys. Any changes to the current LRIT system would require agreement within the IMO.
Any information that is readily available on the basis of an international CDEM standard or agreement, such as the use of bunker delivery notes or logbooks, could be required as a condition for access to EU ports. All vessels of a certain type (e.g. over 400 GT) are required to have these documents on board. Requiring them to be shown to a port authority cannot be considered as a CDEM standard as it does not require any physical, construction or manning changes on board the ship – therefore it would be legally feasible to do so.
Any requirement to make physical changes to the ship, install new technical equipment or to change manning standards beyond existing internationally recognised CDEM standards would however face legal challenges on the basis of the limits under UNCLOS to the authority of a coastal State.
In addition, it seems possible for the port state authority to carry out inspections aboard ships to ensure the ship complies with the requirements of the state.
4.2.3.1 Option selection
A system of distance-based emission calculation could be desirable because it would be highly automated. However, the costs of implementing such a system are uncertain as it relies on data supplied by third parties. Verification of fuel consumption is possible using a variety of other methods; as with monitoring, further studies are needed on the relative accuracy, costs and time implications of these options; therefore it is not possible to recommend a best choice at this stage.
4.2.4 Emission factors
Measured emission factors provided by fuel suppliers could be allowed for the calculation of emissions. In their absence, conservative default values would be an appropriate alternative. There are several estimates for carbon content and equivalent CO2 emission factor of marine fuels.
The IPCC guidelines, 1996, provide the following estimates for tonnes of CO2/tonne of fuel:
Table 4.2: CO2 emissions of fuels
Type of fuel Default Low High
Marine diesel and marine gas oil (distillates)
3.19 3.01 3.24
Residual fuel oil 3.13 3.00 3.29
IMO (2009) provides similar factors as the IPCC default for distillates and RFO as well as an emission factor of 2.75 tonnes of CO2/tonne of fuel for LNG.
Fuels used for maritime transport are much more diverse compared to those used in other sectors (e.g. aviation). Analysis of the bunker samples on board would be needed to ensure emission factors were accurate in all cases. This would involve a high administrative cost for compliance entities.
4.2.4.1 Option selection
On the basis of the above analysis, it is recommended that default emission factors are established in alignment with international policy (e.g. using IMO factors). There could be an option for compliance entities to submit measured emission factors if this would lead to improved emission estimates, but there should be no obligation to do so. Further guidance provided by the Commission or foreseen in the IMO would be required on the accuracy of existing emission factors and the potential gains from a more costly approach involving sample analysis.
Support for the impact assessment of a proposal to address maritime transport greenhouse gas emissions
51
4.2.5 Competent Authority
The Competent Authority would be responsible for approving monitoring plans, receiving and validating verified emissions reports. In addition, for certain market-based measures the Competent Authority would also be responsible for issuing credits or allowances and cancelling them against reported emissions. There are two main options: a Central European regulator or Member States. Regardless of the final choice, a central European registry should be established to enable information sharing about port calls among Member States and specifically ports with responsibilities to enforce the legislation.
4.2.5.1 Central European Regulator
A single European Authority could be designated as Competent Authority. Responsible entities would have to register their ships with that Authority. This could reduce the administrative complexity of allocating each ship or fleet to a specific Member State and could facilitate the pan-European collection of revenues (for policy options that include this possibility).
Note that the collection of tax revenues is a Member State competence. While a number of European agencies collect various types of fees, these are typically for services rendered, such as review of applications for EU-level licenses or quotas. If the revenues to be collected were considered fees rather than taxes; it might be legally feasible for the proposed single European Authority to carry out such collections. This question, however, requires further investigation.
Alternatively, the Council could unanimously decide that all or part of the revenues accrued under the policy options constitute a new own resource for the EU; the Competent Authority could then be funded by the general EU budget to the extent of the revenues. Revenue recycling could thus be implemented under this option. Some of the revenues collected could be used to cover the administrative costs of Member States with duties in the enforcement of the legislation.
4.2.5.2 Member States
Member States could also designate national Competent Authorities. In this case, rules would need to be set over how ships would be assigned to Member States. If ships had EU flags, they could register with their flag state. If ships had non-EU flags, they could register with the Member State whose ports they visited most frequently. However, the most visited port is not static over time, as ships can change their trading patterns. Alternatively, ships with non-EU flags could be assigned to the Member State responsible for the port at which they first call. Responsible entities could bundle all the ships they are responsible for into a single Competent Authority to avoid dealing with multiple administrations.
This option would be more administratively complex compared to a single European regulator. Some types of vessels have highly variable routes (i.e. tramp shipping) which could make it difficult to allocate them to a unique Member State. It could generate a huge administrative burden, particularly if Competent Authorities needed to be changed.
4.2.5.3 Option selection
From a legal perspective, both options are viable. The recommended choice is to establish a central European regulator, as this has several benefits in terms of administrative simplicity.
4.3 Scope of emissions covered
There are three types of scope discussed in this section relating to:
Geographical scope, or the scope of journeys covered;
Scope of ship types covered;
Scope of ship sizes covered.
Support for the impact assessment of a proposal to address maritime transport greenhouse gas emissions
52
4.3.1 Journeys covered
The journeys covered should include all incoming and outgoing ships from the EU. It is essential to define the starting (or finishing) point of the covered ship movement. The starting point is the point from which the emission calculations are to be started for the journey leading up to and including the arrival at an EU port. The finishing point is the point up to which the emissions calculations are to be finished for a journey starting in an EU port.
Some of the potential options for coverage of ship movements that have been discussed with the EC are geographic delimitation based on:
Time before calling at an EU port;
Distance before calling at an EU port;
Previous port of call; and
Origin of the transported cargo.
To ensure non-discrimination, the journeys covered should include internal EU journeys as well as all incoming and outgoing ships from the EU.
4.3.1.1 Time limit
A time limit approach would involve setting a fixed number of days before arrival at an EU port and/or after departure from an EU port and measuring all emissions during that period.
The scope of emissions covered by this option, and therefore its environmental effectiveness, depends on the time limit set and on the potential for evasion. A long time limit would increase environmental effectiveness, but emissions would be included for journeys that are not related to the transport of cargo to or from the EU.
Ships involved in extra-EU trade could evade the legislation in two ways. Firstly, ships could avoid calling at EU ports and instead call at extra-EU ports close to their destination and deliver the cargo to the final destination using a different transport mode. The most likely alternative ports are described in Section 4.3.1.3. The second opportunity for evasion would involve speed reductions during the set time limit followed by speed increases after the limit has been passed. This would not result in carbon emission reductions for the journey overall.
It would be difficult to verify the accuracy of reported fuel consumption data. Even though ships usually send noon reports that include data on fuel use per day, it could be difficult to verify that the fuel consumption corresponds to the right time.
A number of legal issues arise with respect to the option of basing the scope of emissions on fixed time periods before arrival at and following departure from an EU port. On the one hand, it is a quite arbitrary way to delineate the scope of GHG emissions to be covered by EU action, and it would be difficult to show the relevance of the fixed time limit to jurisdiction on the basis of port State authority.
4.3.1.2 Distance limit
A distance limit approach would involve calculating emissions for a set distance after and before calls to EU ports. There are several options to define the distance limit, among which are: territorial waters (12 n mi), contiguous zone (24 n mi) and Exclusive Economic Zone (200 n mi), or distance beyond the contiguous zone, with the last of these involving the highest environmental effectiveness due to the highest scope of covered emissions. The scope of emissions covered by including only territorial waters would be low, since the distance travelled in EU waters would usually be short in comparison to the entire journey. The disadvantage of this approach is that it could include journeys that are not related to voyages to EU ports. The distance limit does not include or exclude vessels of various speeds though, so in that respect a distance limit would be preferable to a time limit.
Support for the impact assessment of a proposal to address maritime transport greenhouse gas emissions
53
Reliability would be low, as it is difficult to enforce measurements of fuel consumption based on a distance limit. Currently there are no existing practices requiring ship operators to monitor fuel consumption or activity data up to a specific distance and therefore new procedures would need to be introduced. For competent authorities, it would be difficult to verify that the measurements were taken at the right location.
The main way to evade legislation covering a specific distance would be calling at ports outside the distance determined by the legislation, as ships could only be made liable once they call at European ports.
Distance-based options covering EU territorial waters or the contiguous zone are legally compatible with UNCLOS and customary international law for ships that call at EU ports, but not for ships that pass through these waters but do not stop in EU ports as this might violate their right of innocent passage. The option covering a distance up to the EEZ is also likely to be politically acceptable but the legality is not as clear as for territorial waters and the contiguous zone, as UNCLOS jurisdiction is explicit only for protection of marine environment.. In addition, a limit based on a fixed distance to all EU ports would be arbitrary in the same fashion as a time-based limit, given the widely differing geographical situation for different EU ports.
4.3.1.3 Previous/next port of call
In this option, the scope of emissions included would be determined on the basis of port calls. For inbound voyages to an EU port, the starting point for the emissions calculation would be the last port of call outside the EU and the end point would be the first port of call within the EU. For outbound voyages leaving the EU, the starting point for the emissions calculation would be the port or departure within the EU and the end point would be the first port of call outside the EU. Additionally, the emission from all journeys between two EU ports (i.e. intra-EU voyages) would also be included in the scope of coverage.
The scope of emissions covered by this option is considered high and hence its potential environmental effectiveness is high.
Environmental effectiveness also depends on the scope for evasion. There are two main ways to avoid reporting emissions for the whole length of the voyage to the EU. One would be offloading the cargo in a port outside the EU and using another vessel or transport mode to reach the final destination. Another option would be to add port calls closer to an EU destination, to avoid reporting emissions from the initial loading port. Additional scope for evasion would come from departing ships calling at extra-EU ports. These ships may not yet know their final destination when departing and it could be difficult for EU Competent Authorities to track their emissions from outgoing journeys. This could be mitigated if the Competent Authorities have access to AIS data and keep records of all outgoing ships that would need to report emissions on their next call to an EU port.
If the scope of coverage includes only incoming ships, the issue of non-discrimination could be raised. Such a scheme would benefit exporters from the EU, who would not have to incur carbon costs for their emissions in voyages out of the EU, as compared to importers to the EU that would be covered by the scheme.
Ensuring reliability would place a high administrative burden on competent authorities, as they would need to track the destinations of outbound ships and keep records of outbound ships pending declaration of emissions. Last port of call could be verified through available information such as bills of lading that are provided to customs at every port of call. AIS data could also support verification of routes of incoming and outgoing ships. The administrative burden for compliance entities would come from the need to measure fuel consumption, and in some policy options, also activity data (cargo multiplied by distance) for every movement covered by the scheme. The burden could be minimized for ships involved only in trade within the EU, as they would be able to monitor and report their emissions annually. For ships calling at EU and extra-EU ports, the burden would be higher, as they would have to
Support for the impact assessment of a proposal to address maritime transport greenhouse gas emissions
54
track the voyages covered by a EU scheme and report their emissions for these annually, or for every port call (depending on the compliance mechanism of the selected option).
Regarding legal feasibility, this option does not pose the same problem of arbitrariness as the two previous options considered, in that the GHG emissions covered would have a more direct relation to the EU and its authority as a port State.
4.3.1.4 Origin of the transported cargo
It could be argued that the ideal starting point for the calculation would be the origin of the cargo, and the ideal finishing point would be the destination of the cargo. A large proportion of port calls involve ship loads with a single bill of lading (IHS, 2011), where ships load or discharge all the cargo on-board at a single destination. In these cases, this option would be equivalent to the option of last (and next) port of call, unless the ship carried out additional port calls for bunkering, maintenance or safety reasons. This option would be difficult to implement for ships with multiple bills of lading, that part-load or discharge their cargo in several ports. This is mainly the case for container ships, general cargo ships and RoRo ships sailing from non-EU ports.
The scope of emissions covered by this option would be higher than the option of last port of call. Additionally, the scope for evasion would be smaller as evasion would require trans-shipping the cargo. This would considerably increase the costs of avoidance.
The reliability of emissions data in this option would be similar to an approach based on the last port of call, except for ships with multiple bills of lading, for which this option could be infeasible. The last port of call option could be preferable for ships with multiple bills of lading. In general, this scheme would involve a higher administrative burden for Competent Authorities than a last port of call approach, as they would have to verify the number of bills of lading on board the ship to decide if the approach is applicable or not. There are systems that would facilitate tracking the origin of the cargo. The Import Control System (ICS) transmits information on ports of loading and discharge, weight and content of containers, and consignee for incoming ships. All containers arriving in the EU must have an ENS (Entry Summary declaration) completed by the charterer or operator electronically 24 hours before their upload in the foreign port. For bulk cargo and non-containerised cargo, all cargo with destination to the EU must be registered by the consignee four hours before their discharge in the first EU port. Customs deliver an authorization of discharge (MRN, Movement Reference Number). The ICS system makes fraud very difficult, as it is based on the electronic declaration of cargo. All the departure and arrival ports must be declared. Even if the ships made supplementary stops, for technical or commercial reasons, this would not have an impact on the departure port. In order to change the departure port, it would be necessary to have two bills of lading and break the guarantee of a transport from origin to destination, which would most likely be opposed by charterers. The new custom rules that allow knowing where the cargo goes after their port of loading up to their port of discharge can facilitate the process of monitoring. However, the ICS is not fully operational, and it would only apply to incoming, not outbound ships.
To avoid discrimination under UNCLOS, the option would need to cover ships going out from EU ports to non-EU ports where EU products were off-loaded, as well as incoming ships.
4.3.1.5 Option selection: scope of emissions coverage
Several options are discarded at this stage as follows:
Time limit: If the time limit was high enough to cover movements outside of EU jurisdiction, this option would be politically difficult to defend given the missing EU relevance of some voyages covered. Conversely, if the time limit was set low, this option would have low environmental effectiveness. It would also be difficult to verify that reporting covered the specified time limit, so reliability would be low and evasion could be high.
Support for the impact assessment of a proposal to address maritime transport greenhouse gas emissions
55
Distance limit: The reliability of this option is low and evasion could be high, as it would be difficult to ensure compliance entities recorded their consumption up to the defined distance limit. The environmental effectiveness would be low because the distance limit would be likely not being extended beyond the EU contiguous zone for political reasons.
Hybrid option: Origin of the cargo (for ships with a single bill of lading), and last port of call for ships with multiple bills of lading. This option is discarded due to the extremely high administrative burden involved. It can also be noted that this option might face a risk of challenge under GATT, as it refers to the cargo and not merely to the maritime sector.
The remaining option for a GHG emissions reductions scheme for shipping is for the scope to cover emissions to EU ports from the last port of call, and from EU ports to the next port of call (plus all intra-EU voyages). However, there are legal issues that would need to be carefully assessed. Section 2.2 presents a legal rationale for actions for all ships arriving at EU ports that addresses their greenhouse gas emissions beyond EU waters. However, as noted in section 2.2, this approach could be open to legal challenge, for example from flag states.
4.3.2 Ship type coverage
In order to maximise the emissions covered under the scope of the policy, it is preferable to include all ship types. However, certain design choices may preclude this. Technical constraints specific to individual policy options have been examined in the relevant section for each policy option. More general options for ship type scope are included here. The options considered are:
1. All ships (for maximum emission coverage);
2. Exemptions for certain ship types with a view to excluding small emitters; and
3. Exemptions for ship types with a view to reducing administrative burden.
4.3.2.1 All ships
Market-based measures could in theory be applied to all ship types, unless there are practical constraints relating to calculation methodologies used in MRV (e.g. use of an EEDI- or EEOI-based indicator, as specified in Section 9).
4.3.2.2 Exemptions for certain ships: excluding small emitters
Exemptions could be offered for certain ship types if they are deemed to have a social benefit and/or they account for only a small proportion of overall emissions. Ship types that emit less than 1% of total EU-27 emissions are summarised in Table 4.3.
Support for the impact assessment of a proposal to address maritime transport greenhouse gas emissions
56
Table 4.3: Ship types above 300GT that emit <1% of total EU-27 emissions
Ship type Ship subtype Number of ships Percentage of total emissions in EU-27
Yacht All 580 0.49%
Service Research 98 0.07%
Tug 979 0.54%
Dredging 202 0.31%
SAR & patrol 72 0.04%
Workboats 172 0.16%
Other 93 0.12%
Fishing All 390 0.24%
Offshore Crew/Supply Vessel 10 0.00%
Platform Supply Ship 248 0.27%
Offshore Tug/Supply Ship 50 0.04%
Anchor Handling Tug Supply 216 0.28%
Support/safety 273 0.27%
Pipe (various) 34 0.12%
Drilling 12 0.03%
Platform & Storage 17 0.05%
Other tanker All 69 0.24%
Other dry Landing craft 4 0.00%
Special 108 0.27%
Miscellaneous Barge & pontoon 27 0.01%
Other 83 0.09%
Source: Ricardo-AEA analysis of IHS Fairplay data
These are generally offshore vessels, service vessels, yachts or fishing vessels. Exclusion of these ship types means that the number of vessels included in the scheme is reduced by 14%, but the total emissions covered is reduced by only 3%. In some cases, the potential for evasion could increase if operators could replace ship types covered under the scheme with ships of types which are not covered under the scheme. The vessels excluded in this case are rather specialised, with a limited overlap in function with other ship types, therefore the potential for switching is considered to be low.
4.3.2.3 Exemptions for certain ship types: Reducing administrative burden
From an administrative perspective it would be desirable to optimise the policy in terms of having the maximum amount of emissions while minimising the number of ships concerned.
In this section, a number of prioritisation strategies are reviewed including:
1. Comparing the share of emissions to the share of vessels;
2. Prioritising by contribution to overall EU-27 emissions;
3. Prioritising by CO2 emissions per vessel.
Strategy 1: Comparing the share of emissions to the share of vessels
The contribution to total EU-27 emissions from each ship type is shown in Figure 4.2, as well as the proportion of total vessels concerned. The ship types are ranked such that the ones with the highest percentage-point difference between the share of total emissions and the share of total vessels are at the top.
Support for the impact assessment of a proposal to address maritime transport greenhouse gas emissions
57
Figure 4.2: Percentage of emissions vs percentage of total vessels attributable to each ship type
Source: Ricardo-AEA analysis
If the aim is for 80% of emissions to be included, then the legislation could exclude general cargo ships, service vessels, offshore vessels, yachts, bulkers and fishing vessels. If the target for emissions covered in the scope of any policy was increased to 90%, then only general cargo ships, service vessels, offshore vessels and yachts could be excluded. However, prioritisation of ship types in this manner is not considered optimal because it is possible for general cargo vessels to carry out the work of some other vessel types (although
23%
8%
4%
3%
14%
2%
11%
2%
1%
3%
0%
2%
8%
2%
1%
1%
5%
10%
8%
1%
1%
0%
12%
0%
9%
1%
0%
3%
0%
3%
9%
3%
3%
4%
11%
31%
General cargo
Service
Offshore
Yacht
Bulker
Fishing
Chemical tanker
LPG
Miscellaneous
Other dry
Other tanker
Vehicle
Oil tanker
RoRo
LNG
Cruise
Ferry
Container
% contribution to total EU-27 CO2 emissions % of total vessels
Support for the impact assessment of a proposal to address maritime transport greenhouse gas emissions
58
usually only the smaller versions of cargo ships e.g. bulkers), so this could lead to some avoidance (IHS, 2011).
Strategy 2: Prioritising ship types by their contribution to overall emissions
Ship types could be prioritised by their contribution to overall emissions in the EU-27. This information is shown in Figure 4.3, where the percentages refer to the contribution from each ship type to total emissions in the EU-27.
Figure 4.3: Contribution to total EU-27 emissions by ship type
Source: Ricardo-AEA analysis
According to this prioritisation strategy, in order to include 80% of total emissions in the scope of the scheme, the ships highlighted in red in the diagram above should be included. In order to include 90% of total emissions in the scheme, the ship types highlighted in green should also be included. Those which only make a small contribution to total EU-27 emissions include LNG/LPG tankers, other dry bulkers, service vessels, offshore vessels, yachts, fishing vessels and other non-specified types.
In general, the administrative burden is likely to be lower if the number of ships included in the scope of the scheme is reduced. According to this prioritisation strategy, if at least 80% of EU-27 emissions are to be included, then the number of ships would be reduced by 77%, and if 90% of total emissions are to be included, the number of ships reduces by 24%.
0%
0%
0%
0%
1%
1%
1%
3%
3%
3%
3%
4%
8%
9%
9%
11%
12%
31%
Miscellaneous
Fishing
Other tanker
Yacht
Offshore
Service
LPG
Other dry
LNG
Vehicle
RoRo
Cruise
General cargo
Oil tanker
Chemical tanker
Ferry
Bulker
Container
80% of EU-27 emissions from these ship
types
90% of EU-27 emissions from these ship
types
Support for the impact assessment of a proposal to address maritime transport greenhouse gas emissions
59
Strategy 3: Prioritising ship types by the CO2 emissions per vessel
Ship types could be prioritised by their emission intensity within the EU-27 (i.e. tonnes of CO2 emitted per vessel). This information is shown in Figure 4.4, where the blue bars represents emission intensity, and the green curve represents the cumulative emissions from the fleet, as taken from the top of the graph and summing downward.
Figure 4.4: tCO2 emitted in the EU-27 per vessel
Source: Ricardo-AEA analysis
The ships which populate the lower end of the scale (fishing vessels, service vessels, yachts etc.) are smaller vessels which tend to emit lower levels of CO2 per ship. In order to reach coverage of approximately 80% of emissions, all vessels with carbon intensity greater than or equal to that of bulkers must be included in the scope of the scheme. In order to reach approximately 90% of emissions, all vessels with carbon intensity greater than or equal to that of LPG tankers should be included.
Comparison of the prioritisation strategies
The three different prioritisation strategies are compared in Table 4.4. From an administrative perspective it would be desirable to optimise the policy in terms of having the maximum amount of emissions while minimising the number of ships concerned.
- 5,000 10,000 15,000 20,000 25,000 30,000 35,000
Fishing
Service
Yacht
Miscellaneous
Offshore
General cargo
Other tanker
LPG
Chemical tanker
Bulker
Other dry
Oil tanker
Vehicle
RoRo
Ferry
Container
Cruise
LNG
EU-27 Average
CO2 intensity (tCO2 per vessel per annum)
100%
99%
98%
98%
97%
89%
89%
88%
79%
66%
64%
55%
52%
47%
37%
6%
3%
cumulative CO2 as percentage of total EU-27 emissions
Support for the impact assessment of a proposal to address maritime transport greenhouse gas emissions
60
Table 4.4: Comparison of prioritisation strategies
Prioritisation strategy Percentage of ships included for a target of:
80% of emissions 90% of emissions
1. Comparing % of emissions to % of vessels 62% 65%
2. Prioritisation by contribution to total emissions 23% 76%
3. Prioritisation by CO2 emissions per vessel 46% 59%
Source: Ricardo-AEA
If the aim is for 80% of total emissions to be covered, the biggest reduction in ship numbers is achieved by prioritisation according to contribution to total emissions from each ship type (strategy number 2). Only 23% of the total EU-27 fleet would need to be included in the legislation. If the target is 90% of emissions, then prioritisation of ships according to CO2 emissions intensity per annum results in the largest reduction in ship numbers, as 59% of the fleet would need to be included in the legislation.
4.3.3 Ship size thresholds
A minimum size threshold would reduce the amount of emissions included in the scope of the legislation. Although smaller ships have low absolute levels of emissions per vessel (IMO, 2009), there are large numbers of small ships, and they generally have a higher frequency of port calls (IHS, 2011). The administrative burden for competent authorities could thus be reduced by excluding smaller ships, but still aiming for a high level of environmental effectiveness. Therefore, one option is to extend the scope of the scheme to cover the largest ships until a certain percentage of total emissions are included. This could also be beneficial in terms of avoiding discrimination, as smaller ships may face disproportionate compliance costs, for example, as transaction costs in an ETS.
A negative effect of a size threshold would be the potential for gaming the threshold by using ships just below it, which could distort the competitive market for ships just above the threshold set. This issue could be dealt with by using thresholds already in use in the regulation of maritime transport (CE Delft, 2009). Therefore, another option is to use a threshold of 400 GT that is common in maritime environmental legislation.
The options for ship size thresholds when considering administrative burden are therefore:
Legislation applies to all ship sizes;
Legislation applies to ships > 400 GT; and
Legislation applies to ships > 5,000 GT
We note that 500 GT is the limit used in SOLAS. However, as MARPOL is the convention related to pollution from ships, and any future amendments to MARPOL, including for energy efficiency, or potentially GHG measures, are like to set similar thresholds. For this reason, it was considered more relevant to use the 400 GT threshold.
4.3.3.1 All ships regardless of size
Including all ships would limit the possibilities to track ship movements and emissions with the use of AIS or Long Range Identification and Tracking (LRIT), as only ships over 300 GT are obliged to carry this equipment (see previous section). Alternatively, small ships could be obliged to install the tracking technology – many already opt to carry this equipment (IHS, 2011). However, as noted earlier in this report, any extension of this requirement to ships under 300GT could be open to legal challenge under UNCLOS as being a CDEM requirement outside of internationally agreed standards, unless the new requirement was agreed by a majority of IMO Members.
Including all ships would considerably increase the administrative burden of the legislation, multiplying the required costs of verification and control by the regulator, while providing
Support for the impact assessment of a proposal to address maritime transport greenhouse gas emissions
61
limited additional benefits in terms of emissions reductions. Given the small share of emissions of ships below 300 GT as compared to the high administrative and transaction costs for the regulator to control emissions of small ships and for compliance entities to operate in the market, this option is not considered to be cost-effective.
4.3.3.2 Ships larger than 400 GT only
A threshold of 400 GT has been suggested in several proposals to the IMO. A size limit of 400 GT could be chosen in order to harmonise the policy with MARPOL, which commonly uses this threshold for regulation. This would have precedence as an internationally recognised cut-off point, and in theory minimise the possibility of the threshold being challenged as being arbitrary in nature. According to emissions estimates derived from AIS data provided by IHS for the year 2010, almost 99% of shipping emissions in the EU-27 come from ships larger than 400 GT. The IHS data may be somewhat distorted because ships smaller than 300 GT are not required by law to carry an AIS transponder. However, a high proportion of ships smaller than 300 GT carry an AIS transponder voluntarily. As a cross-check, according to CE Delft (2009), only 2.7% of emissions on voyages to Europe came from ships smaller than 400 GT, therefore the scope of emissions under the scheme would be more than 97%. The results of both estimates suggest that the scope of emissions would be high.
A size limit of 400 GT would make it simpler to implement any measures which rely on the provision of a bunker delivery note for verification of fuel purchases, as ships under 400 GT are not obliged to carry the notes (under Regulation 18 of MARPOL Annex VI).
If a certain ship size threshold was applied to any policy to control EU maritime GHG emissions, operators could evade the scheme by using a ship which falls just below the threshold for inclusion. In the case of a 400 GT limit, most of the ships clustering around this size are non-cargo ships (dredgers, tugs, research vessels, fishing vessels, passenger ships etc.). The possibilities for evasion by cargo ships (which are the source of the majority of emissions) would most likely be limited to general cargo ships, of which there are only a small number at these sizes. Therefore, risk of this type of evasion would be highest for policies which include non-cargo ships (IMO, 2009).
4.3.3.3 Ships larger than 5,000 GT
A size limit of 5,000 GT has been proposed with a view to limiting the administrative burden (in terms of the number of ships included) while maintaining a high coverage of emissions. Table 4.5 shows the impact of the different size options on the percentage of vessels and percentage of total CO2 from shipping in the EU-27.
Table 4.5: Comparison of options
Ship size % vessels % of total CO2 in EU-27
Include all ships > 400 GT 93% 99%
Include all ships > 5,000 GT 57% 91%
Source: Ricardo-AEA analysis of AIS data provided by IHS Fairplay
It can be seen that selection of ships according to vessel size has a far better trade-off in terms of reducing the number of ships while maintaining a high level of emission coverage compared to the prioritisation strategies for ship type. The IHS data suggests that only including ships larger than 5,000 GT would capture 91% of total CO2 emissions in the EU-27. Note that SOLAS uses 5,000 GT as a threshold for certain technical equipment requirements. In addition, the 1992 International Convention on Civil Liability For Oil Pollution Damage uses 5000 GT as the floor for Article V liability.
Support for the impact assessment of a proposal to address maritime transport greenhouse gas emissions
62
4.3.4 Option selection
4.3.4.1 Ship type
In order to cover all emissions, all ship types would need to be included; however, this could be ineffective from an administrative perspective. Certain ship types could be excluded from the scheme, as they only account for a small proportion (<1%) of total emissions. These vessel types include offshore vessels, service vessels, yachts or fishing vessels. Exclusion of these ship types means that the number of vessels included in the scheme would be reduced by 14%, but the total emissions covered would be reduced by only 3%. Other strategies to reduce the administrative burden by exempting certain ship types have been investigated above, but they appear to be less effective compared to strategies based on ship size.
4.3.4.2 Ship size
A ship size limit of 5,000 GT would capture the majority of emissions (91%) while excluding a large number of smaller ships (43% of ships would be excluded). A threshold of 400 GT has been suggested in previous studies; however, according to the AIS data provided by IHS, using this threshold would include 99% of emissions but only reduce the number of vessels included by 7%.
Table 4.6 shows the impact of different combinations of ship size and scope.
Table 4.6: Impact of different scopes for ship type and ship size on emissions and vessel coverage
Criteria % vessels % of total CO2
in EU-27
Excluding offshore vessels, service vessels, yachts or fishing vessels
86% 97%
Excluding ships smaller than 5,000 GT 57% 91%
Total for combined criteria (accounting for overlaps) 56% 90%
Source: Ricardo-AEA analysis of AIS data provided by IHS
In summary, if the scope excludes offshore vessels, service vessels, yachts and fishing vessels, and is limited to ships larger than 5,000 GT, then it will cover 90% of total shipping emissions in the EU-27, while only including 56% of ships. However, it has to be noted that the added value of excluding ship types in addition to the exclusion of smaller ships is rather limited and may lead to a certain risk of avoidance.
4.4 Overall emissions reduction target of the regulation
There are two options to set the overall emissions reduction target of the scheme which are analysed here:
1. Based on historical emissions and an agreed reduction path;
2. Based on a climate stabilization scenario.
4.4.1.1 Based on historical emissions and an agreed reduction path
Setting a cap based on historical emissions and a reduction path would allow the sector to adapt gradually. This is the approach taken in the EU ETS, which initially took 2005 as a baseline. The inclusion of aviation in the EU ETS also has a cap based on average historical emissions from 2004 to 2006.
The agreed reduction path should be based on what is considered to be a fair level of effort to reduce emissions. It could be based on the European Commission’s White Paper Impact Assessment (2011), which analyses the potential for CO2 reductions in the maritime sector under three different policy options compared to business-as-usual projections. The policy options were developed following two external studies and a long consultation process. It concluded that CO2 emissions from international maritime transport would decrease by
Support for the impact assessment of a proposal to address maritime transport greenhouse gas emissions
63
around 40% between 2005 and 2050 in two of the policy options, and by 50% in the third. This analysis is the basis of the specific target introduced in the European Commission’s Transport White Paper of a reduction in EU CO2 emissions from maritime bunker fuels by 40% (if feasible 50%) by 2050 compared to 2005 levels. Intermediate targets could be introduced for example for example for 2020 and 2030, to improve the predictability of the scheme.
4.4.1.2 Based on a climate stabilization scenario
The IPCC estimated that in order to limit global temperature increases to 2°C, industrialised countries need to reduce their GHG emissions by 25-40% by 2020 compared to 1990 levels (IPCC, 2007). With this in mind, a reduction of approximately 30% below 1990 levels has been suggested, which would represent the upper bound for a cap (Oko-Institut, 2009). This is equivalent to reductions of 59% over 2005 levels (this figure is indicative only). If this method was chosen to set the level of the cap based on uniform reduction factors of all sectors and modes of transport, a more detailed assessment would be needed to generate a likely range of reductions.
Such a target for the maritime sector would be similar to the reductions expected of the stationary sector under the EU ETS. It does not explicitly consider the ability of the sector to meet the reduction.
4.4.1.3 Option selection
The option of setting a cap based on historical emissions and an agreed reduction path would provide more certainty to the scheme and is compatible with previous EU policies. The administrative burden of this option would also be lower than an option based on a climate stabilisation scenario, as relevant calculations of appropriate target levels have already been undertaken by the EC, following an extensive consultation of industry and Member State stakeholders. The selection of the first option would also ensure coherence with previous EU policy and reduce uncertainty for stakeholders.
The impact of different cap levels on the shipping sector will be analysed quantitatively with the TIMES-based shipping model (see section 10 and the Technical Annex).
4.5 Responsible Compliance Entity
The responsible Compliance Entity will be accountable for compliance with the legislation, including activities such as: monitoring and reporting emissions; procuring verification services if required and providing allowances or payments related to the specific policy option selected.
The ship should be the ultimate entity accountable for these activities. Ships can be identified through their IMO number, a permanent number that every ship has for registration purposes (IMO resolution A.600(15); SOLAS Chapter XI). However, the ship itself cannot perform the required activities for compliance and cannot pay levies, surrender allowances or implement specific measures. The ship is not a legal entity, which is essential for the system to be enforceable.
Therefore a clear responsible legal entity needs to be defined. The maritime sector is highly fluid and involves a range of ownership and commercial arrangements that make it difficult to identify the final party responsible for the shipping activities covered by an emissions reduction scheme. Figure 4.5 shows the main actors involved in shipping activities, classified into three groups: ownership, commercial operations and management. In addition to these parties, fuel suppliers and port authorities could also be potential responsible entities due to their direct control in the supply of fossil fuels, which are the main source of GHG emissions in shipping, as well as their role in enforcing the legal framework for shipping.
Support for the impact assessment of a proposal to address maritime transport greenhouse gas emissions
64
Figure 4.5: Ownership, commercial operation and management in shipping activities
Source: authors
The main potential options for responsible entities in a potential scheme to reduce GHG emissions from shipping are:
Registered owner;
Ship operator;
Charterer;
Fuel supplier;
Port; and
The ship, with no indication of who the legally responsible entity should be
Understanding existing arrangements in international shipping law is essential in the definition of a feasible responsible entity. However, owner/operator relationships can be quite fluid in the maritime sector. Therefore, both SOLAS and MARPOL name several possible responsible entities, thus setting up a type of cascade system in which responsibility goes either to the owner or to another entity which has assumed duties and responsibilities for the ship, such as the operator/manager/charterer (see Box 4.1)
Box 4.1: Responsibility under SOLAS and MARPOL
The International Convention for the Safety of Life at Sea (SOLAS) governs the safety of merchant ships: its main objective is to specify minimum standards for the construction, equipment and operation of ships, compatible with their safety. Flag States are responsible for ensuring that ships under their flag comply with their requirements and a number of certificates are prescribed in the Convention as proof that this has been done. For example, according to Regulation 4(1) of Chapter IX of the SOLAS Convention, a document of compliance shall be issued to every company which complies with the requirements of the International Safety Management Code; only those companies that have been provided with the document of compliance are allowed to operate ships.
It should be noted that Regulation 1(2) of the same Chapter provides that “company” shall mean “the owner of the ship or any other organization or person such as the manager, or the bareboat chartered, who has assumed the responsibility for operation of the ship from the owner of the ship and who on assuming such responsibility has agreed to take over all the duties and responsibilities imposed by the
Support for the impact assessment of a proposal to address maritime transport greenhouse gas emissions
65
International Safety Management Code” (emphasis added). As a consequence, it would seem that the owner of the ship is the first entity who is obliged to comply with the requirements – however, in the presence of a contractual arrangement between the owner and another entity – the operator, the manager or charterer – this obligation can be passed on.
Similar provisions are seen in the MARPOL Convention and in the International Maritime Safety Management Code (ISM Code): i.e. obligations can be imposed not only upon the owner of the ship but on other entities as well. For example, according to Regulation 5 of Annex IV of the MARPOL Convention, either the owner of the ship or its master are responsible for reporting any incidents or a defect which may substantially affect the efficiency/completeness of the ship’s equipment. Under the ISM Code, referring to the company that shall provide for the safe practices in ship operation and a safe working environment, the owner, manager or bareboat chartered are all mentioned (Article 2(2)(2) of ISM Code).
4.5.1 The registered owner
The ship owner might be an individual, company or financial institution, and is therefore a legal entity. Although ships can be sold, the ownership usually remains fairly stable (Oko-Institut, 2009).
Regarding administrative feasibility, ship owners should be identifiable on the basis of the IMO number of the ship. Ship owners are linked to a ship by the SOLAS regulation, Chapter XI. The International Convention for the Safety of Life at Sea (SOLAS) requires that each registered owner has a mandatory company and a registered owner identification number. The ships certificates for compliance with SOLAS identify the owner of the ship, and could therefore be used to trace responsibility in a shipping emissions reductions scheme. SOLAS and MARPOL, however, indicate the owner or operator/manager/charterer as responsible.
Ship owners have direct control over the technical factors that determine emissions. They also have control over some operational factors, such as the frequency of maintenance. Depending on the charter arrangements, the ship owner can also retain control over most operational factors. For example, in a voyage charter (for a certain point-to-point voyage), the charterer would hire the vessel for a single voyage, and the vessel's owner (or disponent owner) would provide the master, crew, bunkers and supplies. The owner could therefore be responsible for instructing the crew to implement operational measures that reduce emissions, such as lower speeds or voyage planning according to tides and weather. In a time charter, the owner still manages the vessel but may lose control over some operational measures, as the charterer gives orders for the employment of the vessel. Finally, in the demise or bareboat charter, the charterer would take responsibility for the crewing and maintenance of the ship during the time of the charter, assuming the legal responsibilities of the owner (the charter would be known as the disponent owner). In this case, the owner would lose control of operational factors to reduce emissions. However, the ship owner could delegate responsibility to the charterer for compliance with an emission reductions policy, which could be set out in the charter contract.
Although ship owners are often located within the territory of countries outside of the EU, this should not create any legal problems. Port states have significant autonomy under UNCLOS to make port entry conditional upon a number of requirements provided these requirements are not discriminatory or disproportionate.
As regards compatibility with a potential future global scheme to reduce maritime GHG emissions, the ship owner is already liable in several international conventions and other initiatives. Operational procedures, management systems and liability rules, such as the International Safety Management (ISM) code, often hold the ship owner responsible. Likewise, the International Convention on Civil Liability for Oil Pollution Damage places the liability for oil pollution damage resulting from maritime casualties involving oil-carrying ships on the owner of the ship. Under MARPOL Annex VI, which provides regulations for the Prevention of Air Pollution from Ships, the ship owner is responsible for obtaining an International Air Pollution Prevention certificate (IAPP) which is issued by the ship’s flag state’s Administration or a Recognised Organisation (RO) for any ship of 400 GT or above.
Support for the impact assessment of a proposal to address maritime transport greenhouse gas emissions
66
The owner can delegate responsibilities to other parties, as has been the case in Norway’s tax on nitrogen oxides, where foreign owners are responsible but are required to nominate a representative, who is jointly liable for the tax (CE Delft, 2009). The owner could therefore designate an agent for specific matters. This makes sense particularly for policy proposals that require ad hoc payment of taxes or levies for fuel purchases.
Several proposals to the IMO for schemes to reduce GHG emissions from shipping have favoured the denomination of the ship owner, being the entity identified in SOLAS, as the responsible entity, but this assumes a global system, in which most owners participate and flag and port states have similar interests.
4.5.2 Ship operator
The ship operator organises the daily operations, as well as ensuring adherence to international, national and local standards on the vessel. The ship manager may or may not be the same as the operator. Ships are often managed by shipping companies who organise the manning of the ship and are responsible for charter contracts. The tie to the ship is fairly stable (Oko-Institut, 2009).
As regards administrative feasibility, the commercial operator is not required to have an IMO number and may not be immediately identifiable. The number of ship operators is smaller than the number of ships, which would reduce the administrative burden.
There should be no legal impediments preventing the ship operator as a legal person responsible for compliance. Ship operators can be responsible for compliance with international conventions such as SOLAS, MARPOL or CLC. They can assume the responsibility for the ISM code from the ship owner, in which case they would become the holder of the Document of Compliance (DOC) and become identifiable and responsible.
As regards environmental effectiveness, the ship operator would be the entity most likely to be able to optimise day-to-day running of the ship, although there may be constraints imposed by contractual obligations. The operator would also have the ability to decide the most appropriate balance between operational measures and payments for emissions (buying allowances or paying a levy, for example). However, the operator would generally have limited control over technical measures.
Some proposals to the IMO favour the ship operator as the legally responsible entity. The point of obligation would be individual vessels (as identified by their IMO number).
4.5.3 Charterer
A charter party is the contract between the owner of a vessel and the charterer for the use of a vessel. The charterer takes over the vessel for either a certain amount of time (a time charter) or for a certain point-to-point voyage (a voyage charter). In the time charter, the owner still manages the vessel but the charterer gives orders for the employment of the vessel. In a voyage charter, the charterer hires the vessel for a single voyage and the vessel’s owner provides the master crew, bunkers and supplies. There is a subtype of time charter called the demise or bareboat charter, in which the charterer takes responsibility for the crewing and maintenance of the ship during the time of the charter, assuming the legal responsibilities of the owner, which is known as a disponent owner.
Charterers are identifiable through their contract with the ship owner, but during a certain period a ship could have several charterers, which could make them difficult to track. Besides, not all ships are chartered, as some are operated by the owner. These issues could create a significant administrative burden for Competent Authorities to track the charterers and allocate responsibilities to them.
As regards environmental effectiveness, the charterer can have control over operational factors affecting a ship’s emissions, depending on the specific contractual arrangements. However, it would generally not have control over technical measures.
Support for the impact assessment of a proposal to address maritime transport greenhouse gas emissions
67
Charterers could have specific obligations under international conventions on shipping if agreed with the owner. They have not been proposed by any party as responsible entities under a potential global scheme to reduce GHG emissions from shipping.
4.5.4 The fuel supplier
If the fuel supplier was made the responsible entity of a shipping emissions reduction scheme, it would have to pay contributions for its fuel sales to ships.
In terms of administrative burden, fuel suppliers would be easy to identify, and their numbers are significantly lower compared to ships. Fuel suppliers are already involved in monitoring and reporting bunker sales at the national and international level for the development of national inventories under the UNFCCC, and therefore it would not be difficult to implement a monitoring and reporting system. One potential administrative problem would be the difficulty in differentiating between bunker fuel used for activities covered by the scheme and those purchased for other purposes.
In terms of environmental effectiveness, fuel suppliers do not have direct control over reducing emissions from shipping. These decisions are made by ship owners and operators or, in some cases, the charterer. Besides, in a regional scheme, ship operators would have the option to bunker in countries that are not Parties to the emissions reduction scheme, which would render the policy ineffective.
The option of fuel suppliers as responsible entities has been proposed in the submission to the IMO for an International Compensation Fund. No legal obstacles are seen in terms of making the fuels suppliers a responsible entity for policy options that involve fuel excise taxes.
4.5.5 The port
This option would mean that each EU port would be responsible for the emissions of the ships calling in and out (depending on the scope selected) of that port. This is an option for market based measures, but is not relevant for technical options where the ship would be responsible for compliance, and a responsible legal entity would be liable in case of failure to comply.
Depending on the specific policy selected, if ports were the designated responsible compliance entities, they would need to surrender allowances (in an ETS) or pay levies or taxes for emissions of ships calling at their ports.
This option has administrative advantages, as ports are stationary installations, easily identifiable and this designation would considerably reduce the number of responsible entities by providing a “point of aggregation” for the emissions of all the ships calling at them.
From an environmental effectiveness perspective, although port managers may make decisions that have an impact on shipping emissions, such as the implementation of just-in-time arrivals or the minimisation of emissions in ports, these emissions represent only a small share of total shipping emissions. Additionally, port managers cannot directly influence investment decisions or the actual operation of ships and therefore do not have direct control over the majority of ship emissions. While increased port dues could provide a price incentive to reduce emissions, defining and agreeing sufficiently accurate and harmonised mechanisms could be very difficult given the wide variety of approaches to the charging of port dues that exists in the Community. If ports failed to pass on the costs, then the legislation would not provide the right incentives and the objective of the policy would not be achieved. On the other hand, ports would not be interested in any measures that make them less competitive and reduce shipping demand to their ports. If competent authorities impose charges on ships that are too high, they risk losing business to nearby harbours that do not penalise inefficient ships as heavily. This makes a case for defining authorities which are large enough to avoid the risk of losing customers to neighbouring areas.
Support for the impact assessment of a proposal to address maritime transport greenhouse gas emissions
68
From a legal perspective, in contrast to the previous choices for responsible compliance entities (ship operator, ship owner, charterer, fuel suppliers) which will most likely be private legal persons, ports can be public, private or semi-public entities. As entities having legal personality, they can be held legally responsible for complying with certain obligations imposed upon them by law. Whether the entity is a private or public entity would rather have an impact on the procedures for decision-making within such an entity and the fact whether they can be held politically accountable for some of the decisions taken. However, while no legal problems are foreseen in imposing enforcement obligations to ports for ensuring compliance with the surrendering of allowances under a market-based mechanism, it is highly questionable whether ports can be compliance entities responsible for the GHG emissions of the ships that come into or leave the ports. For one thing, this would not be in accordance with the polluter pays principle in that the ports themselves would not be the polluters. Moreover, a port would not necessarily be informed in advance of how many ships with high or low emissions will enter in the coming year. It is therefore difficult to impose the cap for GHG emissions on the port.
Jamaica’s proposal to the IMO (MEPC 60/4/40) suggests a mechanism to create an incentive for emissions reductions in ports, the Port State Levy. This would levy a uniform emissions charge on all vessels calling at participating ports, based on the amount of fuel consumed on that voyage. Since this would be a market-based mechanism, this could be implemented and enforced via EU ports. However, port rates are often negotiated and the resulting contracts are not in the public domain (Kageson, 2007). This creates great uncertainty in the carbon price being passed on to operators and therefore the level of incentive being created.
4.5.6 The ship as accountable entity without indication of who should be the legal entity responsible
The second IMO GHG report (2009) takes this perspective, indicating that the ship would be accountable and could be held liable if it is not compliant. Ships are easily identified by their IMO number, whereas other stakeholders (owner, charterer etc.) could change several times in a year. In the case of non-compliance, it would be possible to impose penalties on the ship, such as denying the right to call voluntarily at EU ports.
One problem with this approach is that in the case of long-term time charters that commence prior to and continue beyond the entry into force of the legislation, the issue of financial responsibility for emissions units may not have been addressed in the agreement. This eventuality, which would affect a finite period, would require the creation of a legal responsible entity when one has not been appointed in the relevant contracts.
The question of whether ships can be designated as the legally responsible entities is closely related to the question whether ships have a legal personality. Whilst some commentators have claimed that ships have a legal personality of their own in some jurisdictions, in the course of this study no such jurisdictions have been identified within the EU.
It would be difficult to designate ships as the legally responsible entities in the context of the present policy options, in that the ships themselves would not be able to ensure compliance. Other EU legislation refers to vehicles (motor vehicles and airplanes) and to buildings and appliances, but in these cases puts obligations for their design or operation on physical or legal persons such as manufacturers (e.g. for motor vehicles), operators (e.g. for commercial vehicles) or owners (e.g. for buildings).
The fact that the ships have a nationality and that obligations may be imposed directly upon them does not provide a solution to the problem of which natural or legal person would be eventually responsible for complying with the imposed requirements. Even if the ship is the entity emitting the greenhouse gases that will be targeted by an ETS, system of taxes or levies, or other policy option, the EU legislation will still need to designate which natural or legal person (owner, charterer, manager) will have to ensure compliance with these obligations.
Support for the impact assessment of a proposal to address maritime transport greenhouse gas emissions
69
4.5.7 Option selection: responsible entity
Based on the previous analysis, the most appropriate responsible entity would be the registered ship owner. The registered ship owner could delegate its responsibility for compliance to other parties. Whilst the ship owner would be the ultimate responsible party and subject to liability if the nominated parties do not meet their responsibilities, the EU legislation should also name the ship’s operator, manager and/or charterer as also holding responsibility, even if not specifically nominated by the owner. This would be a cascade system similar to those already used for the maritime sector in such instruments as SOLAS and MARPOL.
The European Commission or the relevant Competent Authorities could maintain a list linking ships with their registered ship owners and the party nominated by ship owners as responsible for compliance. Further provisions may be needed depending on the option – e.g. whether the entity needs to pay emissions taxes or demonstrate purchase of allowances.
Regarding the fuel supplier, a clear legal feasibility is seen only for option 2a, a fuel excise tax.
4.6 Enforcement
Port authorities are the most appropriate entities to ensure enforcement. In the most extreme cases, it is envisaged that ports would have the power to detain or deny entry to ships that are found not to be in compliance, based on information provided by the Registry of emission sources, until the matter is satisfactorily resolved. However, this would be an extreme measure, and would not be applied until all other avenues have been investigated.
Any enforcement penalty should be severe enough to ensure that responsible compliance entities meet the legal requirements of the policy measure. If penalties are set too low, many ship owners may choose to pay the penalties instead. Penalties for non-compliant ships could include:
Imposition of monetary penalties such as fines per allowance or in relation to tax-payment shortfalls, in relation to a shortfall in meeting minimum ship efficiency standards or for not contributing to a Compensation Fund.
Denial of port services such as refuelling or unloading cargo;
Detention of the ship;
Denial of the right to call voluntarily at EU ports
With respect to the latter two sanctions, note that under the Paris MoU on Port State Authority, decisions to detain a ship or to refuse it access to a port should be taken in line with the relevant guidance (PSCC Instruction) agreed by the Port State Control Committee under the IMO. As types of deficiencies that might warrant what it calls ‘appropriate action’, the Paris MoU mentions deficiencies ‘which are clearly hazardous to safety, health or the environment’ if the operation of the ship were continued.
Note, however, that while ports in theory would have the power to detain or deny entry to ships that are found not to be in compliance, based on information provided by the Registry of emission sources, until the matter is satisfactorily resolved, this might be considered a disproportionate action under the Paris MoU. The EU would need to make the case that failure to report emissions per compliance period, failure to give up the required number of allowances, failure to meet a specified emission reduction target, etc. would be deficiencies that would warrant detention or refusal of port access.
Support for the impact assessment of a proposal to address maritime transport greenhouse gas emissions
70
4.7 Summary of common design elements
This section has provided an overview of the generic aspects common to all policy options that could be implemented by the EU to reduce maritime GHG emissions. The conclusions, based on the analysis of the advantages and disadvantages of each option, are presented in Table 4.7 below.
Table 4.7: Summary of common design elements
Common design element
Options considered for further analysis
Options NOT considered for further analysis
MRV Issuing official guidelines, the content of which is pending further analysis
Mandating specific technologies e.g. flow meters
Frequency of reporting Annual;
Per voyage
N/A
Emission factors Aligned with international legislation (e.g. IMO values)
N/A
Competent Authority Central European Register (preferred)
Member States
N/A
Scope of emissions Last/next port of call;
Time limit;
Distance limit;
Origin of cargo
Ship type coverage All ship types;
Exemptions for small emitters
Exemptions to reduce administrative burden
Ship size coverage Based on a threshold e.g. >400 GT or >5,000 GT
All ship sizes
Overall emission reduction target
Based on historical emissions and agreed reduction path
Climate stabilisation scenario with uniform reduction factors for all sectors and modes of transport
Responsible Compliance Entity
Ship owner;
The ship operator and the charterer should also be named as per the cascade systems in SOLAS and MARPOL.
Fuel supplier (for taxes on fuel)
Ship operator (direct);
Charterer (direct);
Port;
Ship
Options have been discarded if they are shown to be infeasible, ineffective or involve a prohibitively high administrative burden. For a detailed discussion of each aspect, the reader is referred to the relevant section of the report. Other options may not be assessed quantitatively if there are no feasible alternatives.
The remaining options are taken forward for an in-depth analysis as part of the impact assessment.
Support for the impact assessment of a proposal to address maritime transport greenhouse gas emissions
71
5 Policy option 1: Emissions trading scheme
5.1 Description of the policy option
A cap and trade Emissions Trading Scheme (ETS) operates by setting a cap on aggregate emissions from a defined group of emitters in a certain compliance period. The cap defines the overall limit on the emissions from all of the participants in the scheme and therefore certainty is provided over the amount of emission reductions that will be achieved. Each participant must monitor and report their emissions to the appropriate authority, and submit to the regulator a number of allowances equal to their emissions during the compliance period. Allowances can be auctioned and/ or allocated free of charge to the participants.
By creating a market price for emissions, an ETS encourages participants with low marginal abatement costs to implement abatement measures and to sell their allowances to participants with higher abatement costs. As a result, reductions are achieved in the most cost-effective manner, i.e. allowances are traded to cover emissions that are more costly to reduce than the current carbon price (Aldy & Stavins, 2011).
All technical and operational measures that reduce greenhouse gas emissions (by reducing fuel consumption or switching to low-carbon fuels) would be rewarded for both new and existing ships which suits the diverse nature of the industry. An ETS could also result in emission reductions by lowering maritime trade activity within the regulated scope of the scheme. The carbon price could influence demand if it translates into higher freight rates. The final impact of freight rates increases on transport demand depends on the price elasticity of shipping demand. However, this effect is expected to be small because these elasticities appear to be low in shipping (with the exception of short-sea shipping on certain routes as the competition with land-based modes is more direct) (IMO, 2009). Finally, emission reductions could be directly financially supported if allowances were auctioned and the revenue was hypothecated to promote low-carbon innovation in the shipping industry or climate change mitigation actions in other sectors.
5.2 Design elements specific to an ETS
5.2.1 Open or closed system
A closed system would mean that allowances would only be traded within the part of shipping sector covered as defined by the legislation. A maritime ETS could also be linked to other carbon markets such that participants could trade with other sectors, thus allowing emissions to be reduced where abatement costs are lowest (i.e. an open system). Other carbon markets could be other ETSs or out-of-sector project credits e.g. Clean Development Mechanism and/or Joint Implementation projects. There are several variations which are analysed in this section:
1. Closed system; 2. Open system, linked to other ETSs; 3. Open system linked to out-of-sector project credits (with no restrictions); and 4. Open system linked to out-of-sector project credits (with restrictions).
5.2.1.1 Closed system
Under a closed EU maritime emissions trading scheme, allowances could only be traded among participants of the scheme itself. Examples of closed systems with an absolute cap in the maritime sector include the US NOx and SOx ETS. US SO2 “Acid Rain” Trading began in 1995, and California “RECLAIM” SO2 and NOx trading began in 1994 (Oko-Institut, 2008).
Support for the impact assessment of a proposal to address maritime transport greenhouse gas emissions
72
The environmental effectiveness of an ETS is generally determined by the cap, which sets an upper limit on the permissible emissions from the sector. In a closed scheme a cap would need to be more generous as there would be no out-of-sector solution if it is later proven to have been too low. A more generous cap implies a lower environmental effectiveness.
The certainty of in-sector emission reductions would be the highest of all the options considered in this section, because they would be confined to the shipping sector; i.e. no out-of-sector emission reductions would be rewarded.
The cost of allowances would be equivalent to the marginal abatement costs of the maritime sector. When abatement opportunities in the sector are more expensive than in other sectors, a closed scheme is expected to lead to higher carbon prices than an open scheme. Although marginal abatement cost curves in the shipping sector show that there is a considerable potential for emission reductions at negative cost, this potential has not been realised, which indicates the existence of hidden costs unaccounted for. In this case, a closed scheme could have significant economic impacts on the shipping industry.
The stability of the carbon price is an important consideration to promote long-term investment in abatement measures. Market volatility is likely to be greater in a closed scheme, as it would be highly affected by the business cycle of the shipping sector. In an open system the volatility of the shipping sector could be compensated by the performance in other sectors, which would reduce the uncertainty of carbon prices and hence facilitate investment decisions on low-carbon technologies.
The administrative burden for a closed scheme is the lowest of all the options considered in this section, because there is no need to ensure compatibility between different schemes or to negotiate mutual recognition of different allowances.
5.2.1.2 Open system, linking to other ETS
An open emissions trading system is one that can be linked to other systems. Linking allows tradable permits from other systems to be used in order to meet compliance obligations. This section considers direct linking, that is, where either one or both systems accept the other’s allowances.
Having an open system suggests the cap could be more stringent because it offers participants additional flexibility. If ships were unable to reduce their emissions, they could purchase allowances from other systems. Therefore, the certainty of in-sector emission reductions is lower, but the overall emission reductions in the linked systems would still remain below the aggregate cap.
In theory, having an open scheme increases efficiency by taking advantage of diverse marginal abatement costs, thereby reducing the total costs in the linked systems for the same overall environmental outcome. Due to the potential for reduction of compliance costs and improved market liquidity, linkage between ETSs has attracted some interest. The maritime ETS proposal to the IMO is an open scheme, as it would not limit the growth of shipping, provided it made the necessary contributions to emission reductions in other sectors.
While it is technically feasible to link schemes, there is a need to ensure compatibility between design elements which may require additional administrative procedures. The price and effect on emissions in one system is influenced by developments in linked systems, including political decisions. For example, any link with another ETS would propagate price controls from one system to another, so it would be necessary to ensure harmonization across the schemes.
Price volatility influences how effective the scheme would be in overcoming investment uncertainty. In principle, a larger system or a group of linked ETS are expected to have lower price volatility than a smaller or single ETS. On the other hand, price volatility could also be 'imported' from a linked system.
Support for the impact assessment of a proposal to address maritime transport greenhouse gas emissions
73
Revenues generated through purchase of maritime ETS allowances would accrue to the Competent Authority for the maritime ETS. Allowances purchased from other sectors would accrue to the relevant Competent Authority for that scheme, so total revenues for the maritime ETS Competent Authority could be reduced.
One-way linking would mean that the maritime ETS could accept allowances from other ETS schemes, but maritime allowances would not be accepted elsewhere. This would set an upper limit on the carbon price in the maritime sector, as it would not exceed the price of allowances in other sectors. It would be necessary to ensure that there are sufficient allowances in the external systems.
Issues of fairness are also raised, as some participants could be worse off compared to when they were in a separate system. For example, if the shipping sector becomes a net buyer of external allowances, prices in the linked programmes may be higher than they would otherwise have been. Thus, while this may result in an overall reduction in abatement costs, not everyone will benefit. Several studies have reported that the fuel efficiency of ships could be significantly improved at net profit, and that this potential will grow in the coming decades (see for example, IMO, 2009; IMarEST, 2010). However, other studies (e.g. ICS, 2009) consider it likely that shipping will be a net purchaser of allowances.
5.2.1.3 Open system, linked to out-of-sector project credits with no restrictions
Linking a maritime ETS to out-of-sector project credits would allow a form of indirect linkage between different cap-and-trade systems. As a result, the allowance prices of the linked cap-and-trade schemes would converge and all the benefits of direct linkage are achieved without raising some of the concerns that may impede direct linkage (IPCC, 2001). Such a system could also be expanded globally, or allow a diverse set of regional maritime CO2 reduction policy instruments to be linked.
If out-of-sector project credits (e.g. Clean Development Mechanism and/or Joint Implementation projects) are accepted, it would in theory lower the cost of compliance and reduce price volatility.
The supply of offset credits is potentially very large, which would enable a very ambitious cap to be placed on the shipping sector. This could reduce the certainty of overall emission reductions being achieved in practice, as there is some debate over whether these types of projects truly lead to additional abatement. A high level of integrity of the emissions reductions used as offsets would be required to ensure environmental effectiveness.
The administrative burden would be similar to a closed scheme, but with some additional procedures to ensure recognition of out-of-sector allowances. These procedures should not be difficult to implement, as they already exist as part of the EU ETS.
This scheme would allow the maritime sector some flexibility in meeting the emission cap, and would mitigate the impact of an unexpectedly high carbon price. The balance to strike is between having acceptable costs and environmental effectiveness, against the possibility of having to purchase out-of-sector allowances.
Revenue generation would depend on the mechanism to allocate allowances and the level of the cap set. Assuming that auctioning is the preferred mechanism for the allocation of allowances, a scheme linked to external credits would involve lower revenues for EU Member States. Since project credits are generally expected to come from developing countries where marginal abatement costs are lower, acceptance of these credits would lower the carbon price for the maritime industry; therefore the revenues per tonne CO2 covered will also be lower. However, the cap is likely to be more stringent, leading to a higher number of allowances being purchased.
A heavy reliance on offsets from non-European projects could be contradictory to the EU’s leadership in efforts to mitigate climate change. The more project credits that are bought, the higher the emission reductions achieved outside the EU. Unlimited access to flexible mechanisms would almost certainly lead to lower emission reductions within the EU,
Support for the impact assessment of a proposal to address maritime transport greenhouse gas emissions
74
because in the absence of sufficient commitments outside of Europe, the supply of credits may be plentiful. At the same time this would decrease incentives for significant changes in the maritime industry, and erode the potential of a carbon pricing mechanism to improve the competitiveness of the sector.
5.2.1.4 Open system, linked to out-of-sector project credits with restrictions
A further variation could entail a minimum proportion of maritime ETS allowances to be submitted each year, with the remainder met by either maritime ETS allowances or by out-of-sector project credits. The proportion of external credits that can be used could be set at, for example, 15% of the total emissions of each ship. This would provide more certainty on the reduction achieved in shipping emissions, while limiting the impacts of the carbon price on the maritime sector. Under the EU ETS, credits for up to 50% of the overall reductions made below 2005 levels are allowed.
One problem with complete linking is that it can reduce control over the design and impacts of the trading system. This option allows a certain amount of control to be retained over the maritime system, while still allowing indirect linkages to any other systems that are commonly linked to the out-of-sector project mechanism.
Restrictions on the types of credits that would be accepted could be introduced, which would exclude credits assessed to be of lower quality. This would help to mitigate concerns over whether the emission reductions are truly additive. For instance, under the EU ETS most categories of JI/CDM credits are accepted but certain types are not permitted. Credits that cannot be used are those from afforestation, reforestation and nuclear projects. From 2013 credits from HFC23 and N2O from adipic acid production cannot be used. As in the previous option, one downfall of this approach is the current uncertainty as regards the prospects of climate change negotiations and the future of the Kyoto Protocol.
The administrative burden would be similar to a closed system, but with additional procedures to ensure that out-of-sector project credits are of sufficient quality and do not exceed the permitted levels of substitution.
Other impacts are expected to be part-way between a closed scheme and an open scheme linked to out-of-sector project credits – depending on the proportion of out-of-sector project credits that would be accepted.
A scheme with links to out-of-sector project credits has been favoured in the ETS proposal to the IMO by Germany, France, UK and Norway. Therefore, such a scheme would be expected to have high acceptability among Member States and a high potential for global expandability.
5.2.1.5 Option selection
The analysis has shown that open systems could be more cost-effective and environmentally effective. In open schemes, emission reductions will occur in the sectors where they are cheaper to implement. However, systems with no limits to the number of non-maritime allowances that can be used for compliance risk reaching a very low level of abatement in the shipping sector. This is particularly true of project credits given their lower price in the international carbon markets compared to allowances from the EU ETS.
On the other hand, a closed scheme presents the benefit of lower administrative costs for implementation, as well as higher certainty of in-sector emission reductions achieved.
5.2.2 Method for allowance allocation and distribution
After determining the number of allowances, policymakers must decide how to distribute them among compliance entities. There are several possible procedures, mainly:
1. Full auctioning with no revenue recycling 2. Full auctioning with revenue recycling 3. Free allowances, based on historic emissions
Support for the impact assessment of a proposal to address maritime transport greenhouse gas emissions
75
4. Free allowances, based on output benchmarks 5. Hybrid: partial free allocation with increasing auctioning
These procedures can be considered as a way to reduce the financial impact of auctioning on the shipping industry. No phase-in period is needed in the case of grandfathering or benchmarking because the same effect can be achieved by free allocation.
5.2.2.1 Full auctioning with no revenue recycling
Under auctioning, participants would be required to purchase all of their allowances on the carbon market, based on their own judgement of their needs. 100% auctioning has the advantages of rewarding early action, clear price discovery, transparency of the cost of carbon and an accurate implementation of the “Polluter Pays” principle. The approach also provides a clearer policy signal for investments in clean technology. From an administrative point of view, auctioning is much simpler to implement than free allocation, because there is no need for prior monitoring in order to determine how free allowances should be allocated.
Full auctioning can avoid some of the problems caused by grandfathering during the initial stage of the EU ETS, such as windfall profits for installations that can easily pass costs onto consumers, or penalisation of early action to reduce emissions. Another great advantage of auctioning is the fair treatment of new entrants. There is no need to specify provisions for new entrants, as they would be treated in the same way as incumbents. This is particularly suitable for the shipping sector, as activity is highly variable and it could be expected that many participants would frequently enter and exit the scope of the scheme. The frequency of auctioning would have an impact on the administrative burden.
Auctioning would generate the highest revenues under the scheme, as any allowances allocated for free represent revenue foregone. In an option with no revenue recycling, Member States or EU bodies collecting auctioning revenues could use them for whatever purpose, not necessarily related to environmental issues or the shipping industry.
Full auctioning would increase costs for industry, as it can have a significant cash flow impact on ship operators that cannot pass additional costs on to final consumers, depending on how significant the overall cost of allowances would be compared to their total costs. Full auctioning is also more likely to lead to avoidance by responsible entities, which would be even more likely with high emission prices.
To make the industry familiar with their new responsibilities, a phase-in approach to full auctioning has been proposed to the IMO (as outlined in GHG-WG 3/3/8) to facilitate learning within the industry and timely implementation. This is covered in the sub-section about “Length of compliance periods”.
An option that could mitigate the economic impacts of full auctioning is to have a phase-in period over which full responsibility would be gradually introduced. Participants would initially only surrender allowances for a portion (e.g. 20%) of their emissions which would gradually rise to 100%. Although this approach would lower the cost of compliance for the shipping sector, thereby reducing the incentive to reduce emissions, it would give the industry time to adjust. The phase-in period chosen depends on a political decision as to the burden that can be borne by the maritime sector. However, as highlighted by CE Delft (2009) this approach has three main disadvantages:
The cap would not apply in practice until the liability reaches 100%;
The approach would lower the carbon price and could place it close to zero if the number of auctioned allowances, according to the cap, is much higher than the responsibility to surrender them;
It could lead to higher overall GHG emissions if the scheme is linked to other ETS, as a tonne of CO2 bought from other trading schemes would allow the emission of more than one tonne in the shipping sector. The scheme would therefore need to remain closed during the phase-in period. For example, in the case where a ship only needs
Support for the impact assessment of a proposal to address maritime transport greenhouse gas emissions
76
to submit allowances to cover 20% (one-fifth) of its emissions, a carbon credit purchased from an outside sector effectively covers five times the amount of shipping emissions.
Monitoring, reporting and verification procedures would be the same as in a conventional full auctioning scheme, with the exception of checking that the participant has surrendered the correct proportion of allowances as opposed to 100%. After the phase-in period, the scheme would operate in an identical fashion to the full auctioning option considered above.
5.2.2.2 Full auctioning with revenue recycling
An auctioning scheme with revenue recycling to the shipping industry could improve environmental effectiveness, if revenues were used to support industry’s investments in abatement technologies, to reward the most efficient ships or to finance international climate change mitigation. Additionally, it would gain higher industry acceptability and a lower likelihood of avoidance, as industry could be compensated for the financial burden they face.
The key disadvantage would be the high administrative costs. This could be particularly difficult in the shipping industry, given the potentially large number of compliance entities. Competent Authorities would have to design a scheme to allocate revenues to different ships and monitor the eligibility of ships to receive the funds.
Auctioning of emission allowances with earmarking of revenues could be legally challenging if revenues from auctioning were to be collected by individual Member States. In this scenario, it would be very difficult and controversial for the EU to oblige the Member States to use these revenues for a specific purpose. Finally, it is worth noting that any aid from a Member State government to the national maritime sector, in line with such a recommendation from the Council, would have to respect EU state aid rules as it could affect trade and distort competition between the EU Member States. However, EU state aid rules provide a number of exceptions, including environmental protection, which could justify the support. In particular, the 2008 Community guidelines on state aid for environmental protection (OJ C 82, 1.4.2008, p. 1) allow, under certain conditions, aid for measures aimed for going beyond mandatory EU standards and for early adaptation to already adopted but not yet in force EU standards as far as environment protection is concerned.
If the auctioning of allowances were to be organised by a common authority at the EU level, the revenues of auctioning would not be collected at the level of the individual Member State, but at the EU level. In this case, it seems that possibilities for earmarking such revenues could exist. First, the revenue could be collected in a Fund (see option 3), under strict conditions. Moreover, one could envisage that the revenues constitute a new revenue stream for the EU budget. The Council can adopt a decision laying down the provisions on the system of the own resources of the Union, on the basis of Article 311(3) TFEU. Such provisions could foresee the collection of own resources such as the revenues from auctioning under a GHG emissions trading system. As part of the EU budget, the revenues could be used for providing support on mitigation and adaptation to climate change, both within and outside of the EU.
The EU could also use mechanisms such as the NER300 fund to earmark revenues from an ETS. The NER300 will be funded from the sale of 300 million emission allowances held in the New Entrants Reserve (NER) of the EU Emissions Trading System (ETS). The funds collected by NER300 will support demonstration projects for Carbon Capture and Storage (CCS) and innovative technologies to tap renewable energy sources (RES). It should thus be further investigated how the EU could earmark its revenues from an EU ETS and, in particular, how this could coincide with the establishment of a fund as proposed in Option 3.
5.2.2.3 Free allocation based on historic emissions (grandfathering)
Free allowances would be distributed on the basis of historic emissions (grandfathering). Incentives to reduce emissions would still remain as ships would have to meet an emissions cap and a carbon price would emerge. From an environmental effectiveness perspective, the
Support for the impact assessment of a proposal to address maritime transport greenhouse gas emissions
77
main disadvantage of a scheme with free allocation based on historical emissions is that it would reward high emitters, as opposed to ships that have taken early action to reduce their emissions. Some other problems experienced during Phase I of the EU ETS which granted free allowances on the basis of grandfathering were windfall profits and deferred investment (CEPS, 2011). Windfall profits in the shipping sector would be affected by cost pass-through ability, which may change in response to demand or capacity. Cost pass-through ability also varies between different shipping sectors. An operator who made many port calls in the EU in the baseline year but only very few afterwards would make a large windfall profit. Conversely, an operator making few EU port calls in the baseline year but many more thereafter would be disadvantaged. In general, the problems related to free allowances are more pronounced for the shipping sector than for other sectors, because of the mobile nature of ships and the huge variation in activity levels.
Since inefficient ships would receive more allowances than efficient ships, this effectively penalises participants who take early action to reduce their emissions. In fact, participants would have an incentive to increase their emissions during the period over which historic emissions were considered.
The administrative complexity of this scheme would be high, because reliable data would be needed for the historical emissions of each ship. Given the large number of participants, collecting these data might be costly. Due to the highly variable nature of the industry (particularly tramp shipping), it is likely that data would need to be collected over several years.
No additional administrative complexity arises from the need to identify the entities entitled to the free allocation as the free allowances would be given to the entities responsible for surrendering allowances.
A scheme with full free allocation of allowances would not generate revenues for Competent Authorities.
No legal obstacles are foreseen for the implementation of a free allocation scheme based in grandfathering, as this has already been implemented in the EU ETS for stationary installations. However, practical obstacles would emerge from its implementation in the maritime sector. Thus, none of the proposals to the IMO for a global shipping ETS favour a grandfathering approach.
5.2.2.4 Free allocation based on output benchmarks
An alternative method would be to distribute allowances according to output metrics (e.g. tonne-km). Such is the approach that has been used to grant free allowances to the aviation sector in the EU ETS. The actual emissions from the fleet would be measured over a certain time period (e.g. a single year or more than one year) and typical emission curves per tonne-km would be produced for different ship sizes/types. The data that would need to be provided by every ship for the calculation of the benchmark is similar to the Energy Efficiency Operational Index (EEOI) proposed at the IMO. The EEOI is defined using the following equation:
Where: j is the fuel type;
i is the voyage number;
FCij is the mass of consumed fuel at voyage i;
CFj is the fuel mass to CO2 mass conversion factor of fuel j;
Support for the impact assessment of a proposal to address maritime transport greenhouse gas emissions
78
mcargo,i is cargo carried (tonnes) or work done (number of TEU or passengers) or gross tonnes for passenger ships during voyage i; and
Di is the distance in nautical miles corresponding to the cargo carried or work done during voyage i.
Free allowances would be granted to each ship on the basis of this benchmark, providing as many allowances as the top performers would require for their transport activity. Fluctuations in annual emissions could be partially accommodated by calculating benchmarks over several years; however it could still be problematic for tramp shipping.
This approach is potentially more equitable and more environmentally effective than using historic emissions, as it would not penalise early action to reduce emissions relative to their output. Using output benchmarks could create an incentive for participants to increase their activity (and consequently their emissions) to push up the benchmark. However, given the large number of participants in the scheme, the power of an individual ship to alter the benchmark would be very small and the associated costs to do so would be very high. Incentives for modifying behaviour to affect the benchmark would therefore be relatively low.
On the other hand, a benchmarking approach would face significant challenges for its implementation in the shipping industry. Firstly, benchmarking is very data intensive and requires that in addition to emissions, activity data are also monitored, reported and verified in an initial phase. Also, it requires a substantial effort from the Administration to estimate benchmarks, which is particularly difficult in the shipping sector. Furthermore, it would be difficult to find a metric which would be applicable across the diverse nature of the shipping industry. Even identical ships would have different output benchmarks depending on the volume and density of their cargoes. Devising, monitoring, reporting and verifying a suitable metric would substantially increase the administrative burden of the scheme. A suggested approach to minimise the cost of deriving multiple benchmarks would be to use the 20% rule, by which the emissions intensity of state-of-the-art vessels within one benchmark should not exceed 20% (Oko-Institut, 2009). When ships are grouped according to this 20% rule, and no differentiation is made between different size classes, six different benchmarks are derived. The problem of diversity of benchmarks did not arise in the aviation sector, where a single benchmark was used for all aircraft and services, because the impact of transporting passengers or cargo by air is relatively homogenous. This provides a strong incentive to use the most efficient aircraft available.
No legal challenges would be expected for the implementation of this approach, as it is already used for stationary installations and aircraft operators within the EU ETS. However, as in the case of grandfathering, such a scheme is likely to face significant challenges for implementation and has not been favoured in any of the proposals to the IMO for a global shipping ETS.
The same generic problems of free allocation defined in the previous sub-option also apply under this option.
5.2.2.5 Hybrid: Partial auctioning with a share of free allowances
Despite the positive aspects of full auctioning, it could be problematic initially because it places a financial burden on the sector (which is of uncertain magnitude due to carbon price volatility). This burden is particularly high for small operators, who face higher transaction costs.
An option to mitigate these economic impacts would be to have a phase-in period over which auctioning and free allocation are combined, with an increasing share of auctioning in the total share of allowances distributed. This is the current approach for aviation, where only 15% of allowances will be auctioned in the first trading period (2012), with an expectation that from 1st January 2013, the percentage may be increased as part of the general review of the EU ETS Directive 2003/87/EC. The rest of the sectors covered by the EU ETS will
Support for the impact assessment of a proposal to address maritime transport greenhouse gas emissions
79
receive 80% of the level of ambitious benchmarks reflecting the most efficient installations in Europe in terms of allowances for free from 2012 and thereafter the free allocation will decrease each year until reaching 30% of the benchmark level in 2020 with a view to reaching no free allocation in 2027. The sectors deemed at risk of carbon leakage will receive 100% of the benchmarks as free allocation until 2020, while the power sector will have to purchase 100% in auctions or on the secondary market.
The feasibility of a partial auctioning approach depends on the actual feasibility of the approaches used to estimate the allocation of the share of free allowances among compliance entities. The hurdles of grandfathering and benchmarking approaches have already been highlighted in previous sections. Both approaches could involve very high administrative costs.
One way of gradually introducing auctioning without incurring excessive administrative costs would be a mild form of grandfathering consisting of the free allocation of a share of allowances based on the reported emissions of ships in the previous year. In terms of environmental effectiveness, the main pitfall of this approach would be that it would reward the higher emitters. However, because only one share of previous year emissions would be granted for free, the incentive to reduce emissions would still remain. In any case, to avoid creating perverse incentives for high emitters, this approach should only be used during a transitory period to allow industry to adapt to their new obligations to reduce emissions, until full auctioning is implemented.
5.2.2.6 Option selection
Auctioning is the most efficient method of allocation both in terms of limiting distortions linked to free allowances and maximising the incentive to reduce emissions. In the short term, however, a phase-in period with free allocation would mitigate negative impacts on the maritime sector. The administrative burden of free allocation by output benchmarks or grandfathering is very high in comparison to other options. To reduce the administrative burden of free allocation, a mild form of grandfathering could be introduced, where ships receive a share of their previous years’ reported emissions as free allowances. At this stage, however, there is no clear preferred option.
Auctions could be carried out at the Member State level or at the EU level via a common authority. In line with the auctioning mechanism for the EU ETS, a Regulation would need to be adopted with detailed provisions on the auctioning procedure.
5.2.3 Banking of allowances
A system which allowed banking of allowances between phases would provide additional flexibility in meeting emission reduction targets. Banking of allowances would allow participants to save excess allowances for future compliance periods. In theory this would increase the efficiency of the ETS by shifting emission reductions to lower cost time periods and helping to reduce carbon price volatility. The lack of banking provision in phase I of the EU ETS meant that the allowance price converged to zero as the number of buyers in the market reduced towards the end of the trading period. Banking is also thought to encourage early reductions in emissions (Fraas & Richardson, 2011). Norway’s proposal to the IMO (MEPC 60/4/22) proposes that emission allowances acquired in one commitment period can be banked for the next commitment period. Further, ships would be allowed to borrow allowances, but must surrender allowances 20% above what is required according to the emission report of the ship in the following year.
Borrowing of allowances is not considered, as it would involve postponing GHG emissions reductions commitments to the future.
Support for the impact assessment of a proposal to address maritime transport greenhouse gas emissions
80
5.2.4 Administrative arrangements: monitoring, reporting and verification; issuance of allowances and choice of Competent Authority
A robust compliance mechanism will be key to the effective functioning of an ETS for shipping and is likely to be one of the most important challenges in implementing such as scheme, given the large number of compliance entities, their diversity and mobility.
5.2.4.1 Monitoring, reporting and verification of emissions
Arrangements for monitoring, reporting and verification of emissions are described as part of the section of this report detailing design elements common to every policy option. This section refers to the specific compliance tasks that responsible entities, Competent Authorities, verifiers and the European Commission would need to perform for the functioning of an ETS. The main tasks that would need to be carried out within the compliance period of an ETS for shipping, as well as the responsible parties for each of the tasks, are presented in Table 5.1 below:
Table 5.1: Tasks for monitoring, reporting and verification of emissions from the shipping sector in an ETS
Step Task Description Responsibility Frequency
1 Establish and maintain an ETS Registry
To allow the functioning of the market, a Registry functioning as an electronic exchange (like the Community Independent Transaction Log CITL of the EU) must be created. All participating compliance entities would have a dedicated account. The Registry must be staffed and maintained.
European Commission
Once at the start of the scheme and continuous maintenance
2 Operate in the carbon markets
Compliance entities will need to participate in carbon markets, either in carbon exchanges or in auctions, to purchase the allowances they need to cover their reported emissions or purchase allowances from intermediates.
Compliance entities
Several times through the compliance period
3 Surrender allowances
Once the Competent Authority has acknowledged the verified emission report, the Compliance Entity must then surrender the equivalent number of allowances either for every compliance period or for every voyage.
Compliance entity
For every compliance period (annually)
4 Cancelling of allowances surrendered with annual emissions
At a specific date, the Compliance Entity must have in its account in the ETS Registry enough allowances to cover the emissions declared in its verified report. These allowances will be then cancelled in the ETS Registry.
ETS Registry For every compliance period, or every voyage (to be assessed)
5 Maintenance of registry of non-compliance and issuance of a compliance certificate
A central EU Registry of non-compliant ships should be kept and shared with Port Authorities. Non-compliance would occur if insufficient allowances are surrendered or a verified emission report is not submitted in time.
Compliance could be confirmed by issuing a GHG certificate once the appropriate number of allowances has been surrendered.
Competent Authority
For every compliance period
Support for the impact assessment of a proposal to address maritime transport greenhouse gas emissions
81
Step Task Description Responsibility Frequency
6 Inspection of compliance
Port authorities would inspect GHG certificates and ensure that non-compliant entities are subject to sanctions. Sanctions could increase in severity if non-compliance continues.
Ports As frequent as necessary to ensure an effective implementation while reducing the administrative burden
The scheme should also include an appeals procedure for participants who feel they have been wrongly identified as non-compliant, particularly if the sanctions are very strict. In some cases, fuel consumption could be anomalously low, for example, where super-slow steaming is used. Participants should have the opportunity to prove their innocence. One method would be to voluntarily open their company accounts, which would not normally be accessible to a regulatory authority.
Disputes may arise over the accuracy of bunker delivery notes, which vary between facilities around the world. CE Delft (2009) suggests that the presence of a neutral third party would reduce this risk. The ship and supplier could both take part in obtaining a drip sample. In some cases an additional commercial sample could be dispatched for analysis to determine the amount of fuel received, as the volume depends on the temperature.
5.2.4.2 Options for the selection of a Competent Authority: Ad-hoc Competent Authorities
The Competent Authority would be in charge of approving monitoring plans, issuing emissions allowances, receiving and validating verified emissions reports, and cancelling the surrendered allowances. The different options for Competent Authorities are presented in the Chapter on common design elements for every policy option. However, a specific sub-option for a maritime ETS would consist of the definition of ad-hoc Competent Authorities by Member States. These would include entities such as ports, groups of ports or regional organisations. These ad-hoc Competent Authorities would be in charge of ensuring compliance of ships entering the ports under their competencies. Such a scheme would be feasible when emissions need to be reported by the ship at each port call. In an annual reporting scheme, ports would not be able to deal with emissions from ships continuing their journey to other ports.
In an ad-hoc reporting approach ports could require the ship’s responsible entity to pay for emission allowances to cover each journey ending at that port. Jamaica’s proposal to the IMO (MEPC 60/4/40) suggests an approach based on charging a port State Levy, which could be adapted to an ETS with ports as ad-hoc Competent Authorities.
This approach would involve a high administrative burden because emissions would need to be reported and verified for each voyage. Although port authorities routinely collect variable harbour dues and other fees, this mechanism would be more complex. Ports would have to verify the ship’s specifications, distance travelled, the amount/type of fuel consumed, and then calculate the emissions charge. In order to reduce the likelihood of fraud, significant resources would also be needed for verification.
One problem with this approach could be the lack of liquidity in the market and lack of transparency about the carbon price, if each port applies different rates. This is currently the case with port rates, that are often negotiated bilaterally with operators and the resulting contracts are not in the public domain (Kageson, 2007). This would create great uncertainty and reduce the incentives to invest in abatement measures. On the other hand, if competent authorities impose charges on ships that are too high, they risk losing business to nearby harbours that do not penalise inefficient ships as heavily. This makes a case for defining
Support for the impact assessment of a proposal to address maritime transport greenhouse gas emissions
82
authorities which are large enough to avoid the risk of losing customers to neighbouring areas.
5.2.5 Length of compliance periods
Compliance periods in cap and trade schemes relate to the length of the period during which the cap has to be met and the related number of allowances available for the period as a whole. When deciding the length of the compliance period, there is a trade-off between the certainty for participants in the ETS with respect to the carbon price signal, and the certainty for the regulators with respect to the scheme’s effectiveness and fairness. A long period provides more certainty for ship owners/operators, as many abatement options for ships entail investment lifetimes of 25 years or more. However, long periods do not leave flexibility for the regulator to make adjustments in the definition of the cap or other design elements of the scheme arising during its implementation.
A phase-in or pilot phase of around three years with reduced responsibility would be recommended to provide investment signals and allow learning from operators, as well as to allow regulators to identify potential errors in the design of the scheme that could be refined in a subsequent longer phase. This has been proposed by the UK to the IMO (as outlined in GHG-WG 3/3/8). During the first phase, only a certain part (for example, 10% in the first year) of a ship’s emissions would be covered, gradually increasing to 100% over some years (e.g. three years). Vessels would offset only the set proportion of their emissions through the purchase and surrender of international credits.
Subsequent phases could have a duration of eight years, which could be practical if the system was linked to the EU ETS. The experience of the EU ETS showed that shorter compliance periods do not match the longer investment cycles of installations. The length of the compliance period would be aligned to that of a global ETS proposed by the IMO, should such an option be ultimately retained by the organization. The proposals from the UK, Norway, France and Germany to the IMO have referred to discrete phases with a length of five to eight years, which would be compatible with this approach.
The cap would be decided at the start of the compliance period, but only a share of allowances would be made available to participants each year. A share of allowances could be reserved for new entrants, although this would not be necessary in an auctioning scheme where new entrants and incumbents would be treated equally.
5.2.6 Responsible Compliance Entity
In an ETS, a responsible Compliance Entity is responsible for monitoring and reporting emissions, ensuring that they are verified, and surrendering the allowances equal to the emissions covered by the scheme to a Competent Authority.
The different options for entities to meet these responsibilities are described under the section of this report covering design elements common to every policy option.
A legal issue specific to the option of an ETS relates to the definition of ports as compliance entities. Taking into account existing EU Law on emissions trading, ports would be fixed installations in the meaning of the EU ETS Directive. All compliance entities proposed in this option would be located within the territory of the EU Member States and would essentially be fixed units. Nevertheless, from a legal point of view, this would require amendments to the EU ETS Directive. However, Member States may apply the EU-ETS to activities, installations and greenhouse gases which are not listed in Annex I of the EU-ETS Directive. Therefore, maritime transport could already be included in the EU-ETS, if the Member States are deciding to do so.
Support for the impact assessment of a proposal to address maritime transport greenhouse gas emissions
83
5.3 Legal assessment
5.3.1 Legal feasibility of introducing an ETS under EU law
An EU emissions trading scheme for the maritime sector would have Article 192(1) TFEU as its legal basis and would therefore be adopted with the ordinary legislative procedure. Both the emissions trading scheme for fixed installations and the scheme for aviation have this article as their legal basis. As with these two schemes, the inclusion of the maritime sector in an emissions trading scheme would aim to protect, preserve and improve the quality of the environment by reducing the climate impact of transport by ships.
Directive 2003/87/EC has no provision prohibiting the inclusion of emissions from the maritime sector in the EU ETS. Inclusion of the maritime sector in the existing EU ETS would require amending this Directive as well as its Annex I, similar to the way in which the Directive was amended to include the aviation sector. However, it is worth to notice that the Member States can already introduce maritime transport in the EU ETS on a voluntary basis, as provided by Article 24 of the Directive. It has been argued that a more appropriate solution for the international maritime transport might be to establish a separate scheme for emissions trading, but linked to the existing EU ETS.23 This is not excluded by any provision of EU law. However, it would require a separate legal instrument that could take the form of a Directive or Regulation depending on the content of the instrument. The scope of the Kyoto Protocol does not currently include international maritime transport. If maritime sector were to be an aggregate net seller, a targeted solution would be required in order not to compromise the integrity of the accounting systems. A number of solutions can be considered. For instance, if the EU ETS does not allocate allowances for the maritime sector, no additional allowances are created and the integrity of the accounting system is not jeopardized. For the aviation sector, the solution was to ensure that allowances allocated to the aviation sector can only be used to meet the obligations of aircraft operators in the EU ETS.24 However, aircraft operators can use allowances issued to other sectors.
5.3.2 Legal feasibility of introducing an ETS under international law
With regard to its compatibility with UNCLOS, no specific problems for an EU ETS covering the maritime sector were identified in addition to those identified in the general section. It could be argued that the EU has prescriptive jurisdiction, on the basis of the provisions of UNCLOS, to regulate the emissions from ships entering or leaving EU ports on the basis of EU Member States’ authority as port States. The EU would have to comply with a number of principles and conditions to exercise port State jurisdiction. These conditions reflect principles of the law of the sea included in UNCLOS, such as the principle of non-discrimination and the principle that port States shall exercise their rights, jurisdiction and freedom in ways that do not amount to abuse of right.
23
Note that extending the existing EU ETS to cover maritime GHG emissions could lead to future difficulties if non-EU countries wanted to join the scheme at a later date so as to cover emissions from ships on journeys to and from ports in those countries. As negotiations at the global level will continue concerning a market-based scheme to cover maritime GHG emissions, it is important to consider whether a scheme could be established that would, ideally, be compatible with any future international emissions trading scheme for the maritime sector. 24
‘IMO to resume talks on market-based measures’, available at http://www.endseurope.com/28235?referrer=bulletin&DCMP=EMC-ENDS-EUROPE-DAILY. 24
Preamble, point 27, Directive 2008/101/EC of the European Parliament and of the Council of 19 November 2008 amending Directive 2003/87/EC so as to include aviation activities in the scheme for greenhouse gas emission allowance trading within the Community, OJ L 8, 13.1.2009, p. 3–21.
Support for the impact assessment of a proposal to address maritime transport greenhouse gas emissions
84
Surrendering emissions allowances issued under an EU ETS for the maritime sector could be imposed as a condition for entering EU ports and would not infringe the right of innocent passage as only ships calling at EU ports would be subject to the proposed measure.
The adoption of the proposed ETS scheme would have to respect the commitments the EU has undertaken under the WTO Agreements. As per the legal summary, none of the WTO instruments appear directly applicable. GATT applies to goods, and not to services such as those provided by the maritime sector. However, the proposed ETS scheme could indirectly affect the price of goods (if shippers’ costs of compliance with the EU measures could be passed on in the prices they charge). But even if GATT were therefore considered to apply, the proposed EU measure is unlikely to be held to breach the non-discrimination principles (Articles I and III), as the costs do not relate to distance but to the emissions and thus to efficiency: the costs incurred on a longer voyage could be lower than on a shorter voyage depending on the particular ship’s efficiency. Moreover, domestic goods may still travel further than imported ones. The EU is not responsible for the distance of an exporter from a chosen market or of the type of transport he chooses. Furthermore, depending on the chosen measure and its exact design, it is possible that exporters would incur no additional costs. In any case, it is not clear that the price of the measure will be passed on. However, if the proposed EU measure is considered as affecting goods prior to their importation to the EU (and not after their importation in which case they would be covered by Article III:4), such measure would be covered by Article XI:1 on quantitative restrictions. Article XI prohibits bans and quantitative restrictions on imports and exports among WTO members. Under this policy option, the number of allowances available to shippers would be limited, and this could arguably be considered to have restrictive effects if it limited volumes of goods imported. Since under an ETS, sectors can increase emissions, this is clearly not a quantitative restriction. At most, the obligation of ships to surrender allowances could entail a need to purchase additional allowances and thereby lead to increased transportation costs. However, even in this report, the economic impact assessment shows that goods will not be affected or in a positive way (by reducing the transport costs). In any case, the EU could still justify the introduction of an ETS under Article XX if it satisfies the Article XX requirements, as already analysed in the overarching legal section. With respect to GATS, for the time being international maritime transport is excluded from its scope. Further, according to the EU’s schedule of commitments currently in force, it seems that the Union has not decided to ‘open’ this sector within the context of GATS. The free allocation of allowances to the maritime sector and the potential earmarking of the revenues accrued for reducing the mitigation costs of the maritime sector would not raise issues under either the SCM Agreement or the GATS. Services are excluded from the scope of the SCM Agreement (except if subsidies result in certain goods from certain trading partners benefitting from lower shipping costs while like goods from other trading partners cannot be transported via shipping and, therefore, are not benefitting from the subsidy), and the GATS in case of subsidies only affords WTO Members with the right to request consultations on this matter and, in any case, based on the observations made above is not applicable to the international maritime transport sector.
5.4 Summary assessment of ETS design elements
This section provides a summary of the policy design elements that were used to model the impacts of the policy. Both open and closed systems were considered, as there are compelling arguments for and against each option. The level of the cap was set to achieve the EC’s 2011 White Paper on Transport aim of reducing emissions from bunker fuels by 40% in 2050. An intermediate cap was set at a 10% reduction in 2030. Both auctioning and free allocation were considered for the open ETS option, in order to examine the economic
Support for the impact assessment of a proposal to address maritime transport greenhouse gas emissions
85
impact on the shipping sector. The impact assessment examines full auctioning and full free allocation, on the assumption that any combination of the two schemes will result in impacts somewhere between these two bounds. For the closed scheme, allowances were considered to be allocated for free, as the cost of auctioned permits when there are no options for out-of-sector abatement could be prohibitive. Options for banking and compliance periods do not affect the model, as it calculates the most cost-effective trajectory given the cap in 2050. A summary of the assessment is provided below.
Table 5.2: Summary assessment of policy design elements
Common design element
Options considered for further analysis
Options NOT considered for further analysis
Open or closed system Closed;
Open – one-way link to ETS;
Open – link to credits with restrictions
Open – two-way link to ETS
Open – link to credits with no restrictions
Level of the cap 40% reduction in emissions from bunker fuels in 2050 compared to 2005 levels, and an interim target for 10% reduction in 2030 compared to 2005 levels
N/A
Method of allowance allocation & distribution
Auctioning;
Auctioning with revenue recycling;
Free allocation
N/A
Banking Allow banking;
Do not allow banking
N/A
Length of compliance period
10 years N/A
Use of revenues (in a system with auctioning)
See the Technical Annex: Appendix 7
N/A
The out-of-sector credit prices were based on ETS price projections provided in the EC Roadmap for moving to a competitive low carbon economy in 205025.
Support for the impact assessment of a proposal to address maritime transport greenhouse gas emissions
86
6 Policy option 2: Tax
6.1 Description of the policy option
A tax would levy a charge on some defined basis (e.g. fuel supplied or CO2 emitted) which would apply to fuel suppliers or vessels (as appropriate) operating within the scope of the scheme.
The tax would increase the cost of voyages, either through taxing on the basis of fuel use or emissions. The cost incurred would be fixed per unit of fuel consumed or CO2 emitted, and therefore would scale with the activity of the emitter. The Compliance Entity would have the option to pay the additional tax charges without modifying their fuel consumption / emission levels, or to operate more efficiently in order to reduce the amount of tax they pay under the scheme. This would provide a price incentive to adopt fuel-efficient behaviours and technologies. The policy would reward all measures that reduce fuel consumption as well as switching to low-carbon fuels (provided the tax is wholly or partly based on CO2 intensity of fuel). The tax would apply both to new and existing ships.
The contribution required under such a scheme would increase the cost-effectiveness of fuel reduction measures (which also reduce CO2 emissions). Fuel costs represent a large proportion of overall operating costs – from 33% to 63% depending on the vessel type – therefore any increases to the fuel cost would be highly visible to the entity responsible for paying for the fuel. The price signal may help to overcome some non-price barriers (e.g. investment uncertainty) because it provides a predictable and stable incentive (as opposed to, say, a potentially volatile carbon price under an ETS). A tax could result in emission reductions by reducing maritime trade activity within the regulated scope. As with any scheme that could increase freight rates, demand could fall in response. However, this effect is expected to be small in the shipping sector (IMO, 2009a).
The fundamental property of a tax is that it provides cost certainty, not certainty of emission reductions. The tax would reduce emissions only to the extent that it encourages vessels to be operated in a more fuel efficient manner, so overall emissions may not decline, i.e. if vessels opt to pay the additional charges without modifying their operations. This possibility would be more likely if the marginal abatement costs in the shipping sector are high, meaning that emission reductions are expensive. However, unless price elasticity of demand is completely inelastic, some in-sector emission reductions should be expected. In theory, a tax could achieve the same emission reductions as an ETS, provided an appropriate tax rate is chosen.
Even if ships do not change their behaviour at all, the scheme could still lead to indirect (out-of-sector) emission reductions if revenues are used for GHG abatement (e.g. if they are hypothecated). This possibility is discussed further in the Technical Annex: Appendix 7.
6.2 Design elements specific to a tax
6.2.1 Tax basis
The basis for the tax should provide an incentive to reduce emissions; therefore it would need to be levied on an emission-producing activity. This could either be a direct tax levied on emissions, or a tax levied on fuel supplied, which is closely correlated with CO2 emissions.
6.2.1.1 Tax based on fuel supplied
A marine fuel duty could be levied on sales of all marine fuels, including both residual and distillate fuels, and from all ships purchasing marine fuel within the EU.
Support for the impact assessment of a proposal to address maritime transport greenhouse gas emissions
87
There are various options for the setup of a marine fuel duty:
The tax on fuel could be levied on the volume of fuel supplied (i.e., € per litre)
The taxation level could adopt the same approach made in the proposed review of the Energy Taxation Directive (Council Directive 2003/96/EC) which has two components (COM(2011) 169 final): (1) CO2-related taxation and (2) general energy consumption taxation.
Taxing fossil fuels on the basis of their carbon content is generally expected to lead to CO2 reductions at a lower cost for a given reduction target (IPCC, 2001). As the EU is moving toward a CO2-related taxation structure under the ETD, fuel carbon content is the basis considered for the fuel tax.
The tax would be limited to supplies of marine fuel within the EU. This could introduce significant distortions, because a regional scheme would give operators an incentive to buy fuel outside of the area in which the tax is enforced, if it were cheaper to do so.
Collection of tax revenues is a familiar procedure and thus the administrative effort is expected to be low, as it would be based on the existing fuel excise system in the EU (Hemmings, 2011). This would imply that the levy is charged at the fuel supplier level. This would be beneficial in terms of administrative effort required for the Competent Authority, in that it would dramatically reduce the number of compliance entities and would not require tracking of bunker sales to individual ships. However, fuel suppliers do not directly control uptake of measures to reduce maritime emissions.
The main concern about a tax on fuels is the high potential for evasion. Ships could easily bunker outside of the scope of the scheme. Large ships in particular are able to undertake long voyages on a single bunkering and can carry additional fuel without significantly sacrificing their carrying capacity (a process known as “tankering”). For example, on a single bunkering a Panamax bulk carrier can stay at sea for 56 days (which would allow it to travel between Sydney and Singapore four times). Containerships could travel round the world using only competitively priced fuel suppliers because they are able to use fuel as ballast and replace it with water as the fuel is used – in this manner, they could avoid bunkering again for 3-5 months (AGF, 2010). In practice then, it is likely that a fuel tax would only have an effect for ships that operate in a limited area within Europe, where opportunities for bunkering outside the scheme are few. Even so, fuel suppliers could avoid incurring the duty on fuel sold by setting up offshore bunkering facilities (e.g. beyond a 12nm zone). Offshore bunker supply is already common practice to avoid paying port fees, agency fees or being constrained by loading limits in ports (IPCC, 2007). The main disadvantage of offshore bunkering would be time consumption for the ship operator and environmental concerns relating to possible bunker spill incidents (Beicip Franlab, 2003).
It appears that there are few options to reduce evasion of the scheme. This was demonstrated by California’s 1991 decision to lift the fuel tax exemption and to tax interstate bunker fuel sales. Within a year, Californian bunker sales had collapsed as ships bunkered elsewhere especially Panama; hence the environmental effectiveness is likely to be severely compromised if this is not resolved. Hemmings (2011) suggests that a two-tier system would mitigate evasion, whereby taxed fuel is sold to intra-EU shipping, and untaxed fuel is sold to international shipping. The scope of the tax under this scheme would therefore be limited to supplies of fuel to ships that operate exclusively within the EU. This would cover a large number of small ships including fishing vessels, ferries and vessels <500GT (Hemmings, 2011). However, this would provide an advantage to similar vessels operating both within the EU and in international shipping.
It will be important that any tax (duty) on fuel for (foreign) ships meets WTO tests for being non-discriminatory, i.e. fuels for interchangeable activities within the EU need to face equal taxation.
Support for the impact assessment of a proposal to address maritime transport greenhouse gas emissions
88
6.2.1.2 Tax based on CO2 emissions
A tax on emissions could be levied at the vessel level, i.e. the tax would be levied per unit of CO2 emitted by a vessel. This would greatly increase the number of compliance entities and hence the administrative burden compared to a tax at the level of the fuel supplier. In general, implementation is much simpler if a tax is levied as far upstream in the production process as possible.
The requirement for ships to monitor their emissions would increase the administrative burden for ships. It could also increase awareness and potentially lead them to focus more on reducing fuel consumption (Hemmings, 2011).
The emissions covered under the scope of the scheme would be estimated from fuel consumption quantities by applying a standard CO2 emission factor. The estimated emissions then become the basis for the tax calculation.
Options for evasion would be reduced compared to a tax on fuel. Ships could avoid the charges by sailing outside of the geographical scope of the scheme, but if they make calls at EU ports they would need to pay.
The methods and process of estimating emissions are discussed in Section 4.2, which discusses design elements common to every policy option.
6.2.1.3 Option selection
Given the high risk of evasion of a tax based on fuel supplied, this option is discarded. The opportunities to prevent avoidance are very limited, given the ability of most ships to bunker large amounts of fuel. Even a scheme with a severely restricted scope of coverage would still be vulnerable to avoidance through offshore bunkering. Further, a regional bunker tax that was trialled in California in 1991 led to a spectacular collapse in bunker sales – it would not be recommended to attempt a similar scheme in Europe.
A tax based on emissions is the preferred option, and the rest of this section will refer only to this possibility.
6.2.2 Administrative arrangements: monitoring, reporting, verification of emissions and enforcement
The payment of a tax on emissions would be linked with the declaration of emissions. Therefore, depending on the monitoring, reporting and verification of its emissions (see Section 4.2), a vessel (or the responsible entity set in accordance with Section 4.5 in “Common Design Elements”) could pay a tax each time it calls into an EU port or on an annual basis. The national competent authorities would be responsible for collecting the tax. The enforcement would be ensured via usual rules of port states control set by UNCLOS, such as penalties or detention of the vessel within the port. The administrative tasks specifically related to the tax policy options are detailed in the table below.
Table 6.1: Administrative tasks related to tax policy options
Step Task Description Responsibility Frequency
1 Adopt legislation at EU level including criteria to determine in which MS the tax on emissions become due and to which MS the revenue accrues
Ships paying their taxes on an annual basis would need to be allocated to a specific Member state, to which the revenue would accrue
European Commission and Council of the EU
Once at the start of the scheme
2 Establish a new tax registration system.
Entities responsible for recording emissions from taxable journeys and paying associated tax are likely to include non-EU
Tax authorities with coordination at
Once at the start of the
Support for the impact assessment of a proposal to address maritime transport greenhouse gas emissions
89
Step Task Description Responsibility Frequency
parties which do not have unique tax identification number with any MS tax authorities. For instance, there would be ships that come only occasionally to the EU ports. Furthermore, a responsible entity whose business is registered in one MS could have ships registered to another MS. Therefore, tax on emissions may necessitate creation and management of a new tax registration system.
As part of that registration, ships paying their taxes on an annual basis would be allocated to a specific Member State to which they would pay the taxes.
EU level scheme
3 Pay taxes The responsible entity or its appointed agent or other party, would pay the accrued amount for the established period.
Ships Annually or per trip.
For enforcement, any evidence of non-compliance in terms of incorrect amount of taxes being levied on the emissions will be reported to the tax authority. If the tax is paid for every voyage, the scheme would be best enforced by local tax bodies such as customs. This would be the best option for ships that do not call regularly to EU ports. For ships regularly calling to EU ports or uniquely involved in intra-EU trade, enforcement could be done at the national tax authority level, with an annual frequency.
6.3 Legal assessment
6.3.1 Legal feasibility of introducing a tax on fuel or on emissions under EU law
As per the overarching legal section, the legal basis for the adoption of any action to protect the environment is Article 192 TFEU. According to Article 192(2) TFEU, measures of a primarily fiscal nature are to be adopted through a special legislative procedure.26
The term ‘primarily of a fiscal nature’ is not examined in detail in the reviewed literature. However, in case C-366/10, both the CJEU and AG Kokott refer to the potential fiscal nature of environmental measures. AG Kokott stated that ‘[c]harges are levied as consideration for a public service used. The amount is set unilaterally by a public body and can be determined in advance. Other charges too, especially taxes, are fixed unilaterally by a public body and laid down according to certain predetermined criteria, such as the tax rate and basis of assessment.’ (paragraph 214). In the same case, the CJEU stated that ‘unlike a duty, tax, fee or charge on fuel consumption, the scheme introduced by Directive 2003/87 as amended by Directive 2008/101, apart from the fact that it is not intended to generate revenue for the public authorities, does not in any way enable the establishment, applying a basis of assessment and a rate defined in advance, of an amount that must be payable per tonne of
26
Note that the Commission’s 1992 proposal for a carbon tax was put forward under a double legal basis, i.e., under both the provisions on the protection of the environment (ex Article 175(2) TEC)and on the harmonization of taxes (ex Article 93 TEC, Article 113 TFEU). If a measure is adopted under double legal basis, it needs to be examined whether the procedures for the adoption of the act under each Article are compatible with one another. In the case under examination, the reference to the two legal bases is not of significant practical importance as the decision-making procedure under both Articles is almost the same, i.e., the Council must reach a decision unanimously after consulting the European Parliament and the Economic and Social Committee. The only difference is that under Article 192(2) TFEU the Council must also consult the Committee of the Regions. It could be argued that the two procedures are compatible with one another as they provide for a unanimous decision of the Council after having consulted other EU institutions. On the other hand, it could be maintained that the two procedures are not compatible with one another as under Article 192(2) the Council has to also consult the Committee of the Regions. However, following the procedure laid down in Article 192(2) is not liable to endanger the adoption of the legal instrument by the Council (as the Council under both Articles has to act unanimously and is not obliged to follow the recommendations of any other EU institution) nor to undermine the rights of the Committee of the Regions as, even though Article 113 does not provide for consultation of that institution prior to the adoption of the act, the second Article does lead to such a result.
Support for the impact assessment of a proposal to address maritime transport greenhouse gas emissions
90
fuel consumed for all the flights carried out in a calendar year’ (paragraph 143). This implies that whether a measure is of a primarily fiscal nature depends on: a) whether the price that complying entities have to pay is fixed by the State in advance or depends on free market forces and b) whether the measure is intended to generate revenue for the public authorities.
In this case, the proposed taxation would be fixed in advance by (potentially) both the EU (which would normally introduce only a minimum level of taxation) and the Member States (which would decide on the exact level of taxation taking into account national conditions) and would generate revenues for the public authorities. If the total amount of revenues was earmarked for climate change mitigation purposes, the measure would not be intended to generate revenue for the public authorities stricto sensu. However, even in that case the level of taxation would be established by the Member States in advance and therefore the measure would not lose its fiscal character.
In view of all the above, the proposed taxation would need to be adopted with Article 192(2) TFEU as its legal basis.
Article 14(1)(c) of the Energy Taxation Directive (Directive 2003/96/EC) forbids Member States from taxing fuel used for maritime transport and fisheries. Therefore, should the EU decide to subject these fuels to taxation it would be able to do so either by amending the Energy Taxation Directive (in which case, however, the legal basis would have to be Article 113 TFEU because the Directive is adopted under that legal basis) or by adopting a new Directive. The difference between these two options is that in the first case the Energy Taxation Directive has as its legal basis Article 113 TFEU whereas a new Directive adopted under Article 192(2) TFEU could highlight the environmental significance of the measure. Furthermore, Article 41 of Directive 2008/118/EC provides that ‘until the Council has adopted Community provisions on stores for boats and aircraft, Member States may maintain their national provisions concerning exemptions for such stores’. This provision would have to be amended as well if the EU decided to introduce a tax on the fuels used by the maritime industry.
Option 2(b) provides for the imposition of a tax on the emissions of all ships calling at EU ports. It would not be possible to adopt such a tax within the current system of EU excise duties since the tax would not be based on the sale of a product; hence, the EU would have adopt a new Directive under Article 192(2) TFEU.
6.3.2 Legal feasibility of introducing a tax on fuel or on emissions under international law
No specific problems have been identified concerning the option’s compatibility with UNCLOS. First, a tax on fuels would not raise jurisdictional issues as it would be imposed only on fuel sold within the EU. In regard to the proposed tax on emissions, as already analysed in section 3, the EU could impose such a tax on ships entering and leaving EU Member States’ ports under the prescriptive jurisdictional rights afforded by UNCLOS to port States. Ships’ right of innocent passage would not be violated as only ships calling at EU ports would be subject to the EU legislation. However, as the scheme would be taking into account emissions of GHG outside EU territorial waters the issue of extraterritoriality could potentially be raised by third countries.
Regarding the WTO Agreements, note that the proposed tax on fuels would not raise concerns of having a restrictive effect on international trade as the measure would be imposed only within the jurisdictional limits of the EU.
On the other hand, the proposed tax on emissions would take into account GHGs emitted outside the EU. It is therefore important to consider the relevant WTO legal instruments, as analysed in the overarching legal section.
GATT would not be directly applicable, since the proposed tax on GHG emissions would be regulating the service provided by the maritime industry and not the cargo transported. While
Support for the impact assessment of a proposal to address maritime transport greenhouse gas emissions
91
a tax on emissions could arguably be viewed as having an indirect effect on the cargo transported by ships, as already analysed under section 3, such indirect effect is unlikely.
However, should the proposed taxation on emissions be found to have an indirect effect on goods such that GATT would apply, it could be in violation of Article III:2 GATT, which requires fiscal measures to not discriminate against imported products. Article III:2 applies only if the proposed taxation affects the competitive condition of goods in the domestic market after they have been imported (i.e., the relevant measure is a border-enforced internal measure). Border adjustments which apply the same requirements to imports as the ones imposed on domestic products are generally permissible as border-enforced internal measures, as long as they do not violate the NT or MFN obligations.27 If the border adjustment is imposed as part of an overall scheme for the reduction of GHG emissions, WTO may well view it as a border-enforced internal measure.28 Even if found to violate GATT’s guiding principles, the EU could still justify the imposition of a tax on emissions if it satisfied one of the environmental exceptions of Article XX(b) or XX(g) and it was consistent with the chapeau of Article XX, requirements which have already been analysed in section 3.
With respect to GATS, international maritime transport does not fall in principle within the scope of this agreement and is also not included in the EU’s schedule of commitments currently in force, and therefore GATS is not analysed further with respect to this option.
Finally, the potential earmarking of the revenues accrued from the proposed taxes in order to reduce the mitigation costs of the maritime sector would not raise any issues under either the SCM Agreement since services are excluded from its scope (except if subsidies result in certain goods from certain trading partners benefitting from lower shipping costs while like goods from other trading partners cannot be transported via shipping and, therefore, are not benefitting from the subsidy) or the GATS which, is not applicable to the international maritime sector and, in any case with respect to subsidies only affords WTO Members with the right to request consultations on this matter.
6.4 Summary assessment of taxation policy design elements
This section provides a summary of the policy design elements that were used to model the impacts of the policy. The tax based on CO2 emissions was analysed in detail. For this, two tax levels were considered: one at the level of projected ETS prices, and one high tax scenario which was included as an extreme case. The projected ETS prices were based on projections provided in the EC Roadmap for moving to a competitive low carbon economy in 2050. The tax level in the high tax scenario was based on the marginal abatement costs obtained by modelling the closed ETS policy option (at five-year intervals). A summary of the assessment is provided below.
Table 6.2: Summary of policy design elements
Common design element
Options considered for further analysis
Options NOT considered for further analysis
Tax basis Tax on emissions Tax on fuel (see Technical Annex: Appendix 6)
Tax level Two options: ETS prices and marginal abatement cost from the closed ETS scenario
N/A
Use of revenues See Technical Annex: Appendix 7 N/A
27
Lael Brainard, Isaac Sorkin, Climate Change, Trade and Competitiveness: Is a Collision Inevitable? (Brookings Institution Press, 2009), p. 42. 28
ibid.
Support for the impact assessment of a proposal to address maritime transport greenhouse gas emissions
92
Subsequent to the analysis carried out in this section, the EC requested that an analysis of the fuel tax option was carried out. This can be found in the Technical Annex: Appendix 6. The tax on fuel was analysed assuming that only intra-EU cargo and passenger ships would be effectively subjected to such tax (as these have fewer options to avoid the scheme by bunkering elsewhere).
Support for the impact assessment of a proposal to address maritime transport greenhouse gas emissions
93
7 Policy option 3a: Mandatory EU-level compensation Fund
7.1 Description of the policy option
A maritime sector GHG Compensation Fund could be funded either by a levy on all EU maritime sector fuel purchases or via contributions from ship owners/operators based on the emissions from their ships on voyages to and from Europe. The design of this policy option is based on the proposal for an “International GHG Fund” submitted to the IMO (MEPC 59/4/5), which would raise funds through a levy on bunker fuel. It would entail setting an emissions reduction target for international shipping and offsetting emissions above the target largely through the purchase of approved emission reduction offsets: thus ‘sufficient offsets must be purchased to deliver a net emission target’ (IMO 2010b). The review by the IMO MBM Expert Group (IMO, 2010b) indicated that the maximum cost-effectiveness of the proposal would be achieved when all funds are allocated towards mitigation.
Other features of the International GHG Fund proposal include for the Fund to be established as a ‘separate legal entity responsible for allocating and monitoring the revenues generated’, with funds to be allocated according to UNFCCC principles, and split into four streams:
1. Mitigation and adaptation activities in developing countries and in particular in the most vulnerable developing countries;
2. R&D projects on more energy efficient ship designs and propulsion systems in order to accelerate continuing improvements in this field;
3. Technical cooperation within the existing IMO framework; and
4. Administrative expenses for operation of the International GHG Fund.
The exact allocation between the streams would be decided by the parties (i.e. to the new IMO Convention set out in the proposal) although it is worth noting that the MBM Expert Group allocated a nominal 10% for streams 2-4 when modelling impacts and cost-effectiveness.
A mandatory Compensation Fund managed at the EU level could operate in a similar manner to the proposed International GHG Fund. The Compensation Fund’s revenues would be used to support investments for emissions reductions in the maritime sector or for the purchase of approved offsets from international emission reduction projects. The revenues would flow into the Compensation Fund from levies on fuel sales or on actual vessel emissions. In the case of a levy/charge on vessel emissions, payments could be made by vessels on their arrival at EU ports, and integrated into existing port dues/fees. This process could be automated for large vessels, using a credit system. The scheme could be enforced by detaining ships in port until the contributions are paid.
The Fund would be managed and administered centrally by (for example) an EU-level Competent Authority. Responsible entities would need to become registered members of the Fund. In the case of a Fund where a levy is applied on fuel sales, this would require both fuel suppliers and vessel owners/operators to be registered members of the Fund. In the case of a Fund where a levy is applied to vessel emissions, only vessel owners/operators would need to be registered with the Fund. In either case, as a condition of membership, vessel owners/operators would need to submit a plan that elaborates on how they propose to reduce their emissions over a defined time period (e.g. five years). Each plan would need to include details of operational and technical measures that the owner/operator plans to introduce, with details of the timescales for introduction and an estimate of the costs. The Fund administrator would then need to approve the plan before allowing the vessel
Support for the impact assessment of a proposal to address maritime transport greenhouse gas emissions
94
owner/operator to become a registered member. Potentially, each owner/operator could be required to sign an agreement stating that they will adhere to their emissions reduction plan.
Fund members would pay into the Fund monetary amounts in line with their emissions performance on all journeys to and from Europe. The Fund membership cost per tonne of CO2 would need to be set in advance. The Fund would be responsible for registering all members, for collecting revenues and for determining how the revenues collected should be used to support the aim of reducing GHG emissions. The contributions collected in the Fund would be used largely to finance emission reduction measures in the maritime sector and to purchase recognised offset credits from the international carbon market to count towards the reduction target, up to a certain limit (designated as a percentage of the yearly reduction target). This approach should achieve two broad sets of impacts: direct impacts resulting from the need for Fund members to make contributions based on emissions, and indirect impacts resulting from the use of revenue raised to fund maritime emissions reductions and out of sector offsets29. One of the noted advantages of this approach is the way in which the magnitude of reductions from the price signal element (due to the influence of non-price barriers) can be compensated by direct financing of mitigation (IMO, 2010). A share of the collected revenues would finance the administrative set up of the scheme. For the remaining revenues, the Fund could seek to achieve a balance between financing projects which directly reduce maritime emissions and indirect activities such as Research and Development (R&D) and in-depth studies that could benefit innovation and energy efficiency. Detailed information on the use of revenues is provided in the Technical Annex: Appendix 7.
If the Fund fails to comply with agreed emissions reduction targets, a penalty would be levied on all members of the Fund for every tonne of CO2 emitted over and above the level of the reduction target. Penalties would need to be set at a sufficiently high level to act as a disincentive to non-compliance with the targets. Fund members would be jointly liable for paying any penalties and hence there would need to be an agreed approach by which the Fund administrator could collect any required penalty payments. One option would be to require all members to pay a financial guarantee into the Fund as a condition of membership. Such a guarantee would be in addition to the requisite membership fees that would apply on the basis of emissions performance. The financial guarantee would act as a type of returnable “deposit” and would only be used in cases where the Fund had failed to meet its emissions reduction targets. In such a scenario, a proportion of the financial guarantees provided by each member would be used to pay any penalties imposed on the Fund. Financial guarantees could be paid on an annual basis or cover longer periods of time (e.g. five years). The money paid for these guarantees would be returned at the end of the membership period, minus any costs incurred in paying non-compliance penalties.
Whilst the policy could operate on the basis of applying a levy on fuel sales or on vessel emissions, it should be noted that a fuel levy under current systems (via Member States) would be equivalent to a tax, and thus earmarking could only be suggested, not required. Instead, in order to be able to earmark funds for specific purposes, the levy would have to become a separate EU revenue stream. In order to achieve this, it would make sense to examine the administrative systems introduced for other sources of EU-level revenues. For example, the NER300 funding stream has been set up, where funds raised through the auctioning of 300 million ETS allowances have been earmarked for renewable energy and CCS demonstration projects.
The operational design of the Fund needs to be assessed on a basis of legal and technical feasibility. A levy on fuel applied to all inbound ships, with funds ring-fenced for projects within the EU or ships flagged to EU states may be less feasible than a Fund with no restrictions as to who applies. Limiting Fund eligibility to ships which have participated in the scheme has the advantage of creating an incentive to participate.
29
In the case where Fund contributions are not based on emissions, the impacts will result from the funding activities alone.
Support for the impact assessment of a proposal to address maritime transport greenhouse gas emissions
95
The mechanism by which the policy would control maritime sector emissions would be dependent on the scheme design. The scheme could operate by setting an emissions reduction target on EU maritime emissions and setting a fixed levy on maritime fuel sales or on vessels emissions. The level of impact on emissions associated with a fixed rate levy will be determined largely by the level at which the levy is set, although also affected by other factors such as the level of cost passed through and administrative design. The clarity of the scheme along with perceived permanence of the price signal will enhance the impact. These design elements are discussed further in the following section.
There would be an increase in costs to the maritime sector through the collection of revenues related to fuel sales or vessel emissions (i.e. the levy or funds collected from the sales of emissions allowances). In response to these additional costs, it is likely that there would be some level of emissions reduction due to the take up of efficiency measures. Furthermore, the revenues collected would be used to finance in-sector or out-of-sector emissions abatement. Hence, a key mechanism by which the policy sets out to control maritime sector emissions is arguably through the redistribution of funds, e.g. targeting investment towards maritime energy efficiency and sectoral R&D (again both design and operational measures).
7.2 Design elements specific to a mandatory EU-level compensation Fund
7.2.1 Basis for the collection of revenues
There are two main options for the manner in which revenues would be collected for the mandatory EU-level Compensation Fund:
A levy could be applied to all EU maritime sector fuels sales, and the revenues from this levy would flow into the Fund. The levy could be charged on the basis of the amount of fuel purchased and the carbon content of the fuel; or
A levy could be applied to all vessels arriving at and departing from EU ports, charged on the basis of the actual emissions released by the vessel between the previous port call and arrival at an EU port and/or emissions released after departure from an EU port and until arrival at the first port outside of the EU.
7.2.1.1 Applying a levy to fuel sales
Under this option, all bunker fuel suppliers that want to supply marine fuels within the EU would need to register with the Compensation Fund. Registration with the Fund would enable fuel suppliers to charge a levy on all sales to vessel owners/operators, but they would then be required to transfer the levies received to the EU-level Fund administrator. Vessels would then be obliged to purchase fuel from a bunker supplier registered with the Fund and they would need to provide evidence of this upon arrival at an EU port. The process for collecting revenues could be similar to the processes used for the collection tax revenues and consequently the administrative effort associated with this option is likely to be low. Such an approach has the potential to significantly reduce the number of responsible compliance entities and would not require tracking of emissions from individual ships. However, fuel suppliers do not directly control uptake of measures to reduce maritime emissions.
There may be competition issues associated with a proposal based on applying a levy to fuel suppliers. By requiring vessel owners/operators to provide evidence that they have purchased fuel from a registered bunker supplier, it could be argued that the scheme disproportionately favours those fuel suppliers based within the EU. Large ships starting their journeys far outside the EU are able to undertake long voyages on a single bunkering and hence may not have any need to purchase fuel from an EU fuel supplier registered with the Compensation Fund. In practice then, it is likely that a levy on fuel sales of this nature could only apply to ships that operate in a limited area within Europe. The scope of emissions under this scheme might therefore be limited to ships that operate exclusively
Support for the impact assessment of a proposal to address maritime transport greenhouse gas emissions
96
within Europe. This would cover a large number of small ships including fishing vessels, pleasure craft, ferries and vessels <500GT (Hemmings, 2011).
The main problem of this approach would be the high risk of evasion, as described in the tax policy option (see Section 6)
7.2.1.2 Applying a contribution to vessels based on actual emissions
Under this sub-option, instead of applying a levy to fuel sales, a levy would be applied to vessels per unit of CO2 emitted. This would be similar to applying a tax on vessel emissions (see Section 6 for full details). Ships would be liable to pay the levy upon entry at an EU port and port authorities would then be responsible for transferring the levies received to the body responsible for managing and administering the Compensation Fund. Ships could also pay their contribution on an annual basis, and indeed, this option may be a more practical solution. Ships would need to pay levies equivalent to the emissions released for each journey, and these revenues would be transferred to the Fund administrator. The possible methods used to set the level of levies would be the same as those proposed under the taxation policy (Option 2).
7.2.1.3 Choice of the basis for the collection of revenues
As with the policy option based on a tax, the sub-option of applying a levy to fuel sales is considered to have very high risks of evasion, in addition to potential competition issues if ships are required to buy fuel from suppliers based in the EU. For this reason, as with the tax option, the levy on fuel sales is discarded and the rest of the section focuses on a levy on emissions.
7.2.2 Contribution levels
The level of the contribution to the mandatory Compensation Fund will be assessed as part of the detailed impact assessment.
7.2.3 Administrative arrangements: monitoring, reporting verification of emissions and enforcement
The main MRV and enforcement aspects related to a levy applied on vessel emissions are the following:
Monitoring fuel consumption (and consequently calculating CO2 emissions) associated with journeys included within the scope of the scheme;
Reporting of emissions by the responsible entity;
Verification of emissions reported; and
Enforcement (ensuring that the correct levies are paid).
All the aspects related to monitoring, reporting and verification of emissions are detailed in the section about elements common to every policy option. The following table shows in detail only those aspects of the MRV process that would be specific of a mandatory EU-level compensation Fund.
Table 7.1: MRV Process Aspects Specific to the Mandatory EU-level Compensation Fund
Step Task Description Responsibility Frequency
1 Establish a central Fund administration body responsible for receiving and managing levies related to vessel emissions.
A single EU-wide entity could take on the administration of the Fund and would act as the single point to which levies would be transferred after they have been collected from responsible entities.
European Commission
Once at the start of the scheme
Support for the impact assessment of a proposal to address maritime transport greenhouse gas emissions
97
Step Task Description Responsibility Frequency
2 Register vessel owners/operators as members of the Fund
Vessel owners/operators would be obligated to register as members of the Fund. As a condition of membership, they would need to develop plans that demonstrate how they will reduce their emissions over a specified time period (e.g. five years). The Fund administrator would need to review and approve these plans prior to registering vessel owners/operators as Fund members.
Fund administrator and vessel owners/operators
Once at the start of the scheme and then at regular intervals
3 Testing phase to record emissions from individual vessels
Prior to introducing the scheme, fuel consumption/CO2 emissions from all vessels that would be affected by the policy should be measured and recorded. The testing phase could cover a period of between one and three years. The testing phase would be used to understand the levels of emissions from individual vessels to understand the likely costs of compliance with the scheme.
Fund administrator and responsible entities
Once at the start of the scheme
4 Pay levies The responsible entity or its appointed agent or other party, would pay the accrued amount for the established period. Levies could be paid for per trip (i.e. to port authorities) or annually.
Ships, port authorities
Annually or per trip.
5 Transfer of levies to the Compensation Fund
Port authorities would transfer levies accrued at set dates. A new administrative system would need to be set up to enable this to happen as it is possible that the Fund would be administered by an entity that does not currently collect revenues in this manner.
Port authorities and Fund administrator
Annually or quarterly
6 Develop plans for the use of Fund revenues
Based on the emissions reduction plans submitted by members of the Fund and based on the professional judgement of the Fund administrator, decisions will need to be made on where to invest the revenues collected.
Fund administrator
As is the case with other policy options, the scheme would be best enforced by port authorities. They would report to the Compensation Fund administrator any evidence of non-compliance in terms of incorrect amount of levies being applied or emissions not being monitored.
7.2.4 Options for the selection of a Competent Authority
The Competent Authority responsible for managing the Compensation Fund would be in charge of receiving revenues collected under the scheme (i.e. levy payments) and for
Support for the impact assessment of a proposal to address maritime transport greenhouse gas emissions
98
ensuring that these revenues are used to help the maritime sector reduce its emissions. If the Compensation Fund were to operate on the basis of a levy applied to fuel sales, then the Authority would also have responsibility for ensuring that all relevant fuel suppliers are registered with the Fund. If the Fund were to operate on the basis of applying levies to vessel emissions, then the Authority would have responsibility for ensuring that all vessels that arrive at or depart from EU ports are registered with the Fund.
A number of EU-level organisations could act as the Competent Authority responsible for managing the Compensation Fund. One possibility is for the European Maritime Safety Agency (EMSA) to take on this responsibility. EMSA is a European Union body with responsibilities for supporting the Commission and Member States in the fields of maritime safety and the prevention of pollution from ships. EMSA also has significant capabilities in handling maritime information, including vessel tracking and identification systems. However, EMSA does not have experience in managing and administering funds for investment projects.
An alternative to EMSA could be the European Investment Bank (EIB), which acts as the EU’s financing institution. The EIB’s primary role is to provide long-term finance in support of investment projects, and given that the revenues from the Compensation Fund would at least partially be used to fund investment in abatement projects for the maritime sector, the EIB could be well-placed to act as the Fund administrator. However, whilst EIB is well placed to manage and administer the revenues collected via the Fund, it does not necessarily have the expertise to verify returns provided by the responsible compliance entities.
A further alternative is for a new EU-level Competent Authority to be set up with the express remit of managing the Compensation Fund. The benefit of this approach would be that the new body could be designed to fulfil all of the requirements necessary to manage all aspects of the Fund. However, this would potentially be a very costly option.
One further variation would be for the European Commission to retain overall responsibility for the Fund and to then contract the services of both EMSA and EIB to provide the services necessary for the day-to-day Fund administration and management.
7.3 Legal assessment
7.3.1 Legal feasibility of introducing a Mandatory EU – level compensation fund taking under EU law
Option 3(a) bears a strong resemblance to Options 2(a) and 2(b) as the EU would be imposing an obligatory levy in favour of public authorities; this levy would essentially be a charge on the fuel consumed or the GHG emitted by ship operators. Therefore, even if the principal objective of the proposed scheme is the protection of the environment through the reduction of the maritime GHG emissions, the primarily fiscal nature of the measures employed would imply that the legal basis for the adoption of this option is Article 192(2) TFEU, i.e., it would have to be adopted through a special legislative procedure. However, if the emphasis were placed on the GHG reduction elements rather than the levy aspect of the scheme it might be possible for Option 3(a) to be adopted under Article 192(1) TFEU (ordinary legislative procedure). As already discussed, the CJEU judgment and the AG Kokott Opinion in case C-366/10 imply that a measure is of a fiscal nature if the price that complying entities have to pay is fixed by the State in advance and if the measure is intended to generate revenue for the public authorities. In this case the EU would have to clearly demonstrate that the proposed levies would be of secondary importance within the whole scheme. This could be the case if a more prominent role were given to such elements as the allocation of all the revenues for mitigation purposes, the obligation of ships to register with the Fund (the payment of a membership fee), the requirement to submit emission reduction plans to the Fund administrator or the imposition of fines in case the Fund as a whole exceeded its emission reduction targets. It is true that under this option the levy would be
Support for the impact assessment of a proposal to address maritime transport greenhouse gas emissions
99
fixed in advance and the revenues would be accrued by public authorities. However, under option 2 the imposition of the tax is the sole instrument to reduce GHG emissions from the maritime sector while under option 3(a) the levy is only one of the several elements of the proposed scheme. In addition, under option 3(a) the revenues accrued will be allocated for mitigation purposes and as a consequence cannot be considered as intended to generate revenues for the public authorities. Therefore, depending on the exact design of the option it could be argued that Article 192(1) TFEU would be the correct legal basis for a mandatory EU-level Compensation Fund. As long as the fundamental characteristics of the fund as described above were not modified, the discussion on whether the EU-level Compensation Fund is a measure primarily of a fiscal nature would not significantly change, even if the EU-level Compensation Fund was adopted to serve as an alternative option to another mandatory scheme (for instance, if a tax was imposed on the maritime transport allowing, however, the complying entities to opt to participate in the Fund instead of paying the tax). Introduction of the proposed EU-level compensation Fund via a Regulation rather than a Directive would ensure the uniform application and direct applicability of the measures to the complying entities throughout the EU. As mentioned above, under this option the maritime sector could be obliged to register and pay certain fees to the EU-level Compensation Fund. The obligation of registration and payment of certain fees to a central European authority, such an EU agency, is not a novel concept. Article 74 of Regulation 1907/200630 (the REACH Regulation) requires that payments are made to the European Chemicals Agency in connection with certain activities of the Agency. The payments are intended to cover part of the work that such activities would generate at the Agency. In particular, the REACH Regulation notes that ‘fees’ are paid in connection with certain submissions to the Agency. In addition, it notes that the Agency may collect other payments in connection with services it provides; such payments are referred to as ‘charges’ (Article 74(5)). The activities for which a charge may be imposed are contained in a separate document, the Commission Regulation on Fees and Charges.31 The European Medicines Agency also charges fees for the services it provides including those necessary in order to obtain and maintain a Union authorization to market medicinal products for human and veterinary use.32 Following these precedents, the EU could argue that any ship wishing to provide its services within the EU must be a member of the EU Compensation Fund. The membership fee and any other charges would be imposed for services rendered by the administrator of the Fund, e.g. review of emission reduction plans, monitoring of ship movements, and verification of emissions, as these actions would be intrinsic to the operation of the whole scheme. The inclusion in the proposed scheme of both a membership fee based on emissions and a levy on emissions could be viewed as regulating twice the same conduct. It might be preferable to use only one, i.e., the membership fee since such fees could be paid directly to an EU authority whereas any levies would most likely be accrued at the Member State level since the competence to impose taxes remains with the Member States. This would raise additional concerns as to whether it is possible to earmark them. Regarding enforcement, under this option, the management of the scheme would lie with the EU; this is in contrast to all other options where enforcement is entrusted upon the Member States. The EU can impose administrative penalties on entities not complying with
30
Regulation (EC) No 1907/2006 concerning the Registration, Evaluation, Authorisation and Restriction of Chemicals (REACH), establishing a European Chemicals Agency, OJ L 396, 30.12.2006, p. 1–854. 31
Commission Regulation 340/2008 on the fees and charges payable to the European Chemicals Agency pursuant to Regulation No 1907/2006 on the Registration, Evaluation, Authorisation and Restriction of chemicals (REACH), OJ L 107, 17.4.2008, p. 6–25. 32
Article 1 of Council Regulation No 297/95 on fees payable to the European Agency for the Evaluation of Medicinal Products, OJ L 35, 15.2.1995, p. 1–5.
Support for the impact assessment of a proposal to address maritime transport greenhouse gas emissions
100
its rules, e.g., in EU antitrust law the Commission imposes fines on undertakings abusing their dominant position. Furthermore, under Regulation 1083/2006 laying down general provisions on the European Regional Development Fund, the European Social Fund and the Cohesion Fund, the Commission may suspend all or part of the interim payments if: there is a serious deficiency in the management and control system of the program which affects the reliability of the procedure for certification of payments which has not been subject to corrective measures; expenditure in a certified statement of expenditure Is linked to a serious irregularity which has not been corrected or; if a Member State has seriously breached its management and control obligations (Article 92). Thus, the Commission may impose administrative sanctions on regulated entities, provided that it exerts some kind of supervision over them. In this case the Commission, to the extent it supervised the maritime industry’s compliance with its targets, would be able to require the Fund to withhold parts from the financial guarantees to cover the extent the maritime sector exceeded its emissions target. The imposition of this sanction implies the exercise of discretionary powers and therefore no other entity apart from the Commission would be competent to impose it.
7.3.2 Legal feasibility of introducing a Mandatory EU – level compensation fund under international law
No specific problems further to those analysed in the overarching legal section have been identified concerning the compatibility of the proposed option with UNCLOS. As already discussed in Section X, the EU could impose an obligation to be Members of an EU-level Compensation Fund on ships entering and leaving EU Member States’ ports under the prescriptive jurisdictional rights afforded by UNCLOS to port States. Ships’ right of innocent passage would not be violated as only ships calling at EU ports would be subject to the EU legislation. As the scheme would be taking into account emissions of GHG or the fuel consumed outside EU territorial waters, the potential issue of extraterritoriality remains.
It could be argued that the ships, by submitting emission reduction plans, are assuming an obligation against the EU the breach of which should be compensated through the financial guarantees. However, if each ship has specific emission reduction obligations that would require technical or operational changes, this could raise additional UNCLOS issues due to UNCLOS provisions limiting a coastal State’s authority to impose CDEM requirements (as will be further elaborated under Option 4). Note, however, that UNCLOS does not impose a similar limit on measures taken on the basis of a port State’s authority. The proposed focus on the results the industry has achieved as a whole eliminates this problem.
Regarding the WTO Agreements, the proposed levy on emissions or the fuel consumed (or a participation fee based on emissions) raises similar issues as the ones discussed under the legal analysis of option 2; the main difference between options 2(a) and 2(b) with option 3(a) is that under the latter any revenues accrued are used to fund the Mandatory EU – level compensation Fund. As with other measures, the proposed measure essentially aims at regulating the service provided by the maritime industry and not the cargo transported and GATT is therefore unlikely to apply. The imposition of a levy on emissions or the fuel consumed (or a participation fee to the Fund) could arguably be viewed as having an indirect effect on the cargo transported by ships as already analysed under the legal analysis of option 2. Therefore, the design of the measure has to ensure that the relevant principles of GATT, i.e., Article I:1 on MFN and Article III:4 on NT, are respected. However, even if found to violate such principles, the EU could still justify the introduction of the proposed measure if it satisfied one of the environmental exceptions of Article XX(b) or XX(g) and it was consistent with the chapeau of Article XX, requirements which have already been analysed. With respect to GATS, international maritime transport does not fall in principle within the scope of this agreement and is also not included in the EU’s schedule of commitments currently in force, and therefore GATS is not analysed further with respect to this option.
Support for the impact assessment of a proposal to address maritime transport greenhouse gas emissions
101
Finally, the earmarking of revenues for reducing the mitigation costs of the maritime sector would not raise issues under either the SCM Agreement since services are excluded from its scope (except if subsidies result in certain goods from certain trading partners benefitting from lower shipping costs while like goods from other trading partners cannot be transported via shipping and, therefore, are not benefitting from the subsidy) or the GATS, which does not apply to the international maritime transport sector and, in any case, only affords WTO Members with the right to request consultations on this matter.
7.4 Summary assessment of EU level Compensation Fund policy design elements
This section provides a summary of the policy design elements that were used to model the impacts of the policy. The levy on CO2 emissions was analysed in detail. For the purposes of comparing this option fairly against the other policies, the contribution level was set equal to the level of the low tax on emissions. The level was therefore set at the projected ETS price for each five-year interval (rather than the extreme case high tax). A summary of the assessment is provided below.
Table 7.2: Summary assessment of policy design
Common design element Options considered for further analysis
Options NOT considered for further
analysis
Basis for the collection of revenues Levy on emissions Levy on fuel
Contribution levels Equal to projected ETS price levels every five years as per tax on emissions policy scenario
N/A
Competent Authority EU Agency N/A
Use of revenues See Technical Annex: Appendix 7. N/A
Support for the impact assessment of a proposal to address maritime transport greenhouse gas emissions
102
8 Policy option 3b: Industry managed compensation Fund
8.1 Description of the policy option
This policy option is a variation on the design of the EU-level mandatory Compensation Fund, but because of significant differences in the way in which such a policy would operate, it has been treated as a separate policy option. The design of this policy option draws on the design of the voluntary, industry-led NOx fund implemented in Norway for reducing NOx emissions from shipping and other sectors.
The concept of an industry-managed Compensation Fund for reducing EU maritime sector CO2 emissions would require such a Fund to be set up as a legal entity that would be responsible for ensuring that emissions reductions are achieved in line with any reduction targets in force; this would mean that individual vessels would not be liable for ensuring reductions in emissions, but the industry as a whole, via the legal entity of the Fund, would have responsibility in this area. In addition to similarities with the approach taken in Norway for dealing with NOx emissions, the concept is also similar to that of Protection and Indemnity (P&I) Insurance for the maritime sector, which is provided by P&I clubs.
Two different sub-options are conceived for the mechanism and functioning an industry-managed compensation fund:
Contributions-based compensation fund. This would operate in a similar manner to the Norwegian NOx fund, but would allow industry to earmark revenues to fund activities that reduce emissions in the shipping sector or elsewhere. Typically, fund members would pay into the fund monetary amounts in line with their emissions performance on all journeys to and from Europe, and the membership cost per tonne of CO2 would need to be set in advance (see Section 7.2 on the description of the EU-level mandatory Compensation Fund for further details). Revenues would be re-invested by the Fund. The Fund would not be obliged to comply with emissions reduction targets. Targets could be indicative, but not compulsory.
Target-based compensation fund. This would work in the following way:
1. An emission reduction target for the sector would be estimated by the European Commission, as detailed in Section 4.4.
2. Vessel owners/operators would be required to register with the Compensation Fund. Vessels that are not registered members of the Fund would be required to pay a penalty each time they arrive at and/or depart from an EU port. The level of the penalty would need to be significantly higher than the costs of membership of the Compensation Fund.
3. The Compensation Fund would have to comply with the emission reduction target set at the EU level, and would make arrangements to ensure it is met. This could be achieved by, for example: implementing abatement measures or buying authorised offsets in the international carbon markets.
In addition, the EU has a choice in terms of how it treats the industry Fund in legislation on maritime greenhouse gas emissions: these also influence how the Fund will operate. This overview focuses on two main sub-options: the EU could indicate an industry Fund as a voluntary alternative that industry could take to a legally required policy option; alternatively, the EU could make the creation of the Fund a legal requirement.
A Compensation Fund as an alternative to EU measures. This approach would be analogous to the Norwegian NOx tax. EU legislation would set up a full option (e.g.
Support for the impact assessment of a proposal to address maritime transport greenhouse gas emissions
103
an ETS or a tax as per Options 1 or 2), and give industry the opportunity to present an alternative, i.e. setting up a Compensation Fund.
A legal requirement to set up a Compensation Fund. Under this approach, EU legislation would oblige the maritime industry to set up a Compensation Fund within a certain period of time. In this approach, the EU would need to clearly state what would happen if industry did not fulfil the legislative requirement. In particular, if a Fund is not created by a certain period, the EU would state that it would put in place a mechanism such as an ETS.
The two types of fund interact with the two approaches for treating the fund under EU legislation, in effect creating four sub-options. The sub-options have different implications both for the EU legislative approach (see Section 8.4 below), and also in terms of the treatment of ships owners and operators.
Table 8.1: Summary of approaches for treating the Fund under EU legislation
The fund is an alternative to
other mandatory EU measures The creation of the fund is
mandatory under EU legislation
Contributions-based fund
Ship owners/operators can choose between participating in the fund or complying with the mandatory EU measures
Ship owners/operators that do not participate in the fund would face legal penalties.
Target-based fund Ship owners/operators can choose between participating in the fund or complying with the mandatory EU measures
Ship owners/operators that do not participate in the fund would face legal penalties.
8.1.1 Additional considerations
It can be noted that other paths are also possible: for example, the EU could make a non-binding call for industry to set up a Compensation Fund (the impact of this method in terms of reducing GHG emissions is far from clear, however). Alternatively, the EU could set up a fund, as per Option 3a, and transfer its operations to industry: on an operational basis, this would function in a very similar manner to Option 3a; however, the legal mechanisms would require further study.
A further variation would be to allow more than one industry-managed Compensation Fund to be set up. Each Fund would have responsibility for achieving a proportion of the overall maritime sector emissions reduction target (set at the EU level). Multiple Funds could be created on the basis of alternative EU funds, country level funds, or funds for different shipping sub-sectors e.g. liner shipping, container ships, tankers, etc. This could allow existing industry groups to set up their own Compensation Funds, which could lead to more collaboration, and allow membership dues to be more targeted in their pricing and structure. Multiple Funds could introduce the possibility of vessels switching between Funds. This would lead to uncertainty for Fund administrators in terms of forecasting and managing the Fund revenue streams and targets. One way to mitigate this would be to ban switching, or place time restrictions on switching and for ships to remain liable for any penalties for not achieving environmental targets incurred during any given year’s membership to a Fund.
8.1.2 Enforcement approaches
In all the options, enforcement and control will be shared between public authorities and the industry managed fund (or funds). At the EU level, a system of reporting and control requirements would have to be set up for the fund or funds. Enforcement at the ship level would also be needed. As indicated in the table above, the choice of sub-option will influence the approach.
Support for the impact assessment of a proposal to address maritime transport greenhouse gas emissions
104
Where the fund is an alternative to EU measures, public authorities will need to maintain a registry of ships subject to EU maritime GHG legislation: this registry will need to indicate for each ship whether it participates in the fund system of the EU measures. All ships would need to participate in one of the two systems; those that do not would face penalties.
Where the fund is an alternative to EU measures, a system of additional incentives could also be set up. Such incentives could be in the form of additional benefits for scheme participants, such as priority berthing, or refuelling in ports.
If the fund is a legislative requirement, then membership in the fund (or one of several funds) becomes a requirement, and EU Port Authorities would need to ensure that all arriving ships subject to EU maritime GHG legislation belong to a fund. Those that do not would face penalties.
A penalty system could be set up to reduce the administrative burden of vessels that only call at EU ports very infrequently. As noted above, ships that are not registered with a Fund would receive a financial penalty. Within each observation period (e.g. each calendar year), a ship that calls only once at EU ports would receive a base penalty at a relatively low level. However, if further port calls are made during the observation period, the penalties would increase in severity.
Penalties for non-compliance would be levied by Port Authorities and therefore would form a revenue stream to Member States. The amount of revenue would be proportional to (i) the level at which the penalty is set; (ii) the numbers of port callings; and (iii) the level of compliance enforcement undertaken in a port. No hypothecation of the revenues would be possible if they are collected by Member States.
8.2 Design elements specific to target-based industry managed compensation fund
Design elements specific to contribution-based industry managed compensation fund
The design elements would be similar to those considered in a mandatory EU-level compensation fund, but in this case the managing entity or entities would be set up by industry.
These design elements are mainly:
The basis for the collection of revenues. It would most likely be the emission levels of each of the Fund’s members.
Contribution levels. The level of the contribution should be set up in line with the voluntary commitments to reduce GHG emissions made by the compensation funds.
8.2.1 Setting emission reduction targets for Compensation Fund This policy would operate by setting targets for reductions of maritime sector emissions. The Fund would be legally obligated to ensure that maritime sector emissions meet the agreed target in specific years. Prior to the scheme becoming fully operational, the Fund would be responsible for gaining members or participants in the form of vessel owners/operators. In the case of there just being a single Fund, the European Commission can set the level of emissions reductions that could be achieved by the sector over particular time periods. These reduction targets could be in line with the approach discussed in Section 4.4 . Once a reduction target has been agreed, a period of monitoring would be required so that the Fund administrator can quantify the emission reductions required from its members. Monitoring would take place over a period of between one and three years to take into account variation in activity. Members of the Fund would also be responsible for submitting a plan that demonstrates how they intend to reduce their emissions over a defined time period (e.g. five years). Such plans would need to include details of operational measures and technological measures that would be adopted to reduce emissions. The Fund administrator would review all of the plans submitted, and on the basis of a detailed technical and economic evaluation,
Support for the impact assessment of a proposal to address maritime transport greenhouse gas emissions
105
would identify measures that would receive financial support from the Fund’s financial resources (i.e. from membership fees).
In a scenario with more than one industry-managed Fund in operation, a procedure will be required for allocating emissions reduction targets to each Fund. This could be achieved using the outputs from the emissions monitoring process. The overall emissions target would be distributed across the Funds in proportion to the emissions covered by each Fund.
Applying emission reduction targets on the basis of the total sectoral emissions rather than on the basis of the emissions covered by each Fund should encourage each Fund to maximise its membership.
The main issues when allocating emission reduction targets for each Fund would relate to the treatment of new entrants and the flexibility of the targets to accommodate vessels changing membership from one Fund to another. A new entrant reserve could be kept to increase the allowed emissions for Funds receiving new members. Membership changes would only be allowed after an initial adjustment period, otherwise Compensation Funds would have an incentive to reduce their membership once their targets have been set. Phases could last for about five or eight years, as suggested for the EU ETS.
8.2.2 Options for compliance
The Fund itself would be responsible, as a legal entity, for ensuring compliance with emissions reduction targets. Hence, it would need to submit verified emissions monitoring reports to the European Commission that demonstrate compliance with agreed targets.
The European Commission would need to establish the available options for compliance. These could include some or all of the following:
Internal emission reductions by the Fund members through the implementation of operational and technical measures, as well as the reduction of shipping activity.
Trading of emissions quotas among Compensation Funds, so that Funds that exceed their target can sell their additional emission savings to Funds with a deficit. This would effectively create an emissions trading scheme among Compensation Funds. This is equivalent to the aggregation or “pooling” of installations within sectors in the existing EU ETS, which happens when installations from the same sector co-operate to meet an entire industry’s emissions target collectively.
Buying offsets from accredited out-of-sector emissions reduction credits. These could be from CDM projects (for example). However, a limit would apply on the proportion of annual emissions reduction targets that can be achieved through the purchase of out-of-sector credits, in order to ensure that improvements in the performance of the maritime sector take place.
In the event that the Fund fails to comply with agreed emissions reduction targets, a penalty would be levied on the Fund for every tonne of CO2 emitted over and above the level of the cap. Penalties would need to be set at a sufficiently high level to act as a disincentive. As the Fund would be liable for paying this penalty, any agreement between the Fund administrator and its members would need to allow for failure to meet targets and would need to include agreed procedures for collecting additional revenues to cover the costs of any penalties that would apply. It would be up to the Fund itself to decide on these procedures, but one possible option would be to require all members to pay a financial guarantee into the Fund as a condition of membership. This could operate in the same way as the financial guarantees described for the EU-level mandatory Compensation Fund.
Support for the impact assessment of a proposal to address maritime transport greenhouse gas emissions
106
8.3 Administrative arrangements: monitoring, reporting verification and enforcement
The main MRV and enforcement aspects related to industry managed Compensation Fund are the following:
Monitoring fuel consumption (and consequently calculating CO2 emissions) associated with journeys included within the scope of the scheme;
Reporting of emissions by vessel operators/owners/managers;
Verification of emission reports;
Collecting penalties or applying other enforcement measures to ensure that vessels are members of a registered Fund;
Additionally, in target-based Compensation Funds, enforcement will be necessary to ensure that emissions reduction targets are achieved (e.g. collection of penalties). For contribution based compensation funds, emissions reduction commitments would be voluntary.
The following table shows the main tasks required for compliance with an industry-managed Compensation Fund where the only compliance option was the implementation of emissions abatement measures. Administrative arrangements related to the monitoring, reporting and verification of emissions are detailed as part of the section on elements common to every policy option. Only the specific tasks for an industry managed Compensation Fund are detailed here.
Table 8.2: Administrative arrangements for compliance through abatement measures
Step Task Description Responsibility Frequency
1 Set up legal agreements between industry-managed Compensation Funds and the European Commission
Agreements would need to be reached between each industry-managed Compensation Fund and the European Commission that would delegate responsibility for meeting emissions reduction targets to the Fund(s) and allow Fund members to be exempt from penalties/levies that would be applied to non-members upon entry/departure to/from an EU port.
European Commission and Fund administrator(s)
Once, prior to the start of the scheme and reviews when necessary.
2 Set up agreements between industry-managed Funds and members of each Fund
Each Fund would be responsible for attracting members to its scheme and for providing details of its membership (numbers of vessels included and total annual emissions covered) to the European Commission. The Fund would collect membership fees from each member, charged at an agreed level per tonne of CO2. It may also be necessary to collect financial guarantees from each member at this point.
Fund administrator(s)
Once at the start of the scheme and thereafter at regular intervals (e.g. annually)
Support for the impact assessment of a proposal to address maritime transport greenhouse gas emissions
107
Step Task Description Responsibility Frequency
3 Develop and approve emissions reduction plans
As a condition of entry to the Fund, each member would be responsible for developing an emissions reduction plan that gives full details of how they plan to reduce their emissions over a defined period (e.g. five years). The Fund administrator would need to review and approve these plans prior to registering vessel owners/operators as Fund members.
Fund administrator(s) and vessel owners/operators
Once at the start of the scheme and thereafter at regular intervals
4 Testing phase to record emissions from individual vessels
Prior to introducing the scheme, fuel consumption/CO2 emissions from all vessels that would be affected by the policy should be measured and recorded. The testing phase could cover a period of between one and three years. The testing phase would be used to understand the levels of emissions from individual vessels to understand the likely costs of compliance with the scheme.
Responsible entity
Once at the start of the scheme and reviews when necessary.
5 Allocate emissions reduction targets to the Fund(s)-
(only for target-based fund)
Emissions reduction targets would be allocated to each Fund on the basis of the amount of emissions covered by the Fund as a proportion of the emissions covered by all Funds. Targets would be referenced to total maritime sector emissions to encourage maximum membership.
European Commission
Once at the start of the scheme and thereafter at regular intervals
6 Pay penalties (for non-compliance with targets)
(only for target-based fund)
In the case that a Fund fails to meet its agreed emissions reduction targets, it will be legally liable to pay a penalty on behalf of all if its members. It is up to the Fund administrator to decide how to collect the monies required to pay this penalty from its members, but a system of up-front financial guarantees could be applied to ensure that the Fund has the necessary funding available to it.
Fund administrator(s)
Only in cases of non-compliance
7 Pay penalties (non-members)
Vessels would need to pay a penalty upon entry to/departure from an EU port. These penalties would be collected by Port Authorities
Vessels Per trip.
If the legislation allowed emission trading across Funds, additional administrative tasks would be needed to set up the trading mechanisms, as detailed for the ETS option. Administrative costs would be considerably lower in this option due to the lower number of compliance entities (which in this case would be Compensation Funds instead of the individual vessels).
Support for the impact assessment of a proposal to address maritime transport greenhouse gas emissions
108
8.4 Legal assessment
8.4.1 Legal feasibility of introducing an industry managed Compensation Fund under EU law
The legal basis for the establishment of an industry-managed Compensation Fund to reduce the GHG emissions from the maritime sector would be Article 192(1) TFEU (ordinary legislative procedure). The predominant purpose of the proposed measure is the protection of the environment and the measure would not be considered primarily of a fiscal nature. Even if the industry-managed Compensation Fund takes the form of a contribution-based entity with members obliged to pay the membership fee, the revenues would be accrued by a private body rather than a public authority.
Regardless whether the industry-managed Compensation Fund is contribution-based or target-based, it should be established via a Regulation rather than a Directive as the Member States will not be involved in the operation and oversight of this option and it is essential to ensure the uniform application and direct applicability of the proposed measure to the complying entities throughout the EU.
There are two ways the EU could provide the establishment of this Compensation Fund: first, the EU could afford the maritime industry the option of establishing an industry-managed Compensation Fund, making compliance with its rules an alternative to compliance with other mandatory EU legislation (e.g., an ETS or a tax scheme). Alternatively, the EU could oblige the maritime industry to establish a Fund within a certain period of time, rendering membership to the Fund and compliance with its Rules a condition for any vessel’s entry into an EU port.
Under either option, though the proposed scheme would not be voluntary, it would contain elements of self-regulation as the maritime industry would be allowed a significant margin of appreciation on possible ways to achieve its targets. The Inter-institutional Agreement on better law-making defines self-regulation as ‘the possibility for economic operators, the social partners, non-governmental organisations or associations to adopt amongst themselves and for themselves common guidelines at European level (particularly codes of practice or sectoral agreements)’.33 As a general rule, self-regulation does not imply that the EU Institutions have adopted any particular position – the obligation of the Commission is to scrutinise self-regulation practices in order to verify that they comply with provisions of the Treaties. However, in the case of an industry-managed Compensation Fund, the EU would have to retain supervision powers to monitor whether the Fund and the maritime sector managing it would collectively achieve the targets set. In case the Fund failed to attain the set targets (i.e., either reduce its emissions or collect the participation fee), and if there were no other mandatory measures the maritime sector could comply with instead of participating to the Fund, the Commission could reserve for itself the right to introduce another mandatory mechanism (e.g., an ETS) to reduce the maritime industry’s GHG emissions.
The EU has already some experience with self-regulatory schemes from which it could draw useful insight. Following the introduction of the Euro in 2002, EU governments, the European Commission and the ECB called on the banking industry to develop harmonised schemes for electronic Euro payments (Single European Payments Area, SEPA). To this end, the European Payments Council (EPC) was established, consisting of representatives of banks, banking communities and payment institutions, as the coordination and decision making body of the European banking industry. The EPC supports and promotes the Single Euro Payments Area by developing payment schemes and frameworks which help to realize the integrated euro payments market. The newly adopted SEPA Regulation in Recital (5)
33
Interinstitutional Agreement on better law-making (2003/C 321/01), paragraph 22.
Support for the impact assessment of a proposal to address maritime transport greenhouse gas emissions
109
explicitly recognizes the self-regulatory efforts of the European banking sector through the SEPA initiative and the role of the EPC.34
Another issue is whether the EU Regulation should provide for the establishment of only one or more than one industry-managed Compensation Funds to avoid allegations that the proposed measure is violating EU competition law rules by obliging private parties (i.e., shipping companies) to participate in only one private body (i.e., the industry-managed Compensation Fund) thus creating a ‘monopoly’. EU competition law rules prohibit undertakings from engaging in anti-competitive behaviour such as abuse of their dominant market position. Undertakings are classified as such by their actions, the context in which they act and the purpose or effect of their actions; all undertakings engaged in economic activities are subject to competition law rules, unless they provide services of general interest. The proposed industry-managed Compensation Fund would not be engaging in economic activities since any revenues accrued would be allocated for climate change mitigation purposes; consequently, the proposed scheme does not fall within the ambit of EU competition law rules. Furthermore, State aid rules would also not be applicable as the allocation of the Fund’s revenues for mitigation purposes in the maritime sector would be decided at the EU level and would take place through a private body, and not via the Member States.
On the same issue, note that Article 1(4) of Directive 84/5 on the approximation of the laws of the Member States relating to insurance against civil liability in respect of the use of motor vehicles35 provides that each Member State should establish or authorise a body in which all motor vehicle insurers must participate to provide compensation in case one of its Members has failed to do so. Even though not explicitly provided, this body may be managed by the industry itself (e.g., in Greece). Since the EU could require private parties to be members of only one privately-managed body at the Member State level, it should be able to do the same at the EU level.
With respect to the use of the revenues potentially accrued by the industry managed Compensation Fund, one of the basic elements of this option’s design is that such revenues would be allocated among the maritime industry for mitigation purposes. The EU would have to establish certain rules under which this allocation would take place (e.g., the principle of common but differentiated responsibilities) to ensure that the goals set by the EU institutions are achieved.
8.4.2 Legal feasibility of introducing an industry managed Compensation Fund under international law
No specific problems apart from those analysed in the overarching legal section have been identified concerning the compatibility of the proposed option with UNCLOS. Under the prescriptive jurisdictional rights afforded by UNCLOS to port States, the EU could impose on ships entering and leaving EU Member States’ ports an obligation to be Members to an industry managed Compensation Fund.
Regarding the WTO Agreements, this measure also aims at regulating the service provided by the maritime industry and not the cargo transported. However, the imposition of an obligation on the maritime sector to participate in a contribution-based or a target-based Compensation Fund could arguably be viewed as having an indirect effect on the costs of cargo transported by ships as already analysed. To avoid such issues, it will be important to design the EU legislation carefully to ensure that it respects in particular the MFN and NT principles of GATT.
34
Regulation establishing technical and business requirements for credit transfers and direct debits in euro and amending Regulation (EC) No 924/2009 available at http://register.consilium.europa.eu/pdf/en/12/st06/st06386.en12.pdf (last accessed on 16 May 2012); Note that the EPC argues that its role in the SEPA is misrepresented http://www.europeanpaymentscouncil.eu/article.cfm?articles_uuid=325E5BEE-5056-B741-DB1E484F25C5C265 (last accessed on 16 May 2012). 35
Second Council Directive 84/5/EEC on the approximation of the laws of the Member States relating to insurance against civil liability in respect of the use of motor vehicles, OJ L 008, 11.01.1984, p. 17 – 20.
Support for the impact assessment of a proposal to address maritime transport greenhouse gas emissions
110
The establishment of a contribution-based industry managed Compensation Fund would not be considered as a fiscal measure since the participation fees will be collected by a private body; as a consequence, the proposed measure would not fall within the ambit of Article III:2 GATT. Whether the establishment of a contribution-based or a target-based industry managed Compensation Fund could constitute an internal regulation measure within the meaning of Article III:4 would depend on whether the proposed measures would be considered to affect goods prior to or after their importation to the EU. If the proposed EU measures would be considered as affecting goods after their importation to the EU, they would need to comply with the requirements of Article III:4 concerning like products. If deemed to affect goods prior to their importation, such measures would fall within Article XI:1, which prohibits bans and quantitative restrictions, other than duties, taxes or other charges, on imports and exports among WTO members. If the establishment of a target-based industry managed Compensation Fund resulted in a reduction of the volumes of goods imported into the EU due to, for example, a cap on emissions or because of an increase in the cost of transportation, this might be considered to constitute a quantitative restriction.36However, the economic assessment shows that such effects are unlikely. Even if a compensation-based or target-based industry managed fund were found to violate such principles, the EU could still justify its establishment if it satisfied one of the environmental exceptions of Article XX(b) or XX(g) and it was consistent with the chapeau of Article XX, already analysed in section 3. With respect to GATS, this WTO legal instrument does not apply to the international maritime transport and according to its schedule of commitments, and the EU has not opened this sector within the context of GATS.
Finally, the allocation of revenues by the compensation-based industry managed Compensation Fund is not expected to raise concerns regarding subsidies since, under this option, the monetary assistance to the maritime sector will be provided by a private and not a public body.
8.5 Summary assessment of Industry-managed Compensation Fund policy design elements
The contribution levels can be set by the Compensation Fund. For the purposes of comparing this option fairly against the other policies, the contribution level was set equal to the level of the tax on emissions. The level considered was set at the projected ETS price level for each five-year interval (rather than the extreme case high tax). In addition, for the target-based option, the purchase of out-of-sector permits at the ETS price was allowed.
36
See also Dr Lorand Bartels, ‘The Inclusion of Aviation in the EU ETS, WTO Considerations, ICTSD Global Platform on Climate Change, Trade and Sustainable Energy’ (April 2012), available at http://ictsd.org/downloads/2012/05/the-inclusion-of-aviation-in-the-eu-ets-wto-law-considerations.pdf (last accessed 25 June 2012), p. 9 – 10.
Support for the impact assessment of a proposal to address maritime transport greenhouse gas emissions
111
Table 8.3: Summary assessment of policy design
Common design element
Options considered for further analysis
Options NOT considered for further analysis
Emission reduction targets
Sectoral target as in common elements to every policy option. Distribution across funds according to emissions during a test period
N/A
Contribution levels Set by the Compensation Fund N/A
Compliance options Emissions trading between funds;
Offsets;
Internal abatement measures
N/A
Use of revenues Each compensation fund would manage the revenues collected (see Technical Annex: Appendix 7)
N/A
Support for the impact assessment of a proposal to address maritime transport greenhouse gas emissions
112
9 Policy option 4: Mandatory emission reductions
9.1 Description of the policy option
The option involves specifying a mandatory emission reduction (in either absolute or relative terms) per ship, which would apply both to new and existing vessels. There are two sub-options under this measure:
Sub-option 4a – Mandatory emission reduction per ship
Sub-option 4b – Mandatory emission reduction per ship with incentives.
The environmental effectiveness of this option would be uncertain because it could not place an overall cap on emissions. It is likely that the CO2 intensity of ships would improve, but overall activity would not be limited.
9.1.1 Sub-option 4a – Mandatory emission reduction per ship
This option is a command-and-control measure. Ships that meet the emission requirements would be allowed to operate in Europe without paying recurring activity charges under the scheme (that is, without any charges in addition to costs needed to reduce emissions for compliance). By contrast, under an ETS with full auctioning, a participant would have to purchase credits to cover emissions regardless of how efficient the ship is. Similarly under a tax-based scheme, a charge would be incurred in proportion to the taxed activity. However, under this scheme, if a ship is compliant it may operate within Europe without paying any additional charges.
The means to achieve emission reductions could be either technical or operational, or a combination of the two. Early action could be rewarded under the scheme, but this depends on how the baseline is set (see Section 9.2.2).
9.1.2 Sub-option 4b - Mandatory emission reduction per ship with credit trading
Sub-option 4b is equivalent to a “baseline and credit” trading scheme, where emissions reductions above the requirements are rewarded with tradable credits. Ships unable to meet the required emission reductions would be able to buy credits from efficient ships. Otherwise, they would have to face penalties for non-compliance. Hence, the revenue to ship owners from selling credits would encourage them to install additional abatement measures if they could do so cost-effectively, instead of seeking to just meet the standards (as for option 4a). The advantage of a credit system is that it enables greater flexibility in meeting the targets, while still ensuring similar overall improvements to the fleet efficiency. Consequently, it should lead to a reduction in costs because the compliance burdens would be shifted to ships with the lowest costs.
This is different to a cap-and-trade ETS, under which participants trade allowances but the total emissions from all participants cannot exceed the cap. Each emission allowance represents one tonne of CO2. Option 4 mandates an emission limit for all participants but does not specify a cap on aggregate emissions. Efficiency credits are calculated on the difference with the efficiency baseline, as opposed to absolute emissions.
In terms of economic efficiency, the mandatory emission reduction per ship with incentives would be superior to the measure without incentives, provided the administrative costs related to the trading market do not cancel out the cost-efficiency gains. This is because the flexible trading mechanism should allow emission reductions to be made where they are most cost-effective, while allowing credits to be traded so that they cover the emissions that would be most expensive to reduce.
Support for the impact assessment of a proposal to address maritime transport greenhouse gas emissions
113
9.2 Design elements specific to mandatory emission reductions
9.2.1 Choice of indicator
The emission reductions could be defined based on an absolute or relative reduction basis. The absolute reductions would be in terms of CO2 emissions per ship. Alternatively, an indicator could form the basis for a policy which would aim for relative reductions in CO2 intensity. Ideally, the indicator should be an internationally agreed measure of a ship’s efficiency. Thus, the indicators proposed below are both instruments that have been devised by the IMO after extensive research over many years. Use of these indicators would facilitate the implementation of the scheme, as stakeholders will be familiar with the formulae used.
The options considered are as follows:
1. Absolute emission reductions per ship: reductions in total CO2 emissions per compliance period;
2. Technical efficiency indicator: reductions in CO2 intensity per ship, based on the design and installed technologies of a ship;
3. Operational efficiency indicator: reductions in CO2 intensity per ship, based on the CO2 emissions per unit of activity
Technical measures will take some time to implement because they may involve major retrofits, or apply to new ships only. The rate of uptake could be constrained by barriers such as lack of finance or non-availability of drydocks. In general, technical options involve a substantial investment cost compared to operational measures. Therefore a policy which focuses on technical options only could be expected to increase the costs of compliance for the shipping sector compared to one that also rewarded operational measures
9.2.1.1 Absolute emission reductions per ship
In this option, a mandatory emission reduction objective is set per ship. The absolute emission reductions could apply to all ships operating within the scope of the scheme. This would effectively place an annual cap on the emissions from each vessel operating under the scope of the scheme. This option would therefore provide certainty of emission reductions per ship, but could not provide overall certainty of emission reductions from the shipping sector because the number of ships could increase. Every time a new vessel starts operation in the covered area, it would have to be allocated an emissions reduction target. The absence of a cap on aggregate emissions would mean that any growth of the sector would not be compromised.
The Bahamas proposal to the IMO has suggested that the reductions in CO2 emissions could be based upon a ship’s actual operational emissions, which would be collected over a period of three years. Collecting emission data over several years would reduce (but not eliminate) the incentive for ships to try to increase the baseline by increasing their activity, as fuel is expensive. It would also help to account for the annual variation in shipping activity (say, for liners, which have a regular timetable that may exceed a single year). This approach would work well for a global scheme, but in a regional scheme would be difficult to establish a baseline for vessels with variable routes such as tramp shipping.
Both technical and operational measures would be incentivised. Ships would effectively be given a carbon “budget” to spend how they wish. It would be in the interests of owners/operators to try to do as much useful transport work as possible within this budget. .
Emission reductions would only be encouraged to the extent that these compliance costs outweighed the cost of abatement measures. Once ships reach their emission limit, the available actions would depend on whether the scheme allowed trading of credits. If no
Support for the impact assessment of a proposal to address maritime transport greenhouse gas emissions
114
credit trading was allowed, the ship would have to stop operating or pay penalties. If credit trading was allowed, the ship would have the additional option to purchase credits.
Avoidance of the scheme could be possible by increasing the number of ships operating in Europe. Once the emission limit for a certain vessel is reached, a new vessel could take its place (either redeployed from operations in an area outside of the scheme, or as a new-build ship). The risk of this type of avoidance is likely to be higher for vessels that trade outside of Europe. However, it would still be possible for intra-European ships (such as ferries) if the cost of modifying the existing ship/operations is greater than either the cost of introducing an additional ship or forgoing the revenue that would have been generated by the activity in excess of the budget. It would be very difficult to distinguish between avoidance of this sort and genuine new entrants to the market, even within an intra-EU scheme. Thus, the potential for avoidance would be very high, and there are few options to limit it. For this reason it is not considered to be a suitable policy option for a regional scheme.
9.2.1.2 Technical efficiency indicator
The proposed technical indicator could be based on an indicator similar to the IMO’s Energy Efficiency Design Index (EEDI). The EEDI expresses the emissions of CO2 per capacity-mile from a ship under specified conditions (including external factors such as wind and waves) assuming that the vessel is fully loaded and that the engine delivers 75 % of its maximum output. “Capacity” refers to the design cargo-carrying capacity (usually specified in terms of deadweight tonnes). This means that the EEDI provides a measure of the design performance of the ship, or its “efficiency potential”. This is a fixed value which does not change unless the design of the ship changes.
Developments at the IMO during the course of this project mean that the EEDI cannot be used as a regional measure. However, the assessment of the EEDI has been retained in this section as a proxy for a regional indicator that could be developed. This is because many of the same issues would apply and the analysis would be relevant to a regional technical efficiency indicator. The administrative burden of setting up an equitable technical indicator at the European level is expected to be high.
The scope of emissions covered by ameasure based on a technical indicator is limited by the fact that it only rewards technical measures. Also, many of the most effective options are limited in application to new ships (IMO, 2009). Besides, there could be a significant time lag before emission reductions are achieved. Technical measures account for 47% of total emission reduction options in 2030, and for 47% of the cost-effective options. Thus, limiting abatement options to technical measures only would greatly reduce the CO2 reduction potential of the fleet.
Mandatory technical indicator ratings would provide a means to differentiate between vessels on the basis of their environmental performance. This could be beneficial for the most efficient ships, which could command higher charter rates. Visible information on performance metrics could lead to consumers and/or charterers demanding better performance to support environmentally friendly business practices. These demands are likely to be strongest for container ships associated with highly visible brands.
A mandatory technical indicator would apply to all relevant ships calling at EU ports, but since the design of a ship is fixed, it would apply to all emissions of these ships wherever they operated. CE Delft (2009) suggested that up to 80-90% of ships in the global fleet may visit EU ports at some point, thus the scope of emissions covered would be very large. However, the potential for avoidance of the scheme by moving less efficient ships outside of Europe is also high. There is little action that can be taken at a policy level to prevent this kind of avoidance. As with any measure which increases the efficiency of transport (thereby lowering the cost per unit of activity), there is a potential for a rebound effect that would reduce the level of CO2 abatement.
Support for the impact assessment of a proposal to address maritime transport greenhouse gas emissions
115
9.2.1.3 Operational efficiency indicator
The proposed operational indicator is the Energy Efficiency Operational Index (EEOI). The EEOI was established by the IMO as a voluntary mechanism for ships to improve the energy performance of their operations. It directly relates the mass of CO2 discharged by the ship to the transport work the ship does. Unlike a technical indicator, the EEOI changes with operational conditions. Even the most efficient ship design will have a lower EEOI if it operates empty, and may perform worse than a less efficient design which is operated more efficiently.
The unit of the EEOI is grams of CO2 per unit of transport work performed, where transport work is an expression of the distance travelled and actual amount of cargo the ship is carrying.
The feasibility of implementing this indicator is likely to be high compared to other potential operational indicators because it has been developed in the IMO over a long period of time; it has been under trial since 2005. It is not anticipated that there will be any legal issues with using the EEOI or a similar operational index. On the other hand, the IMO Secretariat was of the opinion that the operational index “was not suited for mandatory application” (MEPC 58/4/13). Moving from a management tool to an industry standard that can support direct and measureable GHG improvement could be complex, but it has been done before. There are several examples of mandatory operational requirements that have been implemented under the IMO, such as mandatory measures for ballast water management, oil discharge prevention and international safety management.
The scope of emissions under an EEOI-based metric would be somehwat higher than for a technical indicator because it rewards both technical and operational measures for both new and existing ships. CE Delft (2009) suggested that by 2030, CO2 emissions from shipping could be reduced by 27-47% through a combination of technical and operational measures compared to a frozen technology baseline. It could have a more immediate impact on fleet emissions than measures that may require retrofit of replacement technology, because most measures take only a relatively short time to show effects. Further, it could be a more accurate representation of emissions – even the most efficient ship design will have a lower EEOI if it operates empty, and may perform worse than a less efficient design which is operated more efficiently.
Difficulties with using the EEOI relate to the way in which it is influenced by actual cargo, which may lead to competitive distortions in some areas of the fleet. For example, the same ship would be rated much more efficiently if it was carrying a cargo with a high weight-to-volume ratio. It could also result in regional impacts that might be considered inequitable. For example, transport efficiency would be greatly affected by the ability to find goods to transport on return journeys, the type of goods (or their volume-to-weight ratio). The EEOI will vary depending on many factors, mainly (GHG-WG 2/3/1):
1. Variations in cargo utilisation;
2. Variation in fuel consumption on ballast voyages (related to length of ballast voyage);
3. Variation in ship efficiency (due to maintenance of engine, hull coating, propellers etc.);
4. Speed;
5. Weather conditions and currents; and
6. Errors in measurement and registration.
Several of these factors are partially or wholly beyond the control of the ship operator (e.g. weather conditions or economic conditions which affect the ability to fully load cargo). So, while in theory operational measures could take effect in a short period of time, there is likely to be a delay while agreement between different stakeholders is secured. In particular, structural changes such as fleet planning can be considered difficult to develop and
Support for the impact assessment of a proposal to address maritime transport greenhouse gas emissions
116
implement (Eide et al, 2011). The majority of measures that can be implemented to improve the EEOI require co-operation between the ship operator, charterer and port authorities.
In general, operational measures have low investment costs and moderate operating costs. Speed reduction accounts for the majority of potential CO2 emission reductions. Other operational measures tend to result in relatively small emission decreases; therefore implementation of many of these measures will be needed in order to achieve significant emissions reductions.
The data requirements associated with the EEOI are significant, because it is necessary to monitor performance (fuel consumption per t-km) constantly. However, it is expected that ships would measure all of the relevant factors in the course of their normal business. Trials with the EEOI suggest that most ship operators have the necessary data in their management information systems (IMO, 2009).
The EEOI rating will be tied to each ship, so all ships within the scheme must operate to a certain standard (in terms of CO2 emissions per transport work). This limits potential for avoidance by switching fleets into/outside of the geographical scope of the scheme.
9.2.1.4 Option selection
The recommended choice of indicator is strongly influenced by the potential for evasion, as in this particular case it is a much stronger determinant of overall environmental effectiveness than the scope of emissions covered. Of course, the environmental effectiveness of all measures is compromised by the absence of a cap on overall emissions. The advantage of not having a cap on emissions is that the sector is able to grow, which has economic benefits despite its potential environmental impacts.
Avoidance of a scheme based on an absolute emissions limit per ship could be easily possible by increasing the number of ships operating in Europe, as there is no overall cap for the sector. Thus, the potential for avoidance would be very high, and there are few options to limit it. Avoidance of a scheme based on a technical indicator could be possible by redistributing efficient ships to services to Europe. Again, it would be very difficult to limit this behaviour. Finally, an EEOI-based scheme would also be vulnerable to avoidance through fleet redistribution. However, since the indicator is much more influenced by how the ship is operated, even ships that have inefficient designs could achieve high ratings if they are operated efficiently. This reduces (but does not eliminate) the potential for avoidance.
The EEOI is the recommended indicator for this policy option, since it has the lowest potential for evasion.
9.2.2 Setting the baseline
In order to define a mandatory emission reduction per ship, a baseline for each type of vessel needs to be determined. EEOI baselines could be established by calculating the best fit of reported EEOIs. However, in practice EEOIs are not static figures and the baselines would be highly sensitive to the maritime business climate. In addition, the diversity of ship sizes, types and usage means that establishing a reliable baseline is challenging.
The options for setting the EEOI baselines are as follows:
1. Sector-wide baseline created by best-fit through measured (historical) EEOI values;
2. Individual baselines for each ship based on measured EEOI values;
The third method is proposed as it would mean that the EEOI requirements would be linked to a value which is much more stable over time.
9.2.2.1 Sector-wide baseline created by best-fit through measured (historical) EEOI values
EEOI baselines could be established by calculating the best fit of reported EEOIs for each ship type. In theory, this would give a “typical” EEOI benchmark against which a ship’s actual performance could be measured.
Support for the impact assessment of a proposal to address maritime transport greenhouse gas emissions
117
In order to perform a benchmarking function, a baseline should be reliable, stable and relevant to the ship types it applies to. However, the EEOI changes radically with operating conditions. While this makes it a more accurate measure of actual efficiency, it also makes it more difficult to establish baselines. It may be calculated for each leg of a voyage and reported as a rolling average or over a set period. The value of the EEOI depends on factors such as the average utilisation of the cargo-carrying capacity, which is affected by the business cycle. Shipping is a highly cyclical business with significant swings from periods where there is a shortage of vessels to periods where there is significant over-capacity in the fleet; the world economy is a crucial factor affecting shipping demand. In addition, seasonal variations are common, such as demand for energy cargoes due to high levels of energy consumption in winter. Hence, the average efficiency indicator for a ship many vary over different voyages, months or years. Some trade patterns may result in low efficiency (e.g. distribution of smaller parcels) which is related to the nature of the transport demand and not to the operation of the ship. Other factors that are outside of the control of the ship operator include weather and wave conditions. In order to demonstrate this variability, data for calculated EEOIs can be examined. Figure 9.1 shows an example of the variation in a real EEOI over time, measured per voyage for a crude oil tanker. Ballast voyages are not plotted as no cargo is carried (thus the transport work is zero). The red line indicates the overall average index. The yellow plots indicate the combined moving average over five voyages.
Figure 9.1: EEOI for a crude oil tanker per voyage
Source: MEPC 55/4/3
The average is relatively stable over the first period then increases significantly before falling back for the last period. The variation could have been due to a number of factors including relative utilisation of cargo space, weather and currents etc. In this particular case, it appeared that the variation in cargo was the primary cause.
Another trial of the EEOI found that it was highly variable over voyages of constant distance, changing by 20-30% across voyages (Australian Ship-owners Association, 2008). The trial also found that adverse weather conditions on one voyage more than doubled the EEOI compared to the average.
The two primary variable factors were fuel consumption and cargo mass. Although there is generally a linear relationship between the two, this relationship is less than 1:1, therefore cargo load has the greatest influence on the value of the EEOI. Increases in cargo loading result in a better EEOI rating regardless of the fuel consumption remaining relatively similar.
Support for the impact assessment of a proposal to address maritime transport greenhouse gas emissions
118
Some voyages undertaken with lower-than-average fuel consumption (due to slow steaming) had a worse EEOI rating due to a lower cargo load.
The issue of cargo utilisation merits further analysis, due to its impact on the attainable EEOI. Figure 9.2 shows the average cargo utilisation rates for the three container shipping lines between 1992 and 2006. The figure shows how capacity utilisation is very closely linked to the global economic climate. During 1995-1998 the container shipping capacity grew at a faster rate than demand. The Asian financial crisis in 1997-1998 led to a sharp decrease in demand and hence a lower ability to fully load vessels. During this period, cargo utilisation averaged at around 40%. From 1999, an increase in demand for container shipping services and a low number of new ships led to a period of high capacity utilisation, which reached a peak of 85%. In 2001, a global economic slowdown, particularly in the US, led to lower demand; this shows up as a dip in cargo utilisation rates, which fell by around 25 percentage points between 2000 and 2001. Finally, in later years the utilisation rates for all carriers shows some improvement that is likely due to the formation of a shipping alliance. High fuel prices have stimulated most container lines to restructure their operations to optimize utilisation by redeploying ships among global trade lanes and consolidating services through multi-carrier alliances (WSC, 2008). The WSC suggests that the additional opportunities to improve operations may be limited, as these measures have already been taken as a response to high fuel prices in 2007.
Figure 9.2: Average cargo utilisation ratios for 3 container ships
Source: Wu, 2008
Capacity utilisation rates vary from less than 30% up to 85% (Wu, 2008). The variation is likely due to the business climate, as it is generally more economical to maximise capacity utilisation where possible. In periods of low demand it is more difficult to fully load vessels – this may become more of a problem in coming years due to the industry trend towards larger ships. The close correlation between cargo utilisation and the health of the global economy shows just how significant the business climate can be for the shipping industry.
Attempts to establish a baseline EEOI in terms of ship size (dwt) found that although there is a strong relationship between the two, the results are not representative for the respective ship types in general because the EEOI is strongly affected by external factors such as the business and seasonal variation. Figure 9.3 shows the average EEOI over a period of approximately a year for each vessel.
Support for the impact assessment of a proposal to address maritime transport greenhouse gas emissions
119
Figure 9.3: Average EEOI per type of vessel
Source: IMO GHG-WG 2/3/1
Trials with the index show considerable variation of up to 33% between virtually identical ships (MEPC/55/4/3).
Because of these results, the GHG Intersessional (Oslo, June 2008) concluded that the EEOI would not be an appropriate tool to formulate a baseline for use in CO2 emission controls and base further regulation of CO2 emissions on, as the necessary parity between ships cannot be obtained. As such, it is not possible to produce a baseline for the EEOI using measured (historical) ratings. Thus, if the EEOI is to be used as an indicator, another method must be found to define the necessary baselines.
9.2.2.2 Individual baselines for each ship using measured EEOI
This option would require ships to report their EEOI values for a period of between one and three years (in order to account for variations). Ships would then be required to improve their EEOI against their initial reported values. This would eliminate the problems in trying to assess a sector-wide baseline as described above.
The environmental effectiveness of this option would be lowered due to several factors. First, this option would create an incentive for ships to decrease their efficiency during the reporting period, in order to make their subsequent targets easier to achieve. Second, highly efficient ships would not be rewarded for their performance under this option. Third, new entrants to the scheme would need to monitor their EEOI for a set period before their baseline could be formulated, which would be a high administrative burden for ships that visited EU ports infrequently, and would mean that the legislation would never be fully applied to the entire fleet (because new ships would be built or enter the scope constantly).
This option would not be feasible unless credit trading was allowed, because it would prevent ships from changing trades if this would increase their EEOI above the target level. However, if credit trading was allowed, this would further increase the incentive for ships to decrease their efficiency during the reporting period.
9.2.2.3 Option selection
For a policy based on mandatory emission reductions, setting the baseline appears to be the most difficult part. Three options were proposed and discussed in this section, and each has significant drawbacks.
Large variation in EEOI for similar ships
Support for the impact assessment of a proposal to address maritime transport greenhouse gas emissions
120
The first option, to evaluate sector-wide baselines using the measured EEOI would be difficult to implement due to the high variance in EEOIs – international trials with the EEOI have concluded that it is not possible to establish baselines using measured EEOIs.
The second option would require ships to improve their CO2 intensity relative to their past performance. It appears to be feasible, although the environmental effectiveness could be compromised due to the incentive to increase emissions during the initial period. Provisions for new entrants and ships that call only infrequently to EU ports would need to be carefully considered.
9.2.3 Setting of the reduction level per ship
Clearly, the environmental effectiveness of the scheme will be influenced by the stringency of the required emission reductions. Due to the highly variable nature of the EEOI, it is recommended that a rolling average should be used (over 6-10 voyages) or that an average should be computed over a set period of time. This will reduce the influence of uncontrollable variables on the final index. The options considered to set the reduction level per ship are as follows:
Fixed percentage improvements per ship;
Reduction levels based on the age of the ship; or
Reduction levels based on ship type; and
Reduction levels based on ship size.
There is much uncertainty over the potential for emission reductions in ships, which may make it difficult to balance the trade-off between environmental effectiveness and feasibility of compliance. This is true for all options discussed in this section. Several studies find that there is significant potential for cost-effective CO2 reductions in the maritime sector (e.g. IMO, 2009; IMarEST, 2010; Eide et al, 2011); in reality the suitability of each abatement measure will depend on the characteristics of the ship and the way in which it is operated. Estimates of cost effective emission reductions are considered to be overly optimistic by industry experts, so in reality the abatement potential may be lower (MEPC 61 INF.2).
9.2.3.1 Fixed percentage improvements
All existing ships could be required to improve their efficiency over their respective baselines by the same percentage. The absolute changes in efficiency required would therefore be higher for less efficient ships. The fixed percentage reductions could gradually become more stringent over time. This would require the intended pathway to be announced well in advance, so that investors are given a long enough time horizon.
However, while the simplicity of this option is attractive, it would discriminate against ships that are older or smaller, which could disproportionately affect certain sectors.
9.2.3.2 Reduction levels based on the age of the ship
The energy efficiency of a ship is closely related to the original design specification; many modifications of design are primarily suitable for new ships only. Therefore it could be argued that new ships should have the highest mandatory emission reduction. As ships age, they are less able to implement as many abatement measures, and therefore their required emission reduction should be lower to avoid imposing excessive burdens on the older fleet. The age of the ship will be especially important in situations where the service life of a retrofitted technology exceeds the remaining life of the vessel.
The Bahamas proposal to the IMO suggested that mandatory emission reduction targets are applied to ships based on their age, with new ships having a 25% reduction target and older ships having lower targets as follows:
Support for the impact assessment of a proposal to address maritime transport greenhouse gas emissions
121
Table 9.1: Proposed CO2 reductions by vessel age
Ship age (years) New 0-15 15-20 20-25 25+
% CO2 reduction 25% 20% 15% 10% 5%
Source: MEPC 62/5/1
Setting the precise reduction levels would merit further analysis. It would take advantage of the higher abatement potential for new ships and could help to overcome the risk involved in ordering an expensive efficient vessel. However, this could potentially be viewed as contravening the principle of “polluter pays”, as older vessels are generally more polluting.
9.2.3.3 Reduction levels based on the ship type
Broad ship types are important because of the different demands for which each vessel is designed to accommodate. This may limit the suitability and effectiveness of potential abatement measures.
The IMO has recognised that regulation of GHG emissions from ships must take into account ‘appropriate differences’ like their type, structure, manning and operational features, irrespective of the flag they are flying or the degree of industrial development of the flag State or the State of nationality of the owner or the operator. However, the IMO sets the same EEDI reduction requirements for all ship types, with differences only according to two tiers of sizes. The exception is that general cargo and refrigerated cargo ships have requirements in 2020 that are 5% lower compared to bulkers, tankers and container ships.
Table 9.2: IMO requirements for EEDI reductions (percentage) relative to the baselines
Source: DNV (2011)
Thus, it appears that the IMO expects all ship types to be able to broadly achieve the same percentage reductions for an EEDI (which is strongly related to the EEOI). Differentiation of targets by vessel type would be much more administratively complex, and could introduce competitive distortion into the fleet.
9.2.3.4 Reduction levels based on the ship size
There is some argument for differentiation based on the size of the vessel, given the large variation in performance for smaller ships (see Section 9.2.2.2). Thus, one policy option would be to set requirements that taper off in proportion to ship size (e.g. using the thresholds from the IMO EEDI regulations). This would also reduce the incentive to “game” the thresholds by using ships just above or below the cut-off point.
In terms of administrative burden, this scheme would be slightly more complex. However, the information for vessel size, baseline and reduction requirement would already be calculated as part of the scheme – the only additional procedure would be to apply a reduction factor to ships below a certain size. Therefore, the additional administrative effort is minimal.
Support for the impact assessment of a proposal to address maritime transport greenhouse gas emissions
122
9.2.3.5 Option selection
At this stage a fixed percentage reduction across the fleet is recommended, which is the same for all ship types and ages. Although considerations of available compliance options are highly relevant and the real reduction potential is likely to vary by ship type and age, there is not sufficient real-world data on the achievable emission reductions. Because of this, it is not possible to recommend targets without further analysis. The IMO regulation for new ships could represent a starting point for the required reductions under a European policy. There is scope to make the standards more stringent once further real-world data has been gathered on the possible measures applicable to existing ships.
In terms of differentiation according to ship size, it could be necessary to have less stringent targets for smaller ships due to the large variation in performance for smaller ships. This fact has already been recognised in the IMO EEDI regulation,
9.2.4 Credit trading
There are two variants of this option: with or without credit trading
No credit trading: each ship would have to reduce its emissions by a defined percentage or be subject to enforcement measures. In this case it could be important to understand the potential for emission reductions per ship type, otherwise ships could be physically unable to meet reduction targets.
If credit trading was allowed: A non-compliant ship would have an additional option to purchase credits to offset its excess emissions, provided sufficient credits were available. There is no need to accurately calculate the potential reductions per ship type, because the trading mechanism will allow the most cost-effective reductions to be implemented.
9.2.4.1 Option selection
Given the uncertainty discussed above as to the level of reduction that could be achieved for various sectors the fleet, it is not possible to recommend an approach that did not include credit trading.
Additionally, as discussed in the introductory section, a credit system enables greater flexibility in meeting the targets, while still ensuring similar overall improvements to the fleet efficiency. This should allow emission reductions to be made where they are cost-effective, while allowing credits to be traded such that they cover the emissions that would be most expensive to reduce.
9.2.5 Threshold values
Monitoring EEOI is relatively data-intensive, and could cause high administrative costs to compliance entities. It might therefore be desirable to avoid imposing these costs on ships that only occasionally operate in the EU.
Threshold values could be used such that the mandatory emission reductions would only apply to ships that exceed certain de minimis thresholds e.g.
Certain number of t-nm per compliance period;
Certain number of port calls per compliance period (for ships below a certain size threshold).
The impact on overall emissions covered would be small, as the activity of these ships is also small.
Ships would be required to register under the scheme as normal, but would have the option to apply for an exemption certificate. Provided they did not exceed the threshold values within each compliance period, no further action would need to be taken.
Support for the impact assessment of a proposal to address maritime transport greenhouse gas emissions
123
9.2.6 Administrative arrangements: monitoring, reporting, verification and enforcement
The potential methodologies for measuring fuel consumption and activity data have been described in other sections of the report, therefore we refer the reader to these sections.
Monitoring fuel consumption per vessel Section 4.2.1
Monitoring & reporting of EEOI per vessel Section 9.2.6.4
Length of compliance periods Section 5.2.5
Responsible Compliance Entity Section 5.2.6
Additional arrangements for credit trading Section 9.2.6.2
The administrative arrangements required to implement mandatory emission reductions are described step by step in the tables included in the following sub-sections.
9.2.6.1 The value of credits to be awarded
The value of the credits could be determined by:
1. A fixed value for each additional percentage point reduction of EEOI below the required level;
2. A variable value determined by the additional reduction of EEOI below the required level, multiplied by the ship’s activity.
For a scheme based on an EEOI indicator, part of the calculation involves recording the ship’s activity, therefore the additional administrative effort is very low for the second option. The advantage of variable penalties based on ship activity is that it relates the credits to a ship’s actual emissions. It would also mean that ships operating only occasionally in Europe could comply more cheaply by buying credits. The disadvantage is that it adds slightly more complexity.
9.2.6.2 Credit trading
The procedures for a trading platform for efficiency credits would be similar to provisions under an ETS. Please see Section 5.2.4.
9.2.6.3 Credit banking in Option 4b
There are two options for credit banking considered here:
1. Credit banking is not allowed;
2. Credit banking is allowed, but with incentives to trade.
If credit banking were not allowed, all efficiency credits would be taken into the trading platform and the revenues from their sale would be returned to the ships they were awarded to. Ships would therefore not have the ability to hoard credits for their own future compliance. This could reduce the incentive for ships to invest in costly technical measures to exceed the standards. This is particularly important for new ships which have many design options available to them.
Credits could be banked for future compliance periods. This could provide a further incentive for investment in abatement measures beyond what is required. However, this could equally create a disincentive to trade because ship operators may wish to use them as insurance against future efficiency requirements. If credits expire after a limited period of time, it would provide a greater incentive for trade and also mitigate the risk of delayed compliance.
Support for the impact assessment of a proposal to address maritime transport greenhouse gas emissions
124
Creating an incentive to trade is more important under this policy option compared to an ETS. Under an ETS, some allowances are likely to be auctioned, and therefore companies that require them can bid higher prices to ensure they obtain sufficient allowances. Under this option, credits are only awarded to ships which exceed the requirements, and there is no obligation to trade. With a limited number of credits, there is a possibility that strong actors would manipulate the market by withholding credits from trading.
A phased approach is proposed under the US proposal to the IMO. Positive credits that are generated at the time of a survey would be available to the ship operator to trade or use on any other vessels it operates, for a period of two years. Following the initial two years, the credits could still be traded, but could not be used by the ship operator for compliance of its own vessels. Following the fifth year, the credits would expire.
Time elapsed after award of credits
0-2 years 2-5 years 5+ years
Self-certification
Trading
This would increase the administrative complexity of the scheme somewhat, as each credit would need to be date-stamped on the award date, and additional verification procedures would be needed to ensure that expired credits were not used. While this adds some additional administrative burden, it is not considered to be excessive, as much of the necessary information would already be collected.
Credit banking with incentives to trade would create the greatest incentive to exceed the required standards while also creating an incentive to trade through the use of expiry dates.
9.2.6.4 Monitoring and reporting of EEOI
The average EEOI is calculated over a certain time period, and should be continuously monitored throughout this time period even if a ship is operating outside of Europe. This would need to be specified for participating ships.
The guidelines for voluntary use of the EEOI (MEPC.1/Circ.684) state that “In order to avoid unnecessary administrative burdens on ships’ staff, it is recommended that monitoring of an EEOI should be carried out by shore staff, utilizing data obtained from existing required records such as the official and engineering log-books and oil record books, etc. The necessary data could be obtained during internal audits under the ISM Code, routine visits by Superintendents”
Emissions would be monitored as detailed in Section 4.2. Activity data would also be needed, defined as follows:
Activity =
CO2 emissions are divided by activity to obtain data the EEOI. The two elements that need to be monitored to measure activity data are therefore tonnes of cargo or transport work and distance:
Cargo (mcargo,i) : Ships would need to track the cargo on-board for every voyage covered by a EU emissions reduction scheme. This would be relatively easy for ships trading only within the EU, which could add up annual cargo transported. It would also be relatively easy for ships with a single bill of lading. Ships with multiple bills of lading would need to track the cargo that is on-board during the ship movement that are covered by the legislation. This can be tracked through the bill-of lading. A bill of lading is a document signed by a carrier (the transporter of goods) or the carrier’s representative and issued to a consignor (the shipper of the goods) that evidences
Support for the impact assessment of a proposal to address maritime transport greenhouse gas emissions
125
the receipt of goods in a specific location for shipment to a specified designation or person. The bill of lading describes the freight for identification purposes and its terms direct the cargo to be delivered to a particular person, the consignee, at a designated location. Bills of lading are reliable evidence of the date and place of shipment of goods. Customs authorities always obtain copies of the bill of lading for import duty purposes, which could facilitate verification of cargo information provided. Load is systematically weighed when it arrives to ports in the EU, or before loading in the foreign port.
Distance (Di). The distance between the initial and final points of the voyage covered by an EU scheme, could be estimated using the actual distance sailed in as recorded in the log-book. This is the approach suggested by the IMO in its “Guidelines for voluntary use of the ship energy efficiency operational indicator (EEOI) (IMO, 2009). However, this approach would not encourage the selection of the optimal route to minimise emissions reductions. Another approach would consist in using standard distances between ports (such as the GCD approach used for aviation in the EU ETS). This would require the selection of appropriate standard distances.
Table 9.3: Monitoring and reporting of EEOI
Step Task Description Responsibility Frequency
1 Establish guidelines for calculation of EEOI values for existing vessels.
Calculation of the EEOI would be based on the IMO Guidelines for voluntary use of the EEOI (MEPC.1/Circ.684)
European Commission
In advance of the scheme, but allowing for periodic updates
2 Establish baselines for the EEOI
The EEOI baselines would be calculated. Periodic updates may be required.
.
European Commission
Once in advance of the scheme, but allowing for periodic updates
3 Establish reduction targets for the EEOI
The reduction targets would be established for each compliance period. The targets could be subject to review (infrequently) if they are shown to be unfeasibly high or ineffectively low
European Commission
As above
4 Establish a registry of ships under the scheme
A Registry must be established to record the EEOI values of ships participating in the scheme.
All participating ships would have a target based on the required reduction levels against which their performance would be assessed.
European Commission
Once at the start of the scheme and reviewed when necessary.
5 Submit activity monitoring plan to a Competent Authority
The Compliance Entity will present a monitoring plan providing details of the ship, the responsible entity, the ship movements covered and the method that will be used to monitor activity data, according to the published guidelines.
Compliance entity
At the start of every Phase and every time significant changes occur
Support for the impact assessment of a proposal to address maritime transport greenhouse gas emissions
126
Step Task Description Responsibility Frequency
6 Approve activity monitoring plan
The relevant Competent Authority will approve the MP.
Competent Authority
At the start of every Phase and when an updated MP is sent
7 Monitor fuel consumption
Compliance entities will monitor fuel consumption for every voyage covered by the scheme. To do so, they will follow one of the options detailed in the relevant section of this report about monitoring fuel consumption.
Compliance entities
Every voyage
8 Monitor activity data
Compliance entities will monitor activity data for every voyage covered by the scheme. To do so, they will follow one of the options detailed in the relevant section of this report about activity data.
Compliance entities
Every voyage
9 Prepare EEOI report
After the end of each reporting year, or for every ship movement covered by the scheme, responsible entities must submit an emissions report for verification by an accredited external verifier. The European Commission could provide a standard report template that would be compulsory, to ensure harmonisation across Member States.
Compliance entity
Two options: per compliance period (annually) or per voyage (to be assessed)
10 Verification of EEOI report
The verifier reviews records and calculations made by the Compliance Entity to confirm that the monitoring was performed in accordance with the approved Monitoring Plan and the requirements of the MRV guidance and that the emissions reported are free from material misstatements. The compliance entities would need to correct any mis-statements found by the verifier before the verifier will issue their verification opinion and essentially ‘confirm’ the validity of the operator’s EEOI report.
Accredited verifier appointed by the Compliance Entity
Same frequency as preparation of report above
11 Submission of verified report to a Competent Authority
The verified report should be sent to the relevant Competent Authority, who would then acknowledge receipt.
Compliance entity
Two options: annually or per voyage
12 Assessment of compliance
The validation authority would confirm that the ship’s EEOI is less than or equal to the level required at the end of the compliance period.
For the majority of cases, this would be carried out by inspecting the Registry.
Competent Authority
At the end of each compliance period
13 Maintenance of registry of non-compliance
A central EU Registry of non-compliant ships should be kept and shared with Port Authorities. Non-compliance would occur if the ship did not meet the EEOI requirements, or did not submit an updated EEOI report in time.
Competent Authority
For every compliance period
Support for the impact assessment of a proposal to address maritime transport greenhouse gas emissions
127
Step Task Description Responsibility Frequency
14 Inspection of compliance
Port authorities would check the registry of non-compliance and would ensure that non-compliant entities are subject to sanctions.
Ports Every voyage
9.2.7 Administrative arrangements for credit trading
Ships attaining negative credit values would be required to purchase efficiency credits from ships with positive credit values. If the ship was unable to submit sufficient allowances, it would be subject to penalties. In addition to the activities described in the previous sub-sections, the table below indicates the tasks that would be required under a baseline-and-credit regime.
Table 9.4: Administrative arrangements for compliance through mandatory emissions reductions
Step Task Description Responsibility Frequency
1 Issue guidelines for calculation of credits
Including calculation of “negative” credits, which would need to be covered through purchase of efficiency credits
European Commission
Once in advance of the scheme, but allowing for periodic updates
2 Establish a platform for trading certificates
Including transaction settlement European Commission
Once at the start of the scheme
3 Issuing efficiency credits to efficient ships and “negative” credits to inefficient ships
Credits would be issued to an account held for each ship in the Registry
Registry Ongoing
4 Submission of efficiency credits to cover negative credits
Compliance entities which have “negative” credits in their Registry account must purchase sufficient efficiency credits from the trading platform and submit these to the Competent Authority.
Compliance entity
At the end of each compliance period
5 Cancelling of efficiency credits submitted to cover negative credits
Any efficiency credits submitted by compliance entities to cover negative credits must be cancelled after the ship’s account balance has been amended.
Registry Ongoing, but at least at the end of each compliance period.
9.3 Legal assessment
9.3.1 Legal feasibility of mandatory emission reductions per ship under EU law
A mandatory emission reduction per ship requirement would have as its main objective to reduce the climate impact of shipping and thus aim to protect, preserve and improve the quality of the environment. Consequently, such a measure could be based on Article 192(1) TFEU. In this case, it would be adopted by qualified majority, on the basis of the ordinary legislative procedure. An alternate legal basis could be Article 100 TFEU (ex Article 80 TEC), which provides for the EU to legislate concerning sea and air transport, and which was the legal basis for the adoption of Directive 2005/35/EC on ship source pollution.
Support for the impact assessment of a proposal to address maritime transport greenhouse gas emissions
128
9.3.2 Legal feasibility of mandatory emission reductions per ship under international law
With respect to the legal compatibility with UNCLOS, it is important to note that this particular policy option would result in a mandatory emission reduction being imposed on each particular ship. Such an imposition of an emission standard on a ship would by its nature require alterations to the ship or to its methods of operation. Such measures, if required to meet the mandatory emission reduction requirement, could be considered as CDEM standards. UNCLOS does not define the term CDEM.37 However, a CDEM imposed on the basis of coastal State authority could be considered as hampering the vessels’ rights in the territorial sea, the EEZ, the high seas, and the territorial waters of third countries, unless it was giving effect to internationally agreed standards. 38 At this point the only international standards in this area are the mandatory energy efficiency measures to reduce emissions (GHGs) from international shipping adopted by Parties to MARPOL in July 2011.39 The EEDI applies to new ships, and the SEEMP to all ships of 400GT and above.40 While there is no legal obstacle to the EU prescribing and enforcing them for new ships, any mandatory emission reduction requirements that would go beyond the EEDI would not be internationally accepted.
On the other hand, UNCLOS does not explicitly impose such limits on port State authority. Under Article 211(3) UNCLOS, the EU – on the basis of EU Member States’ competence as port States – would have the competence to unilaterally set particular requirements for entry into EU ports aimed at preventing pollution of the marine environment, provided such requirements were given due publicity and communicated to the competent international organisation, i.e., the IMO.
Regarding the WTO Agreements, GATT, as already noted in the overarching legal section, would not be directly applicable as both options 4(a) and 4(b) aim at regulating the service provided by the maritime industry and not the cargo transported. Nonetheless, these measures could arguably be viewed as having an indirect effect on the costs of the cargo transported by the ships. However, as already mentioned in section 3 such indirect effects are very unlikely. More precisely, it is uncertain whether imported goods will become more expensive than domestic ones as a result of the EU measures. Domestic goods could in some instances travel further than imported ones. Moreover, the EU is not responsible for the distance of an exporter from a chosen market or for the type of transport selected. Depending on the chosen measure, its exact design and the maritime industry’s behaviour, it is possible that exporters would incur no additional costs.
However, if the proposed EU measure is considered as affecting goods prior to their importation to the EU, such measure would be covered by Article XI:1. Article XI prohibits bans and quantitative restrictions, other than duties, taxes or other charges, on imports and exports among WTO members. Under option 4(a), ships would only be able to emit a specific volume of GHG, which could arguably be considered to have restrictive effects on the volumes of goods transported. Under option 4(b), though ships would have a mandatory emission reduction requirement, they would be able to buy additional credits from more fuel efficient ships. This might increase transportation costs which could also arguably have restrictive effects on the volumes of goods imported. On the other hand, while emission reduction requirements are imposed upon each individual ship, the sector as a whole would not have a cap on emissions and therefore the overall volume of goods transported might not
37
Examples of measures that one trading partner would not view as applying to the design, construction, manning or equipment of ships would include reporting requirements, record-keeping requirements, quantitative restrictions on discharge of substances, regulation of dumping of substances, ship routing measures, traffic separation schemes and speed limits. US Senate Executive Reports, p. 184. 38
See for example, VITO et al, ‘Final Report (Annexes): Market-based instruments for reducing air pollution - Lot 2: Assessment of Policy Options to reduce Air Pollution from Shipping’ (Study for the European Commission), June 2010, p. 4; available at: http://www.tmleuven.be/project/soxnox/annexfinalreport.pdf , page 4. 39
‘Mandatory energy efficiency measures for international shipping adopted at IMO environment meeting’ (Briefing: 42, 15 July 2011), IMO website available at http:// www.imo.org/MediaCentre/PressBriefings/Pages/42-mepc-ghg.aspx (last accessed 19 June 2012). 40
Support for the impact assessment of a proposal to address maritime transport greenhouse gas emissions
129
be affected. Note that if the proposed measures were found to have a restrictive effect -- regardless of how small, Article XI would apply.
Even if found to violate the above GATT principles, the EU could still justify the measure under Article XX if it satisfies the Article XX requirements, as already analysed in the overarching legal section.
As far as GATS is concerned, this legal instrument is not applicable to the international maritime transport at this time, and the EU has not opened this sector within the context of GATS.
The TBT Agreement could also be relevant for this option, in that it aims to ensure that technical regulations, standards, testing and certification procedures do not create unnecessary obstacles to trade. Its rules apply to all technical regulations, standards and conformity assessment procedures relevant to trade in goods, i.e., all agricultural and industrial products (Article 1.3). As already discussed, mandatory emissions reductions would be aimed at regulating GHG emissions due to the service provided by the maritime industry. Annex 1 on Terms and their Definitions for the Purpose of the TBT Agreement provides that services are excluded from the Agreement’s coverage. Since ships constitute goods (they have a monetary value and they are traded in the market), in principle any technical regulations affecting their trade would fall within the scope of TBT. However, in the present case even if option 4 implies the introduction of technical standards, such standards would not necessarily be a prerequisite for the import of a ship into the EU market as a good, but rather a prerequisite for them to deliver a service which entails calling at an EU port. Therefore, this analysis concludes that the TBT Agreement does not apply to the policy option under consideration.
9.4 Summary assessment of policy design elements
The option of mandatory emission reductions was not modelled to assess its impacts. As discussed in the previous section, the variants of this policy option based on technical indicators are not compatible with international law (UNCLOS) and it is likely that mandatory emission reductions would result in legal challenges. For indicators based on operations, the administrative burdens are considered prohibitive.
Support for the impact assessment of a proposal to address maritime transport greenhouse gas emissions
130
10 Analysis of the impacts of each policy option
10.1 Introduction
The study team developed a model to assess the impacts of policy instruments for reducing CO2 emissions from EU international shipping. The implemented solution is a TIMES energy system model, which was built specifically for this project. The TIMES model characterises the available routes within/into/out of Europe and available technological and logistical choices out to 2050. A detailed overview of the modelling approach, data sources and assumptions is provided in the Technical Annex: Appendix 1. The outputs of the TIMES model were used to assess some of the environmental, economic and social impacts of each policy option; this was supplemented where required with off-model analysis.
10.2 Environmental impacts
10.2.1 Identification of impacts
A policy to reduce CO2 emissions from the maritime sector directly aims to reduce the environmental impact of shipping in terms of its impact on global warming. A CO2 reduction policy could result in lower fuel consumption or switching to cleaner fuels, thereby also resulting in reductions in air quality pollutants, changes in the use of energy and changes in resource consumption. This section considers the environmental impacts as follows:
A quantitative assessment to the extent possible of major impacts, including:
Impacts on global warming;
Impacts of air pollutants on human health and crops;
Changes to the use of energy in maritime transport;
Changes in resource consumption;
A qualitative assessment is provided of other more minor impacts, including:
Impacts of air pollutants on ecosystems and materials;
Land use change; and
Waste production.
10.2.2 Impacts on global warming
10.2.2.1 Changes in emissions of CO2
The main GHG from shipping is CO2. According to IMO (2009), CO2 accounts for over 98% of total shipping GHG emissions (in terms of CO2-equivalent). Therefore, only the impacts of CO2 are investigated here.
Under the baseline scenario CO2 emissions are projected to increase from 180 MtCO2 in 2010 to 223 MtCO2 in 2030. Table 10.1 shows the emissions of CO2 from the European maritime sector under each of the policy options.
All policy options are expected to lead to CO2 reductions compared to the baseline scenario. The ETS policies would lead to net reductions of 47.67 MtCO2 in 2030 compared to the baseline (a 10% reduction compared to 2005 levels). In the closed scheme, all reductions would be achieved within the maritime sector. In the open ETS options, 11 MtCO2 (23%) of the reductions would be achieved through purchases of out-of-sector permits. The tax on emissions is assessed at two levels: the low level would achieve a reduction of 36.66 MtCO2
Support for the impact assessment of a proposal to address maritime transport greenhouse gas emissions
131
in 2030 compared to the baseline (a 4% reduction compared to 2005 levels), whereas the high level achieves a reduction of 47.32 MtCO2 in 2030 compared to the baseline scenario. The contribution-based compensation fund is projected to achieve the same reductions as the tax on emissions, and the target-based compensation fund is projected to achieve the same reductions as the open ETS with full auctioning.
Table 10.1: Maritime sector CO2 emissions and savings in 2030 compared to the 2030 baseline scenario
Scenario Maritime sector
emissions (annual MtCO2)
Maritime sector
emissions reductions compared to baseline
(MtCO2)
Out-of-sector permit
purchases (MtCO2)
Net total emissions
Percentage change
compared to 2005
emissions
Cumulative emission
reductions 2018-2030
Baseline 223.41 - - 223.41 +14.6% -
Shipping ETS – closed with free allocations
175.74 47.67 - 175.74 -9.9% -377.07
Shipping ETS – open with free allocations
186.73 36.68 10.99 175.74 -9.9% -333.80
Shipping ETS – open with full auctioning
186.76 36.65 11.03 175.74 -9.9% -336.27
Tax on emissions (low)
186.75 36.66 - 186.75 -4.2% -335.35
Tax on emissions (high)
176.09 47.32 - 176.09 -9.7% -390.30
Target-based compensation fund
186.76 36.65 11.03 175.74 -9.9% -336.27
Contribution-based compensation fund
186.75 36.66 - 186.75 -4.2% -335.35
The emphasis of the analysis in this section is on the warming effects of CO2 emissions. Studies indicate that the net effect of ship emissions on global warming may be negative in the short term due to the cooling effect of some emissions such as sulphates (AEA et al., 2008). However, cooling effects are regional and short-lived so they do not necessarily cancel the warming effects of CO2, which is a long-lived, homogeneously distributed GHG. The residence times of CO2 (of the order of centuries) means that the warming effects of CO2 are dominant in the long term (IMO, 2009).
10.2.2.2 Changes in emissions of black carbon
The warming effect of CO2 dominates the global warming impacts of shipping. However, black carbon (BC) can have significant regional warming impacts. Atmospheric BC and surface deposition is considered to produce a warming effect due to accelerated melting of ice and snow. The impacts of black carbon (BC) emissions from shipping are now under review by the IMO, with a particular focus on the potential impacts in the Arctic. However, the relative contribution this makes to climate change is not clear (Lack and Corbett, 2012).
Support for the impact assessment of a proposal to address maritime transport greenhouse gas emissions
132
BC from maritime diesel engines is produced from incomplete combustion. Literature data for BC emissions from ship engines vary with a factor of about 10 from 0.1g/kg up to 1 g/kg fuel burned. The recommended values from CIMAC (2012) for ships burning HFO at steady state high load is 0.05-0.20 g/kg fuel used. Other estimates from the IMO put BC at between 5% and 15% of shipping particulate matter (IMO, 2010).
Switching to low sulphur distillate fuel (LFO) has sometimes been proposed as a measure to reduce BC, but recent reports find that emission rates are unchanged (and may even increase) when switching to LFO (CIMAC, 2012). Engines are already of a high efficiency, and the potential to reduce BC emissions by engine internal measures is expected to be small for new engines (CIMAC, 2012). BC emissions are increased when engines operate at low loads; however if fleets were required to operate at lower loads (e.g. if speed was reduced) it is expected that the engines could be re-tuned to reduce the impact of increased BC (Lack and Corbett, 2012). Most other potential technologies are not expected to have a significant impact on BC except at low load, including water-in-fuel emulsions, common rail, exhaust gas recirculation and selective catalytic reduction (CIMAC, 2012) – however, there are sparse data and further research could reveal higher-than-expected impacts from these and other technologies. Where reductions in BC emissions are expected, e.g. for scrubber systems, the magnitude of the benefits is not certain (CIMAC, 2012). A detailed analysis of the impacts of a maritime CO2 reduction policy on BC emissions would require a greater amount of data than is available to the project team. It is therefore not possible to quantify the impacts in terms of BC emissions or climate change impacts. In general terms, a policy that reduces HFO consumption is also likely to reduce BC emissions, all else being equal.
The high tax policy shows the highest reduction in bunker fuel consumption compared to the baseline over the period from 2018-2030 (118.2 Mtoe) followed by the closed ETS (114.3 Mtoe).
Table 10.2: Reduction in bunker fuel (HFO and MDO) consumption compared to the baseline in 2030
Scenario Cumulative reduction in bunker fuel
consumption 2018-2030 (Mtoe)
Reduction in 2030 (snapshot
year) bunker fuel consumption
(Mtoe)
Shipping ETS – closed with free allocations 114.3 14.4
Shipping ETS – open with free allocations 99.5 10.8
Shipping ETS – open with full auctioning 101.0 10.8
Tax on emissions (low) 100.3 10.8
Tax on emissions (high) 118.2 14.2
Target-based compensation fund 101.0 10.8
Contribution-based compensation fund 100.3 10.8
10.2.3 Impacts on air pollution
Environmental impacts described in this section relate to emissions of PM, NOx and SOx from maritime transport. Both NOx and SOx are controlled by international standards that will become significantly more stringent in the future. PM emissions are indirectly regulated via sulphur limits on maritime fuels. Although these measures are expected to significantly lower emissions of air pollutants, a CO2 regulation on maritime transport result in further reductions due to improved fuel economy and fuel switching.
Decreased fuel consumption leads to lower emissions of NOx, SOx and PM through simple mass balance. Fuel switching can also have an impact, for example, through increased uptake of LNG.
Fuel consumption estimates from the TIMES model have been combined with standard emission factors for each fuel type to estimate emissions of NOx, SO2 and PM total for each of the scenarios considered. This has been used to derive estimates of the total emissions
Support for the impact assessment of a proposal to address maritime transport greenhouse gas emissions
133
reductions under each scenario, relative to the baseline; these are presented in Error! Reference source not found. below and have assumed linearly interpolation between the five year periods analysed.
Table 10.3: Total reduction in emissions over the period 2010-2030 relative to the baseline
Scenario Atlantic (kt)
Baltic (kt)
Mediterranean & Black Seas
(kt)
North Sea (kt)
Outside EU (kt)
At Berth (kt)
NOx emissions
Closed ETS 1,414 432 1,658 646 2,279 329
Open ETS – free allocation
1,323 398 1,534 602 2,148 299
Open ETS – auction 1,344 410 1,554 616 2,160 303
Emissions tax - low 1,334 402 1,546 608 2,165 301
Emissions tax - high 1,464 435 1,720 665 2,417 337
SO2 emissions
Closed ETS 214 19 229 27 343 12
Open ETS – free allocation
200 17 213 25 322 11
Open ETS – auction 204 17 217 26 324 11
Emissions tax - low 202 17 215 25 325 11
Emissions tax - high 221 19 238 28 362 12
PM (total) emissions
Closed ETS 24 9 29 14 38 6
Open ETS – free allocation
23 8 26 12 36 5
Open ETS – auction 23 9 27 13 36 5
Emissions tax - low 23 8 26 13 36 5
Emissions tax - high 25 9 30 14 40 6
Environmental impacts of air pollutants are determined by the proximity of the emissions to sensitive areas. Thus, to fully understand the impacts of NOx and SO2, dispersion modelling should be used. However, this was not possible within the scope of this study and therefore estimates of net changes in air pollutant levels have been made using the fuel consumption data from the TIMES model. The impacts as assessed here are indicative only, and should be interpreted with care.
10.2.3.1 Impacts on health and crops
The impacts on health and crops and assessed as part of the analysis of social impacts (Section 10.4.8).
Support for the impact assessment of a proposal to address maritime transport greenhouse gas emissions
134
10.2.3.2 Impacts on materials
The main impact on materials and buildings is through degradation from acid air pollutants such as NOx and SOx. Damage to buildings occurs primarily to those made of stone, bronze or with painted surfaces.
The cost of materials damage per tonne of SO2 for the UK has been developed by Entec (2009). The figures are £95/t (€114/t) for in-port emissions and £19/t (€23/t) for at-sea emissions. Although these figures were developed for the UK, they provide an indicative analysis of the impacts on materials. These indicative costs suggest that the magnitude of damage costs to materials is a small fraction of the damages to health (assessed above) and so a more detailed account was not considered.
10.2.3.3 Impacts on ecosystems and biodiversity
The impacts of ship emissions on ecosystems and biodiversity are highly site-specific, but can cause damage though acidification and eutrophication. Increased acidification may affect certain organisms, particularly those with calcium carbonate skeletons or shells and the ecosystems that rely on them. Eutrophication is caused by high nutrient concentrations that stimulate the growth of algae and leads to several problems including: production of excess organic matter; increase in oxygen consumption; oxygen depletion and death of benthic organisms (Helsinki Commission, 2010).
It has been suggested in studies of the impacts of emissions in Europe that including ecological impacts would make little difference given the magnitude of health effects (EC4MACS, 2010). However, since all policies are expected to reduce emissions of NOx, SOx and CO2 compared to the baseline, beneficial impacts could be expected for ecosystems and biodiversity. In 2030, all of the policy options are projected to reduce NOx and SO2 by similar amounts.
The total annual emissions of NOx from European maritime transport are projected to reduce by 21-23% compared to the baseline for all of the policy options and annual emissions of SO2 are projected to reduce by approximately 24-25% compared to the baseline. The main difference is in reductions of CO2 emissions, which are highest for the ETS options (21.3% reduction compared to the baseline in 2030) and lowest for the low tax on emissions and the contribution-based compensation fund.
Table 10.4: Reduction in emissions compared to the baseline in 2030
Scenario Reduction in 2030 NOx emissions
Reduction in 2030 SO2
emissions
Reduction in 2030 CO2 emissions
Shipping ETS – closed with free allocations 19% 20% 21.3%
Shipping ETS – open with free allocations 17% 18% 21.3%
Shipping ETS – open with full auctioning 17% 18% 21.3%
Tax on emissions (low) 17% 18% 16.4%
Tax on emissions (high) 19% 19% 21.2%
Target-based compensation fund 19% 20% 21.3%
Contribution-based compensation fund 17% 18% 16.4%
10.2.4 Other impacts
10.2.4.1 Transport and the use of energy
Energy demand for shipping is projected to decrease for all policy options compared to the baseline. The high emission tax offers the highest cumulative reduction in fuel consumption over the period from 2018-2030 compared to the baseline at 117.8Mtoe. However, this policy represents an extreme option. The second-most effective policy option in terms of reducing fuel consumption is the closed ETS. All of the other policy options assessed here achieved similar reductions of around 107 Mtoe from 2018 to 2030.
Support for the impact assessment of a proposal to address maritime transport greenhouse gas emissions
135
Table 10.5: Reduction in total fuel consumption compared to the baseline in 2030
Scenario Reduction in 2030 total
fuel consumption
(Mtoe)
Cumulative reduction in
fuel consumption
(2018-2030 (Mtoe)
% reduction in fuel
consumption (2018-2030)
Shipping ETS – closed with free allocations 13.1 113.5 12.7%
Shipping ETS – open with free allocations 11.9 106.9 11.9%
Shipping ETS – open with full auctioning 11.9 107.3 12.0%
Tax on emissions (low) 11.8 107.2 12.0%
Tax on emissions (high) 13.9 117.8 13.2%
Target-based compensation fund 11.9 107.3 12.0%
Contribution-based compensation fund 11.8 107.2 12.0%
10.2.4.2 Resource consumption
As fossil fuels are a non-renewable resource, reductions in their use are considered to be a key element of sustainability. Maritime transport is expected to remain heavily dependent on oil products (HFO and MDO) under all policy options. LNG represents about 11% of energy consumption in 2030 under the closed ETS policy and the high emission tax, and 10% of energy consumption in 2030 for all other policy options (on an energy-equivalent basis).
The renewable energy sources considered in the TIMES model include biofuels, solar panels and wind propulsion (kites and Flettner rotors). The share of biofuels in 2030 on an energy-equivalent basis is around 4% for the closed ETS policy and the high tax on emissions (biofuels are not taken up under any of the other policy options by 2030). The penetration rate is rather low because it is a relatively expensive abatement option. The share of alternative propulsion (wind power, solar power) in maritime transport is expected to be zero under the baseline scenario. For all policy options, the share of renewables leads to a reduction in fuel consumption of around 5-6% in 2030 compared to the baseline.
Table 10.6: Resource consumption under each of the policy options from 2018-2030
Scenario Reduction in non-
renewable consumption
in 2030 (snapshot
year) (Mtoe)
Reduction in non-
renewable consumption
2018-2030 (Mtoe)
Consumption of biofuels 2018-2030
(Mtoe)
Share of alternative propulsion
in 2030 (single year)
Baseline 13.4 - - 0
Shipping ETS – closed with free allocations
11.1 119.9 6.3 4.7%
Shipping ETS – open with free allocations
11.1 106.9 - 5.7%
Shipping ETS – open with full auctioning
11.1 107.3 - 5.8%
Tax on emissions (low) 11.1 107.2 - 5.8%
Tax on emissions (high) 13.7 124.1 6.3 4.8%
Target-based compensation fund 11.1 107.3 - 5.8%
Contribution-based compensation fund
11.1 107.2 - 5.8%
Impacts on other environmental resources could be caused by land use changes due to increased demand for biofuels and through construction of LNG infrastructure. The consumption of LNG from 2018-2030 is around 58 Mtoe under the baseline scenario, and around 52 Mtoe for all of the policy options. Since the consumption of LNG under each of the
Support for the impact assessment of a proposal to address maritime transport greenhouse gas emissions
136
policy options is similar, the impacts on land-use change would also be expected to be similar; therefore it was not possible to rank the options according to their impact on land-use change.
10.2.4.3 Waste production
While the effects of waste production have not been quantified, it is noted that policies that lead to increased scrappage of ships could have negative environmental impacts if ships are not scrapped in an environmentally sound manner.
Ship recycling is driven by factors including freight rates, the price of steel scrap and the costs of maintaining an ageing fleet. Older ships tend to have higher emissions and fewer options for abatement. This could mean that the cost of compliance for older ships would be higher, particularly in situations with a high carbon price, and therefore scrappage rates could increase. If the legislation includes compensation or special provisions for older ships, it could lead to delayed scrappage. It was not possible to quantify the impact of these factors on waste production.
In European countries ship breaking is strictly controlled to minimise its impact on the environment. However, most ship recycling takes place in South Asia where environmental standards are lower, leading to pollution of water, soil and coastal habitats.
Various hazardous materials are banned from use on new ships by legal instruments41. Older ships (pre-1980s) designated for scrapping are usually categorised as hazardous waste and EU legislation prohibits the export of hazardous wastes from the EU to non-OECD countries for recycling. However, if a ship has left European waters (without having been recognised as waste), the Community rules do not apply. These ships could be coated with 10-100 tonnes of paint containing lead, cadmium, organotins, arsenic, zinc and chromium (Hossain & Islam, 2006). They may also contain other hazardous wastes42; up to 7.5 tonnes of asbestos; and several thousand litres of oil. In Asia, ships containing these materials are cut up by hand on open beaches.
International legislation is in place to help reduce the environmental impact of ship breaking. On 15 May 2009, the IMO adopted a Convention to minimise the environmental impact of ship recycling through the Hong Kong International Convention for the Safe and Environmentally Sound Recycling of Ships which has not yet entered into force due to a delayed ratification process. Once this convention has been implemented, it can be expected that potential environmental and social risks of ship recycling will be reduced compared to today's situation.
10.2.5 Probability of undermining the environmental effectiveness of a regional system by implementing avoidance or evasion strategies
The maritime sector is global and therefore, it may be possible to undermine the environmental effectiveness of a regional system by implementing avoidance or evasion strategies.
With respect to the potential for avoiding the scheme, several options are available to reduce the proportion of a given voyage that would be subject to policy action:
a. Addition of port calls or ship-to-ship transfers: the addition of a port call to the route or a ship-to-ship transfer for the sole purpose of minimizing the distance from the last port of call before arriving at an in-scope port or minimizing the distance to the next port of call after leaving an in-scope port and therefore reducing the emissions covered by an EU measure. Alternatively, the cargo could then be transported by smaller vessels to EU ports. This would reduce the emissions covered by an EU
41
for PCBs through the Stockholm Convention and Regulation (EC) No 850/2004, for organotin compounds from 17 September 2008 through the Anti-Fouling Systems Convention and Regulation (EC) No 782/2003,for the production and use of ozone-depleting substances through Regulation (EC) No 2037/200, for perfluorooctane sulfonates (PFOS) from June 2008 through Directive 2006/122/EC and for trichlorobenzene (TCB) since June 2007 through Directive 2005/59/EC 42
such as PCBs (toxic to humans and animals), heavy metals and carcinogens (including dioxins, PVC, PAH)
Support for the impact assessment of a proposal to address maritime transport greenhouse gas emissions
137
measure. The total emissions could increase due to the lower efficiency of smaller ships. Theoretically, a similar approach could be applied for cargo exported.
b. Modal shift: the addition of a call at an out-scope port situated close to an in-scope port, and discharge of cargo there. The cargo could then be transported by another mode of transport. The whole journey would then fall outside of the scope of the policy action. Theoretically, a similar approach could be applied for cargo exported.
The impact of these mechanisms were assessed within the TIMES model. Additional port calls incur additional costs due to operational costs over the additional time (e.g. employment), fuel for the extra distance covered, and the port dues, which were included as cost elements in the model. However, in should be noted that in the model the decisions are made on a fleet level, rather than by specific ship operators, therefore the options for route shifting available to the model are broader than those a particular ship operator has. In this case, the time horizon available to the actors in the model is to 2050 and their decisions are assumed to be made with the perfect knowledge of prices in the future. As such, the results are an indicator of a general trend given the particular evasion options modelled (also worth noting that the extra costs associated with the change of the route were not very high in the modelled case). Finally, the model does not include other barriers to route shifting such as the capacity/congestion at evasion ports, time limitations on charters, physical ability to dock (e.g. due to the limited size of berths), availability of loading/unloading equipment suitable for specific cargoes etc. In order to address these limitations, and evaluate the risk on specific regions, a number of case studies were also carried out. These are available in the Technical Annex to this report.
Table 10.7: Impacts of potential evasion and modal shift on in-scope emissions and total emissions for each policy option
CO2 emissions (MtCO2)
Scenario 2030 in-scope emissions in response to policy action
2030 emissions out of scope due
to evasion (additional port calls
and/or trans-shipment)
2030 emissions out of scope due to modal shift
2030 total emissions
Baseline - 223.41 0 0 223.41
Shipping ETS – closed with free allocations
Direct route 175.74 0 0 175.74
Alternative route
169.10 18.47 0 187.57
Shipping ETS – open with free allocations
Direct route 175.74 0 0 175.74
Alternative route
167.70 19.69 0 187.39
Shipping ETS – open with full auctioning
Direct route 175.74 0 0 175.74
Alternative route
155.49 31.06 0.21 186.76
Tax on emissions (low)
Direct route 186.75 0 0 186.75
Alternative route
156.49 29.99 0.21 186.70
Support for the impact assessment of a proposal to address maritime transport greenhouse gas emissions
138
CO2 emissions (MtCO2)
Scenario 2030 in-scope emissions in response to policy action
2030 emissions out of scope due
to evasion (additional port calls
and/or trans-shipment)
2030 emissions out of scope due to modal shift
2030 total emissions
Tax on emissions (high)
Direct route 176.09 0 0 176.09
Alternative route
111.56 70.14 1.92 183.61
Target-based compen-sation fund
Direct route 175.74 0 0 175.74
Alternative route
155.49 31.06 0.21 186.76
Contribution-based compen-sation fund
Direct route 186.75 0 0 186.75
Alternative route
156.49 29.99 0.21 186.70
As can be seen from the table the closed ETS policy option is anticipated to result in the lowest levels of evasion. However, the potential impacts of any other option remains low, bearing in mind that this assessment does not consider all market barriers that may prevent evasion, as discussed above. Conversely, as the economic impact assessment finds, it is possible that the costs of maritime transport could be reduced, if fuel savings are greater than the investment required for increased energy efficiency. Therefore a shift from land-based modes to sea transportation could also be possible. An assessment of this reverse shift is outside the scope of the current study.
Table 10.8 compares the total net emissions impacts of the policy options with and without the possibility of evasion (via route-shifting / additional port calls) and avoidance (via modal shift) occurring. Taking into account the potential for avoidance, it can be noticed that any policy option still deliver absolute emissions reductions in 2030 compared to 2005.
Support for the impact assessment of a proposal to address maritime transport greenhouse gas emissions
139
Table 10.8: Comparison of scenarios with and without route shifting and modal shift
Net CO2 emissions in 2030
% reduction compared to 2005 levels
Scenario No route shifting
Route shifting &
modal shift
No route shifting
Route shifting &
modal shift
Baseline
223.41 N/A +14.6% N/A
Shipping ETS – closed with free allocations
175.74 187.57 -9.9% -3.8%
Shipping ETS – open with free allocations
175.74 187.39 -9.9% -3.9%
Shipping ETS – open with full auctioning
175.74 186.76 -9.9% -4.2%
Tax on emissions (low)
186.75 186.70 -4.4%-4.4% -4.4%-4.4%
Tax on emissions (high)
176.09 183.61 -9.7% -5.8%
Target-based compensation fund
175.74 186.76 -9.9% -4.2%
Contribution-based compensation fund
186.75 186.70 -4.4%-4.2% -4.4%-4.3%
A full breakdown of emissions under the route shifting and modal shift analysis is provided in the Technical Annex: Appendix 5. The reduction in environmental effectiveness due to avoidance could be mitigated by taking measures such as setting up voluntary agreements with ports that are close to the EU but outside of the default scope of the scheme.
The impacts of modal shift and route shifting are captured in the model, but other possible behaviours such as redeployment of ships to different parts of the world and relocation of manufacturing are not. A separate off-model assessment of avoidance was carried out, and these other effects are not anticipated to have significant impacts on avoidance compared to modal shift and route shifting (see the Technical Annex: Appendix 5).
As a conclusion, the probability of undermining the environmental effectiveness of a regional system by implementing avoidance or evasion strategies is considered to be very low. On the contrary, the reduction total costs described in Section 10.3 may lead to modal shift from rail or road to ships, if the savings are passed into the freight rates.
Support for the impact assessment of a proposal to address maritime transport greenhouse gas emissions
140
10.3 Economic impacts
For Europe, shipping is the main mode of transport for extra-EU trade and is therefore crucial to its global competitiveness as well as the optimal operation of its internal market. Eurostat estimates that in 2010, the EU 27 imported €812bn worth of goods from the rest of the world by sea and exported the equivalent of €640bn. This equated to around half the total value of extra-EU trade and three quarters of the volume of goods traded.
Economic growth and overall demand for shipping are driven by a multitude of complex and connected factors making it very difficult to isolate the impact of a single policy over the next 20 years. However, the analysis produced in this chapter highlights a number of ways in which the policy options may impact on the European economy.
10.3.1 Who might be impacted by a change in the cost of shipping and how?
Due to its central role in enabling economic activity, a change in the cost of shipping may have repercussions on the whole spectrum of economic agents: raw material suppliers, manufacturers and service providers, the shipping industry, retailers and eventually consumers. The ultimate impact on these agents will depend on the relative levels of costs and savings generated by the policy options over the next 20 years.
Figure 10.1 illustrates the types of stakeholders with relations to the shipping industry and their complex relationships.
Figure 10.1: Types of organisations involved in the demand for and supply of shipping services
The main groups of stakeholders likely to be impacted at the micro-economic level are:
Ship owners and operators.
Companies which supply goods transported by sea and companies which demand goods transported by sea.
UN
IMO Member
States
Inter/national
bodies & other
Port coastal
Flag
states Ship
owner
Management
company
Captain /
Crew
Other
services Bunker
supplier
Insurer
Port
agent
Ship
broker
Ship
financier
Ship yard
Classification
society
H&M
manufacturer
Shareholders
Charterer
Cargo
owner
Freight
forwarder
Consignee
Final
consumers
Industries:
construction,
mining,
manufacturing
Regulatory
Shipping
operators
Demand
drivers
Support for the impact assessment of a proposal to address maritime transport greenhouse gas emissions
141
Final consumers.
The direct change in costs resulting from the selected policy will in turn impact on freight rates. The scale of this impact will depend on the ability to pass these additional costs or savings through the maritime supply chain by changing freight rates. Final consumers will only bear the portion of any cost variation that is passed-through by manufacturers and retailers.
At the macro-economic level, the main parties affected by the economic impacts of a scheme to reduce GHG emissions from shipping are:
EU countries which are heavily reliant on imports by sea.
EU countries whose economies are heavily reliant on exports by sea.
Countries outside the EU which rely heavily on their exports to Europe, with a particular emphasis on developing countries.
EU regions particularly vulnerable to loss of shipping traffic, due to their economic dependence on this sector.
EU small and medium-size enterprises (SMEs), which may suffer a heavier burden than large enterprises as a result of the scheme. This is because they will be less able than large companies to spread the capital costs and fixed administrative costs necessitated by the policy.
Public authorities which will finance the implementation, enforcement and monitoring of the policies.
In each of these categories, some organisations / countries will win or lose more than others. This impact assessment will particularly focus on identifying those which may be disproportionately disadvantaged.
It is important to note that commodity prices and shipping activity are affected by many factors other than shipping costs. It is therefore not straightforward to isolate the impact of policy options on economic activity.
10.3.2 Economic impacts on the shipping industry
The shipping industry involves a number of actors who undertake and facilitate the transport of cargoes by sea. They are listed below along with their function.
Table 10.9: Businesses involved in shipping
Type of business Function
Ship owners Parties that own ships and make decisions on how to use existing ships to provide shipping services, when and how to buy new ships, and what ships to buy.
Shipbuilders Parties that build new ships and sell them to ship owners.
Scrap dealers Parties that buy old ships from ship owners for scrapping.
Terminal operators Parties that provide port services to ships, such as berthing and cargo handling.
Intermodal transport operators
Parties that provide intermodal transport services for the door-to-door movement of cargoes.
Ship agents Companies that represent owners of the vessels, and are engaged in the routine business related to vessel arrival, operation, and departure of ships.
Charterers Entities that employ ships to transport cargoes.
Shipbrokers Specialist intermediaries between ship owners and ship charterers, or between buyers and sellers of ships.
Common carriers Transport operators that provide services to the general public at published rates.
Non-vessel operating common carriers
Transport operators that have no operating vessels but coordinate the provision of shipping services.
Support for the impact assessment of a proposal to address maritime transport greenhouse gas emissions
142
Different types of businesses will be affected by the policy options in different ways: some directly (ship owners / operators); and others indirectly if the policy leads to a reduction in shipping activity, changes in working practices or the take up of innovative technologies to improve the carbon efficiency of ships.
10.3.3 Direct economic impacts on the shipping industry
10.3.3.1 Methodology
Operating, fuel and capital costs for the baseline and the policy options are modelled in TIMES. The detailed methodology is available In the Technical Annex: Appendix 1
It is important to point out that: the target-based compensation fund is modelled along the lines of the open ETS with full auctioning as the target will be the same and a compensation fund requires the payment of a contribution driven by this target; the contribution-based compensation fund is modelled along the lines of a low emissions tax.
The administrative burden placed on the shipping industry by the policy options is presented separately and is sourced from Section 10. Administrative costs were estimated for the ETS and the contribution-based compensation fund only due to limited time and resources.
10.3.3.2 Impacts on capital and operational costs
Table 10.10 and
Support for the impact assessment of a proposal to address maritime transport greenhouse gas emissions
143
Table 10.11 below present the total and additional costs and savings generated by each policy option between 2010 and 2030 compared to the baseline in terms of capital, operational and fuel expenditure as well as the net aggregated total. This is based on the assumptions that the final specification of the policies avoids significant evasion or modal shift.
It is important to note that the high tax on emissions option is an extreme and very unlikely scenario which is only included for illustrative purposes. For this reason, the analysis throughout this chapter focuses on the other – more likely – options.
Table 10.10: Discounted costs of baseline and policy options, 2010-2030 (€bn)
Policy option Capital costs
Operational costs
Fuel costs Tax/ contribution/
permits
Total costs
Total baseline costs 614.7 305.5 582.3 - 1,502.5
Shipping ETS – closed with free allocations
623.1 305.5 526.6 - 1,455.2
Shipping ETS – open with free allocations
617.5 305.6 526.7 0.7 1,450.5
Shipping ETS – open with full auctioning
617.7 305.5 526.3 30.4 1,479.9
Tax on emissions (low)
617.6 305.5 526.4 26.1 1,475.6
Tax on emissions (high)
623.4 305.6 525.9 203.5 1,658.4
Target-based compensation fund
617.7 305.5 526.3 30.4 1,479.9
Contribution-based compensation fund
617.6 305.5 526.4 26.1 1,475.6
Support for the impact assessment of a proposal to address maritime transport greenhouse gas emissions
144
Table 10.11: Additional costs of each policy option compared to the baseline, 2010-2030 (€bn)
Policy option Capital costs
Operational costs
Fuel costs Tax / contribution /
permits
Total costs
Shipping ETS – closed with free allocations
8.4 0.072 -55.8 - -47.3
Shipping ETS – open with free allocations
2.8 0.12 -55.6 0.7 -52.0
Shipping ETS – open with full auctioning
3.0 0.009 -56.0 30.4 -22.6
Tax on emissions (low)
2.9 0.032 -55.9 26.1 -26.9
Tax on emissions (high)
8.7 0.173 -56.4 203.5 156.0
Target-based compensation fund
3.0 0.009 -56.0 30.4 -22.6
Contribution-based compensation fund
2.9 0.032 -55.9 26.1 -26.9
As seen above, all options will incur additional capital costs: in order to comply with the policies, the shipping sector will need to invest in new vessels and / or abatement technologies to retrofit existing ships.
Additional capital costs will be highest under a high emissions tax (€8.7bn), as it is an extreme scenario that places heavy burdens on the shipping sector. The closed ETS also incurs relatively high capital costs (€8.4bn), as it combines strict targets without the option to purchase allowances from other schemes. It also rewards those who exceed their reduction targets by offering them a chance to monetise them due to the free allocation of allowances. By doing so, it provides several strong reasons to invest in new technologies and reduce emissions.
Both open ETS options set a cap on emissions but allow operators to meet part of their obligations by buying allowances from other sectors. The more expensive abatement options (i.e. those with costs per tonne of CO2 abated greater than the ETS price) would no longer be cost effective, and hence additional out-of-sector permits would be purchased in preference to investing in these technologies. As a result, additional capital costs under this option are lower at €2.8bn for the open ETS with free allocations and €3bn for the open ETS with full auctioning.
The low tax option does not include targets for emission reductions. It encourages improvements in fuel efficiency by charging a levy on emissions but it is up to the individual operator to decide whether it is more cost-effective for them to bear the tax or to reduce emissions. The level of the tax will therefore be decisive in the rationale for capital investment in abatement technologies. Under the current assumptions, this option would generate an additional €2.9bn in capital investment compared to the baseline.
The compensation funds also provide a lower incentive to invest in abatement technologies than the closed ETS: the target-based compensation fund sets targets but offers some flexibility as they can be met by buying offsets from the international carbon markets; the contribution-based compensation fund does not include an emissions reduction target.
With regards to fuel costs, the TIMES model finds that all policy options would lead to significant savings compared to the baseline. These savings would be broadly similar across the different options, amounting to €55-€56bn, and directly benefit shipping operators.
Aside for fuel costs, the options will have minimal impact on shipping operators’ operational costs, only triggering a small increase compared to the baseline.
Support for the impact assessment of a proposal to address maritime transport greenhouse gas emissions
145
Finally, most policy options place some form of financial cost on the industry be it in the shape of a tax, permits or contributions. In the case of a high tax on emissions, the burden placed on the industry would be very heavy – €203.5bn – cancelling out any savings from the policy. However, it is important to bear in mind that this option is an extreme scenario, used here for illustrative purposes. Under an ETS with full auctioning, permit costs are estimated at €30bn by 2030 and the cost of a lower tax would be €26bn.
In total, the implementation of all policy options would result in significant net cost savings for the industry, except the extreme case of a high tax on emissions.
The open ETS with free allocation achieves the highest savings against the baseline, largely due to the lower capital costs implied by this option. The closed ETS offers the second largest value of cost savings over the period: the higher constraints it sets means that the larger capital investment required is also counterbalanced by more important fuel savings over time as the industry becomes more efficient.
The other options would generate broadly similar savings for the sector, significantly lower than under the closed ETS and open ETS with free allocation. The open ETS with full auctioning and the target-based compensation fund are in many ways similar and would result in the smallest cost savings because of the cost of purchasing the permits and making the required contributions. On the other hand, the low tax and contribution-based compensation fund place lower costs on the industry and as a result in slightly higher savings.
It is worth bearing in mind however, that although many of the abatement options which lead to the cost savings mentioned in this section have been available to the maritime sector for a while, they have not yet been implemented. This suggests some hidden cost, time or other market barriers to their uptake by the sector. Given that most policy options will generate revenue for the industry, it will be worth considering the use of these revenues to maximise the effectiveness of the chosen policy.
As operators realise savings on their operating costs over time, it may be possible to pass these on to their customers. This in turn could translate into lower costs of shipping and of the goods transported by sea. The extent to which cost savings benefit those down the supply chain would depend on a wide range of factors including demand elasticity, commodity prices and competition levels on specific trade routes. This is explored in the analysis of impacts on commodities presented in Section 10.3.5
10.3.3.3 Administrative burden on ship owners / operators
The methodology and the data sources for the development of the administrative burdens are presented in the Technical Annex: Appendix 4. The implementation of the policies will place additional administrative costs on the industry as businesses have to monitor, report, and verify the information required as part of the selected option. This will require additional manpower and resources.
The administrative costs common to all policy options, as well as those specific to Option 1 (ETS) and Option 3b (industry-managed compensation fund) have been analysed. The analysis considers two scenarios: under the first scenario, only ships above 5,000 GT are included. This threshold is reduced to 400 GT under the second scenario. These scenarios would affect, respectively, 2,623 and 5,139 operators and cover 11,400 and 18,400 ships.
10.3.3.3.1 Administrative costs common to all policy options
These costs would cover:
Set-up and preparation. Understanding the scheme’s rules, definitions and implications, consulting and checking documentation, and interacting with competent authorities are time-consuming activities.
Monitoring plan, prepared to keep track of the information and performance of ship owners and operators.
Support for the impact assessment of a proposal to address maritime transport greenhouse gas emissions
146
Monitoring and reporting. Emissions reporting obligations, which in this study are assumed to be annual, are another important cost parameter. This task includes retrieving relevant information from existing data, adjusting existing data and filling in forms and tables (including record keeping). Emissions monitoring and reporting is already possible since fuel consumption is systematically recorded by most commercial vessels. So data and capacity are available and as a result the costs related to gathering documentation are likely to be minor.
Verification costs may vary substantially across Member States as well as across compliance entities. Verification could mix on-board and on-shore procedures to limit costs and maximise effectiveness. These costs rise more slowly than fleet size, and economies of scale could therefore be obtained by larger companies.
Submission costs. On average, each vessel is expected to require approximately one man-day per annum to submit all the necessary information to the Competent Authority.
Other costs may be incurred by businesses although they have not been quantified: costs related to Member States’ individual requirements and investments in IT solutions for monitoring and reporting.
The estimates for the administrative burden common to all policies under the two scenarios are presented in the table below (see the Technical Annex for derivation of these estimates). Amounts represent net additional administrative costs on top of business-as-usual costs on an annualised basis. A ten-year period has been used for amortisation purposes.
Table 10.12: Estimates of costs common to all policy options (calculated per year over ten years), 2010 €
Type of cost All ships >400GT All ships >5,000GT
€m € per vessel
€m € per vessel
Set-up and preparation 14.7 800 7.6 660
Monitoring plan 3.7 200 1.9 170
Preparation of yearly emissions reports 28.1 1,500 12.9 1,130
Verification of yearly emissions reports 82.8 4,500 51.3 4,500
Submission of information 6.1 330 3.8 330
TOTAL 135.2 7,350 77.4 6,780
According to the estimates produced for this study, the maritime transport industry as a whole would incur annual administrative costs of approximately €77m if only vessels above 5,000 GT were to be affected by the policy option. This figure would increase by 75% to €135m if the 400 GT threshold was used. The average cost per Compliance Entity would be €6,780 in the first case and €7,350 in the second case, highlighting the likelihood of economies of scale and of disproportionate impacts on smaller businesses.
The final administrative costs are likely to be influenced by the level of aggregation allowed within the scheme, as fixed costs per operator would presumably be lower if joint reporting and verification were possible.
10.3.3.3.2 Costs specific to ETS
The approach used to estimate ETS administrative costs assumes a design similar to that chosen for aviation. Research suggests that the main cost parameters specifically related to this option would come from becoming acquainted with the information obligation and purchasing and surrendering allowances.
There are two categories of costs, as presented in Table 10.13 below:
Support for the impact assessment of a proposal to address maritime transport greenhouse gas emissions
147
Costs common to both a full allocations and free allocations ETS.
Additional costs specific to the free allocations option. In this latter case, compliance entities would face additional administrative costs stemming from reporting. This would probably need to be done on the basis of fuel consumption. There may need to be a benchmarking period in order to assess annual fuel consumption/emission levels before the scheme enters into force.
Table 10.13: ETS administrative burden per year
Type of cost All ships >400GT All ships >5,000GT
€m € per vessel
€m € per vessel
Costs common to all ETS options 18 1,000 11 1,000
Costs specific to ETS with free allocations 39 2,100 21.5 1,900
Total 57 3,100 32.5 2,900
10.3.3.3.3 Costs specific to compensation funds
Estimates for this option are based on data and information from Norway’s Business Sector NOx-Fund and also incorporate inputs from Commission officials. It is important to note that resulting estimates are indicative only.
Table 10.14: Compensation fund administrative burden
Type of cost All ships >400GT All ships >5,000GT
€m € per vessel
€m € per vessel
Total 34 1,900 21 1,900
10.3.4 Indirect impacts on the industry
Businesses in the shipping industry will be affected by an EU policy to reduce maritime sector GHG emissions if it leads to a change in shipping activity and/or if it leads to improvements in productivity.
10.3.4.1 Changes to levels of shipping activity
Each of the policy options is expected to result in significant net savings for the shipping industry, thereby enhancing shipping’s competitiveness as a mode of transport for international trade. This could boost shipping activity by encouraging modal shift from other transport modes .
However, demand for sea transport is a derived demand and therefore other factors will influence shipping activity levels. These will include: economic growth at a global level and by country; the elasticity of consumer demand for the goods shipped by sea; the availability or absence of an alternative mode of transport; and time, which allows shippers to adjust their fleet to new conditions. Assumptions regarding these factors have been included as part of the IHS Global Redesign forecast for business-as-usual shipping activity and emissions. This forecast data has been used as the basis of the baseline business-as-usual scenario within the TIMES model. Full details are contained in the Technical Annex: Appendix 1 and Appendix 2.
Aside from the levels of total shipping activity, the policy options could also affect the distribution of shipping activity in terms of route, commodity and vessel types. The complexity of trading relations make it impossible to estimate the impact of the policies on shipping activity overall. However, it is possible to consider the impacts on specific commodities, as presented in Section 10.3.5.
Support for the impact assessment of a proposal to address maritime transport greenhouse gas emissions
148
10.3.4.2 Improvements in productivity
The reduction in carbon emissions required by the policy options may lead to a change in operating practices and the development of innovative technologies, which in turn would result in higher productivity and cost savings.
This relates to the Porter hypothesis which AEA reviewed in a previous study (AEA, 2011). It is built on an assumption that a company is unable to take economically beneficial measures on its own. This may occur because companies are unable to find the most efficient way to produce, because they do not have the ability or capacity to make investment decisions that benefit the company in the long term, or because they will sub-optimally invest in innovation from a societal perspective due to not being able to fully capture all of the benefits of innovation directly (spillovers). Although the hypothesis is controversial, there is a general consensus in literature that it has validity in cases where there is a systematic lack of information, or limited or bounded rationality (Brannlund and Lundgren, 2009).
According to Porter, more stringent environmental policies, if they are implemented correctly, can lead to higher productivity, or a new comparative advantage, which can lead to improved competitiveness. In other words, environmental policy can lead to a win-win situation, or an extra profit of environmental regulation (in addition to net benefits related to less pollution).
Porter points out two main reasons why environmental policies can lead to improved competitiveness:
More stringent environmental regulations can reveal inefficiencies within firms that were previously hidden and in this way put pressure on a company to become more efficient; and
More stringent regulations induce innovation in companies.
We explore both these types of effects below.
10.3.4.2.1 Operating practices of ship operators
Implementing policy for the reduction of emissions from the shipping sector may encourage the uptake of operational efficiency, leading to reduced fuel consumption. This is the hypothesis used in the TIMES model, as illustrated by savings in fuel costs due to the policy options.
Some recent papers find evidence of positive relationships between more stringent environmental regulation and productivity but this evidence is only anecdotal at this point. Overall however, most studies find that the effect of environmental regulation on business performance is weak or ambiguous.
10.3.4.2.2 New technologies
In the longer-term, improvements in productivity may also be achieved through the integration of innovative technologies on new vessels and by retrofitting existing vessels where possible. A policy measure to reduce maritime sector CO2 emissions may make new technologies more cost effective. The abatement technologies included in the TIMES model include: alternative energies such as towing kites, wind engines and solar panels; optimized hull & superstructure; air lubrication; hull coating and cleaning; common rail technology; main engine tuning; speed control of pumps & fans; propeller and rudder upgrades; and LNG-powered ships.
However, most of these technologies remain nascent and their current uptake is limited, mostly due to the cost of implementing them, a lack of knowledge of their effectiveness on specific ship types/sizes/routes and other market barriers such as the principal / agent problem. Any impact from the selected policy on technological innovation will be relatively slow, as many of the most effective options are limited in application to new ships (IMO, 2009). For retrofittable measures there could be a significant time lag before emission reductions are achieved. as most can only be adopted when vessels dry dock for scheduled maintenance (e.g. every 30 months or 60 months). This means that the phase-in and the reductions achieved by design-based improvements in energy efficiency are likely to be slow.
The development and uptake of innovative solutions can be enhanced by recycling any revenues from the policy options. This aspect has been assessed in the Technical Annex: Appendix 7.
Support for the impact assessment of a proposal to address maritime transport greenhouse gas emissions
149
10.3.4.3 Conclusions
The table below summarises the impacts from the policy options on the shipping sector in quantitative and qualitative terms. The net savings identified by the TIMES model are expected to directly benefit shipping operators. They may choose to retain these savings and improve their profitability or they may decide to pass them on to their customers through reduced freight rates which in turn would improve their competitiveness. Their decision will depend on a range of factors (price elasticity of demand, levels of competition on their route, type of commodity traded+) which are explained in Section 11.3.5. A more detailed analysis of how these savings may impact other economic agents (manufacturers and customers) is also undertaken at commodity level in Section 11.3.5.
Table 10.15: Summary of direct and indirect impacts on the shipping industry by policy option by 2030 compared to the baseline
Type of impact
ETS closed
ETS open (free
allow-ance)
ETS open (full
auction-ing)
Tax (low) Tax (high)
Target-based
compensation fund
Contri-bution-based
compensation fund
Net additional costs (€bn)
-49.2 -51.9 -22.6 -26.7 153.9 -22.6 -26.7
Total admin-istrative burden common to all policies (€bn)
0.077 – 0.135
Total policy-specific admin-istrative burden (€bn)
0.011-0.018
0.011-0.018
0.033-0.057
0.021-0.034
0.021-0.034
Impact on shipping activity
The impact on shipping activity is assessed for the most relevant commodities in section 1.2.5
Potential for innovation
All options will create incentives for the uptake of new abatement technologies. The option which places the most constraints on emissions from the shipping sector without alternative ways to offset them is also the one likely to make investment in new technologies most cost-effective. This option is the closed ETS.
Further, all options will generate revenues which can be recycled to support investment in abatement technology in the industry, thereby accelerating the reduction in GHG emissions. The impact of each policy in this respect will depend on the final specifications.
10.3.5 Economic impacts on the European internal market
A policy for the reduction of GHG emissions from the shipping sector will have an impact on the operation of Europe’s internal market if it:
Increases or decreases consumer choice;
Increases or decreases the price of consumer goods; or
Creates or removes barriers to the free operation of businesses across Europe.
More specifically, any change in costs experienced by the shipping sector as a result of the policies may affect the EU’s internal market by:
Support for the impact assessment of a proposal to address maritime transport greenhouse gas emissions
150
Increasing/decreasing freight rates;
Raising / reducing the operational costs of EU-based businesses for sectors which rely on imports by sea and depending on the share of maritime freight costs in product prices;
Increasing/decreasing the price of consumer goods if costs / savings are passed through to consumers, thereby reducing/increasing their utility for a given level of spending. The ability of importers to pass carbon costs through to consumers depends on the share of imports in local consumption, competition levels on the market, and the elasticity of local demand to price changes;
Should cost decreases be significant enough on certain routes, imports of new inputs or consumer products may become competitive. The policy options would thereby lead to further competition and choice on the EU market.
It is not possible to analyse the impacts of the policies on all routes and for all goods; therefore a detailed analysis of ten commodities, selected in collaboration with the European Commission, has been carried out. These commodities are: crude petroleum; refined products; natural gas; iron ores; iron and steel; wearing apparel; grain; office and IT equipment; motor vehicles; and chemicals. An additional analysis was conducted on the pulp and paper section, which is presented in the Technical Annex.
The impacts of the policies on exports relate to Europe’s competitive position in the world and are explored in the next section
10.3.5.1 Methodology
The commodities were selected for detailed analysis based on:
The relevance of the commodity in terms of its importance for EU competitiveness (e.g. share of exports and imports, profit margins, transport costs). Competitiveness is understood at the EU-27 level, considering all Member States as a trading bloc vs. the rest of the world.
The technical feasibility of the analysis, in terms of readily available data on historical and predicted trade flows, freight rates, freight rate elasticities, own price elasticities, costs pass-through rates, quantities sold and market shares of domestic and overseas producers.
Furthermore, the commodities were selected to reflect a range of possible economic impacts from the policy options. They relate to the three main potential risks for the EU: the competitiveness loss of its exports (for goods with a high ratio of seaborne exports such as motor vehicles or chemicals), the competitiveness loss of local industries heavily dependent on imports of intermediate goods by sea (for example, refined products or iron and steel, as well as all energy intensive countries consuming oil and gas) and the increase in prices for final consumer goods (for example for office and IT equipment, wearing apparel or grain).
The scale of the impacts from the policies, and who will bear these impacts (producer, manufacturer, retailer or consumer) depend on the following factors:
Cost pass-through. The extent to which a change in freight rate is passed on from ship operators to their customers. For each commodity, a high and low freight rate is considered which corresponds to two popular trade routes with Europe for the relevant type of vessel. The chosen routes and therefore the freight rates change with each commodity in order to reflect the geography of its trade. Our analysis assumes that freight rates change in response to the real costs of shipping. However, contract structures in the maritime industry are complex and may be agreed for long time period, therefore in some cases the changes in the cost of shipping may not be reflected in the freight rates that are charged on the market. It is assumed that if freight rates increase, shipping operators absorb the additional cost for commodities which are price elastic but pass it on to their customers for commodities which are unresponsive to price changes.
Support for the impact assessment of a proposal to address maritime transport greenhouse gas emissions
151
In the case of freight rate decreases, if demand for a commodity is inelastic, shipping operators keep the savings. In the opposite case, they are assumed to reduce transport costs. Cost pass-through also relates to the ability of producers, manufacturers and retailers to pass costs through to the next link in the supply chain. This in turn depends on levels of market concentration and demand price elasticity.
Ad valorem – i.e. the percentage of the price of the commodity that is due to the cost of shipping: the higher the ad valorem of freight rates, the stronger the repercussions on the price of the commodity. As mentioned above, in order to reflect the variety of freight rates depending on routes, for each commodity a low and high freight rates have been chosen. Both relate to popular trade routes for the commodity considered.
The price elasticity of demand for the commodity. This will determine the change in the consumer surplus as a result of a change in price (e.g. the extent to which demand for a product responds with respect to changes in its price)
Armington elasticities - the ability to substitute imports with domestic products. Armington elasticities compare the change in the price of an imported good with the demand for this same good but produced domestically. In other words it assesses the extent to which imported and domestic goods are substitute for each other, in which case an increase in the cost of imports makes local products more competitive. It is important to bear in mind however, that Armington elasticities are extremely difficult to estimate and data is scarce. The results from this part of the analysis must therefore be read with caution.
10.3.5.2 Crude oil
Crude oil is an essential commodity for the operation of the European economy, both as a fuel and as a component in a large number of products. Europe is almost completely dependent on imports in order to meet its needs for crude oil: imports amount to 93% of total EU consumption. This dependence on imports is expected to grow in the future as domestic resources are depleted.
Shipping plays a critical role in the transport of crude oil: 81% of all imports to Europe travel by sea. The level of dependency of Europe on seaborne imports means that any change in the cost of shipping crude oil could have repercussions throughout the economy. Seaborne imports predominantly come from Russia, Norway and Libya, adding up to 53% of the total in 2010. With Iran, Saudi Arabia, Kazakhstan and Nigeria, these seven countries provide three quarters of Europe’s imported oil. They are therefore the countries most vulnerable to impacts from the policy options.
Support for the impact assessment of a proposal to address maritime transport greenhouse gas emissions
152
Figure 10.2: Seaborne imports of crude oil by country of origin (% tonnes), 2009
Source: Eurostat
Freight rates represent a very small proportion of the final price of crude oil, between 0.3-1.3% of CIF (cost, insurance, freight) price of oil. Prices are mostly driven by factors other than transport costs, mainly by the supply and demand dynamics of the market and by the cost of finding, developing and producing new reserves. As a result, it is difficult to isolate the impact a change in freight rates would have on future crude oil prices.
There are no realistic alternative to crude oil on a large scale and, as mentioned before, Europe is highly dependent on imports to meet its needs. As a result, demand is likely to be inelastic to price change. In addition, Europe has very little production capacity meaning it cannot replace imports with local supply (this is reflected in Table 10.16 by a very low Armington elasticity).
It is expected that any increases in the price of crude oil imports would be fully passed on by overseas producers to European refineries. Foreign oil producers hold a high market power and as a result have a strong ability to pass costs on to their customers.
The respective impacts of the policy options are estimated in Table 10.17 after a reminder of the key assumptions underlying our analysis in Table 10.16. They represent the difference between what would happen under each policy option compared to the baseline.
Table 10.16: Key figures and assumptions
Variable Assumption
Initial price (€/tonne) 328 to 386
Initial total EU demand (Million tonnes) 599.7
Total consumption (€m) 196,689
Market share of domestic producers 7%
% seaborne imports 81%
Freight rate per tonne and ad valorem €1.1 to €4.3€ (0.3%-1.2%)
Armington elasticity 0.005
Own price elasticity of crude oil -0.1 to -0.3
Cost pass through to refineries 100%
RUSSIA26%
NORWAY16%
LYBYA11%
IRAN6%
SAUDI ARABIA
6%
KAZAKHSTAN6%
NIGERIA5%
AZERBAIJAN4%
IRAQ4%
ALGERIA2%
ANGOLA2%
SYRIA2%
MEXICO2%
OTHER8%
Support for the impact assessment of a proposal to address maritime transport greenhouse gas emissions
153
Table 10.17: Summary of policy impacts on crude oil by 2030 compared to the baseline
Variable Change in freight rates (€ per tonne
and %)
Resulting change in price per tonne of
crude oil for refineries (€)
Resulting change in price per tonne of
crude oil as % of total
price
Change in demand for
EU production (€m and %)
ETS closed
-€0.01 (-0.8% to -
0.2%)
€0
0% 0%
ETS open (free allowances)
-€0.015 to -€0.1
(-7% to -1%)
€0
0% 0%
ETS open (full auctioning)
€0 - €0.4 (-0.4% to 8%)
€0 - €0.4
0% €0-€0.06m (0%)
Emissions tax (low) €0 - €0.3 (-0.8% to 7%)
€0 - €0.3
0% €0-€0.05m (0%)
Emissions tax (high)
€1 to €5.6 (93% to 119%)
€1-€5.6
0.2-0.7% €0.2-0.9m 0%
Target-based compensation fund
€0 - €0.4 (-0.4% to 8%)
€0 - €0.4
0% €0-€0.06m (0%)
Contribution-based compensation fund
€0 - €0.3 (-0.8% to 7%)
€0 - €0.3
0% €0-€0.05m (0%)
Both the closed ETS and open ETS (free allowances) are expected to lead to a decrease in freight rate compared to the baseline by 2030. These decreases equate to small amounts, between €0.01 and €0.1. It is assumed that these savings are kept by ship operators, meaning that these policy options are not expected to have any impacts on the price of crude oil and therefore on the demand for imports and domestic production.
The effects of the other options may range from a small drop in freight rate to a rise of 8% compared to the baseline. These different levels of change reflect the different trajectories assumed by the model for each route and ship size in order to achieve the targets to 2050. The low end freight rate assumption tends to refer to a shorter route and the higher freight rate to a longer route. This usually also means different ship sizes which will affect how effective the model finds abatement options. In turn this will impact on freight rates. In all cases however, these relative changes equate to changes of less than €0.7 per tonne. In view of the low freight rate ad valorem, this in fact will not generate any noticeable impacts on domestic or foreign producers. It is also unlikely to lead to modal shift from shipping to road or rail as on long distances the cost of shipping is significantly lower than freight by lorry or train. The analysis of the high tax option is included here for completeness, but it is an extreme scenario that is unlikely to be implemented.
The impact of a change in the price of crude oil on EU consumers is explored in the next section.
10.3.5.3 Refined petroleum products
The price of petroleum products is closely related to that of crude oil prices because crude oil makes up a large share of the retail prices of gasoline and diesel in the EU: 77% on average for gasoline and 82% for diesel for the period 2005-2011. However, as seen above, it is expected that freight rates will either remain unaffected by the policy options or that at most a very small increase will occur.
The other possible way in which the policy options may have an effect on the price of refined petroleum products in Europe is through their impact on the cost of imports. This is considered here.
Support for the impact assessment of a proposal to address maritime transport greenhouse gas emissions
154
The EU is not dependent on imports of refined petroleum products from overseas to meet its overall consumption needs, although there are differences across products. The EU-27 has a total production surplus of petroleum products which comes mainly from two products: gasoline and residual fuel oil (RFO). However, there is a production deficit for several key products: diesel, jet fuels and liquefied petroleum gas. The key trend in the last decade has been the decline in the demand of gasoline and RFO, and an increase in the demand for diesel, which has left EU refineries with a surplus of the former products and a deficit in the latter. The European Union’s refining industry has not been able to keep pace with the growth in middle distillate demand, and some dependence on imports for these products is expected to remain in the future despite investment in refineries (Purvin and Gertz, 2009). Diesel, the main petroleum product consumed in the EU, depends to some extent on imports to meet internal demand: imports of diesel amount to 16% of internal consumption. On the other hand, the EU is practically self-reliant for gasoline consumption, where it actually has an excess production that must be exported.
Shipping plays a dominant role in the transport of imports of refined petroleum products to the EU accounting for 81% of the total. As seen below, Russia is the main supplier of refined petroleum products to Europe, with 44% of all imports. Other important suppliers to Europe include the United States and India.
Figure 10.3: Seaborne imports of refined petroleum products by country of origin (% tonnes), 2009
Source: Eurostat, 2012
Shipping costs, as approximated by freight rates, represent a small proportion of the final price of petroleum products, accounting for between 0.4 and 1.7% of wholesale prices.
Demand for refined petroleum products is inelastic so changes to prices as a result of the policies considered would be expected to have a minimal effect on demand. There is some potential to substitute imports with EU products, although this is more feasible for some products than others.
In the event of an increase of in the price of refined petroleum products, whether through direct imports or because of a rise in the price of crude petroleum, consumers are likely to fully bear this increase in price for two reasons: as mentioned earlier, elasticity of demand is very low; and the profit margins of EU refineries have deteriorated limiting their ability to absorb costs.
The respective impacts of the policy options are estimated in Table 10.19 after a reminder of the key assumptions underlying our analysis in Table 10.18.
RUSSIA44%
UNITED STATES
8%
INDIA8%
ALGERIA4%
NORWAY4%
LIBYA4%
KUWAIT3%
UAE3%
SAUDI ARABIA2%
ISRAEL2%
VENEZUELA2%
OTHER16%
Support for the impact assessment of a proposal to address maritime transport greenhouse gas emissions
155
Table 10.18: Key figures and assumptions
Variable Assumption
Initial price (€/tonne) 659
Initial total EU demand (Million tonnes) 538
Total consumption (€m) 354,892
Market share of domestic producers 121%*
% seaborne imports 81%
Freight rate per tonne and ad valorem 1.6-6.7 (0.4%-1.7%)
Armington elasticity 0.37
Own price elasticity -0.1 to -0.3
Cost pass through to EU retailers and consumers
100%
Pass through of change in crude oil prices
100%
*This reflects the fact that the EU produces more refined petroleum products than it consumes
Table 10.19: Summary of policy impacts on refined petroleum products by 2030 compared to the baseline
Variable Change in freight rates (€ per tonne
and %)
Resulting change in price per tonne of refined
products (€)*
Resulting change in price per tonne of refined
products as % of total
price
Change in demand for
EU production (€m and %)
Change in consumer
surplus (€m and %)
ETS closed
-€0.2 to €0 (-2.4% to -
0.8%)
€0
0% 0 (0%)
0 (0%)
ETS open (free allowances)
-€0.2 to -€0.1 (-7% to -2%)
€0
0% 0 (0%)
0 (0%)
ETS open (full auctioning)
-€0.01 to €0.9
(-0.4% to 6%)
€0 – 0.8 0%-0.06% €0 - €196m (0%-0.02%)
-€34 to €0 (-0.01% to
0%)
Emissions tax (low) -€0.03 to €0.4
(-0.8% to 5.6%)
€0 – 0.8 0%-0.06% €0 - €181m (0%-0.02%)
-€32 to €0 (-0.01% to
0%)
Emissions tax (high)
€1.6 to €8 (94% to 111%)
€2.7 – 14 0.25%-1% €661m- €3,326m
(0.1%-0.4%)
-€584 to -€145
(-0.1% to 0%)
Target-based compensation fund
-€0.01 to €0.9
(-0.4% to 6%)
€0 – 0.8 0%-0.06% €0 - €196m (0%-0.02%)
-€34 to €0 (-0.01% to
0%)
Contribution-based compensation fund
-€0.03 to €0.4
(-0.8% to 5.6%)
€0 – 0.8 0%-0.06% €0 - €181m (0%-0.02%)
-€32 to €0 (-0.01% to
0%)
*This combines increase in European price of crude oil estimated above and the increase in the price of imports of refined petroleum products
As with crude oil, the first two ETS options are expected to lead to a decrease in freight rates, up to a 7% reduction under the open ETS. These decreases equate to small amounts in absolute terms - up to €0.2 per tonne. As these savings are assumed to be retained by
Support for the impact assessment of a proposal to address maritime transport greenhouse gas emissions
156
ship operators, these policy options would not have any impacts on the price of refined petroleum products or therefore on domestic production or the consumer surplus.
Under the open ETS (full auctioning), low tax and compensation funds, impacts could range from a small drop in freight rate to a rise of 6% depending on the route considered. This increase as well as the small increase in the cost of crude oil could lead to higher prices for refined petroleum products, although the rise would be small. As a result of this, imports could reduce slightly (up to -0.02%) to the benefit of domestic production. This could amount to an additional €196m of demand for EU production under the open ETS (full auctioning) and target-based compensation fund policies. Finally, as European consumers would be likely to bear the brunt of the impacts on the refined petroleum industry, it is expected that these policy options could lead to a small loss of €34m in consumer surplus compared to the baseline, although it must be stressed that this is negligible in relative terms.
Modal shift: It is also worth bearing in mind that the cost of transporting refined products by sea tankers on long distances is much lower compared to other modes. The cost of sea transport is approximately 65% of the cost of transporting by rail and 4% of the cost of transporting it by road. It is therefore unlikely that any potential increases in freight rates would lead to significant modal shift.
10.3.5.4 Natural gas
The EU is heavily dependent on imports of natural gas. Natural gas represented 28.5% of the primary energy demand in the EU in 2009 and is projected to remain the fastest growing fuel in the EU-25 energy system, together with renewable energies, growing at rates three times faster than overall energy needs (1.7% per year) up to 2030.
Modal shift: Natural gas is mainly transported in gaseous form by pipeline from Russia, Northern Africa and Norway, whereas shipping accounts for 38% of imports to the EU 27. However, gas disputes between Russia and Ukraine have exposed the EU to the risks of its heavy dependence on pipeline gas from Russia and have spurred a search for alternatives such as building new pipelines to diversify sources of energy and increasing the EU's use of liquefied natural gas (LNG) transported by sea. The use of LNG therefore has strategic advantages, but is more expensive than natural gas transported by pipeline. This, and the fact that building new pipelines takes time and is expensive, means that natural gas imported by sea cannot simply be replaced by pipeline imports should a rise in shipping costs occur.
Most imports by sea (90%) come from a small group of countries, mainly Qatar, Algeria, Nigeria, Norway and Trinidad and Tobago. Spain is the main importer of LNG, with 43% of total EU imports43.
43
Source: Eurostat
Support for the impact assessment of a proposal to address maritime transport greenhouse gas emissions
157
Figure 10.4: Mode of transport of natural gas imports to the EU per main importer, 2010 (tonnes)
Source: Eurostat, 2012
Shipping costs represent a significant proportion of the final price of natural gas, between 4% and 20%. However, it is worth bearing in mind that a large number of factors influence the final price of LNG: the main drivers of LNG prices include supply and demand dynamics, oil price and contract agreements. Nevertheless shipping costs are still fairly important so variations in transport costs can have some, albeit limited, impact on the price of LNG.
Demand for natural gas is relatively inelastic, especially in the short and medium term.
Given the high dependency on imports and limited production of natural gas in Europe, the possibility to substitute seaborne imports with domestic natural gas is very limited.
The market for natural gas is heavily concentrated. In addition, growing demand from other parts of the world, particularly in Asia, further enhances the market power of producers and their ability to pass possible cost increases onto consumers. Indeed, there has been a shift in the natural gas market towards the domination by a small number of large and well-established international industry players, with a high ability to set prices and pass costs through to consumers. Consequently, it might be expected that any possible cost increases are fully passed on to consumers.
The respective impacts of the policy options are estimated in
Table 10.21 after a reminder of the key assumptions underlying our analysis in Table 10.20. It must be pointed out that our analysis has been undermined by the unavailability of accurate data on price and freight rates for LNG tankers (freight rate estimates presented below relate to liquid bulk).
Support for the impact assessment of a proposal to address maritime transport greenhouse gas emissions
158
Table 10.20: Key figures and assumptions
Variable Assumption
Initial price (€/tonne) 322
Initial total EU demand (Million tonnes) 339.925
Total consumption (€m) 109,457
Market share of domestic producers 17%
% seaborne imports 38%
Freight rate per tonne and ad valorem 16-85 (4%-20%)
Armington elasticity 0.37
Own price elasticity -0.5
Cost pass through to EU processors 75%
Cost pass through to consumers 75%
Table 10.21: Summary of policy impacts by 2030 on the natural gas sector
Variable Change in freight rates (€ per tonne
and %)
Resulting change in price per tonne of
natural gas (€)
Resulting change in price per tonne of
natural gas as % of total
price
Change in demand for
EU production (€m and %)
Change in consumer
surplus (€m and %)
ETS closed
-€1.8 to -€0.3 (-2% to -1.4%)
€0 0% 0% €0 (0%)
ETS open (free allowances)
-€1.3 to -€0.3 (-1.5% to –
1.4%)
€0 0% 0% €0 (0%)
ETS open (full auctioning)
€1-€6 (6%)
€0.6-€3.2 0.1%-0.5% €10-€54 (0.1%-0.2%)
-€263 to -€81
(-0.2% to -0.1%)
Emissions tax (low)
€1-€5 (6%)
€0.6-€3 0.1%-0.4% €9-€50 (0.1%-0.2%)
-€244 to -€75
(-0.2% to -0.1%)
Emissions tax (high)
€18-€94 (100%)
€10-€53 2.4%-7.3% €168-€877 (0.9%-2.7%)
-€4,252 to -€1,355
(-2.7% to -1%)
Target-based compensation fund
€1-€6 (6%)
€0.6-€3.2 0.1%-0.5% €10-€54 (0.1%-0.2%)
-€263 to -€81
(-0.2% to -0.1%)
Contribution-based compensation fund
€1-€5 (6%)
€0.6-€3 0.1%-0.4% €9-€50 (0.1%-0.2%)
-€244 to -€75
(-0.2% to -0.1%)
Under the open and closed ETS, freight rates in 2030 would be between 1.4% and 2% lower compared to the baseline. The assumption is that freight rate reductions are kept by ship operators because elasticity of demand with respect to price is low. As a result, these two options would not have any impact on the price of natural gas and therefore on demand for imports or the consumer surplus.
The other four policy options generate similar results: a significant increase in freight rates which translates into a small increase in prices leading to a modest rise in EU production and
Support for the impact assessment of a proposal to address maritime transport greenhouse gas emissions
159
a minor loss of consumer surplus equivalent to between €75m to €260m.The high tax is included here for completeness but does not represent a realistic policy option.
10.3.5.5 Iron ores
The markets for iron ores, iron and steel are different but closely related and dependent on one another. Iron ores are almost exclusively used for the production of steel and iron, for which they are the principal component (iron ores constitute 98% of the material content of steel). This section, along with the next two, should therefore be read with this in mind.
Europe is heavily dependent on extra-EU imports of iron ores: it consumes almost 100 million tonnes per annum, approximately 82% of which is imported from outside the EU. At the same time, it only produces around 24 million tonnes per annum. Europe is not a large producer of iron ores which means that self-supply is limited and imports from third countries are essential to supply European manufacturers and steel makers.
Shipping is critical to the trade in iron ores: 83% of extra EU imports are transported by sea. The most important supplier of iron ores to the EU 27 by far is Brazil, which accounts for 60% of seaborne imports (in terms of both value and volume). Canada is placed second, accounting for just under a fifth of iron ores shipped to Europe.
Figure 10.5: Seaborne imports of iron ores by country of origin (% tonnes), 2009
Source: Eurostat
The ad valorem of transport in the price of iron ore is likely to be high. Definitive estimates have not been found, but data from a range of sources suggest that transport would account for a high share of its price as iron ores are a low value commodity.
The nature of iron ores as a raw material means that the price elasticity of demand is low. In addition, given the small reserves in the EU, substitution of imports by domestic production would be very limited.
With regards to market structure, the production of iron ores is very concentrated with the top three producers accounting for 60-70% of global iron ore trade. In addition to this very high concentration of trade in the hands of a small number of firms, other factors which have already been analysed (i.e. the low price elasticity of demand and the absence of realistic substitutes to iron ores and its transport by sea) suggest that an increase in the price of iron ores will largely be passed on to iron and steel makers.
The respective impacts of the policy options are estimated in Table 10.23 after a reminder of the key assumptions underlying the analysis in Table 10.22.
60%19%
6%
5%
3%2%2%2%
BrazilCanada
Mauritania
South AfricaRussia
AustraliaNorway
Other
Support for the impact assessment of a proposal to address maritime transport greenhouse gas emissions
160
Table 10.22: Key figures and assumptions
Variable Assumption
Initial price (€/tonne) 127
Initial total EU demand (Million tonnes) 97
Total consumption (€m) 12,300
Market share of domestic producers 18%
% seaborne imports 83%
Freight rate per tonne 2.8-4.5
Own price elasticity -0.18
Armington elasticity 0.533
Cost pass through to EU steelmakers 100%
Table 10.23: Summary of policy impacts on iron ores by 2030 compared to the baseline
Variable Change in freight rates (€ per tonne and
%)
Resulting change in
price per tonne of iron ore (€)
Resulting change in price
per tonne of iron ore as % of total price
Change in demand for EU production (€m
and %)
ETS closed
-€0.2 to €0.1 (-4.6% to 3.3%)
€0 - €0.1 0% - 0.1% €0m-€1m (0% to 0.04%)
ETS open (free allowances)
-€0.3 to €0.1 (-5.3% to 2.8%)
€0 - €0.1 0% - 0.1% €0m-€1m (0% to 0.04%)
ETS open (full auctioning)
€0.1 to €0.4 (2.6% to 12%)
€0.1 - €0.4 0.1% - 0.3% €1m-€3m (0.1% to 0.2%)
Emissions tax (low)
€0.1 to €0.4 (2% to 11%)
€0.1 - €0.4 0.1% - 0.3% €1m-€3m (0.1% to 0.2%)
Emissions tax (high)
€4 to €5.2 (107% to 130%)
€2 - €5.2 3% - 4% €34m-€45m (1.6% to 2.2%)
Target-based compensation fund
€0.1 to €0.4 (2.6% to 12%)
€0.1 - €0.4 0.1% - 0.3% €1m-€3m (0.1% to 0.2%)
Contribution-based compensation fund
€0.1 to €0.4 (2% to 11%)
€0.1 - €0.4 0.1% - 0.3% €1m-€3m (0.1% to 0.2%)
A range of effects are possible from the implementation of the open (free allowances) and closed ETS depending on routes: from a decrease of around 5% in freight rates to an increase of around 3%. Reductions in shipping costs would be kept by shipping operators (i.e. actual freight rates paid by customers would not be reduced in response to reductions in costs experienced by vessel operators) because of the low price elasticity of iron ores. In the case of an increase, EU steelmakers would bear the full impact, however this is only estimated to amount to €0.1 per tonne. The level of substitution of imports by domestic production would therefore be marginal, amounting to up to €1m at the most.
The other options result in higher freight rates than the baseline by 2030. This would translate into iron prices higher by 0.1% to 0.3%. The impact on imports and EU producers would be minimal.
The impact on the final consumer of this small increase in iron ores is not calculated here as supply chain relationships are too complex but the next sections explore the ability of European steelmakers to pass costs through to manufacturers and finally consumers.
10.3.5.6 Iron and steel
Crude steel and pig iron are derived from iron ores. They are in turn used to make steel products which act as components in a wide range of products. The EU is self-sufficient with regards to iron and steel i.e. domestic production broadly meets domestic consumption.
Support for the impact assessment of a proposal to address maritime transport greenhouse gas emissions
161
However, it is important to bear in mind that this self-sufficiency relies on importing large quantities of iron ores as raw material.
Europe is a net importer of pig iron and crude steel, although quantities are small: in 2009, the EU 27 imported 4.5m tons of pig iron and 225,000 tons of crude steel while it exported 403,000 tonnes and 91,000 tonnes respectively (Eurostat).
Shipping is critical to this trade: 88% of extra-EU imports are transported by sea. The main supplier of pig iron to the EU 27 by sea is Russia, followed by Trinidad & Tobago and the Ukraine.
Figure 10.6: Seaborne imports of pig iron by country of origin (% tonnes), 2009
Source: Eurostat
Shipping costs account for a small but not insignificant proportion of the price of iron and steel, between 3-4% according to the OECD Maritime Transport Cost database.
Demand for iron and steel is assumed to be relatively inelastic as substitute materials are not widely available.
The global market for iron and steel is more dispersed than the one for iron ores. In addition, the EU is a large market which imports steel from a wide range of countries. Overseas steelmakers are also competing with domestic steelmakers who will be less affected by any policy to reduce GHGs from shipping. This means that overseas steelmakers have limited market power, restricting their ability to pass costs through to their customers in Europe.
The respective impacts of the policy options are estimated in Table 10.25 after a reminder of the key assumptions underlying the analysis in Table 10.24.
Table 10.24: Key figures and assumptions
Variable Assumption
Initial price (€/tonne) 386
Initial total EU demand (Million tonnes) 238
Total consumption (€m) €91,714
Market share of domestic producers 98%
% seaborne imports 88%
Freight rate per tonne and ad valorem 2.2-9.8 (3-4%)
Own price elasticity -0.57
Armington elasticity 0.533
Cost pass through to EU steelmakers 50%
45%
11%
10%
8%
7%
3%
4%
4%
3%2%
5%
Russia
Trinidad & Tobago
Ukraine
South Africa
Norway
Others
Venezuela
Libya
CanadaBrazil
Support for the impact assessment of a proposal to address maritime transport greenhouse gas emissions
162
Variable Assumption
Pass through of pig iron price increase 100%
Table 10.25: Summary of policy impacts on iron and steel by 2030 compared to the baseline
Variable Change in freight rates (€ per tonne and
%)
Resulting change in
price per tonne of iron & steel
(€)
Resulting change in price
per tonne of iron & steel as % of total price
Change in demand for EU production (€m
and %)
ETS closed
-€0.6 to €0.1 (-5.5% to 5.5%)
€0-€0.1 0% -0.02% €0-€9m (0%)
ETS open (free allowances)
-€0.6 to €0.1 (-5.4% to 4.5%)
€0-€0.05 0% €0-€8m (0.01%)
ETS open (full auctioning)
€0.25-€0.3 (2%-14%)
€0.1-€0.2 0.02%-0.05% €15m - €28m (0.01%-0.02%)
Emissions tax (low)
€0.2-€0.3 (2%-14%)
€0.1-€0.2 0.02%-0.04% €12m - €27m (0.01%-0.02%)
Emissions tax (high)
€3-€11 (100%-136%)
€1.8-€4 0.5%-1% €282m to €624m (0.25% to 0.55%)
Target-based compensation fund
€0.25-€0.3 (2%-14%)
€0.1-€0.2 0.02%-0.05% €15m - €28m (0.01%-0.02%)
Contribution-based compensation fund
€0.2-€0.3 (2%-14%)
€0.1-€0.2 0.02%-0.04% €12m - €27m (0.01%-0.02%)
Depending on the routes, an ETS – closed or open with free allowances - may lead to a drop in freight rates of around 5.5% (-€0.6 per tonne) or a rise in freight rates of up to 5.5% (€0.1 per tonne). A decrease would be absorbed by ship operators and an increase would be only partially passed on to EU steelmakers. As a result, the final impact on prices would be negligible and therefore no significant effect on imports and EU producers would occur.
Under the other policy options (excluding the extreme scenario of the high tax), freight rates are expected to rise by up to €0.3 resulting in an increase in the price of iron and steel per tonne of €0.1 to €0.2. This would lead to a minimal transfer of imports to domestic production, equivalent to €12m to €28m.
As iron ores are transported in large dry bulkers over long distances, an increase in freight rates is unlikely to lead to a modal shift as shipping remains the most economical mode of transport.
The impact on the final consumer of the changes in the prices of iron ores and iron and steel are estimated in the next section.
10.3.5.7 Steel products
Steel products include: steel sheets, plates, hoop and strip, bars, sections, wide rod, tubes, pipes, iron and steel castings. They are used in a wide range of industries including structural engineering, ship building, car manufacturing and general industrial applications (e.g. machinery). Steel is a core component in a myriad of everyday products - from household items such as fridges and washing machines, to cars, buses, trains and the steel girders used in most office buildings.
Europe is not reliant on imports of steel products: in 2010 imports represented 13% of EU consumption. On the other hand, it is a net exporter of steel and iron products and as such this is an important sector of activity to the economy.
Shipping is by far the main transport mode for imports: 76% of all imports travel by sea. The main routes for steel products come from Russia, Ukraine and China which together account for 60% of volumes transported by sea to Europe.
Support for the impact assessment of a proposal to address maritime transport greenhouse gas emissions
163
Figure 10.7: Seaborne imports of steel products by country of origin (% tonnes), 2009
Source: Eurostat
The relative importance of transport costs in the price of steel products is small but not insignificant. It ranges from 1% to 7% on the longer routes.
According to research carried out by the UK Department of Energy and Climate Change (DECC), demand for steel products is assumed to be elastic. However, the estimates are acknowledged as not being very robust so the results of the quantitative analysis should be read with caution.
The market for steel products is less concentrated than for iron ores and competition is stronger, meaning that steel products manufacturers are less able to pass costs through to their customers and onwards to consumers.
The respective impacts of the policy options are estimated in Table 10.27 after a reminder of the key assumptions underlying our analysis in Table 10.26.
Table 10.26: Key figures and assumptions
Variable Assumption
Initial price (€/tonne) 547
Initial total EU demand (Million tonnes) 209
Total consumption (€ m) €114,239
Market share of domestic producers 87%
% seaborne imports 76%
Freight rate per tonne and ad valorem 5.4-38.6 (1.0%-7.3%)
Own price elasticity -1.43
Armington elasticity 0.229-2.43
Pass through of changes to iron and steel
50%
Cost pass through to EU manufacturers 50%
Cost pass through to EU consumers 25%
25%
19%
18%
8%
5%
4%
4%
18%Russia
Ukraine
China
Turkey
Korea
India
Brazil
Other
Support for the impact assessment of a proposal to address maritime transport greenhouse gas emissions
164
Table 10.27: Summary of policy impacts on steel products by 2030 compared to the baseline
Variable Change in freight
rates (€ per tonne and
%)
Resulting change in price per
tonne of steel products (€)
Resulting change in price per
tonne of steel products as
% of total price
Change in demand for
EU production (€m and %)
Change to consumer
surplus (€m and %)
ETS closed
-€4.5 to €0.4
(-11% to 5.5%)
-€0.6 to €0.01 -0.08% to 0% -73 to 1 (-0.04% to
0%)
0 to 8 (0% - 0.03%)
ETS open (free allowances)
-€4.4 to €0.3
(-11% to 4.5%)
-€0.6 to €0.01 -0.08% to 0% -72 to 1 (-0.04% to
0%)
0 to 8 (0%-0.03%)
ETS open (full auctioning)
-€1 to €1.6 (-4% to 14%)
-€0.2 to €0.02 -0.03% to 0% -25 to 3 (-0.01% to
0%)
0 to 3 (0% to 0.01%)
Emissions tax (low)
-€1.8 to €1 (-4% to 14%)
-€0.2 to €0.02 -0.03% to 0% -28 to 3 (-0.02% to
0%)
0 to 3 (0% to 0.01%)
Emissions tax (high)
€9 to €34 (81% to 136%)
€0.2 to €0.5 0.03% to 0.07%
29 to 54 (0.02% to
0.04%)
-7 to -3 (-0.03% to -
0.01%)
Target-based compensation fund
-€1 to €1.6 (-4% to 14%)
-€0.2 to €0.02 -0.03% to 0% -25 to 3 (-0.01% to
0%)
0 to 3 (0% to 0.01%)
Contribution-based compensation fund
-€1.8 to €1 (-4% to 14%)
-€0.2 to €0.02 -0.03% to 0% -28 to 3 (-0.02% to
0%)
0 to 3 (0% to 0.01%)
It is estimated that the closed ETS and ETS with free allowances could lead to a significant reduction in freight rates, amounting to over €4 or 11% compared to the baseline by 2030. Based on our assumptions with regards to price elasticity, some of this decrease would be passed on by shipping operators to their customers, leading to a drop of €0.6 in the price of steel products per tonne. This would benefit importers, making their products more competitive on the internal market and resulting in a boost of up to €73m. It would also benefit consumers with the surplus expanding by €8m. On other routes however, these options would result in a small increase in freight rates. As steel products are price elastic, it is assumed that this would not be passed on. However, part of the increase in iron and steel prices on the EU market would filter through leading to an small increase in price of €0.05. These changes in prices may lead to a drop in imports and a small reduction in consumer surplus.
For the other policy options (excluding the high tax), impacts on freight rates may be positive or negative, although with a smaller decrease and larger increase than under the closed ETS and open ETS with free allowances. This means that if freight rates drop, domestic consumers would lose comparatively less than under these options, and they would gain comparatively more should freight rates rise. It also means however the potential benefits in terms of consumer surplus would be reduced.
In relative terms however, the impacts under all the options except the high tax are very minor.
10.3.5.8 Wearing apparel
In 2010, Europe imported €768.8.7bn worth of wearing apparel and exported €4.618.6bn. The EU continues to play a big role by dominating global markets for high quality textiles and
Support for the impact assessment of a proposal to address maritime transport greenhouse gas emissions
165
clothing (European Commission, 2011). However, imports from China are still increasing and the EU relies on imports for a large share of its consumption.
Because of the lengthy routes and low value of goods, shipping provides an attractive mode of transport for cheaper imports; it accounts for 54% of the total.
The EU relies heavily on a small number of trade partners in Asia for its wearing apparel imports, particularly China (50%), Bangladesh (12%), India (6%) and Turkey (5%). In fact, the EU’s dependence on seaborne imports from South East Asia has grown over the last decade.
Figure 10.8: Seaborne imports of wearing apparel by country of origin (% tonnes), 2010
Source: Eurostat
Demand in the EU for wearing apparel is not very elastic but the rate of substitution between imported and domestically produced goods is potentially high.
Transport costs for wearing apparel account for between 0.1% and 1.95% of the price. This means that effects on the final price are likely to be small.
The production of wearing apparel, both overseas and in Europe, is a highly competitive market with large numbers of companies involved, which limits market power and the ability to pass costs on.
The respective impacts of the policy options are estimated in Table 10.29 after a reminder of the key assumptions underlying our analysis in Table 10.28.
Table 10.28: Key figures and assumptions
Variable Assumption
Initial price (€/tonne) 43,909 (imports)
Initial total EU demand (Million tonnes) 0.78
Total consumption (€ m) €81,388
Market share of domestic producers 15%
% seaborne imports 46%
Freight rate per tonne and ad valorem 37-99 (0.1%-1.95%)
Own price elasticity -0.68
Armington Elasticity 1.1 – 2.1
Cost pass through to EU manufacturers 50%
Cost pass through to EU consumers 25%
China50%
BANGLADESH
12%
INDIA6%
TURKEY5%
TUNISIA5%
MOROCCO4%
VIET-NAM2%
Other16%
Support for the impact assessment of a proposal to address maritime transport greenhouse gas emissions
166
Table 10.29: Summary of policy impacts on wearing apparel by 2030 compared to the baseline
Variable Change in freight
rates (€ per tonne and
%)
Resulting change in price per tonne of wearing
apparel (€)
Resulting change in price per tonne of wearing
apparel as % of total price
Change in demand for
EU production (€m and %)
Change to consumer
surplus (€m and %)
ETS closed
-€14 to -€13 (-31% to -
15%)
0 0% 0 (0%)
0 (0%)
ETS open (free allowances)
-€14 to -€10 (-33% to -
11%)
0 0% 0 (0%)
0 (0%)
ETS open (full allocations)
-€11 to -€2 (-26% to -
2%)
0 0% 0 (0%)
0 (0%)
Emissions tax (low)
-€11 to -€2.7
(-26% to -3%)
0 0% 0 (0%)
0 (0%)
Emissions tax (high)
€26 to €87 (62% to
94%)
€3-€11 0-0.01% €1m (0.01%)
0 (0%)
Target-based compensation fund
-€11 to -€2 (-26% to -
2%)
0 0% 0 (0%)
0 (0%)
Contribution-based compensation fund
-€11 to -€2.7
(-26% to -3%)
0 0% 0 (0%)
0 (0%)
All options (except the high emissions tax) would lead to a decrease in freight rates. As mentioned previously, it is assumed that a decrease in freight rates would be retained by the shipping industry and therefore there would be no impact on EU producers and consumers.
10.3.5.9 Grain
Europe is not dependent on imports of grain from outside Europe: domestic production accounts for 83% of EU consumption. The remaining 17% are imported, mostly by sea as shipping account for 86% of imports.
As shown in the chart, EU imports come from a wide range of suppliers, led by the United States, Canada and Brazil. This suggests a dispersed market with low market power to overseas producers, thereby limiting their ability to pass additional costs on to European food processors.
Support for the impact assessment of a proposal to address maritime transport greenhouse gas emissions
167
Figure 10.9: Seaborne imports of grain by country of origin (% value), 2010
Source: Eurostat
The proportion of the final price made up by seaborne transport costs varies significantly in the literature assessed, giving a range of 1% to 37% depending on route and type of grain.
Due to the nature of grain as a staple and its ties to various food products, it is relatively unresponsive to price changes with price elasticity of demand of -0.035 to -0.297. In addition, as mentioned before, European production is high meaning there is scope to replace imports with EU grain.
The respective impacts of the policy options are estimated in Table 10.31 after a reminder of the key assumptions underlying our analysis in Table 10.30.
Table 10.30: Key figures and assumptions
Variable Assumption
Initial price (€/tonne) 255
Initial total EU demand (Million tonnes) 66
Total EU consumption (€m per annum) 20,176
Market share of domestic producers 83%
% seaborne imports 86%
Freight rate per tonne and ad valorem 4.6-7.3 (1-37%)
Own price elasticity -0.035 to -0.297
Armington elasticity 0.8
Cost pass through to EU processors 50%
Cost pass through to EU retailers and consumers
50%
Table 10.31: Summary of policy impacts on grain by 2030 compared to the baseline
Variable Change in freight
rates (€ per tonne and
%)
Resulting change in price per
tonne of grain (€)
Resulting change in price per
tonne of grain as % of total
price
Change in demand for
EU production (€m and %)
Change to consumer
surplus (€m and %)
ETS closed
-€2.7 to -€0.9
(-34% to -17%)
€0 0% 0 (0%)
0 (0%)
ETS open (free allowances)
-€2.7 to -€1 (-34% to -
22%)
€0 0% 0 (0%)
0 (0%)
UNITED STATES
15%
CANADA15%
BRAZIL10%
THAILAND7%INDIA
5%PAKISTAN
4%
UKRAINE3%
Other41%
Support for the impact assessment of a proposal to address maritime transport greenhouse gas emissions
168
Variable Change in freight
rates (€ per tonne and
%)
Resulting change in price per
tonne of grain (€)
Resulting change in price per
tonne of grain as % of total
price
Change in demand for
EU production (€m and %)
Change to consumer
surplus (€m and %)
ETS open (full auctioning)
-€2.3 to -€0.8
(-28% to -15%)
€0 0% 0 (0%)
0 (0%)
Emissions tax (low)
-€2.3 to -€0.8
(-29% to -15%)
€0 0% 0 (0%)
0 (0%)
Emissions tax (high)
€4 to €4.6 (50% to
90%)
€1-€1.2 0.4% €57-€65 (0.3%)
-€7m to -€6m (-0.05% to -
0.01%)
Target-based compensation fund
-€2.3 to -€0.8
(-28% to -15%)
€0 0% 0 (0%)
0 (0%)
Contribution-based compensation fund
-€2.3 to -€0.8
(-29% to -15%)
€0 0% 0 (0%)
0 (0%)
All policy options (except the extreme scenario of the high emissions tax) would generate a reduction in freight rates for grain on the routes considered compared to the baseline. Given the low elasticity of grain demand, it is assumed that the savings from the decrease in transport cost will be retained by ship operators and that no impact will feed through to the market or consumers.
10.3.5.10 Office and IT equipment
Domestic producers hold a majority share in the EU market for office and IT equipment accounting for 74% of total consumption. Of the 26% which is therefore imported, only 19% is by sea, accounting for just 5% of total consumption.
Whilst the share of seaborne imports is small, it is dominated by countries from South East Asia (92%), in particular China (86%).
Figure 10.10: Seaborne imports of office & IT equipment by country of origin (% value), 2010
Source: Eurostat
CHINA86%
TAIWAN3%
PHILIPPINES2%
JAPAN1%
Other8%
Support for the impact assessment of a proposal to address maritime transport greenhouse gas emissions
169
The weight of shipping in the final price of office and IT equipment is very small, ranging from 0.001% to 0.03% of final prices. This means that a change in price from the policy options is unlikely to have a noticeable impact on consumer prices, even if it is fully passed through.
Office and IT equipment are responsive to changes in prices, although as mentioned above, these changes are unlikely to happen as a result of an increase in the cost of shipping.
The respective impacts of the policy options are estimated in Table 10.33 after a reminder of the key assumptions underlying our analysis in Table 10.32.
Table 10.32: Key figures and assumptions
Variable Assumption
Initial price (€/unit) 500-1,321
Initial total EU demand (Million tonnes) 0.24-0.55
Market size (€ M per annum)44
152,175
Market share of domestic producers 74%
% seaborne imports 19%
Freight rate per tonne and ad valorem 28-60 (0.001-0.03%)
Own price elasticity -0.8 to -1
Armington elasticity 0.659 - 1.494
Cost pass through to EU retailers 50%
Cost pass through to EU consumers 50%
Table 10.33: Summary of policy impacts on office & IT equipment by 2030 compared to the baseline
Variable Change in freight
rates (€ per tonne and
%)
Resulting change in price per tonne of
office equip. (€)
Resulting change in price per tonne of
office equip. as % of total
price
Change in demand for
EU production (€m and %)
Change to consumer
surplus (€m and %)
ETS closed
-€8 to -€4 (-15%)
0 0% 0 (0%)
0 (0%)
ETS open (free allowances)
-€6 to -€3 (-11%)
0 0% 0 (0%)
0 (0%)
ETS open (full auctioning)
-€1.3 to -€0.6
(-2.3%)
0 0% 0 (0%)
0 (0%)
Emissions tax (low)
-€1.6 to -€0.8
(-2.9%)
0 0% 0 (0%)
0 (0%)
Emissions tax (high)
€25 to €53 (94%)
6 - 12 0% €2m - €4m (0%)
0 (0%)
Target-based compensation fund
-€1.3 to -€0.6
(-2.3%)
0 0% 0 (0%)
0 (0%)
Contribution-based compensation fund
-€1.6 to -€0.8
(-2.9%)
0 0% 0 (0%)
0 (0%)
All policy options except the extreme scenario of the high emissions tax are expected to result in lower freight rates compared to the baseline by 2030. Given the elasticity of demand for office and IT equipment, this drop in transport costs will be retained by shipping operators. 44
Estimated as total consumption in 2009 multiplied by oil prices in this year
Support for the impact assessment of a proposal to address maritime transport greenhouse gas emissions
170
10.3.5.11 Motor vehicles
The automotive industry is at the core of European manufacturing and economic competitiveness because of the jobs it supports directly and indirectly; the value it creates along the supply chain and through export revenues; its innovation and research content and their applications beyond the sector. It is also an industry which faces considerable challenges including: competition from other countries; proliferation of models; rising fuel prices; environmental concerns and urban congestion. It is important to bear these in mind and recognize that separating the impact of the policies on the overall demand for motor vehicles will be difficult.
Europe is not reliant on other countries to meet the needs of its internal market: imports represent 8% of total consumption. The bulk of the Extra EU trade for motor vehicles trade is undertaken by sea: 83% of imports travel by ship. The main supplier of motor vehicles to the EU 27 is Japan with 27% of seaborne imports in terms of value. Together with Turkey, these two countries account for half the value of motor vehicles coming into Europe.
Figure 10.11: Seaborne imports of motor vehicles by country of origin (% value), 2010
Source: Eurostat
Overall, freight rates are quite a small proportion of the price of imports from North America and the Mediterranean, as expected for high value goods. For cheaper imports from further afield, the weight of transport rises, potentially to 2% of the retail price.
Demand for cars is estimated to be relatively inelastic, however the Armington elasticity is set at the high level indicating the possibility to substitute an imported model with a domestic model if prices of imports rise.
The market for cars is concentrated, which offers a significant opportunity to pass costs through to consumers. Reports from the industry over the last few years have pointed to a reduction in profit margins in the car industry suggesting a limited ability to bear additional costs. However, other factors limit the level of cost pass through. In particular, while market concentration is high, competition is intense and the number of models in each segment is high. In addition, demand for new cars in Europe has been declining and price elasticity is relatively high. Consequently, a low level of cost pass through is assumed.
The respective impacts of the policy options are estimated in
Table 10.35 after a reminder of the key assumptions underlying our analysis in
27%
25%16%
9%
7%
4%
3% 8%Japan
TurkeyUS
South Korea
Mexico
South Africa
IndiaOther
Support for the impact assessment of a proposal to address maritime transport greenhouse gas emissions
171
Table 10.34.
Support for the impact assessment of a proposal to address maritime transport greenhouse gas emissions
172
Table 10.34: Key figures and assumptions
Variable Assumption
Initial price (€/unit) 9,500-63,994
Initial total EU demand (Million tonnes) 15
Market size (€ M per annum)45
318,433
Market share of domestic producers 92%
% seaborne imports 83%
Freight rate per tonne and ad valorem 37-142 (0.1-2.1%)
Own price elasticity -0.341
Armington elasticity 1.699
Cost pass through to EU retailers 25%
Cost pass through to EU consumers 25%
Table 10.35: Summary of policy impacts by 2030 on the motor vehicles market
Variable Change in freight
rates (€ per tonne and
%)
Resulting change in price per tonne of motor
vehicles (€)
Resulting change in price per tonne of motor
vehicles as % of total price
Change in demand for
EU production (€m and %)
Change to consumer
surplus (€m and %)
ETS closed
-€20 to -€2 (-15% to -
6%)
€0 0% 0 (0%)
0 (0%)
ETS open (free allowances)
-€15 to -€8 (-20% to -
11%)
€0 0% 0 (0%)
0 (0%)
ETS open (full auctioning)
-€5 to -€3 (-12% to -
2%)
€0 0% 0 (0%)
0 (0%)
Emissions tax (low)
-€5 to -€4 (-13% to -
3%)
€0 0% 0 (0%)
0 (0%)
Emissions tax (high)
€48 to -€125
(94% to 117%)
€3 - €31 0.02%-0.07% €148m-€537m (0.04%-0.1%)
0 (0%)
Target-based compensation fund
-€5 to -€3 (-12% to -
2%)
€0 0% 0 (0%)
0 (0%)
Contribution-based compensation fund
-€5 to -€4 (-13% to -
3%)
€0 0% 0 (0%)
0 (0%)
All policy options (except the extreme scenario of the high emissions tax) are expected to result in lower freight rates compared to the baseline by 2030. Given the elasticity of demand for cars, it is assumed that those savings will be retained by shipping operators. This means that there will be no impact on EU producers and consumers under any of the options for the motor vehicle market by 2030.
The extreme scenario of the high emissions tax would lead to an increase in freight rate. However, the very small weight of transport in the final price of cars means that impacts on EU producers would be small and those on EU consumers negligible.
45
Estimated as total consumption in 2009 multiplied by oil prices in this year
Support for the impact assessment of a proposal to address maritime transport greenhouse gas emissions
173
10.3.5.12 Organic chemicals
The chemicals industry is one of the largest European manufacturing sectors, generating 7% of the manufacturing turnover and value added (Eurostat, 2009 figures). The EU is the world’s top exporter and importer of chemicals, accounting for 41% of global trade46 (Cefic, 2011). The chemicals industry consists of a highly heterogeneous product range. Organic chemicals were selected as the focus of this analysis. The organic chemicals sector produces mainly intermediate goods which are delivered to several sectors such as food, refining, pharmaceuticals and automotive sectors.
The EU produces more organic chemicals than it consumes (in value terms) and is able to meet around 66% of its consumption with local production. European exports of organic chemicals tend to be higher value than imports.
Shipping plays a dominant part in the trade of organic chemicals: 75% of EU imports (in volume terms) are transported by sea. The share of seaborne transport is significantly reduced when measuring trade in value terms, which shows the higher value of organic chemicals transported by air and by road.
EU imports are dispersed across a number of suppliers, which shows the high competition levels on this market as well as the diversity of products that are traded under this group. The main importers in value terms are the United States and China, holding close to 50% of the value of imports.
Figure 10.12: Seaborne imports of organic chemicals by country of origin (% value), 2010
Source: Eurostat
The weight of transport in the price of organic chemicals varies depending on the product considered. Organic chemicals include a very large number of products, some high value and some low value. The former will have a low freight rate ad valorem (0-1%) while for the latter it can reach 10-20%. This underlines the need for caution when reading the results of our quantitative analysis below. Freight rates ad valorem are expected to be higher for imports than exports on average, due to the lower average unit cost of imported goods in comparison to exported goods.
The market for organic chemicals is highly competitive with a high demand elasticity to price and a strong potential for substitution of imports by European production.
Concentration on the European market and the market share of local producers is high, affording them considerable power as demonstrated by the significant price increases in organic chemicals for the domestic market over the last few years. This and the fact that imports are spread out across a large number of countries means that overseas producers have limited power and a reduced ability to pass costs through.
46
This includes intra-EU trade.
23%
22%
7%7%
5%
5%
4%
27%
US
China
SingaporeIndia
Saudi Arabia
Japan
Norway
Others
Support for the impact assessment of a proposal to address maritime transport greenhouse gas emissions
174
The respective impacts of the policy options are estimated in Table 10.37 after a reminder of the key assumptions underlying our analysis in Table 10.36.
Table 10.36: Key figures and assumptions
Variable Assumption
Initial price (€/tonne) 2,205-4,032
Initial total EU demand (Million tonnes) 86
Market size (€ M per annum)47
95,974
Market share of domestic producers 107%
% seaborne imports 83%
Freight rate per tonne and ad valorem 50-70
Own price elasticity -3.9
Armington elasticity 1
Cost pass through to EU industry 25%
Cost pass through to EU consumers 25%
Table 10.37: Summary of policy impacts by 2030 on the organic chemicals market
Variable Change in freight
rates (€ per tonne and
%)
Resulting change in price per tonne of organic
chemicals (€)
Resulting change in price per tonne of organic
chemicals as % of total
price
Change in demand for
EU production (€m and %)
Change to consumer
surplus (€m and %)
ETS closed
-€2 to -€0.7 (-2.6% to -
1.2%)
-€0.1 to -€0.04 0% -2 to -1 (0%)
0 (0%)
ETS open (free allowances)
-€1.7 to -€0.7
(-2.1% to -1.2%)
-€0.1 to -€0.04 0% -1 (0%)
0 (0%)
ETS open (full auctioning)
€3 - €4 (5% to 6%)
€0 0% €0 (0%)
0 (0%)
Emissions tax (low)
€3-€4 (5% to 6%)
€0 0% €0 (0%)
0 (0%)
Emissions tax (high)
€56-€61 (78% to 102%)
€0 0% €0 (0%)
0 (0%)
Target-based compensation fund
€3 - €4 (5% to 6%)
€0 0% €0 (0%)
0 (0%)
Contribution-based compensation fund
€3-€4 (5% to 6%)
€0 0% €0 (0%)
0 (0%)
An ETS, either open with free allowances or closed with free allowances, would likely result in lower freight rates in 2030 compared to the baseline. Given the high elasticity of demand for organic chemicals, it is assumed that some of these savings would be passed on to the market and would translate into lower prices. However, the drop in prices is likely to be limited leading only to small contraction in demand for EU production, amounting to €1m or €2m. A low level of cost pass through to consumer is applied and as a result, the changes in prices are not likely to have any impact on EU consumers.
The open ETS with full allocation, low tax and compensation funds are likely to result in increases in freight rates, although these are much smaller. Because of the high price
47
Estimated as total consumption in 2009 multiplied by oil prices in this year
Support for the impact assessment of a proposal to address maritime transport greenhouse gas emissions
175
elasticity of demand for chemicals, it is assumed that this rise in costs will not be passed on to EU processors and as a result there will be no impact on the market.
A number of factors must be borne in mind however when reading these estimates:
They are based on a number of assumptions and often limited data and should therefore be taken as orders of magnitude rather than actual estimates.
Organic chemicals cover a very wide range of products of different values, profiles and trade characteristics. These nuances cannot be taken into account in this analysis.
The price of organic chemicals will also be influenced by the impact of the policies on the price of fuel including crude oil and natural gas: around 95% of organic products are obtained from oil and gas. However, as seen earlier, the impacts of the policies on these commodities are expected to be relatively small.
10.3.5.13 Conclusions
The analysis of selected commodities shows that the options can be split into two groups:
The first group comprises the closed ETS and open ETS with free allowances. These two options consistently lead to lower freight rates than the baseline in 2030. In most cases those savings are retained by shipping operators and there is no impact on EU producers or consumers. Where increases in freight occur, they are smallest under these two options.
The second group is composed of the open ETS with full auctioning; the target-based compensation fund (which use the same modelling approach as the ETS with full auctioning); the emissions tax (low tax rate); and the contribution-based compensation fund which follows the same model as the emissions tax. The effects of these four options tend to be broadly similar. For consumer goods (wearing apparel, motor vehicles, office and IT equipment), they result in reductions in freight rates with no impact on EU producers and consumers. For energy resources and raw materials, these options can generate effects ranging from a small drop in freight rates to an increase of up to 15%. In all cases however, this does not translate into a perceptible impact on EU producers and consumers.
It is important to bear in mind that, even under the extreme scenario of the emissions tax using high tax rates, the impact on commodities prices remains moderate. It is also important to stress that the drop in freight costs was, in many cases, not considered as being passed through.
10.3.6 Economic impacts on EU regions heavily dependent on shipping
While sea transport is critical to the competitiveness and economic operation of the EU as a whole, shipping activity is concentrated in specific regions and countries. The presence of a freight and/or passenger port attracts a range of shipping-related activities, creating a cluster of businesses and jobs which in turn support the local economy through their spend in goods and services. In this section the parts of the EU 27 which are likely to be most affected by changes in the shipping sector have been identified. These include countries and regions which rely heavily on sea transport:
To import the raw materials necessary for their domestic industries. Any change in cost may feed through the supply chain and translate into lower or higher prices for domestically manufactured products, altering their competitiveness on global markets.
To import finished goods and meet the demand of domestic consumers. A change in cost may alter choice in these markets and lead to variations in retail prices. This may be beneficial if freight rates decline and savings are passed on but it could be detrimental in the case of rises.
To export products and services (including tourism) to other parts of Europe and the world. This in turn generates revenues and supports local jobs. Any change in cost will affect the competitiveness of these products and services on global markets.
Support for the impact assessment of a proposal to address maritime transport greenhouse gas emissions
176
As a major mode of transport for commuters, business visitors or tourists. Any change in cost may affect the competitiveness of sea transport where alternative modes are available, and as result of coastal areas and islands as tourist destinations.
As a significant source of jobs and revenues.
In order to cover all these factors, freight activity has been examined first and passenger transport activity second, both at national and NUTS2 region level, using data on trade and traffic from Eurostat and IHS data.
10.3.6.1 Freight
In 2009, 3.4 billion tonnes of goods where handled (loaded and unloaded) in European ports48. As seen below, the main countries handling goods are the UK (15% of total), the Netherlands (14%), Italy (14%) and Spain (11%); together they account for over half the EU27 total.
Figure 10.13: Proportion of gross weight of goods handled in EU 27 ports, by country, 2009
Source: Eurostat
However while the chart above conveys the spatial distribution of goods handled through the EU, it does not communicate the importance of shipping to the individual national and regional economies.
10.3.6.2 Exposed countries
In order to determine national reliance on shipping, the importance of international trade (extra- and intra-EU exports and imports) to each country’s economy was first estimated. The countries where a high proportion (above EU average) of international trade is undertaken by sea were then identified.
10.3.6.2.1 International trade intensity
In 2010, the EU27 exported €3.88 trillion and imported €3.92 trillion worth of products and services. Intra EU trade amounted to 65% of exports and 62% of imports.
Germany accounted for the lion’s share of this activity, with 24% of extra EU trade and 22% of intra EU trade. The UK, Italy, the Netherlands, Belgium and France followed in varying order depending on whether Extra EU or Intra EU trade is considered.
48
Eurostat
15%
14%
14%
11%9%
8%
6%
5%
4%
3%3%
2%2%
1%
United Kingdom
Netherlands
Italy
Spain
France
Germany
Belgium
Sweden
Greece
Finland
Denmark
Portugal
Latvia
Poland
Ireland
Estonia
Romania
Lithuania
Bulgaria
Slovenia
Cyprus
Malta
Support for the impact assessment of a proposal to address maritime transport greenhouse gas emissions
177
Total exports and imports each represent 31% of the EU 27 Gross Domestic Product. However as illustrated below there are considerable variations across Europe, with some economies being more self-contained than others.
At the top end are Northern and Eastern European countries. For instance, in Belgium, exports and imports together amount to 163% of the GDP. At the other end of the spectrum are Mediterranean countries and the UK where international trade tends to represents a much smaller proportion of GDP i.e. below 50%.
Figure 10.14: International trade by Member State as % of Gross Domestic Product, 2010
Source: Eurostat
10.3.6.2.2 Reliance on sea transport for international trade
Extra-EU trade by sea
In the EU27, three quarters of extra-EU imports and exports are transported by sea and they account for half the total value of traded goods.
As can be seen in Figure 10.15, this proportion is much higher for island countries such as Malta, Ireland, Cyprus and the UK. In these countries, between 90% and 100% of extra-EU trade is undertaken through shipping. When taking the value of this trade into account however, differences appear: in Cyprus and Greece, trade by sea accounts for most of the value of imports and exports; in Malta it accounts for 55% of the country total; and in Ireland for 30%. In other words, even within these island countries, some would be more affected than others by a change in the cost of shipping.
Another category of countries with a high proportion of trade transported by sea are countries on the Atlantic Coast – Portugal, Spain and Denmark. Due to their geographical locations, these countries are often the first ports of call in Europe for ships coming from the Americas, and sometimes Africa.
Support for the impact assessment of a proposal to address maritime transport greenhouse gas emissions
178
Figure 10.15: % volume of Extra EU trade (imports + exports) by sea as a proportion of the total, 2010
Source: Eurostat
Intra EU trade by sea
As with extra EU trade, any change in shipping costs will disproportionately affect countries which rely on sea transport rather than other modes to transport in order to import and export products and services. This is an important element to grasp, as for all EU 27 countries, intra-EU trade is greater than extra-EU trade.
The intra-EU trade profile of EU 27 countries is similar to their profile for total trade; at the top end are Northern and Eastern Europe countries. For instance, in Belgium, intra-EU trade amounts to 116% of GDP. On the other end, intra-EU trade represents a much smaller proportion of GDP in Mediterranean countries and the UK.
Figure 10.16: Intra-EU trade by Member State as % of Gross Domestic Product, 2010
Source: Eurostat
Eurostat does not provide intra-EU trade data by sea. However, IHS Fairplay provided estimates which indicated that 466m tons of goods were traded by sea inside the EU27 in
Support for the impact assessment of a proposal to address maritime transport greenhouse gas emissions
179
2010. Comparing IHS Fairplay data with Eurostat data has allowed the proportion of total intra-EU imports accounted for by seaborne intra-EU imports to be estimated. Based on this comparison, Malta, Ireland, Cyprus, the UK and Scandinavian countries stand out as particularly dependent on sea transport for intra-EU trade. These figures are in line with the analysis on extra-EU trade and make sense as these countries are islands or have long coastlines.
Figure 10.17: Intra-EU imports by sea % of total intra EU imports, 2010
Source: IHS, Eurostat
10.3.6.2.3 Levels of exposure to changes in shipping costs
In order to identify which countries across the EU are likely to be most affected by changes in the cost of shipping, a series of indicators has been combined. Country exposure can manifest itself through a loss of competitiveness on the global market as a result of more expensive exports or through reduced competition and standard of living as a result of more expensive imports. It can also be beneficial should the policy result in a drop in freight rate although this is likely to be smaller as in most cases cost savings would be retained by shipping operators.
Ireland (below) is an example of a very exposed country, with a high ratio of sea freight per capita. It is higher than average levels of international trade and a higher than average proportion of this trade, both intra and extra EU, is undertaken through shipping.
0%
10%
20%
30%
40%
50%
60%
70%
80%
90%
Mal
ta
Irel
and
Cyp
rus
Fin
lan
d
Swed
en
Un
ited
Kin
gdo
m
Esto
nia
Net
her
lan
ds
Den
mar
k
Gre
ece
Lith
uan
ia
EU 2
7
Spai
n
Ger
man
y
Latv
ia
Slo
ven
ia
Bu
lgar
ia
Bel
giu
m
Ital
y
Ro
man
ia
Fran
ce
Po
rtu
gal
Po
lan
d
Au
stri
a
Hu
nga
ry
Cze
ch R
epu
blic
Slo
vaki
a
Luxe
mb
ou
rg
Support for the impact assessment of a proposal to address maritime transport greenhouse gas emissions
180
Figure 10.18: Trade and shipping indicators for Ireland, indexed to EU 27 average, 2009
Produced by Ricardo-AEA with data from Eurostat
As seen above, Ireland’s share of extra-EU imports and exports by sea is 30% higher than the EU 27 average and the weight of exports in GDP is 80% higher than the average. The proportion of intra EU trade undertaken by shipping is also above average, especially for imports. This type of country will be most exposed to changes in the cost of shipping.
At the other end of the spectrum are countries like Poland (below) with a scarce use of sea transport.
Figure 10.19: Trade and shipping indicators in Poland, indexed to EU 27 average, 2009
Produced by Ricardo-AEA with data from Eurostat
0.0
0.5
1.0
1.5
2.0
2.5
3.0
3.5
4.0
4.5
Tonnes per capita
Exports as % GDP
Imports as % GDP
Extra EU imports by sea as % of totExtra EU exports by sea as % of tot
Intra EU imports by sea as % of tot
Intra EU exports by sea as % of tot
Ireland EU 27 average
0.0
0.2
0.4
0.6
0.8
1.0
1.2
Tonnes per capita
Exports as % GDP
Imports as % GDP
Extra EU imports by sea as % of totExtra EU exports by sea as % of tot
Intra EU imports by sea as % of tot
Intra EU exports by sea as % of tot
Poland EU 27 average
Support for the impact assessment of a proposal to address maritime transport greenhouse gas emissions
181
Between these two categories, there is a range of situations reflecting the geographical location of countries, their preferred trade relationships within and outside Europe and their reliance on shipping. Based on this analysis, EU countries have been classified into four broad groups:
Most exposed countries: those with high levels of international trade and heavily reliant on shipping to carry it out.
Exposed countries: Countries with high indicators for one any of the following:
o Countries with high levels of international trade compared to GDP and relying on sea transport for more than half the volume of international trade, be it intra or extra EU.
o Countries where international trade is mostly undertaken by sea.
Least exposed countries: which do not rely on sea transport. These countries will not be very affected by changes to shipping policies.
This classification of countries in terms of their vulnerability is presented below.
Table 10.38: Exposure of EU countries to policy change on shipping emissions
Category Countries
Most exposed Ireland, Malta, Netherlands, UK, Cyprus, Sweden and Finland, Greece.
Exposed
Shipping most important for intra-EU trade: Bulgaria, Estonia, Latvia, Lithuania, Finland, Sweden.
Shipping most important for extra EU trade: Germany, Belgium, Luxembourg, France, Italy, Portugal, Spain.
Shipping important to all trade: Denmark, Romania.
Least exposed Austria, Czech Republic, Hungary, Poland, Slovakia, Slovenia
10.3.6.3 Analysis for each country
While Austria shows higher levels of international trade than the European average, hardly any of this trade is carried out by sea. The country is therefore not exposed to changes in shipping policy.
0,0
0,5
1,0
1,5
Tonnes percapita
Exports as %GDP
Imports as %GDP
Extra EUimports by sea…
Extra EU exportsby sea as % of…
Intra EU importsby sea as % of…
Intra EU exportsby sea as % of…
Austria EU 27 average
Support for the impact assessment of a proposal to address maritime transport greenhouse gas emissions
182
Belgium has a high international trade intensity compared to Europe as a whole: exports account for 83% of the GDP and exports for 80%. In Europe, imports and exports equate to 31% of GDP. While a small proportion of intra-EU trade is undertaken by sea, shipping accounts for a significant proportion of extra EU trade (81%) making Belgium exposed to changes in shipping policy.
Bulgaria is more dependent on international trade than Europe as a whole and sea transport plays a key role in this activity. Around three quarters of extra-EU trade is transported by sea, similar to the European average. Bulgaria is therefore exposed to changes in shipping costs.
N.B: data on intra EU exports not available
Cyprus only exports a small proportion of GDP (6%) and imports a similar proportion to the EU average. It therefore does not show a high level of international trade intensity. On the other hand, almost all imports and exports arrive or leave the country by ships. Cyprus is therefore exposed to changes in shipping costs.
0,0
1,0
2,0
3,0
Tonnes percapita
Exports as % GDP
Imports as %GDP
Extra EU importsby sea as % of tot
Extra EU exportsby sea as % of tot
Intra EU importsby sea as % of tot
Intra EU exportsby sea as % of tot
Belgium EU 27 average
0,00,51,01,52,0
Tonnes percapita
Exports as %GDP
Imports as %GDP
Extra EUimports by sea…
Extra EUexports by sea…
Intra EUimports by sea…
Intra EU exportsby sea as % of…
Bulgaria EU 27 average
0,0
2,0
4,0
Tonnes percapita
Exports as %GDP
Imports as %GDP
Extra EU importsby sea as % of
tot
Extra EU exportsby sea as % of
tot
Intra EU importsby sea as % of
tot
Cyprus EU 27 average
Support for the impact assessment of a proposal to address maritime transport greenhouse gas emissions
183
The Czech Republic has a similar profile to Austria – another landlocked country - with higher levels of international trade than the European average, but hardly any of this trade carried out by sea. The country is therefore not exposed to changes in shipping policy
Denmark, as Europe as a whole, exports and imports a little less than a third of GDP. It is therefore no more reliant on international trade than average. However, it relies on shipping more heavily than Europe as a whole and is therefore exposed to changes in the cost of sea transport for its international trade activity.
Estonia is exposed to changes to shipping policy as its economy relies on imports and exports and exports in particular are mostly shipped by sea.
0,00,51,01,52,02,5
Tonnes percapita
Exports as % GDP
Imports as % GDP
Extra EU importsby sea as % of tot
Extra EU exportsby sea as % of tot
Intra EU importsby sea as % of tot
Intra EU exportsby sea as % of tot
Czech Republic EU 27 average
0,00,51,01,52,02,5
Tonnes per capita
Exports as % GDP
Imports as % GDP
Extra EU importsby sea as % of tot
Extra EU exportsby sea as % of tot
Intra EU importsby sea as % of tot
Intra EU exports bysea as % of tot
Denmark EU 27 average
0,00,51,01,52,02,53,03,54,04,55,0
Tonnes per capita
Exports as % GDP
Imports as % GDP
Extra EU importsby sea as % of tot
Extra EU exportsby sea as % of tot
Intra EU importsby sea as % of tot
Intra EU exportsby sea as % of tot
Estonia EU 27 average
Support for the impact assessment of a proposal to address maritime transport greenhouse gas emissions
184
Finland’s reliance on international trade is in line with the EU average. The weight of shipping in Extra EU trade is also similar to the EU average however it is between 3.4 and 5 times the average for intra-EU trade. Finland’s economy is therefore somewhat exposed to changes in shipping policy although less than some other countries.
France’s economy is more self-sufficient than the European average: exports equate to 20% of GDP and imports for 23% compared to 31% at EU level. It is also markedly less dependent on shipping for trade (except for extra-EU imports). France is therefore not very exposed to changes in shipping costs compared to other parts of Europe.
Germany exports and imports a similar proportion of its GDP to the Europe average but relies a lot less on sea transport to do so. As a result, it is less exposed to changes in shipping policy than other countries.
0,01,02,03,04,05,06,0
Tonnes per capita
Exports as % GDP
Imports as % GDP
Extra EU importsby sea as % of tot
Extra EU exportsby sea as % of tot
Intra EU importsby sea as % of tot
Intra EU exportsby sea as % of tot
Finland EU 27 average
0,0
0,5
1,0
1,5Tonnes per capita
Exports as % GDP
Imports as % GDP
Extra EU importsby sea as % of tot
Extra EU exportsby sea as % of tot
Intra EU importsby sea as % of tot
Intra EU exportsby sea as % of tot
France EU 27 average
0,0
0,5
1,0
1,5Tonnes per capita
Exports as % GDP
Imports as % GDP
Extra EU importsby sea as % of tot
Extra EU exportsby sea as % of tot
Intra EU importsby sea as % of tot
Intra EU exports bysea as % of tot
Germany EU 27 average
Support for the impact assessment of a proposal to address maritime transport greenhouse gas emissions
185
Greece does not have high levels of international trade. However, most of this trade activity occurs by sea. Extra EU trade in particular is heavily reliant on shipping. Greece is therefore exposed to changes in shipping policy although it would impact a relatively small proportion of its economy.
Hungary, like Austria and the Czech Republic, is a landlocked country. As a result, while it does have high levels of international trade, shipping plays no part in this activity. The country is therefore not exposed to policy changes in this sector.
Ireland relies heavily on international trade, in particular on exports; they represent 56% of GDP compared to 31% for Europe as a whole. Shipping is critical to all international trade, especially extra EU trade: almost 100% of all extra EU trade occurs by ship. Ireland’s economy is therefore highly exposed to changes in shipping costs
0,00,51,01,52,02,53,0
Tonnes per capita
Exports as % GDP
Imports as % GDP
Extra EU importsby sea as % of tot
Extra EU exportsby sea as % of tot
Intra EU importsby sea as % of tot
Intra EU exportsby sea as % of tot
Greece EU 27 average
0,00,51,01,52,02,5
Tonnes per capita
Exports as % GDP
Imports as % GDP
Extra EU importsby sea as % of tot
Extra EU exports bysea as % of tot
Intra EU imports bysea as % of tot
Intra EU exports bysea as % of tot
Hungary EU 27 average
0,00,51,01,52,02,53,03,54,04,5
Tonnes percapita
Exports as % GDP
Imports as %GDP
Extra EU importsby sea as % of tot
Extra EU exportsby sea as % of tot
Intra EU importsby sea as % of tot
Intra EU exportsby sea as % of tot
Ireland EU 27 average
Support for the impact assessment of a proposal to address maritime transport greenhouse gas emissions
186
Italy’s economy is not very dependent on international trade: imports and exports represent 23% and 21% of the GDP respectively. This is significantly lower than the EU average. Shipping only plays a small role in intra-EU trade but does account for around 80% of extra-EU trade. Italy is therefore exposed to a limited degree to changes in shipping costs.
Latvia is more reliant on international trade than Europe as a whole, however it is less reliant on shipping to undertake that trade. Its exposure to changes to shipping costs is therefore limited.
Lithuania’s economy is highly dependent on international trade, with imports and exports accounting for more than half the GDP. Shipping has a broadly similar weight than the European average in Extra EU trade and intra EU imports. On the other hand it is highly important for intra EU exports. There is therefore some level of exposure to changes in shipping costs in Lithuania.
0,0
0,5
1,0
1,5Tonnes per capita
Exports as % GDP
Imports as % GDP
Extra EU importsby sea as % of tot
Extra EU exportsby sea as % of tot
Intra EU importsby sea as % of tot
Intra EU exportsby sea as % of tot
Italy EU 27 average
0,0
2,0
4,0Tonnes per capita
Exports as % GDP
Imports as % GDP
Extra EU importsby sea as % of tot
Extra EU exportsby sea as % of tot
Intra EU importsby sea as % of tot
Latvia EU 27 average
0,00,51,01,52,02,53,0
Tonnes per capita
Exports as % GDP
Imports as % GDP
Extra EU importsby sea as % of tot
Extra EU exportsby sea as % of tot
Intra EU importsby sea as % of tot
Intra EU exportsby sea as % of tot
Lithuania EU 27 average
Support for the impact assessment of a proposal to address maritime transport greenhouse gas emissions
187
Luxembourg has high levels of international trade; however as a landlocked country it does not rely on shipping to facilitate this activity. As such it is not exposed to changes in shipping costs. It is worth bearing in mind however that this analysis focuses on trade but Luxembourg is an important flag state and could therefore be impacted in this way.
Malta’s economy depends on imports for 50% of its GDP (compared to 31% of Europe). Export levels are similar to the European average. As a small island, almost all international trade activity takes place by ship. This is therefore a country which is highly exposed to changes in the cost of shipping.
The Netherlands have a highly international economy: imports represent 64% of GDP (double the EU average) and exports represent 71% of GDP. In addition, the proportion of this international trade which is seaborne is higher than the EU average. As a result, the Netherlands are highly exposed to changes in shipping policy.
0,0
0,5
1,0
1,5Tonnes per capita
Exports as % GDP
Imports as % GDP
Extra EU importsby sea as % of tot
Extra EU exportsby sea as % of tot
Intra EU importsby sea as % of tot
Intra EU exportsby sea as % of tot
Luxembourg EU 27 average
0,0
2,0
4,0
6,0Tonnes per capita
Exports as % GDP
Imports as % GDP
Extra EU importsby sea as % of tot
Extra EU exportsby sea as % of tot
Intra EU importsby sea as % of tot
Malta EU 27 average
0,00,51,01,52,02,53,03,54,04,5
Tonnes per capita
Exports as % GDP
Imports as % GDP
Extra EU importsby sea as % of tot
Extra EU exportsby sea as % of tot
Intra EU importsby sea as % of tot
Intra EU exportsby sea as % of tot
Netherlands EU 27 average
Support for the impact assessment of a proposal to address maritime transport greenhouse gas emissions
188
Poland has higher levels of imports and exports than Europe but sea transport only plays a very small part in this trade. It is therefore not exposed to changes in shipping costs.
Portugal’s levels of international trade intensity are lower than the EU average for exports and similar for imports. For extra EU trade, shipping is important accounting for 93% of exports and 100% of imports. It is less critical to intra EU trade. Overall, Portugal’s exposure to changes in shipping costs is therefore more limited than for other countries.
Romania has a similar profile to Europe as a whole in terms of international trade intensity and the role of shipping in extra EU trade. With regards to intra EU trade shipping plays a smaller part. As a whole, Romania’s exposure is therefore more limited than for some other countries across Europe.
0,0
0,2
0,4
0,6
0,8
1,0
1,2Tonnes per capita
Exports as % GDP
Imports as % GDP
Extra EU importsby sea as % of tot
Extra EU exportsby sea as % of tot
Intra EU importsby sea as % of tot
Intra EU exportsby sea as % of tot
Poland EU 27 average
0,0
0,5
1,0
1,5Tonnes per capita
Exports as % GDP
Imports as % GDP
Extra EU importsby sea as % of tot
Extra EU exportsby sea as % of tot
Intra EU importsby sea as % of tot
Intra EU exportsby sea as % of tot
Portugal EU 27 average
0,0
0,5
1,0
1,5Tonnes per capita
Exports as % GDP
Imports as % GDP
Extra EU imports bysea as % of tot
Extra EU exports bysea as % of tot
Intra EU imports bysea as % of tot
Intra EU exports bysea as % of tot
Romania EU 27 average
Support for the impact assessment of a proposal to address maritime transport greenhouse gas emissions
189
Slovakia’s economy is highly dependent on imports and exports but, as it is a landlocked country, international trade is not undertaken by sea. As a result, Slovakia is not exposed to changes in shipping policy.
As with Slovakia, Slovenia’s economy is highly dependent on imports and exports but, given its limited coast line, shipping plays only a minor part in international trade. As a result, Slovenia is not exposed to changes in shipping policy.
Spain’s economy is not heavily reliant on international trade: imports and exports account for around 20% of GDP compared to 31% at European level. Shipping plays an important role in extra-EU trade but a small role for intra-EU trade. As a result, Spain has a relatively limited exposure to changes in shipping policy.
0,00,51,01,52,02,5
Tonnes per capita
Exports as % GDP
Imports as % GDP
Extra EU importsby sea as % of tot
Extra EU exportsby sea as % of tot
Intra EU importsby sea as % of tot
Intra EU exportsby sea as % of tot
Slovakia EU 27 average
0,00,51,01,52,02,5
Tonnes per capita
Exports as % GDP
Imports as % GDP
Extra EU importsby sea as % of tot
Extra EU exportsby sea as % of tot
Intra EU importsby sea as % of tot
Intra EU exportsby sea as % of tot
Slovenia EU 27 average
0,0
0,5
1,0
1,5Tonnes per capita
Exports as % GDP
Imports as % GDP
Extra EU importsby sea as % of tot
Extra EU exportsby sea as % of tot
Intra EU importsby sea as % of tot
Intra EU exportsby sea as % of tot
Spain EU 27 average
Support for the impact assessment of a proposal to address maritime transport greenhouse gas emissions
190
Sweden’s economy is similar to Europe’s in terms of its level of international trade intensity: imports and exports equate to around 30% of GDP. With regards to extra EU relationships it relies on shipping for approximately 80% of trade. With regards to intra-EU trade shipping plays an important role, far more important than for Europe as a whole. Sweden is therefore exposed to changes in shipping costs to some degree.
While the UK is an island and as a result heavily relies on shipping for international trade (in particular extra EU trade), its economy is less dependent on international trade than some others in Europe. Exports represent 18% of GDP and imports represent 24% of GDP. As a result, while the UK is exposed to changes in shipping costs, it is less so than other countries like Malta or Ireland.
10.3.6.4 Exposed regions
There are 271 NUTS2 regions in the EU27 and 63 of these report freight activity by sea. The boundaries of all NUTS2 regions and Europe’s main ports in terms of goods handled are mapped below.
0,00,51,01,52,02,53,03,54,04,5
Tonnes per capita
Exports as % GDP
Imports as % GDP
Extra EU importsby sea as % of tot
Extra EU exportsby sea as % of tot
Intra EU importsby sea as % of tot
Intra EU exportsby sea as % of tot
Sweden EU 27 average
0,00,51,01,52,02,53,03,5
Tonnes per capita
Exports as % GDP
Imports as % GDP
Extra EU importsby sea as % of tot
Extra EU exports bysea as % of tot
Intra EU imports bysea as % of tot
Intra EU exports bysea as % of tot
United Kingdom EU 27 average
Support for the impact assessment of a proposal to address maritime transport greenhouse gas emissions
191
Figure 10.20: Europe’s main ports by tonnage of goods handled, 2010
Source: Eurostat, produced by AEA
The table below lists the names of the main NUTS2 regions in terms of maritime freight and estimates of employment in water transport as a proportion of total employment in the region.
Table 10.39: Top 20 EU 27 regions in terms of maritime freight
NUTS2 region Description Employment in water transport as % total employment
Zuid Holland The region of Rotterdam, the largest port in Europe with 346m tonnes of goods handled in 2009 (10% of EU 27 total).
1.9%
Prov. Antwerpen
The region of the port of Antwerp, the second largest in Europe. Its location on the estuary of the Scheldt enables capsize ships to dock inland, with good connections by rail, waterway and road.
0.3%
Hamburg The port of Hamburg is the third largest port in the EU and largest in Germany.
8.2%
Haute-Normandie
Location of the port of Le Havre, leading French port for container traffic.
0.4%
Noord-Holland Region immediately north of Rotterdam and which includes Amsterdam.
N/A
Andalucia Location of the port of Algeciras at the southernmost point of Spain, in the Bay of Gibraltar. It serves as the main embarkation point between Spain and Tangier and other ports in Morocco as well as the Canary Islands and the Spanish enclaves of Ceuta and Melilla.
N/A
Provence-Alpes-Cote d’Azur
Home to the port of Marseille on the Mediterranean, both a passenger and freight port.
1.3%
Support for the impact assessment of a proposal to address maritime transport greenhouse gas emissions
192
NUTS2 region Description Employment in water transport as % total employment
East Yorkshire and Northern Lincolnshire
Location of the ports of Grimsby & Immingham which together combine to form the UK's largest port by tonnage. Grimsby’s major focus is on the handling of imported trade cars. Immingham is the UK's premier energy port, handling oil and petrochemicals, coal, iron ore, and renewable fuels for industry.
N/A
Liguria Region of the port of Genova, the first port of Italy in terms of trade volume. It is located at the centre of Northern Italy’s industrial region.
32.8%
Sicily Sicily is a large island with a number of ports handling freight: Augusta, Palermo, Catania, Trapani, Pozzallo and Termini Imerese.
N/A
Västsverige Region of the port of Gothenburg in Sweden. 3.2%
Cataluna Region of the port of Barcelona in Spain. 0.1%
Comunidad Valenciana
Region of the port of Valencia in Spain. 0.0%
Etelä-Suomi Long stretch of coastline along the south of Finland including the port of Helsinki and other smaller ports.
0.4%
Bremen Region of the port of Bremerhaven. It is particularly important with regards to the trade of cars in Europe.
0.9%
Puglia Puglia is the “heel” on the “boot” of Italy. It includes the ports of Taranto, Bari and Brindisi.
1.1%
Latvia Location of the ice-free port of Ventspils. N/A
Nord-Pas-de-Calais
Includes both ports of Calais and Dunkerque. 0.4%
Sud-Est Location of the Romanian port of Constanta on the Black Sea. 0.4%
Source: Eurostat, 2007
There are a number of other large ports – ranked amongst the top 20 in Europe and mapped in Figure 11.21 - which do not appear here because their regions are not classified amongst the largest ones in Europe in terms of freight. They include: London; Trieste; Milford Haven (Wales); Tees & Hartlepool; Southampton; Forth (Edinburgh); Wilhelmhave (DE); Zeebrugge; Tallin; Sullom Voe (Shetland Islands)
Where possible, the amount of employment in water transport as a proportion of total employment in industry and services (excl. banking) has been calculated for each region. However, data is often patchy and dated. In addition, the range of sizes in NUTS2 areas undermines this indicator’s value as a comparative tool across regions. For instance, in Liguria, according to Eurostat 32.9% of people employed work in water transport compared to 0.4% in the Nord Pas de Calais or 0.1% in Catalonia. However, while the region of Liguria is very small and mostly focused on the port of Genova and north coast of Italy, Catalonia and Nord Pas de Calais are much larger regions which extend inland and include other significant cities (e.g. Lille in Nord Pas de Calais) beyond the ports. This means that at regional level, their economy is more diversified. However it does not reflect the importance of the ports as economic drivers of the towns and cities they are located in.
These figures are therefore of limited use as indicators of the importance of the shipping industry to these local areas. In view of the limited data available, the most reasonable approach is to assume that the regions and ports listed above will contain the areas most
Support for the impact assessment of a proposal to address maritime transport greenhouse gas emissions
193
likely to be affected by changes in shipping costs. The main concentrations are in the UK, Italy, Spain, France and Germany.
10.3.6.5 Sea passengers
10.3.6.5.1 National analysis
Aside from the cargo-carrying ships, there is another category of ships which would be affected by the policies under consideration: those carrying passengers (ferries and cruise ships).
In 2009, 403 million passengers embarked and disembarked in EU 27 ports. Italy and Greece are the focus of this activity, together accounting for 44% of all passengers. This is followed, with significantly smaller numbers, by North Sea countries (Denmark, Sweden and Germany).
Figure 10.21: Passengers embarked and disembarked in all ports by Member State, 2009
Source: Eurostat
According to IHS Fairplay (2011), almost two-thirds of the total calls by ferries in the EEA in 2009 were made by ferries in domestic traffic and one-third by ferries in intra-EEA traffic. In Italy, 90% of all calls were made by ferries in domestic traffic between the mainland, Sardinia and Sicily. The Greek archipelago has few options other than ferry traffic. In Denmark however, while there are a large number of domestic ferry lines, the largest number of calls is made by ferries in intra-EEA traffic, mainly traffic from Sweden and Germany.
While these figures indicate the prominent role of these countries as sea passenger hubs in Europe, and point to their economic importance to the domestic economy, a better indicator of dependency of a national economy on sea travel is to compare it to total employment or population. Unfortunately Eurostat data on employment in the shipping sector in general and transport of passengers in particular is too scarce to be used here so instead passenger traffic has been correlated with the number of inhabitants.
92,335
88,351
43,561
31,066
29,573
28,281
25,067
21,458
17,226
9,140
Italy
Greece
Denmark
Sweden
Germany
United Kingdom
France
Spain
Finland
Estonia
Malta
Ireland
Poland
Netherlands
Portugal
Belgium
Latvia
Lithuania
Cyprus
Slovenia
Bulgaria
Romania
Support for the impact assessment of a proposal to address maritime transport greenhouse gas emissions
194
Figure 10.22: No. passengers embarked and disembarked per inhabitant, 2009
Source: Eurostat
As can be seen from the chart above, sea passenger traffic is disproportionately large in Malta with 18 passengers per inhabitant. It is also significantly above the EU average in Denmark, Greece, Estonia, Sweden, Finland and Italy. These seven countries are the most dependent on sea passenger traffic activity.
Sea travel is mostly used by tourists. Therefore, the more a country’s economy is dependent on tourism, and the more this tourism relies on ferries or cruise ships, the more it will benefit from the projected decrease in the cost of sea travel by 2030.
The EC’s latest report on the EU tourism industry (European Commission, 2009) found that the largest density of tourism enterprises per 10,000 inhabitants is found in Cyprus. Other countries with a large concentration of tourism enterprises are Greece, Malta and Portugal. As Greece and Malta are identified above as countries with a very high ratio of sea passengers to inhabitant, they will be major beneficiaries to policies decreasing the cost of sea travel.
This same study identified the cruise industry as the fastest growing sector of the travel industry. It estimates that €14.2 billion are spent by cruise lines and their passengers, generating €32.2 billion in total output and supporting 311,512 jobs. The main cruise regions in Europe are the Mediterranean and Northern Europe. The study also found that the main challenges for the cruise industry worldwide include oil prices (with fuel costs amounting to 10-11% of vessel operating costs) and cost control.
Overall, this reinforces the findings that the Mediterranean islands and Scandinavian countries will be the most important beneficiaries of policy options resulting in a drop in the cost of passenger transport by sea.
10.3.6.5.2 Regional analysis
The regions with the largest numbers of sea passengers are concentrated in the North Sea, specifically Sweden and Denmark, and in the Mediterranean, specifically Italy and Greece. This is illustrated in the map below which combines data on passenger traffic a NUTS2 level and for the top 20 passenger ports in the EU.
Support for the impact assessment of a proposal to address maritime transport greenhouse gas emissions
195
Figure 10.23: Passenger numbers by NUTS2 region, 2010
Source: Eurostat, produced by AEA
Regions with over 10 million passengers a year include: Sicily, Sydsverige in Sweden, Attiki in Greece (which includes the port of Athens), Campania which includes Naples and Salerno, Stockholm, Calabria and Sardegna.
In order to take into account the size of the regions, the ratio of sea passengers to their total population has been examined. The list of NUTS2 regions with the highest ratios is provided below.
Table 10.40: Highest ratio of passengers embarked and disembarked per inhabitant, 2009
NUTS2 region Ratio Location and description
Åland 66.2 Islands between Sweden and Finland.
Ceuta 11.7 Spanish enclave on the Northern coast of Morocco.
Sjælland 10.7 Southern half of the island where Copenhagen is located.
Sydsverige 9.6 Southern tip of Sweden, surrounded on three sides by the North Sea.
Notio Aigaio 9.3 79 Greek islands in the Aegean sea – an essential contributor to tourism in Greece. They are mostly reliant on ferries to bring tourists.
Malta 7.6 Island country south of Sicily, largely dependent on tourism.
Nordjylland 7.0 Northern tip of Denmark, surrounded on three sides by the North Sea.
Sardinia 6.1 Italian island south of Corsica.
Stockholm 6.1 Capital of Sweden, located in an area of islands and fjords.
Calabria 5.5 Southernmost tip of Italy, adjacent to Sicily.
Support for the impact assessment of a proposal to address maritime transport greenhouse gas emissions
196
NUTS2 region Ratio Location and description
Hovedstaden 5.2 Northern half of the island where Copenhagen is located.
Ionia Nisia 5.2 Ionian islands in Greece, a key tourist attraction for the country.
Source: Eurostat
As seen above and as expected, the EU regions which rely the most on sea transport for passenger movements are coastal and island areas. Ferries and cruise ship bring tourists which in turn support local economies; they can also bring commuters and business visitors. In the case of most of these regions, alternative modes of transport are not available or viable, which means that businesses and residents will be vulnerable to price changes. As seen previously, the policy options are most likely to result in a reduction in shipping costs by 2030 which should benefit the transport of sea passengers.
10.3.6.6 Concentrations of jobs in shipbuilding in Europe
One of the sectors that could be affected by a policy is shipbuilding. This section provides a short overview of the geographical distribution and prospects of European shipbuilding, based on the European Commission’s own research (2009).
In the global context, while the demand for ship building is dominated by European buyers, Europe’s past dominance in ship construction no longer exists and its weight in the global industry continues to diminish. Asian countries such as South Korea, Japan and China now lead the market:
In terms of completions South Korea, China and Japan represent almost 80% of the world production.
The 15 largest ship-building companies are all located in Asia: eight in Korea, six in China and one in Japan15. The largest European ship construction company, Meyer Werft in Germany, ranks a mere 38th.
At the end of 2008, the ten largest European ship yards had a combined order book of 5.97 million Compensated Gross Tons, which was only 46% of the order book of the world leader Hyundai H.I. and only about 3% of the total world order book.
Although Europe’s market share in terms of volumes has declined over the years, Europe has succeeded in retaining a position by building more complex ships with a relatively higher value added, while the production of more standard mass production ships moved to other (lower labour cost) countries, especially in Asia. Europe also has a relatively strong position on the ship repair market and in the marine equipment sector which supplies ship construction. Indeed it is a net exporter; however the market share of Asia has grown rapidly over the last decade and is expected to grow further at the expense of Europe.
At the European level, while shipbuilding may be declining, it still remains an important source of jobs and economic activity in the regions where it does take place. As can be seen from the figure below, the main concentrations of large ship yards are in Germany, Croatia and Romania, followed by Finland, the UK and Spain.
Support for the impact assessment of a proposal to address maritime transport greenhouse gas emissions
197
Figure 10.24: Top 20 shipyards in Europe
Source: Clarkson, Ecorys
This is reflected in the weight of these countries in the total orders for ships to European countries. As seen below, Germany and Italy are traditionally the largest shipbuilding nations in Europe followed by countries such as Romania, The Netherlands, Poland, Croatia and Spain.
Figure 10.25: Relative position of 30 European (EU and non-EU) countries regarding shipbuilding (order book in CGT), 2007
The regions and countries where the shipyards are located will be affected if the policies lead to a contraction of shipping activity. However, demand for shipping is affected by a range of other factors (economic performance, comparative cost of other modes etc.) making it very difficult to isolate the impact of the policies considered. Conversely, the same regions and countries could benefit from greater demand for complex ships and/or efficiency retrofits.
Support for the impact assessment of a proposal to address maritime transport greenhouse gas emissions
198
10.3.6.7 Conclusions
The EU countries and regions most exposed to the implementation of a policy to reduce carbon emissions from shipping tend to be islands or coastal areas. Because of their geographical location they rely heavily on sea transport to import the primary and secondary goods needed by their residents, to draw revenues through exports, and to attract tourists. In Malta, Ireland, Cyprus, Portugal, Spain and Greece for instance, over 90% of extra EU trade is undertaken by sea. Some of these countries are heavily reliant on international trade for their economic performance: in Malta and Ireland, international trade represents 75% of GDP.
A number of Mediterranean and Northern European countries and regions are also heavily dependent on sea transport as a mean to enable their tourism sector. These include Malta, Denmark and Greece.
The countries named above are the most exposed to changes in the cost of shipping, however the ultimate geographical distribution of impacts will depend on the trade and economic characteristics of each individual country and region. While savings are expected at the aggregate level by 2030 under most policy options, the commodities analysis has shown that there can be different impacts depending on the route and commodities considered. Overall however, impacts are likely to be small, in part because it is expected that in most cases, shipping operators will retain the savings achieved as a result of the policy.
10.3.7 Economic impacts on sectors heavily dependent on shipping
Overall, a policy to control shipping GHG emissions will have greater impacts on the primary (agriculture and fishing) and secondary (manufacturing) sectors rather than the service sector, as most shipping activity is for the transport goods and raw materials. Aside from services related to the shipping industry, the main service sector which may directly benefit from measures is tourism through the changes in the cost of operating cruise ships and ferries.
In order to identify the economic sectors most exposed to impacts from the policies considered, Eurostat data has been used to select the goods with the highest levels of extra-EU imports and exports and assess the role of sea transport in the trade of these commodities. This has been complemented by analysing the level of intra-EU trade by commodity from IHS.
10.3.7.1 Main goods traded with the rest of the world
With regards to EU trade, the table below shows the top ten goods exported and imported by the EU in terms of value. In both the export and import cases, the main goods combine fuels (e.g. petroleum and gas), transport equipment (road vehicles and other), various machinery and chemicals (e.g. pharmaceutical products, organic chemicals).
While the broad categories of imports and exports may be the same, EU’s exports tend to be higher value products including road vehicles, pharmaceuticals and specialised machinery which show a highly positive trade balance. These ten goods represent 55% of total Extra EU exports.
On the other hand, as seen in our analysis of the commodities, the EU relies heavily on imports to meet its needs for oil. Other important categories of imports include lower value products such as clothes, office machinery and electrical machinery. These ten goods represent 59% of total extra-EU imports.
Support for the impact assessment of a proposal to address maritime transport greenhouse gas emissions
199
Table 10.41: Goods with the highest level of Extra EU trade activity (€m)
Electrical machinery 6.1 Gas, natural and manufactured 4.9
Machinery specialised for particular industries
5.3 Office machines and computers 4.9
Petroleum and petroleum products 5.2 Clothing and clothing accessories 4.4
Power generating machinery & equipment
4.5 Miscellaneous manuf. articles 3.7
Other transport equipment 4.5 Other transport equipment 3.6
Miscellaneous manuf. Articles 3.5 Medicinal and pharmaceutical products
3.2
Organic chemicals 3.2 Road vehicles 3.1
10.3.8 Reliance on shipping
Trade in products that heavily rely on shipping transport are likely to be the most affected by policy action. For road vehicles, petroleum and petroleum products, shipping accounts for over three quarters of the value of exports. With regards to imports, shipping accounts for over 60% of the total for road vehicles, petroleum and petroleum products, other transport equipment and wearing apparel.
Data on intra-EU trade by sea is only available at broad commodity group49 and is therefore of limited help here. However, it does further emphasise the importance of machinery and vehicles to EU trade; 41% of intra EU imports and 47% of intra EU exports in value fall under this category.
All the key products identified here as potentially vulnerable to the policies considered were included in our sample of commodities targeted for further analysis and as a result the potential impacts of the policies on them have already been examined and where possible quantified.
10.3.9 Economic impacts on SMEs
In line with the Commission’s Impact Assessment Guidelines (European Commission, 2009), the aim of this section is to investigate the potential impact of the policy options on SMEs in the shipping industry in view of their relative weight in the shipping sector and how each option will affect their operations. The central question which needs to be answered is whether SMEs are likely to be disproportionately affected or disadvantaged by the proposed policies in comparison to large companies.
10.3.9.1 SME population in the shipping industry
Business size in the sector tends to be measured in terms of fleet size or capacity rather than employment numbers and as a result, data on SMEs as defined by the EU (<250 employee) is scarce. Sector-specific sources provide a wealth of data on ship types, size and numbers, volumes and value of goods transported but no figures on business size.
Another reason for caution with regards to employment data on shipping was highlighted recently by the Task Force on Maritime Employment and Competitiveness (European Commission 2011). It found that it was difficult to find reliable, accurate and complete data because of the globalised nature of the shipping industry and its flexibility, including
49
Chemicals, food, forest products, iron & steel, machinery & vehicles, reefer cargo and other.
Support for the impact assessment of a proposal to address maritime transport greenhouse gas emissions
200
temporary employment which has become increasingly common. Assets are mobile and since the late 1970s crews can and have been recruited from anywhere in the world.
The only source of employment figures is Eurostat and data is limited there as well. In 2009, there were approximately 17,100 enterprises operating in water transport in the EU 27, of which 3,000 were involved in sea and coastal passenger water transport, and 5,000 in sea and coastal freight water transport, the two sub-sectors which make up shipping. These companies respectively employed around 62,000 people (passenger transport) and 83,000 people (freight) in Europe, in other words a total of 145,000 people.
As in other sectors of the economy, SMEs represent almost the totality of enterprises, although their weight is lower in sea and coastal transport than in other sectors. In the non-financial business economy as a whole, micro businesses (fewer than 10 employees) account for 92% of the total business population. As can be seen from the table below, in shipping between 76% (freight) and 86% (passenger transport) of enterprises fall within this category.
Table 10.42: No. of enterprise by number of employees, 2009
Employment data is patchy at the sub-sector level but figures for Water Transport as a whole suggest that SMEs account for 60% of all jobs and 99% of businesses.
Turnover data shows that the weight of large companies is even higher in terms of output: they account for half the turnover in Water Transport for 1% of businesses.
This suggests that large firms undertake higher added value tasks and have higher productivity than SMEs. This is likely to be the result of economies of scale which apply strongly in shipping with research showing that firm capacity and net profit are positively related (Y.H.V Lun, K-H Lai, T.C.E Cheng 2010).
Overall, while it is lower than in other sectors, the weight of SMEs in shipping as an employer and a generator of value is significant and should therefore not be overlooked. It is likely that SMEs provide a wide range of necessary support and / or niche services.
10.3.9.2 Impacts of policies on SMEs
The impacts of the policy on the capital, operational and administrative costs of all operators in the shipping industry have been estimated in Section 11.
In this section we explore whether SMEs may be disproportionately affected by the policies. This in turn will depend on the extent to which the change in costs which result from the implementation of the chosen policy are proportional to size/activity or not.
Capital costs relate to the need for new investment in order to increase fuel efficiency and reduce GHG emissions. Policies which require rapid reductions in CO2 in turn require investment in new ships/technologies which may affect SMEs more as they tend to experience more difficulties in raising finance.
Access to finance for SMEs has indeed been identified as a priority issue by DG Enterprise and Industry and is underlined by the latest results of the European Central Bank’s Survey on Access to Finance of SMEs in the Euro area published in April 2012. It finds that 15-20% of SMEs rank access to finance as the most important problem they face. This makes it the third main challenge experienced by European SMEs overall, after finding customers and competition.
Support for the impact assessment of a proposal to address maritime transport greenhouse gas emissions
201
According to this latest survey: ‘SMEs also reported a further deterioration in the availability of bank overdrafts as well as of trade credit, indicating an overall considerable worsening in the access to finance for euro area SMEs in the period from October 2011 to March 2012. The deterioration in the availability of bank loans was much less pronounced for large firms’.
In addition, capital investment usually benefits from economies of scale which puts SMEs at a disadvantage.
The impacts on operational and fuel costs will be more proportional to the size of the company, although there might still be some level of disproportionate impact on SMEs because of their inability to spread overheads as large companies can.
Finally, the analysis on administrative costs found that costs are likely to be higher per ship for small owners. Some administrative costs borne by ship operators entities (e.g. obligations to obtain a certificate from the verifier) will depend on the size of their fleet; other costs, however, will be of a similar order of magnitude for all owners, both large and small. Due to the existence of significant set-up and fixed costs, the resulting administrative burden is expected to be proportionately much higher for smaller operators than for their larger counterparts, as the latter may benefit from significant economies of scale.
Overall, it is likely that SMEs will be more affected than large companies by the introduction of policy action to control maritime CO2 emissions. The degree to which this will occur may be mitigated by the final design of the selected policy, in particular as it will determine the administrative burden placed on shipping operators. This underlines the importance of the choice of the threshold for inclusion in the policy coverage. In addition, policy which focuses on emissions will be fairer as these are broadly proportional to the size of the company. It may also be worthwhile to investigate simplified procedures for MRV and reporting for small owners and owners affected by the requirements on a limited basis (e.g. owners with only one ship call per year or less at EU ports). Such simplified procedures could be analogous to the provisions for small emitters under the aviation ETS.
10.3.10 Economic impacts on European international competitiveness and relationships
10.3.10.1 Introduction
Implementing policy action on shipping emissions to and from Europe may have an impact on Europe’s relationships with the rest of the world for the following reasons:
By changing the freight cost from and to Europe. This has been assessed, where relevant, as part of the commodity analysis and the key findings are provided here.
Given the geographical distribution of extra-EU trade, some countries are more important markets and suppliers for Europe than others. These countries have been identified through Eurostat and OECD data, with a particular focus on least developed countries.
10.3.10.2 Impacts on the global competitiveness of EU firms
10.3.10.2.1 Impacts on EU 27 exports
The US, Turkey and China are the main markets for Europe’s seaborne exports, whether in volume or in value terms. However, the difference in market share in the charts below suggest that exports to the US and China are higher value than those to Turkey.
Aside from these top three destinations, extra-EU exports are widely spread across the globe. Higher value products tend to go to more developed countries such as Japan, Canada, Australia, and emerging large markets like Brazil and India. Europe also exports a significant volume of lower value goods to the Middle East and North Africa.
Support for the impact assessment of a proposal to address maritime transport greenhouse gas emissions
202
Figure 10.26: Percentage total volume of extra-EU exports by sea, 2010
Figure 10.27: Percentage total value of extra-EU exports by sea, 2010
Source: Eurostat
The table below with the main products exported by Europe by sea shows a concentration across a number of product categories including vehicles, electrical and other machinery. Depending on the destination, EU 27 also exports refined petroleum products, iron and steel, and pharmaceutical products.
Table 10.43: Main export markets by sea for EU 27
Country Main seaborne exports by value Value to weight ratio
US Vehicles other than railway and tramway rolling stock; Nuclear reactors, boilers, machinery & mechanical appliances; Mineral fuels and oils; pharmaceutical products; beverages, spirits and vinegar.
High
China Nuclear reactors, boilers, machinery & mechanical appliances; Vehicles other than railway and tramway rolling stock; electrical machinery & equipment.
High
Turkey Iron and steel; Vehicles other than railway and tramway rolling stock; Nuclear reactors, boilers, machinery & mechanical appliances; plastics.
High
Brazil Nuclear reactors, boilers, machinery & mechanical appliances; Vehicles other than railway and tramway rolling stock; electrical machinery & equipment; organic chemicals
High
Overall, the pattern of trade between the EU and the rest of the world is one where imports supply energy, raw materials, intermediary products and lower value consumer goods, while in return Europe exports high value manufactured products. As an indicator, based on Eurostat’s data, in 2010, the average value of one tonne of Extra EU imports was €676. The same year, the average value of one tonne of Extra EU exports was €1,507. Importers to the EU are therefore more likely to be affected by possible changes in the cost of maritime transport than exporters from the EU.
10.3.10.3 Impacts on selected commodities
Europe is a net exporter of five of the commodities included in our detailed analysis. The potential impacts of the policies on these products are explored here. However, it is not possible to quantify impacts in the same way as for the internal market as each export country would have a different Armington elasticity and different elasticities of demand.
Some quantification of the impacts of the policy options on freight rates and prices has been made. However, it must be read with great caution because:
14%
7%
7%
4%
3%3%
3%3%
56%
US Turkey China Algeria Egypt Norway Saudi Arabia Nigeria Other
20%
11%
4%
3%3%
3%3%3%
51%
US China Turkey Brazil Japan India Canada Australia Other
Support for the impact assessment of a proposal to address maritime transport greenhouse gas emissions
203
The freight rates used are for imports routes as it is the only data available to us. However, freight rates can differ greatly depending on direction of travel meaning that estimates for import routes will be a poor proxy for export routes.
One price is used when prices are likely to differ across countries, sometimes significantly.
10.3.10.3.1 Refined petroleum products
In 2010, Europe exported €60.3bn worth of refined products, a net trade surplus of €5.3bn. This is largely driven by gasoline, which Europe has an excess of as domestic demand has fallen.
Shipping accounts for 82% of exports of refined petroleum products. The main destination is the United States, with 30% of exports, followed by Nigeria, Mexico, Singapore and Turkey.
However the US is expected to reduce its gasoline consumption in the future (European Commission, 2010). Indeed, exports of refined products to the US have already started to decline. In response, the EU has searched for new markets and diversified its trade relationships: the share of exports to ‘other countries’ as risen from 25% of the total in 2000 to 30% in 2010. However, demand in these countries is not expected to be as high as the current EU export levels placing Europe in a vulnerable position.
Broad estimates of the impact of the policies on freight rates on trade routes with the US and North Africa are provided below.
Table 10.44: Summary of policy impacts by 2030 on refined petroleum products
Policy Change in freight rates (€ per tonne
and %)
Resulting change in price per tonne of
petroleum products (€ per tonne and %)
ETS closed
-0.2 to 0 (-2.4% to 0%)
0 (0%)
ETS open (free allowances) -0.2 to -0.04 (-2.3% to -1%)
0 (0%)
ETS open (full auctioning) 0.3 to 0.5 (6% to 8%)
0.15-0.4 (0.01%-0.03%)
Emissions tax (low) 0.3 to 0.4 (5.6% to 7%)
0.1-0.4 (0.01%-0.03%)
Emissions tax (high) 4.5 to 8.2 (110% to 120%)
2.8-6.9 (0.3%-0.5%)
Target-based compensation fund
0.3 to 0.5 (6% to 8%)
0.15-0.4 (0.01%-0.03%)
Contribution-based compensation fund
0.3 to 0.4 (5.6% to 7%)
0.1-0.4 (0.01%-0.03%)
As seen above, based on our assumptions, a closed ETS and open ETS with free allowances would lead to a drop in freight rates. This would be absorbed by the industry and have therefore no impact on prices and EU exporters. The other options are expected to have only a small impact on prices.
10.3.10.3.2 Steel products
In 2010, Europe exported 34m tonnes of steel products compared to 27m of imports. These exports generated a trade surplus of €13bn. Europe tends to export higher value steel products than it imports: the average value of exports in 2010 was €961 per tonne compared to €708 per tonne for imports.
Shipping is critical to this trade, accounting for 80% of all steel product exports. Europe’s exports of steel products are widely spread around the world, indeed the top six destinations
Support for the impact assessment of a proposal to address maritime transport greenhouse gas emissions
204
only account for half of all extra EU exports. Turkey, the US and Algeria are the main markets with 10-14% market share each.
Broad estimates of the impact of the policies on freight rates on trade routes with the North Africa and the US are provided below.
Table 10.45: Summary of policy impacts by 2030 on steel products
Policy Change in freight rates (€ per tonne
and %)
Resulting change in price per tonne of
steel products (€ per tonne and %)
ETS closed
0.4 – 0.9 (3.3% - 3.6%)
0.01 (0%)
ETS open (free allowances) 0.4 -0.5 (2.8% to 3.8%)
0.01-0.02 (0%)
ETS open (full auctioning) 1.5-1.6 (12%-13%)
0.01-0.02 (0%)
Emissions tax (low) 1.5-1.6 (12% to 13%)
0.01-0.02 (0%)
Emissions tax (high) 16 (130% to 132%)
0.2-0.5 (0.03%-0.07%)
Target-based compensation fund
1.5-1.6 (12%-13%)
0.01-0.02 (0%)
Contribution-based compensation fund
1.5-1.6 (12% to 13%)
0.01-0.02 (0%)
All policy options are expected to result in a limited increase in freight rates on the routes explored. However, under all policy options this would have a negligible impact on prices as any increases would mostly be borne by shipping operators due to the elastic nature of demand for steel products. Even under the extreme scenario of a high emissions tax, the impact would be very small.
It is worth bearing in mind that EU steelmakers’ ability to pass costs through to overseas manufacturers is limited by the fact that it is in competition with other countries, China being one of them. Having said that European products’ competitiveness is mainly linked to the provision of high quality and often tailor made products, meaning that there is some potential for pass through as these high value products have more capacity to absorb price increases.
10.3.10.3.3 Grain
In 2010, Europe exported €5.5bn of grain, 25% of its production, while in the same year it imported €3.3bn. These exports were mostly delivered by sea (87% of total). Europe provides grain to a very wide range of countries, with the main ones located in North Africa (Algeria, Egypt, Saudi Arabia and Morocco). Together they account for around 40% of exports. Other trade partners hold relatively small shares of the total EU export market.
Broad estimates of the impact of the policies on freight rates on trade routes with the North Africa and the Middle East are provided below.
Table 10.46: Summary of policy impacts by 2030 on the grain market
Policy Change in freight rates (€ per tonne
and %)
Resulting change in price per tonne of grain (€ per tonne
and %)
ETS closed
-0.8 (-17%)
0 (0%)
ETS open (free allowances) -1.1 (-22%)
0 (0%)
Support for the impact assessment of a proposal to address maritime transport greenhouse gas emissions
205
Policy Change in freight rates (€ per tonne
and %)
Resulting change in price per tonne of grain (€ per tonne
and %)
ETS open (full auctioning) 0.8 (-15%)
0 (0%)
Emissions tax (low) 0.8 (-15%)
0 (0%)
Emissions tax (high) 4.3 (90%)
1.1 (0.4%)
Target-based compensation fund
0.8 (-15%)
0 (0%)
Contribution-based compensation fund
0.8 (-15%)
0 (0%)
As seen above, all options apart from a high emissions tax would result in a drop in freight rates which in turn would be retained as savings by the industry. As a result, there would be no impact on EU producers.
10.3.10.3.4 Motor vehicles
Motor vehicles are a major export product for Europe. In 2010, the EU 27 exported 7.9m tons worth €84.8bn. The net trade balance for the EU 27 in this sector was: €58.2bn, underlining its importance to the European economy.
Europe relies on other countries to buy its products with exports amounting to 18% of EU production. This has become all the more important in past years as the number of registrations for passenger cars in Europe has declined.
Shipping plays a crucial role in this trade: 76% of exports in terms of value travel by ship and this has remained broadly unchanged since 2000.
By far the main two markets for EU seaborne exports are the US, with 29% of exports, and China (17%). Other markets with a 4-5% share are Japan, Turkey, Australia and Canada. Generally, Europe exports to a wide range of countries. In this assessment trade to China is used as an example of an appropriate low freight rate example and US a high freight rate.
Broad estimates of the impact of the policies on freight rates on trade routes with the US and China are provided below.
Table 10.47: Summary of policy impacts by 2030 on the motor vehicles market
Policy Change in freight rates (€ per tonne
and %)
Resulting change in price of motor
vehicle (€ per tonne and %)
ETS closed
-20 to -8 (-15% to -17%)
0 (0%)
ETS open (free allowances) -15 to -9.5 (-20% to -11%)
0 (0%)
ETS open (full auctioning) -5.8 to -3 (-12% to -2%)
0 (0%)
Emissions tax (low) -6 to -4 (-13% to -3%)
0 (0%)
Emissions tax (high) 56-125 (94%-116%)
28-63 (0.15%-0.2%)
Target-based compensation fund
-5.8 to -3 (-12% to -2%)
0 (0%)
Contribution-based compensation fund
-6 to -4 (-13% to -3%)
0 (0%)
Support for the impact assessment of a proposal to address maritime transport greenhouse gas emissions
206
All options (apart from a high emissions tax) would result in a drop in freight rates which in turn would be retained as savings by the industry. As a result, there would be no impact on EU producers. Even under the extreme scenario of a high emissions tax, the change in price is not significant.
10.3.10.3.5 Organic chemicals
Europe exports close to 40% of its production and in 2010 had a surplus worth €7bn in the trade of organic chemicals. This is despite the fact that it imported larger quantities than it exported, highlighting the high value of EU exports. Indeed, EU exports had an average unit value of 4,000€ per tonne, whereas EU imports had an average unit value of roughly half that amount.
Shipping plays a central part in the trade of organic chemicals, transport 81% of all exports (in terms of volume). The share of seaborne transport is significantly reduced when measuring trade in value terms, which shows the higher value of organic chemicals transported by air and by road. The average unit export value of organic chemicals exported by sea is 1,970 €/tonne whereas exports by air average value is 367,620 €/tonne and exports by road average value is 4,506 €/tonne.
EU exports of organic chemicals are dispersed across a large number of countries, with main destinations being the United States, China and Brazil, holding around 40% of the exports value.
Broad estimates of the impact of the policies on freight rates on trade routes with the US and China are provided below.
Table 10.48: Summary of policy impacts by 2030 on organic chemicals
Policy Change in freight rates (€ per tonne
and %)
Resulting change in price of organic
chemicals (€ per tonne and %)
ETS closed
-2 to -0.7 (-2.6% to -1.2%)
-0.25 to -0.1 (0%)
ETS open (free allowances) -1.7 to -0.7 (-2.1% to -1.2%)
-0.2 to -0.1 (0%)
ETS open (full auctioning) 3.5-4 (5.2%-6.4%)
0.9-1 (0.02%-0.03%)
Emissions tax (low) 3-4 (5%-6%)
0.8-0.9 (0.02%-0.03%)
Emissions tax (high) 56-61 (79%-102%)
7-7.6 (0.1%-0.2%)
Target-based compensation fund
3.5-4 (5.2%-6.4%)
0.9-1 (0.02%-0.03%)
Contribution-based compensation fund
3-4 (5%-6%)
0.8-0.9 (0.02%-0.03%)
The closed ETS and open ETS with free allowances would lead to a decrease in freight rates. A small proportion of this would be passed on, leading to marginally lower EU export prices. Overall the impact on exports of organic chemicals is unlikely to be significant.
This reflects the fact that transport accounts for a modest share of the total price on average (although there are large variations depending on products) and the fact that EU exporters are expected to absorb part of the price in order to remain competitive. Indeed, the ability to pass costs through in export markets is considered as moderate to low because pricing in the global chemicals industry is very competitive, due to the few possibilities for product differentiation and the increasing global competition. The ability to pass costs through will be particularly low in the Asian market or in those markets where the EU competes with Asian producers. Whilst the EU has a range of trade partners for its exports, China is the second largest holding 11% in terms of value.
Support for the impact assessment of a proposal to address maritime transport greenhouse gas emissions
207
As with the other commodities, the final impact on EU exporters will depend on the extent to which the countries with which they trade are able and willing to substitute EU products with other products.
10.3.11 Impacts on third countries
This section provides an overview of the EU27’s main suppliers by sea and therefore those most likely to be affected by the implementation of policy action on shipping emissions, in absolute terms.
Impacts on third countries will depend on commodities. Based on our detailed analysis of ten commodities, it is apparent how trade routes vary across commodities. The European Commission’s Join Research Centre is developing a model to examine the trade impacts of the scheme on third countries in detail so this analysis has focused on identifying:
The main trading partners by sea of the EU27 overall in terms of imports and exports, value and volume;
The main traded commodities for these top partners;
Whether least developed countries might be disproportionately affected by policy intervention.
10.3.11.1 EU 27 main suppliers by sea
As can be seen from the chart below, six countries account for half of extra-EU imports by sea in terms of quantity: Russia, Norway, Brazil, the US, Libya and China. Six countries also account for roughly half the value of Extra EU imports: they are the same except for Libya which is replaced by Japan.
The relative shares suggest that:
China is exporting high value products to Europe: 4% of volume but 21% of value;
Similarly, Japan accounts for only 0.3% of the total quantity of imports but 4% of value;
Russia, Norway, Brazil on the other hand supply lower value goods and are therefore more likely to be affected by an increase in the costs of maritime transport.
Figure 10.28: Percentage total volume of Extra EU imports by sea, 2010
Figure 10.29: Percentage total value of Extra EU imports by sea, 2010
Source: Eurostat
These countries are the ones with the largest value of seaborne exports to the EU and as such the most exposed to changes in the operation of the shipping sector. The main
18%
10%
8%
6%
5%4%
50%
Russia Norway Brazil US Libya China Other
21%
10%
7%
6%4%3%3%
45%
China Russia US Norway Japan Brazil Libya Other
Support for the impact assessment of a proposal to address maritime transport greenhouse gas emissions
208
products imported by sea from these countries are listed in the table below. It highlights again the dependence of Europe on other countries for fuels and raw materials.
Table 10.49: Main Extra EU seaborne imports
Country Main seaborne imports by value Value to weight ratio
China Electrical machinery and equipment; Nuclear reactors, boilers, machinery & mechanical appliances; Toys & games; Furniture; articles of apparel and clothing accessories.
Medium-High
Russia Mineral fuels and oils (82% of total value); Iron and steel Low
Norway Mineral fuels and oils (73% of total value); aluminium and fish. Low
US Mineral fuels and oils; Nuclear reactors, boilers, machinery & mechanical appliances; Vehicles other than railway and tramway rolling stock; organic chemicals; plastics; electrical machinery & equipment.
High
Japan Nuclear reactors, boilers, machinery & mechanical appliances; Vehicles other than railway and tramway rolling stock; electrical machinery & equipment.
High
Brazil Ores, slag and ash; Residues and waste from the food industry; oil seeds and oleaginous fruit; coffee, tea and spices; Mineral fuels and oils; Pulp of wood.
Low
Libya Mineral fuels and oils (98% of total) Low
As can be seen in the section of this report on commodities, the final impact will depend on a range of factors including: the commodity traded; the routes; the elasticity to freight rate and prices; levels of competition and the ability to pass costs through to along the supply chain and to consumers. Several of the core products listed above are examined in the commodities section. In the majority of cases, no significant impacts on prices are expected as a result of the policy options.
10.3.11.2 Least Developed Countries
Forty-eight countries are currently designated by the United Nations as “least developed countries” (LDCs). The following three criteria are used to define LDCs:
A “low-income” criterion, based on a three-year average estimate of the gross national income (GNI) per capita, with a threshold of $905 for possible cases of addition to the list, and a threshold of $1,086 for graduation from LDC status;
A “human assets weakness” criterion, involving a composite index (the Human Assets Index) based on indicators of nutrition (percentage of the population that is undernourished); health (child mortality rate); school enrolment (gross secondary school enrolment rate); and literacy (adult literacy rate);
An “economic vulnerability” criterion, involving a composite index (the Economic Vulnerability Index) based on indicators of natural shocks (index of instability of agricultural production, share of the population made homeless by natural disasters); trade shocks (an index of instability of exports of goods and services); exposure to shocks (share of agriculture, forestry and fisheries in GDP; index of merchandise export concentration); economic smallness (population in logarithm); and economic remoteness (index of remoteness).
In addition, in order to be designated as a LDC, a country’s population must be smaller than 75 million and its government must accept this status.
According to Eurostat, in 2010, LDCs represented a very small proportion of EU seaborne imports: together these 49 countries amounted to 2% of the value of all Extra EU seaborne imports and 2.9% of the total volume. They also accounted for 4.7% of Extra EU seaborne
Support for the impact assessment of a proposal to address maritime transport greenhouse gas emissions
209
exports’ value and 2.8% of volume. Europe exports higher value products to LDCs than it imports from them: the trade balance in terms of volume is negative but it is positive (albeit small) in terms of value. The main LDC trading partners for Europe (in terms of value) are listed below.
Table 10.50: Main LDC trading partners with Europe
Main exporters to Europe Main importers from Europe
Bangladesh
Angola
Equatorial Guinea
Mozambique
Cambodia
Angola
Senegal
Bangladesh
Benin
Yemen
While LDCs play a small role in the EU’s seaborne trade, the EU may play a large role in theirs, offering a large market and sources of revenues to their economy through these imports. This would make them all the more sensitive to a change in shipping costs. Should shipping costs decrease as a result of the selected policy, these countries may benefit from an improved price-competitiveness of their products. However, as mentioned previously, it is unlikely that reductions in shipping costs would be fully passed through by operators. In order to identify these countries, we refer to UNCTAD’s 2011 report on Least Developed Countries.
10.3.11.2.1 Imports from Europe
Overall, 19.2% of LDCs’ imports come from Europe (UNCTAD, 2011) but there are significant variations across countries with some more reliant on their trade with Europe than others. As seen below, the countries that are most reliant on imports from Europe are all African LDCs.
Figure 10.30: Europe imports as a % of total LDC imports, 2010
Source: UNCTAD
In Sao Tome & Principe, Chad, Mauritania, Guinea, Senegal, Angola and the Central African Republic 40% or more of all imports come from Europe. Data on the weight of shipping in the
0
10
20
30
40
50
60
70
80
Sao
Tom
e &
Pri
ncip
e
Cha
d
Mau
rita
nia
Gui
nea
Sene
gal
Ang
ola
Cen
tral
Afr
ican
Rep
ublic
Gui
nea-
Bis
sau
Ben
in
Gam
bia
Tim
or-L
este
Nig
er
Bur
kina
Fas
o
Com
oros
Dem
ocra
tic
Rep
ublic
of
Cong
o
Mal
i
Equa
tori
al G
uine
a
Bur
undi
Mad
agas
car
Erit
rea
Tuva
lu
Rw
anda
Suda
n
Sier
ra L
eone
Ethi
opia
Moz
ambi
que
Uga
nda
Yem
en
Mal
awi
Leso
tho
Afg
hani
stan
Djib
outi
Zam
bia
Ban
glad
esh
Hai
ti
Bhu
tan
Libe
ria
Laos
Nep
al
Kiri
bati
Solo
mo
n Is
land
s
Som
alia
Cam
bodi
a
Mya
nmar
Van
uatu
Sam
oa
Tanz
ania
Togo
Support for the impact assessment of a proposal to address maritime transport greenhouse gas emissions
210
transport of imports is not available but it is likely to be very high for Sao Tome & Principe as it is an island. It is also likely to be considerable for Mauritania, Guinea, Senegal and Angola which all have a coastline. These countries will be highly sensitive to a change in the cost of shipping.
Generally, although it depends on routes, LDC imports from Europe tend to be for oil products, food or machinery.
The issue of rising and volatile food prices is a concern for LDCs. The LDC economies that are heavily dependent on imports of food and fuel had already experienced a crisis in 2007 and 2008, caused by a sharp increase in international prices. However, the assessment on EU exports of grains mentioned previously shows that any EU measure would lead to lower freight cost and no change in grain prices (as savings would be kept by the sector). Therefore, the impacts on LDC imports are expected to be insignificant.
10.3.11.2.2 Exports to Europe
Overall, Europe is the destination of 18.7% of LDCs’ exports but there are significant variations across countries with some more reliant on their trade with Europe than others. As can be seen from the chart below, over half of all exports from Sierra Leone, Mozambique, Madagascar and Bangladesh go to Europe. This represents a very high reliance on this market as an outlet for domestic production. Aside from these, a large number of other LDCs also heavily rely on the EU economy to create demand for their products.
Figure 10.31: European destinations as a percentage of total LDC exports from selected countries, 2010
Source: UNCTAD, 2011
The chart above indicates that Sierra Leone, Mozambique, Madagascar, Bangladesh, the Central African Republic and Sao Tome & Principe send more than 40% of their exports to Europe. All these countries, apart from the Central African Republic, are likely to rely heavily on shipping for exports given their geographical location. They are likely to be highly sensitive to any changes in freight costs as they tend to export lower value products to Europe, i.e. products with a lower value to weight ratio. However the ultimate impact will depend on the commodity traded and whether the shipping operators decide to pass on the
0
10
20
30
40
50
60
70
Sier
ra L
eon
e
Mo
zam
biq
ue
Mad
agas
car
Ban
glad
esh
Cen
tral
Afr
ican
Rep
ub
lic
Sao
To
me
& P
rin
cip
e
Gu
inea
Nig
er
Bu
run
di
Erit
rea
Mal
awi
Co
mo
ros
Mau
rita
nia
Tuva
lu
Eth
iop
ia
Equ
ato
rial
Gu
inea
Gam
bia
Cam
bo
dia
Lib
eria
Sen
egal
Tim
or-
Lest
e
Mya
nm
ar
Uga
nd
a
Tan
zan
ia
Bu
rkin
a Fa
so
Rw
and
a
Ben
in
Lao
s
Dem
ocr
atic
Rep
ub
lic o
f C
on
go
Leso
tho
Ch
ad
Afg
han
ista
n
Nep
al
Togo
Solo
mo
n Is
lan
ds
An
gola
Mal
i
Djib
ou
ti
Hai
ti
Zam
bia
Van
uat
u
Yem
en
Gu
inea
-Bis
sau
Sud
an
Bh
uta
n
Som
alia
Kir
ibat
i
Sam
oa
Support for the impact assessment of a proposal to address maritime transport greenhouse gas emissions
211
savings to their customers – in most cases the impacts for the commodities analysed earlier in this section were found to be insignificant.
10.3.12 Economic impacts on public authorities
The administrative burden placed on public authorities as a result of the implementation of the policies includes costs associated with the preparation and implementation of national legislation and guidelines, the oversight of compliance entities’ MRV processes, compliance inspections at ports, as well as a broad range of information communication tasks (including interactions with compliance entities). Communicating with and informing compliance entities as well as validating MRV procedures are expected to be among the largest administrative cost parameters for public authorities due to the high resource-intensiveness of these tasks.
Estimates presented in this section distinguish, where applicable, between administrative costs at the EU and Member State level. They also distinguish between compliance- and enforcement-related tasks.
Administrative costs for public authorities will vary according to the burden sharing arrangement between EU and Member State authorities. In addition, not all EU Member States will bear these costs in the same proportion. .
For all of the options under consideration, administrative set up costs are to be expected for public authorities. Establishing an industry-managed compensation fund may shift some of these tasks and costs from public authorities to industry actors.
Becoming familiar with information obligations arising from new policy measures requires significant resources Tasks such as coordination and administration, including answering questions, registration procedures, and liaising with other agents will also entail significant administrative costs for public authorities.
Public authorities would also be responsible for validating companies’ MRV procedures including monitoring plans and annual emissions reports, although in the case of the industry-managed compensation fund, validation would take place at the fund level.
Finally, other set-up arrangements may include stakeholder information material and event organisation, piloting of the scheme, and defining emission reductions target(s) if applicable.
On this basis, it was estimated that public entities would have the following set-up costs, spread across the Member States and EU bodies.
Table 10.51: Compliance-related costs for public authorities per year (€000)
MS Competent Authority
EU Competent Authority
>400GT >5,000GT >400GT >5,000GT
Familiarisation with information obligation 45 45 3 3
Information material 210 210 210 210
Informing compliance entities 610 380 740 460
Approval of plans and reports 3,000 1,800 2,500 1,500
10.3.12.2.1 Administrative burden related to enforcement
Public authorities will have a role to play in the implementation of the policies, in particular through inspections of ships. It is assumed that they would be carried out as part of existing
Support for the impact assessment of a proposal to address maritime transport greenhouse gas emissions
212
regimes and would therefore not generate additional inspections but they would increase the overall inspection time per vessel.
It is assumed that, in both scenarios, one-eighth of the vessels would undergo one inspection per year. The estimated average duration of this inspection (in addition to existing inspections) would be one hour. These are rather conservative assumptions and may need to be reviewed if more (or fewer) inspections are foreseen, or if a large number of regular physical inspections were deemed necessary.
On the basis of the assumptions above, the total yearly costs for port inspections are estimated below.
Table 10.52: Total inspection costs for public authorities per year (€000)
MS Competent Authority
>400GT >5,000GT
Familiarisation with information obligation 4.5 4.5
Inspections 100 60
TOTAL 104.5 64.5
10.3.12.3 Administrative costs for an ETS
A significant share of the administrative costs for public authorities would stem from the need to get acquainted with the scheme, understand its implications and follow up on any updates. Contacts with public authorities in a number of Member States suggest that additional administrative costs for the public sector specifically stemming from this option could be moderate, as previous ETS experience in other sectors is likely to be capitalised upon.
Estimates of the administrative burden for the public authorities are presented below, differentiating between those related to any ETS and those additional to an ETS with free allocations. It is assumed that the administrative tasks required under the free allocations ETS would be undertaken by the EU.
Table 10.53: ETS administrative burden per year for public authorities (€m)
Type of cost If applied by MS Competent Authority
If applied by EU Competent Authority
Costs common to all ETS options (apply to both scenarios)
1.78 1.0
Costs specific to ETS with free allocations 0.25-0.3
As for public authorities they could benefit from past experiences with the EU ETS and this would limit the additional administrative burdens they would incur. These burdens are estimated at around 2m between €1.5m and €2m p.a., depending on design elements and scenario, if Member State authorities were to be designated as competent authorities. These figures would be slightly lower (between €1m and €1.5m) if the scheme were to be administered at EU level. Burdens would likewise depend on the threshold used for the inclusion of vessels in the scheme as this would affect the number of compliance entities.
10.3.12.4 Compensation fund
Administrative costs for public authorities specifically stemming from this option are likely to be relatively low, as the fund would be managed by the industry. As a result, public authorities are not expected to incur any major additional administrative burden specifically stemming from this option but only those already identified as applying to all policy options under consideration.
Support for the impact assessment of a proposal to address maritime transport greenhouse gas emissions
213
10.3.12.5 Conclusions
A significant share of the administrative costs for public authorities would stem from the need to get acquainted with the scheme, understand its implications and follow up on any updates. Inspections and enforcement have also been identified as an important cost parameter. The distribution of the majority of these costs will depend on the burden sharing between EU and Member State authorities, but their order of magnitude is unlikely to vary significantly across options.
Contacts with public authorities in a number of Member States suggest that additional administrative costs for the public sector specific to a maritime ETS would be moderate, as previous ETS experience in other sectors is likely to be capitalised upon.
In all cases, administrative costs are likely to be influenced by the level of aggregation allowed within the scheme, as fixed costs per operator would presumably be lower if joint reporting and verification were possible. Public authorities would also see their administrative burden decrease as a result, as they would effectively have to oversee a smaller number of compliance entities.
Support for the impact assessment of a proposal to address maritime transport greenhouse gas emissions
214
10.4 Social impacts
10.4.1 Introduction
Shipping plays a core part in economic development as a source of low-cost transport essential to the trade of goods and services (see introduction to economic impact assessment for further detail on the sector’s contribution to the economy).
There are currently more than 1,200 seaports in the 22 maritime EU Member States and approximately 400 million passengers pass through these ports every year using ferry and cruise services (European Sea Port Organisation, 2012). In 2009, 17 ports had container traffic of more than 1 million twenty-foot container equivalent unit (TEU) throughput, led by Rotterdam, Antwerp and Hamburg (European Sea Port Organisation, 2011). There are also 367 European shipyards in 17 countries including Norway (CESA, 2011).
The shipping sector also employs a significant number of people in various sub-sectors. Total maritime employment in the EU is approximately 250,000 (BIMCO and International Shipping Federation, 2010). In addition to seafarers, there are a number of sectors that are directly linked to the shipping industry, such as shipping services, port services, maritime works, shipbuilding, ship management and brokerage, marine equipment, fisheries and seafood processing, recreational boating and offshore oil, gas and wind energy industries. Banking and financial services, research and development, education and marine equipment are sectors that are indirectly linked to the maritime sector.
The policy options considered to reduce GHG emissions from shipping could place an additional cost on the operation of the sector, and this may have repercussions on the whole spectrum of economic agents including the raw material suppliers, manufacturers and service providers, the maritime transport industry, retailers and consumers. The types of stakeholders linked to the maritime transport industry and their complex relationships are described in detail in the economic impact assessment chapter.
In this chapter, the main social impacts from each policy option have been identified and reviewed. First, all potential social impacts of the policy options were screened to identify those with high priority for inclusion in the social impact assessment resulting in seven potential social impacts being selected for further analysis. Results from the economic and environmental impact assessment were used to analyse the high-priority potential social impacts. For all impact categories, information was collected from Eurostat and academic and industry-specific literature was reviewed in order to establish a baseline for:
The number of enterprises and persons employed in the sectors and services likely to be affected;
Current practices in health and safety conditions for workers; and
The proportion of disposable income used to purchase 10 commodities.
10.4.2 Screening the likely social impacts
The first step in assessing the likely social impacts of the policy options was to understand how each option may impact on company and regulator behaviour as well as any knock-on impacts associated with this. In order to understand how the shipping industry will respond to each policy option, findings from the environmental and economic impact assessment along with a review of existing literature and social impact analysis have been used. In the figure below, we provide a simple diagram illustrating the causality between policy options, company and regulator reactions, and the potential social impacts.
Support for the impact assessment of a proposal to address maritime transport greenhouse gas emissions
215
Figure 10.32: Potential social impacts of policy options on the shipping industry
Potential social impacts under each policy option (relative to the baseline scenario) were assessed on the basis of their significance. This allowed the project team to identify the most significant impacts for further analysis as well as to provide justification as to why other types of impacts have not been considered further. The approach for the screening was based on the Commission’s supplementary guidance for assessing social impacts within the Commission Impact Assessment guidelines (European Commission, 2009).
Based on the screening exercise, the project team identified that the following potential impacts would be a high priority for inclusion in the social impact assessment:
Employment and labour markets:
o Employment change in maritime energy efficient/abatement technology suppliers and marine fuel suppliers;
o Employment change in the land-based industries covering 10 key commodities;
o Employment change in ports and distribution hubs;
o Employment change in on-board ships;
Standards and rights related to job quality:
o Changes in workers’ health and safety linked to specific GHG abatement technologies;
Social inclusion and protection of particular groups:
o Impact of changes in consumer price on socio-economic groups’ disposable income
Public health and safety:
o Impacts on human health due to the reduction in air pollutant emissions.
Support for the impact assessment of a proposal to address maritime transport greenhouse gas emissions
216
10.4.3 Employment change in the maritime sector
The ‘Porter hypothesis’ suggests that environmental regulation can generate competitive advantages in the long run where pioneering companies in abatement technologies will obtain first mover advantages and the eventual adoption of these technologies by other companies would lead to an overall innovation in the sector and may also create jobs (Porter and van der Linde, 1995). This innovation effect will be felt only if the regulations are strict enough to stimulate the development and wide-scale adoption of new technologies. A literature review by ZEW (2006) suggests that empirical evidence in whether the Porter hypothesis stands is mixed. Considering that the cap set by the Phase I of the EU ETS was not very stringent and the allocations were given free of charge, it is unlikely to have provided strong incentives for innovation in emission abatement technology development (ZEW, 2006). It further suggests that environmental regulations in the form of emissions trading schemes or taxes have a limited impact on the labour market, or a slightly positive impact if certain criteria are fulfilled.
It is difficult to find accurate, complete, up-to-date and reliable data on employment in the maritime sector in the EU and at the Member State level because of the global nature of the shipping industry and its flexibility in employing temporary workers (European Commission, 2011). The most recent information available in Eurostat is employment in the water transport sector (NACE Rev.2 class 61.1) for 2006. In 2006, 198,000 persons were employed in the water transport sector, 80% of which was in sea and coastal transport, including transport of passengers or freight over sea and coastal water, operation of excursion, cruise or sightseeing boats, operation of ferries and water taxies, transport by towing or pushing of barges and oil rigs, as well as renting of ships and boats with crew. The remaining 20% of total employment was for inland water transport of passenger or freight. Germany and Italy have the most number of persons employed in the sector, whereas the Netherlands, Greece and Germany had the most number of enterprises in the EU-27.
A more recent dataset gathered by BIMCO and International Shipping Federation (2010) shows that maritime sector employment in the EU Member States and Norway grew to around 254,000 in 2010. Approximately 78% of these seafarers are EU nationals (i.e. 198,000) employed on ships with EU flags in regular service within the EU. In some northern countries like Norway, the offshore extractive industries employ a significant number of workers
This section includes assumptions and results related to employment in shipbuilding, technology and marine fuel suppliers, as well as employment on-board ships.
10.4.3.1 Baseline Scenario
Ship Yards
The shipbuilding industry is dominated by a few large shipyards located in Korea, Japan and increasingly China (Ecorys, 2009). There are 367 smaller European shipyards in 17 countries (including Norway), with approximately 114,500 people directly employed (CESA, 2011). Europe is active in some specialised segments such as cruise vessels, offshore vessels and luxury yachts, and this is led by Germany, Italy, the Netherlands and Romania. Although these shipyards are located in Europe, ownership has partly changed to foreign, largely Korean, hands. If naval shipbuilding is included, the shipbuilding sector in the EU27, Croatia and Norway involved 9,145 enterprises with approximately 211,000 workers in 200950. The production value of ships in Europe was estimated to be €12bn in 2007, with the global ship construction estimated at €54bn (Ecorys, 2009). Germany accounted for the largest share of the European shipbuilding workforce at 16%, followed by France (14%), the Netherlands (11%) and Italy (10%) (CESA, 2010).
50
Eurostat Structural Business Statistics’ NACE 35.11 category includes both commercial and naval shipbuilding.
Support for the impact assessment of a proposal to address maritime transport greenhouse gas emissions
217
The ratio of research and development expenditure to revenue for leading European ship-builders (2 to 3%) was found to be significantly higher than their Asian counterparts (<1%) (Ecorys, 2009). In addition, European shipyards were found to build higher value ships on average compared to their Asian counterparts. This suggests that European companies are likely to have a competitive advantage in emerging technologies and are likely to benefit from policy options that promote the early uptake of these measures.
Marine equipment
The marine equipment sector is highly heterogeneous and consists of many relatively small companies, with estimates ranging from 5,000 to 9,000 suppliers worldwide (Ecorys, 2009). Many of these suppliers also provide parts to cars and aeroplanes. The European-based marine equipment manufacturers specialise in key areas such as mechanical engineering including engines, electrical engineering/electronics and steel products, supplying goods to both European and non-European shipyard customers. The total market for marine equipment was estimated to be €57bn p.a. in 2005; European firms’ market share was 36% (Ecorys, 2009). Although the largest manufacturing facilities are located in Asia, two European companies, Warstila and MAN B&W Diesel, are significant players and license their designs to, or enter joint ventures with, large Asian manufacturers (Ecorys, 2009). In 2006, the sector employed around 305,000 persons, led by Germany (24%), Poland (11%) and France (10%) (Policy Research Corporation, 2008).
Alternative energy
The market for alternative energy sources (towing kites, wind engines) for commercial shipping is relatively new and is still in development. Whilst a comprehensive study on the location of suppliers of these technologies is outside the scope of this project, it is possible to say that market leading suppliers are located within the EU (e.g. SkySails – towing kites51, Lindenau GmbH – Flettner rotors52) and that these suppliers are likely to be the main beneficiaries of policy options which result in additional investment; particularly investment in early years, before rival companies are able to build their production capacity.
Fuel suppliers
The bunker fuel supply chain includes traders, suppliers, brokers, bunker-service providers or facility operators and bunkering ports. Rotterdam is the largest bunker port in Europe with 12.2 million tonnes of bunker fuel volume, 95% of which was bunker fuel oil and the rest marine gas oil (Port of Rotterdam Authority, 2011). Rotterdam does not yet supply LNG bunkers.
Eurostat suggests that the total number or persons employed in the sector, ‘agents involved in the sale of fuels, ores, metals and industrial chemicals’ in the EU27 in 2007 was approximately 60,000. The number of persons employed in this sector is not a significant proportion of the total number of persons employed (<0.01%) in any Member State.
On-board ships
As discussed in the previous section, the TIMES model projected that trade activity levels in terms of tonnes of goods would increase by 43% from 2010 to 2030. This is a significant increase from the current level of trading activities, and it is thus expected that there would be an increase in employment on-board ships in the maritime sector.
10.4.3.2 Policy Option Analysis
The TIMES model generated annualised capital costs that would flow to the individual abatement measures. The output from the TIMES model, in the form of annualised capital cost and annual operating cost for each group of measures and for each scenario, was available for the years 2010, 2015, 2020, 2025, 2030, 2035, 2040 and 2050. These results have been discounted using 3.5% and extrapolated (as linear interpolations) to estimate the
51
Sky Sails website. Downloaded on the 28/05/2012 from: http://www.skysails.info/english/skysails-marine/ 52
Lindenau GmbH launches a Flettner rotor power ship in 2008. Downloaded on the 28/05/2012 from: http://www.boatdesign.net
Support for the impact assessment of a proposal to address maritime transport greenhouse gas emissions
218
discounted annual capital costs to energy efficiency equipment/abatement technology suppliers. Because there is some uncertainty in estimates of the capital expenditure for energy efficiency measures, the results presented in this section focus on the capital expenditure in the years 2010-2030, as:
Estimates of capital expenditure are more certain for earlier years, because where measures which have been retrofitted to existing ships, the timing of the retirement of the measure (ship) is uncertain;
Early investment is more significant in the development of emerging technology markets;
Early investment will give the greatest advantage to firms with innovative technologies; as time passes, first-mover advantages reduce;
The geographic location of suppliers of energy efficiency measures is more certain in early years and therefore conclusions on the potential benefits to EU suppliers are also more certain.
Because operational costs include labour costs, changes in operational costs allocated to certain abatement measures were used to estimate changes in employment associated with these abatement measures. It was assumed that labour and associated overhead costs are 35% of the total operating costs for all abatement measures and labour costs are on average €22.5 per hour (Eurostat estimate for 2010). Assuming that a typical employee works 40 hours per week for 48 weeks per year, this would lead to an average annual wage of €43,200. Based on these assumptions, the number of changes in employees due to changes in operating costs was estimated.
Changes in annuitized technology investment costs associated with abatement measures were also used to estimate changes in employment associated with these abatement measures. Because abatement measures varied in terms of how dependent they are on special technologies or labour, the methodological approach to estimate changes in employment from changes in investment costs first distinguished the abatement measures into the following two groups:
Technology-dependent abatement measures, which involve more nascent technologies and/or implementation of the technologies would not be labour-intensive. This group includes:
o Alternative propulsion measures, both new and retrofit, as they involve rotors, kites or solar;
o Friction reduction measures for new-build vessels, as they involve optimum hull and superstructure design; and
o Propeller measures, as they involve propeller and rudder upgrades.
Labour-dependent abatement measures, which involve existing technologies and/or implementation of the technologies that would be more labour-intensive. This group includes:
o Energy efficiency measures, as they involve engine tuning, common rail diesel fuel injection systems, speed control of pumps and fans;
o Retrofit friction reduction measures, as they involve hull coating and air lubrication; and
o Operational & maintenance measures, as they involve hull cleaning, propeller polishing, autopilot and weather routing.
For technology-dependent abatement measures, changes in employment were estimated assuming an average R&D investment of €140,000 per research employee in the EU transportation sector (Leduc, et al., 2010). In other words, we assumed that with each
Support for the impact assessment of a proposal to address maritime transport greenhouse gas emissions
219
increase or decrease of €140,000 technology investment costs, it would generate one change in employee. For labour-dependent abatement measures, this average R&D investment per employee was discounted by 50% (i.e. €70,000) to reflect that these abatement technologies may already exist and / or they are more labour intensive to implement (i.e. typically requiring less skilled employees).
For conventional HFO/MDO ships and ships fuelled with LNG there were changes in operational costs and technology investment costs due to the different levels of deployment for these types of vessels against each policy option. Employment from changes in operational costs was estimated following the same approach used for the other abatement options (i.e. HR cost is 35% of total operation costs and the average annual salary is €43,200 per employee). Employment from changes in investment costs was estimated using the shipbuilding industry-specific labour costs assumptions. Using the Eurostat information on total wages and salaries and number of persons employed in the building of ships and boats industry (NACE Rev.2 Group C 30.1), an average salary in 2009 was around €35,000 per employee. The share of labour cost in total production costs for the European shipbuilding industry was approximately 22% (Ecorys, 2009). Based on these assumptions, the changes in the numbers of employees in the shipbuilding industry due to changes in investment costs in conventional ships and LNG ships were estimated.
The impact of the policy options for capital expenditure on specific measures is discussed below.
Alternative propulsion measures
The baseline scenario considers no investment in alternative propulsion measures (i.e. Flettner rotors, kites and solar panels). The impact of all policy options is to increase expenditure on alternative propulsion measures (both new and retrofit) in all years between 2010 and 2050. The total estimated capital costs including both technology investment and operating costs, relative to the baseline in the period 2010 to 2030, are approximately €1.3-1.5bn depending on the policy options, and this would be likely to create 2,400 to 2,600 jobs in 2030.
Therefore all options considered will encourage the growth of the markets for alternative propulsion measures. As stated in the baseline section, leading suppliers of alternative propulsion measures are located in Europe and policy options which lead to the rapid uptake of these measures will allow the companies to grow and potentially gain first-mover advantages. Growth in revenues for leading suppliers in Europe is likely to increase employment of designers, engineers and back room staff over the assessment period. Growth in manufacturing jobs may be located outside the EU in order to take advantage of lower labour costs, especially in later years, after the market matures and there is greater competition on price.
Engine efficiency measures
In the baseline scenario, the total capital expenditure on engine efficiency measures (i.e. engine tuning, common rail and speed control of pumps and fans) between 2010 and 2030 is expected to be approximately €1.1bn. The impact of all policy options is to increase the net expenditure on engine efficiency measures between 2010 and 2030. The total estimated additional capital costs (relative to the baseline) in the period 2018 to 2030 are around €0.2bn for open ETS, low tax and open ETS with auctioning policy options. The extreme and less flexible policy options of high tax and closed ETS would require greater capital costs of around €1.1bn. The capital expenditure for engine efficiency measures is estimated to create 1,200 to 3,000 jobs in 2030 relative to the baseline.
All policy options are expected to encourage investment in and growth in the market for engine efficiency measures above the baseline level which should provide a boost to supplier revenues and encourage additional research and development in these measures; creating professional jobs, potentially within Europe. The open ETS with auctioning and closed ETS scenarios involve early accelerated investment in these measures, which should allow
Support for the impact assessment of a proposal to address maritime transport greenhouse gas emissions
220
existing market leaders to capitalise on first-mover advantages; all other policy options will provide a boost to the industry, but first-mover advantages are likely to be less due to the increase in funding occurring later.
Friction reduction measures
In the baseline scenario, the total capital expenditure on both new and retrofit friction reduction measures (i.e. hull coating, air lubrication, optimum hull and superstructure design) between 2010 and 2030 is expected to be approximately €10.3bn. The impact of all policy options is to increase the net expenditure relative to the baseline on engine measures. The estimated total capital costs (relative to the baseline) in the period 2010 to 2030 are €0.9bn for open ETS, low tax and open ETS with auctioning. The capital costs are higher for extreme policy options at around €4.5bn. The capital expenditure for friction reduction measures is estimated to create 2,100 to 12,000 additional jobs in 2030 relative to the baseline.
The level of additional investment in the early years indicates that these scenarios could significantly contribute to the development of the markets for air lubrication and optimised hull and superstructure technologies; current market leaders are likely to benefit from this early uptake, as rivals will not have sufficient time to develop the necessary designs and production infrastructure. The sustained level of additional expenditure up until 2050 suggests that suppliers of these technologies will have sufficient incentive to undertake further research and development, which may lead to reduced costs and further efficiency improvements in the long term.
All policy options are likely to have a positive impact on employment within the EU. Although application of hull coatings could be completed at any location globally, there is a significant body of ships that travel largely within Europe and would likely provide a demand for friction reduction measures in the EU. Furthermore, as stated in the baseline, EU ship-builders are market leaders in emerging technologies for friction reduction, such as air lubrication and optimised hull and superstructure, due to higher levels of R&D and added value. EU industries are therefore likely to benefit from the uptake of these measures by more than their 2007 share of production value, with positions created in research and development roles.
Operational and maintenance measures
The baseline scenario considers no investment in operational and maintenance measures (i.e. hull cleaning, propeller polishing, autopilot and weather routing). The impact of all policy options is to introduce an expenditure on operational and maintenance measures between 2010 and 2030. The estimated total capital costs including both technology investment and operating costs (relative to the baseline) in the period 2010 to 2030 for all scenarios are approximately €1.7 to 1.8bn. These are estimated to create 3,600-3,900 additional jobs by 2030.
The additional level of investment in these measures is likely to increase employment in the EU:
Although some maintenance measures could be conducted at any location globally, ships which predominately serve intra-European routes are unlikely to travel large distances to undertake routine and relatively low cost maintenance measures; European shipyards would benefit from increased expenditure on these measures, at least for intra-Europe shipping;
The market share of European companies in autopilot and weather routing systems is not known, but additional expenditure on these measures in early years is likely to benefit European suppliers to some extent.
Support for the impact assessment of a proposal to address maritime transport greenhouse gas emissions
221
Propeller measures
In the baseline scenario, the net expenditure on propeller measures (i.e. upgrading propeller and rudder) between 2010 and 2030 is expected to be approximately €3.6bn. All policy scenarios suggest only a small increase in capital costs (€0.1-0.2bn) compared to the baseline. The capital expenditure for all policy options is higher relative to the baseline in the early years until 2026, after which it does not increase as fast as the baseline scenario. Therefore the policy options are likely to result in a reduction in employment by 500-600 people in 2030 relative to the baseline, even though employment levels under all policy options leading up to 2026 would be higher than that of the baseline.
All policy options will lead to marginally increased growth in the markets for propeller measures in early years (10-15% increase on the baseline). The reduced level of investment in these measures from 2030 onwards (~25% reduction on baseline level) does not indicate that the absolute market for these measures would shrink; it rather suggests that the rate of growth is reduced slightly in comparison to the baseline.
Fleet measures and speed reduction
The TIMES model treats the ‘speed reduction’ and ‘economies of scale through larger ships’ measures in a different manner to other measures. Instead of assigning costs related to the uptake of these measures directly, the model creates or reduces the capacity demand for a shipping category. For example:
Where speed reduction is taken up in conventional HFO/MDO-fuelled ships, the model creates demand for additional conventional ships necessary to maintain a constant level of shipping activity (if ships slow down on a route, more ships are required to keep the shipping activity rate constant);
Where the measure ‘economies of scale in LNG ships’ is shown, the model creates a demand for larger LNG ships, but also reduces the demand for conventional LNG ships.
Because of the interrelated nature of the economies of scale and speed reduction measures, the combined impact on demand for ships should be considered together by considering total capital expenditure on conventional HFO, large HFO, conventional LNG and larger LNG ships together.
To estimate the number of additional employees due to speed reduction, it was assumed that labour and associated overhead costs are 35% of the total operating costs, labour costs are on average €22.5 per hour (Eurostat estimate for 2010), and a typical mariner works 40 hours per week for 48 weeks per year.
In the baseline scenario, the net expenditure for conventional and large HFO/MDO and LNG ships between 2010 and 2030 is expected to be approximately €905bn (93% to HFO/MDO ships; 7% to LNG ships). The impact of all policy options is estimated to increase expenditure on HFO/MDO ships and reduce expenditure on LNG ships between 2010 and 2030 relative to the baseline. As a result, there will be 64,000-68,000 additional jobs created by increased building and deployment of HFO/MDO ships, of which approximately 2,600 to 2,900 would be due to speed reduction measures. However, policies will also result in a loss of around 67,000 jobs from reduced building and deployment of LNG ships in 2030. The results suggest a net decrease in shipbuilding jobs. However, it is unlikely that the overall net loss of shipbuilding jobs would be seen in Europe. This is because the shipbuilding of HFO and LNG ships would probably be done from the ship yards which currently dominate (Korea, Japan) and are expected to expand production (e.g. China). Unlike these shipyards, the European companies are likely to benefit more from the construction of ships which incorporate emerging technologies, Therefore it is concluded that the impacts on shipbuilding in Europe is insignificant.
Support for the impact assessment of a proposal to address maritime transport greenhouse gas emissions
222
Fuel suppliers – LNG, HFO & Distillates
All policy options under consideration reduce expenditure on fossil fuels relative to the baseline in all years. As the ships improve energy efficiency to reduce GHG emissions, the fuel consumption and associated fuel costs would decrease as a result. Between 2010 and 2030, the reduction in HFO and distillate fuel costs would be around €55bn (i.e. -10%) relative to the baseline, whereas reduction in LNG fuel costs would be around €2.1bn (i.e. -11%).
Although the reduction in fuel sales will adversely impact on bunker fuel sales globally and within Europe, the negative impact of this will largely be restricted to fuel sales at ports, as:
As stated in Sections 10.3.5.2 and10.3.5.4, EU extraction of crude oil and natural gas is small when compared to the level of imports and is likely to continue to decline in the future; reduced demand from shipping is unlikely to impact this sector in Europe significantly;
Refineries supply products to a global market and transport costs are a small proportion of the price (0.4-1.7%) as stated in Section 10.3.5.3, therefore European refineries should be able to export any surpluses caused by a reduction in demand from shipping, although they may experience a reduction in margins due to higher transport costs.
Fuel suppliers - biofuels
The TIMES model results suggest no significant uptake of biofuels between 2010 and 2030 for policy options. Therefore, no impacts on biofuel processors and suppliers of biofuel inputs (e.g. farmers) are expected in the early years. In the longer term (beyond 2030), additional demand for biofuels for shipping is likely to increase the global demand for biofuels and the feedstocks used in biofuel production.
Biofuels for shipping are an emerging technology and there are a wide variety of methods for producing suitable fuels from different feedstocks. Given the uncertainty over the source of biofuels from 2030 onwards, it is not feasible to estimate what the impact of additional demand from shipping would be on EU biofuel processors and input suppliers.
10.4.3.3 Summary
In conclusion, policy options which increase expenditure on energy efficiency measures, new ships and engines will contribute to the growth of the global market for these products and companies operating in the EU will benefit as the markets grow.
It is beyond the scope of this study to undertake detailed competition analysis necessary to draw firm conclusions on whether policy options will deliver first-mover advantages to European firms (Porter hypothesis) in the long-term. However, there is evidence that some of the policy options could create the necessary conditions (i.e. regulations that are strict enough) to stimulate the development and wide-scale adoption of new technologies.
The key evidence for policy options stimulating innovation, market development and ultimately employment is as follows:
All policy options increase revenue for the suppliers of energy efficiency measures;
Certain policy options require significantly larger increases in investment, particularly in the early years, in the measures where the market is least developed (i.e. alternative energy, air lubrication, optimised hulls/superstructures). Suppliers of technologies which are at an early stage of development are more likely to realise first-mover advantages from early investment;
Support for the impact assessment of a proposal to address maritime transport greenhouse gas emissions
223
There is evidence that EU companies have a competitive advantage in new, more specific technology measures and are therefore more likely to benefit from growth in these markets.
Support for the impact assessment of a proposal to address maritime transport greenhouse gas emissions
224
Table 10.54: Additional employment relative to the baseline in 2030
Support for the impact assessment of a proposal to address maritime transport greenhouse gas emissions
225
10.4.4 Employment change in ports and distribution hubs
In order to assess the impacts on employment in ports and distribution hubs, a review of relevant literature and datasets was conducted to collect information regarding the current level of employment in the economic activities that are directly related to ports. These included ship loading and unloading operations, ship operations and services, land transport, logistics activities, cargo activities, industrial facilities and government agencies.
Official data on employment in European ports collected at the European level such as Eurostat is not available and existing information is not complete or up-to-date. Port sector activity is not separately defined in the international standard industrial classification and therefore standard economic statistics collected at the national, regional and international level do not relate directly to the ports sector. However, some information on the employment in European ports is available in a few studies.
Although the statistics may be incomplete, there are a number of economic activities directly related to ports that generate employment such as ship loading and unloading operations, ship operations and services, land transport, logistics activities, cargo activities, industrial facilities and government agencies (Notteboom, 2010). These employees include dock workers, ship agents, pilots, tug boat operators, freight forwarders, employees of port authorities, ship chandlers, warehouse operators, terminal operators and stevedores. Ports also generate employment indirectly, as those who are directly employed provide demands for goods and services locally and in the region. These sectors include shipbuilding, ship management and brokerage, marine equipment, fisheries and seafood processing, recreational boating and offshore oil, gas and wind energy industries.
10.4.4.1 Baseline Scenario
As of 3 February 2012, the European Sea Port Organisation listed on its website that there are more than 1,200 seaports in the 22 maritime EU Member States and more than 400 million passengers pass through these ports every year using ferry and cruise services. In 2009, 17 ports had container traffic of more than 1 million twenty-foot container equivalent unit (TEU) throughput, led by Rotterdam, Antwerp and Hamburg (European Sea Port Organisation, 2011). In terms of employment, ECOTEC (2006) suggests that approximately 284,000 individuals were employed in the European sea ports and their related services in 2005. Various sources of information suggest that in 2007, the Belgian, Dutch and the UK ports directly employed approximately 109,000, 167,000 and 132,000 full-time employees, respectively, which add up to 408,000 persons employed (National Bank of Belgium, 2009; Notteboom, 2010; Oxford Economics, 2009). Despite the lack of consistent data, the major employment trend in this sector is an overall decrease in direct employment by sea port services sector even with an increase in maritime traffic due to increased efficiency in ports.
The TIMES model projects trade activity levels in terms of tonnes of goods, categorising the total trade activities into three categories: (1) direct route (maritime transport); (2) route shifting (rail transport); and (3) alternative technology. Over the projection period of 2010 to 2030, the total trade activities increased from 2.4 trillion tonnes of goods traded in 2010 to 3.4 trillion tonnes of good traded, representing a 43% increase overall. This is a significant increase from the current level of trading activities, and it is thus expected that there would be an increase in employment attributable to shipping activities in ports and distribution hubs in the baseline scenario.
10.4.4.2 Policy Option Analysis
The economic impact assessment analysed the changes in shipping activity levels (relative to baseline) and modal shift from maritime to rail transport per policy option. These results were used to make a qualitative assessment of the impacts of policy options on employment in ports and distribution hubs. It was assumed that changes in the economic activities at key ports and distribution hubs would directly impact the level of employment in these locations e.g. a reduced level of economic activities in ports due to a specific policy option would be
Support for the impact assessment of a proposal to address maritime transport greenhouse gas emissions
226
likely to cause a reduction in employment level in the affected ports. In terms of modal shift to rail, ports and transport hubs with easy access to rail were assumed to be most affected by the policy options.
Each of the policy options imposes a certain level of costs and constraints on shipping operators. If the costs are significant and lead to higher freight rates, the policy option could have a negative impact on the demand for shipping services. With reduced shipping activities, terminal operators would process fewer ships and shipyards would experience a drop in demand for new ships. In addition to potential changes in the levels of total shipping activity, the policy options could also affect the distribution of shipping activity in terms of route, commodity and vessel types, and in some cases lead to some degree of modal shift away from shipping. In the case of modal shift, the economic impact assessment assumed that rail transport, which is less expensive than road transport, will absorb the shift from maritime transport.
Shipping Activity Levels
The TIMES model did not quantify changes in shipping activity in any scenario. According to the economic impact assessment, all policy options except for the extreme scenario of the high tax showed net cost savings overall. As a result, it was assumed that there would be no change in shipping activity levels and subsequently no change in the level of employment at ports and distribution hubs for all policy options except one. In the high tax policy scenario, the employment level in ports and distribution hubs would be negatively affected due to reduced shipping activity levels, and the impacts are expected be felt most significantly in the largest and busiest ports such as Rotterdam, Antwerp and Hamburg.
Modal Shift
The economic impact assessment analysed the possibility of modal shift from maritime to rail transport for different policy options. According to the results of the economic assessment, the impact of modal shift or evasion is expected to be marginal. Consequently, no negative impacts on employment due to modal shift or evasion from shipping to road and/or rail transport is expected. Considering that the policy options lead to overall cost savings, it is possible that the modal shift from road and rail to shipping would occur. In this case, there may be a positive impact on the employment in ports and transportation hubs due to an increased level of shipping activity.
Moreover, it should be noted that the significant increase in overall trade activities in the baseline projection (i.e. 43% increase between 2010 and 2030) would mean that, even with modal shift, the level of trade activities that rely on maritime transport would actually increase over time compared to the current level. For instance, trade activities for all time periods for most policy options, would be greater than trade activities in 2010. In other words, the level of employment is likely to grow along with the increased level of trade activities for all policy options compared to the 2010 level even though there may be some level of modal shift.
10.4.4.3 Summary
Employment in European ports and distribution hubs is expected to rise along with an expected growth in trading activities according to the baseline projection.
Shipping activity levels are likely to remain the same across all policy options with net cost savings. Only the extreme scenario of the high tax, with net additional costs, will lead to a decreased level of shipping activities and subsequently a potential reduction in employment in ports and distribution hubs compared to the baseline.
Support for the impact assessment of a proposal to address maritime transport greenhouse gas emissions
227
10.4.5 Employment change in the land-based industries (10 key commodities)
10.4.5.1 Introduction
Shipping is a key activity in economic growth as a source of low-cost transport, essential to the trade of goods and services. For Europe, shipping is the main mode of extra-EU trade and shipping is therefore crucial to its global competitiveness as well as operation of the internal market. As described in Section 10.3.3, shipping is essential for the trade in lower value goods and particularly those with a low price to weight/volume.
Changes in shipping costs (freight rates) due to the policy options under consideration will impact land-based EU industries, in a number of ways including the following:
Changing the cost of inputs for land-based industries. Operational costs for land-based industries which rely on imports by sea may change;
Changing the cost of imports of finished goods. Changes in freight rates will affect international competition. The scale of the impact depends upon the share of maritime freight costs in final product prices;
Changing the cost of exports from the EU. If the overall shipping costs decrease, shipping companies may pass-through the savings in transport costs to their customers including EU exporters. EU exporters should then increase their profit margins, or face a rise in demand if they pass-through the savings; both result in an improvement of international competitiveness for EU industries.
In this analysis, the change in demand for EU production (%) from the economic assessment is used alongside data on employment in industries associated with the selected commodities from Eurostat to estimate potential changes in employment in those sectors in the EU in 2030. The following points should be noted:
The analysis does not include all sectors, as the economic assessment did not consider the impact of freight rates on all commodities;
For those commodities selected for further analysis, the economic assessment does not consider ‘secondary impacts’, such as the impact of changes in commodity prices on wage demands, or the impact of price changes in goods used as inputs to the process (e.g. coal in steel manufacture);
The analysis assumes that employment in the EU in the sectors is static over the time period considered, as it is beyond the scope of this report to estimate Business-as-Usual (BAU) employment levels in 2030.
The analysis focuses on the potential impacts on total EU employment, the impact on employment in Member States identified as vulnerable in the economic impact assessment and Member States where the sector is a significant source of employment.
10.4.5.2 Petroleum products and lubricating preparation
In 2007, there were approximately 86,000 persons employed in the manufacture of refined petroleum products (NACE Rev.2 class 19.20) in the EU, accounting for less than 0.1% of total employment. Eurostat does not provide employment data in this sector for the vulnerable Member States, Ireland, Malta and the Netherlands, except for Belgium which had less than 5,000 people employed (0.1% of the total employment). Hungary had the biggest share of employment in this sector at 5,600 people (0.1%).
The policy options under consideration are expected to impact EU refineries in a number of ways: increase in the price of crude oil (input) and change in the cost of imports and exports, due to a change in transport costs. All policy options are estimated to have insignificant impacts on demand for EU production of refinery products, resulting in no significant changes in the employment level in this sector. Only the extreme scenario of the high tax is estimated to have a very small increase in EU employment of between 80 and 700 employees. The
Support for the impact assessment of a proposal to address maritime transport greenhouse gas emissions
228
impacts are likely to be insignificant for vulnerable Member States and other Member States where refineries are a significant sector.
It should be noted that these estimates are based upon a static baseline, when in reality the EU refinery sector is facing increasing international competition. Therefore, the impacts estimated above may be lower than the figures presented above, as the baseline level of employment in 2030 could be lower due to international competition.
10.4.5.3 Gas
In 2007, there were approximately 130,000 persons employed in the extraction of crude petroleum and natural gas services (NACE Rev.2 class 06.10 and 06.20) in the EU, accounting for less than 0.1% of total employment. Eurostat did not provide employment data in this sector for the vulnerable Member States, Belgium, Ireland and Malta, except for the Netherlands of which had about 5,000 persons employed (less than 0.1% of the total employment). Romania and the United Kingdom had the biggest share of employment in this sector at 56,000 people (0.6%) and 28,000 people (0.1%), respectively.
The EU is heavily dependent on imports of natural gas and opportunities to increase domestic production are limited. All policy options result in a small increase in demand for EU production of refinery products at around 0.1 - 0.3%, which may contribute to a small increase in EU employment of between 100 and 400 employees. In the extreme scenario of high tax, the impacts are more significant; change in demand for EU production of refinery products would be 1.8 to 5.4% and this may lead to an increase in EU employment of between 2,300 and 6,800 employees.
It should be noted that the impacts may be smaller as the impact assessment assumed a static baseline, when in reality EU production of natural gas is declining, and did not consider that the availability of gas reserves in the EU would constrain production.
10.4.5.4 Iron Ores
In 2007, there were approximately 20,000 persons employed in the mining of ferrous and non-ferrous metal ores (NACE Rev.2 class 07.1 and 07.2) in the EU, accounting for less than 0.1% of total employment. Eurostat did not provide employment data in this sector for the vulnerable Member States, Belgium, Ireland, Malta and the Netherlands. This sector is not significant (>0.1%) in any MS.
The EU is heavily dependent on imports of iron ores (82% of consumption) and opportunities for increasing EU production are limited. As iron ore is a low value product, with proportionately higher transport costs, the impacts of the policy options are expected to be more pronounced than for other commodities. All policy options result in a very small change in demand for EU production of iron ores around 0% to 0.3%, which would not lead to significant change in the employment in the sector. Only in the extreme case of high tax, the increase in demand for iron ores and an associated increase in employment is more significant (3-4% increase in demand and 600 to 800 additional employees). Additional employment is not significant for any specific or vulnerable Member State.
It should be noted that the impacts may be smaller as the impact assessment assumed a static baseline and did not consider that the availability of iron ore reserves in the EU would constrain production. Eurostat figures for employment in the mining of metal ores also include ores other than iron. The impact of the increase in price of iron ores estimated in the economic analysis is more likely to impact on the international competitiveness of EU Iron & Steel producers (see below).
10.4.5.5 Iron
In 2007, there were approximately 350,000 persons employed in the manufacture of basic iron and steel ferro-alloys (NACE Rev.2 class 24.1) in the EU, accounting for around 0.2% of total employment. Eurostat did not provide employment data in this sector for the vulnerable Member States, Malta and the Netherlands. The sector employed 1,300 persons in Ireland
Support for the impact assessment of a proposal to address maritime transport greenhouse gas emissions
229
(less than 0.1% of total employment) and 18,500 persons in Belgium (0.4%). Germany and Italy had the biggest share of employment in this sector at 37,400 persons (0.2%) and 44,600 (0.2%). The sector also made a significant contribution to total employment in Bulgaria (0.3%), Spain (0.1%), France (0.1%), Latvia (0.2%), Hungary (0.2%), Austria (0.4%), Poland (0.2%), Romania (0.3%), Slovenia (0.3%), Finland (0.5%), Sweden (0.4%),
All policy options result in no significant change in demand for EU production of iron, suggesting that there are expected to be no significant changes in the employment level in this sector under these policy scenarios. In the extreme scenario of high tax, there is a small increase in the demand for iron (0.5-1.1%) and an associated increase in EU employment is expected to be between 1,700 and 3,800 persons. The impacts on vulnerable Member States are estimated to be insignificant, due to the low proportion of employees in the iron and steel sector in vulnerable MSs.
10.4.5.6 Steel Products
In 2007, there were approximately 200,000 persons employed in the manufacture of tubes and other first processing of iron and steel products in the EU, accounting for less than 0.1% of total employment. Member States in which these sectors provided a significant share of total employment were: Belgium (0.1%), the Czech Republic (0.1%), Germany (0.1%), Italy (0.1%), Austria (0.1%) and Sweden (0.35%).
There is more international competition in steel products than in iron products and shipping is the major transport mode for import and exports. All policy options result in no significant change in demand for EU production of steel products, suggesting that there will be no significant changes in the employment level in this sector under these policy scenarios. In the extreme scenario of high tax, there is a small increase in the demand for iron (0.2-0.7%) and an associated increase in EU employment is expected to be 400 to 1,400 persons. Impacts on the sectors contribution to total employment in vulnerable MSs and other affected MSs would be insignificant (<0.1%).
10.4.5.7 Wearing apparel
In 2007, there were approximately 1.3 million persons employed in the manufacture of wearing apparel (NACE Rev.2 class 14), accounting for 0.6% of total employment in the EU. Member States for which the manufacture of wearing apparel was identified as a significant employer (relative to total employment) include Bulgaria (4.6%), Romania (2.8%), Lithuania (2.1%), Estonia (1.7%), Latvia (1.3%), Italy (1.2%), Poland (1.1%), Slovakia (1.1%) and Hungary (1.0%). Among the vulnerable MS, Belgium was most significant (0.2%).
In the wholesale clothing and footwear services sector and the retail sale of clothing in specialised stores sector (NACE Rev.2 class 46.42 and 47.71), there were 2.3 million persons employed in EU in 2009, accounting for 1.1% of total employment. MSs for which the sale of wearing apparel was identified as a significant employer (relative to total employment) include Ireland (1.4%), the Netherlands (1.4%) and Belgium (1.0%), UK (1.4%), Italy (1.3%) and Bulgaria (1.1%).
The international market for wearing apparel is highly competitive and shipping is one of the major transport modes for trade. All policy options result in no significant change in demand for EU production of clothing, suggesting that the impact of all scenarios on the number of persons employed in the manufacture of wearing apparel is estimated to be insignificant for the EU and all MSs considered. The impact on clothes retailers is also assumed to be zero, as no scenario resulted in a significant change in the price of wearing apparel.
10.4.5.8 Grains
The Eurostat statistics suggests the ‘manufacture of grain mill products, starches and starch products’ sector employs approximately120,000 people in the EU27, which accounts for less than 0.1% of the total employment. Statistics are not available in the Eurostat database for the number of persons employed in the production of grains, as these are included within the agricultural sector.
Support for the impact assessment of a proposal to address maritime transport greenhouse gas emissions
230
All policy options result in no significant change in demand for EU production of grains, suggesting that the impact of all scenarios on the number of persons employed in this sector is estimated to be insignificant for the EU and all MSs considered. Only the extreme high tax scenario is estimated to result in an increase of the price of grain and a corresponding increase in EU production of 0.6-0.7%. Due to the categorisation of agricultural employment in Eurostat it is not possible to estimate a corresponding increase in employment.
10.4.5.9 Office and computer machinery
The Eurostat statistics suggests that the office machinery and computers sector employs around 160,000 persons, which represents an insignificant proportion (<0.1%) of the total number of persons employed in most Member States, except for Germany (0.1%) and Ireland (0.6%).
The majority of office and IT equipment purchased within the EU is also produced here (74%), but the majority of the imports arrive by sea. The change in demand for EU production (%) is insignificant for all policy options, suggesting that there will be no significant changes in the employment level in this sector.
10.4.5.10 Motor vehicles
In 2007, there were approximately 2.3 million people employed in the manufacture of motor vehicles, trailers and semi-trailers (NACE Rev.2 class 29) in the EU, accounting for 1.1% of total employment. In 2009, the sale of motor vehicles (NACE Rev.2 class 45.1) accounted for 1.7 million people employed in the EU, accounting for 0.8% of total employment. The number of people employed in the ‘manufacture of motor vehicles, trailers and semi-trailers’ as a proportion of total employment was found to be significant (>1%) for Belgium (1.0%), the Czech Republic (2.5%), Germany (2.3%), Sweden (2%), Hungary (1.4%), Slovenia (1.1%), Slovakia (1.0%) and France (1.0%). The number of persons employed in the ‘sale of motor vehicles’ as a proportion of total employment was found to be significant (>1%) for Belgium (1.1%), the Netherlands (1.2%) and Germany (1.1%). The motor vehicle manufacturing sector is very important to the EU economy because of the jobs it creates throughout the supply chain and the export revenues generated.
All policy options result in no significant change in demand for EU production of motor vehicles, suggesting that the impact of all scenarios on the number of persons employed in this sector is estimated to be insignificant for the EU and all MSs considered. Only the extreme scenario of the high tax is estimated to result in any change in EU production (0.1% increase), which would result in an increase in EU employment of between 1,500 and 3,000 persons.
However, the increase in the number of people employed may be greater than that estimated above, as the baseline figure taken from Eurostat did not consider the number of persons employed in associated activities. The impact of all policy options on the number of people employed in the sale of motor vehicles is estimated to be negligible, as the maximum price increase estimate is €31/tonne.
10.4.5.11 Chemicals (organic, inorganic and synthetic resins)
In 2007, there were approximately 1.9 million people employed in the manufacture of chemicals and chemical products (NACE Rev.2 class 20) in the EU, accounting for 0.9% of total employment. Among vulnerable Member States, with the exception of Malta for which Eurostat did not provide information, Belgium had the highest number of employees at 68,000 persons, accounting for 1.6% of the country’s workforce. France had the highest number of persons employed in this sector with 267,000 persons (1.0%) in the EU. The manufacture of chemicals accounts for 7% of EU manufacturing turnover in 2009 and is a major source of extra-EU exports.
All policy options result in no significant change in demand for EU production of motor vehicles (<0.02%), suggesting that the impact of all scenarios on the number of persons employed in this sector is estimated to be insignificant (max. 400 persons) for the EU and all
Support for the impact assessment of a proposal to address maritime transport greenhouse gas emissions
231
MSs considered. Only the extreme scenario of high tax, policy option is estimated to result in a small (0.1-0.2%) increase in the demand, resulting in an increase in EU employment of 1,800 - 3,700 persons, No scenarios were found to have a significant impact on vulnerable Member States, or make a significant contribution to Member States’ total employment.
10.4.5.12 Summary
All policy options under consideration would have insignificant impacts on the demand for EU production of 10 key commodities and therefore EU employment in these sectors. Although the extreme scenario of the high tax policy option leads to a small increase in employment, the number of additional employees account for less than 0.01% of total employment in these sectors.
No policy option is expected to result in a significant negative impact on industries in vulnerable Member States.
Table 10.55: Change in EU employment in land-based industries in 2030
Sector Baseline employment (persons)
Increase in EU employment (persons)
Comments
Policy options (ETS and low tax)
Extreme policy option (high tax)
Refined petroleum product manufacture
86,000
Insignificant 80 – 700 Impacts may be smaller as the impact assessment assumed a static baseline in estimation and did not consider crude petroleum, gas and iron ore reserves as a constraint.
Crude petroleum and natural gas extraction
130,000 100 – 400 2,300 – 6,800
Iron ore extraction
20,000 Insignificant 600 – 800
Basic iron manufacture
350,000 Insignificant 1,700 – 3,800
Steel products manufacture
200,000 Insignificant 400 – 1,400
Wearing apparel manufacture
1.3 million Insignificant Insignificant
Retailers of wearing apparel
2.3 million Insignificant Insignificant
Grain production N/A Insignificant A small increase Eurostat provide employment in the manufacture of grain mill and starch products, not grain production.
Office and computer machinery manufacture
160,000 Insignificant Insignificant
Motor vehicle manufacture
2.3 million Insignificant 1,500 – 3,000 Increase in employment may be seen in associated sectors (e.g. sales of motor vehicles).
Support for the impact assessment of a proposal to address maritime transport greenhouse gas emissions
232
Sector Baseline employment (persons)
Increase in EU employment (persons)
Comments
Policy options (ETS and low tax)
Extreme policy option (high tax)
Chemicals manufacture
1.9 million Insignificant 1,800 – 3,700
All sectors considered
100 – 400 (< 0.01%)
8,380 – 20,200 (0.1% - 0.2%)
10.4.6 Changes in workers’ health and safety linked to specific GHG abatement technologies
10.4.6.1 Baseline Scenario
There are several international and EU policies relevant to employment, working conditions and safety in waterborne transport sector, which include the following (EU-OSHA, 2011);
The International Labour Organisation (ILO) Convention 180 concerning seafarers’ hours of work and the manning of ships;
Council Directive 1999/63/EC, which set the minimum requirements with regard to working time;
Directive 1999/95/EC, which aims to improve safety at sea, combat unfair competition from third-country ship owners and protect the health and safety of seafarers on board ships using Community ports;
Directive 2001/25/EC, which defined the minimum level of training of seafarers; and
Directive 92/29/EEC, which set the minimum safety and health requirements for improved medical treatment on board vessels.
In addition to the aforementioned legislation, the European Maritime Safety Agency (EMSA) provides technical and scientific assistance to the European Commission and Member States in the proper development and implementation of EU legislation on maritime safety, pollution by ships and security on board ships.
10.4.6.2 Policy Option Analysis
The TIMES model estimates the uptake of groups of measures over time, for the baseline and each of the policy option scenarios on the basis of least cost for the operator. For this analysis, it is assumed that the existing legislation on health and safety of seafarers is properly implemented. For instance, minimum requirements with regard to working time are met regardless of whether certain GHG abatement measures are adopted or not.
Qualitative analysis of potential health and safety impacts relevant to the individual GHG abatement measures is provided below in Table. The impacts on workers’ health and safety are likely to be insignificant as long as sufficient training is provided for the workers to be educated in how to safely operate new technologies (e.g. towing kites; air lubrication) and follow new modes of operations (autopilot adjustment).
Support for the impact assessment of a proposal to address maritime transport greenhouse gas emissions
233
Table 10.56: Likely impacts on seafarer’s occupational health and safety due to adoption of GHG measures
Group Measure Likely impacts on seafarers’ occupational health and safety
Alternative energy
Towing kites There should be sufficient training for workers involved in operating the towing kites in order to safely manage the flying system, launch and recovery system and control system components under all weather conditions. With lack of or insufficient training, workers may not know how to ensure their safety in operating the system or simply working on vessels equipped with towing kites.
Wind engines There should be a sufficient training for workers involved in operating the wind engines in order to safely manage the system components under all weather conditions. With lack of or insufficient training, workers may not know how to ensure their safety in operating the system or simply working on vessels equipped with wind engines.
Friction Optimised hull and superstructure
Considering that the measure is structural adjustment to a typical vessel, typical workers who are working on the vessel are not likely to be affected by adoption of optimised hull and superstructure.
Air lubrication Air lubrication technology on ships may require a special vessel operation techniques, therefore the workers involved in operating the ships should receive sufficient training to learn how to manoeuvre the vessels equipped with air lubrication.
Hull coatings Considering that the measure is structural adjustment to a typical vessel, typical workers who are working on the vessel are not likely to be affected by application of hull coatings or hull cleaning.
Hull cleaning
Engine Common rail technology Assuming that the engine fitted is similar to the traditional engine, no significant change in vessel manoeuvring techniques. Therefore there will be no requirements for additional health and safety training.
Main engine tuning
Operation Autopilot adjustment There should be sufficient training for workers involved in vessel operation to provide information and code of practice for autopilot adjustment and weather routing. Weather routing
Hull cleaning Considering that the measure is structural adjustment to a typical vessel, typical workers who are working on the vessel are not likely to be affected by hull cleaning, propeller polishing or hull coating.
Propeller polishing
Hull coating
Propeller Propeller & rudder upgrades
Considering that the measure is structural adjustment to a typical vessel, typical workers who are working on the vessel are not likely to be affected by propeller and rubber upgrades.
Speed reduction
Speed reduction Speed reduction of vessels may lead to seafarers to spend longer periods of time on the vessel, however assuming that the existing health and safety regulations are met this should not affect the workers.
Support for the impact assessment of a proposal to address maritime transport greenhouse gas emissions
234
Group Measure Likely impacts on seafarers’ occupational health and safety
Alternative fuels
LNG There should be sufficient training for workers involved in refuelling of the vessels in order to allow workers to fully understand what actions are required to safely fuel the vessels with LNG.
10.4.6.3 Summary
Impacts on workers’ health and safety due to adoption of GHG abatement measures are likely to be insignificant.
10.4.7 Impact of change in consumer price on socio-economic groups’ disposable income
10.4.7.1 Baseline
Certain goods that rely on sea transport, such as fuels for transport, can account for a significant share of the total household expenditure and the change in price of these commodities can certainly have direct impacts on the disposable income for households. For example, in the case of transport fuels, the ‘Consumers in Europe’ report by Eurostat (2005) provides an estimate of the proportion of household expenditure spent on fuels and lubricants for the operation of transport equipment in 1999. It ranged from 2.4% (Luxembourg) to 5.4% (Italy), and the average EU15 expenditure was 3.8%. The report does not present estimates of expenditure on fuels for different socio-economic groups, but does present figures for the range in expenditure on transport (which includes fuel use) as a proportion of household expenditure. The EU15 average ranges from 9.7% (lowest income quintile) to 16.1% (highest income quintile). This information can be used in conjunction with information on the EU15 expenditure on fuel as a proportion of expenditure on transport services (28%) to estimate the range in expenditure on fuels by different groups: 2.8% (lowest income quintile) to 4.6% (highest income quintile).
10.4.7.2 Policy Option Analysis
As a part of the economic impact assessment, changes in commodity prices in 2030 due to policy options were analysed. Based on this analysis, the social impact assessment considered how the change in consumer prices of these commodities may impact different socio-economic groups. However, it should be noted that the economic analysis did not estimate the impacts on consumer prices and a number of the commodities are not bought by consumers directly (crude oil, iron ore, iron & steel, steel products, organic chemicals).
For most policy options, the estimated price changes are zero or insignificant for all commodities. Only in the extreme scenario of the high tax were small price increases foreseen for some commodities.
Therefore, no significant impact is expected on household disposable income for different socio-economic groups for all policy options. Even under the extreme scenario of the high tax policy option, the impact is insignificant as the highest income quintile would spend an additional 0.1% of household income on transport fuels.
Support for the impact assessment of a proposal to address maritime transport greenhouse gas emissions
235
10.4.8 Impacts on human health due to reduction in CO2 and conventional air pollutant emissions
10.4.8.1 Baseline Scenario
The combustion of conventional fossil fuels on-board ships leads to the emission of air pollutants including nitrogen oxides (NOx), sulphur dioxide (SO2) and particulate matter (PM). These pollutants can travel long distances and some undergo chemical reactions in the atmosphere to form new pollutants e.g. NOx, Volatile Organic Compounds (VOCs) and carbon monoxide (CO) can react in the presence of sunlight to produce ozone in the lower atmosphere.
Exposure to these air pollutants can lead to detrimental impacts on human health. Short term impacts include irritation of the lungs, whilst longer term exposure has been linked to asthma, chronic bronchitis, heart and circulatory disease and cancer. The main health impacts of the air pollutants affected by policy options considered in this study are summarised below
Sulphur dioxide (SO2): Although concentrations of SO2 are much lower than in the past, they can still reach a level where human health is affected. Due to its acidic nature, SO2 has an irritant effect on the linings of the airways and can cause coughing, tightness in the chest and narrowing of the airways; asthmatics are more sensitive to the effects of SO2;
Nitrogen oxides (NOx): NO2 can, in high concentrations, act as an irritant to the airways and increase susceptibility to respiratory infections, although ambient concentrations are normally lower than those associated with these effects. NO2 has also been linked to increased sensitivity for asthmatics and increased likelihood of respiratory illnesses in children;
Ozone (O3): Ozone acts as an irritant to the airways and at high concentrations can irritate the eyes, nose and throat;
Particulate matter (PM): Chronic exposure to PM contributes to the risk of developing cardiovascular and respiratory diseases, as well as of lung cancer. No threshold for PM has been identified below which no damage to health is observed.
10.4.8.2 Policy Option Analysis
In order to estimate the health benefits related to these emissions reductions within the EU53, the following process was followed:
The average emissions reduction for each year was estimated by linearly interpolating between projected emissions reductions over each five year period;
It was assumed that fine particulate matter (PM2.5) is equivalent to 90% of total particulate emissions (PMtotal), which is in accordance with reports for the European Commission on the health impacts of shipping (Cofala et al, 2007).
Estimates developed under the Clean Air For Europe (CAFE) programme (AEA, 2005) for the marginal damage cost per tonne (damage cost function, DCF) of NOx, SO2 and PM2.5, emissions were applied to:
Each sea area: Atlantic (CAFE equivalent area – North East Atlantic), Baltic Sea, Mediterranean and Black Sea (CAFE equivalent area – Mediterranean Sea) and the North Sea;
Emissions at berth: 50% of the value of the average (land-based) EU-25 DCF was applied to emissions at port54;
53
Health benefits occurring outside the EU were not estimated, as these emissions occur across the globe, where there will be an extremely large variance in marginal damage caused by pollutant emissions, due to the differences in population demographics globally.
Support for the impact assessment of a proposal to address maritime transport greenhouse gas emissions
236
All DCFs were updated from 2005 to 2010 prices using EU HICP data from Eurostat;
It should be noted that the public health benefit is for the individual sea areas, which includes areas beyond the coastal regions. It was not possible to segregate public health benefit for coastal areas as the maritime emissions were only available in sea areas as a whole (rather than parts of sea areas such as coastal regions).
Four DCFs were used for each geographical area to account for the sensitivity analysis included in AEA (2005). The DCF sensitivities account for the range of damage estimates used for different elements of the health assessment, such as: PM mortality, ozone mortality, damage to crops and health sensitivity (damage to crops is included in all four DCFs).
The value of health benefits due to emissions reductions was calculated for each year, for each pollutant and each scenario by multiplying the estimated emission reductions by the appropriate DCF55;
The value of benefits for each year was discounted using a 4% discount rate (in accordance with EC Impact Assessment Guidelines) and the total benefits summed for each scenario;
The range of (discounted) benefits (i.e. damage costs avoided relative to the baseline) for each scenario are presented in 2010 prices in Error! Reference source not found. (below); the figure shown in brackets are the mean estimate.
Table 10.57: Total estimated benefits (health and crop damage) due to reductions in emissions of NOx, SO2 and PM2.5 (€bn) under each scenario for the period 2010-2030 inclusive
Benefits: low – high (mean) (€bn)
Closed ETS 6.5 - 18.3 (11.3)
Open ETS – free allocation 6.2 - 17.6 (10.9)
Open ETS – auction 6.4 - 18.0 (11.1)
Emissions tax - low 6.3 - 17.8 (11.0)
Emissions tax - high 6.5 - 18.5 (11.4)
Source: Health and crops damage costs from AEA (2005), pollution projections obtained from TIMES analysis
Note: Values are presented in 2010 prices and are discounted using a discount rate of 4%
It can be seen from Error! Reference source not found.that the value of benefits to human health and crops are significant for all sensitivities considered, with little variation between the policy options; as would be expected given the small variation in emissions reductions. When the human health and crop benefit estimates shown above are compared to the additional discounted costs of the policy options it can be seen that the inclusion of health benefits has a substantial impact on the net benefit. Inclusion of the health benefits increases the net benefit of the ‘Closed ETS’ and ‘Open ETS – free allocation’ policy options by 10-29% and the net benefit of the ‘Open ETS - auction’ and ‘Emission tax – low’ policy
54
Only 50% of the value of the EU25 DCF was applied in order to reflect that ‘at berth’ emissions are by their nature, partly on land and partly at sea. 55
The authors recognise that damage cost functions are based on the marginal change in benefits due to a reduction in emissions for the situation in 2010 and that the true marginal change in benefits in future years will be different due to changes in the baseline situation (emissions, population characteristics). However, alternative estimates of damage costs functions for future years are not currently available.
Support for the impact assessment of a proposal to address maritime transport greenhouse gas emissions
237
options by 17-48%. Inclusion of the health benefits reduces the net cost of the ‘Emissions tax – high’ policy by 5-13%.
Support for the impact assessment of a proposal to address maritime transport greenhouse gas emissions
238
11 Conclusions
11.1 Overview
This section summarises our analysis of the environmental, economic and social impacts of each of the policy options. A total of four specific policy options are considered in this report, along with several sub-options:
Emissions trading:
o Closed scheme with free allocation of credits
o Open scheme with free allocation of credits
o Open scheme with full auctioning of credits
Tax on emissions:
o Low tax level
o High tax level, set as an extreme scenario
A compensation fund:
o Based on a target level of CO2 reduction
o Based on a certain contribution per ton of CO2 emitted
The environmental, economic and social impacts of these options is summarised in the following section.
11.2 Environmental impacts
All policy options are expected to result in lower environmental impacts compared to the baseline in 2030. The closed ETS results in slightly lower (better) environmental impacts compared to all other policy options, whereas the low emission tax and contribution-based Fund results in slightly higher (worse) environmental impacts. The main difference between the options relates to the reduction in net CO2 emissions, which is significantly higher (better) for the ETS policy variants and the target-based compensation fund (due to certainty of emission reductions) The analysis suggests that for other categories of environmental impacts, the policies have similar effects.
Table 11.1: Reduction of environmental impact for each policy option compared to the baseline in 2030
Closed ETS free
allocation
Open ETS free
allocation
Open ETS full
auction-ing
Emission tax (low)
Emission tax (high)
Target-based Fund
Contribution-based
Fund
Reduction in CO2 emissions (net) in 2030
Highest
47.67 Mt CO2
Highest
47.67 Mt CO2
Highest
47.67 Mt CO2
Lowest
36.66 Mt CO2
47.32 Mt CO2
Highest
47.67 Mt CO2
Lowest
36.66 Mt CO2
Reduction in black carbon (based on reduction in HFO & MDO consumption)
Highest
(Reduction of14.4 Mtoe)
Lowest
Reduction of 10.8 Mtoe
Reduction of 10.8 Mtoe
Reduction of 10.8 Mtoe
Reduction 14.2 Mtoe
Reduction of 10.8 Mtoe
Reduction of 14.2 Mtoe
Support for the impact assessment of a proposal to address maritime transport greenhouse gas emissions
239
Closed ETS free
allocation
Open ETS free
allocation
Open ETS full
auction-ing
Emission tax (low)
Emission tax (high)
Target-based Fund
Contribution-based
Fund
Reduction in damage to ecosystems (acidification and eutrophication)
As % reduction compared to baseline in 2030
Highest
-23.3% NOx
-25.5% SO2
-21.3% CO2
-21.0% NOx
-23.6% SO2
-21.3% CO2
-21.1% NOx
-25.3% SO2
-21.3% CO2
Lowest
-21.1% NOx
-23.6% SO2
-16.4% CO2
-21.1% NOx
-25.3% SO2
-21.2% CO2
-21.1% NOx
-25.3% SO2
-21.3% CO2
Lowest
-21.1% NOx
-23.6% SO2
-16.4% CO2
Reduction in energy demand for maritime transport
13.1 Mtoe
11.9 Mtoe
11.9 Mtoe Lowest
11.8 Mtoe
Highest
13.9 Mtoe
11.9 Mtoe
Lowest
11.8 Mtoe
Reduction in non-renewable fuel consumption (HFO, MDO and LNG) in 2030
13.4 Mtoe Lowest
11.1 Mtoe
Lowest
11.1 Mtoe
Lowest
11.1 Mtoe
Highest
13.7 Mtoe
Lowest
11.1 Mtoe
Lowest
11.1 Mtoe
11.3 Economic impacts
11.3.1 Impacts on the shipping sector
Ship owners and operators will be first hit by a policy aimed at reducing GHG emissions from the shipping industry as they will bear the associated compliance and administrative costs.
Table 11.2: Summary of additional costs for the shipping industry by 2030
Type of impact
ETS closed
ETS open (free
allow-ances)
ETS open (full auction-
ing)
Tax (low) Tax (high)
Target-based
compen-sation fund
Contribution-
based compen-
sation fund
Net additional costs (€bn)
-49.2 -51.9 -22.6 -26.7 153.9 -22.6 -26.7
Total administrative burden common to all policies (€bn)
0.077 – 0.135
Total policy-specific administrative burden (€bn)
0.011-0.018
0.033-0.057
0.021-0.034
Support for the impact assessment of a proposal to address maritime transport greenhouse gas emissions
240
Type of impact
ETS closed
ETS open (free
allow-ances)
ETS open (full auction-
ing)
Tax (low) Tax (high)
Target-based
compen-sation fund
Contribution-
based compen-
sation fund
Impact on shipping activity
The impact on shipping activity is assessed for the most relevant commodities in section 1.2.5
Potential for innovation
All options will create incentives for the uptake of new abatement technologies. The option which places the most constraints on emissions from the shipping sector without alternative ways to offset them is also the one likely to make investment in new technologies most cost-effective. This option is the closed ETS.
Further, all options will generate revenues which can be recycled to support investment in abatement technology in the industry, thereby accelerating the reduction in GHG emissions. The impact of each policy in this respect will depend on the final specifications.
All the policies will generate additional investment costs for the industry as the shipping sector will need to invest in new vessels and / or abatement technologies in order to improve fuel efficiency. However, by 2030 they will also all generate considerable savings as a result of lower fuel consumption and in some cases, reduced operational costs. As no pass-through of these savings is expected/ assumed in the economic analysis, the shipping industry would have additional profits of €22.6 to €51.9 billion until 2030 under the different policy options except the high tax.
The outcome of this is that by 2030 all realistic policies are actually expected to save money for the industry in terms of overall operating costs. The open ETS with free allowances records the highest savings against the baseline, largely due to the lower capital costs implied by this option. The closed ETS offers the second most savings over the period: the higher constraints it sets means that the larger capital investment required is also counterbalanced by more important operational and fuel savings over time as the industry becomes more efficient.
The other options generate similar and smaller savings. The extent to which these cost savings will benefit those down the supply chain would depend on a wide range of factors including demand elasticity, commodities and trade routes.
In addition to the impact of the policies on the cost of undertaking shipping activity, they would also generate administrative costs. The ultimate scale of this burden will heavily depend on the design of the chosen policy, in particular with regards to the size threshold of vessels to be covered by the policy eventually selected. The policy design is also critical in minimizing the disproportionate impacts likely to affect SMEs.
The reduction in carbon emissions required by the policy options may also lead to a change in operating practices and the development of innovative technologies, which in turn would result in higher productivity and cost savings. The extent to which this is achieved can be greatly enhanced by recycling the revenues from the selected the policy to support research into abatement technologies and encourage their uptake.
All options will create incentives for the uptake of new abatement technologies. The option which places the most constraints on emissions from the shipping sector without alternative ways to offset them is also the one likely to make investment in new technologies most cost-effective. This option is the closed ETS. Further, all options will generate revenues which can be recycled to support investment in abatement technology in the industry, thereby accelerating the reduction in GHG emissions. The impact of each policy in this respect will depend on the final specifications.
Support for the impact assessment of a proposal to address maritime transport greenhouse gas emissions
241
11.3.2 Impacts on the EU internal market
The impacts on the European internal market are extremely difficult to assess given the complexities of trade relations and supply chains.
A policy for the reduction of GHG emissions from the shipping sector will have an impact on the operation of Europe’s internal market if it increases or decreases consumer choice; increases or decreases the price of consumer goods; creates or removes barriers to the free operation of businesses across Europe.
The analysis of selected commodities suggests that while policies are unlikely to increase or decrease the price of commodities, and therefore change the consumer choices, the decrease or increase of freight rates may have an impact on the profit margin of the ship operator or trigger some avoidance of the scheme. To summarise the findings from this analysis, the realistic policy options can be split into two groups:
The first group comprises of the closed ETS and open ETS with free allowances. These two options consistently lead to lower freight rates than the baseline. In most cases those savings are retained by the industry and there is no impact on EU producers or consumers. Where increases in freight occur they are smallest under these two options.
The second group is composed of: the open ETS with full auctioning and the target-based fund which uses the same modelling approach; the low emission tax and the compensation-based fund which follows the same model. The effects of these four options tend to be broadly similar.
Aside from the impacts at EU level, this report also considers how they will be distributed geographically. The countries and regions most sensitive are those which rely most on shipping for their international trade. As expected, these countries are mostly islands or countries with long coastlines. The most vulnerable of all are Ireland, Malta and the Netherlands.
11.3.3 Impacts on EU competitiveness
As mentioned earlier, the policies are expected to result in savings for the industry although the impacts vary depending on route and vessel type. Therefore, no significant impact on the EU competitiveness could be envisaged.
11.3.4 Impacts on third countries
The impacts of the policy options on third countries depend on their trade relations with Europe and which commodity they import from and export to Europe. The main commodities have already been analysed.
A group of countries is more vulnerable to changes in economic conditions than others: Least Developed Countries.
Generally, although it depends on routes, LDC imports from Europe tend to be for oil products, food or machinery. A price decrease in food products could therefore potentially be positive. Europe, as a large and wealthy market, is also an important destination for the goods and materials produced by LDCs and therefore an important source of revenue. In Sierra Leone, Mozambique, Madagascar and Bangladesh half the exports go to Europe. This represents a very high reliance on this market as an outlet for domestic production. Aside from these, a large number of other LDCs also heavily rely on the EU economy to create demand for their products. They are likely to benefit from an improvement in the price-competitiveness of their products to the extent that shipping operators may pass on cost savings. Given that all except one policy options lead in many cases to decreasing shipping costs, there are no major impacts on LDCs to be expected.
11.3.5 Conclusions
Overall, the implementation of a policy to reduce GHG emissions from the shipping sector is expected to have broadly positive or negligible economic impacts through: cost savings to the industry; the development and uptake of innovative technologies and more productive practices; and limited impacts on the trade of most commodities and the competitive position of Europe.
Support for the impact assessment of a proposal to address maritime transport greenhouse gas emissions
242
11.4 Social Impacts
In terms of employment and labour markets, all policy options will have generally positive impacts on the employment in maritime energy efficiency and GHG abatement technology suppliers. As additional investment is going into these technologies, there may be first mover advantages for European companies that are already leading the market in developing nascent GHG abatement technologies in the shipping sector.
There are likely to be no significant impacts on the land-based industries covering ten key commodities. All realistic policy options will result in net cost savings and cause the shipping activity levels to remain the same as the baseline projection. Therefore, no significant impacts are expected on the employment in ports, distribution hubs and on-board ships.
In terms of standards and rights related to job quality, all policy options will have insignificant impacts on workers’ health and safety due to the adoption of GHG abatement measures. All realistic policy options will lead to little increase in consumer price on socio-economic groups’ disposable income.
Impacts on public health and safety, particularly on human health due to the changes in CO2 and conventional air pollutant emissions, are expected to be significantly positive.
A summary of the potential social impacts of maritime GHG abatement policy options is provided below in Error! Reference source not found..
Table 11.3: Summary of the social impacts per individual policy options compared to baseline
Impacts
Policy Options
Closed ETS
Open ETS (free
allocation)
Open ETS (full
auctioning)
Low Tax
High Tax
Target-based comp. fund
Contribution-based comp.
fund
Employment change in maritime energy efficient/abatement technology suppliers and marine fuel suppliers
++ + + + ++ N/A N/A
Employment change in the land-based industries covering 10 key commodities
0+ 0+ 0+ 0+ + N/A N/A
Employment change in ports and distribution hubs
0 0 0 0 0 N/A N/A
Employment change in on-board ships
+ + + + + N/A N/A
Changes in workers’ health and safety linked to specific GHG abatement technologies
0 0 0 0 0 N/A N/A
Impact of increase in consumer price on socio-economic groups’ disposable income
0 0 0 0 0 N/A N/A
Support for the impact assessment of a proposal to address maritime transport greenhouse gas emissions
243
Impacts
Policy Options
Closed ETS
Open ETS (free
allocation)
Open ETS (full
auctioning)
Low Tax
High Tax
Target-based comp. fund
Contribution-based comp.
fund
Impacts on human health due to the changes in CO2 and conventional air pollutant emissions
++ ++ ++ ++ ++ N/A N/A
Impact types are described below:
Impact types Description Symbol
Major positive impact
The proposed policy option has a significant positive impact. ++
Minor positive impact
The proposed policy option has a minor positive impact. +
Neutral The proposed policy option does not have any impact. 0
Minor negative impact
The proposed policy option has a minor negative impact. -
Major negative impact
The proposed policy option has a significant negative impact. --
No relationship There is no clear relationship between the proposed policy option and the considered group/issues for potential impacts.
~
Uncertain The proposed policy has an uncertain relationship with the considered group/issues for potential impacts. There is no sufficient information to enable an assessment to be made.
?
Support for the impact assessment of a proposal to address maritime transport greenhouse gas emissions
244
12 References AEA, 2011. Cumulative impacts of energy and climate change policies on carbon leakage.
AEA, 2005. Damages per tonne emission of PM2.5, NH3, SO2, NOX and VOCs from each EU25 Member State (excluding Cyprus) and surrounding seas. Final report for the European Commission, March 2005. Available for download on 4 April 2012 from: http://www.cafe-cba.org/assets/marginal_damage_03-05.pdf
AEA, Entec, Marintek, MMU, DLR, CE Delft, 2008. Greenhouse gas emissions from shipping: trends, projections and abatement potential. Committee on Climate Change. http://www.theccc.org.uk/pdfs/AEA%20shipping%20report%20for%20the%20CCC.pdf
AGF, 2011. Work stream 2: paper on potential revenues from international maritime and aviation sector policy measures.
Aldy, J. & Stavins, R. 2011. The promise and problems of pricing carbon: Theory and experience. Resources for the future.
Australian Shipowners Association, 2008. Information on trials according to the Interim Guideline for Voluntary Ship CO2 Emission Indexing and its relevance to application of the EEOI for measuring ship efficiency. http://www.asa.com.au/wp-content/uploads/Emission-index-trials-report-summary.pdf
BeicipFranlab, 2003. Advice on Marine Fuel: Potential price premium for 0.5%S marine fuel; Particular issues facing fuel producers in different parts of the EU; and Commentary on marine fuels market Framework Contract of the European Commission for Technical Support in Relation to the Quality of Fuels.
BIMCO and International Shipping Federation (ISF), 2010, Manpower 2010 Update: the worldwide demand for and supply of seafarers. http://www.marisec.org/Manpower%20Study.pdf
Bloomberg, 2011. Nippon Yusen may slow container ships to save fuel on surging oil prices. Chris Cooper and Koyotaka Matsuda. March 08, 2011. URL: [http://www.bloomberg.com/news/2011-03-07/nippon-yusen-may-slow-container-ships-to-save-fuel-on-surging-oil-prices.html]. Accessed on 02/12/2011.
Brännlund, R. and T. Lundgren, 2009. Environmental Policy without Costs? A Review of the Porter Hypothesis, The International Review of Environmental and Resource Economics, 3(2), 75-117.
British Chamber of Shipping, 2009. A global cap and trade system.
C-140/79, Chemial Farmaceutici SpA v DAF SpA, European Court reports 1981 Page 00001. http://eur-lex.europa.eu/LexUriServ/LexUriServ.do?uri=CELEX:61979CJ0140:EN:HTML
CE Delft et al. 2009. Technical support for European action to reducing greenhouse gas emissions from international maritime transport. European Commission.
CE Delft, 2006. Greenhouse Gas Emissions for Shipping and Implementation Guidance for the Marine Fuel Sulphur Directive. European Commission.
CE Delft, 2008. Handbook on estimation of external costs in the transport sector: Internalisation Measures and Policies for All external Costs of Transport (IMPACT), Version 1.1.
CE Delft, 2010. A Global Maritime Emissions Trading System Design and Impacts on the Shipping Sector, Countries and Regions. Report for the Federal Ministry for the Environment, Nature Conservation and Nuclear Safety.
CE Delft, 2011. Analysis of GHG Marginal Abatement Cost Curves.
Support for the impact assessment of a proposal to address maritime transport greenhouse gas emissions
245
CEPS, 2011. The EU ETS and climate policy towards 2050. Centre for European Policy Studies. www.ceps.eu/ceps/download/4097
Charpin, 2009. Report of the working group on the modalities for the sale and auctioning of CO2 allowances. Inspecteur general des Finances. http://www.igf.finances.gouv.fr/gcp/webdav/site/igfinternet/shared/Nos_Rapports/documents/Charpin_report_CO2_auctions_post-2012.pdf
Chiffi, C. Fiorello, D. Schrooten, L. De Vlieger, I. 2007. EX-TREMIS – exploring non road transport emissions in Europe. Institute for Prospective Technological Studies.
ClientEarth, 2011. – Legal implications of EU action on GHG emissions from the International Maritime Sector, November 2011, p. 19.
CMTI, 2009. The IMO Energy Efficiency Design Index: A Netherlands Trend Study. Centre for Maritime Technology and Innovation. http://www.cmti.nl/wp-content/uploads/2011/11/110706-Rapport-CO2-Ontwerpindex-2009-AL.pdf
Cofala, J.,Amann, M., Heyes, C., Wagner, F., Klimont, Z., Posch, M., Shopp, W., Tarasson, L., Jonson, J.E., Whall, C. and Stavrakaki, A., 2007. Analysis of policy measures to reduce ship emissions in the context of the revision of the National Emissions Ceilings Directive. International Institute for Applied Systems Analysis (IIASA), Norwegian Meteorological Institute and Entec UK Ltd. Available for download on the 4th April 2012 from: http://www.iiasa.ac.at/rains/reports/IR06-107_Ships.pdf
Community of European Shipyards’ Association (CESA), 2011, CESA Annual Report 2010-2011. http://www.cesa.eu/download/aTBiYGViZ2phIGRlajJhbms2Nm0%3D%3D
Corbett, J. 2003. New Directions: Designing ship emissions and impacts research to inform both science and policy. Atmospheric Environment, Vol 37 Issue 33: 4719–4721.
Delft, Marintek, DLR, Entec & Manchester Metropolitan University, 2008. Greenhouse gas emissions from shipping: trends, projections and abatement potential. The Committee on Climate Change.
DNV, 2011. Assessment of IMO mandated energy efficiency measures for international shipping. MEPC 63/INF.2
Documents on Public consultation 2011, EU ETS Monitoring & Reporting Regulation and EU ETS Accreditation and Verification Regulation/ http://ec.europa.eu/clima/consultations/0010/index_en.htm, (accessed 22 February 2012).
Dutch emissions authority and the UK Environment Agency, 2009. Guidance for the Aviation Industry Monitoring and Reporting Annual Emissions and Tonne km Data for EU Emissions Trading. http://ec.europa.eu/clima/policies/transport/aviation/monitoring/docs/nl_guidance_en.pdf (accessed 29 February 2012).
EC, 2011. Commission welcomes the International Maritime Organization agreement to tackle CO2 emissions. European Commission press release of 18 July 2011, accessed 22 September 2011. http://ec.europa.eu/clima/news/articles/news_2011071801_en.htm
Ecorys, 2009, Study on Competitiveness of the European Shipbuilding Industry. Final Report within the Framework Contract of Sectoral Competitiveness Studies – ENTR/06/054. October 2009.
ECOTEC Research & Consulting, 2006, An exhaustive analysis of employment trends in all sectors related to sea or using sea resources. Final report for the European Commission, DG Fisheries and Maritime Affairs C3135 / September 2006.
Eide, M. S., Longva, T. Hoffmann, P., Endresen, O. Dalsoren, S. B. 2011. Future cost scenarios for reduction of ship CO2 emissions. Maritime Policy & Management, 38:1, 11-37.
El Comercio de Derechos de Emisión en España, Guía explicativa (July 2009).
Support for the impact assessment of a proposal to address maritime transport greenhouse gas emissions
246
Entec, 2008. MRV Guidance for aviation in the EU ETS Annual Emissions Draft Technical Report. European Commission.
Entec, 2010. Study to review assessments understand of the revised MARPOL Annex VI Regulations.
Entec, 2010. UK Ship emissions inventory, prepared for Defra.
European Agency for Safety and Health at Work (EU-OSHA), 2011, OSH in figures: Occupational safety and health in the transport sector – An overview. http://osha.europa.eu/en/publications/reports/transport-sector_TERO10001ENC
European Commission IMPACT ASSESSMENT Accompanying document to the Commission Regulation on the timing, administration and other aspects of auctioning of greenhouse gas emission allowances pursuant to Article 10(4) of Directive 2003/87/EC.
European Commission, 2009, Guidance for assessing Social Impacts within the Commission Impact. Assessment system. Ref. Ares (209)326974 – 17/11/2009. http://ec.europa.eu/social/BlobServlet?docId=4215&langId=en
European Commission, 2009. Study on the competitiveness of the EU tourism industry.
European Commission, 2011, Report of the Task Force on Maritime Employment and Competitiveness and Policy Recommendations to the European Commission. http://ec.europa.eu/transport/maritime/seafarers/doc/2011-06-09-tfmec.pdf
European Commission, 2011. Report of the Task Force on Maritime Employment and Competitiveness.
European Commission, 2011a. Proposal for a Council Directive amending Directive 2003/96/EC restructuring the Community framework for the taxation of energy products and electricity. URL: [http://ec.europa.eu/taxation_customs/resources/documents/taxation/com_2011_169_en.pdf, accessed 24/10/2011]
European Commission, 2011b. White Paper 2011: Roadmap to a Single European Transport Area – Towards a competitive and resource efficient transport system. URL: [http://eur-lex.europa.eu/LexUriServ/LexUriServ.do?uri=COM:2011:0144:FIN:EN:PDF, accessed 28/10/2011]
European Commission, Assessment of the Possible Development of an EU-wide NOx and SO2 Trading Scheme for IPPC Installations. http://circa.europa.eu/Public/irc/env/ippc_rev/library?l=/emissions_trading/final_report_first/report_10235i2pdf/_EN_1.0_&a=d
European Commission, IMPACT ASSESSMENT A Roadmap for moving to a competitive low carbon economy in 2050.
European Commission, Impact Assessment of the inclusion of aviation activities in the scheme for greenhouse gas emission allowance trading within the Community.
European Commission, Impact Assessment Accompanying the document Proposal for a Regulation of the European Parliament and of the Council on a mechanism for monitoring and reporting greenhouse gas emissions and other information at national and Union level relevant to climate change. http://ec.europa.eu/governance/impact/ia_carried_out/docs/ia_2011/sec_2011_1407_en.pdf
European Sea Port Organisation (ESPO), 2011, ESPO Annual Report 2010-2011. http://www.espo.be/images/stories/Publications/annual_reports/annualreport2011.pdf
Eurostat, 2005, Consumers in Europe: Facts and figures.
Eurostat, 2012. Annual detailed enterprise statistics for industry (NACE Rev.2).
Eurostat, 2011. Key figures on European business with a special feature on SMEs.
Support for the impact assessment of a proposal to address maritime transport greenhouse gas emissions
247
Federal Environment Agency (Germany),2010. Integration of Marine Transport into the European Emissions Trading System, Environmental, economic and legal analysis of different options, p. 90-91.
Fraas & Richardson, 2011. Banking on allowances. Resources for the future.
Green, 2005, Climate Change, Regulatory policy and the WTO, Journal of International Economic Law p. 154.
H. Ringbom, 2011. Global Problem – Regional Solution? International Law Reflections on an EU CO2 Emissions Trading Scheme for Ships, The International Journal of Marine and Coastal Law 26, p. 621.
Hargreaves, S., 2011. EU Law Concentrate. Law Revision and Study Guide. Second Edition. Oxford University Press. http://www.oup.com/uk/orc/bin/9780199587735/resources/answers_essays/ch05/
Hemmings, B., 2011. The CO2 Taxation Option for an EU Shipping Measure. Background Document prepared for ECCP WG Ships Meeting 2, 22-23 June 2011.
ICS, 2009. MBI analysis report. ICS Executive Committee Working Group on Greenhouse Gas Emissions and Market Based Instruments. http://www.shippingandco2.org/mbi.pdf
IEA, 2009. Transport, energy and CO2. International Energy Agency.
IETA, 2007. Report on linking GHG emissions trading systems. International Emissions Trading Association. http://www.hks.harvard.edu/fs/rstavins/Monographs_&_Reports/IETA_Linking_Report.pdf
IHS, 2011. Ships visiting European ports. Report for the European Commission.
IMAREST, 2010. Reduction of GHG emissions from ships: Marginal abatement costs and cost-effectiveness of energy-efficiency measures. Institute of Marine Engineering, Science and Technology.
IMF, 2011. Market-based instruments for international aviation and shipping as a source of climate finance. International Monetary Fund.
IMO GHG WG2/3/1, 2009. Review of the Energy Efficiency Operational Index. Intersessional meeting of the Greenhouse Gas Working Group, 2nd session, agenda item 3.
IMO MEPC 61/INF.2, 2010. Reduction of GHG emissions from ships. Marine Environment Protections Committee, 61st Session 13 August 2010. Note by the Secretariat.
IMO, 2009. Guidelines for voluntary use of the ship energy efficiency operational indicator, (EEOI). MEPC.1/Circ.684
IMO, 2009. International Shipping and Market Based Instruments 2009. MEPC 60/INF 21.
IMO, 2010. Reduction of GHG emissions from ships. Full report of the work undertaken by the Expert Group on Feasibility Study and Impact Assessment of possible Market-based Measures. Notes by the Secretariat. MEPC 61/INF.2. 13 August 2010. URL: [http://www.imo.org/ourwork/environment/pollutionpreventioN/Airpollution/documents/inf-2.pdf]. Accessed on 01/12/2011
IPCC, 2001. Third assessment report: Climate change 2001, working group III: Mitigation 425. Intergovernmental Panel on Climate Change.
IPCC, 2007b. Contribution of Working Groups I, II and III to the fourth assessment report of the Intergovernmental Panel on Climate Change. 2007, IPCC, Geneva.
Support for the impact assessment of a proposal to address maritime transport greenhouse gas emissions
248
Kageson, P. 2007. Linking CO2 emissions from international shipping to the EU ETS. Nature Associates, commissioned by the Federal Environment Agency, Germany.
Kageson, P. 2011. Options for Europe when acting alone on CO2 emissions from shipping. Background document prepared by Per Kågeson, Centre for Transport Studies, Stockholm. http://ec.europa.eu/clima/events/0036/options_en.pdf
Khee, 2006. Jin Tan, Vessel Source Pollution: The Law and Politics of international regulation, p. 219, Cambridge University Press 2006.
Kruger, J; Oates, W; Pizer, W, 2007. Decentralization in the EU ETS and lessons for global policy. Resources For The Future. http://www.rff.org/rff/Documents/RFF-DP-07-02.pdf
Lacoste, R., Franc, P. and Gambet, E. 2011. Quels attributs pour un marche european de permis d’emission de CO2 dans le transport maritime?
Leduc, G., Köhler, J., Wiesenthal, T., Tercero, L., Schade, W., Schade, B. (2010): Transport R&D Capacities in the EU. Deliverable report of GHG-TransPoRD (Reducing greenhouse-gas emissions of transport beyond 2020: linking R&D, transport policies and reduction targets). Project co-funded by European Commission 7th RTD Programme. Fraunhofer-ISI, Karlsruhe, Germany. Accessed: http://www.ghg-transpord.eu/ghg-transpord/downloads/wp6-workshop3/GHG_TransPoRD_D1_Innovation_and_RDD_Analysis.pdf~
Lindstad and Pedersen, 2009. Lindstad, H. Pedersen, J.,T., Using maritime transport to meet climate goals in Europe and the challenges for the RoPax vessels . Conference proceedings FAST 2009 Athens, Greece October 2009.
Lindstad et al, 2011 Lindstad, H. Asbjørnslett, A. H. Strømman, Reductions in greenhouse gas emissions and cost by shipping at lower speed. Energy Policy Journal 39 (2011) 3456-3464.
Lindstad et al, 2012. Lindstad, H., Asbørnslett, B., E., Pedersen, J.,T. Green Maritime Logistics and Sustainability. Maritime Logistics: Contemporary Issues. Emerald Group Publishing Limited. ISBN: 978-1-78052-340-8.
Lindstad, H. Asbjørnslett, B. E. Pedersen, J, T, 2010. Reduction of Greenhouse Gases from shipping through Technical Measures or Marked Based Instruments, Conference Proceedings IAME 2010, Lisbon Portugal.
Lun, Lei & Cheng, 2004. Shipping, logistics and management. Springer. ISBN 978-1-84882-996-1.
Lun, Y.H., Lai, K.H. and Cheng,E, 2010. Shipping and logistics management. Springer London, UK.
Marintek, 2010. Description of model for efficiency monitoring. http://www.flagship.be/media/1111/final_deliverable_d-b1_4_2.pdf
Miola, A. Ciuffo, B. Giovine, E. & Marra, M. 2010. Regulating Air Emissions from Ships. The State of the Art on Methodologies, Technologies and Policy Options, JRC Reference Reports, p. 60.
Muller, B., 2008. To Earmark or Not to Earmark?: A far-reaching debate on the use of auction revenue from EU Emissions Trading. Oxford Institute for Energy Studies. EV 43.
N. West, 2004. Marine Affairs Dictionary – Terms, Concepts, Laws, Court Cases and International Conventions and Agreements, p. 320.
National Bank of Belgium, 2009, Economic importance of the Belgian ports: Flemish maritime ports, Liège port complex and the port of Brussels – Report 2007. http://www.nbb.be/doc/oc/repec/docwpp/wp172Fr.pdf
National Renewable Energy Laboratory (NREL) (2009), Carbon taxes: a review of experience and policy design considerations. Technical Report. NREL/TP-6A2-47312. URL: [http://www.nrel.gov/docs/fy10osti/47312.pdf]. Accessed on 01/12/2011.
Support for the impact assessment of a proposal to address maritime transport greenhouse gas emissions
249
Notteboom, T., 2010, Doc labour and port-related employment in the European seaport system: Key factors to port competitiveness and reform. Report prepared for European Sea Ports Organisation (ESPO).
Oko Institute, 2011. Review of Decision No 280/2004/EC (Monitoring Mechanism Decision) in view of the agreed Climate Change and Energy package. Report prepared for DG Clima.
Oko-Institut, 2008. Tradeable permit schemes in environmental management. http://www.oeko.de/oekodoc/977/2008-317-en.pdf
Oko-Institut, 2010. Integration of marine transportation into the EU ETS. Umweltbundesamt. http://www.umweltbundesamt.de/uba-info-medien-e/mysql_medien.php?anfrage=Kennummer&Suchwort=3942
Otsubo, S. 2009. Japan’s viewpoint on CO2 emission reduction policy for international shipping. Ministry of Land, Infrastructure, Transport and Tourism, Japan. http://www.nmri.go.jp/main/cooperation/imo_iso/contents/IMO2009/GHG-symposium09/NMRI-GHG09-Otsubo.pdf
Oxford Economics, 2009. The economic contribution of ports to the UK economy. March 2009.
POLES, 2009. POLES Model. Prospective Outlook on Long-term Energy Systems.
Policy Research Corporation, 2008, The role of maritime clusters to enhance the strength and development of European maritime sectors. Commissioned by the European Commission, DG MARE. Antwerpen/Rotterdam: Policy Research Corporation.
Port of Rotterdam Authority, 2011, Port Statistics 2010.
Porter and van er Linde, 1995, Toward a New Conception of the Environment - Competitiveness Relationship. Journal of Economic Perspectives. Fall 1995.
Porter, M.E. and C. van der Linde (1995), “Toward a new conception of the environment competitiveness relationship,” Journal of Economic Perspectives 9(4), 97-118.
Shaw, M N, 2008. International Law, Sixth Edition, p. 645-646.
Stopford, M. 2009. Maritime Economics. Routledge, Abingdon, UK.
UK Department of Energy and Climate Change, 2010. Final Impact Assessment on the Order to implement the CRC Energy Efficiency Scheme.
UNCTAD, 2010. Review of maritime transport. United Nationals Conference on Trade and Development. http://www.unctad.org/en/docs/rmt2010_en.pdf
UNCTAD, 2011. Review of maritime transport. United Nationals Conference on Trade and Development.
United Nations Conference on Trade and Development (UNCTAD) (2009). Oil prices and maritime freight rates: an empirical investigations. URL: [http://www.unctad.org/en/docs/dtltlb20092_en.pdf]. Accessed: 02/12/2011.
University of Cambridge, Cambridge Econometrics, Marintek, Manchester Metropolitan University, DLR, 2009. International Shipping and Market Based Instruments, 2009. Prepared for the IMO, MEPC 60/INF.21.
West, N. 2004. Marine Affairs Dictionary – Terms, Concepts, Laws, Court Cases and International Conventions and Agreements, p. 320.
Wood Mackenzie, 2010. Impact of the use of biofuels on oil refining and fuels specifications. URL: [http://ec.europa.eu/energy/oil/studies/doc/2011_06_impact_biofuels.pdf, accessed 28/10/2011]
WSC, 2008. Record fuel prices place stress on ocean shipping. World Shipping Council. http://www.worldshipping.org/pdf/WSC_fuel_statement_final.pdf
Support for the impact assessment of a proposal to address maritime transport greenhouse gas emissions
250
WSC, 2011. Design and implementation of the vessel efficiency incentive scheme. World Shipping Council.
Wu, W. 2008. The capacity utilisation of a container shipping line. Graduate institute of Business Management, National Kaohsiung First University. http://www.lms.polyu.edu.hk/Event/IFSPA2009/IFSPA2009%20Conference%20pdf/ParSession3B/PA-3B_3.pdf
Y.H.V Lun, K-H.Lai, T.C.E. Cheng, 2010. Shipping and Logistics Management.
ZEW, 2006. The Impacts of the European Emissions Trading Scheme on Competitiveness and Employment in Europe – a Literature Review.
Support for the impact assessment of a proposal to address maritime transport greenhouse gas emissions
1
Support for the impact assessment of a proposal to address maritime transport greenhouse gas emissions
Ref: Ricardo-AEA/ED56985/Issue Number 5
Appendices
Appendix 1: Insert title here
Appendix 2: Insert title here
Appendix 3: Insert title here
Support for the impact assessment of a proposal to address maritime transport greenhouse gas emissions
Ref: Ricardo-AEA/ED56985/Issue Number 5
Appendix 1 - Title
The Gemini Building Fermi Avenue Harwell Didcot Oxfordshire OX11 0QR