Page 1
Numerical modeling and experimental testing of a Pendulum Wave Energy Converter
(PeWEC)
11 Ottobre 2017
Politecnico di TorinoCorso di dottorato in Ingegneria Meccanica – XXX Ciclo
Candidate:
Nicola Pozzi
Supervisor:
Giuliana Mattiazzo
Page 2
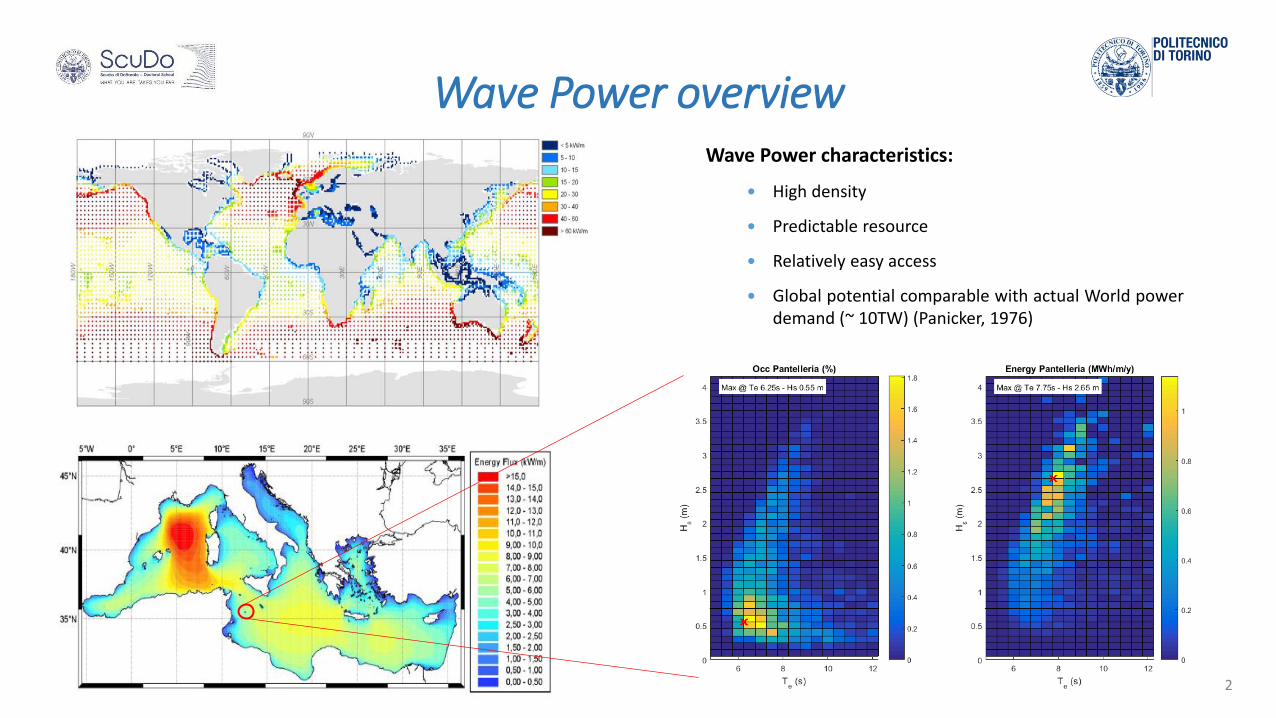
Wave Power overview
2
Wave Power characteristics:
High density
Predictable resource
Relatively easy access
Global potential comparable with actual World powerdemand (~ 10TW) (Panicker, 1976)
Page 3
Inertial based Wave Energy Converters
x
y
z
d
e
ISWEC
Working principle: gyroscope
Active device: necessity to maintain in rotationmechanical parts (auto-consumption)
Tunable with respect to sea state:
PTO control parameters
Flywheel speed
Mechanics protected against sea environment
Slack mooring line: low environmental impact
PeWEC
Working principle: oscillating mass
Passive device: no necessity to maintain in rotationmechanical parts
Tunable with respect to sea state:
PTO control parameters
Mechanics protected against sea environment
Slack mooring line: low environmental impact
3
Page 4
PeWEC numerical modeling activity
Lumped parameters Wave-to-Wire models
WEC simulation from the waves to the electrical grid
Includes all the WEC components (hull, moorings, mechanics, PTO, controller)
Purposes:
WEC design and optimization
PTO control law design and optimization
Productivity analysis in the installation site
WAVES HULL MECHANICS PTO
CONTROL
ELECTRIC GRID
MOORINGS
4
Page 5
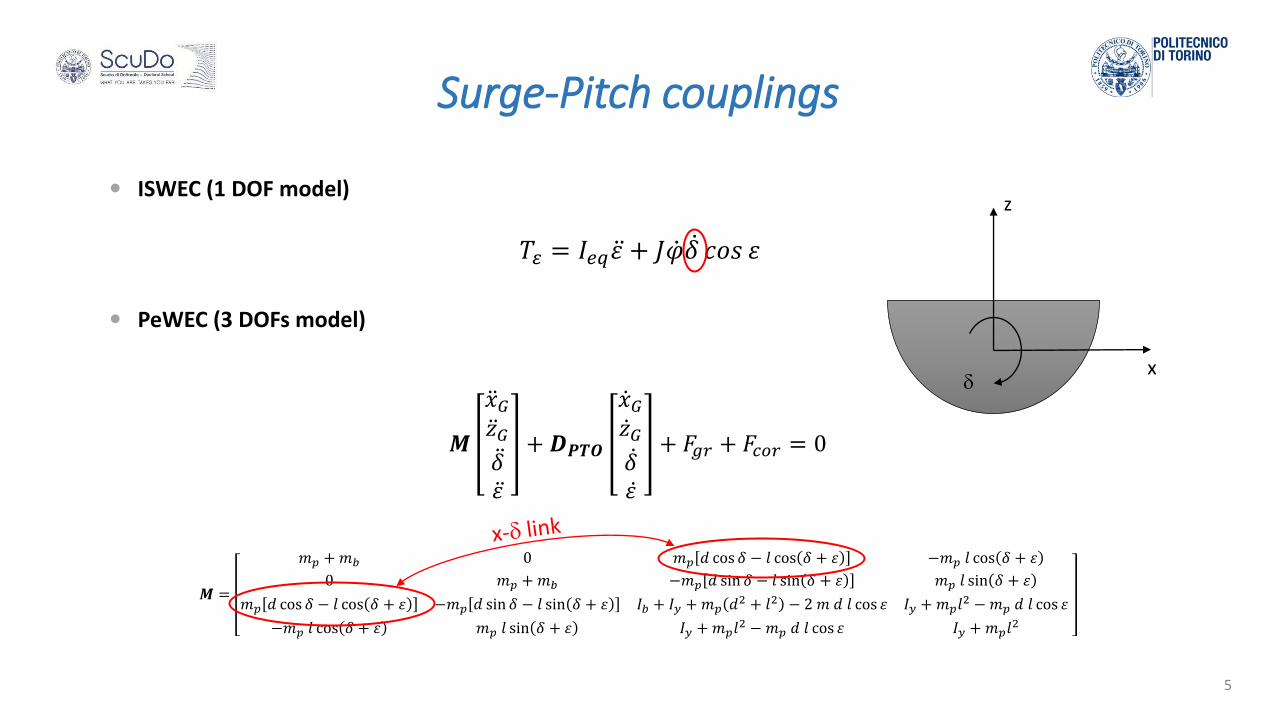
Surge-Pitch couplings
ISWEC (1 DOF model)
PeWEC (3 DOFs model)
𝑇𝜀 = 𝐼𝑒𝑞 휀 + 𝐽 𝜑 𝛿 𝑐𝑜𝑠 휀
𝑴
𝑥𝐺 𝑧𝐺 𝛿 휀
+ 𝑫𝑷𝑻𝑶
𝑥𝐺 𝑧𝐺 𝛿 휀
+ 𝐹𝑔𝑟 + 𝐹𝑐𝑜𝑟 = 0
𝑴 =
𝑚𝑝 +𝑚𝑏 0 𝑚𝑝 𝑑 cos 𝛿 − 𝑙 cos 𝛿 + 휀 −𝑚𝑝 𝑙 cos 𝛿 + 휀
0 𝑚𝑝 +𝑚𝑏 −𝑚𝑝 𝑑 sin 𝛿 − 𝑙 sin 𝛿 + 휀 𝑚𝑝 𝑙 sin 𝛿 + 휀
𝑚𝑝 𝑑 cos 𝛿 − 𝑙 cos 𝛿 + 휀 −𝑚𝑝 𝑑 sin 𝛿 − 𝑙 sin 𝛿 + 휀 𝐼𝑏 + 𝐼𝑦 +𝑚𝑝 𝑑2 + 𝑙2 − 2𝑚 𝑑 𝑙 cos 휀 𝐼𝑦 +𝑚𝑝𝑙2 −𝑚𝑝 𝑑 𝑙 cos 휀
−𝑚𝑝 𝑙 cos 𝛿 + 휀 𝑚𝑝 𝑙 sin 𝛿 + 휀 𝐼𝑦 +𝑚𝑝𝑙2 −𝑚𝑝 𝑑 𝑙 cos 휀 𝐼𝑦 +𝑚𝑝𝑙
2
z
xd
5
Page 6
3 DOF hydrodynamic model
Body mass matrix
Added-mass matrix
Radiation damping matrix
Hydrostatic stiffness
1st order incident wave forces
Mooring forces
𝑀 + 𝐴 𝜔 𝑋 + 𝐵 𝜔 + 𝐵𝑣 𝜔 𝑋 + 𝐾 𝑋 = 𝐹𝑤 𝑗𝜔 + 𝐹𝑚 𝑋 =𝑥𝑧𝛿
Linearized hydrodynamic viscous damping
6
Frequency-domain model Linear model
Body mass matrix
Added-mass matrix for infinite frequency
Convolution integral
Hydrostatic stiffness
1st order incident wave forces
𝑀 + 𝐴∞ 𝑋 + 0
𝑡
ℎ𝑟 𝑡 − 𝑡′ 𝑋𝑑𝑡′ + 𝛽 𝑋 𝑋 + 𝐾 𝑋 = 𝐹𝑤 𝑡 + 𝐹𝐷 𝑡 + 𝐹𝑚 𝑡
2nd order incident wave forces
Mooring forces
Hydrodynamic viscous damping
Time-domain model Non-linear model
Page 7
Mooring lineHypothesis
Chains assumed as rigid bodies
Quasi-static behavior
7
d
𝐹𝑚𝑥,𝑀𝑜𝑜𝑟 = 𝑓 𝑥, 𝑧, 𝛿
𝐹𝑚𝑧,𝑀𝑜𝑜𝑟 = 𝑓 𝑥, 𝑧, 𝛿
𝐹𝑚𝑟𝑦,𝑀𝑜𝑜𝑟 = 𝑓 𝑥𝐶 , 𝑧𝐶 , 𝛿, 𝐹𝑚𝑥,𝑀𝑜𝑜𝑟 , 𝐹𝑚𝑧,𝑀𝑜𝑜𝑟
Page 8
Wave Forces 1st order wave forces (Froude-Krylov forces)
Surge, heave and pitch directions
Same frequency content of the wave ( 5 -10 s)
2nd order wave forces (Drift force)
Surge only
Low frequency (50 -100 s) resonance with moorings
8
Page 9
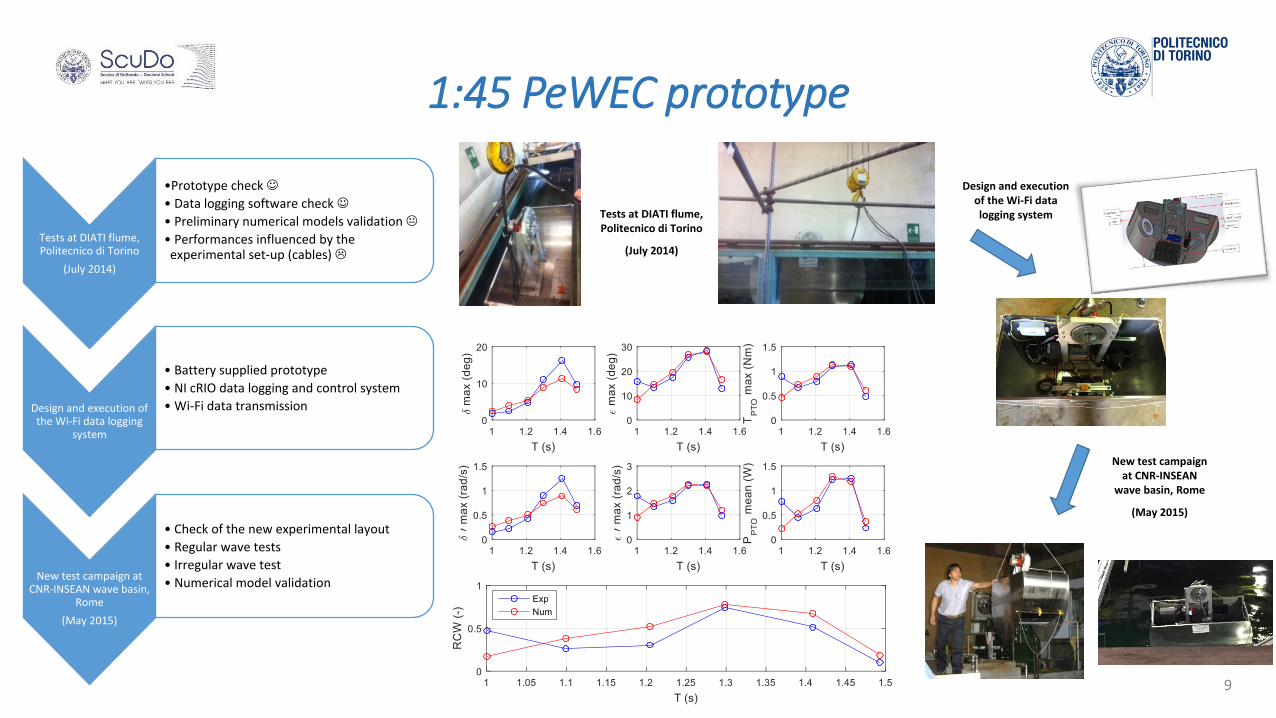
1:45 PeWEC prototype
Tests at DIATI flume, Politecnico di Torino
(July 2014)
•Prototype check
• Data logging software check
• Preliminary numerical models validation
• Performances influenced by the experimental set-up (cables)
Design and execution of the Wi-Fi data logging
system
• Battery supplied prototype
• NI cRIO data logging and control system
• Wi-Fi data transmission
New test campaign at CNR-INSEAN wave basin,
Rome
(May 2015)
• Check of the new experimental layout
• Regular wave tests
• Irregular wave test
• Numerical model validation
Tests at DIATI flume, Politecnico di Torino
(July 2014)
Design and execution of the Wi-Fi data logging system
New test campaignat CNR-INSEAN
wave basin, Rome
(May 2015)
9
Page 10
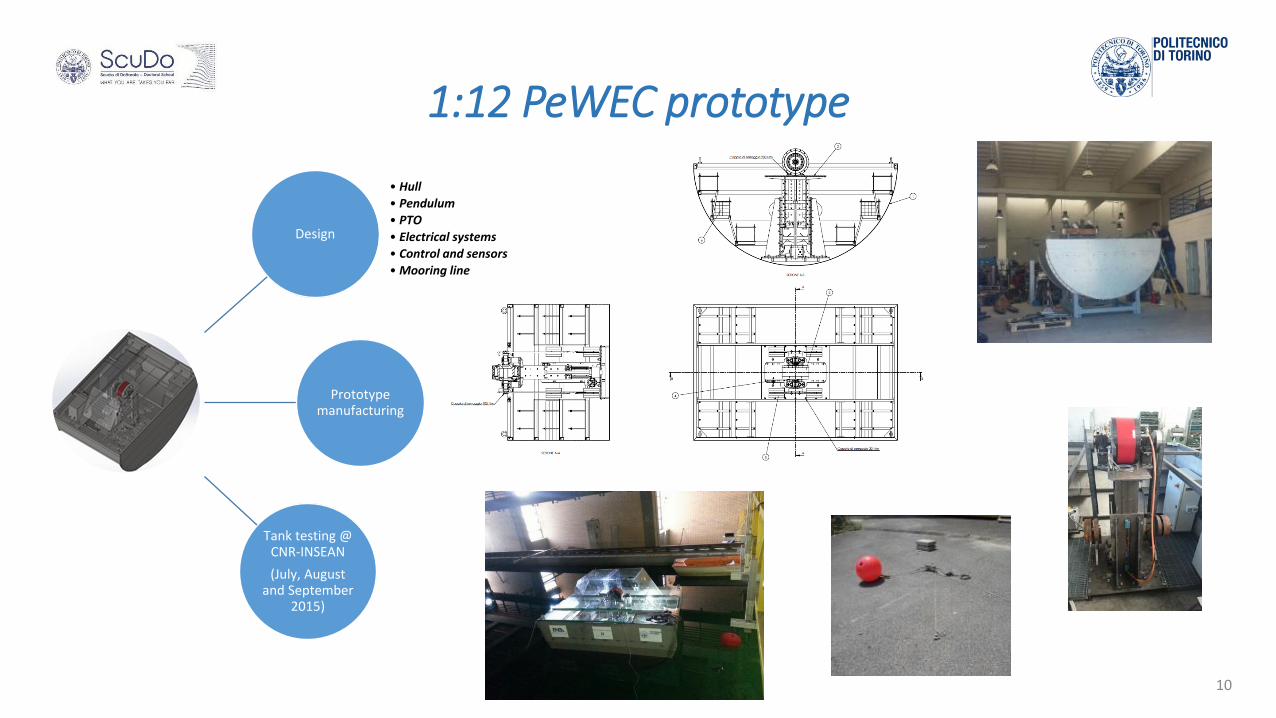
1:12 PeWEC prototype
Design
Prototype manufacturing
Tank testing @ CNR-INSEAN
(July, August and September
2015)
• Hull
• Pendulum
• PTO
• Electrical systems
• Control and sensors
• Mooring line
10
Page 11
1:12 PeWEC prototype tank testing
11
4 weeks of experimental testing
INSEAN wave basin, Rome
126 tests:
74 regular waves tests
52 irregular waves tests based on real Pantelleria Island wave climate
Data logging of the main physical variables
Hull and pendulum motions
PTO torque and power
Wave field monitoring
Regular waves properties and experimental verification in the free wave basin
Irregular waves properties and experimental verification in the free wave basin
Page 12
Pitch RAO validation
12
Regular wave tests
Fixes wave height 0,15 m
Variable wave period 1,9 – 2,4 s
Locked pendulum
𝑅𝐴𝑂 =𝑋𝑖𝐻2
=𝑓𝑖,𝑤
−𝜔2 𝑀𝑖𝑖 + 𝐴𝑖𝑖 𝜔 + 𝑗𝜔𝐵𝑖𝑖 𝜔 + 𝐾
Response Amplitude Operator (RAO): ratio between the i-thfloater motion amplitude and the wave amplitude
Page 13
Model validation (1)Regular waves tests – Frequency sweep hydrodynamic viscous damping identification
13
Page 14
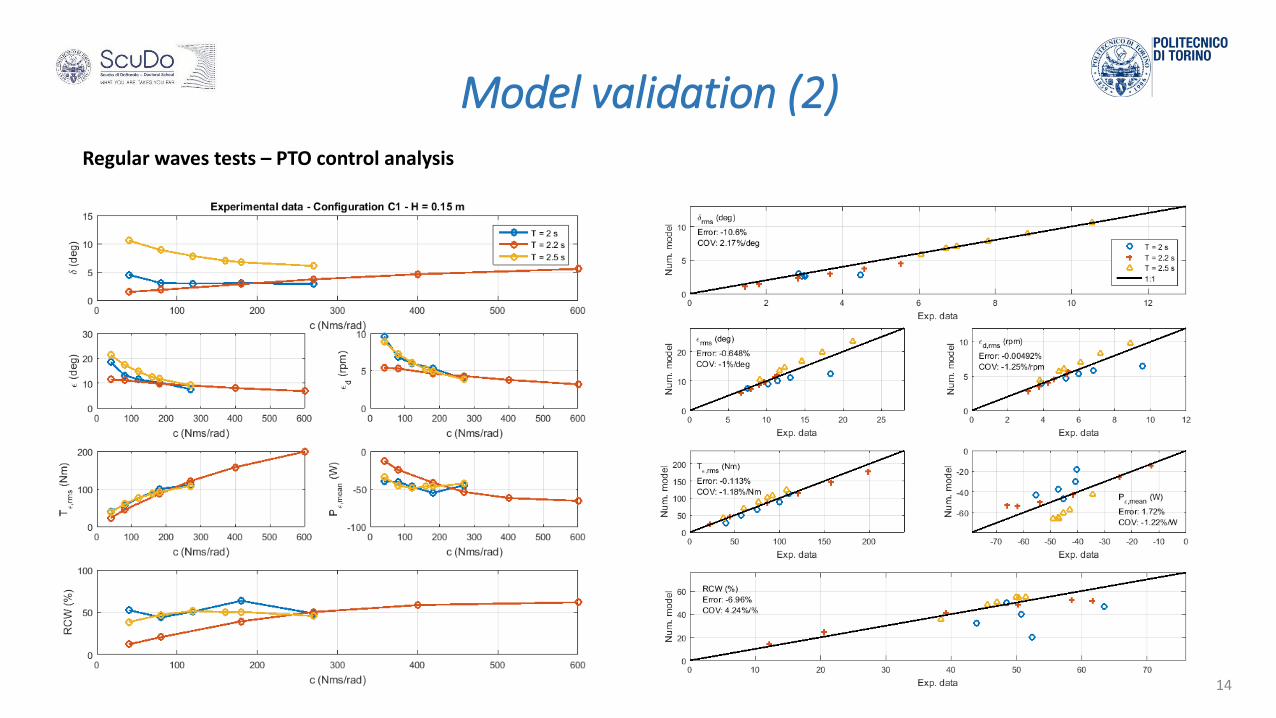
Regular waves tests – PTO control analysis
14
Model validation (2)
Page 15
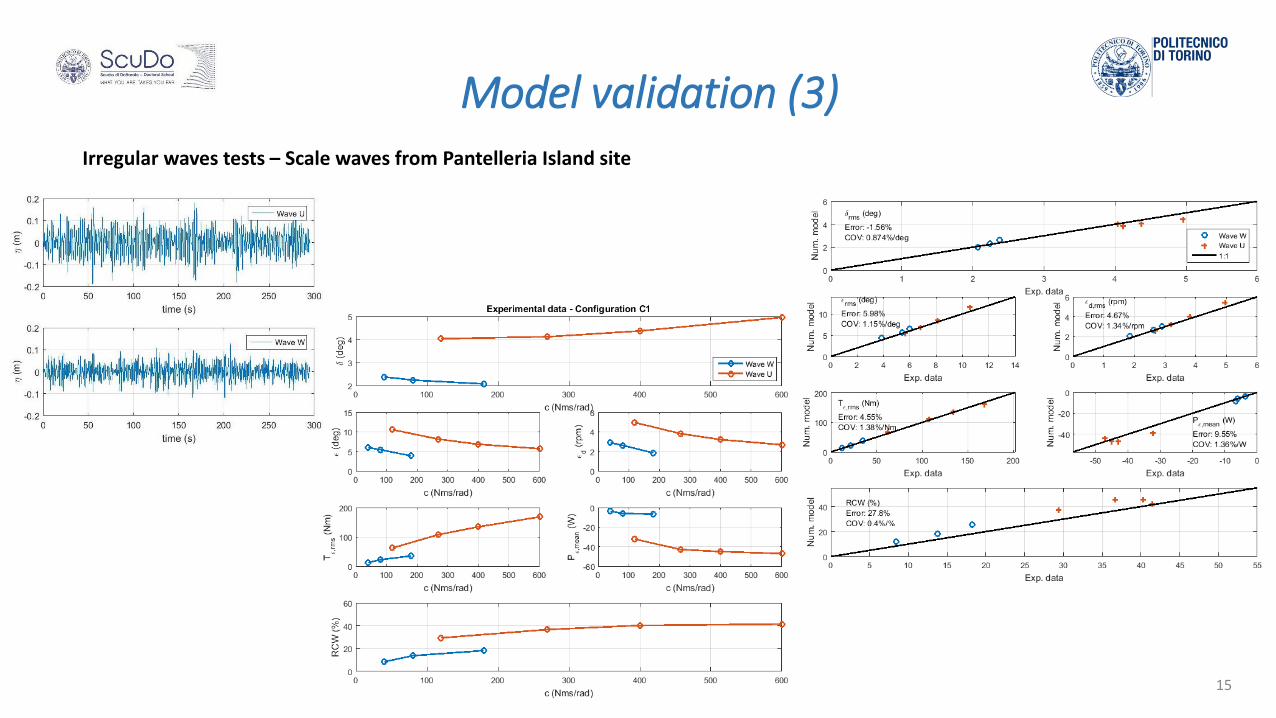
Irregular waves tests – Scale waves from Pantelleria Island site
15
Model validation (3)
Page 16
16
Full scale device design methodologyObjectives
Methodology for the design and optimization of the PeWEC device
Multiple stage optimization procedure
Inclusion of the installation site characteristics in the optimization procedure
Methodology layout
Linear Optimization Tool:
Preliminary optimization based on the frequency response of the device
Combination of the frequency response with the scatter diagram occurrences
PeWEC Design Tool:
Linear time-domain model
Optimization of the control and performances over the entire site scatter diagram
Non-linear PeWEC Parametric Tool:
Nonlinear time-domain model
Optimization of the control and performances over the entire site scatter diagram
Bearings life and saturations of the PTO are included
Fidelity Computational cost
Page 17
17
Linear Optimization Tool (LOT)
Input
Floater geometry
Hydrodynamic database
Scatter diagram occurrences
Pendulum geometry
Solver & Optimization (frequency-domain model)
Pendulum mass and dimensions
Pendulum position
Ballast mass
Extracted power
Output
Optimal configuration is determined:
Taking into account the scatter diagram occurrences
Geometrical constraints
Page 18
18
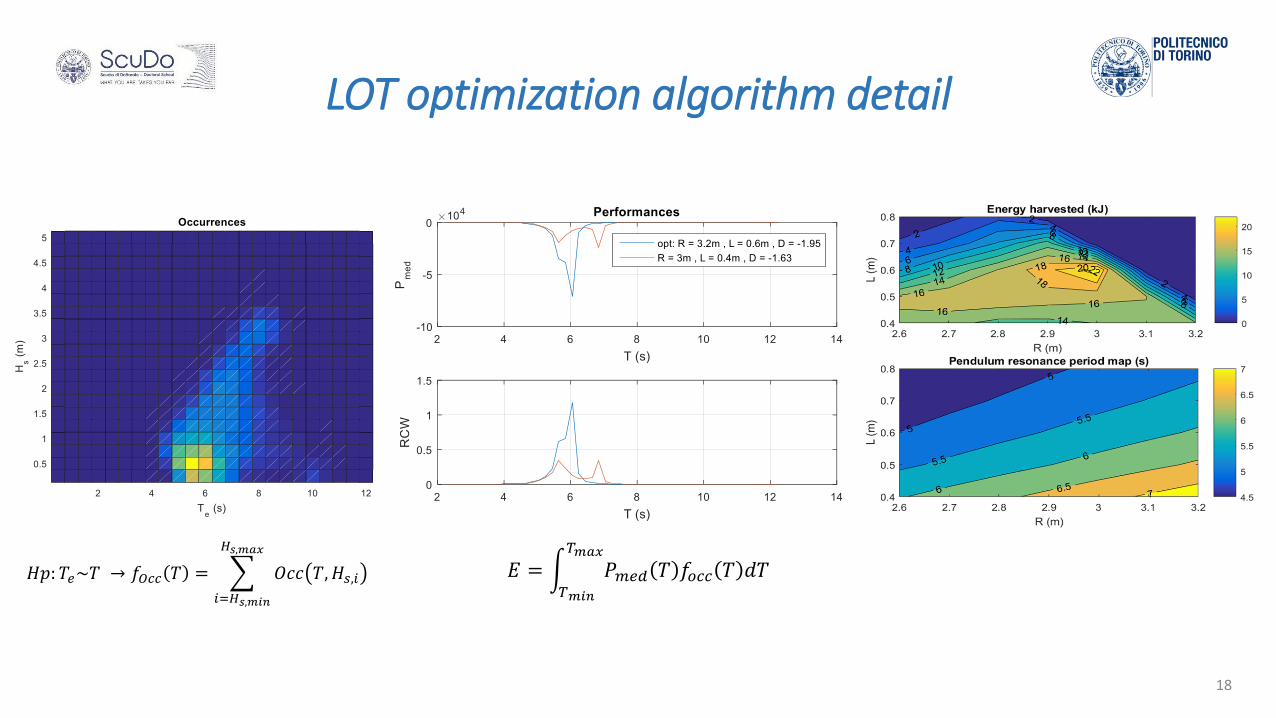
LOT optimization algorithm detail
𝐻𝑝: 𝑇𝑒~𝑇 → 𝑓𝑂𝑐𝑐 𝑇 =
𝑖=𝐻𝑠,𝑚𝑖𝑛
𝐻𝑠,𝑚𝑎𝑥
𝑂𝑐𝑐 𝑇, 𝐻𝑠,𝑖 𝐸 = 𝑇𝑚𝑖𝑛
𝑇𝑚𝑎𝑥
𝑃𝑚𝑒𝑑 𝑇 𝑓𝑜𝑐𝑐 𝑇 𝑑𝑇
Page 19
19
PeWEC Design Tool (PDT)Input
Optimal parameters from LOT
Irregular waves
Scatter diagram occurrences
PTO power and torque constraints
Solver & Optimization
Linear time domain model
System performances optimization over the scatter diagram
Output
Optimal PTO control damping map
Productivity
Floater dynamics map
Pendulum dynamics map
Bearings loads
PTO loads map
Page 20
20
Nonlinear Parametric Tool
Similar to the PDT tool but a fully nonlinear model is considered
Hydrodynamic nonlinearities
Nonlinear mooring force-displacement characteristic
Nonlinear pendulum dynamic equations
PTO velocity and torque saturations
Used for
A final verification of the LOT and PDT results
Productivity assessment and optimization
Bearings life calculation
Page 21
21
PeWEC full scale design results
Name L [m] Width [m] W central [m] Height [m] Mass system [ton]
C19A 21.4 10 3 9 501
C19B 19 10 3 8 393
C19C 16 10 3 8 335
C19D 16 8 2.5 8 268
-35
-30
-25
-20
-15
-10
-5
0
1,4 1,6 1,8 2 2,2 2,4 2,6 2,8 3 3,2
ΔP
rod
uct
ion
[%
]
Freeboard level [m]
Δ Production Of C19A, 135ton vs. freeboard
-85
-75
-65
-55
-45
-35
-25
-15
-5
5
60 80 100 120 140 160 180 200
ΔP
rod
uct
ion
[%
]
mP [kg]
Δ Production w.r.t. C19A,135ton vs. mP
A
B
C
D
Page 22
22
Pendulum technological solution and structural design
Concrete filled steel pendulum
m = 115 ton
R = 3 m
W = 1,6 m
Page 23
23
Techno-economic analysis
L
model CAPEX [€] OPEX [€] LCOE [€/MWh]
C19A115ton2800draftPTO4 679222,60 16980,57 +0%
C19A115ton2800draftPTO2 698054,71 17451,37 +3,7%
C19A135ton2800draftPTO4 752519,56 18812,99 +9,75%
C19A135ton2800draftPTO2 771351,66 19283,79 +13%
C19A135ton2800draftPTO1 757894,80 18947,37 +18%
C19B135ton1400draftPTO2 733753,10 18343,83 +54,4%
C19C90ton2800draftPTO1 581239,55 14530,99 +108,3%
C19C90ton2800draftPTO2 594696,41 14867,41 +111,6%
C19D90ton2800draftPTO2 562741,66 14068,54 +263,5%
model C19A135ton2800draftPTO1 C19A115ton2800draftPTO4
hull mass [kg] 95661 95661
mat cost [€/kg] 3 3
hull cost [€] 286984 286984
ballast mass [kg] 270708 296369
mat cost [€/kg] 0,05 0,05
ballast cost[€] 13535 14818
pend steel mass [kg] 39000 13000
pend concr mass [kg] 91600 100000
pend steel cost [€/kg] 3 3
pend concr cost [€/kg] 0,5 0,5
pendulum cost [€] 162800 89000
shaft mass [kg] 910 871
mat cost [€/kg] 10 10
shaft cost [€] 18200 17420
bearings model 24068 CC/W33 24068 CC/W33
bearings cost [€] (tot) 20000 20000
gearbox cost 37000 37000
PTO model PTO1 PTO4
PTO motor [€] 28455 35000
PTO drive [€] 10921 17000
PTO tot [€] 39375,248 52832
mooring cost [€] 120000 120000
onboard instruments [€] 60000 60000
TOT [€] 757894 679222
Page 24
24
Full-scale device features
C19A115ton2800draftPTO4
Floater
Length [m] 21
Width [m] 10
Height [m] 9
Steel mass [kg] 95661
Ballast mass [kg] 296369
Total mass [kg] 392030
Pendulum
Steel mass [kg] 15000
Concrete mass [kg] 100000
Total mass [kg] 115000
Bearings
Bearings model SKF 24068 CC/W33
Inner diameter [mm] 340
Gearbox
Ratio 10
PTO
Model Siemens 1FW3287-2E
Rated torque [Nm] 7000
Rated speed [rpm] 120
Rated power [kW] 110
Page 25
25
Conclusions & Further work
Conclusions
Numerical modeling of a pendulum based WEC
Implementation of the 3 DOF hydrodynamic model
Experimental testing of 1:45 and 1:12 scale models
Numerical model validation
Development of a design methodology for the full scaledevice
Design and techno-economic analysis of the full scaledevice for the Pantelleria Island site
Further work
LCOE reduction
Test and implementation of more sophisticatedcontrol techniques
Test of the hydraulic PTO solution
More detailed floater structural design
Improvements of the Linear Optimization Tool
Integration of a open source hydrodynamic BEM
Optimization via genetic algorithm instead of aparametric run