1 Cahier de recherche 2016-08 Political Connections, Ownership Structure and Quality of Governance Saidatou Dicko, Ph.D. Professor, Department of Accounting, School of Management, Université du Québec à Montréal, [email protected]École des sciences de la gestion, Université du Québec à Montréal (ESG-UQAM) P. O. Box 8888, Downtown postal station Montreal, Quebec, Canada H3C 3P8 UQAM
Transcript
1
Cahier de recherche 2016-08
Political Connections, Ownership Structure and Quality of Governance
Saidatou Dicko,
Ph.D.
Professor, Department of Accounting, School of Management, Université du Québec à Montréal,
Abstract: In this study, we asked if a link exists between political connections, quality of
governance and ownership structure in corporations. We then examined Canadian companies
from the 2015 S&P/TSX Composite Index. Our statistical results were mixed. According to the
bivariate analyses, being politically connected did not appear to make a significant difference in
the quality of corporate governance. Only the shareholder rights index showed a barely
significant difference in that connected companies had a higher level of governance risk than
other companies. Concentrated ownership companies had more governance risk than non-
concentrated ownership companies on the overall governance index, the board of directors index
and the shareholder rights index. When a company was both politically connected and had a
concentrated ownership, governance risk was higher than the other companies on the three
same indexes mentioned above. The results of the multivariate analyses were reversed.
Key words: political connections, ownership, companies, governance index, Canadian.
Résumé : Dans cette étude nous posons la question suivante : y-a-t-il un lien entre le fait d’être politiquement connecté, la qualité de gouvernance et la structure d’actionnariat de l’entreprise ? Nous avons alors examiné les entreprises canadiennes de l’indice S&P/TSX pour l’année 2015. Nos résultats statistiques sont mitigés. Selon les analyses bivariées, le fait d’être politiquement connecté ne semble pas faire une différence significative quant à la qualité de gouvernance des entreprises. Seul l’indice lié aux droits des actionnaires présente une différence à peine significative : les entreprises connectées sont plus risquées à ce niveau que les autres. De plus, les entreprises à actionnariat concentré présentent plus de risque de gouvernance que celles à actionnariat non concentré concernant l’indice global de gouvernance, l’indice du conseil d’administration et l’indice des droits des actionnaires. Lorsque l’entreprise est à la fois connectée politiquement et a un actionnariat concentré, son risque de gouvernance est plus élevé que les autres concernant toujours les trois indices sur cinq sus mentionnés. Les analyses multivariées présentent des résultats contraires. Mots clés : connexion politique, actionnariat concentré, entreprises, indice de gouvernance.
3
1. Introduction
Companies are central to market economic system and create wealth at all levels and in all
spheres of society. The actions of companies can therefore have an impact on the entire
population. In their role as social institutions, companies should act impeccably, respect
governance rules and adhere to a strict ethical code. Instead, crises and financial scandals in
the business world are becoming increasingly common. The corruption and collusion in the
construction industry in Quebec, which were disclosed during the Charbonneau Commission,
are just the latest relevant example in the Canadian context. The various testimony and
statements heard during the Commission showed that the construction industry in particular
uses political connection networks.
In the literature, some authors have shown that political connections in corporations are
prevalent in all sectors and in most countries worldwide (Faccio, 2006). However, few studies
have actually examined the potential impact of those connections on society as a whole,
particularly in the Canadian context. It is important and even essential to examine and better
understand the characteristics of firms with political connections in order to anticipate the
effects of the phenomenon on the economy and to regulate these effects effectively. It is an
important issue of governance for both companies and society in general.
In market economies, the most characteristic and probably most-watched aspects (usually by
investors and financial regulators) of companies are related to their governance practices. It is
also accepted that a company with good governance practices adds value and increases its
financial performance (La Porta et al., 1998; Liu, 2006; Claessens and Yurtoglu, 2013; Matoussi
and Jardak, 2012). However, several authors have agreed that companies with political
connections create more value than others because these companies are likely to receive many
benefits, including winning contracts and loans more easily and more flexible monitoring of
regulation implementation (Dinc, 2005; Charumilind et al., 2006; Faccio et al., 2016; Claessens
et al., 2008; Chen et al., 2014; Houston et al., 2014). According to this logic, companies with
political ties do not need to adopt good governance practices to create value; however, there is
no empirical evidence in the current literature that confirms this reasoning.
4
Ownership structure is an important characteristic of market economies and financial
governance (Aggarwal et al., 2009). The whole market-based governance system is centered
on the idea that companies have a dispersed ownership structure (more shareholders holding
the capital of the same company), and that there is a separation between those who manage
(managers) and those who hold capital (shareholders). But in reality, there are more
concentrated ownership companies (one owner or a majority shareholder) than dispersed
ownership companies. The type of ownership generally determines how the business is run and
therefore has a probable impact on the quality of its governance.
In this study, we asked the following question: is there a link between being politically
connected, quality of governance and ownership structure? Our objective was threefold: first, to
establish a link between being politically connected and quality of corporate governance, then
to examine the link between being politically connected and corporate ownership structure, and
finally, to investigate whether ownership structure plays a mediating or moderating role
between being politically connected and the quality of corporate governance.
2. Theoretical Foundations
There are two main approaches to corporate governance in the literature: a purely financial and
economic approach, and a sociological approach. According to proponents of the former
(primarily supported by agency theory), governance comprises a set of mechanisms intended to
control managerial actions in order to make managers’ interests converge with shareholder
interests and reduce agency costs (related to managing conflicts of interest between managers
and shareholders), as well as ensure returns on investment (Jensen and Meckling, 1976; Fama
and Jensen, 1983).
The basic presupposition of agency theory is the separation of management and ownership. In
the classical economic model, capitalist companies are supposed to be owned by several
shareholders scattered across the market, each of whom holds a small share. The shareholders
then hire a professional manager who, in return for a substantial payment, is supposed to
ensure that shareholders get a return on their investment. Given the opportunistic nature of
human beings, managers can act in their own interest at the expense of shareholders to
5
maximize their own personal utility—hence the potential conflicts of interest between
shareholders and management and the resulting costs.
Governance mechanisms are tools to ensure that managers act in the interest of shareholders.
The most important governance tool is the board of directors, which recruits, controls and
monitors managers, in addition to deciding on the salary paid to managers. The system of
internal control and the external audit that ensure the integrity of the management process.
These mechanisms reduce the cost of conflicts of interest and increase the company’s financial
value. Governance practices are a means of improving the company’s financial performance,
since they reduce management costs (Yammeersi and Herath, 2010; Claessens and Yurtolu,
2013).
Nevertheless, in capitalist economies there are many companies in which no separation exists
between ownership and management. This is the case for companies controlled by an individual
or a family. In such companies the nature of agency conflict is different than described above.
It occurs between the majority shareholder and minority shareholders. The main agency
problem in this case occurs when majority shareholders ignore the interests of minority
shareholders and make decisions that only take into account their own interests. Canada is
recognized for having many companies with a concentrated ownership structure compared to
the United States (Bozec et al., 2008).
In contrast, according to the sociological approach, governance is a set of practices that enable
companies to connect to their environment by giving access to the resources they need, and is
supported mainly by resource dependence theory (Pfeffer and Salancik, 1978). For sociologist
Mark Granovetter, economic activities are socially constructed and embedded in social
relationship networks (Granovetter, 1973; 2008); all economic activity is therefore a social
interaction.
Social capital theory states that individuals possess a certain level of inherited or acquired social
capital according to their social class, which allows them to access different types of resources
and privileges such as recognition, reputation, fame, economic capital and financial capital
(Bourdieu 1979; 1986; 2000). In companies, people with social relationships are most popular
6
because they allow economic activities to grow through their connections (Ameer et al., 2010;
DelVecchio, 2010) by facilitating access to key resources. Governance practices are therefore
mechanisms that increase social connections within companies, but always with the aim of
creating value either for individuals, organizations or both.
Whatever the approach, the most-watched governance practices by market participants and
regulatory agencies generally revolve around four main aspects: the structure and operation of
the board of directors (BoD), executive compensation structure, rights and protection of
investors, and audit and risk control (Institutional Shareholder Services, ISS,
www.issgovernance.com, accessed December 12, 2014). Quality governance should comply
with a number of standards and regulations relating to each of these four aspects, which we
will examine in this study.
3. Literature Review and Research Hypothesis
The literature on corporate governance shows that economic and institutional determinants
influence both its nature and quality. Elements such as the country’s legal system (common law
versus civil law), level of economic and financial development, level of law enforcement,
protection of shareholder rights, and culture and policy all have an impact (LaPorta et al., 1998;
Claessens and Yortuglu, 2013; Matoussi and Jardak, 2012). Moreover, authors such as Faccio
(2006) have established a link between companies’ political connections and institutional
factors, such as the level of corruption in the country and the degree of law enforcement. There
is therefore a logical link between governance and the level of corporate political connections. It
is important to empirically investigate such a link.
3.1 The Impact of Political Connections on Firms
Most previous studies of politically connected companies have looked at financial performance
and have shown that politically connected corporations perform better than firms without
political links (Ang et al., 2013; Dicko and Breton 2013a; 2013b; and El Dicko Ibrami, 2013; Li
and Xia, 2013). These studies, conducted mainly in the United States and Canada, have shown
that companies with connections have better market (Goldman et al., 2009) and accounting
performances (Dicko and Khemakhem, 2015) than companies that are not connected.
Moreover, some studies have also shown that politically connected firms get more government
7
contracts than unconnected firms, both in the United States (Wang, 2014) and Canada (Dicko,
2016).
3.2 Political Connections and Corporate Governance
So far, there is no empirical evidence of a direct link between corporate political connections
and quality of corporate governance. However, there are indications that politically connected
companies may not make much effort to improve governance quality. We note the study by
Chaney et al. (2011), which demonstrated that politically connected companies disclose poor-
quality financial information compared to companies that are not connected. The authors
argued that politically connected firms do not need to respond to market pressure to increase
the quality of information because they have easy access to financial resources. Note that in a
market economy, the information disclosed by companies is a central governance mechanism
because it reduces information asymmetry between shareholders and managers and between
majority and minority shareholders, and also reduces agency costs and problems. Following the
logic of Chaney et al.’s conclusions (2011), it is possible that firms with political ties have
sufficient resources to avoid good governance practices without suffering financially. We
therefore formulated the following hypothesis:
H1: The quality (risk) of politically connected firms’ governance is lower (higher) than
that of politically unconnected firms.
3.3 Political Connections, Governance and Ownership Structure
Some authors, such as Aggarwal et al. (2009), have argued that only companies with dispersed
ownership have a real interest in observing good governance practices because they require
stable external financing the most. In a company with a concentrated or family ownership,
much of the financing is provided by the majority shareholder. The quality of governance also
depends on the ownership structure. It is generally accepted that a company’s ownership
structure is a primary factor of its governance.
In a concentrated ownership (or family-owned) company, conflicts of interest are different,
given the lack of separation between ownership and management. Schulze et al. (2001) argued
that Jensen and Meckling’s (1976) agency model, which is based on the separation of
ownership and management, ignores family-owned firms (concentrated ownership firms)
8
because these firms may present different characteristics and agency problems in governance
and daily management than other firms.
Several studies have shown that in a market system, such as in the United States and Canada,
concentrated ownership is not associated with good governance. After examining a sample of
Canadian companies, Bozec and Bozec (2007) found a negative relationship between better
governance and ownership concentration, measured by the difference between voting rights
and cash flow rights. Bozec (2008) also showed that earnings management increases when
voting rights and property rights are separated (multiple voting shares). In addition, Bozec et
al.’s study (2010) highlighted the fact that when there is a separation between voting rights and
cash flow rights, there is a positive and significant relationship between firm value (Tobin’s Q)
and the governance risk index of Canadian companies. Also in Canada, Bozec et al. (2014)
demonstrated that the presence of dominant shareholders increases the cost of capital.
According to LaPorta et al. (1998), ownership concentration exists on every continent,
depending on the legal system (common law versus civil law). In Canada, the separation
between voting rights and cash flow rights, as well as multiple voting shares, is common and is
explained by the fact that most companies are family-owned or have concentrated ownership
(Bozec et al., 2008). It is logical to say that a concentrated ownership company is more likely to
have a low quality of governance than a dispersed ownership company. In addition, as
mentioned above, a lower quality of governance can be expected in companies with political
connections than in companies without them. This brings us to our second and third hypotheses
(H2):
H2: The quality (risk) of governance is lower (higher) for concentrated ownership
companies, whether they are politically connected or not.
H3: The quality (risk) of governance is lower (higher) for concentrated ownership
companies with political connections than for other companies.
4. Research Methodology
4.1. Sample and General Model of Analysis
9
This study will focus on Canadian companies listed on the Toronto Stock Exchange and included
in the S&P/TSX Composite Index in 2015. Approximately 250 companies were included in this
index, excluding financial institutions. The names of these companies, along with all financial
data for the study, were downloaded from the Compustat database. To meet our research
objectives, we used the general model below:
Quality of Governance = Political Connections + Ownership Structure +
Control Variables + Error Term
4.2. Variables, Measurements and Data Sources
4.2.1. The Dependent Variable: Quality of Governance
The governance index developed by ISS was used to measure quality of governance. This index
assesses corporate governance risk. The assessment is based on an average of 300 items, each
related to one of the four governance aspects most watched by regulatory agencies worldwide,
including board structure (composition, committees, practices and policies), executive
compensation, shareholder rights (voting, decision-defense against hostile control), and audit
and risk control. Items on the index are valued from 1 to 10, 1 meaning that governance risk is
very low and the company has good practices (high quality), while 10 means that the
governance risk is very high and the company has very poor practices (low quality). Note that
for each company, there is an overall index and an index for each of the four aspects. In total,
there were five sub-dependent variables: overall governance index, BoD index, compensation
structure index, shareholder rights index, and audit and risk control index.
4.2.2. The Independent Variables
We had two independent variables, political connections and ownership structure.
a- Political Connections
In the literature, a company is considered politically connected if its majority shareholder or one
of its executive officers or board members is or has been a member of government, prime
minister or head of government, member of parliament, member or leader of a political party,
10
has a connection to politicians and/or has contributed or currently contributed to political parties
(Faccio, 2006; Dicko, 2011; Dicko and Breton, 2013a; 2013b; El Dicko Ibrami, 2013).
In most studies, political connections were measured using a dichotomous variable with the
value of 1 if the firm was politically connected and 0 otherwise. To better capture the effects of
companies’ political connections, it is important to think differently about how to measure them.
For this study, we decided to use three variables to measure political connections:
– Being politically connected (political connections): this variable was equal to 1 if the
firm was politically connected and 0 otherwise.
– Number of political connections, measured by the number of people with political
connections among BoD and executive members. This variable was split into two: the number
of political connections on the BoD (political connections—BoD) and the number of political
connections among the executive (political connections—executive). Decision-making power is
not the same on the BoD as on the executive management team.
Information on political connections was collected from the BoardEx database, which lists the
organizational affiliations of hundreds of thousands of managers and directors worldwide. For
each company, the database provides past and current information on the personal and
professional backgrounds of each manager and member of the board.
b- Ownership Structure
In the literature, a company was usually called a concentrated (or family) ownership when one
shareholder (or members of the same family) controlled 10% or more of its capital (Corbetta
and Salvato, 2004; and Boubaker Labégorre, 2008; Bozec et al., 2008). To measure ownership
structure, we chose three key indicators:
– Concentration of ownership: the variable took the value of 1 if the ownership was
concentrated and 0 otherwise.
– Managerial ownership: when executive members hold shares in the company, it is
recognized as a governance mechanism that reduces agency costs, because the interests of
shareholders and managers are aligned. However, some authors, such as Wright et al. (1996),
argued that beyond a certain threshold of shares held by managers, managerial ownership
11
becomes counterproductive (over 5% or 7.5%). In this study, we chose to integrate the
percentage of shares held by the entire management team into our model of analysis.
– Institutional shareholders: we also integrated the percentage of shares held by
institutional investors, as they are recognized as important players in corporate governance
oversight in market economies. Governance indices used in this study were developed by an
institutional investor service.
Information on shareholding was collected from circulars and annual reports. These documents
are available at www.sedar.com.
4.2.3. The Control Variables
Previous studies (Aggarwal et al., 2009) have suggested that the following variables can
influence a company’s quality of governance:
– Firm size: measured by the natural logarithm of total revenue
– Indebtedness: measured by the total long-term debt to total equity
– Company value: measured by the market-to-book ratio (market value divided by total
equity)
– Relative cash: measured by total cash divided by total assets
– Property, plant and equipment (PP&E): measured by the total net tangible assets to
total assets
– Industry: measured by a dichotomous variable that takes the value of 1 to 19 based
on industry according to the North American Industry Classification System (NAICS), as follows:
1 for agriculture, forestry, fishing and hunting; 2 for mining, quarrying, and oil and gas
extraction; 3 for utilities; 4 for construction; 5 for manufacturing; 6 for wholesale trade; 7 for
retail trade; 8 for transportation and warehousing; 9 for information and cultural industries; 10
finance and insurance; 11 for real estate and rental and leasing; 12 for professional, scientific
and technical services; 13 for management of companies and enterprises; 14 for administrative
and support, waste management and remediation services; 15 for educational services; 16 for
health care and social assistance; 17 for arts, entertainment, and recreation; 18 for
accommodation and food services; and 19 for other services
– Listing on a U.S. stock exchange, measured by a dichotomous variable that takes the
value of 1 if the company is listed on a U.S. stock exchange and 0 otherwise. It is generally
12
recognized that U.S. markets are more stringent than Canadian markets in terms of governance
regulations, so Canadian companies that are also listed on a U.S. exchange should have better
governance practices.
These variables were used in our model above as control variables. The financial data relating
to these controls were downloaded from Compustat. Other data (industry and trading on U.S.
stock exchanges) were collected from www.sedar.com.
Ultimately, the objective of this study was to see if concentrated ownership plays a mediating or
moderating role in the relationship between political connections and quality of governance for
Canadian companies. After analyzing data from 2015, we got mixed statistical results. The
results of the descriptive and bivariate analyses were not consistent with the results of the
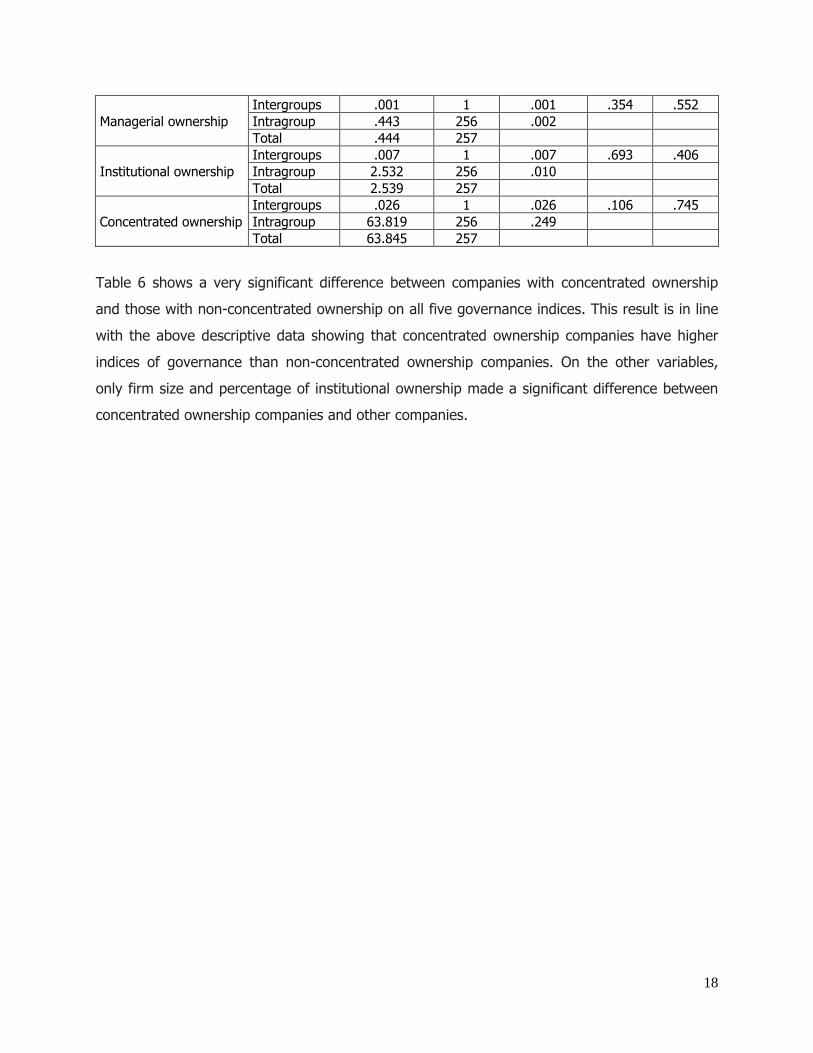
multivariate analysis (regression). The results of the bivariate analysis were as follows:
32
– Being politically connected does not appear to make a significant difference in the
quality of corporate governance. Only the shareholder rights index indicated a barely significant
difference between politically connected and unconnected companies. The connected
companies had more risk at this level than other companies, which partially confirmed
Hypothesis 1.
– Concentrated ownership companies had more risk on the overall governance, BoD,
and shareholder rights indices, which partially confirmed Hypothesis 2.
– When the company was both politically connected and had a concentrated ownership,
governance risk was higher on the three same previously mentioned indices, which partially
confirmed Hypothesis 3.
However, the results of multivariate analysis were contrary to our research hypotheses. When
other variables are taken into account, political connections had no significant effect on the
quality of governance. By contrast, the number of political connections in the executive seemed
to be linked to a lower level of governance risk on the overall governance and compensation
structure indices. The concentration of ownership also appeared to reduce governance risk
related to the overall governance index and the BoD index. Finally, political ties combined with
concentrated ownership appeared to reduce governance risk related to the shareholder rights
index.
This study’s contributions are both theoretical and practical. In the literature, numerous studies
have demonstrated the positive effects of good governance practices on firm value (Bozec et
al., 2010; Bozec et al., 2014.). Several studies worldwide, including in Canada, have generally
found a positive relationship between political connections and firms’ market and financial
performance (Goldman et al., 2009; Dicko and Khemakhem, 2015). Governance mechanisms
and political connections both create value for firms. However, other studies have shown the
negative nature of concentrated ownership, particularly in market economies such as Canada
and the U.S.
Until now, no study has made a direct link between governance and political connections, or
even between ownership concentration and political connections, especially in the Canadian
context. In this study, we argued that there is a link, at least theoretically, between political
33
connections, governance structure and firm ownership structure. The literature has
demonstrated the institutional dimension of corporate governance. In each country, regulations
(mandatory or voluntary) and institutions determine corporate governance mechanisms; the
same goes for the links between politics and business. In Canada, no law prevents a person
from moving from politics to business and vice versa, so an individual can occupy a ministerial
post one day and become an officer or director of a company the next day without any
restriction or delay, with the exception of in the province of Quebec, where former ministers
must observe a two-year waiting period before going into business.
The results of our study bring a double theoretical contribution. This study will enrich the
literature on corporate governance and was also the first to analyze the relationship between
political connections, quality of governance and ownership structure.
On a practical level, we hope that our results will provide information for regulators regarding
the need not only to further regulate the relationship between business and politics, but also
take into account the specific nature of concentrated ownership or family-owned companies. In
Quebec, the controversy surrounding Pierre Karl Péladeau’s (75% majority shareholder of
Quebecor Inc., one of Quebec’s largest companies) entry into politics is a relevant example.
The time limitation was the main weakness of this study and probably the cause of the mixed
results. It is important to conduct a study over several years to better observe the relationships
between key variables, especially the effects of political connections and concentrated
ownership. Corporate governance indices also vary over time, so it would be more appropriate
to capture their evolution over a longer period.
34
References
Aggarwal, R., Erel, I., Stulz, R. & Williamson, R. 2009. Differences in governance practices between U.S. and foreign firms: measurement, causes, and consequences, The Review of Financial Studies, 22(8): 3132-3169. Ameer, R., Ramli, F. & Zekaria, H 2010. A new perspective on board composition and firm performance in an emerging market, Corporate Governance, 10(5): 647-661. Ang, J. S., Ding, D. K. & Thong, T. Y. 2013. Political Connections and Firm Value, Asian Development Review, 30(2): 131–166. Bhagat, S. & Bolton, B. J. 2008. Corporate Governance and Firm Performance, Journal of Corporate Finance, 14: 257-273. Bonn, I., Yoshikawa, T. & Phan, P. H. 2004. Effects of Board Structure on Firm Performance: A Comparison between Japan and Australia, Asian Business & Management, 3(1): p. 105-125. Bonn, I. 2004. Board Structure and Firm Performance: Evidence from Australia, Journal of the Australian and New Zealand Academy of Management, 10(1): 14-24. Boubakri, N., Mansi, S. A. & Saffar, W. 2013. Political Institutions, Connectedness, and Corporate Risk-taking. Journal of International Business Studies, 44: 195–215. Bourdieu, P. 1979. La distinction: critique sociale du jugement. Paris: Les Éditions de Minuit. Bourdieu, P. 1986. The Forms of Capital. In J.G. Richardson (Eds.), Handbook of Theory and Research for the Sociology of Education, 241-258.New York: Greenwood Press. Bourdieu, P. 2000. Les structures sociales de l’économie. Paris: Editions du Seuil. Bozec, Y. 2008. Concentration de l’actionnariat, séparation des droits de vote et des droits de propriété et gestion des bénéfices: une étude empirique canadienne. Canadian Journal of Administrative Sciences, 25(1): 67-82. Bozec, Y. & Bozec, R. 2007. Ownership Concentration and Corporate Governance Practices: Substitution or Expropriation Effects? Canadian Journal of Administrative Sciences, 24(3) : 182-195. Bozec, Y., Bozec, R., & Dia, M. 2010. Overall governance, firm value and deviation from one share: one vote principle. International Journal of Mangerial Finance, 6(4): 305-328. Bozec, R. & Dia, M. 2007. Board Structure and Firm Technical Efficiency: Evidence from Canadian State-Owned Enterprises, European Journal of Operational Research, 177(3): 1734-1750.
35
Bozec, Y. & Laurin, C. 2008. Large Shareholder Entrenchment and Performance: Empirical Evidence from Canada, Journal of Business Finance & Accounting, 35(1/2): 25–49. Bozec, Y., Laurin, Claude & Meier, Iwan. 2014. The relation between excess control and cost of capital. International Journal of Managerial Finance, 10(1): 93-114. Bozec, Y., Rousseau, S. & Laurin, C. 2008. Law of incorporation and firm ownership structure: The law and finance theory revisited, International Review of Law and Economics, 28: 140-149. Breton, G. & Pesqueux, Y. 2006. Business in society or an integrated vision of governance, Society and Business Review, 1(1): 7-27. doi: 10.1108/17465680610643319 Chaney, P. K., Faccio, M. & Parsley, D. 2011. The Quality of Accounting Information in Politically Connected Firms, Journal of Accounting and Economics, 51(1): 58–76. Charumilind, C., Kali, R. & Wiwattanakantang, Y. 2006. Connected Lending: Thailand before the Financial Crisis, Journal of Business, 79(1): 181-217. Chen, Y.-S., Shen, C.-H. & Lin, C.-Y. 2014. The Benefits of Political Connection: Evidence from Individual Bank-Loan Contracts, J FinancServ Res, 45:287–305. doi: 10.1007/s10693-013-0167-1 Claessens, S., Feijen, E. & Laeven, L. 2008. Political Connections and Preferential Access to Finance: The Role of Campaign Contributions, Journal of Financial Economics, 88: 554–580. doi:10.1016/j.jfineco.2006.11.003 Claessens, S., Yurtoglu, B.B. 2013. Corporate governance in emerging markets: A survey, Emerging Markets Review, 15: 1-33. doi:10.1016/j.ememar.2012.03.002 Defond, M. L., Hann, R. N. & Hu, X. 2005. Does the Market Value Financial Expertise on Audit Committees of Boards of Directors? Journal of Accounting Research, 43 (2): 153-193. DelVecchio, N. 2010. Réseaux de conseils d’administration et adoption de pratiques de gouvernance d’entreprise, Revue française de gestion, 202: 145-158. Dicko, S. 2016. Firms Political Connections and Winning Government Contracts. International Journal of Economics and Finance, 8(2): 19-32. Dicko, S. 2011. Réseaux de relations sociales des membres du conseil d’administration et acquisition de ressources: le cas de Power Corporation du Canada. Unpublished doctoral dissertation, Université du Québec à Montréal, Montreal. Dicko, S. & Breton, G. 2013a. Do Directors’ Connections Really Matter? International Academic Research Journal of Business and Management, 1(7): 1-19. Dicko, S. & Breton, G. 2013b. Social Networks of the Board Members and Acquisition of Resources by the Firm: A Case Study, International Academic Research Journal of Business and Management, 1(8): 30-47.
36
Dicko, S. & El Ibrami, H. 2013. Directors’ Connections, Financial Resources and Performance: An In-Depth Analysis of Canadian Companies, International Journal of Business and Management, 8(10): 1-14. doi:10.5539/ijbm.v8n10p1 Dicko, S. & Khemakhem, H. (2015). S&P/TSX 300 Companies’ Political Connections, Compliance with Board of Directors Regulations and Financial Performance, International Journal of Business and Management, 10(1): 14-24. doi:10.5539/ijbm.v10n1p14 Dinc, I. S. 2005. Politicians and banks: Political influences on government-owned banks in emerging markets, Journal of Financial Economics, 77: 453–479. Faccio, M. 2006. Politically Connected Firms. The American Economic Review, 96(1): 369-386. Faccio, M., Masulis, R. W. & McConnell, J. J. 2006. Political Connections and Corporate Bailouts, The Journal of Finance, LXI (6): 2597-2635. Fama, E. F. 1980. Agency Problems and the Theory of the Firm, The Journal of Political Economy, 88(2): 288-307. Fama, E. F. & Jensen, M. C. 1983. Separation of Ownership and Control, Journal of Law and Economics, 26(2): 301-325. Goldman, E., Rocholl, J. & So, J. 2009. Do Politically Connected Boards Affect Firm Value? The Review of Financial Studies, 22(6): 2331-2360. doi:10.1093/rfs/hhn088 Granovetter, M. 1973. The strength of weak ties, American Journal of Sociology, 78(6): 1360-1380. Granovetter, M. 2008. Sociologie économique. Paris: Éditions du Seuil. Hartarska, V. 2005. Governance and Performance of Microfinance Institutions in Central and Eastern Europe and the Newly Independent States, World Development, 33(10): 1627-1643. Houston, J., Jiang, L. L., Lin, C. & Yue ma. 2014. Political Connections and the Cost of Bank Loans, Journal of Accounting Research, 52(1), 193-243. DOI: 10.1111/1475-679X.12038 Jensen, M. C. & Meckling, W. H. 1976. Theory of the Firm: Managerial Behavior, Agency Costs and Ownership Structure, Journal of Financial Economics, 3(4): 305-360. Khemakhem, H. & Dicko, S. 2013. Directors’ Political Connections and Compliance with Board of Directors Regulations: The Case of S&P/TSX 300 Companies, International Journal of Business and Management, 8(24): 117-125. doi:10.5539/ijbm.v8n24p117 Khemakhem, H. 2011. Lien entre les caractéristiques du conseil d’administration et de ses comités sur le coût du capital des entreprises canadiennes. Unpublished doctoral dissertation, Université du Québec à Montréal, Montreal.
37
Klein, P., Shapiro, D. & Young, J. 2005. Corporate Governance, Family Ownership and Firm Value: The Canadian evidence, Corporate Governance, 13(6): 769-784. LaPorta, R., Lopez-de-Silanes, F., Shleifer, A. Vishny, R. W. 1998. Law and Finance, Journal
of Political Economy, 106(6): 1113-1155. Leng, A. C. 2004. The Impact of Corporate Governance Practices on Firms' Financial Performance: Evidence from Malaysian Companies, ASEAN Economic Bulletin, 21(3): 308-409. Li, A. & Xia, X. 2013. Political Connections, Financial Crisis and Firm’s Value: Evidence from Chinese Listed Firms, International Journal of Business and Management, 8(18): 63-77. doi:10.5539/ijbm.v8n18p63 Liu, Q. 2006. Corporate Governance in China: Current Practices, Economic Effects and Institutional Determinants, CESifo Economic Studies, 52(2): 415-453. Matoussi, H. & Jardak, M. K. 2012. International Corporate Governance and Finance: Legal, Cultural and Political Explanations, The International Journal of Accounting, 47(1): 1-43. Pfeffer, J. 1982. Organizations and Organization Theory. Stanford University: Pitman (Boston, London, Melbourne, Toronto). Pfeffer, J. & Salancik, G. R. 1978. The External Control of Organizations: A Resource Dependence Perspective. New York: Harper & Row. Roy, M.-J. 2009. Linking Board Types to Key Board Roles, International Journal of Business Governance and Ethics, 4(3): 298-312. Schulze, William S., Lubatkin, Michael H., Dino, Richard N. & Buchholtz, Ann K. (2001). Agency relationships in family firms: Theory and evidence. Organization Science, 12(2): 99-116. Wang, C. 2014. Political Connections of the Boards of Directors and Department of Defense Contractors' Excessive Profits, Journal of Public Procurement, 14(1): 96-122. Williams, D. R., Duncan, W. J., Ginter, P. M. & Shewchuk, R. M.2006. Do Governance, Equity Characteristics, and Venture Capital Involvement Affect Long-Term Wealth Creation in US Health Care and Biotechnology IPOs? Journal of Health Care Finance, 33(1): 54-71. Wright, P., Ferris, S., Sarin, A., & Awasthi, V. (1996). Impact of Corporate Insider, Blockholder, and Institutional Equity Ownership on Firm Risk Taking. The Academy of Management Journal, 39(2), 441-463. Retrieved from http://www.jstor.org/stable/256787