Contributors Laura Assis Analyst Global Research & Design [email protected]Hector Huitzil Senior Specialist Product Management [email protected]Jason I. McMann, PhD Head of Analytics GeoQuant [email protected]Ross D. Schaap, PhD Head of Research GeoQuant [email protected]Political Risk and Emerging Market Equities: Applications in an Index Framework INTRODUCTION Political risk is widely presumed to affect emerging market equities. However, its impact has historically been difficult to assess due to the lack of quantifiable, systematic, and standardized political risk metrics. The growing popularity of alternative data derived from natural language processing and sentiment analysis of global news media has opened new opportunities in the political risk space, including novel methods of devising systematic investment and asset allocation frameworks that are uniquely informed by a new generation of political risk indicators. To take advantage of this development, S&P Dow Jones Indices has collaborated with GeoQuant, an AI-driven political risk data firm, to devise a best-in-class Emerging Markets Political Risk-Tilted Concept Index (hereafter the “Political Risk-Tilted Concept Index” or “Concept Index”). The Concept Index takes the S&P Emerging BMI as its starting point and rebalances country allocations monthly based on GeoQuant’s custom “Macro-Government Political Risk Indicator,” yielding the Political Risk- Tilted Concept Index by overweighting (underweighting) countries with relatively low (high) political risk. We find that systematically incorporating political risk as a factor into emerging market equity allocation decisions can potentially drive outperformance relative to the benchmark S&P Emerging BMI. Outperformance is largely attributable to reduced overall volatility and greater insulation from downside risk. Over a 2013-2020 back-test period, the Concept Index outperformed the S&P Emerging BMI using a standard set of back-test parameters. Specifically, the Concept Index yielded higher return/risk ratios over three- and five-year horizons, and on a cumulative basis over the full back-tested period, with an annualized excess return of 1.31% relative to its benchmark. It also demonstrated a consistently lower level of volatility, a relatively low annualized tracking error of 2.03%, and a lower monthly average turnover than its benchmark. On a monthly basis, the back-tested Concept Index outperformed the S&P Emerging BMI in the majority of all
Political Risk and Emerging Market Equities: Applications in an Index Framework April 2021
RESEARCH | Equities 2
For use with institutions only, not for use with retail investors.
months, and in a larger majority of down months in which benchmark
returns decreased. The back-test also outperformed the S&P Emerging
BMI over 2020 despite well-known challenges in forecasting equity market
performance during the COVID-19 pandemic.
The Political Risk-Tilted Concept Index is the first of its kind (to the best of
our knowledge) and offers novel opportunities to leverage S&P Dow Jones
Indices and GeoQuant data to inform emerging market equity allocation
decisions.
MEASURING POLITICAL RISK: AN OVERVIEW
GeoQuant is a venture-backed, AI-driven political risk data firm that fuses
political science and machine learning to systematically measure and
predict political risks in real-time.
Well before COVID-19, the interplay of macro-economic policymaking and
government (in)stability, and the lack of high-frequency data to measure
these factors, made it notoriously difficult to assess the impact of political
risk on equity prices, particularly in emerging markets. Technical advances
in monitoring and predicting political risk were necessary.
To that end, GeoQuant has developed a best-in-class set of more than 20
political risk indicators for modeling and understanding the impact of
political risk on markets. These indicators enable data-driven and
systematic asset allocation in response to measurable, real-time variation
in political risk.
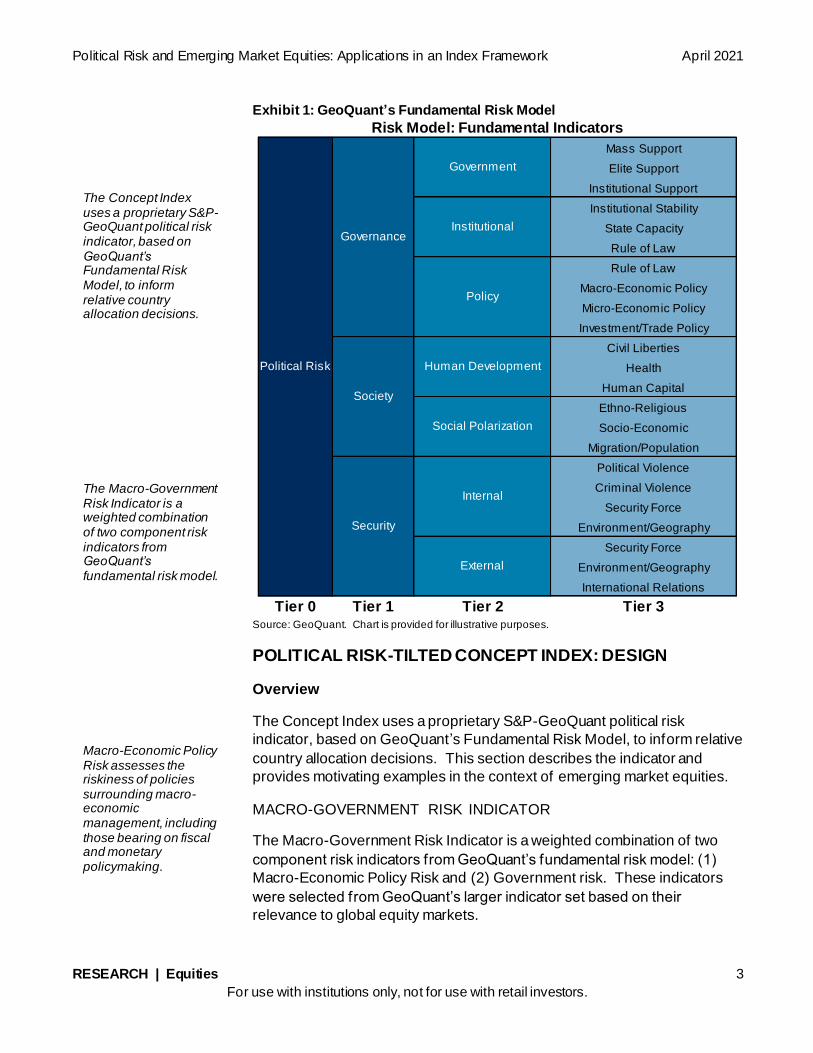
Exhibit 1 provides a snapshot of GeoQuant’s core set of risk indicators,
which collectively comprise GeoQuant’s “Fundamental Risk Model.” The
indicators measure the full spectrum of risks that are likely to affect
commerce, trading, investment decisions, and intergovernmental relations.
All indicators are generated by real-time natural language processing of
traditional news media using proprietary algorithms for text-based
sentiment analysis, as well as synchronous inputs and review by a team of
PhD political economists.
The Political Risk-Tilted Concept Index is the first of its kind and offers novel opportunities to leverage S&P DJI and GeoQuant data to inform emerging market equity allocation decisions. GeoQuant is a venture-backed, AI-driven political risk data firm that fuses political science and machine learning to systematically measure and predict political risks in real-time. GeoQuant has developed a best-in-class set of more than 20 political risk indicators for modeling and understanding the impact of political risk on markets.
Political Risk and Emerging Market Equities: Applications in an Index Framework April 2021
RESEARCH | Equities 3
For use with institutions only, not for use with retail investors.
Exhibit 1: GeoQuant’s Fundamental Risk Model
Source: GeoQuant. Chart is provided for illustrative purposes.
POLITICAL RISK-TILTED CONCEPT INDEX: DESIGN
Overview
The Concept Index uses a proprietary S&P-GeoQuant political risk
indicator, based on GeoQuant’s Fundamental Risk Model, to inform relative
country allocation decisions. This section describes the indicator and
provides motivating examples in the context of emerging market equities.
MACRO-GOVERNMENT RISK INDICATOR
The Macro-Government Risk Indicator is a weighted combination of two
component risk indicators from GeoQuant’s fundamental risk model: (1)
Macro-Economic Policy Risk and (2) Government risk. These indicators
were selected from GeoQuant’s larger indicator set based on their
relevance to global equity markets.
Mass Support
Elite Support
Institutional Support
Institutional Stability
State Capacity
Rule of Law
Rule of Law
Macro-Economic Policy
Micro-Economic Policy
Investment/Trade Policy
Civil Liberties
Health
Human Capital
Ethno-Religious
Socio-Economic
Migration/Population
Political Violence
Criminal Violence
Security Force
Environment/Geography
Security Force
Environment/Geography
International Relations
Tier 0 Tier 1 Tier 2 Tier 3
Internal
External
Risk Model: Fundamental Indicators
Political Risk
Governance
Government
Institutional
Policy
Society
Human Development
Social Polarization
Security
The Concept Index uses a proprietary S&P-GeoQuant political risk indicator, based on GeoQuant’s Fundamental Risk Model, to inform relative country allocation decisions. The Macro-Government Risk Indicator is a weighted combination of two component risk indicators from GeoQuant’s fundamental risk model. Macro-Economic Policy Risk assesses the riskiness of policies surrounding macro-economic management, including those bearing on fiscal and monetary policymaking.
Political Risk and Emerging Market Equities: Applications in an Index Framework April 2021
RESEARCH | Equities 4
For use with institutions only, not for use with retail investors.
Macro-Economic Policy Risk assesses the riskiness of policies surrounding
macro-economic management, including those bearing on fiscal and
monetary policymaking, both of which have historically shaped equity
market performance.
Government Risk is expected to have a second-order impact on equity
markets. An increase in Government Risk reflects greater uncertainty
surrounding the survival and capacity of incumbent governments, which in
turn heightens uncertainty surrounding policymaking, and macro-economic
policymaking more specifically. Government risk’s impact on equity
markets increases as risk rises, as investors commonly respond by shifting
assets into less risky countries.
The Macro-Government Risk Indicator covers 22 of the 26 total countries
included in the S&P Emerging BMI between 2013 and 2020.1 The four
omitted countries are Czech Republic, Greece, Kuwait, and Morocco. The
first three have a combined weight of 0.99% in the S&P Emerging BMI as of
December 2020; Morocco has not been included in the S&P Emerging BMI
since Q4 2015. These countries were not covered by GeoQuant at the time
of creation of the Concept Index and are therefore kept neutral to their
weights in the benchmark index.
GeoQuant’s country-specific Macro-Government Risk Indicator series are
on average negatively correlated (r = -0.25) with S&P DJI’s country-specific
BMI Indices in the 22 countries we assess among the broader S&P
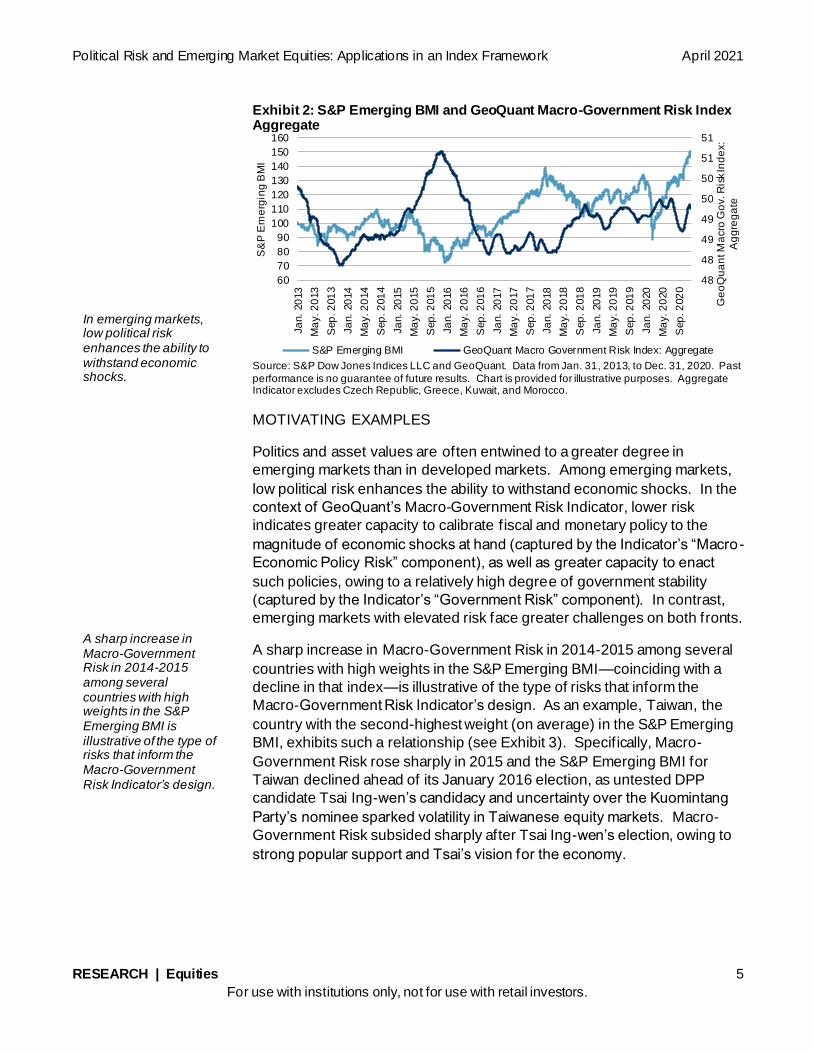
Emerging BMI country universe. A weighted cross-country aggregate of
the Macro-Government Risk Indicator among those 22 countries is
inversely correlated (r = -0.27) with the S&P Emerging BMI, as can be seen
in Exhibit 2.2
1 Brazil, Chile, China, Colombia, Egypt, Hungary, India, Indonesia, Malaysia, Mexico, Pakistan, Peru, Philippines, Poland, Russ ia, Saudi
Arabia, South Africa, Thailand, Turkey, Taiwan, Qatar, and United Arab Emirates.
2 Each country’s contribution to the aggregate Indicator is calculated by multiplying its risk value by its default weight under the S&P
Emerging BMI. The four countries not covered by the Macro-Government Risk Indicator are omitted from the aggregate calculation
reported here, but are included in the subsequent back-test by assigning them a tilt value of 1, such that we remain neutral to their weights in the S&P Emerging BMI.
Government Risk is expected to have a second-order impact on equity markets by raising uncertainty surrounding the survival and capacity of incumbent governments, which in turn heightens uncertainty surrounding policymaking. A weighted cross-country aggregate of the Macro-Government Risk Indicator among the 22 included countries is inversely correlated with the S&P Emerging BMI.
Political Risk and Emerging Market Equities: Applications in an Index Framework April 2021
RESEARCH | Equities 5
For use with institutions only, not for use with retail investors.
Exhibit 2: S&P Emerging BMI and GeoQuant Macro-Government Risk Index Aggregate
Source: S&P Dow Jones Indices LLC and GeoQuant. Data from Jan. 31, 2013, to Dec. 31, 2020. Past
performance is no guarantee of future results. Chart is provided for illustrative purposes. Aggregate Indicator excludes Czech Republic, Greece, Kuwait, and Morocco.
MOTIVATING EXAMPLES
Politics and asset values are often entwined to a greater degree in
emerging markets than in developed markets. Among emerging markets,
low political risk enhances the ability to withstand economic shocks. In the
context of GeoQuant’s Macro-Government Risk Indicator, lower risk
indicates greater capacity to calibrate fiscal and monetary policy to the
magnitude of economic shocks at hand (captured by the Indicator’s “Macro -
Economic Policy Risk” component), as well as greater capacity to enact
such policies, owing to a relatively high degree of government stability
(captured by the Indicator’s “Government Risk” component). In contrast,
emerging markets with elevated risk face greater challenges on both fronts.
A sharp increase in Macro-Government Risk in 2014-2015 among several
countries with high weights in the S&P Emerging BMI—coinciding with a
decline in that index—is illustrative of the type of risks that inform the
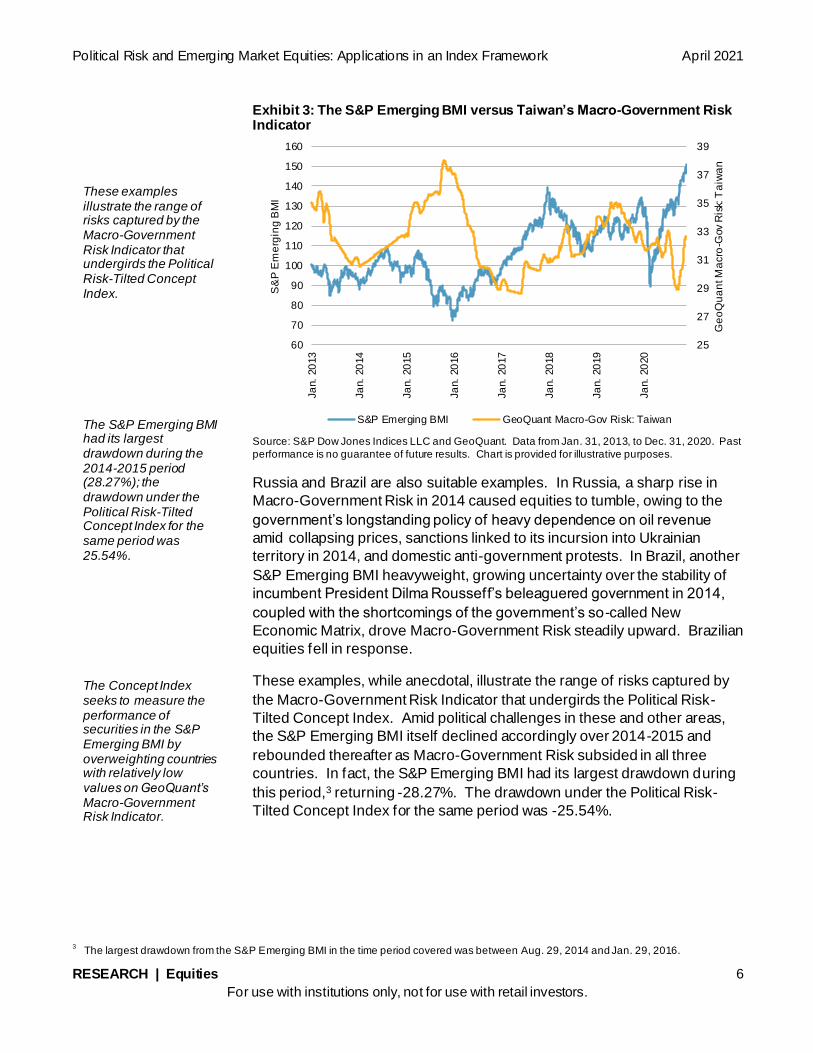
Macro-Government Risk Indicator’s design. As an example, Taiwan, the
country with the second-highest weight (on average) in the S&P Emerging
BMI, exhibits such a relationship (see Exhibit 3). Specifically, Macro-
Government Risk rose sharply in 2015 and the S&P Emerging BMI for
Taiwan declined ahead of its January 2016 election, as untested DPP
candidate Tsai Ing-wen’s candidacy and uncertainty over the Kuomintang
Party’s nominee sparked volatility in Taiwanese equity markets. Macro-
Government Risk subsided sharply after Tsai Ing-wen’s election, owing to
strong popular support and Tsai’s vision for the economy.
48
48
49
49
50
50
51
51
60
70
80
90
100
110
120
130
140
150
160
Ja
n.
20
13
Ma
y. 2
013
Sep
. 2
01
3
Ja
n.
20
14
Ma
y. 2
014
Sep
. 2
01
4
Ja
n.
20
15
Ma
y. 2
015
Sep
. 2
01
5
Ja
n.
20
16
Ma
y. 2
016
Sep
. 2
01
6
Ja
n.
20
17
Ma
y. 2
017
Sep
. 2
01
7
Ja
n.
20
18
Ma
y. 2
018
Sep
. 2
01
8
Ja
n.
20
19
Ma
y. 2
019
Sep
. 2
01
9
Ja
n.
20
20
Ma
y. 2
020
Sep
. 2
02
0
Ge
oQ
ua
nt M
acro
Go
v. R
isk
Ind
ex:
Ag
gre
ga
te
S&
P E
me
rgin
g B
MI
S&P Emerging BMI GeoQuant Macro Government Risk Index: Aggregate
In emerging markets, low political risk enhances the ability to withstand economic shocks. A sharp increase in Macro-Government Risk in 2014-2015 among several countries with high weights in the S&P Emerging BMI is illustrative of the type of risks that inform the Macro-Government Risk Indicator’s design.
Political Risk and Emerging Market Equities: Applications in an Index Framework April 2021
RESEARCH | Equities 6
For use with institutions only, not for use with retail investors.
Exhibit 3: The S&P Emerging BMI versus Taiwan’s Macro-Government Risk Indicator
Source: S&P Dow Jones Indices LLC and GeoQuant. Data from Jan. 31, 2013, to Dec. 31, 2020. Past
performance is no guarantee of future results. Chart is provided for illustrative purposes.
Russia and Brazil are also suitable examples. In Russia, a sharp rise in
Macro-Government Risk in 2014 caused equities to tumble, owing to the
government’s longstanding policy of heavy dependence on oil revenue
amid collapsing prices, sanctions linked to its incursion into Ukrainian
territory in 2014, and domestic anti-government protests. In Brazil, another
S&P Emerging BMI heavyweight, growing uncertainty over the stability of
incumbent President Dilma Rousseff’s beleaguered government in 2014,
coupled with the shortcomings of the government’s so-called New
These examples, while anecdotal, illustrate the range of risks captured by
the Macro-Government Risk Indicator that undergirds the Political Risk-
Tilted Concept Index. Amid political challenges in these and other areas,
the S&P Emerging BMI itself declined accordingly over 2014-2015 and
rebounded thereafter as Macro-Government Risk subsided in all three
countries. In fact, the S&P Emerging BMI had its largest drawdown during
this period,3 returning -28.27%. The drawdown under the Political Risk-
Tilted Concept Index for the same period was -25.54%.
3 The largest drawdown from the S&P Emerging BMI in the time period covered was between Aug. 29, 2014 and Jan. 29, 2016.
25
27
29
31
33
35
37
39
60
70
80
90
100
110
120
130
140
150
160
Ja
n.
20
13
Ja
n.
20
14
Ja
n.
20
15
Ja
n.
20
16
Ja
n.
20
17
Ja
n.
20
18
Ja
n.
20
19
Ja
n.
20
20
Ge
oQ
ua
nt M
acro
-Gov R
isk:
Ta
iwa
n
S&
P E
me
rgin
g B
MI
S&P Emerging BMI GeoQuant Macro-Gov Risk: Taiwan
These examples illustrate the range of risks captured by the Macro-Government Risk Indicator that undergirds the Political Risk-Tilted Concept Index. The S&P Emerging BMI had its largest drawdown during the 2014-2015 period (28.27%); the drawdown under the Political Risk-Tilted Concept Index for the same period was 25.54%. The Concept Index seeks to measure the performance of securities in the S&P Emerging BMI by overweighting countries with relatively low values on GeoQuant’s Macro-Government Risk Indicator.
Political Risk and Emerging Market Equities: Applications in an Index Framework April 2021
RESEARCH | Equities 7
For use with institutions only, not for use with retail investors.
INDEX METHODOLOGY SUMMARY AND BACK-TESTED
RESULTS
In this section, we present a full set of back-tested results for the Political
Risk-Tilted Concept Index. We then return to a brief discussion of global
and country-specific trends in Macro-Government Risk during the COVID-
19 pandemic in 2020 and highlight factors driving the Concept Index’s
outperformance during a period of heightened equity market volatility.
The Concept Index seeks to measure the performance of securities in the
S&P Emerging BMI by overweighting (underweighting) countries with
relatively low (high) values on GeoQuant’s Macro-Government Risk
Indicator, reflecting low (high) levels of political risk. In turn, country
weights are tilted so that countries with lower political risk are overweighted
and countries with higher political risk are underweighted. The tilt is derived
on a monthly basis by first converting the Macro-Government Risk Indicator
into a z-score to standardize the indicator for the countries in the index
universe. Each country is then given a tilt score, which is multiplied by
each country’s weight in the S&P Emerging BMI (see Appendix). To avoid
concentration, countries are capped at a maximum of 200% and a minimum
of 50% of their f loat market capitalization weight in the S&P Emerging BMI.
As previously noted, the Macro-Government Risk Indicator covers 22 of the
26 total countries included in the S&P Emerging BMI between 2013 and
2020.4 The four omitted countries (Czech Republic, Greece, Kuwait, and
Morocco) are assigned a tilt score equal to 1, reflecting a neutral position
relative to their weights in the S&P Emerging BMI.
COUNTRY ALLOCATIONS
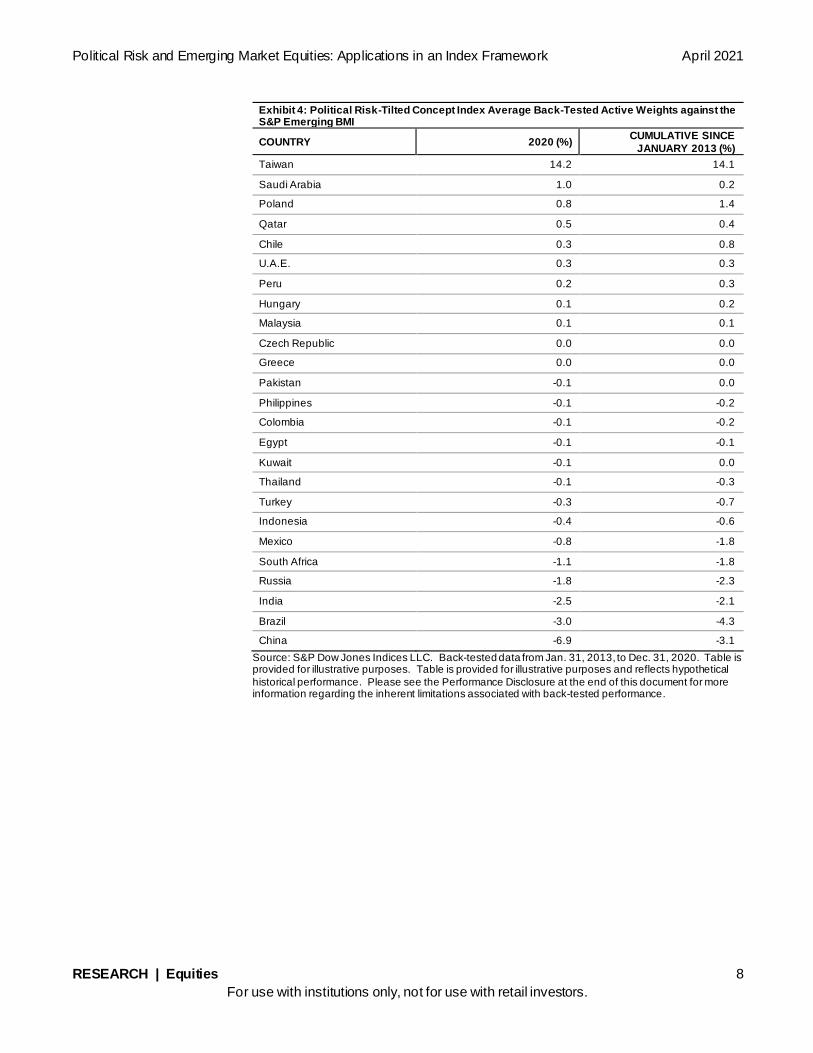
Exhibit 4 shows each country’s average active weight in the Political Risk-
Tilted Concept Index compared to the S&P Emerging BMI as of December
2020 and on a cumulative basis. On average, Taiwan, Saudi Arabia, and
Poland were the most heavily overweighted in 2020, averaging 14.2%,
1.0%, and 0.8%, respectively, in excess weight above the benchmark.
China, Brazil, and India on average carried a smaller weight in the Concept
Index, underweighted 6.9%, 3%, and 2.5%, respectively. While China
experienced the largest decrease in weight in 2020 among all countries
covered, it nevertheless remained the largest country by average weight
(see Exhibits 4 and 5). China and Taiwan were the largest countries by
weight in 2020 for the S&P Emerging BMI, comprising 42% and 14%,
respectively.
4 Brazil, Chile, China, Colombia, Egypt, Hungary, India, Indonesia, Malaysia, Mexico, Pakistan, Peru, Philippines, Poland, Russ ia, Saudi
Arabia, South Africa, Thailand, Turkey, Taiwan, Qatar, and United Arab Emirates.
On average, Taiwan, Saudi Arabia, and Poland were the most heavily overweighted in 2020. While China experienced the largest decrease in weight in 2020 among all countries covered, it nevertheless remained the largest country by average weight. China and Taiwan are the largest countries by weight in 2020 for the S&P Emerging BMI.
Political Risk and Emerging Market Equities: Applications in an Index Framework April 2021
RESEARCH | Equities 8
For use with institutions only, not for use with retail investors.
Exhibit 4: Political Risk-Tilted Concept Index Average Back-Tested Active Weights against the S&P Emerging BMI
COUNTRY 2020 (%) CUMULATIVE SINCE
JANUARY 2013 (%)
Taiwan 14.2 14.1
Saudi Arabia 1.0 0.2
Poland 0.8 1.4
Qatar 0.5 0.4
Chile 0.3 0.8
U.A.E. 0.3 0.3
Peru 0.2 0.3
Hungary 0.1 0.2
Malaysia 0.1 0.1
Czech Republic 0.0 0.0
Greece 0.0 0.0
Pakistan -0.1 0.0
Philippines -0.1 -0.2
Colombia -0.1 -0.2
Egypt -0.1 -0.1
Kuwait -0.1 0.0
Thailand -0.1 -0.3
Turkey -0.3 -0.7
Indonesia -0.4 -0.6
Mexico -0.8 -1.8
South Africa -1.1 -1.8
Russia -1.8 -2.3
India -2.5 -2.1
Brazil -3.0 -4.3
China -6.9 -3.1
Source: S&P Dow Jones Indices LLC. Back-tested data from Jan. 31, 2013, to Dec. 31, 2020. Table is provided for illustrative purposes. Table is provided for illustrative purposes and reflects hypothetical
historical performance. Please see the Performance Disclosure at the end of this document for more information regarding the inherent limitations associated with back-tested performance.
Political Risk and Emerging Market Equities: Applications in an Index Framework April 2021
RESEARCH | Equities 9
For use with institutions only, not for use with retail investors.
Exhibit 5: S&P Emerging BMI and Political Risk-Tilted Concept Index Average Back-Tested 2020 Country Weights
Source: S&P Dow Jones Indices LLC. Back-tested data from Jan. 31, 2019, to Dec. 31, 2020. Chart is
provided for illustrative purposes. Table is provided for illustrative purposes and reflects hypothetical historical performance. Please see the Performance Disclosure at the end of this document for more
information regarding the inherent limitations associated with back-tested performance.
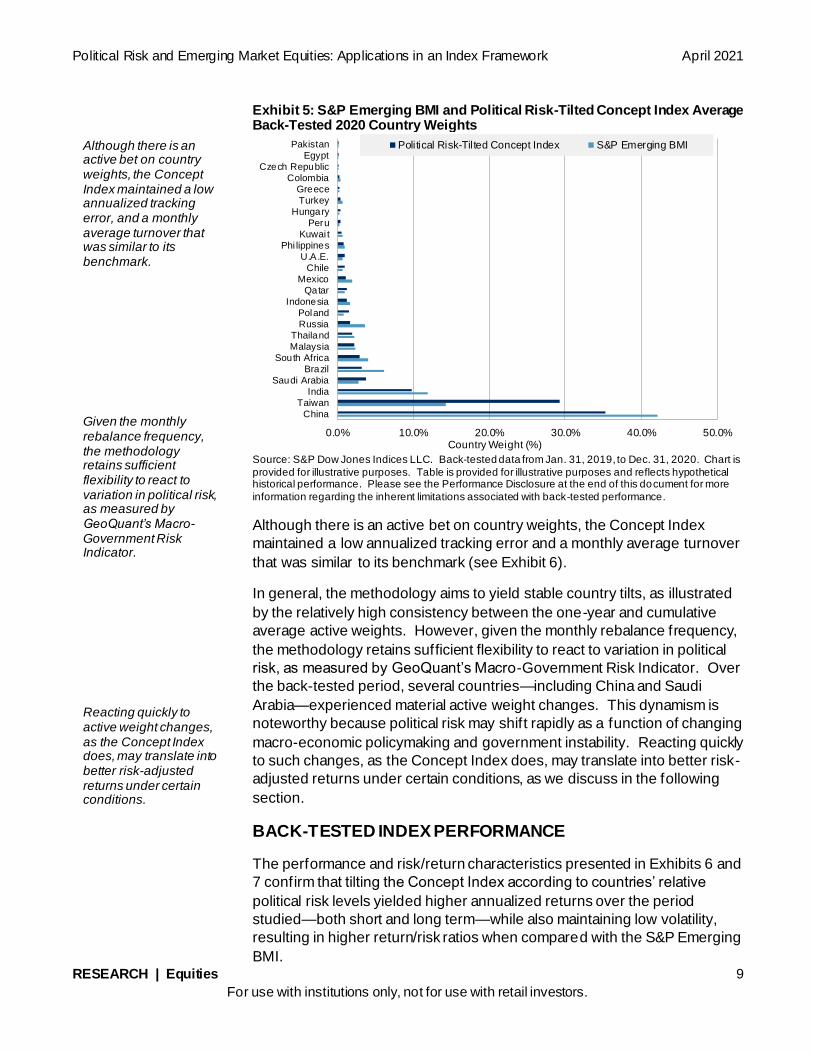
Although there is an active bet on country weights, the Concept Index
maintained a low annualized tracking error and a monthly average turnover
that was similar to its benchmark (see Exhibit 6).
In general, the methodology aims to yield stable country tilts, as illustrated
by the relatively high consistency between the one-year and cumulative
average active weights. However, given the monthly rebalance frequency,
the methodology retains sufficient flexibility to react to variation in political
risk, as measured by GeoQuant’s Macro-Government Risk Indicator. Over
the back-tested period, several countries—including China and Saudi
Arabia—experienced material active weight changes. This dynamism is
noteworthy because political risk may shift rapidly as a function of changing
macro-economic policymaking and government instability. Reacting quickly
to such changes, as the Concept Index does, may translate into better risk-
adjusted returns under certain conditions, as we discuss in the following
section.
BACK-TESTED INDEX PERFORMANCE
The performance and risk/return characteristics presented in Exhibits 6 and
7 confirm that tilting the Concept Index according to countries’ relative
political risk levels yielded higher annualized returns over the period
studied—both short and long term—while also maintaining low volatility,
resulting in higher return/risk ratios when compared with the S&P Emerging
BMI.
0.0% 10.0% 20.0% 30.0% 40.0% 50.0%
China
Taiwan
India
Saudi Arabia
BrazilSouth Africa
Malaysia
Thailand
Russia
Poland
Indonesia
QatarMexico
Chile
U.A.E.
Phi lippines
Kuwai tPeru
HungaryTurkeyGreece
Colombia
Czech Republic
Egypt
Pakistan
Country Weight (%)
Political Risk-Tilted Concept Index S&P Emerging BMIAlthough there is an active bet on country weights, the Concept Index maintained a low annualized tracking error, and a monthly average turnover that was similar to its benchmark. Given the monthly rebalance frequency, the methodology retains sufficient flexibility to react to variation in political risk, as measured by GeoQuant’s Macro-Government Risk Indicator. Reacting quickly to active weight changes, as the Concept Index does, may translate into better risk-adjusted returns under certain conditions.
Political Risk and Emerging Market Equities: Applications in an Index Framework April 2021
RESEARCH | Equities 10
For use with institutions only, not for use with retail investors.
Exhibit 6: Risk/Return Profile
ANNUALIZED RETURN (%) POLITICAL RISK-TILTED
CONCEPT INDEX S&P EMERGING BMI
1-Year 19.52 15.51
3-Year 7.53 6.18
5-Year 13.25 12.56
Cumulative 6.65 5.34
ANNUALIZED VOLATILITY (%)
3-Year 19.16 19.58
5-Year 16.77 17.32
Cumulative 15.73 16.48
RETURN/RISK
3-Year 0.39 0.32
5-Year 0.79 0.73
Cumulative 0.42 0.32
Annualized Tracking Error (%) 2.03 -
Monthly Average Turnover (%) 1.84 1.65
The Political Risk-Tilted Concept Index is a hypothetical index. Source: S&P Dow Jones Indices LLC. Back-tested data from Jan. 31, 2013, to Dec. 31, 2020. Table is
provided for illustrative purposes and reflects hypothetical historical performance. Please see the Performance Disclosure at the end of this document for more information regarding the inherent
limitations associated with back-tested performance.
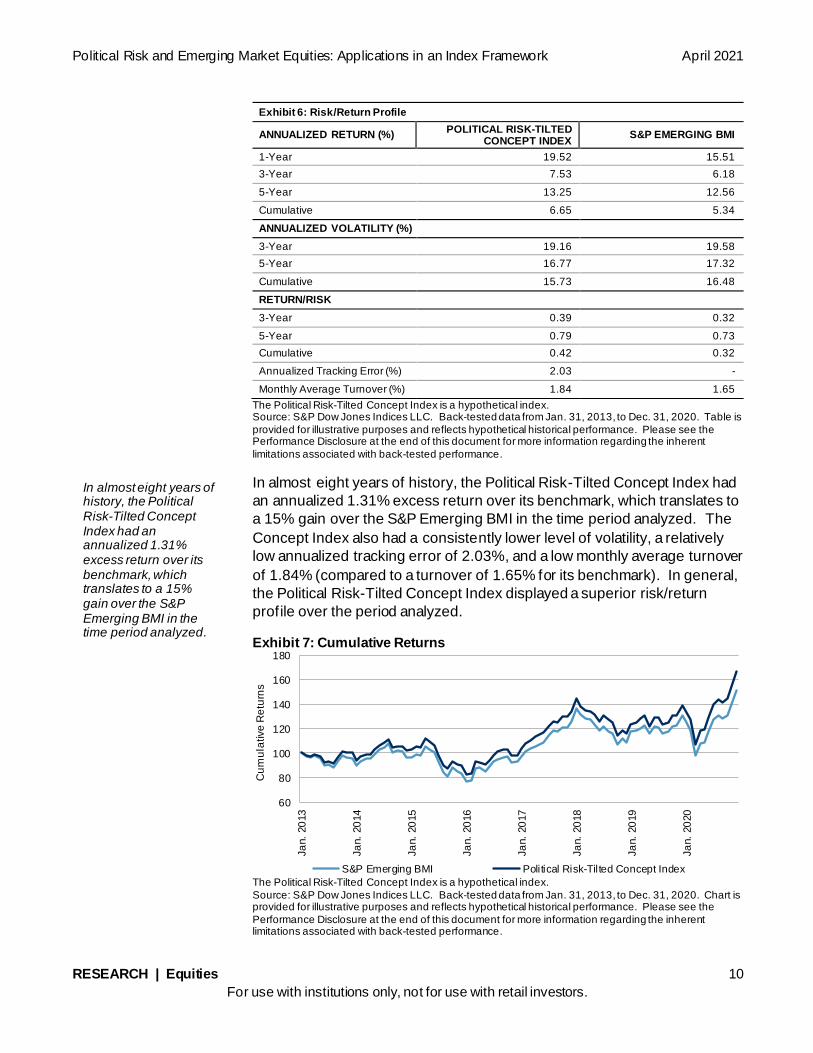
In almost eight years of history, the Political Risk-Tilted Concept Index had
an annualized 1.31% excess return over its benchmark, which translates to
a 15% gain over the S&P Emerging BMI in the time period analyzed. The
Concept Index also had a consistently lower level of volatility, a relatively
low annualized tracking error of 2.03%, and a low monthly average turnover
of 1.84% (compared to a turnover of 1.65% for its benchmark). In general,
the Political Risk-Tilted Concept Index displayed a superior risk/return
profile over the period analyzed.
Exhibit 7: Cumulative Returns
The Political Risk-Tilted Concept Index is a hypothetical index.
Source: S&P Dow Jones Indices LLC. Back-tested data from Jan. 31, 2013, to Dec. 31, 2020. Chart is provided for illustrative purposes and reflects hypothetical historical performance. Please see the
Performance Disclosure at the end of this document for more information regarding the inherent limitations associated with back-tested performance.
60
80
100
120
140
160
180
Ja
n.
20
13
Ja
n.
20
14
Ja
n.
20
15
Ja
n.
20
16
Ja
n.
20
17
Ja
n.
20
18
Ja
n.
20
19
Ja
n.
20
20
Cu
mu
lative
Re
turn
s
S&P Emerging BMI Political Risk-Tilted Concept Index
In almost eight years of history, the Political Risk-Tilted Concept Index had an annualized 1.31% excess return over its benchmark, which translates to a 15% gain over the S&P Emerging BMI in the time period analyzed.
Political Risk and Emerging Market Equities: Applications in an Index Framework April 2021
RESEARCH | Equities 11
For use with institutions only, not for use with retail investors.
Between 2013 and 2020, when the S&P Emerging BMI had negative
monthly returns, the Concept Index outperformed 70% of the time;
whenever the benchmark had positive monthly returns, the Concept Index
outperformed 45% of the time. This downside protection with some upside
participation is expected from a low volatility strategy. The Concept Index
outperformed the S&P Emerging BMI in 56% of the total monthly periods
covered by the back-test.
The largest drawdown of the S&P Emerging BMI was -28.27%, compared
to -26.13% for the Concept Index.5 Moreover, during the first quarter of
2020, which was marked by an unanticipated shock to equity markets due
to the onset of the COVID-19 pandemic, the Concept Index lost 22.9%
compared to 24.61% for the benchmark. The ability to decrease the
severity of drawdowns demonstrates the potential to hedge returns against
unfavorable market conditions faster than with traditional methods. This
downside protection, even when limiting upside participation, was the
primary driver of the Concept Index’s longer-term outperformance.
COUNTRY-LEVEL PERFORMANCE DRIVERS
Of the countries in the index universe covered by GeoQuant, 67%
contributed positively to index returns in cumulative terms. This implies that
systematic over- and under-weighting according to GeoQuant´s Macro-
Government Risk Indicator contributed to alpha generation.
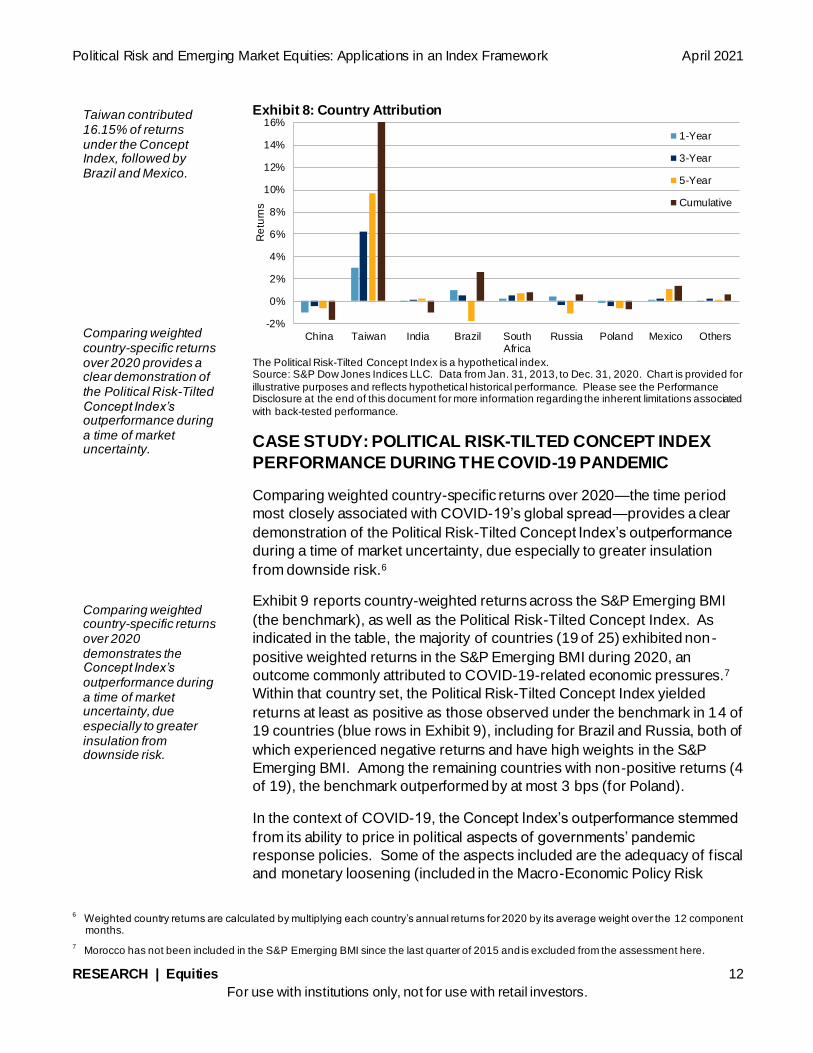
To analyze each country’s contribution to the 15% accumulated gain of the
Political Risk-Tilted Concept Index over its benchmark, we multiplied each
country’s average active weight by the difference in returns between the
Concept Index and the benchmark (see Exhibit 8). The largest contributor
to returns was Taiwan, reflecting its low average levels of Macro-
Government Risk relative to the country universe of the S&P Emerging
BMI. Accordingly, Taiwan generated the highest cumulative returns of all
countries in 2020.
In cumulative terms, Taiwan contributed 16.15% of returns under the
Concept Index, followed by Brazil (2.64%) and Mexico (1.36%).
Conversely, China had the most negative contribution due to the
underweight given to this country, subtracting 1.7% from overall cumulative
returns under the Concept Index, followed by India (1.0%) and Poland
(0.7%).
5 The largest drawdown from the S&P Emerging BMI between 2013 and 2020 was recorded between Aug. 29, 2014, and Jan. 29, 2016,
while the largest drawdown from the Political Risk-Tilted Concept Index occurred between April 30, 2015, and Jan. 29, 2016.
The Concept Index outperformed the S&P Emerging BMI in 56% of the total monthly periods covered by the back-test. The ability to decrease the severity of drawdowns demonstrates the potential to hedge returns against unfavorable market conditions faster than with traditional methods. Of the countries in the index universe covered by GeoQuant, 67% contributed positively to index returns in cumulative terms.
Political Risk and Emerging Market Equities: Applications in an Index Framework April 2021
RESEARCH | Equities 12
For use with institutions only, not for use with retail investors.
Exhibit 8: Country Attribution
The Political Risk-Tilted Concept Index is a hypothetical index. Source: S&P Dow Jones Indices LLC. Data from Jan. 31, 2013, to Dec. 31, 2020. Chart is provided for
illustrative purposes and reflects hypothetical historical performance. Please see the Performance Disclosure at the end of this document for more information regarding the inherent limitations associated
with back-tested performance.
CASE STUDY: POLITICAL RISK-TILTED CONCEPT INDEX
PERFORMANCE DURING THE COVID-19 PANDEMIC
Comparing weighted country-specific returns over 2020—the time period
most closely associated with COVID-19’s global spread—provides a clear
demonstration of the Political Risk-Tilted Concept Index’s outperformance
during a time of market uncertainty, due especially to greater insulation
from downside risk.6
Exhibit 9 reports country-weighted returns across the S&P Emerging BMI
(the benchmark), as well as the Political Risk-Tilted Concept Index. As
indicated in the table, the majority of countries (19 of 25) exhibited non-
positive weighted returns in the S&P Emerging BMI during 2020, an
outcome commonly attributed to COVID-19-related economic pressures.7
Within that country set, the Political Risk-Tilted Concept Index yielded
returns at least as positive as those observed under the benchmark in 14 of
19 countries (blue rows in Exhibit 9), including for Brazil and Russia, both of
which experienced negative returns and have high weights in the S&P
Emerging BMI. Among the remaining countries with non-positive returns (4
of 19), the benchmark outperformed by at most 3 bps (for Poland).
In the context of COVID-19, the Concept Index’s outperformance stemmed
from its ability to price in political aspects of governments’ pandemic
response policies. Some of the aspects included are the adequacy of fiscal
and monetary loosening (included in the Macro-Economic Policy Risk
6 Weighted country returns are calculated by multiplying each country’s annual returns for 2020 by its average weight over the 12 component
months.
7 Morocco has not been included in the S&P Emerging BMI since the last quarter of 2015 and is excluded from the assessment here.
-2%
0%
2%
4%
6%
8%
10%
12%
14%
16%
China Taiwan India Brazil SouthAfrica
Russia Poland Mexico Others
Re
turn
s
1-Year
3-Year
5-Year
Cumulative
Taiwan contributed 16.15% of returns under the Concept Index, followed by Brazil and Mexico. Comparing weighted country-specific returns over 2020 provides a clear demonstration of the Political Risk-Tilted Concept Index’s outperformance during a time of market uncertainty. Comparing weighted country-specific returns over 2020 demonstrates the Concept Index’s outperformance during a time of market uncertainty, due especially to greater insulation from downside risk.
Political Risk and Emerging Market Equities: Applications in an Index Framework April 2021
RESEARCH | Equities 13
For use with institutions only, not for use with retail investors.
component of the Macro-Government Risk Indicator) and governments’
stability in the face of widespread socioeconomic pressures that translated
(to varying degrees) into popular unrest (measured by the Government Risk
component of the Indicator).
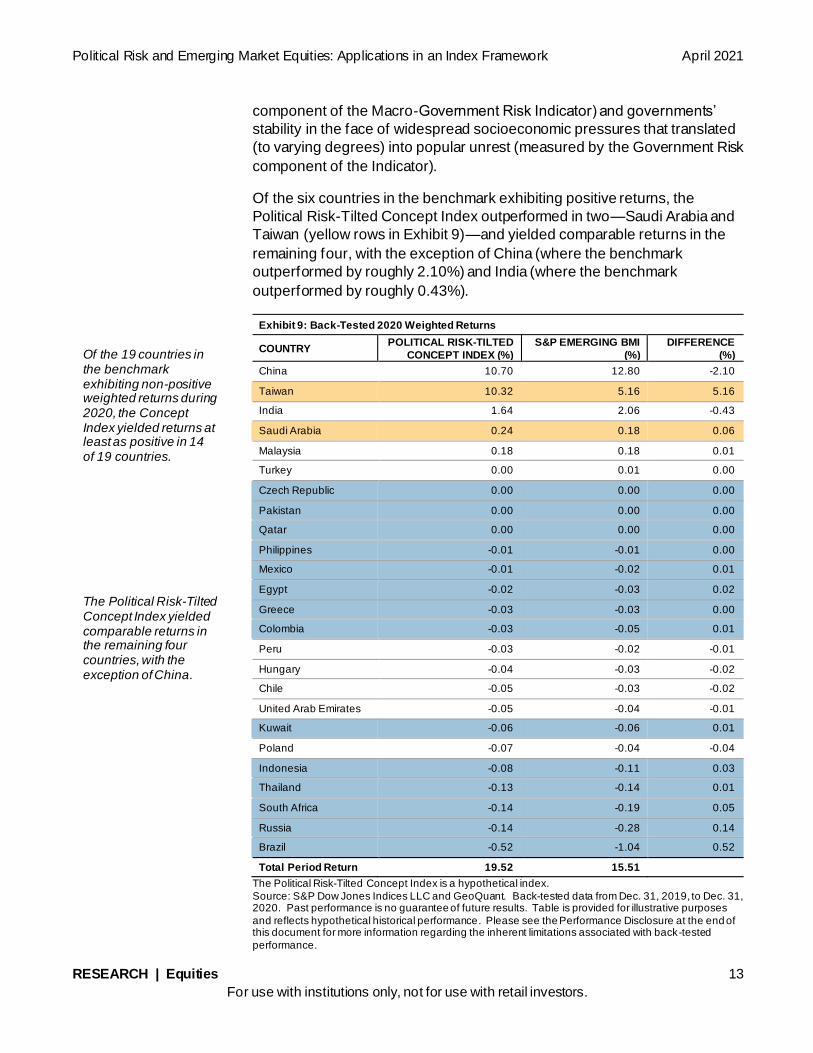
Of the six countries in the benchmark exhibiting positive returns, the
Political Risk-Tilted Concept Index outperformed in two—Saudi Arabia and
Taiwan (yellow rows in Exhibit 9)—and yielded comparable returns in the
remaining four, with the exception of China (where the benchmark
outperformed by roughly 2.10%) and India (where the benchmark
outperformed by roughly 0.43%).
Exhibit 9: Back-Tested 2020 Weighted Returns
COUNTRY POLITICAL RISK-TILTED
CONCEPT INDEX (%)
S&P EMERGING BMI
(%)
DIFFERENCE
(%)
China 10.70 12.80 -2.10
Taiwan 10.32 5.16 5.16
India 1.64 2.06 -0.43
Saudi Arabia 0.24 0.18 0.06
Malaysia 0.18 0.18 0.01
Turkey 0.00 0.01 0.00
Czech Republic 0.00 0.00 0.00
Pakistan 0.00 0.00 0.00
Qatar 0.00 0.00 0.00
Philippines -0.01 -0.01 0.00
Mexico -0.01 -0.02 0.01
Egypt -0.02 -0.03 0.02
Greece -0.03 -0.03 0.00
Colombia -0.03 -0.05 0.01
Peru -0.03 -0.02 -0.01
Hungary -0.04 -0.03 -0.02
Chile -0.05 -0.03 -0.02
United Arab Emirates -0.05 -0.04 -0.01
Kuwait -0.06 -0.06 0.01
Poland -0.07 -0.04 -0.04
Indonesia -0.08 -0.11 0.03
Thailand -0.13 -0.14 0.01
South Africa -0.14 -0.19 0.05
Russia -0.14 -0.28 0.14
Brazil -0.52 -1.04 0.52
Total Period Return 19.52 15.51
The Political Risk-Tilted Concept Index is a hypothetical index.
Source: S&P Dow Jones Indices LLC and GeoQuant. Back-tested data from Dec. 31, 2019, to Dec. 31, 2020. Past performance is no guarantee of future results. Table is provided for illustrative purposes
and reflects hypothetical historical performance. Please see the Performance Disclosure at the end of this document for more information regarding the inherent limitations associated with back-tested
performance.
Of the 19 countries in the benchmark exhibiting non-positive weighted returns during 2020, the Concept Index yielded returns at least as positive in 14 of 19 countries. The Political Risk-Tilted Concept Index yielded comparable returns in the remaining four countries, with the exception of China.
Political Risk and Emerging Market Equities: Applications in an Index Framework April 2021
RESEARCH | Equities 14
For use with institutions only, not for use with retail investors.
Several examples drawn from countries with high weights in the S&P
Emerging BMI add nuance to the aggregate results presented in Exhibit 9.
They demonstrate specifically that amid an unexpected global pandemic,
equity market projections that skewed a risk-tilted approach missed an
opportunity to outperform the S&P Emerging BMI.
Brazil and Russia offer two clear cases where the Political Risk-Tilted
Concept Index outperformed the benchmark by limiting downside risk. In
Brazil, Macro-Government Risk heading into 2020 was elevated relative to
average risk levels observed in 2017-2018. The 2020 trend continued a
pattern of both elevated and volatile risk that began in earnest in 2019 and
persisted in 2020, owing to policy disagreements between President
Bolsonaro and opposition-controlled state and local governments over how
best to manage COVID-19. The Political Risk-Tilted Concept Index’s direct
“pricing in” of these constraints in the form of rising Macro-Government Risk
(specifically over the first half of 2020) drove its outperformance relative to
the benchmark. Although the S&P Emerging BMI and the Political Risk-
Tilted Concept Index experienced negative weighted annual returns for
Brazil in 2020, the Concept Index’s returns were consistently less negative,
-0.52% versus -1.04%, under the benchmark.
Russian Macro-Government Risk exhibited similar trends over 2020, but
with different underlying drivers. Distinct from Brazil, rising risk in early
2020 was in reaction to anti-government protests over the 2019 Duma
elections; these protests persisted heading into regional elections in
September 2020. In parallel, the persistent threat of oil sanctions posed
clear macro-economic policy challenges for President Putin amid already
plummeting oil prices linked to a reduction in global economic activity
during the pandemic. Russia’s weight in the Political Risk-Tilted Concept
Index decreased accordingly over 2020, helping to generate less negative
annual weighted returns under the Political Risk-Tilted Concept Index
relative to the S&P Emerging BMI.
While outperformance in the Russian and Brazilian cases was linked to a
reduction in downside risk, Taiwan’s returns under the Political Risk-Tilted
Concept Index outperformed the benchmark in 2020 due to an accurate
read on upside potential linked to politics. Specifically, Taiwanese Macro-
Government Risk trended downward on over much of 2020 (excepting Q4),
as incumbent President Tsai Ing-wen headed toward an easy re-election
and promised a continuation of macro-economic policymaking that had
positively sustained Taiwanese equity market performance since Tsai
assumed the presidency in 2016. Taiwanese Macro-Government Risk thus
continued to decline even as COVID-19 spread globally (excepting a late
fourth quarter upswing), facilitated by an aggressive government response
on the economic policy front as well as by Tsai’s success in limiting COVID-
under the Political Risk-Tilted Concept Index far exceeded those under the
Brazil and Russia offer two clear cases where the Political Risk-Tilted Concept Index outperformed the benchmark by limiting downside risk. The Political Risk-Tilted Concept Index’s direct “pricing in” of political constraints in the form of rising Macro-Government Risk drove its outperformance relative to the benchmark. Taiwan’s returns under the Political Risk-Tilted Concept Index outperformed the benchmark in 2020 due to an accurate read on upside potential linked to politics.
Political Risk and Emerging Market Equities: Applications in an Index Framework April 2021
RESEARCH | Equities 15
For use with institutions only, not for use with retail investors.
S&P Emerging BMI in 2020, outperforming the benchmark by more than
five percentage points.
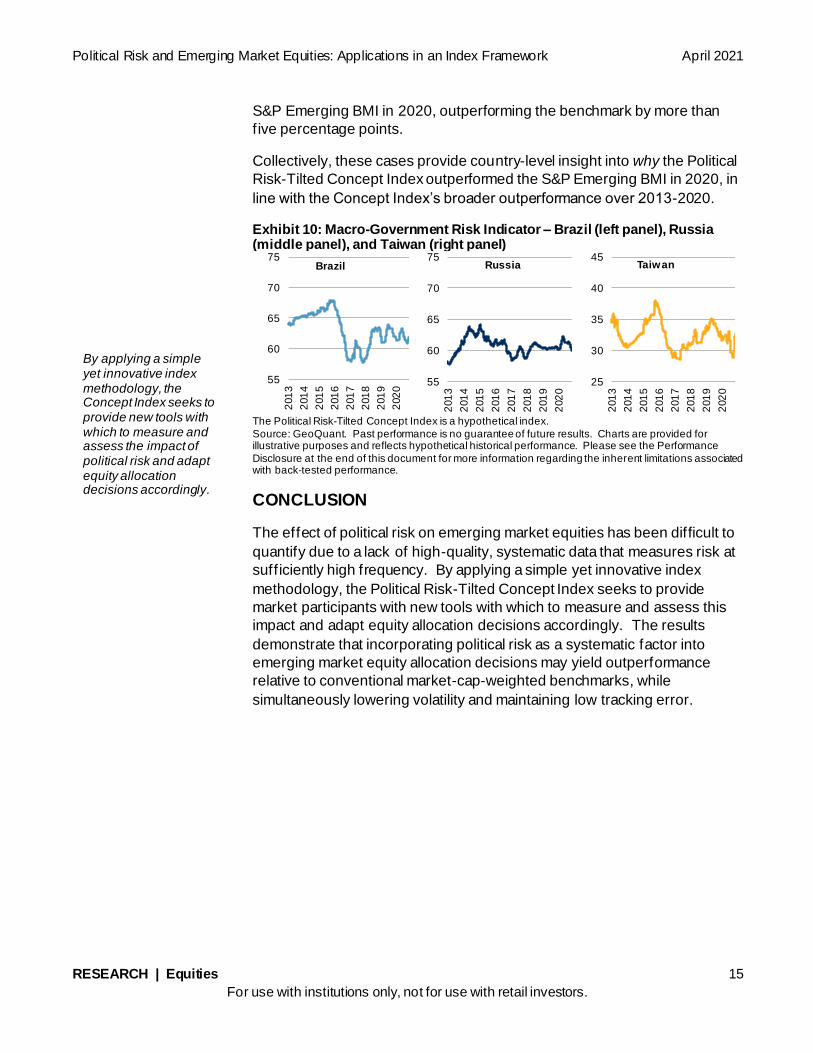
Collectively, these cases provide country-level insight into why the Political
Risk-Tilted Concept Index outperformed the S&P Emerging BMI in 2020, in
line with the Concept Index’s broader outperformance over 2013-2020.
Exhibit 10: Macro-Government Risk Indicator – Brazil (left panel), Russia (middle panel), and Taiwan (right panel)
The Political Risk-Tilted Concept Index is a hypothetical index.
Source: GeoQuant. Past performance is no guarantee of future results. Charts are provided for illustrative purposes and reflects hypothetical historical performance. Please see the Performance
Disclosure at the end of this document for more information regarding the inherent limitations associated with back-tested performance.
CONCLUSION
The effect of political risk on emerging market equities has been difficult to
quantify due to a lack of high-quality, systematic data that measures risk at
sufficiently high frequency. By applying a simple yet innovative index
methodology, the Political Risk-Tilted Concept Index seeks to provide
market participants with new tools with which to measure and assess this
impact and adapt equity allocation decisions accordingly. The results
demonstrate that incorporating political risk as a systematic factor into
emerging market equity allocation decisions may yield outperformance
relative to conventional market-cap-weighted benchmarks, while
simultaneously lowering volatility and maintaining low tracking error.
55
60
65
70
75
201
3
201
4
201
5
201
6
201
7
201
8
201
9
202
0
Brazil
55
60
65
70
75
201
3
201
4
201
5
201
6
201
7
201
8
201
9
202
0
Russia
25
30
35
40
45
201
3
201
4
201
5
201
6
201
7
201
8
201
9
202
0
Taiwan
By applying a simple yet innovative index methodology, the Concept Index seeks to provide new tools with which to measure and assess the impact of political risk and adapt equity allocation decisions accordingly.
Political Risk and Emerging Market Equities: Applications in an Index Framework April 2021
RESEARCH | Equities 16
For use with institutions only, not for use with retail investors.
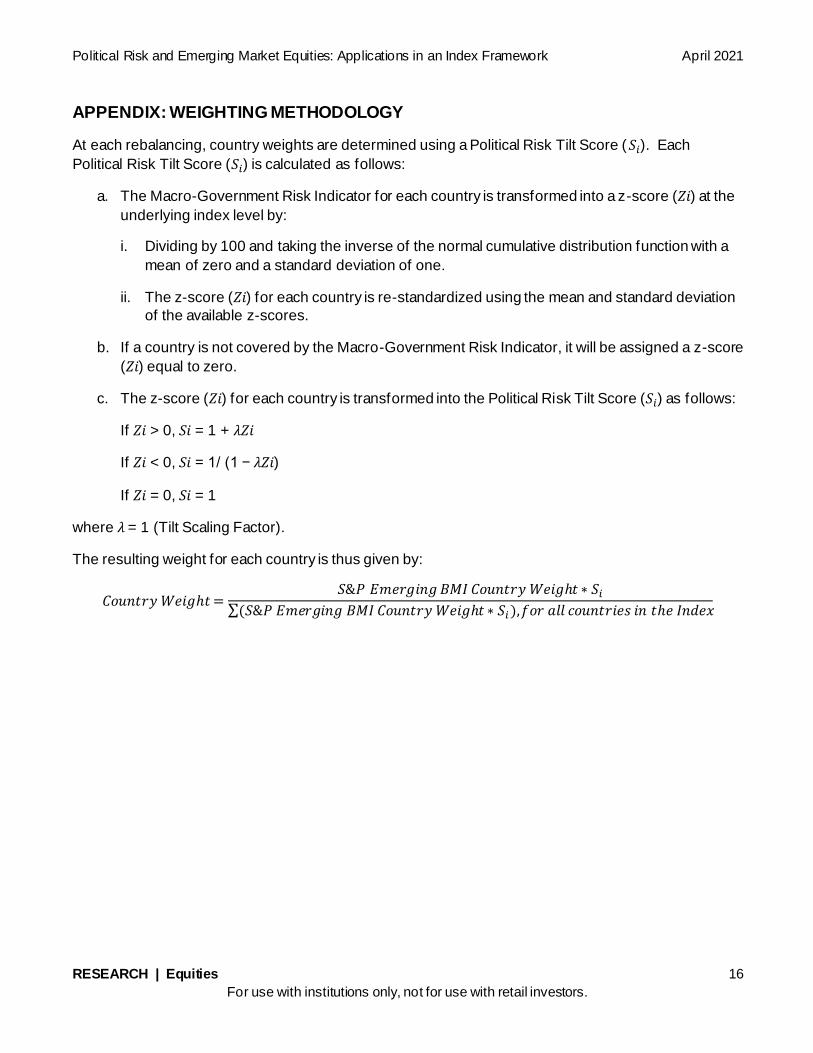
APPENDIX: WEIGHTING METHODOLOGY
At each rebalancing, country weights are determined using a Political Risk Tilt Score ( 𝑆𝑖). Each
Political Risk Tilt Score (𝑆𝑖) is calculated as follows:
a. The Macro-Government Risk Indicator for each country is transformed into a z-score (𝑍𝑖) at the
underlying index level by:
i. Dividing by 100 and taking the inverse of the normal cumulative distribution function with a
mean of zero and a standard deviation of one.
ii. The z-score (𝑍𝑖) for each country is re-standardized using the mean and standard deviation
of the available z-scores.
b. If a country is not covered by the Macro-Government Risk Indicator, it will be assigned a z-score
(𝑍𝑖) equal to zero.
c. The z-score (𝑍𝑖) for each country is transformed into the Political Risk Tilt Score (𝑆𝑖) as follows:
If 𝑍𝑖 > 0, 𝑆𝑖 = 1 + 𝜆𝑍𝑖
If 𝑍𝑖 < 0, 𝑆𝑖 = 1/ (1 − 𝜆𝑍𝑖)
If 𝑍𝑖 = 0, 𝑆𝑖 = 1
where 𝜆 = 1 (Tilt Scaling Factor).
The resulting weight for each country is thus given by:
Political Risk and Emerging Market Equities: Applications in an Index Framework April 2021
RESEARCH | Equities 18
For use with institutions only, not for use with retail investors.
PERFORMANCE DISCLOSURE/BACK-TESTED DATA
The Emerging Markets Political Risk-Tilted Concept Index is a hypothetical Index and has not been launched publicly as of the publication
date. All information presented prior to an index’s launch date is hypothetical (back-tested), not actual performance. The back-test calculations are based on the methodology described herein. When creating back-tested history for periods of market anomalies or other periods that do
not reflect the general current market environment, index methodology rules may be relaxed to capture a large enough universe of securities to simulate the target market the index is designed to measure or strategy the index is designed to capture. For example, market capitalization
and liquidity thresholds may be reduced. Upon launch, the complete index methodology details will be available at www.spglobal.com/spdji. Past performance of the Index is not an indication of future results. Back-tested performance reflects application of an index methodology and
selection of index constituents with the benefit of hindsight and knowledge of factors that may have positively affected its performance, cannot account for all financial risk that may affect results and may be considered to reflect survivor/look ahead bias. Actual returns may differ
significantly from, and be lower than, back-tested returns. Past performance is not an indication or guarantee of future results. Please refer to the methodology for the Index for more details about the index, including the manner in which it is rebalanced, the timing of such rebalanc ing,
criteria for additions and deletions, as well as all index calculations. Back-tested performance is for use with institutions only; not for use with retail investors.
S&P Dow Jones Indices defines various dates to assist our clients in providing transparency. The First Value Date is the firs t day for which
there is a calculated value (either live or back-tested) for a given index. The Base Date is the date at which the index is set to a fixed value for calculation purposes. The Launch Date designates the date when the values of an index are first considered live: index values provided for
any date or time period prior to the index’s Launch Date are considered back-tested. S&P Dow Jones Indices defines the Launch Date as the date by which the values of an index are known to have been released to the public, for example via the company’s public webs ite or its data
feed to external parties. For Dow Jones-branded indices introduced prior to May 31, 2013, the Launch Date (which prior to May 31, 2013, was termed “Date of introduction”) is set at a date upon which no further changes were permitted to be made to the index methodology, but that
may have been prior to the Index’s public release date.
Typically, when S&P DJI creates back-tested index data, S&P DJI uses actual historical constituent-level data (e.g., historical price, market capitalization, and corporate action data) in its calculations. As ESG investing is still in early stages of development, certain datapoints used to
calculate S&P DJI’s ESG indices may not be available for the entire desired period of back -tested history. The same data availability issue could be true for other indices as well. In cases when actual data is not available for all relevant historical periods, S&P DJI may employ a
process of using “Backward Data Assumption” (or pulling back) of ESG data for the calculation of back -tested historical performance. “Backward Data Assumption” is a process that applies the earliest actual live data point available for an index constituent company to all prior
historical instances in the index performance. For example, Backward Data Assumption inherently assumes that comp anies currently not involved in a specific business activity (also known as “product involvement”) were never involved historically and similarly also assumes that
companies currently involved in a specific business activity were involved historically too. The Backward Data Assumption allows the hypothetical back-test to be extended over more historical years than would be feasible using only actual data. For more information on “Backward Data Assumption” please refer to the FAQ. The methodology and factsheets of any index that employs backward assumption in the
back-tested history will explicitly state so. The methodology will include an Appendix with a table setting forth the specific data points and relevant time period for which backward projected data was used.
Index returns shown do not represent the results of actual trading of investable assets/securities. S&P Dow Jones Indices maintains the index
and calculates the index levels and performance shown or discussed but does not manage actual assets. Index returns do not re flect payment of any sales charges or fees an investor may pay to purchase the securities underlying the Index or investment funds that are intended to
track the performance of the Index. The imposition of these fees and charges would cause actual and back-tested performance of the securities/fund to be lower than the Index performance shown. As a simple example, if an index returned 10% on a US $100,000 investment
for a 12-month period (or US $10,000) and an actual asset-based fee of 1.5% was imposed at the end of the period on the investment plus accrued interest (or US $1,650), the net return would be 8.35% (or US $8,350) for the year. Over a three-year period, an annual 1.5% fee
taken at year end with an assumed 10% return per year would result in a cumulative gross return of 33.10%, a total fee of US $5,375, and a cumulative net return of 27.2% (or US $27,200).
methodology are proprietary to S&P Dow Jones Indices LLC. S&P, S&P 500, S&P 500 LOW VOLATILITY INDEX, S&P 100, S&P COMPOSITE 1500, S&P MIDCAP 400, S&P SMALLCAP 600, SELECT SECTOR, S&P GIVI, GLOBAL TITANS, DIVI DEND ARISTOCRATS,
S&P TARGET DATE INDICES, S&P PRISM, S&P STRIDE, GICS, SPIVA, SPDR and INDEXOLOGY are registered trademarks of Standard & Poor’s Financial Services LLC, a division of S&P Global (“S&P”). DOW JONES, DJ, DJIA, The Dow and DOW JONES INDUSTRIAL
AVERAGE are registered trademarks of Dow Jones Trademark Holdings LLC (“Dow Jones”). These trademarks together with others ha ve been licensed to S&P Dow Jones Indices LLC. Redistribution or reproduction in whole or in part are prohibited without written permission of
S&P Dow Jones Indices LLC. This document does not constitute an offer of services in jurisdictions where S&P Dow Jones Indices LLC, S&P, Dow Jones or their respective affiliates (collectively “S&P Dow Jones Indices”) do not have the necessary licenses. Except for certain custom
index calculation services, all information provided by S&P Dow Jones Indices is impersonal and not tailored to the needs of any person, entity or group of persons. S&P Dow Jones Indices receives compensation in connection with licensing its indices to third parties an d providing
custom calculation services. Past performance of an index is not an indication or guarantee of future results.
It is not possible to invest directly in an index. Exposure to an asset class represented by an index may be available through investable instruments based on that index. S&P Dow Jones Indices does not sponsor, endorse, sell, promote or manage any investment fund or other
investment vehicle that is offered by third parties and that seeks to provide an investment return based on the performance o f any index. S&P Dow Jones Indices makes no assurance that investment products based on the index will accurately track index performance or provide
positive investment returns. S&P Dow Jones Indices LLC is not an investment advisor, and S&P Dow Jones Indices makes no repre sentation regarding the advisability of investing in any such investment fund or other investment vehicle. A decision to invest in any such investment
fund or other investment vehicle should not be made in reliance on any of the statements set forth in this document. Prospect ive investors are advised to make an investment in any such fund or other vehicle only after carefully considering the risks associated with investing in such
funds, as detailed in an offering memorandum or similar document that is prepared by or on behalf of the issuer of the invest ment fund or other investment product or vehicle. S&P Dow Jones Indices LLC is not a tax advisor. A tax advisor should be consulted to evaluate the
impact of any tax-exempt securities on portfolios and the tax consequences of making any particular investment decision. Inclu sion of a security within an index is not a recommendation by S&P Dow Jones Indices to buy, sell, or hold such security, nor is it cons idered to be
investment advice.
These materials have been prepared solely for informational purposes based upon information generally available to the public and from sources believed to be reliable. No content contained in these materials (including index data, ratings, credit -related analyses and data,
research, valuations, model, software or other application or output therefrom) or any part thereof (“Content”) may be modified, reverse -engineered, reproduced or distributed in any form or by any means, or stored in a database or retrieval system, without the p rior written
permission of S&P Dow Jones Indices. The Content shall not be used for any unlawful or unauthorized purposes. S&P Dow Jones Indices and its third-party data providers and licensors (collectively “S&P Dow Jones Indices Parties”) do not guarantee the accuracy, completeness , timeliness or availability of the Content. S&P Dow Jones Indices Parties are not responsible for any errors or omissions, regardless of the
cause, for the results obtained from the use of the Content. THE CONTENT IS PROVIDED ON AN “AS IS” BASIS. S&P DOW JONES INDICES PARTIES DISCLAIM ANY AND ALL EXPRESS OR IMPLIED WARRANTIES, INCLUDING, BUT NOT LIMITED TO, ANY
WARRANTIES OF MERCHANTABILITY OR FITNESS FOR A PARTICULAR PURPOSE OR USE, FREEDOM FROM BUGS, SOFTWARE ERRORS OR DEFECTS, THAT THE CONTENT’S FUNCTIONING WILL BE UNINTERRUPTED OR THAT THE CONTENT WILL OPERATE
WITH ANY SOFTWARE OR HARDWARE CONFIGURATION. In no event shall S&P Dow Jones Indices Parties be liable to any party for any direct, indirect, incidental, exemplary, compensatory, punitive, special or consequential damages, costs, expenses, legal fees, or losses
(including, without limitation, lost income or lost profits and opportunity costs) in connection with any use of the Content even if advised of the possibility of such damages.
S&P Global keeps certain activities of its various divisions and business units separate from each other in order to preserve the independence
and objectivity of their respective activities. As a result, certain divisions and business units of S&P Global may have info rmation that is not available to other business units. S&P Global has established policies and procedures to maintain the confidentiality of certain non-public
information received in connection with each analytical process.
In addition, S&P Dow Jones Indices provides a wide range of services to, or relating to, many organizations, including issuers of securities, investment advisers, broker-dealers, investment banks, other financial institutions and financial intermediaries, and accordingly may receive
fees or other economic benefits from those organizations, including organizations whose securities or services they may recommend, rate, include in model portfolios, evaluate or otherwise address.
GEOQUANT DISCLAIMER: Any opinions, estimates or projections expressed herein may assume some economic, industry and political
considerations and constitute current opinions, at the time of issuance, that are subject to change. This information is bein g furnished to you for informational purposes only, and on the condition that it will not form a primary basis for any investment decision and is intended for
institutional clients only. This report may contain links to third-party websites, and GeoQuant Inc. is not responsible for their content or any linked content contained therein; access to these links is at your own risk. This message is intended only for the use of the individuals to which
it is addressed and may contain information that is proprietary, privileged or confidential. If you are not the named addressee unauthorized use, disclosure or copying is strictly prohibited, and may be unlawful. If you have received this communication in error, ple ase immediately
notify the sender by return e-mail, and delete the original message and all copies from your system.