57
POLK COUNTY COMPREHENSIVE PLAN 2009-2029 ADOPTED OCTOBER 20 th , 2009
POLK COUNTY COMPREHENSIVE PLAN
2009-2029
ADOPTED OCTOBER 20th, 2009

Forward
Special thanks goes out to all of the local level Plan Commissions, county level Plan Commission, contributing citizens, and survey respondents, for all their hard work and dedication to this process and for helping provide their input for this plan.

POLK COUNTY, WISCONSIN COMPREHENSIVE PLAN
2009-2029
POLK COUNTY PLAN COMMISSION MEMBERS:
Kim O’Connell Keith Rediske Ken Sample
Larry Voelker Craig Moriak
CURRENT COUNTY BOARD MEMBERS:
Bryan Beseler - Chair Keith Rediske -1st Vice Chairman Patricia Schmidt -2nd Vice Chairman Bob Dueholm Joan Peterson Dean Johansen Herschel Brown Kathryn Kienholz Marvin Caspersen James Edgell Brian Masters Ken Sample
Craig Moriak Russell Arcand Michael Larsen Jay Luke Diane Stoneking Larry Jepsen Kim O’Connell Gary Bergstrom Neil Johnson Larry Voelker Gerald Newville
ELEMENT SUBCOMMITTEE MEMBERS:
Housing: Land Use: Don Althoff Steve Arduser Jenny Bergmann-Mortel Justin Duncan Bonnie Leonard Bruce Paulson Ed Gullickson Gary Spanel Craig Moriak Pam Blegen Dwayne Rasmussen Transportation: Jose Trejo Keith Rediske Milton Johnson Craig Moriak Gretchen Sampson James Beistle Steve Stocker Energy and Sustainability: Larry Voelker Jeff Peterson Brad Johnson Nancy Stewart Moe Norby Marc Cutter Cindy Cutter Utilities and Community Facilities: Bob Kazmierski Neil Soltis Tom Engel William Johnson Wendy Olney-Rattel Jeff Peterson Cindy Collins Gene Krull Sue Sopiwnik Alan Pearson Agricultural, Natural, and Jean Schermer Cultural Resources: Jim Skemp Carol Wallin Mike Bauer Jean Schermer Janice Bauer Tim Ritten Donald Hoffman Ryan Sterry Dan Beal Paul Pedersen Evie Beal Deb Peterson Kathryn Kienholz Brian Hobbs Kathleen Melin Dan Graf Ed Spiess Patti Lehman Dan Worrell Cory Ruona Economic Development: Cindy Stimmler Kim O’Connell Kris Schmid Darcy Long Kathleen Kolar Mike Welch Donna Mumm Chris Nelson Mark Buley Tonya Weinert Nancy Buley Win Herberg Intergovernmental Cooperation: David Ammend Andrea Jerrick Don Keseler Marv Caspersen Joyce Keseler Steve Hanson Jerry Viebrock Ken Sample Polk County Renewable Energy Committee Jeff Fuge Malia Malone

Polk County has chosen, as part of the multi-jurisdictional grant, to develop its Comprehensive Plan through a bottom-up approach. This means that the common themes, ideas, and concepts detailed in the local level plans of towns, villages, and cities were used to build the county plan and give direction for the county for the future. This means that all plans developed within the county were used to develop the Polk County Comprehensive Plan. In addition to the names listed above input was received from local Plan Commissions, citizens who made their opinions known by completing surveys and participating in their local plan development process. More detail on the grant process is available in the Issues and Opportunities Element.
TABLE OF CONTENTS Page # ELEMENT 1: ISSUES AND OPPORTUNITIES 1
1.1 Background 1.2 Issues and Opportunities
1.2.1 Strategic Plan 1.2.2 Sustainability
1.3 Socio-Economic Profile 1.4 Summary
ELEMENT 2: HOUSING 46
2.1 Visioning 2.2 Existing Conditions 2.3 Assessment of Future Needs 2.4 SWOT Analysis 2.5 Current Housing Programs 2.6 Goals, Objectives, and Policies
ELEMENT 3: TRANSPORTATION 71
3.1 Visioning 3.2 Existing Conditions 3.3 Road Classifications 3.4 Planned Improvements 3.5 Relevant Transportation Plans 3.6 SWOT Analysis 3.7 Goals, Objectives, and Policies
ELEMENT 4: UTILITIES AND COMMUNITY FACILITIES 104
4.1 Existing Conditions 4.1.1 Inventory of Utilities 4.1.2 Inventory of Educational Facilities 4.1.3 Inventory of Other Community Facilities and Services
4.2 SWOT Analysis 4.3 Goals, Objectives, and Policies
ELEMENT 5: AGRICULTURAL, NATURAL AND CULTURAL RESOURCES 147
5.1 Visioning 5.2 Existing Conditions 5.3 Agricultural Resources 5.4 Natural Resources 5.5 Cultural Resources 5.6 SWOT Analysis 5.7 Goals, Objectives, and Policies
TABLE OF CONTENTS Page # ELEMENT 6: ECONOMIC DEVELOPMENT 200
6.1 Visioning 6.2 Existing Conditions 6.3 Desired Types of Economic Development 6.4 SWOT Analysis 6.5 Issues and Opportunities 6.6 Opportunities for Redevelopment 6.7 Current Economic Development Programs 6.8 Goals, Objectives, and Policies
ELEMENT 7: INTERGOVERNMENTAL COOPERATION 237
7.1 Visioning 7.2 Existing Conditions
7.2.1 Pertinent Existing Agreements 7.3 SWOT Analysis 7.4 Opportunities for Intergovernmental Cooperation 7.5 Existing and Potential Conflicts 7.6 Goals, Objectives, and Policies
ELEMENT 8: LAND USE 242
8.1 Visioning 8.2 Existing Conditions 8.3 Land Supply, Demand, and Prices 8.4 Future Land Use 8.5 SWOT Analysis 8.6 Goals and Objectives
ELEMENT 9: ENERGY AND SUSTAINABILITY 360 9.1 Existing Conditions 9.2 Goals, Objectives, and Policies ELEMENT 10: IMPLEMENTATION 365
10.1 Changes to Land Use Controls 10.2 Consistency and integration of comprehensive plan elements 10.3 Mechanisms to Measure Progress Toward Achieving All Aspects of the
Comprehensive Plan 10.4 Comprehensive Plan Amendments and Update 10.5 Implementation Recommendations
APPENDIX i
Public Participation Plan i

Polk
TrempealeauBuffaloPepin
EauClairePierce
DunnSt.
CroixChippewa
RuskBarron
BurnettSawyerWashburn
Douglas Bayfield
GoodhueScott
Dakota
Carver
RamseyHennepin
Washington
AnokaWright
Sherburne Chisago
Isanti
Kanabec
MilleLacs
Pine
Aitkin
This drawing is the result of a compilation and reproduction of landrecords as they appear in various Polk County Offices. Thedrawing should be used for reference purposes only. Polk Countyis not responsible for any inaccuracies herein contained.
MAP 1-1
Created by:Polk County Land Information DepartmentGeographic Information Systems Division100 Polk County Plaza, Suite 130Balsam Lake, WI 54810Ph: 715.485.9279Fax: 715.485.9246www.co.polk.wi.us 5/13/09
0 10 205Miles
LOCATIONMAP
POLK COUNTYWISCONSIN COUNTIESMINNESOTA COUNTIES
POLK COUNTY

I
GE
EG
JJJ
O
E
E
35
48
N
E
DF
35
XX
M 65A
CC
C
PP
C
A46
CC
C
F
JJ
63
A
P
A
D
PJ
D46 JJ
FF
H
C
C
K
F
65
F
Y
35 K
M
MM
M243
S
Y35
87
35
I
8
46
H
I V
DV
8
T
G
T
G
E
GDEI
GG
G
G46
35G
I
Z
G
G87
87
B Z
B
N
B
W
I48
I
O
48
E
W
48
W
I
O
E
63
35EE
This drawing is the result of a compilation and reproduction of landrecords as they appear in various Polk County Offices. Thedrawing should be used for reference purposes only. Polk Countyis not responsible for any inaccuracies herein contained.
Created by:Polk County Land Information DepartmentGeographic Information Systems Division100 Polk County Plaza, Suite 130Balsam Lake, WI 54810Ph: 715.485.9279Fax: 715.485.9246www.co.polk.wi.us
Polk CountyWisconsin
8/7/09
COMPREHENSIVEPLANNING
GRANTPARTICIPANTS
0 3 61.5Miles
US HIGHWAY SHIELDSTATE HIGHWAY SHIELDCOUNTY ROAD SHIELDConsultant: CountyConsultant: OtherPlanning CommissionNot ParticipatingUS HIGHWAYSTATE HIGHWAYCOUNTY ROAD
State of Wisconsin
FARMINGTON ALDENBLACKBROOK
CLEARLAKE
OSCEOLA GARFIELD LINCOLN CLAYTON
BEAVERAPPLERIVER
BALSAMLAKE
ST CROIXFALLS
JOHNSTOWNGEORGETOWN
MILLTOWN
MCKINLEY
EUREKA
BONELAKE
LUCKLAKETOWNSTERLING
WESTSWEDEN
LORAINCLAMFALLS
Frederic
Luck
Milltown
Balsam LakeCenturia
St Croix Falls
Dresser
OsceolaAmery
ClearLake
Clayton
TurtleLake
MAP 1-2
BURNETT COUNTY
ST CROIX COUNTY
BARRON COUNTYBURNETT COUNTY
BARRON COUNTY
ST CROIX COUNTY

Polk County, Wisconsin Issues and Opportunities
Comprehensive Plan 2009-2029 1
ELEMENT 1: ISSUES AND OPPORTUNITIES This element will cover the items that are important to Polk County and will offer ideas on what the public values and detail some background data relevant to the plan development. In order to address these things, this element will cover the following:
1.1 BACKGROUND 1.2 ISSUES AND OPPORTUNITIES
1.2.1 STRATEGIC PLAN 1.2.2 SUSTAINABILITY
1.3 SOCIO-ECONOMIC PROFILE 1.4 SWOT ANALYSIS 1.5 SUMMARY
1.1 BACKGROUND Introduction The availability of natural and recreational resources and its proximity to the Minneapolis-St. Paul metropolitan area has made Polk County a desirable place to live. Ongoing improvements in the transportation system, modes of transportation, and communications technology continue to expand the limits of acceptable distances between home and the workplace. With the allure of the County’s natural and recreational resources, rural character, and the area’s continued strong economy, development pressures are likely to continue. It is important to understand that growth and development activities have an impact on the social, economic, and natural environments, and, in some instances, can negatively impact the desired characteristics that originally made the location an attractive place to live. In 2007, Polk County, along with 24 of its municipalities, received a comprehensive planning grant from the State of Wisconsin. The communities included in the grant are shown on Map 1-2. Polk County decided on a process that would utilize a ground-up approach to planning within the County. This means that local municipalities built their plans with the input of their citizenry and crafted their issues, opportunities, goals, and objectives. These plans were then reviewed at the county level, where common themes in the issues, opportunities, goals and objectives were integrated into the County Plan. This approach was selected to best ensure that the views, needs, and desires of the
Polk County, Wisconsin Issues and Opportunities
Comprehensive Plan 2009-2029 2
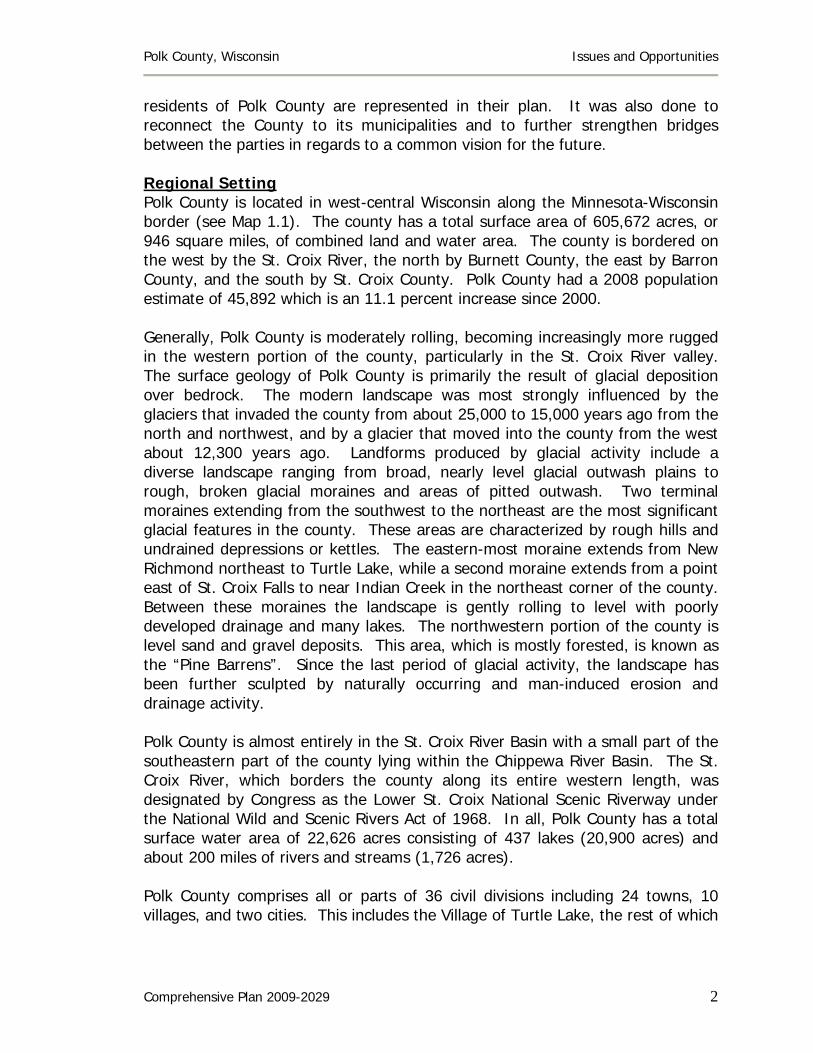
residents of Polk County are represented in their plan. It was also done to reconnect the County to its municipalities and to further strengthen bridges between the parties in regards to a common vision for the future. Regional Setting Polk County is located in west-central Wisconsin along the Minnesota-Wisconsin border (see Map 1.1). The county has a total surface area of 605,672 acres, or 946 square miles, of combined land and water area. The county is bordered on the west by the St. Croix River, the north by Burnett County, the east by Barron County, and the south by St. Croix County. Polk County had a 2008 population estimate of 45,892 which is an 11.1 percent increase since 2000. Generally, Polk County is moderately rolling, becoming increasingly more rugged in the western portion of the county, particularly in the St. Croix River valley. The surface geology of Polk County is primarily the result of glacial deposition over bedrock. The modern landscape was most strongly influenced by the glaciers that invaded the county from about 25,000 to 15,000 years ago from the north and northwest, and by a glacier that moved into the county from the west about 12,300 years ago. Landforms produced by glacial activity include a diverse landscape ranging from broad, nearly level glacial outwash plains to rough, broken glacial moraines and areas of pitted outwash. Two terminal moraines extending from the southwest to the northeast are the most significant glacial features in the county. These areas are characterized by rough hills and undrained depressions or kettles. The eastern-most moraine extends from New Richmond northeast to Turtle Lake, while a second moraine extends from a point east of St. Croix Falls to near Indian Creek in the northeast corner of the county. Between these moraines the landscape is gently rolling to level with poorly developed drainage and many lakes. The northwestern portion of the county is level sand and gravel deposits. This area, which is mostly forested, is known as the “Pine Barrens”. Since the last period of glacial activity, the landscape has been further sculpted by naturally occurring and man-induced erosion and drainage activity. Polk County is almost entirely in the St. Croix River Basin with a small part of the southeastern part of the county lying within the Chippewa River Basin. The St. Croix River, which borders the county along its entire western length, was designated by Congress as the Lower St. Croix National Scenic Riverway under the National Wild and Scenic Rivers Act of 1968. In all, Polk County has a total surface water area of 22,626 acres consisting of 437 lakes (20,900 acres) and about 200 miles of rivers and streams (1,726 acres). Polk County comprises all or parts of 36 civil divisions including 24 towns, 10 villages, and two cities. This includes the Village of Turtle Lake, the rest of which

Polk County, Wisconsin Issues and Opportunities
Comprehensive Plan 2009-2029 3
lies in Barron County. The Village of Balsam Lake, population 1,075, is the county seat. The largest community is the City of Amery with 2,919 people. Polk County is located northeast of the Minneapolis-St. Paul metropolitan area, and is contiguous to the Minneapolis-St. Paul Metropolitan Statistical Area (MSA). The Census Bureau defines a Metropolitan Statistical Area (MSA) as a county or counties with a central city of at least 50,000 people, a total population over 100,000 people, and significant social and economic ties between the central city and outlying counties. By that definition, St. Croix County became part of the Minneapolis-St. Paul MSA in 1980 and Pierce County in 1990. Consequently, even though Polk County is not currently a part of the MSA, it is apparent that the influence of the metro area is spreading, and that Polk County is becoming more economically and socially interconnected to the MSA. Major transportation corridors in Polk County are U.S. Highway 8, which runs east-west through the county, U.S. Highway 63 which travels through an eastern portion of the county, and five state trunk highways (STH 35, 46, 48, 65, & 87). A relatively fine network of town roads distributes traffic to numerous county trunk highways. Polk County’s climate is classified as mid-latitude continental. Warm, humid summers and cold, snowy winters are the main characteristics. The average monthly temperature ranges from 15 degrees Fahrenheit in January to 73 degrees Fahrenheit in July. Annual precipitation averages 32 inches, with approximately two-thirds of this occurring as rain. Seasonal snowfall ranges from 12 to 75 inches. Currently the area is experiencing a multi-year dry spell in which precipitation amounts have been well below normal and thus the surface water and groundwater have receded, in some cases quite dramatically. Need for a Plan Polk County completed a countywide land use plan in 2003, which, for a variety of reasons, never served to give direction for the future of the county. A Zoning Ordinance was adopted in 1971, and has not been comprehensively revised since that time. Consequently, it is likely that the information upon which development decisions are being made in the County, and the implementation tools used to guide development, are inadequate to meet the challenges of effectively directing current or future growth. Budget crises of recent years have also driven home the point that planning and prioritizing are needed to ensure the provision of cost-effective and efficient governmental services. The proximity to the Minneapolis-St. Paul metropolitan area has a profound impact on Polk County. Population growth alone indicates the magnitude of that

Polk County, Wisconsin Issues and Opportunities
Comprehensive Plan 2009-2029 4
impact on the County. Significant increases in population occurred during the 1970s and 1990s, and this growth appears to be continuing in the 2000s. Towns, villages and cities in the southwestern part of the county have experienced the greatest rates of growth, especially in rural residential development. Similar to trends in other areas of Wisconsin, non-farm residential development has increased significantly in rural areas. Although this transition is not yet as pronounced as in areas closer to the Minneapolis-St. Paul metropolitan area, continued growth will foster an increased demand for this type of development. This residential growth has led to a change in the rural character by transforming the previously rural farm areas into rural residential areas. Another indicator of development is the increased economic growth as indicated by employment increases within the county. Although commuting patterns indicate that a significant portion of residents living in southwestern Polk County are driving to the Minneapolis-St. Paul metropolitan area to work, Polk County has maintained a presence in the region's economy. Between 1990 and 2000 there was a 33% increase in employment within the County, while having a 19% increase in population. Consequently, even though a significant number of people are commuting to Minnesota to work, employment increases within the County have also contributed to growth in the residential, industrial and commercial sectors of the Polk County economy. Although increases in employment and development are generally viewed as positive, it is important to understand that this growth has increased the demand for public services, required significant investment in public infrastructure, and impacted natural resources and the physical environment. Unfortunately, local units of government have limited capacity to deal with these issues. This is primarily due to a lack of resources and non-existent or outdated planning information and enforcement tools. Polk County’s 2003 Land Use Plan’s expressed purpose was to facilitate a rewrite of the outdated zoning ordinances that the county currently has. Due to a number of circumstances, those implementation recommendations for the most part went unfulfilled. The 2009 Polk County Comprehensive Plan is an update and expansion of the 2003 Land Use Plan. The 2003 Land Use Plan was not developed under the Comprehensive Planning legislation and does not meet the State requirements. Because of these new requirements, revisions and updates to the 2003 plan were needed. The comprehensive plan covers many more subjects that the Land Use Plan and is subject to the new requirements of the Comprehensive Planning Legislation, which necessitated this additional planning process. Therefore, after a few years of capacity building for planning within the county, Polk County began polling interest among its municipalities for a new

Polk County, Wisconsin Issues and Opportunities
Comprehensive Plan 2009-2029 5
approach to planning through a multi-jurisdictional grant. Polk County wanted plans at the local and county level to reflect the desires and needs of its residents. The process chosen was one of building plans at the local level and capitalizing on the common themes that emerged, meaning that these are the important issues to those who live, work, and play in Polk County. Planning Background and Authority Under Section 59.69 of the Wisconsin Statutes, the stated purpose of planning and zoning is to promote the public health, safety, convenience and general welfare of the County. In addition, other identified reasons for planning and zoning are:
• To encourage planned and orderly land-use development; • To protect property values and tax bases; • To permit careful planning and efficient maintenance of highway systems; • To ensure adequate highway, utility, health, educational, and recreational facilities; • To recognize the needs of agriculture, forestry, industry, and business in future growth; • To encourage the appropriate use of land and natural resource conservation; • To encourage the protection of ground water resources; • To preserve wetlands and conserve soil, water, and forest resources; • To protect the beauty of the landscape and man-made developments; • To provide healthy surroundings for family life; and, • To promote the efficient and economical use of public funds.
With these purposes in mind, the Polk County Board of Supervisors may plan for the physical development and zoning of territory within the County. According to Wisconsin Statute, a plan may include, without limitation, comprehensive surveys, studies, and analyses of:
• County history; • Existing land use; • Population and population density; • Economy; • Soil characteristics; • Forest cover; • Wetland and floodplain conditions; and, • Other human or natural features of the county.
Polk County, Wisconsin Issues and Opportunities
Comprehensive Plan 2009-2029 6
Purpose of a Plan The purpose of the Polk County Comprehensive Plan is to develop a complete set of informational resources and a policy framework to assist the county and local units of government in managing development. To address growth and development occurring in Polk County, the plan explores the physical and economic conditions of the county; identifies what the residents, groups, organizations and institutions believe are the important development issues affecting the County; and articulates a countywide development policy to assist local and County governments in building their capacity to deal with development issues. When adopted by the Polk County Board of Supervisors, the Comprehensive Plan is certified by designated state statutes to serve as a guide for public and private actions and decisions to assure the appropriate development of public and private property in Polk County. If conscientiously implemented, the plan will act as the basis for ensuring the appropriate development of the County. The plan, along with the implementation tools, will provide local governments with the ability to effectively and efficiently make public investment decisions and work with developers to ensure private investments are compatible with the public interest. The primary objective of the Comprehensive Plan is to minimize the impacts and maximize the opportunities that growth and development brings to the County. Development, acceptance and implementation of the plan can also provide many other benefits including:
• An allocation of land uses that provides for the health, safety, and welfare of the residents, and maximizes the amenity and convenience; • An allocation of land uses that maintains a balance between the activities of people and the natural environment which supports them; • the establishment of a relationship of land uses to soil type in order to maximize existing natural resources, avoid costly development activities, and protect irreplaceable resources; • the protection of lakes, streams, wetlands and woodlands, and other natural habitats, which are essential in order to maintain environmental values, provide recreational opportunities and maintain a desirable aesthetic setting; • The preservation of the most productive agricultural land for agricultural use; • the development of an efficient and cost effective transportation system that provides accessibility and service essential to support the surrounding land uses;

Polk County, Wisconsin Issues and Opportunities
Comprehensive Plan 2009-2029 7
• The establishment of residential areas conveniently located proximate to commercial, educational, health, transportation and recreational facilities and employment opportunities; and • The savings of public and private expenditures through wise investment decisions based on sound development policy.
The result of the Polk County Comprehensive Plan will be an enhanced ability of the County and local governments to promote the health, safety and welfare of the public and make wise investment decisions. Planning Process Given the scope of this plan, a considerable number of financial, political, technical, and legal resources were necessary to complete it. These resources included the respective County and local governments; the Wisconsin Departments of Revenue, Transportation, Natural Resources, and Workforce Development; West Central Wisconsin Regional Planning Commission; University of Wisconsin-Extension; Soil Conservation Service; Minnesota-Wisconsin Boundary Area Commission; the private sector (developers, engineers and lawyers); and the Wisconsin Legislature. In addition, throughout the entire process, oversight for the development of the Polk County Comprehensive Plan was the responsibility of the Land Information Committee, which is the acting Plan Commission for Polk County. The planning process relied heavily on the participation of local governments and individual citizens. Without their involvement and support, the plan would not be an accurate reflection of what Polk County is, what it wants to be, and how it wants to get to its desired future. Perhaps the most important element of the planning process occurred in all phases of the plan’s development - Community Involvement. The process chosen by Polk County and its municipalities was an intentional effort to reconnect the local municipalities with the County and to jointly develop a plan informed by local issues and needs. The stated goal of the bottom-up approach is to organize the priorities and direction of County government to match the needs and goals of the citizens of Polk County. This process, which began in 2007, has involved the input of the 24 local municipalities as well as the input of those communities who developed Comprehensive Plans, but were not part of the grant. In addition, the Polk County Plan Commission (Land Information Committee) held a series of meetings, all open to the public, as part of the development of the Polk County Comprehensive Plan. The Plan Commission then developed sub-commissions -- the Rural Plan Commission and the Urban Plan Commission. These sub-committees were charged with review of the local level

Polk County, Wisconsin Issues and Opportunities
Comprehensive Plan 2009-2029 8
plans to identify common themes, goals, needs, visions, etc. and bring these forth into the Polk County Comprehensive Plan. Since there are issues that are specific to the local level, the County’s plan cannot be as specific as some of the local plans. Instead, the County plan will be an umbrella plan that encompasses the shared goals and vision of all the towns, villages, and cities. The County also has responsibilities that are different than the city, village or town. Therefore, additional issues were brought up and discussed at the County Planning meetings. 1.2 ISSUES AND OPPORTUNITIES Throughout the planning process at the local and county levels, several common themes were noted that indicated what the citizens of Polk County value and want to see maintained as part of life here, they are:
- high quality surface and groundwater - farming, especially small-scale - small town character in the incorporated areas and rural character in
the unincorporated areas - ensuring that development fits the qualities mentioned above
Since before the arrival of Europeans, the place we now call Polk County has been known for its natural resources. The Anishinabe found everything they needed in the area’s woods and waters, and the original European settlers likewise came here because of abundant natural resources, most notably timber. Today, we are struggling to protect those natural resources, especially water. Groundwater provides the sole source of drinking water for the county; this means that the health of the citizens of the county is directly linked to the quality of the groundwater. There is wide consensus that this is one of the major long-term issues that should be addressed by the County.
Another key issue in the county is the preservation of farmland and agriculture. Since the end of the logging era, farming has been part of the landscape of Polk County. The County has been losing substantial farmland over the past decades, primarily due to development pressures from the Twin Cities metropolitan area. An interesting trend at the time of this plan is that, in contrast to most of the rest of the country, Polk County’s farms are increasing in number and decreasing in size, while national and statewide trends are just the opposite. This could be due to the rising interest in locally produced agricultural products. Or it could be that hobby and horse farms are becoming more prevalent. The vast majority of the local level plans expressed a preference for small-scale, family farming operations. These local plans also indicated a desire that farmland and farming as a way of life in Polk County should be maintained, if not expanded. Polk

Polk County, Wisconsin Issues and Opportunities
Comprehensive Plan 2009-2029 9
County should continue to research the ways in which it can facilitate these things. Possibilities include: evaluating the State of Wisconsin’s Working Lands Initiative, Transfer of Development Rights programs, Purchase of Development Rights programs, Density Bonuses, conservation developments, and voluntary easements. There are already numerous farmers’ markets within the county and several communities have implemented incentives to buy local. The final common issue from the local level plans is retaining the rural and small town character of the County. The rural lifestyle in the towns and the small-town atmosphere in the villages and cities are intangible characteristics of the county that are difficult to quantify. A number of methodologies to reach these goals are out there and have been explored at the local level and county level in this planning process. Tools such as purchase of development rights and transfer of development rights to preserve farmland and design review criteria to preserve small-town character are just a couple examples of ways to achieve the goals set forth in this plan. The high quality of water resources and farming operation are key components to maintaining this character as well. Much of the rest of this plan deals with these issues and explains the background data and discussions that led to the formation of goals. In addition to the issues and opportunities listed above, another major issue remains, that being the aging population of Polk County. The “Baby Boomer” generation will be reaching retirement age within the timeframe of this plan; this means that the services in place for this segment of the population will have increased demand placed on them. This is both an issue and an opportunity. The demographic data contained later in this element details the increase in retirement age population over the next 20 years. While this increased population could strain the current level of services, if planned for properly, it could become an asset that the county benefits from. 1.2.1 POLK COUNTY STRATEGIC PLAN Integration of other key planning documents is an important component of the Comprehensive Plan. One such document is the Polk County Strategic Plan developed in 2007. The goal of the Polk County Comprehensive Plan is to fit within the stated vision, mission, and directional statements outlined below.

Polk County, Wisconsin Issues and Opportunities
Comprehensive Plan 2009-2029 10
Polk County Strategic Plan
Vision Statement “Improve the quality of life for all who live, work, and play in Polk
County.”
Mission Statement “The mission of Polk County Government is to serve and represent
the public with integrity.”
Polk County Slogan: “Polk County-Gift of the Glaciers”
Directional Statements: Foster a Diverse Economic Base Goals:
• Support and enhance Polk County Economic Development Corporation – county wide
• Lobby for state incentives that support area main street businesses • Provide hard-skills training to everyone through trade schools/workforce
development programs Promote Quality Education for All Goals:
• Explore post-secondary campus • Make technology available to everyone • On-going assessment of needs
Design Good land Use Practices That Recognize Distinctions Goals:
• Create opportunity with protections • Balance between public and private interests • Create fair policy to include local input
Preserve and Enhance the Environment Goals:
• Preserve and protect water quality • Identify and implement environmental best management practices
Responsive Transportation System Goals:
• Investigate alternative fuels • Upgrade roads • Develop local transportation options
Polk County, Wisconsin Issues and Opportunities
Comprehensive Plan 2009-2029 11
Each of the elements of the Strategic Plan is addressed at various points throughout the Comprehensive Plan. This should further emphasize the importance of those goals and provide additional detail on background information and desired ways to move forward. 1.2.2 SUSTAINABILITY At the time when most municipalities were putting the finishing touches on their comprehensive plans, questions started surfacing about the possible inclusion of additional language supporting goals related to sustainability: local food production, renewable energy, etc. Concurrently, the West Central Regional Planning Commission (WCWRPC) was facilitating the development of a regional comprehensive plan that was envisioned to include an additional element – beyond the nine required elements – dealing with Energy & Sustainability. Polk County had already experienced a great deal of interest in sustainability issues through a loose-knit network of over a hundred citizens who had studied a book called The Natural Step for Communities and were looking for ways to apply those principals locally. Members of this group collectively drafted a proposed additional Element for Polk County that was modeled on the WCWRPC draft. This was submitted during the 30-day comment period on the County’s draft plan along with a list of 34 supporters, including the County’s Ad Hoc Renewable Energy Committee. The comprehensive plans developed at the local level, as well as the development meetings for the County Plan; produced areas within the elements of the Polk County Comprehensive Plan that already address issues of sustainability. Here are a few examples:
Housing Element: - Allow for conservation subdivisions to preserve open space, farmland,
unique physical features, etc. - Ensure the housing needs of the people of Polk County are met
Transportation Element:
- Park ‘n’ ride facilities, promote alternative transportation options, like trails, rail service, and buses
- Promotion of an alternatively powered fleet vehicles for the county - Encouraging establishment of alternative energy fueling sites
Utilities and Community Facilities Element: - Promotion of alternative/renewable energy sources for utilities

Polk County, Wisconsin Issues and Opportunities
Comprehensive Plan 2009-2029 12
- Encouragement of energy efficiency measures - Promoting the full utilization of existing infrastructure before
expanding
Agricultural, Natural, and Cultural Resources Element: - Conservation of our natural resources - Preservation and enhancement of surface and groundwater quality - Preservation of prime farmland - Support for locally grown and produced agricultural products
Economic Development Element:
- Promotion of local businesses - Promotion of local and organic agriculture - Promotion of “green” business parks and industrial parks
Land Use Element:
- conservation/cluster subdivision provision option to preserve farmland - Support of sustainable practices within the county
Even with these items already in place, the Planning Commission concluded that it would make a stronger statement to add an additional element that expands on many of these objectives and brings them together under a common heading.
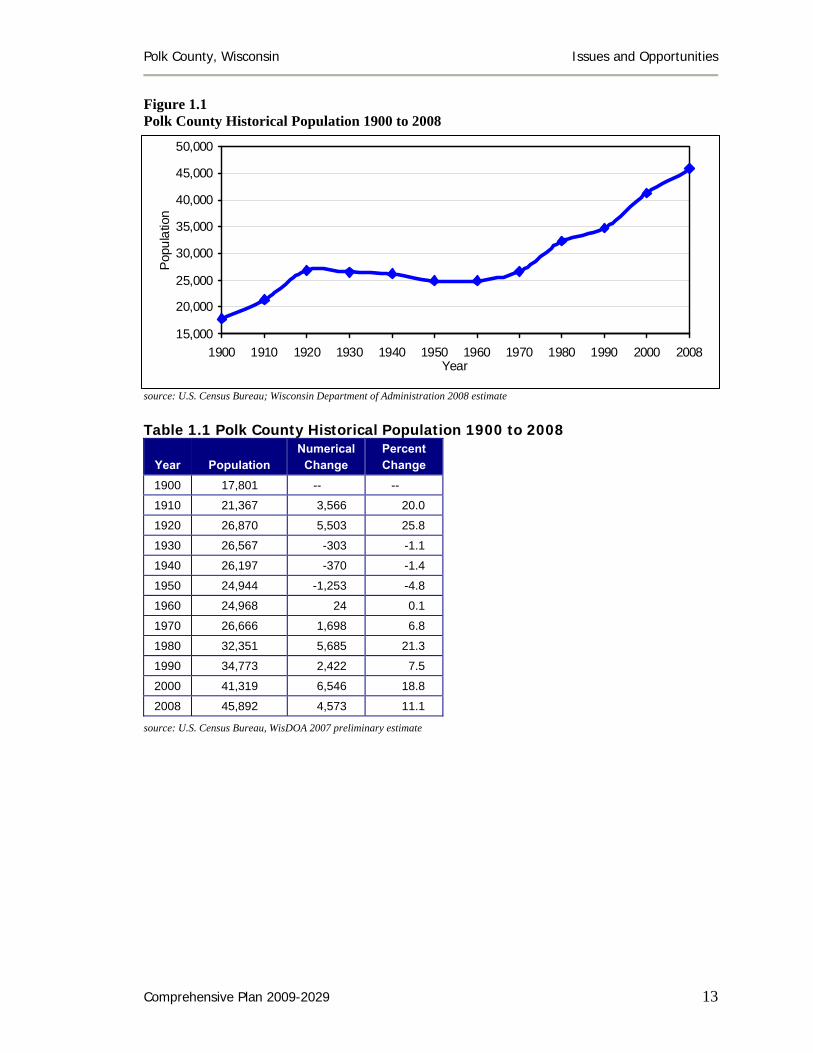
1.3 SOCIO-ECONOMIC PROFILE Population Analyzing population size, growth, density, characteristics and distribution trends reveals important facts about the most important component of growth and development in Polk County ⎯ its residents. Reviewing population characteristics will reveal important indicators of change that must be recognized to effectively prepare for change. After increases for the first two decades of the 20th Century, Polk County’s population has remained fairly steady through 1960. Since 1960, the County’s population has increased significantly, with the county’s highest growth decade in the 1970s (21.3%). The population growth rate declined somewhat in the 1980s (7.5%) only to have the 1990s (18.8%) approach the growth of the 1970s. Recently, between 2000 and 2008, the County’s population increased by 4,573 people, or 11.1 percent. If such a rate of growth were continued throughout the decade it would result in a decennial rate of about 14 percent. See Figure 1.1 below, and Tables 1.1 and 1.2 at the end of this section.
Polk County, Wisconsin Issues and Opportunities
Comprehensive Plan 2009-2029 13
Figure 1.1 Polk County Historical Population 1900 to 2008
source: U.S. Census Bureau; Wisconsin Department of Administration 2008 estimate Table 1.1 Polk County Historical Population 1900 to 2008
Year
Population
Numerical Change
Percent Change
1900 17,801 -- --
1910 21,367 3,566 20.0
1920 26,870 5,503 25.8
1930 26,567 -303 -1.1
1940 26,197 -370 -1.4
1950 24,944 -1,253 -4.8
1960 24,968 24 0.1
1970 26,666 1,698 6.8
1980 32,351 5,685 21.3
1990 34,773 2,422 7.5
2000 41,319 6,546 18.8
2008 45,892 4,573 11.1
source: U.S. Census Bureau, WisDOA 2007 preliminary estimate
15,000
20,000
25,000
30,000
35,000
40,000
45,000
50,000
1900 1910 1920 1930 1940 1950 1960 1970 1980 1990 2000 2008Year
Popu
latio
n
Polk County, Wisconsin Issues and Opportunities
Comprehensive Plan 2009-2029 14
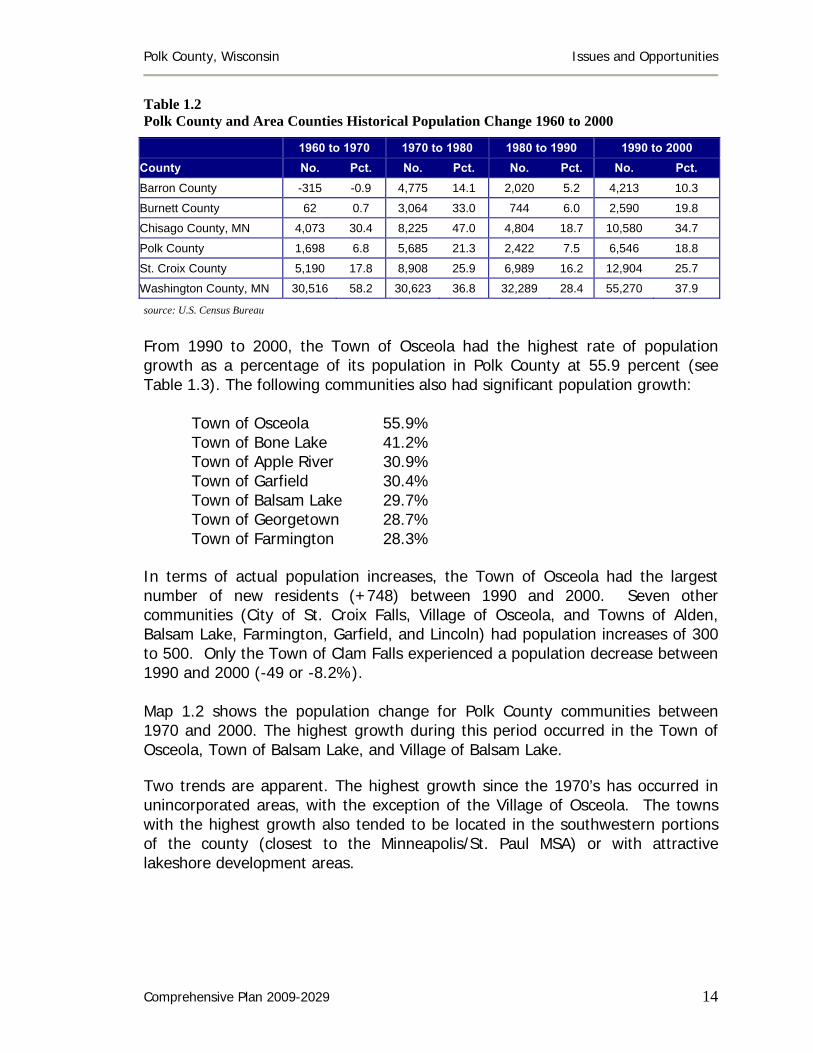
Table 1.2 Polk County and Area Counties Historical Population Change 1960 to 2000
1960 to 1970 1970 to 1980 1980 to 1990 1990 to 2000 County No. Pct. No. Pct. No. Pct. No. Pct. Barron County -315 -0.9 4,775 14.1 2,020 5.2 4,213 10.3
Burnett County 62 0.7 3,064 33.0 744 6.0 2,590 19.8
Chisago County, MN 4,073 30.4 8,225 47.0 4,804 18.7 10,580 34.7
Polk County 1,698 6.8 5,685 21.3 2,422 7.5 6,546 18.8
St. Croix County 5,190 17.8 8,908 25.9 6,989 16.2 12,904 25.7
Washington County, MN 30,516 58.2 30,623 36.8 32,289 28.4 55,270 37.9
source: U.S. Census Bureau
From 1990 to 2000, the Town of Osceola had the highest rate of population growth as a percentage of its population in Polk County at 55.9 percent (see Table 1.3). The following communities also had significant population growth:
Town of Osceola 55.9% Town of Bone Lake 41.2% Town of Apple River 30.9% Town of Garfield 30.4% Town of Balsam Lake 29.7% Town of Georgetown 28.7% Town of Farmington 28.3%
In terms of actual population increases, the Town of Osceola had the largest number of new residents (+748) between 1990 and 2000. Seven other communities (City of St. Croix Falls, Village of Osceola, and Towns of Alden, Balsam Lake, Farmington, Garfield, and Lincoln) had population increases of 300 to 500. Only the Town of Clam Falls experienced a population decrease between 1990 and 2000 (-49 or -8.2%). Map 1.2 shows the population change for Polk County communities between 1970 and 2000. The highest growth during this period occurred in the Town of Osceola, Town of Balsam Lake, and Village of Balsam Lake. Two trends are apparent. The highest growth since the 1970’s has occurred in unincorporated areas, with the exception of the Village of Osceola. The towns with the highest growth also tended to be located in the southwestern portions of the county (closest to the Minneapolis/St. Paul MSA) or with attractive lakeshore development areas.

Polk County, Wisconsin Issues and Opportunities
Comprehensive Plan 2009-2029 15
1970 1980 1990 2000 2008 '70-'80 '80-'90 '90-'00 '00-'08TownsAlden 1,406 1,862 2,133 2,615 2,927 32.4% 14.6% 22.6% 11.9%Apple River 544 819 815 1,067 1,182 50.6% -0.5% 30.9% 10.8%Balsam Lake 631 960 1,067 1,384 1,464 52.1% 11.1% 29.7% 5.8%Beaver 641 755 663 753 853 17.8% -12.2% 13.6% 13.3%Black Brook 775 949 964 1,208 1,416 22.5% 1.6% 25.3% 17.2%Bone Lake 416 466 503 710 807 12.0% 7.9% 41.2% 13.7%Clam Falls 522 614 596 547 593 17.6% -2.9% -8.2% 8.4%Clayton 713 789 780 912 1,048 10.7% -1.1% 16.9% 14.9%Clear Lake 793 777 744 800 887 -2.0% -4.2% 7.5% 10.9%Eureka 1,043 1,135 1,201 1,338 1,605 8.8% 5.8% 11.4% 20.0%Farmington 1,156 1,195 1,267 1,625 1,902 3.4% 6.0% 28.3% 17.0%Garfield 768 1,010 1,107 1,443 1,678 31.5% 9.6% 30.4% 16.3%Georgetown 526 746 780 1,004 1,103 41.8% 4.6% 28.7% 9.9%Johnstown 328 401 410 520 590 22.3% 2.2% 26.8% 13.5%Laketown 725 909 921 918 972 25.4% 1.3% -0.3% 5.9%Lincoln 1,198 1,683 1,835 2,304 2,483 40.5% 9.0% 25.6% 7.8%Lorain 275 280 299 328 332 1.8% 6.8% 9.7% 1.2%Luck 663 863 880 881 864 30.2% 2.0% 0.1% -1.9%McKinley 297 337 327 328 358 13.5% -3.0% 0.3% 9.1%Milltown 691 943 949 1,146 1,270 36.5% 0.6% 20.8% 10.8%Osceola 769 1,066 1,337 2,085 2,793 38.6% 25.4% 55.9% 34.0%St Croix Falls 783 873 1,034 1,119 1,256 11.5% 18.4% 8.2% 12.2%Sterling 379 497 591 724 780 31.1% 18.9% 22.5% 7.7%West Sweden 691 718 682 731 758 3.9% -5.0% 7.2% 3.7%
sub-total 16,733 20,647 21,885 26,490 29,921 23.4% 6.0% 21.0% 13.0%VillagesBalsam Lake 648 749 792 950 1,075 15.6% 5.7% 19.9% 13.2%Centuria 632 711 790 865 939 12.5% 11.1% 9.5% 8.6%Clayton 306 425 450 507 572 38.9% 5.9% 12.7% 12.8%Clear Lake 721 899 932 1,051 1,143 24.7% 3.7% 12.8% 8.8%Dresser 533 670 614 732 875 25.7% -8.4% 19.2% 19.5%Frederic 908 1,039 1,124 1,262 1,239 14.4% 8.2% 12.3% -1.8%Luck 848 997 1,022 1,210 1,226 - - - 1.3%Milltown 634 732 786 888 914 15.5% 7.4% 13.0% 2.9%Osceola 1,152 1,581 2,075 2,421 2,732 37.2% 31.2% 16.7% 12.8%Turtle Lake* 0 0 6 65 153 0.0% 0.0% 983.3% 135.4%
sub-total 6,382 7,803 8,591 9,951 10,868 22.3% 10.1% 15.8% 9.2%CitiesAmery 2,126 2,404 2,657 2,845 2,919 13.1% 10.5% 7.1% 2.6%St. Croix Falls 1,425 1,497 1,640 2,033 2,184 5.1% 9.6% 24.0% 7.4%
sub-total 3,551 3,901 4,297 4,878 5,103 9.9% 10.2% 13.5% 4.6%Total 26,666 32,351 34,773 41,319 45,892 21.3% 7.5% 18.8% 11.1%
Year Percent Change
Table 1.3 Polk County Historical Population and Population Change, 1970 to 2008, by MCD
source: U.S. Census Bureau; 2008 Wisconsin Department of Administration Estimate
Polk County, Wisconsin Issues and Opportunities
Comprehensive Plan 2009-2029 16
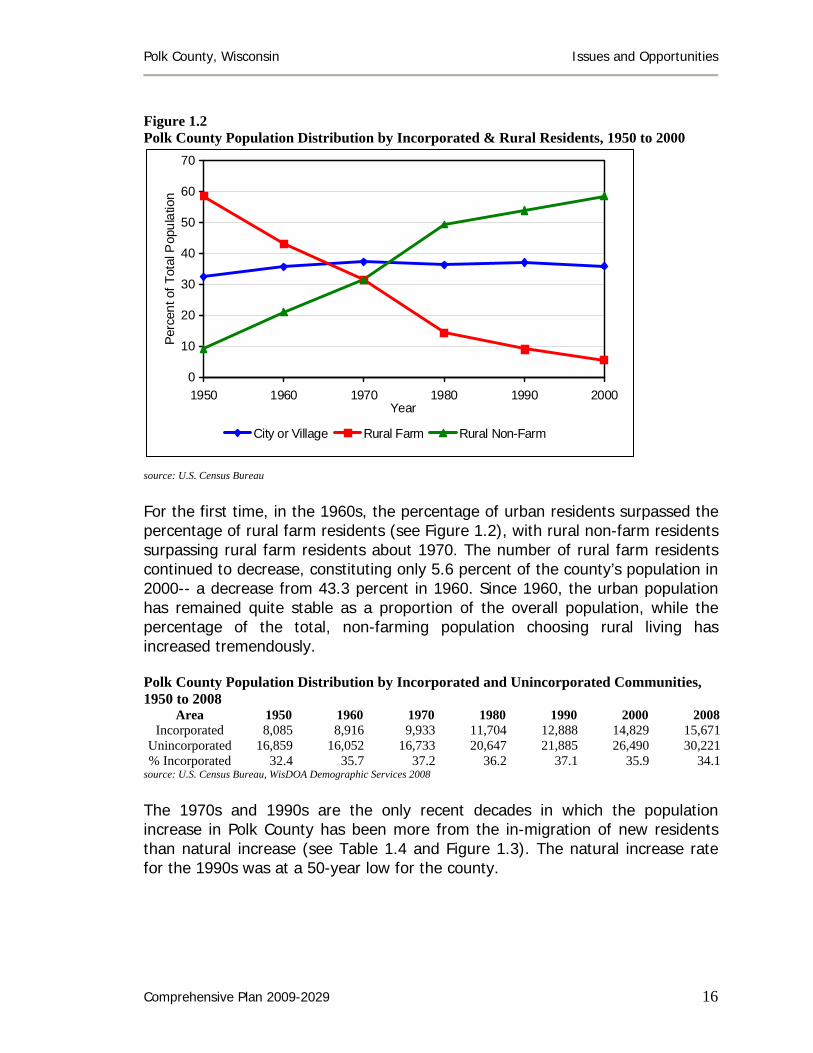
Figure 1.2 Polk County Population Distribution by Incorporated & Rural Residents, 1950 to 2000
source: U.S. Census Bureau
For the first time, in the 1960s, the percentage of urban residents surpassed the percentage of rural farm residents (see Figure 1.2), with rural non-farm residents surpassing rural farm residents about 1970. The number of rural farm residents continued to decrease, constituting only 5.6 percent of the county’s population in 2000-- a decrease from 43.3 percent in 1960. Since 1960, the urban population has remained quite stable as a proportion of the overall population, while the percentage of the total, non-farming population choosing rural living has increased tremendously. Polk County Population Distribution by Incorporated and Unincorporated Communities, 1950 to 2008
Area 1950 1960 1970 1980 1990 2000 2008 Incorporated 8,085 8,916 9,933 11,704 12,888 14,829 15,671
Unincorporated 16,859 16,052 16,733 20,647 21,885 26,490 30,221 % Incorporated 32.4 35.7 37.2 36.2 37.1 35.9 34.1
source: U.S. Census Bureau, WisDOA Demographic Services 2008
The 1970s and 1990s are the only recent decades in which the population increase in Polk County has been more from the in-migration of new residents than natural increase (see Table 1.4 and Figure 1.3). The natural increase rate for the 1990s was at a 50-year low for the county.
0
10
20
30
40
50
60
70
1950 1960 1970 1980 1990 2000Year
Perc
ent o
f Tot
al P
opul
atio
n
City or Village Rural Farm Rural Non-Farm

Polk County, Wisconsin Issues and Opportunities
Comprehensive Plan 2009-2029 17
Figure 1.3 Polk County Components of Population Change 1950 to 2000
Source: U.S. Census Bureau Table 1.4 Polk County Components of Population Change 1950 to 2000
1950 to 1960
1960 to 1970
1970 to 1980
1980 to 1990
1990 to 2000
Births 5,382 4,603 4,481 5,150 4,565
Deaths 2,519 2,739 3,183 3,424 3,782
Total Natural Increase 2,863 1,864 1,298 1,726 783
Natural Increase Rate 11.5% 7.0% 4.0% 5.0% 1.9%
Net Migration -2,839 -166 4,387 696 5,763
Net Migration Rate -11.4% -0.6% 13.6% 2.0% 13.9%
Total Population Change 24 1,698 5,685 2,422 6,546
Percent Population Change 0.1% 6.8% 21.3% 7.5% 18.8% *NOTE: Calculated as a percent of the County’s total population. Source: U.S. Census Bureau; Wisconsin Department of Health and Family Services The average age of Polk County residents increased 7.3 years between 1980 to 2000 to 38.7 years (see Table 1.5). Population increased in every age group except 0-4, 20-24, and 25-34 between 1980 and 2000 (see Table 1.5 and Table 1.6). The middle-age groups (35-60) increased substantially during this timeframe, with a very large population increase of over 100 percent in the 35-44 and 45-54 age groups.
-4,000
-2,000
0
2,000
4,000
6,000
8,000
1950-60 1960-70 1970-80 1980-90 1990-00
Year
Peop
le
Natural Increase Net Migration

Polk County, Wisconsin Issues and Opportunities
Comprehensive Plan 2009-2029 18
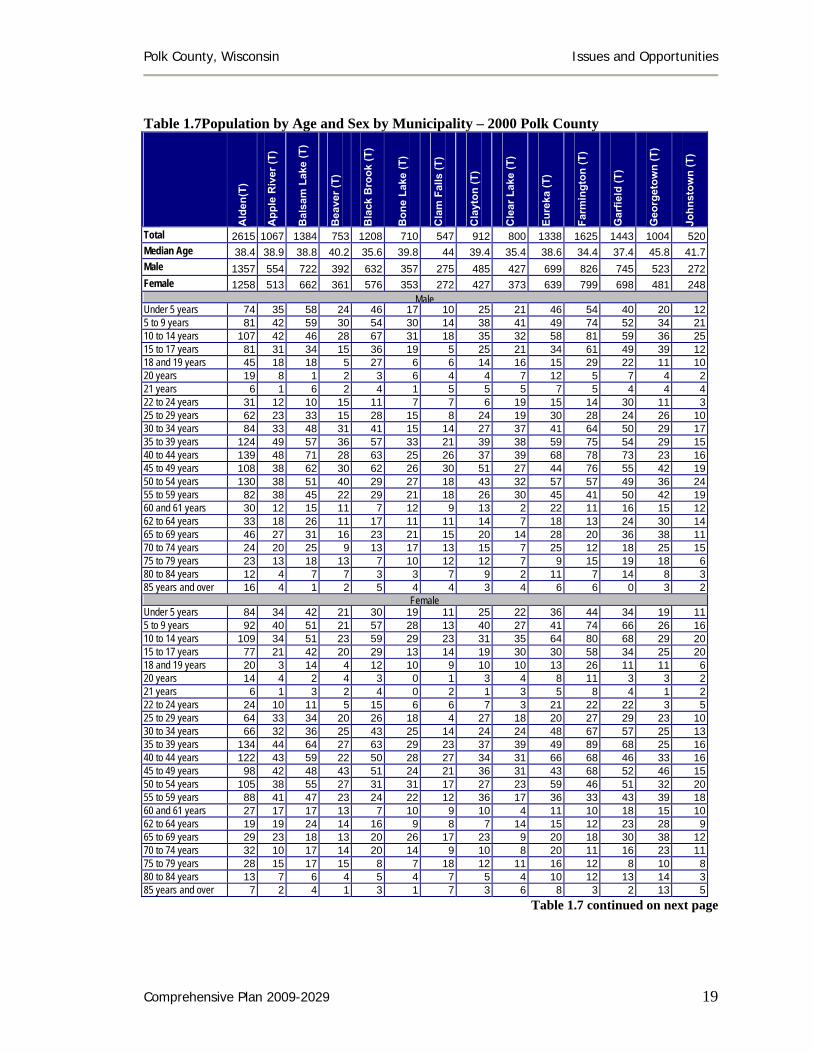
The 1990 and 2000 age-by-sex breakdowns and percentage change for each municipality in Polk County are included in Tables 1.7, 1.8, and 1.9. Table 1.5 Polk County Historical Population by Age and Sex 1980 and 2000
source: U.S. Census Bureau Table 1.6 Polk County Change in Age-Sex Structure 1980 to 2000
1980 to 2000 TotalAge Male Female # Change Pct Change
0-4 -40 -79 -100 -4.05-9 72 -50 317 12.0
10-14 325 -17 689 26.515-19 140 -181 173 5.820-24 -204 -106 -501 -21.925-34 -64 -113 -138 -2.935-44 1,715 -48 3,418 101.245-54 1,658 -205 3,028 103.755-64 520 -23 874 27.265-74 88 129 205 7.175+ 287 712 1,003 47.0
source: U.S. Census Bureau
Male Female TotalAge 1980 2000 1980 2000 1980 20000-4 1,293 1,253 1,234 1,174 2,527 2,4275-9 1,434 1,506 1,211 1,456 2,645 2,962
10-14 1,330 1,655 1,274 1,638 2,604 3,29315-19 1,523 1,663 1,449 1,482 2,972 3,14520-24 1,151 947 1,138 841 2,289 1,78825-34 2,437 2,373 2,334 2,260 4,771 4,63335-44 1,706 3,421 1,670 3,373 3,376 6,79445-54 1,418 3,076 1,501 2,871 2,919 5,94755-64 1,533 2,053 1,676 2,030 3,209 4,08365-74 1,403 1,491 1,503 1,620 2,906 3,11175+ 925 1,212 1,208 1,924 2,133 3,136
Median Age 31.4 38.7
Polk County, Wisconsin Issues and Opportunities
Comprehensive Plan 2009-2029 19
Table 1.7Population by Age and Sex by Municipality – 2000 Polk County
Ald
en(T
)
App
le R
iver
(T)
Bal
sam
Lak
e (T
)
Bea
ver (
T)
Bla
ck B
rook
(T)
Bon
e La
ke (T
)
Cla
m F
alls
(T)
Cla
yton
(T)
Cle
ar L
ake
(T)
Eure
ka (T
)
Farm
ingt
on (T
)
Gar
field
(T)
Geo
rget
own
(T)
John
stow
n (T
)
Total 2615 1067 1384 753 1208 710 547 912 800 1338 1625 1443 1004 520Median Age 38.4 38.9 38.8 40.2 35.6 39.8 44 39.4 35.4 38.6 34.4 37.4 45.8 41.7Male 1357 554 722 392 632 357 275 485 427 699 826 745 523 272Female 1258 513 662 361 576 353 272 427 373 639 799 698 481 248
Male Under 5 years 74 35 58 24 46 17 10 25 21 46 54 40 20 125 to 9 years 81 42 59 30 54 30 14 38 41 49 74 52 34 2110 to 14 years 107 42 46 28 67 31 18 35 32 58 81 59 36 2515 to 17 years 81 31 34 15 36 19 5 25 21 34 61 49 39 1218 and 19 years 45 18 18 5 27 6 6 14 16 15 29 22 11 1020 years 19 8 1 2 3 6 4 4 7 12 5 7 4 221 years 6 1 6 2 4 1 5 5 5 7 5 4 4 422 to 24 years 31 12 10 15 11 7 7 6 19 15 14 30 11 325 to 29 years 62 23 33 15 28 15 8 24 19 30 28 24 26 1030 to 34 years 84 33 48 31 41 15 14 27 37 41 64 50 29 1735 to 39 years 124 49 57 36 57 33 21 39 38 59 75 54 29 1540 to 44 years 139 48 71 28 63 25 26 37 39 68 78 73 23 1645 to 49 years 108 38 62 30 62 26 30 51 27 44 76 55 42 1950 to 54 years 130 38 51 40 29 27 18 43 32 57 57 49 36 2455 to 59 years 82 38 45 22 29 21 18 26 30 45 41 50 42 1960 and 61 years 30 12 15 11 7 12 9 13 2 22 11 16 15 1262 to 64 years 33 18 26 11 17 11 11 14 7 18 13 24 30 1465 to 69 years 46 27 31 16 23 21 15 20 14 28 20 36 38 1170 to 74 years 24 20 25 9 13 17 13 15 7 25 12 18 25 1575 to 79 years 23 13 18 13 7 10 12 12 7 9 15 19 18 680 to 84 years 12 4 7 7 3 3 7 9 2 11 7 14 8 385 years and over 16 4 1 2 5 4 4 3 4 6 6 0 3 2
Female Under 5 years 84 34 42 21 30 19 11 25 22 36 44 34 19 115 to 9 years 92 40 51 21 57 28 13 40 27 41 74 66 26 1610 to 14 years 109 34 51 23 59 29 23 31 35 64 80 68 29 2015 to 17 years 77 21 42 20 29 13 14 19 30 30 58 34 25 2018 and 19 years 20 3 14 4 12 10 9 10 10 13 26 11 11 620 years 14 4 2 4 3 0 1 3 4 8 11 3 3 221 years 6 1 3 2 4 0 2 1 3 5 8 4 1 222 to 24 years 24 10 11 5 15 6 6 7 3 21 22 22 3 525 to 29 years 64 33 34 20 26 18 4 27 18 20 27 29 23 1030 to 34 years 66 32 36 25 43 25 14 24 24 48 67 57 25 1335 to 39 years 134 44 64 27 63 29 23 37 39 49 89 68 25 1640 to 44 years 122 43 59 22 50 28 27 34 31 66 68 46 33 1645 to 49 years 98 42 48 43 51 24 21 36 31 43 68 52 46 1550 to 54 years 105 38 55 27 31 31 17 27 23 59 46 51 32 2055 to 59 years 88 41 47 23 24 22 12 36 17 36 33 43 39 1860 and 61 years 27 17 17 13 7 10 9 10 4 11 10 18 15 1062 to 64 years 19 19 24 14 16 9 8 7 14 15 12 23 28 965 to 69 years 29 23 18 13 20 26 17 23 9 20 18 30 38 1270 to 74 years 32 10 17 14 20 14 9 10 8 20 11 16 23 1175 to 79 years 28 15 17 15 8 7 18 12 11 16 12 8 10 880 to 84 years 13 7 6 4 5 4 7 5 4 10 12 13 14 385 years and over 7 2 4 1 3 1 7 3 6 8 3 2 13 5
Table 1.7 continued on next page

Polk County, Wisconsin Issues and Opportunities
Comprehensive Plan 2009-2029 20
Table 1.7 continued Population by Age and Sex by Municipality – 2000 Polk County
Lake
tow
n (T
)
Linc
oln
(T)
Lora
n (T
)
Luck
(T)
McK
inle
y (T
)
Mill
tow
n (T
)
Osc
eola
(T)
St. C
roix
Fal
ls (T
)
Ster
ling
(T)
Wes
t Sw
eden
(T)
Bal
sam
Lak
e (V
)
Cen
turia
(V)
Cla
yton
(V)
Total 918 2304 328 881 328 1146 2085 1119 724 731 950 865 507Median Age 40.9 40.3 38.4 39.8 44 40.4 35.5 39.2 37.2 41.1 45.5 34.6 30.1Male 456 1169 171 464 182 600 1074 600 380 369 488 416 245Female 462 1135 157 417 146 546 1011 519 344 362 462 449 262
Male Under 5 years 20 61 7 28 9 31 80 33 18 14 24 29 225 to 9 years 29 77 11 36 17 50 89 37 26 25 20 39 2210 to 14 years 40 101 19 38 10 48 97 61 31 39 27 23 2015 to 17 years 23 64 11 27 13 27 67 33 21 17 20 24 1318 and 19 years 10 32 5 12 4 20 32 20 7 14 7 16 720 years 5 10 1 6 0 4 12 8 1 2 9 7 221 years 0 12 1 3 2 1 5 4 1 5 13 6 622 to 24 years 10 19 7 15 3 12 19 10 12 6 14 9 825 to 29 years 27 53 9 18 8 23 46 30 19 11 29 34 2230 to 34 years 16 62 9 12 9 34 89 34 30 19 37 31 2035 to 39 years 30 75 10 39 5 47 111 40 33 24 36 35 2340 to 44 years 50 122 12 43 17 46 98 60 44 33 26 21 2245 to 49 years 41 96 13 50 20 56 95 61 32 44 39 37 1650 to 54 years 43 76 10 34 17 56 74 41 27 25 33 24 1055 to 59 years 31 76 10 30 11 35 45 24 17 16 24 16 960 and 61 years 5 29 2 7 4 12 13 14 11 11 8 5 062 to 64 years 20 47 9 9 5 20 20 16 11 10 17 7 665 to 69 years 15 60 4 21 9 21 33 14 19 11 27 12 670 to 74 years 13 49 8 12 11 26 25 28 9 17 28 10 475 to 79 years 15 30 5 15 7 19 16 16 4 21 24 11 480 to 84 years 8 10 7 5 1 7 6 10 5 4 10 10 285 years and over 5 8 1 4 0 5 2 6 2 1 16 10 1
Female Under 5 years 25 50 7 32 7 27 83 35 22 24 26 30 215 to 9 years 30 72 12 25 9 38 98 25 34 22 24 31 2010 to 14 years 37 98 16 31 6 49 80 40 34 26 19 40 3015 to 17 years 31 73 13 27 8 31 38 32 16 24 13 25 1418 and 19 years 11 29 5 7 2 14 17 9 8 11 7 5 420 years 1 13 0 3 2 1 6 2 1 1 4 5 521 years 2 10 0 3 1 2 8 6 1 1 10 9 422 to 24 years 13 18 3 10 2 9 15 16 13 4 10 10 1325 to 29 years 16 47 4 13 8 23 58 23 19 13 15 39 2430 to 34 years 30 68 8 19 3 34 86 30 19 17 19 27 1735 to 39 years 37 94 15 39 10 40 115 53 38 33 24 33 2140 to 44 years 33 92 13 37 19 48 99 56 28 38 34 40 1845 to 49 years 58 109 10 32 11 52 87 47 20 32 31 31 1150 to 54 years 35 75 9 38 15 42 57 30 14 20 38 17 1055 to 59 years 24 70 11 23 6 36 41 33 30 16 30 17 660 and 61 years 7 32 3 10 5 7 11 7 3 6 9 3 362 to 64 years 9 35 3 15 7 20 21 12 8 12 19 9 965 to 69 years 22 61 5 20 10 25 32 19 12 19 26 21 870 to 74 years 12 31 12 13 9 22 29 18 6 22 27 19 875 to 79 years 16 30 6 9 3 13 14 11 11 11 37 7 780 to 84 years 6 14 1 4 2 6 10 7 4 3 18 12 585 years and over 7 14 1 7 1 7 6 8 3 7 22 19 4
Table 1.7 continued on next page

Polk County, Wisconsin Issues and Opportunities
Comprehensive Plan 2009-2029 21
Table 1.7 continued Population by Age and Sex by Municipality – 2000 Polk County
Cle
ar L
ake
(V)
Dre
sser
(V)
Fred
eric
(V)
Luck
(V)
Mill
tow
n (V
)
Osc
eola
(V)
Turt
le L
ake
(V)*
Am
ery
(C)
St. C
roix
Fal
ls (C
)
Polk
Cou
nty
Total 1051 732 1262 1210 888 2421 65 2845 2033 41319 Median Age 38.3 35.1 43.6 40 39.9 32.8 21.5 44.6 40.7 38.7 Male 500 360 557 556 408 1163 31 1241 954 20650 Female 551 372 705 654 480 1258 34 1604 1079 20669
Male Under 5 years 35 27 39 26 21 96 3 84 64 1253 5 to 9 years 34 34 32 55 23 88 3 75 65 1506 10 to 14 years 34 19 53 47 23 104 1 86 69 1655 15 to 17 years 25 10 32 19 23 57 4 65 50 1107 18 and 19 years 15 2 9 10 10 33 4 23 22 556 20 years 7 5 9 4 5 16 0 11 7 215 21 years 5 2 8 5 1 13 1 11 13 177 22 to 24 years 14 20 17 23 16 55 1 43 31 555 25 to 29 years 28 35 34 31 28 90 2 85 52 1059 30 to 34 years 32 31 28 37 27 96 2 70 58 1314 35 to 39 years 45 30 44 47 34 95 0 80 66 1635 40 to 44 years 39 30 30 43 31 121 2 77 85 1786 45 to 49 years 38 15 40 35 32 76 1 77 84 1668 50 to 54 years 23 28 26 28 25 50 2 67 58 1408 55 to 59 years 19 15 14 19 6 34 0 66 49 1074 60 and 61 years 5 5 8 9 8 15 0 29 17 404 62 to 64 years 7 11 11 14 10 16 0 39 23 575 65 to 69 years 20 13 28 17 23 27 0 47 24 797 70 to 74 years 22 9 18 28 21 20 1 61 36 694 75 to 79 years 22 9 27 15 21 27 1 69 30 590 80 to 84 years 14 4 23 23 13 15 3 44 26 347 85 years and over 17 6 27 21 7 19 0 32 25 275
Female Under 5 years 23 24 30 25 30 85 5 76 55 1174 5 to 9 years 40 30 28 37 40 85 2 93 69 1456 10 to 14 years 38 34 50 62 22 104 4 89 74 1638 15 to 17 years 28 12 26 23 18 57 2 61 42 1046 18 and 19 years 19 10 12 16 7 34 4 29 17 436 20 years 5 3 1 3 7 16 0 13 4 158 21 years 6 3 7 6 6 9 0 6 10 152 22 to 24 years 18 12 17 17 15 62 1 56 37 531 25 to 29 years 31 26 29 27 26 100 3 77 50 1024 30 to 34 years 24 26 29 33 31 91 0 70 56 1236 35 to 39 years 32 29 36 53 32 115 4 87 75 1722 40 to 44 years 45 28 52 49 33 88 0 68 88 1651 45 to 49 years 34 22 40 43 28 79 2 101 69 1567 50 to 54 years 27 22 29 29 21 53 1 91 69 1304 55 to 59 years 21 23 26 13 15 50 0 69 43 1082 60 and 61 years 11 10 6 9 12 16 0 34 13 395 62 to 64 years 12 11 13 16 13 15 0 51 26 553 65 to 69 years 25 8 31 23 23 35 1 70 52 844 70 to 74 years 27 14 45 29 35 44 2 89 48 776 75 to 79 years 29 7 57 41 32 38 2 109 49 724 80 to 84 years 28 6 72 42 20 35 0 102 58 562 85 years and over 28 12 69 58 14 47 1 163 75 638 source: U.S. Census, 2000 *Portion of Turtle Lake located in Polk County only

Polk County, Wisconsin Issues and Opportunities
Comprehensive Plan 2009-2029 22
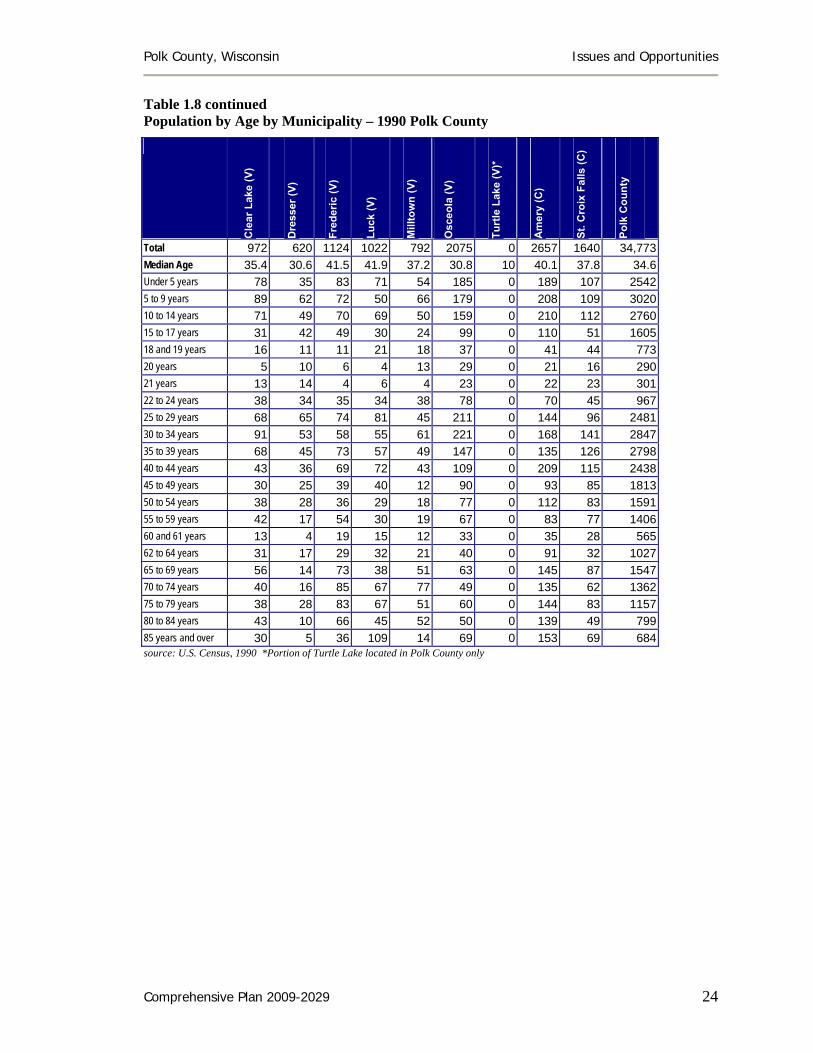
Table 1.8 Population by Age by Municipality – 1990 Polk County
Total 2133 824 1088 654 964 516 609 796 728 1201 1267 1107 765 425Median Age 34.6 36.4 35.4 34.2 33.1 36.6 36.1 33.2 31.2 33.9 30.4 35.6 42.2 35.9Under 5 years 169 50 74 40 79 25 51 54 55 78 102 74 33 325 to 9 years 195 71 107 56 99 26 35 88 77 122 148 83 76 3410 to 14 years 190 63 90 60 66 54 56 62 52 83 118 109 45 3115 to 17 years 112 44 56 32 58 32 37 38 34 52 74 50 32 1718 and 19 years 63 16 6 22 25 17 9 20 18 46 32 17 21 1320 years 23 9 7 6 6 4 2 11 6 9 10 12 5 421 years 18 10 9 0 9 5 4 3 3 13 12 6 4 422 to 24 years 60 20 24 18 21 14 16 28 26 43 40 21 9 825 to 29 years 159 48 77 56 73 36 48 68 65 89 98 66 32 2530 to 34 years 180 61 118 42 71 33 54 76 63 88 116 103 44 4435 to 39 years 193 78 81 56 106 46 51 51 56 99 136 119 55 3440 to 44 years 184 74 94 55 53 44 40 67 51 90 87 82 47 4245 to 49 years 161 43 81 29 65 29 6 55 41 77 69 53 38 2150 to 54 years 101 58 58 37 44 19 33 22 39 65 39 61 55 1255 to 59 years 78 56 38 16 51 26 18 40 28 53 39 52 35 2360 and 61 years 19 11 11 16 9 9 8 19 3 31 13 25 33 562 to 64 years 46 19 35 23 38 16 20 16 25 32 18 31 41 2565 to 69 years 67 35 53 43 28 32 40 26 19 42 40 37 40 2070 to 74 years 57 26 40 18 23 20 40 24 36 23 36 61 58 1375 to 79 years 36 20 11 9 24 18 27 18 11 36 30 25 45 680 to 84 years 13 8 12 12 12 5 8 9 14 17 7 13 15 885 years and over 9 4 6 8 4 6 6 1 6 13 3 7 2 4
Table 1.8 continued on next page
Ald
en(T
)
App
le R
iver
(T)
Bal
sam
Lak
e (T
)
Bea
ver (
T)
Bla
ck B
rook
(T)
Bon
e La
ke (T
)
Cla
m F
alls
(T)
Cla
yton
(T)
Cle
ar L
ake
(T)
Eure
ka (T
)
Farm
ingt
on (T
)
Gar
field
(T)
Geo
rget
own
(T)
John
stow
n (T
)

Polk County, Wisconsin Issues and Opportunities
Comprehensive Plan 2009-2029 23
Table 1.8 continued Population by Age by Municipality – 1990 Polk County
Lake
tow
n (T
)
Linc
oln
(T)
Lora
n (T
)
Luck
(T)
McK
inle
y (T
)
Mill
tow
n (T
)
Osc
eola
(T)
St. C
roix
Fal
ls (T
)
Ster
ling
(T)
Wes
t Sw
eden
(T)
Bal
sam
Lak
e (V
)
Cen
turia
(V)
Cla
yton
(V)
Total 921 1835 315 868 298 943 1337 1034 603 669 771 784 416Median Age 34.3 33.3 33 35 35.8 35.5 33.1 33.1 31.4 35.9 41.3 33.1 29.6Under 5 years 64 136 40 65 16 82 97 72 59 44 51 68 305 to 9 years 88 171 38 70 27 84 109 104 68 82 15 77 3510 to 14 years 103 173 9 88 26 69 116 83 41 50 46 57 3015 to 17 years 40 83 6 38 24 53 52 61 29 18 32 29 3618 and 19 years 25 45 3 16 7 24 49 17 10 13 20 14 620 years 7 12 6 4 0 6 11 7 5 0 6 4 421 years 5 21 5 8 6 9 15 6 2 2 5 7 122 to 24 years 8 54 6 16 3 20 33 18 14 6 37 19 1325 to 29 years 56 119 15 39 8 50 120 84 64 19 54 81 4830 to 34 years 75 155 41 69 26 67 113 106 76 71 35 44 2835 to 39 years 109 137 20 68 30 80 138 104 25 67 37 81 4140 to 44 years 53 132 13 55 20 91 112 64 40 44 45 50 1345 to 49 years 62 126 15 69 13 60 86 52 37 43 29 24 1550 to 54 years 37 123 3 46 30 40 64 60 20 35 35 22 1255 to 59 years 24 87 12 52 15 51 55 40 18 33 34 35 860 and 61 years 11 34 10 17 2 16 22 13 4 9 29 14 1362 to 64 years 31 50 22 27 9 40 26 36 13 35 26 19 1565 to 69 years 51 82 24 36 13 59 55 34 26 31 51 14 2270 to 74 years 30 26 9 29 8 20 25 31 26 17 60 48 2775 to 79 years 28 32 2 37 6 8 15 30 12 29 53 24 1180 to 84 years 12 22 8 12 7 11 20 11 12 9 44 20 485 years and over 2 15 8 7 2 3 4 1 2 12 27 33 4
Table 1.8 continued on next page
Polk County, Wisconsin Issues and Opportunities
Comprehensive Plan 2009-2029 24
Table 1.8 continued Population by Age by Municipality – 1990 Polk County
Cle
ar L
ake
(V)
Dre
sser
(V)
Fred
eric
(V)
Luck
(V)
Mill
tow
n (V
)
Osc
eola
(V)
Turt
le L
ake
(V)*
Am
ery
(C)
St. C
roix
Fal
ls (C
)
Polk
Cou
nty
Total 972 620 1124 1022 792 2075 0 2657 1640 34,773Median Age 35.4 30.6 41.5 41.9 37.2 30.8 10 40.1 37.8 34.6Under 5 years 78 35 83 71 54 185 0 189 107 25425 to 9 years 89 62 72 50 66 179 0 208 109 302010 to 14 years 71 49 70 69 50 159 0 210 112 276015 to 17 years 31 42 49 30 24 99 0 110 51 160518 and 19 years 16 11 11 21 18 37 0 41 44 77320 years 5 10 6 4 13 29 0 21 16 29021 years 13 14 4 6 4 23 0 22 23 30122 to 24 years 38 34 35 34 38 78 0 70 45 96725 to 29 years 68 65 74 81 45 211 0 144 96 248130 to 34 years 91 53 58 55 61 221 0 168 141 284735 to 39 years 68 45 73 57 49 147 0 135 126 279840 to 44 years 43 36 69 72 43 109 0 209 115 243845 to 49 years 30 25 39 40 12 90 0 93 85 181350 to 54 years 38 28 36 29 18 77 0 112 83 159155 to 59 years 42 17 54 30 19 67 0 83 77 140660 and 61 years 13 4 19 15 12 33 0 35 28 56562 to 64 years 31 17 29 32 21 40 0 91 32 102765 to 69 years 56 14 73 38 51 63 0 145 87 154770 to 74 years 40 16 85 67 77 49 0 135 62 136275 to 79 years 38 28 83 67 51 60 0 144 83 115780 to 84 years 43 10 66 45 52 50 0 139 49 79985 years and over 30 5 36 109 14 69 0 153 69 684source: U.S. Census, 1990 *Portion of Turtle Lake located in Polk County only
Polk County, Wisconsin Issues and Opportunities
Comprehensive Plan 2009-2029 25
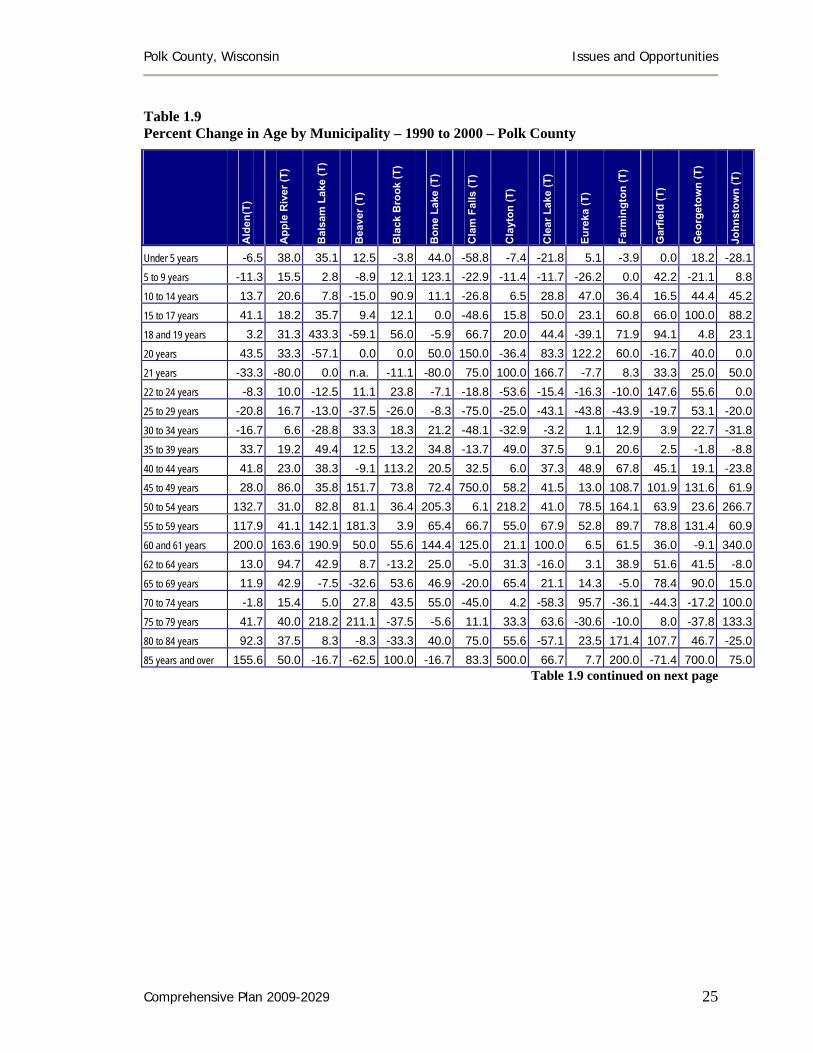
Table 1.9 Percent Change in Age by Municipality – 1990 to 2000 – Polk County
Under 5 years -6.5 38.0 35.1 12.5 -3.8 44.0 -58.8 -7.4 -21.8 5.1 -3.9 0.0 18.2 -28.15 to 9 years -11.3 15.5 2.8 -8.9 12.1 123.1 -22.9 -11.4 -11.7 -26.2 0.0 42.2 -21.1 8.810 to 14 years 13.7 20.6 7.8 -15.0 90.9 11.1 -26.8 6.5 28.8 47.0 36.4 16.5 44.4 45.215 to 17 years 41.1 18.2 35.7 9.4 12.1 0.0 -48.6 15.8 50.0 23.1 60.8 66.0 100.0 88.218 and 19 years 3.2 31.3 433.3 -59.1 56.0 -5.9 66.7 20.0 44.4 -39.1 71.9 94.1 4.8 23.120 years 43.5 33.3 -57.1 0.0 0.0 50.0 150.0 -36.4 83.3 122.2 60.0 -16.7 40.0 0.021 years -33.3 -80.0 0.0 n.a. -11.1 -80.0 75.0 100.0 166.7 -7.7 8.3 33.3 25.0 50.022 to 24 years -8.3 10.0 -12.5 11.1 23.8 -7.1 -18.8 -53.6 -15.4 -16.3 -10.0 147.6 55.6 0.025 to 29 years -20.8 16.7 -13.0 -37.5 -26.0 -8.3 -75.0 -25.0 -43.1 -43.8 -43.9 -19.7 53.1 -20.030 to 34 years -16.7 6.6 -28.8 33.3 18.3 21.2 -48.1 -32.9 -3.2 1.1 12.9 3.9 22.7 -31.835 to 39 years 33.7 19.2 49.4 12.5 13.2 34.8 -13.7 49.0 37.5 9.1 20.6 2.5 -1.8 -8.840 to 44 years 41.8 23.0 38.3 -9.1 113.2 20.5 32.5 6.0 37.3 48.9 67.8 45.1 19.1 -23.845 to 49 years 28.0 86.0 35.8 151.7 73.8 72.4 750.0 58.2 41.5 13.0 108.7 101.9 131.6 61.950 to 54 years 132.7 31.0 82.8 81.1 36.4 205.3 6.1 218.2 41.0 78.5 164.1 63.9 23.6 266.755 to 59 years 117.9 41.1 142.1 181.3 3.9 65.4 66.7 55.0 67.9 52.8 89.7 78.8 131.4 60.960 and 61 years 200.0 163.6 190.9 50.0 55.6 144.4 125.0 21.1 100.0 6.5 61.5 36.0 -9.1 340.062 to 64 years 13.0 94.7 42.9 8.7 -13.2 25.0 -5.0 31.3 -16.0 3.1 38.9 51.6 41.5 -8.065 to 69 years 11.9 42.9 -7.5 -32.6 53.6 46.9 -20.0 65.4 21.1 14.3 -5.0 78.4 90.0 15.070 to 74 years -1.8 15.4 5.0 27.8 43.5 55.0 -45.0 4.2 -58.3 95.7 -36.1 -44.3 -17.2 100.075 to 79 years 41.7 40.0 218.2 211.1 -37.5 -5.6 11.1 33.3 63.6 -30.6 -10.0 8.0 -37.8 133.380 to 84 years 92.3 37.5 8.3 -8.3 -33.3 40.0 75.0 55.6 -57.1 23.5 171.4 107.7 46.7 -25.085 years and over 155.6 50.0 -16.7 -62.5 100.0 -16.7 83.3 500.0 66.7 7.7 200.0 -71.4 700.0 75.0
Table 1.9 continued on next page
Ald
en(T
)
App
le R
iver
(T)
Bal
sam
Lak
e (T
)
Bea
ver (
T)
Bla
ck B
rook
(T)
Bon
e La
ke (T
)
Cla
m F
alls
(T)
Cla
yton
(T)
Cle
ar L
ake
(T)
Eure
ka (T
)
Farm
ingt
on (T
)
Gar
field
(T)
Geo
rget
own
(T)
John
stow
n (T
)
Polk County, Wisconsin Issues and Opportunities
Comprehensive Plan 2009-2029 26
Table 1.9 continued Percent Change in Age by Municipality – 1990 to 2000 – Polk County
Lake
tow
n (T
)
Linc
oln
(T)
Lora
n (T
)
Luck
(T)
McK
inle
y (T
)
Mill
tow
n (T
)
Osc
eola
(T)
St. C
roix
Fal
ls (T
)
Ster
ling
(T)
Wes
t Sw
eden
(T)
Bal
sam
Lak
e (V
)
Cen
turia
(V)
Cla
yton
(V)
Under 5 years -29.7 -18.4 -65.0 -7.7 0.0 -29.3 68.0 -5.6 -32.2 -13.6 -2.0 -13.2 43.3
5 to 9 years -33.0 -12.9 -39.5 -12.9 -3.7 4.8 71.6 -40.4 -11.8 -42.7 193.3 -9.1 20.0
10 to 14 years -25.2 15.0 288.9 -21.6 -38.5 40.6 52.6 21.7 58.5 30.0 0.0 10.5 66.7
15 to 17 years 35.0 65.1 300.0 42.1 -12.5 9.4 101.9 6.6 27.6 127.8 3.1 69.0 -25.0
18 and 19 years -16.0 35.6 233.3 18.8 -14.3 41.7 0.0 70.6 50.0 92.3 -30.0 50.0 83.3
20 years -14.3 91.7 -83.3 125.0 n.a. -16.7 63.6 42.9 -60.0 n.a. 116.7 200.0 75.0
21 years -60.0 4.8 -80.0 -25.0 -50.0 -66.7 -13.3 66.7 0.0 200.0 360.0 114.3 900.0
22 to 24 years 187.5 -31.5 66.7 56.3 66.7 5.0 3.0 44.4 78.6 66.7 -35.1 0.0 61.5
25 to 29 years -23.2 -16.0 -13.3 -20.5 100.0 -8.0 -13.3 -36.9 -40.6 26.3 -18.5 -9.9 -4.2
30 to 34 years -38.7 -16.1 -58.5 -55.1 -53.8 1.5 54.9 -39.6 -35.5 -49.3 60.0 31.8 32.1
35 to 39 years -38.5 23.4 25.0 14.7 -50.0 8.8 63.8 -10.6 184.0 -14.9 62.2 -16.0 7.3
40 to 44 years 56.6 62.1 92.3 45.5 80.0 3.3 75.9 81.3 80.0 61.4 33.3 22.0 207.7
45 to 49 years 59.7 62.7 53.3 18.8 138.5 80.0 111.6 107.7 40.5 76.7 141.4 183.3 80.0
50 to 54 years 110.8 22.8 533.3 56.5 6.7 145.0 104.7 18.3 105.0 28.6 102.9 86.4 66.7
55 to 59 years 129.2 67.8 75.0 1.9 13.3 39.2 56.4 42.5 161.1 -3.0 58.8 -5.7 87.5
60 and 61 years 9.1 79.4 -50.0 0.0 350.0 18.8 9.1 61.5 250.0 88.9 -41.4 -42.9 -76.9
62 to 64 years -6.5 64.0 -45.5 -11.1 33.3 0.0 57.7 -22.2 46.2 -37.1 38.5 -15.8 0.0
65 to 69 years -27.5 47.6 -62.5 13.9 46.2 -22.0 18.2 -2.9 19.2 -3.2 3.9 135.7 -36.4
70 to 74 years -16.7 207.7 122.2 -13.8 150.0 140.0 116.0 48.4 -42.3 129.4 -8.3 -39.6 -55.6
75 to 79 years 10.7 87.5 450.0 -35.1 66.7 300.0 100.0 -10.0 25.0 10.3 15.1 -25.0 0.0
80 to 84 years 16.7 9.1 0.0 -25.0 -57.1 18.2 -20.0 54.5 -25.0 -22.2 -36.4 10.0 75.0
85 years and over 500.0 46.7 -75.0 57.1 -50.0 300.0 100.0 n.a. 150.0 -33.3 40.7 -12.1 25.0Table 1.9 continued on next page
Polk County, Wisconsin Issues and Opportunities
Comprehensive Plan 2009-2029 27
Table 1.9 continued Percent Change in Age by Municipality – 1990 to 2000 – Polk County
Cle
ar L
ake
(V)
Dre
sser
(V)
Fred
eric
(V)
Luck
(V)
Mill
tow
n (V
)
Osc
eola
(V)
Turt
le L
ake
(V)*
Am
ery
(C)
St. C
roix
Fal
ls (C
)
Polk
Cou
nty
Under 5 years -25.6 45.7 -16.9 -28.2 -5.6 -2.2 n.a. -15.3 11.2 -4.5
5 to 9 years -16.9 3.2 -16.7 84.0 -4.5 -3.4 n.a. -19.2 22.9 -1.9
10 to 14 years 1.4 8.2 47.1 58.0 -10.0 30.8 n.a. -16.7 27.7 19.3
15 to 17 years 71.0 -47.6 18.4 40.0 70.8 15.2 n.a. 14.5 80.4 34.1
18 and 19 years 112.5 9.1 90.9 23.8 -5.6 81.1 n.a. 26.8 -11.4 28.3
20 years 140.0 -20.0 66.7 75.0 -7.7 10.3 n.a. 14.3 -31.3 28.6
21 years -15.4 -64.3 275.0 83.3 75.0 -4.3 n.a. -22.7 0.0 9.3
22 to 24 years -15.8 -5.9 -2.9 17.6 -18.4 50.0 n.a. 41.4 51.1 12.3
25 to 29 years -13.2 -6.2 -14.9 -28.4 20.0 -10.0 n.a. 12.5 6.3 -16.0
30 to 34 years -38.5 7.5 -1.7 27.3 -4.9 -15.4 n.a. -16.7 -19.1 -10.4
35 to 39 years 13.2 31.1 9.6 75.4 34.7 42.9 n.a. 23.7 11.9 20.0
40 to 44 years 95.3 61.1 18.8 27.8 48.8 91.7 n.a. -30.6 50.4 41.0
45 to 49 years 140.0 48.0 105.1 95.0 400.0 72.2 n.a. 91.4 80.0 78.4
50 to 54 years 31.6 78.6 52.8 96.6 155.6 33.8 n.a. 41.1 53.0 70.5
55 to 59 years -4.8 123.5 -25.9 6.7 10.5 25.4 n.a. 62.7 19.5 53.3
60 and 61 years 23.1 275.0 -26.3 20.0 66.7 -6.1 n.a. 80.0 7.1 41.4
62 to 64 years -38.7 29.4 -17.2 -6.3 9.5 -22.5 n.a. -1.1 53.1 9.8
65 to 69 years -19.6 50.0 -19.2 5.3 -9.8 -1.6 n.a. -19.3 -12.6 6.1
70 to 74 years 22.5 43.8 -25.9 -14.9 -27.3 30.6 n.a. 11.1 35.5 7.9
75 to 79 years 34.2 -42.9 1.2 -16.4 3.9 8.3 n.a. 23.6 -4.8 13.6
80 to 84 years -2.3 0.0 43.9 44.4 -36.5 0.0 n.a. 5.0 71.4 13.8
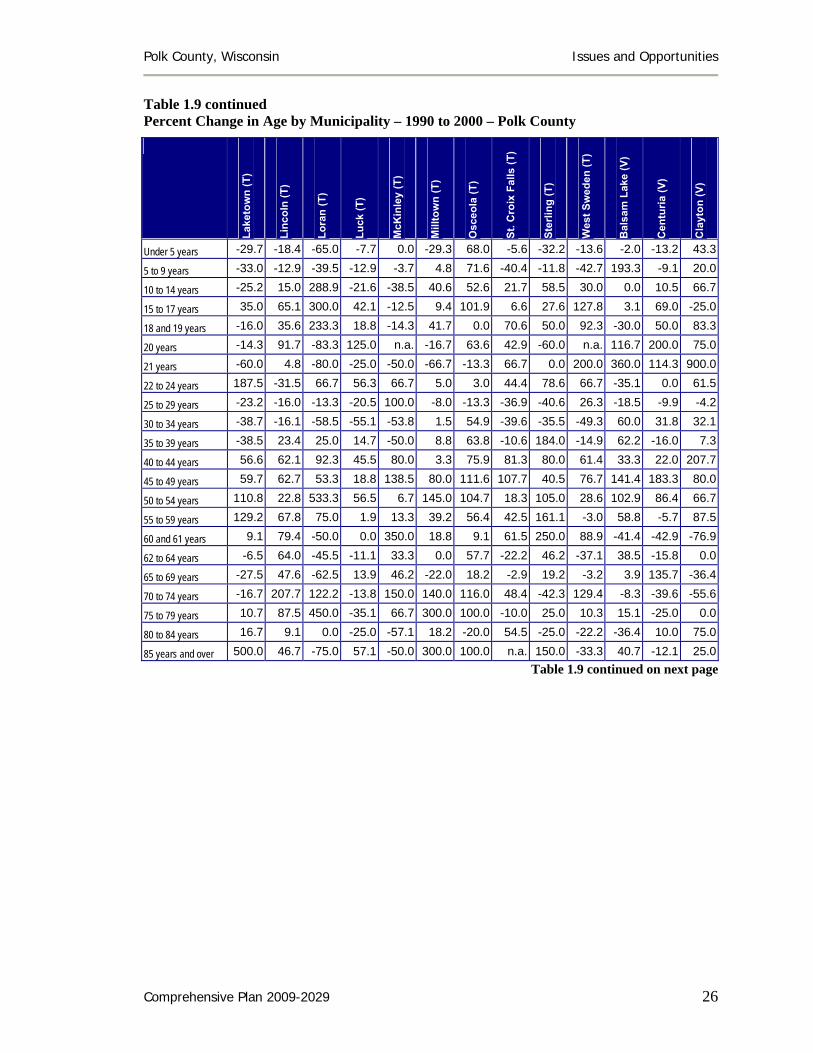
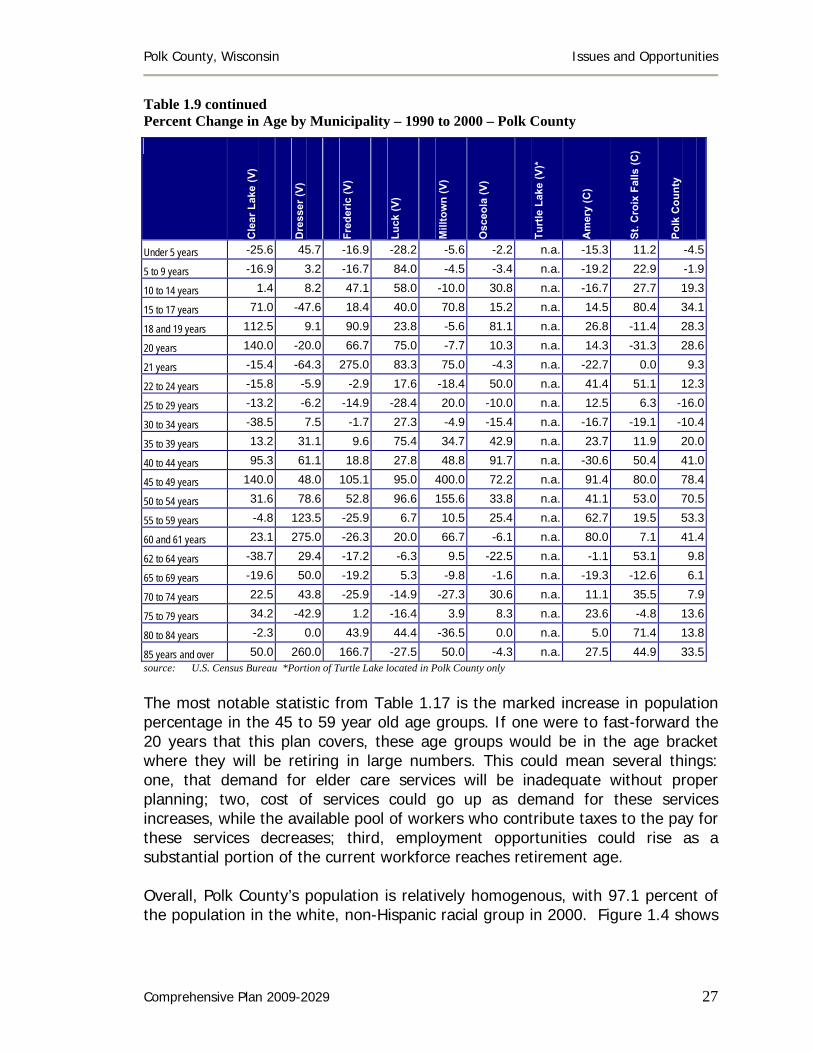
85 years and over 50.0 260.0 166.7 -27.5 50.0 -4.3 n.a. 27.5 44.9 33.5source: U.S. Census Bureau *Portion of Turtle Lake located in Polk County only The most notable statistic from Table 1.17 is the marked increase in population percentage in the 45 to 59 year old age groups. If one were to fast-forward the 20 years that this plan covers, these age groups would be in the age bracket where they will be retiring in large numbers. This could mean several things: one, that demand for elder care services will be inadequate without proper planning; two, cost of services could go up as demand for these services increases, while the available pool of workers who contribute taxes to the pay for these services decreases; third, employment opportunities could rise as a substantial portion of the current workforce reaches retirement age. Overall, Polk County’s population is relatively homogenous, with 97.1 percent of the population in the white, non-Hispanic racial group in 2000. Figure 1.4 shows
Polk County, Wisconsin Issues and Opportunities
Comprehensive Plan 2009-2029 28
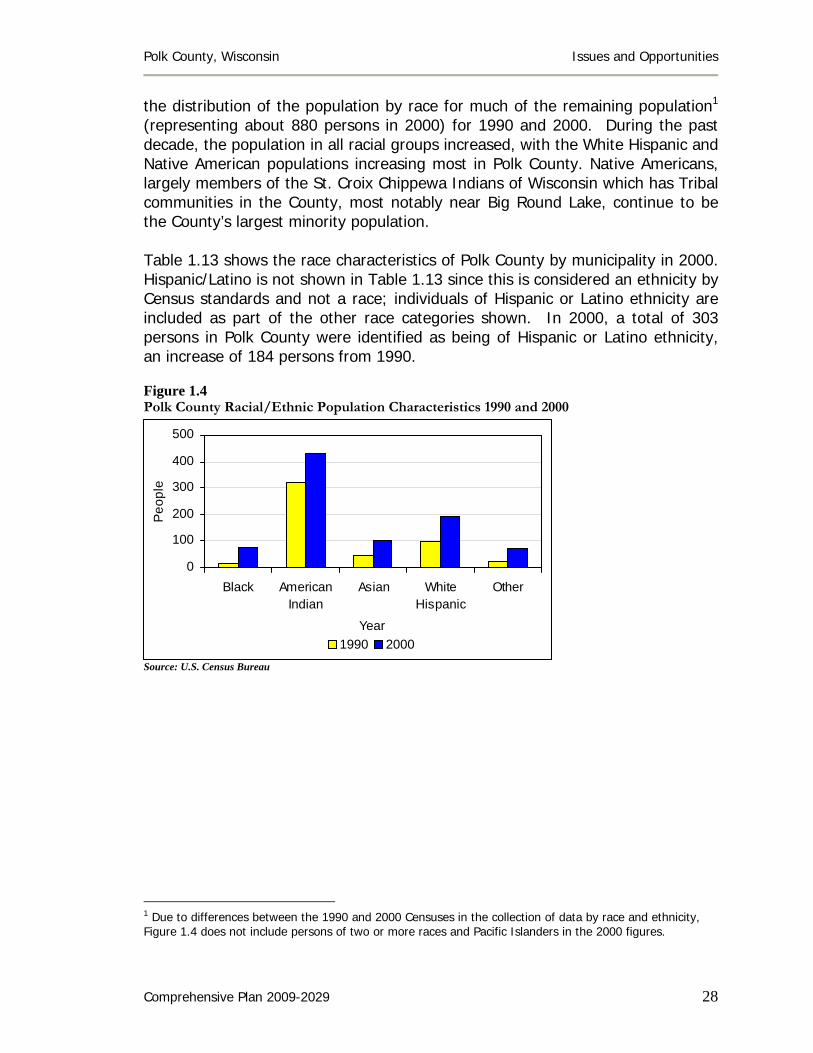
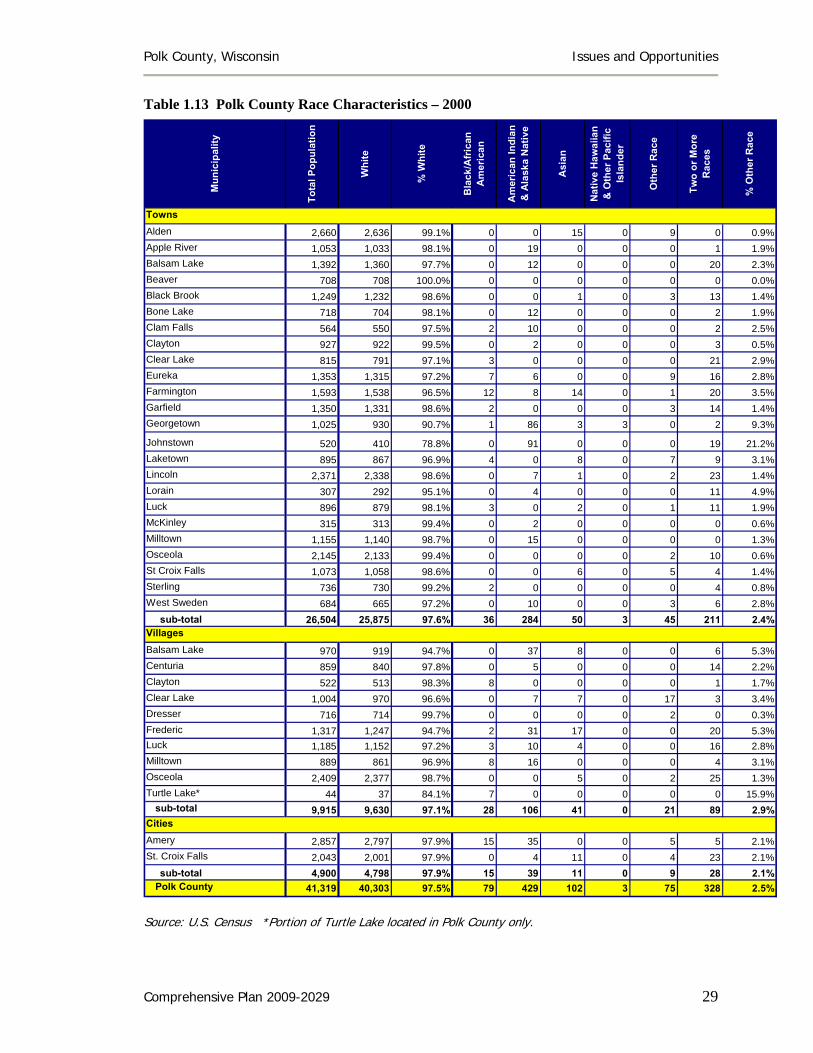
the distribution of the population by race for much of the remaining population1 (representing about 880 persons in 2000) for 1990 and 2000. During the past decade, the population in all racial groups increased, with the White Hispanic and Native American populations increasing most in Polk County. Native Americans, largely members of the St. Croix Chippewa Indians of Wisconsin which has Tribal communities in the County, most notably near Big Round Lake, continue to be the County’s largest minority population. Table 1.13 shows the race characteristics of Polk County by municipality in 2000. Hispanic/Latino is not shown in Table 1.13 since this is considered an ethnicity by Census standards and not a race; individuals of Hispanic or Latino ethnicity are included as part of the other race categories shown. In 2000, a total of 303 persons in Polk County were identified as being of Hispanic or Latino ethnicity, an increase of 184 persons from 1990. Figure 1.4 Polk County Racial/Ethnic Population Characteristics 1990 and 2000
Source: U.S. Census Bureau
1 Due to differences between the 1990 and 2000 Censuses in the collection of data by race and ethnicity, Figure 1.4 does not include persons of two or more races and Pacific Islanders in the 2000 figures.
0
100
200
300
400
500
Black AmericanIndian
Asian WhiteHispanic
Other
Year
Peo
ple
1990 2000
Polk County, Wisconsin Issues and Opportunities
Comprehensive Plan 2009-2029 29
Table 1.13 Polk County Race Characteristics – 2000
Source: U.S. Census *Portion of Turtle Lake located in Polk County only.
TownsAlden 2,660 2,636 99.1% 0 0 15 0 9 0 0.9%Apple River 1,053 1,033 98.1% 0 19 0 0 0 1 1.9%Balsam Lake 1,392 1,360 97.7% 0 12 0 0 0 20 2.3%Beaver 708 708 100.0% 0 0 0 0 0 0 0.0%Black Brook 1,249 1,232 98.6% 0 0 1 0 3 13 1.4%Bone Lake 718 704 98.1% 0 12 0 0 0 2 1.9%Clam Falls 564 550 97.5% 2 10 0 0 0 2 2.5%Clayton 927 922 99.5% 0 2 0 0 0 3 0.5%Clear Lake 815 791 97.1% 3 0 0 0 0 21 2.9%Eureka 1,353 1,315 97.2% 7 6 0 0 9 16 2.8%Farmington 1,593 1,538 96.5% 12 8 14 0 1 20 3.5%Garfield 1,350 1,331 98.6% 2 0 0 0 3 14 1.4%Georgetown 1,025 930 90.7% 1 86 3 3 0 2 9.3%
Johnstown 520 410 78.8% 0 91 0 0 0 19 21.2%Laketown 895 867 96.9% 4 0 8 0 7 9 3.1%Lincoln 2,371 2,338 98.6% 0 7 1 0 2 23 1.4%Lorain 307 292 95.1% 0 4 0 0 0 11 4.9%Luck 896 879 98.1% 3 0 2 0 1 11 1.9%McKinley 315 313 99.4% 0 2 0 0 0 0 0.6%Milltown 1,155 1,140 98.7% 0 15 0 0 0 0 1.3%Osceola 2,145 2,133 99.4% 0 0 0 0 2 10 0.6%St Croix Falls 1,073 1,058 98.6% 0 0 6 0 5 4 1.4%Sterling 736 730 99.2% 2 0 0 0 0 4 0.8%West Sweden 684 665 97.2% 0 10 0 0 3 6 2.8% sub-total 26,504 25,875 97.6% 36 284 50 3 45 211 2.4%VillagesBalsam Lake 970 919 94.7% 0 37 8 0 0 6 5.3%Centuria 859 840 97.8% 0 5 0 0 0 14 2.2%Clayton 522 513 98.3% 8 0 0 0 0 1 1.7%Clear Lake 1,004 970 96.6% 0 7 7 0 17 3 3.4%Dresser 716 714 99.7% 0 0 0 0 2 0 0.3%Frederic 1,317 1,247 94.7% 2 31 17 0 0 20 5.3%Luck 1,185 1,152 97.2% 3 10 4 0 0 16 2.8%Milltown 889 861 96.9% 8 16 0 0 0 4 3.1%Osceola 2,409 2,377 98.7% 0 0 5 0 2 25 1.3%Turtle Lake* 44 37 84.1% 7 0 0 0 0 0 15.9%
sub-total 9,915 9,630 97.1% 28 106 41 0 21 89 2.9%CitiesAmery 2,857 2,797 97.9% 15 35 0 0 5 5 2.1%St. Croix Falls 2,043 2,001 97.9% 0 4 11 0 4 23 2.1% sub-total 4,900 4,798 97.9% 15 39 11 0 9 28 2.1%
Polk County 41,319 40,303 97.5% 79 429 102 3 75 328 2.5%
Bla
ck/A
fric
an
Am
eric
an
Am
eric
an In
dian
&
Ala
ska
Nat
ive
Asi
an
Mun
icip
ality
Tota
l Pop
ulat
ion
Whi
te
% W
hite
Nat
ive
Haw
aiia
n &
Oth
er P
acifi
c Is
land
er
Oth
er R
ace
Two
or M
ore
Rac
es
% O
ther
Rac
e
Polk County, Wisconsin Issues and Opportunities
Comprehensive Plan 2009-2029 30
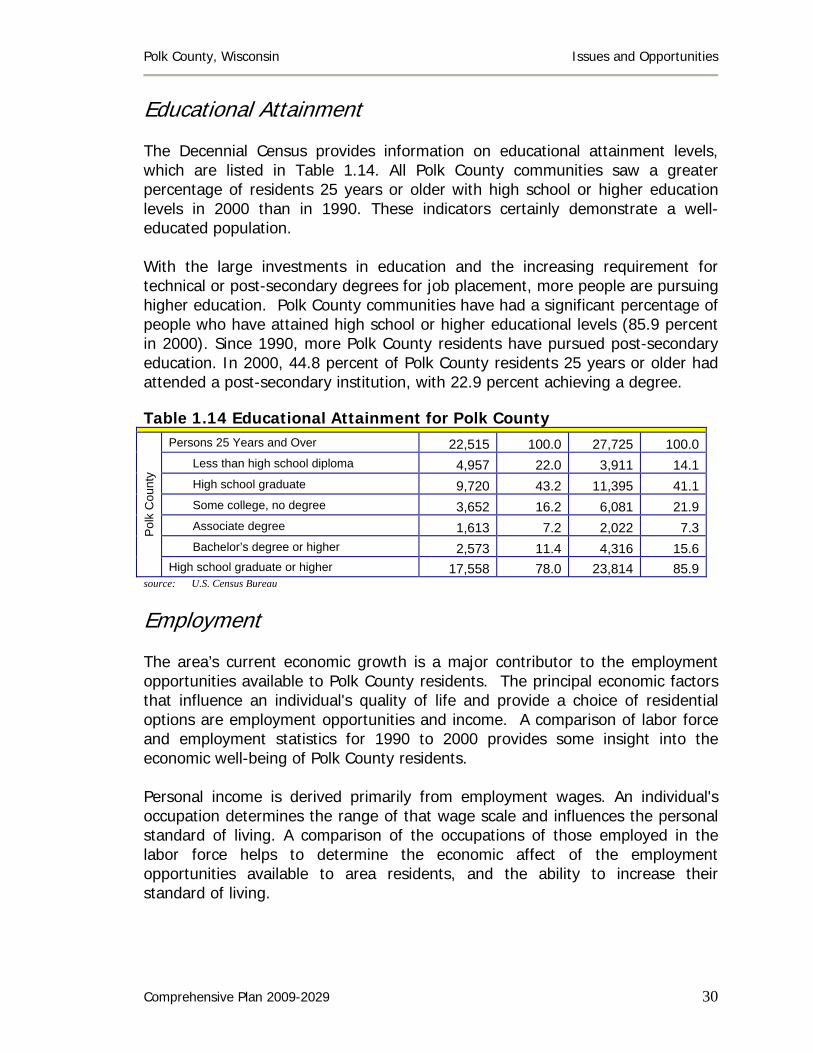
Educational Attainment The Decennial Census provides information on educational attainment levels, which are listed in Table 1.14. All Polk County communities saw a greater percentage of residents 25 years or older with high school or higher education levels in 2000 than in 1990. These indicators certainly demonstrate a well-educated population. With the large investments in education and the increasing requirement for technical or post-secondary degrees for job placement, more people are pursuing higher education. Polk County communities have had a significant percentage of people who have attained high school or higher educational levels (85.9 percent in 2000). Since 1990, more Polk County residents have pursued post-secondary education. In 2000, 44.8 percent of Polk County residents 25 years or older had attended a post-secondary institution, with 22.9 percent achieving a degree. Table 1.14 Educational Attainment for Polk County
Persons 25 Years and Over 22,515 100.0 27,725 100.0Less than high school diploma 4,957 22.0 3,911 14.1High school graduate 9,720 43.2 11,395 41.1Some college, no degree 3,652 16.2 6,081 21.9Associate degree 1,613 7.2 2,022 7.3Bachelor’s degree or higher 2,573 11.4 4,316 15.6
Pol
k C
ount
y
High school graduate or higher 17,558 78.0 23,814 85.9source: U.S. Census Bureau
Employment The area’s current economic growth is a major contributor to the employment opportunities available to Polk County residents. The principal economic factors that influence an individual's quality of life and provide a choice of residential options are employment opportunities and income. A comparison of labor force and employment statistics for 1990 to 2000 provides some insight into the economic well-being of Polk County residents. Personal income is derived primarily from employment wages. An individual's occupation determines the range of that wage scale and influences the personal standard of living. A comparison of the occupations of those employed in the labor force helps to determine the economic affect of the employment opportunities available to area residents, and the ability to increase their standard of living.

Polk County, Wisconsin Issues and Opportunities
Comprehensive Plan 2009-2029 31
While the segment of the population eligible for the labor force in Polk County grew by 23 percent between 1990 and 2000 (see Table 1.15), the actual number in the labor force increased by 29.1 percent. Employed residents in the labor force increased by 33 percent over the same period, while the percentage of unemployed residents decreased by 4.1 percentage points. Based on these statistics, it appears that a growing number of county residents had been finding employment opportunities in the 1990s. The trend of rising employment opportunities in Polk County came to a halt due to the latest economic downturn. A number of factors played into the downturn, but the result has been exceedingly high unemployment rates and numerous foreclosures of homes. The most recent economic data states that as of August, 2009, the unemployment rate for the Polk County is 8.8%. This figure is well over 3-times the rate in 2000. Table 1.15 Labor Force – 1990 and 2000 – Polk County Municipal Units
Polk County
Total
Population # in Labor
Force
% in Labor Force Employed Unemployed
% Unemployed
1990 25,896 16,574 64.0 15,455 1,105 6.7 2000 31,857 21,400 67.2 20,553 830 2.6 2008 45,892 25,087 54.7 23,254 1,842 7.9
source: U.S. Census
Table 1.16 shows the employment trends between 1990 and 2006 for employers in Polk County based on tax and employee information. However, the Census Bureau only collects place-of-residence employment data; this means these data can tell us in what industries or occupations the residents of Polk County communities work. Table 1.17 compares the industries in which Polk County residents worked between 1990 and 2000. During this timeframe, Polk County residents were increasingly employed in manufacturing, construction, and educational, health and social services industries. Perhaps surprising is the significant decrease in County residents’ employment in the retail trades. This trend, as well as several other trends noted by data here in the Issues and Opportunities Element, show that in some areas Polk County may be heading in the opposite direction from national and state trends, where manufacturing has been heading downward and retail heading upward.

Polk County, Wisconsin Issues and Opportunities
Comprehensive Plan 2009-2029 32
Table 1.16 Polk County Employment – 1990 to 2006
Industry Category 1990 1992 1994 1996 1998 2000 2002 2004 2006
% Chg ‘90- ‘06
Ag Forestry Fishing & Hunting n.a. n.a. n.a. n.a. n.a. 109 118 152 154 n.a. Mining Quarrying & Oil & Gas Extraction n.a. n.a. n.a. n.a. n.a. 24 29 32 30 n.a. Utilities 143 182 153 154 165 167 140 132 119 -16.8% Construction 422 514 500 554 623 722 790 788 741 75.6% Manufacturing 2,192 2,262 2,568 3,719 4,074 4,361 3,813 3,812 3,827 74.6% Wholesale Trade 191 409 733 251 228 284 303 354 476 149.2% Retail Trade 1,240 1,226 1,336 1,587 1,721 1,806 1,817 1,729 1,756 41.6% Transportation & Warehousing 239 264 297 326 322 334 364 346 344 43.9% Information 319 307 309 332 329 342 300 456 323 1.3% Finance & Insurance 340 356 384 386 397 402 431 436 437 28.5% Real Estate & Rental & Leasing 63 77 66 76 78 80 89 74 88 39.7% Professional & Technical Services 147 157 179 200 191 n.a. 253 n.a. n.a. n.a. Management Of Companies & Enterprises n.a. n.a. 10 10 n.a. n.a. 0 n.a. n.a. n.a. Admin & Waste Services n.a. n.a. 144 142 n.a. n.a. 190 n.a. 434 n.a. Educational Services 943 963 1,014 1,107 1,203 1,253 1,328 1,315 1,346 42.7% Health Care & Social Assistance 1,331 1,502 1,613 1,776 1,970 2,063 2,146 2,275 2,315 73.9% Arts Entertainment & Recreation 180 249 229 247 236 212 251 277 263 46.1% Accommodation & Food Services 881 818 910 1,003 983 1,064 1,129 1,209 1,227 39.3% Other Services, except Public Admin n.a. n.a. n.a. n.a. n.a. 251 266 n.a. 258 n.a. Public Administration 551 502 526 553 544 597 598 618 626 13.6% Unclassified n.a. n.a. n.a. n.a. n.a. n.a. 0 n.a. 0 n.a. Total 9,182 9,788 10,971 12,423 13,064 14,071 14,355 14,005 14,764 60.8%
note: Only includes employers participating in the State unemployment insurance program. Some employment numbers not available in order to maintain confidentiality due to a small number of firms. source: Wisconsin Department of Workforce Development, WORKnet
Table 1.18 shows the occupations in which Polk County residents were employed as opposed to the industries in which they work. Polk County communities experienced very little change in residents’ occupations, except for farming, forestry and fishing, which decreased by 78.7 percent between 1990 and 2000, and managerial, professional, and technical occupations, which increased by 6.4 percent. No 1990 data for construction occupations was available for comparison.

Polk County, Wisconsin Issues and Opportunities
Comprehensive Plan 2009-2029 33
Table 1.17 Employment By Industry – 1990 and 2000 – Polk County (yellow shading indicates combined categories)
source: U.S. Census
1990 2000 Number Percent Number Percent
Polk County Agriculture, forestry, fishing, hunting & mining 1,678 10.9 991 4.8 Construction 995 6.4 1,520 7.4 Manufacturing 4,066 26.3 5,780 28.1 Wholesale trade 380 2.5 530 2.6 Retail trade 2,274 14.7 2,074 10.1 Transportation, warehousing and utilities 813 5.3 885 4.3 Information ---- ---- 330 1.6 Finance, insurance, real estate, rental & leasing 630 4.1 780 3.8 Professional, scientific, management, administrative and waste management services 784 5.1 948 4.6 Educational, health and social services 2,402 15.5 3,698 19.3 Arts, entertainment, recreation, accommodation and food services 949 6.1 1,262 6.1 Other services, except public administration 853 4.2 Public administration 484 3.1 632 3.1 Total Employment (16 years and over) 15,455 100.0 20,553 100.0

Polk County, Wisconsin Issues and Opportunities
Comprehensive Plan 2009-2029 34
Table 1.18 Employment By Occupation – 1990 and 2000 – Polk County Municipal Units (yellow and green shading indicates combined categories)
source: U.S. Census The economic downturn early in the decade starting in 2000 makes it uncertain how the labor force and employment has been affected in Polk County; however, in Table 1.16 we can see indicators in employment for Polk County that may reveal the recent economic slowdown. Table 1.16 shows Polk County non-farm employment. Although one cannot see what is happening in each municipality, one could infer that the trend defined for Polk County is likely to show changes in employment opportunities for the residents of most Polk County communities. After steady employment growth in the 1990s, some variability in employment is evident since 2000 with decreasing employment between 2002 and 2004, perhaps reflecting the national economic downturn. The 2006 data shows a rebound in employment but it is not enough information to indicate the impact of the current economic situation in Polk County. Information due out next year associated with the 2010 census will give a much better picture of what the conditions are on the ground. Although the Decennial Census’s standard available information limits employment information to place of residence, it also provides information that can indicate Polk County’s commuting characteristics. Table 1.19 shows how long it took Polk County residents to get to work in 1990 and 2000. During this period, the number of residents who worked at home or commuted less than 20 minutes to work increased by nine percent, while the number of residents who commuted 20 minutes or more to work increased by 70.5 percent. In 1990, only 39.7 percent of employed residents commuted 20 minutes or longer, which increased to 50.8 percent by 2000.
1990 2000 Number Percent Number PercentPolk County Executive, administrative and managerial 1,193 7.7 Professional 1,541 10.0 5,418 26.4 Technician 362 2.3 Sales 1,372 8.9 4,458 21.7 Administrative support, including clerical 1,964 12.7 Service 2,021 13.1 2,839 13.8 Farming, forestry, fishing 1,575 10.2 335 1.6 Construction, extraction and maintenance ---- ---- 2,135 10.4 Precision production, craft and repair 2,120 13.7 Machine operators, assemblers and inspectors 1,722 11.1 5,368 26.1 Transportation and material moving 786 5.1 Handlers, equipment cleaners, helpers & laborers 799 5.2 Total Employment (16 years and over) 15,455 100.0 20,553 100.0

Polk County, Wisconsin Issues and Opportunities
Comprehensive Plan 2009-2029 35
In general, Polk County residents are experiencing even longer commutes to work. This is important, in part because it is one indicator of the use of the existing transportation infrastructure. For example, growing commute times, coupled with a growing population, results in an increased demand for road maintenance and expansion. It is uncertain if this trend will continue with recent increases in energy prices and the slumping economy. Table 1.19 Travel Time to Work – 1990 and 2000 – Polk County
1990 2000 Number Percent Number Percent Worked at home 1,733 11.4 1,268 6.3Less than 5 minutes 1,219 8.0 1,226 6.05 to 9 minutes 2,450 16.1 2,577 12.710 to 19 minutes 3,761 24.7 4,915 24.220 to 29 minutes 1,905 12.5 3,002 14.830 to 44 minutes 1,752 11.5 2,830 13.945 to 59 minutes 850 5.6 1,668 8.260 minutes or longer 1,537 10.1 2,802 13.8TOTAL 15,207 100.0 20,288 100.0
source: U.S. Census
Studying the special distribution of workers and employment centers is helpful with economic development efforts and transportation infrastructure management. The Census information that reveals actual commuting patterns is called Place of Residence/Place of Work shown in Table 1.20. In 2000, about 61.7 percent of the workers living in the County worked within Polk County. About 7.6 percent commuted to nearby St. Croix County. Almost 20 percent commuted to Chisago, Washington, Ramsey, or Hennepin counties in Minnesota.
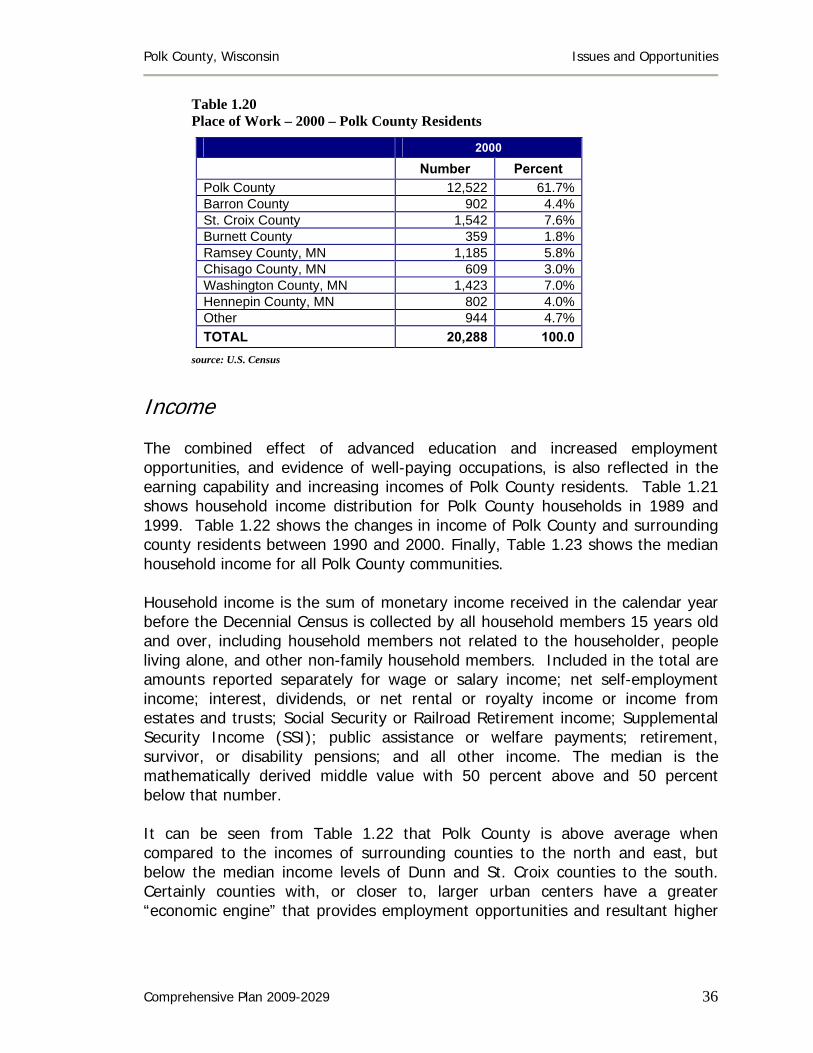
Polk County, Wisconsin Issues and Opportunities
Comprehensive Plan 2009-2029 36
Table 1.20 Place of Work – 2000 – Polk County Residents
2000
Number Percent Polk County 12,522 61.7% Barron County 902 4.4% St. Croix County 1,542 7.6% Burnett County 359 1.8% Ramsey County, MN 1,185 5.8% Chisago County, MN 609 3.0% Washington County, MN 1,423 7.0% Hennepin County, MN 802 4.0% Other 944 4.7% TOTAL 20,288 100.0
source: U.S. Census
Income The combined effect of advanced education and increased employment opportunities, and evidence of well-paying occupations, is also reflected in the earning capability and increasing incomes of Polk County residents. Table 1.21 shows household income distribution for Polk County households in 1989 and 1999. Table 1.22 shows the changes in income of Polk County and surrounding county residents between 1990 and 2000. Finally, Table 1.23 shows the median household income for all Polk County communities. Household income is the sum of monetary income received in the calendar year before the Decennial Census is collected by all household members 15 years old and over, including household members not related to the householder, people living alone, and other non-family household members. Included in the total are amounts reported separately for wage or salary income; net self-employment income; interest, dividends, or net rental or royalty income or income from estates and trusts; Social Security or Railroad Retirement income; Supplemental Security Income (SSI); public assistance or welfare payments; retirement, survivor, or disability pensions; and all other income. The median is the mathematically derived middle value with 50 percent above and 50 percent below that number. It can be seen from Table 1.22 that Polk County is above average when compared to the incomes of surrounding counties to the north and east, but below the median income levels of Dunn and St. Croix counties to the south. Certainly counties with, or closer to, larger urban centers have a greater “economic engine” that provides employment opportunities and resultant higher
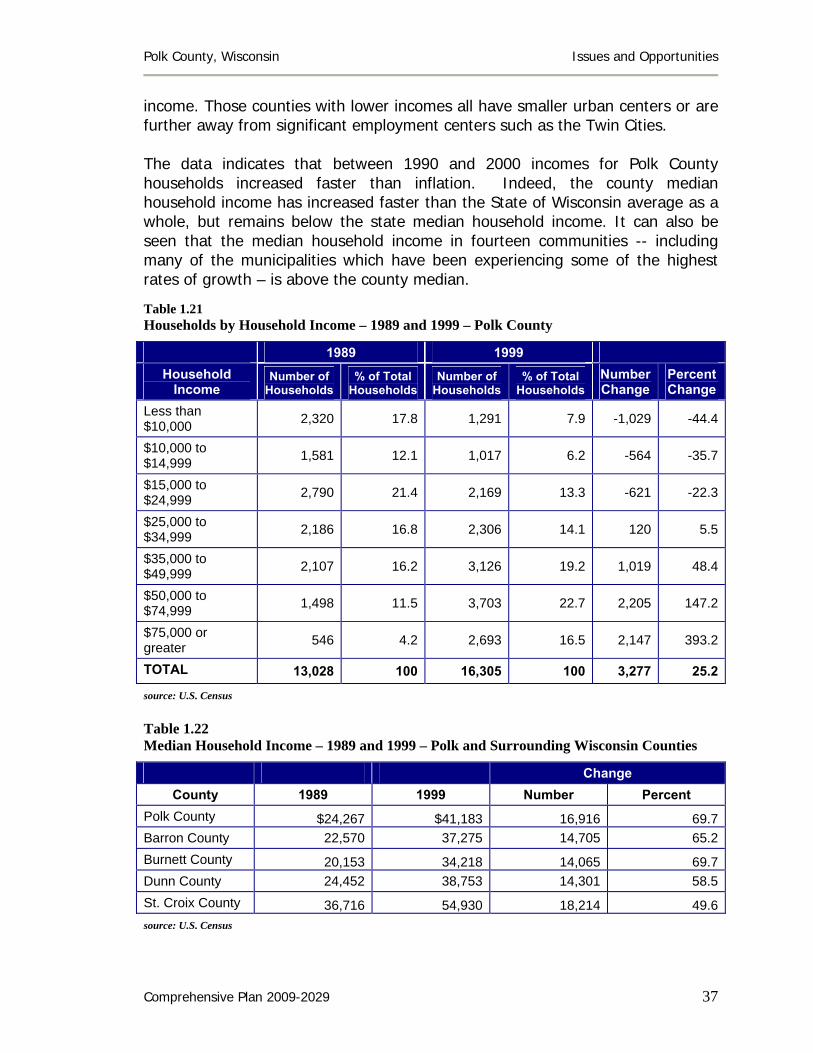
Polk County, Wisconsin Issues and Opportunities
Comprehensive Plan 2009-2029 37
income. Those counties with lower incomes all have smaller urban centers or are further away from significant employment centers such as the Twin Cities. The data indicates that between 1990 and 2000 incomes for Polk County households increased faster than inflation. Indeed, the county median household income has increased faster than the State of Wisconsin average as a whole, but remains below the state median household income. It can also be seen that the median household income in fourteen communities -- including many of the municipalities which have been experiencing some of the highest rates of growth – is above the county median. Table 1.21 Households by Household Income – 1989 and 1999 – Polk County
1989 1999 Household
Income Number of
Households % of Total
Households Number of
Households % of Total
Households Number Change
Percent Change
Less than $10,000 2,320 17.8 1,291 7.9 -1,029 -44.4
$10,000 to $14,999 1,581 12.1 1,017 6.2 -564 -35.7
$15,000 to $24,999 2,790 21.4 2,169 13.3 -621 -22.3
$25,000 to $34,999 2,186 16.8 2,306 14.1 120 5.5
$35,000 to $49,999 2,107 16.2 3,126 19.2 1,019 48.4
$50,000 to $74,999 1,498 11.5 3,703 22.7 2,205 147.2
$75,000 or greater 546 4.2 2,693 16.5 2,147 393.2
TOTAL 13,028 100 16,305 100 3,277 25.2
source: U.S. Census Table 1.22 Median Household Income – 1989 and 1999 – Polk and Surrounding Wisconsin Counties
Change County 1989 1999 Number Percent
Polk County $24,267 $41,183 16,916 69.7Barron County 22,570 37,275 14,705 65.2Burnett County 20,153 34,218 14,065 69.7Dunn County 24,452 38,753 14,301 58.5St. Croix County 36,716 54,930 18,214 49.6source: U.S. Census

Polk County, Wisconsin Issues and Opportunities
Comprehensive Plan 2009-2029 38
Table 1.23 Median Household Income – 1989 and 1999 – Polk County
Dollars Change 1989 1999 Dollars Percent Towns Alden 35,732 57,337 21,605 60.5Apple River 24,911 43,500 18,589 74.6Balsam Lake 29,118 34,276 5,158 17.7Beaver 22,500 40,114 17,614 78.3Black Brook 28,011 48,125 20,114 71.8Bone Lake 19,000 39,821 20,821 109.6Clam Falls 23,026 34,844 11,818 51.3Clayton 29,063 29,135 72 0.2Clear Lake 21,806 32,269 10,463 48.0Eureka 27,404 45,625 18,221 66.5Farmington 37,600 58,833 21,233 56.5Garfield 27,050 48,000 20,950 77.4Georgetown 18,750 38,487 19,737 105.3Johnstown 22,292 37,500 15,208 68.2Laketown 24,643 40,156 15,513 63.0Lincoln 27,448 45,904 18,456 67.2Lorain 18,295 25,208 6,913 37.8Luck 23,889 32,138 8,249 34.5McKinley 21,964 37,083 15,119 68.8Milltown 26,964 28,309 1,345 5.0Osceola 35,000 39,000 4,000 11.4St Croix Falls 29,018 46,500 17,482 60.2Sterling 22,237 36,042 13,805 62.1West Sweden 23,182 41,250 18,068 77.9Villages Balsam Lake 17,778 45,909 28,131 158.2Centuria 20,625 32,560 11,935 57.9Clayton 17,656 41,719 24,063 136.3Clear Lake 22,917 48,542 25,625 111.8Dresser 22,446 37,500 15,054 67.1Frederic 15,602 25,380 9,778 62.7Luck 20,263 40,417 20,154 99.5Milltown 13,654 46,944 33,290 243.8Osceola 25,641 55,509 29,868 116.5Turtle Lake* 0 19,750 19,750 n.a.Cities Amery 19,828 30,710 10,882 54.9St. Croix Falls 26,016 39,350 13,334 51.3Polk County 24,267 41,183 16,916 69.7State of Wisconsin 29,442 43,791 14,349 47.1source: U.S. Census. * Portion of Turtle Lake in Polk County only
Polk County, Wisconsin Issues and Opportunities
Comprehensive Plan 2009-2029 39
Population Projections
Population projections have long been used to assess development prospects and community facility needs. Small area population forecasts can be used to evaluate potential residential development and economic conditions, and the level of demand for public facilities and services. Businesses, schools and government frequently use these forecasts to determine the future needs or design of public facilities or services. This estimate of future growth is also valuable for establishing management techniques to guide orderly growth and development. Projecting population is not a science of absolutes. Consequently, there are limitations that should be remembered when reviewing and evaluating these forecasts. These limitations include:
Population projections are based on historical trends of population growth that are extended into the future, and the assumption that those trends, and the factors behind them, will continue to some point in time.
Forecasts of large area populations (e.g., states or counties) are more reliable. The smaller the area for which a projection is produced, like an individual community, the greater the possibility for error.
The closer the projection year is to the base year; the more likely the population for that projection will be close to the true population.
Population projections are, at best, guides, and their limitations must be considered. Intimate knowledge of local conditions can help build local variables into population projections to enhance their validity.
The Wisconsin Department of Administration (WisDOA) population projections are, by state statute, the official population projections for Wisconsin. Between 2000 and 2030, the WisDOA projections predict a 42.5 percent increase in the Polk County population (about 17,547 more residents). The percentage increases within the towns are anticipated to be a bit higher on average than in the villages and cities (see Map 1.3 and Table 1.10). The largest rates of increase are expected in the Towns of Black Brook, Bone Lake, Eureka, Farmington, Garfield, and Osceola, and the Village of Dresser.
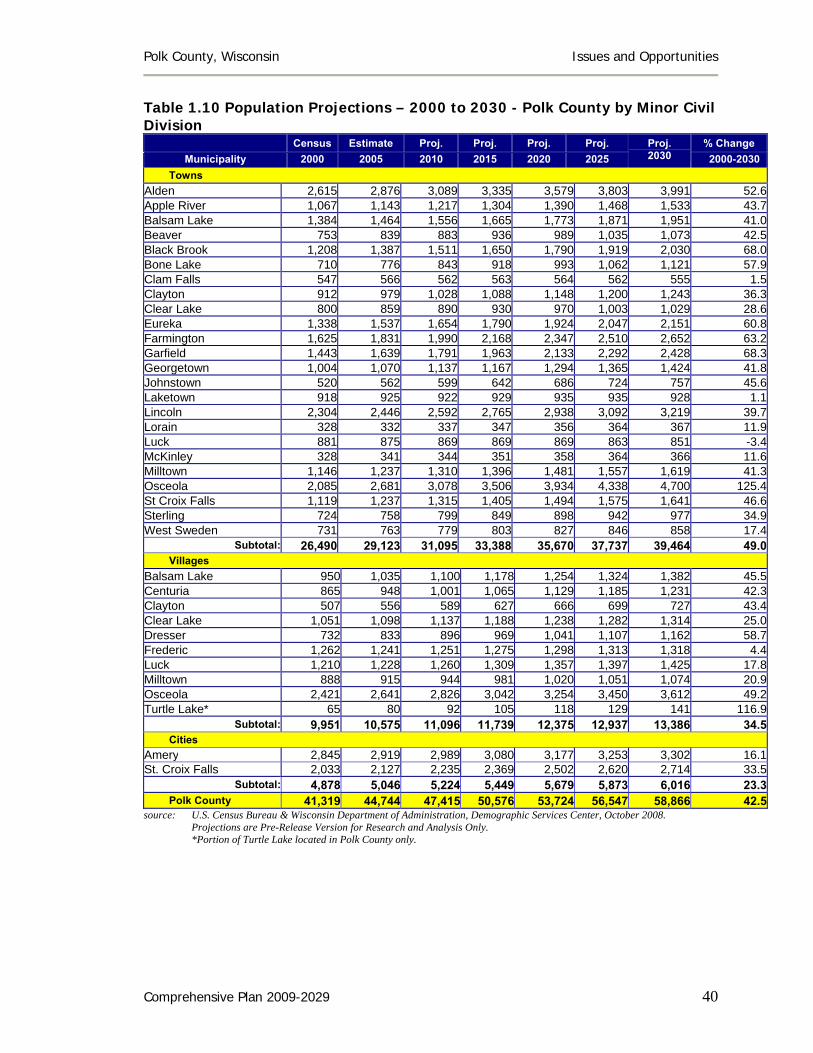
Polk County, Wisconsin Issues and Opportunities
Comprehensive Plan 2009-2029 40
Table 1.10 Population Projections – 2000 to 2030 - Polk County by Minor Civil Division
Census Estimate Proj. Proj. Proj. Proj. % Change Municipality 2000 2005 2010 2015 2020 2025
Proj. 2030 2000-2030
Towns Alden 2,615 2,876 3,089 3,335 3,579 3,803 3,991 52.6Apple River 1,067 1,143 1,217 1,304 1,390 1,468 1,533 43.7Balsam Lake 1,384 1,464 1,556 1,665 1,773 1,871 1,951 41.0Beaver 753 839 883 936 989 1,035 1,073 42.5Black Brook 1,208 1,387 1,511 1,650 1,790 1,919 2,030 68.0Bone Lake 710 776 843 918 993 1,062 1,121 57.9Clam Falls 547 566 562 563 564 562 555 1.5Clayton 912 979 1,028 1,088 1,148 1,200 1,243 36.3Clear Lake 800 859 890 930 970 1,003 1,029 28.6Eureka 1,338 1,537 1,654 1,790 1,924 2,047 2,151 60.8Farmington 1,625 1,831 1,990 2,168 2,347 2,510 2,652 63.2Garfield 1,443 1,639 1,791 1,963 2,133 2,292 2,428 68.3Georgetown 1,004 1,070 1,137 1,167 1,294 1,365 1,424 41.8Johnstown 520 562 599 642 686 724 757 45.6Laketown 918 925 922 929 935 935 928 1.1Lincoln 2,304 2,446 2,592 2,765 2,938 3,092 3,219 39.7Lorain 328 332 337 347 356 364 367 11.9Luck 881 875 869 869 869 863 851 -3.4McKinley 328 341 344 351 358 364 366 11.6Milltown 1,146 1,237 1,310 1,396 1,481 1,557 1,619 41.3Osceola 2,085 2,681 3,078 3,506 3,934 4,338 4,700 125.4St Croix Falls 1,119 1,237 1,315 1,405 1,494 1,575 1,641 46.6Sterling 724 758 799 849 898 942 977 34.9West Sweden 731 763 779 803 827 846 858 17.4
Subtotal: 26,490 29,123 31,095 33,388 35,670 37,737 39,464 49.0 Villages Balsam Lake 950 1,035 1,100 1,178 1,254 1,324 1,382 45.5Centuria 865 948 1,001 1,065 1,129 1,185 1,231 42.3Clayton 507 556 589 627 666 699 727 43.4Clear Lake 1,051 1,098 1,137 1,188 1,238 1,282 1,314 25.0Dresser 732 833 896 969 1,041 1,107 1,162 58.7Frederic 1,262 1,241 1,251 1,275 1,298 1,313 1,318 4.4Luck 1,210 1,228 1,260 1,309 1,357 1,397 1,425 17.8Milltown 888 915 944 981 1,020 1,051 1,074 20.9Osceola 2,421 2,641 2,826 3,042 3,254 3,450 3,612 49.2Turtle Lake* 65 80 92 105 118 129 141 116.9
Subtotal: 9,951 10,575 11,096 11,739 12,375 12,937 13,386 34.5 Cities Amery 2,845 2,919 2,989 3,080 3,177 3,253 3,302 16.1St. Croix Falls 2,033 2,127 2,235 2,369 2,502 2,620 2,714 33.5
Subtotal: 4,878 5,046 5,224 5,449 5,679 5,873 6,016 23.3 Polk County 41,319 44,744 47,415 50,576 53,724 56,547 58,866 42.5source: U.S. Census Bureau & Wisconsin Department of Administration, Demographic Services Center, October 2008. Projections are Pre-Release Version for Research and Analysis Only. *Portion of Turtle Lake located in Polk County only.

Polk County, Wisconsin Issues and Opportunities
Comprehensive Plan 2009-2029 41
Household Projections
A household forecast is used to help develop housing and land-use forecasts. The Wisconsin Department of Administration, Demographic Services has prepared household projections for year 2000 to 2030 in five-year increments found in Table 1.11. Table 1.11Household Projections - 2000 to 2030 - Polk County by Minor Civil Division
Estimate Proj. Proj. Proj. Proj. Proj. % changeMunicipality 2000 2005 2010 2015 2020 2025 2030 2000-2030
Towns Alden 973 1,091 1,208 1,332 1,451 1,557 1,650 69.6Apple River 418 457 501 549 594 633 668 59.8Balsam Lake 529 570 625 682 739 787 829 56.7Beaver 304 345 375 406 435 460 481 58.2Black Brook 419 491 551 614 676 733 782 86.6Bone Lake 264 294 330 366 402 435 463 75.4Clam Falls 237 250 256 262 266 268 268 13.1Clayton 360 393 426 461 494 522 546 51.7Clear Lake 276 302 323 344 365 380 394 42.8Eureka 503 589 653 722 788 847 898 78.5Farmington 525 603 675 752 827 892 952 81.3Garfield 529 612 689 772 852 924 989 87.0Georgetown 433 471 516 563 608 648 683 57.7Johnstown 203 224 245 269 291 311 328 61.6Laketown 350 359 369 380 388 393 393 12.3Lincoln 864 934 1,021 1,112 1,201 1,276 1,342 55.3Lorain 117 120 127 133 138 143 145 23.9Luck 339 343 352 358 364 365 364 7.4McKinley 130 137 144 149 154 158 162 24.6Milltown 441 485 530 577 621 659 692 56.9Osceola 744 974 1,154 1,342 1,529 1,704 1,864 150.5St Croix Falls 420 473 519 566 611 651 684 62.9Sterling 280 299 325 352 378 401 420 50.0West Sweden 285 303 319 336 352 363 372 30.5
Subtotal: 9,943 11,119 12,233 13,399 14,524 15,510 16,369 64.6 Villages Balsam Lake 428 447 489 536 579 617 651 52.1Centuria 343 386 420 457 492 522 547 59.5Clayton 199 223 243 264 285 302 317 59.3Clear Lake 453 483 516 550 582 609 629 38.9Dresser 302 350 388 429 468 503 532 76.2Frederic 536 534 556 578 598 611 619 15.5Luck 500 525 555 589 620 644 664 32.8Milltown 420 441 469 498 525 547 565 34.5Osceola 1,002 1,116 1,231 1,353 1,470 1,574 1,664 66.1Turtle Lake* 25 31 37 43 49 54 61 144.0
Subtotal: 4,208 4,536 4,904 5,297 5,668 5,983 6,249 48.5 Cities Amery 1,231 1,289 1,360 1,432 1,502 1,551 1,591 29.2St. Croix Falls 872 932 1,010 1,093 1,172 1,240 1,297 48.7
Subtotal: 2,103 2,221 2,370 2,525 2,674 2,791 2,888 37.3 Polk County 16,254 17,876 19,507 21,221 22,866 24,284 25,506 56.9
source: Wisconsin Department of Administration, Demographic Services Center ,October 2008. Projections are Pre-Release Version for Research and Analysis Only. *Portion of Turtle Lake located in Polk County only.
Polk County, Wisconsin Issues and Opportunities
Comprehensive Plan 2009-2029 42
Employment Projections In May 2008, the Wisconsin Department of Workforce Development (WDWD) Office of Economic Advisors (OEA) released a series of publications entitled OEA 2006-2016 Statewide Long-term Projections. In addition, a WDWD-OEA report entitled Occupation Projections for West Central Wisconsin Workforce Development Area, 2004-2014 was also released in August of 2006. These reports make economic projections regarding the state’s labor force, industries and occupations. Municipal units within Polk County have employment patterns that are similar to the State’s. It is expected that during the next several years, Wisconsin’s population is will grow slower and older than the nation as a whole, leading to lower participation rates in the workforce. Wisconsin is also having difficulty attracting domestic migrants and retaining its own citizens. However, international immigrants are increasing significantly. The industries that are projected to add the most jobs from 2006-2016 are ambulatory health care services, administrative and support services, eating and drinking establishments, hospitals, social assistance and professional, scientific and technical services. The top six occupations in Wisconsin with the greatest expected job growth for 2006-2016 are retail salespersons (32,400); cashiers (31,400); waiters/waitresses (30,900); registered nurses (21,800); customer service representatives (21,000); and combined food preparation/serving workers (20,800). For further labor force and economic base indicators refer to Section 6: Economic Development Information section. Table 1.12A presents employment and wage projections by the top 10 occupations for the Wisconsin Department of Workforce Development West Central Wisconsin Region. This represents the occupation opportunities available for Polk County residents. The greatest demand for workers is in the occupations on the ‘Most Openings’ list. This list includes many occupations considered as first-time, or temporary, jobs that workers often leave as other opportunities open up. Turnover is high and wages are low. There is one exception on the list: registered nursing, which requires a greater degree of education or training and reflects a higher wage scale. The ‘Fastest Growth’ occupations are often referred to as hot jobs, with more training requirements and better wages. There are often fewer openings in these jobs since the list is based on the greatest percent change in employment; for example, an occupation that increases from 5 to 10 jobs increased 100 percent, whereas an occupation that increases from 2,000 to 2,200 jobs increased only 10 percent.

Polk County, Wisconsin Issues and Opportunities
Comprehensive Plan 2009-2029 43
Table 1.12A West Central Wisconsin Region Occupation Projections – 2014
Top 10 Occupations Typically Required Education/Training Average Wage
Home Health Aides 1-month on-the-job training $9.29Medical Assistants 1-12 mo. on-the-job training $12.63Network and Data Analysts Bachelor’s degree $22.19Computer Software Engrs, Applications Bachelor’s degree $37.08Personal and Home Care Aides 1-month on-the-job training $8.82Dental Assistants 1-12 mo. on-the-job training $12.50Dental Hygienists Associate degree $23.34Employment, Recruitment & Placement Bachelor’s degree $19.67Medical Records & Health Information Associate degree $12.71
Fast
est G
row
th
Occupational Therapists Master’s degree $25.53Cashiers 1-month on-the-job training $7.64Retail Salespersons 1-month on-the-job training $11.06Comb Food Prep/Serv Wrk/Incl Fast 1-month on-the-job training $7.04Waiters/Waitresses 1-month on-the-job training $7.34Registered Nurses Associate’s or Bachelor’s degree $25.83Labrs/Frght/Stock/Matrl Movers/Handlers 1-month on-the-job training $10.09Janitors/Cleaners, except Maids/Housekpg 1-month on-the-job training $10.67Team Assemblers 1-12 mo. on-the-job training $12.94Stock Clerks/Order Fillers 1-month on-the-job training $9.47
Mos
t Ope
ning
s
Bartenders 1-month on-the-job training $8.16West Central WDA includes Barron, Chippewa, Clark, Dunn, Eau Claire, Pepin, Pierce, Polk and St. Croix Counties. source: Wisconsin Dept. of Workforce Development, Bureau of Workforce Information, 2006
Table 1.12B shows employment projections by industry for the West Central Wisconsin Region. The greatest potential growth for employment appears to be in health and education related fields, while computer and electronic product manufacturing appears to be at risk of losing employment. Information and professional services and the leisure and hospitality industry have the potential to add significant employment by 2014.

Polk County, Wisconsin Issues and Opportunities
Comprehensive Plan 2009-2029 44
Table 1.12B West Central Wisconsin Region Industry Projections – 2004-2014 Industry Title
2004 Estimated Employment
2014 Projected Employment
2004-2014 Employment Change
2004-2014 Percentage Change
Total Non-Farm Employment 173,880 194,330 20,450 11.8% Construction/Mining/Natural Resources 8,380 9,880 1,500 17.9% Manufacturing 31,990 32,030 40 0.1% Paper Manufacturing 1,720 1,720 0 0.0% Plastics and Rubber Products 3,400 3,670 270 7.9% Computer and Electronic Product 3,220 3,020 -200 -6.2% Trade 28,800 30,900 2,100 7.3% Food and Beverage Stores 5,040 5,250 210 4.2% Transportation and Utilities (Including US Postal) 8,270 9,520 1,250 15.1% Financial Activities 7,010 7,710 700 10.0% Education and Health Services (Including State and Local Gov Educ and Hosp) 37,330 45,540 8,210 22.0% Ambulatory Health Care Services 5,540 7,570 2,030 36.6% Hospitals (Including State and Local Government) 7,050 8,640 1,590 22.6% Leisure and Hospitality 17,300 19,930 2,630 15.2% Information/Prof Services/Other Services 21,470 24,920 3,450 16.1% Government (Excluding US Postal, State and Local Educ and Hosp) 13,310 13,930 620 4.7% West Central WDA includes Barron, Chippewa, Clark, Dunn, Eau Claire, Pepin, Pierce, Polk and St. Croix Counties. source: Wisconsin Dept. of Workforce Development, Bureau of Workforce Information, 2006
1.5 SUMMARY Certain trends become apparent after reviewing the countywide demographic and economic information. Studying these trends and their implications on local quality of life will be useful in guiding public decision making. Since 1960, Polk County has been increasing significantly in population in part due to its proximity to the Minneapolis/St. Paul metropolitan area. And, since 1960, there has been an explosion of rural non-farm residents. Indeed, amongst the rural population there has been a transformation from a largely farm population to a rural non-farm population. This is due in part to a decrease in the number of active farms, but also from the significant increases in the in-migration of new residents, especially during the 1970s and 1990s, many of which are attracted to the County’s many natural amenities and shorelands. It is clear that the national trend of an aging population is reflected in Polk County. Large numbers of people will be reaching retirement age over the next 20 years. While the Polk County population will be aging, it will also be changing its racial and ethnic characteristics. The county’s minority population can be expected to continue to increase significantly.

Polk County, Wisconsin Issues and Opportunities
Comprehensive Plan 2009-2029 45
Polk County residents have become more educated over the past several decades. Without adequate employment opportunities this can lead to the loss of increasingly well-qualified individuals moving to other areas offering those opportunities. And residents have been increasingly willing to travel longer to places of employment with almost 20% of Polk County workers commuting to Minnesota. This is a trend that may be reversed if transportation costs rise sharply in the future. Overall, the previously analyzed trends reveal that Polk County will continue to experience growth in population and employment with a growing inter-relationship to the Minneapolis/St. Paul MSA, and its communities will face several challenges as a result. However, rising energy costs and recent troubles with the housing market and economy have curtailed new construction throughout much of west-central Wisconsin and some of these trends may be changing, at least for the short-term. Polk County is in a unique spot at present. While still within the sphere of influence of the Twin Cities in Minnesota, the downturn in the economy has slowed development pressures. This has given Polk County the opportunity to get on top of its most pressing issues and establish its priorities for how it will develop in the future before it loses its character and the resources it is known for. The goal of this plan is to set the framework so decisions are based on the thoughts and opinions of its citizens.


