Stormwater Series Development in coastal regions. Over half of our nation’s population lives along the coast and this trend is expected to continue. In the Charleston area alone we expect to see a population increase of nearly 263,000 people between 1994 and 2030. It is predicted that 618 square miles of developed area, representing a 247% increase in development, will accommodate this increase in population. 1 If this growth is not properly planned for and managed, then we can expect problems with costly, haphazard development (sprawl) and increased traffic congestion. The impervious cover (roads, parking lots, rooftops, etc.) that accompanies development prevents infiltration of rainwater into the ground, which leads to a host of problems such as localized flooding, water quality degradation, and the declining health of our coastal resources (e.g., closure of shellfish beds and beaches). What is nonpoint source pollution? Nonpoint source (NPS) pollution, also referred to as polluted runoff, comes from many diffuse sources. Unlike point source pollution that comes from specific sources such as sewage treatment plants and industrial facilities, NPS pollution is transported by water, from rainfall or irrigation, flowing over land. As the water moves across the land, it picks up and transports pollutants. These pollutants include oil and sediment from roadways, agricultural chemicals from farmland, and fertilizer, pesticides, and pet waste from urban and suburban areas. Eventually this polluted runoff is deposited into the nearest waterbody either directly or through storm drain systems. Additional Resources S.C. Sea Grant Extension Program www.scseagrant.org/extension Clemson University Cooperative Extension Service www.clemson.edu/extension South Carolina Coast-A-Syst: An Environmental Risk-Assessment Guide for Protecting Coastal Water Quality www.clemson.edu/sccoastasyst/newb/ siteassessm.htm or contact S.C. Sea Grant at 843/953-2078 for a free copy S.C. Department of Health and Environmental Control – Bureau of Water www.scdhec.gov/environment/water S.C. Department of Health and Environmental Control – Office of Ocean and Coastal Resource Management www.scdhec.gov/environment/ocrm South Carolina Native Plant Society www.scnps.org Low Impact Development Center, Inc. www.lowimpactdevelopment.org U.S. Environmental Protection Agency – Office of Wetlands, Oceans, and Watersheds www.epa.gov/owow 1 Allen, J. & K. Lu. 2003. Modeling and Prediction of Future Urban Growth in the Charleston Region of South Carolina: a GIS-based Integrated Approach. Conservation Ecology 8(2):2. www.consecol.org/vol8/iss2/art2 Shellfish bed closure photo/S.C. Sea Grant Extension Stormwater runoff photo/S.C. Sea Grant Extension “Scoop the poop” signage photo/S.C. Sea Grant Extension Coastal development photo/George Steele Publication of this brochure is sponsored by the National Oceanic and Atmospheric Administration through a grant administered by the S.C. Sea Grant Consortium, award number NA06OAR4170015. SCSGC-G-08-05 Polluted Stormwater Storm drain outfall at beach photo/Jackie Taylor
Transcript
Stormwater Series
Development in coastal regions.
Over half of our nation’s population lives along the coast and this trend is expected to continue. In the Charleston area alone we expect to see a population increase of nearly 263,000 people between 1994 and 2030. It is predicted that 618 square miles of developed area, representing a 247% increase in development, will accommodate this increase in population.1 If this growth is not properly planned for and managed, then we can expect problems with costly, haphazard development (sprawl) and increased traffic congestion. The impervious cover (roads, parking lots, rooftops, etc.) that accompanies development prevents infiltration of rainwater into the ground, which leads to a host of problems such as localized flooding, water quality degradation, and the declining health of our coastal resources (e.g., closureof shellfish beds and beaches).
What is nonpoint source pollution?
Nonpoint source (NPS) pollution, also referred to as polluted runoff, comes from many diffuse sources. Unlike point source pollution that comes from specific sources such as sewage treatment plants and industrial facilities, NPS pollution is transported by water, from rainfall or irrigation, flowing over land. As the water moves across the land, it picks up and transports pollutants. These pollutants include oil and sediment from roadways, agricultural chemicals from farmland, and fertilizer, pesticides, and pet waste from urban and suburban areas. Eventually this polluted runoff is deposited into the nearest waterbody either directlyor through storm drain systems.
Additional Resources
S.C. Sea Grant Extension Programwww.scseagrant.org/extension
South Carolina Coast-A-Syst:An Environmental Risk-Assessment Guidefor Protecting Coastal Water Qualitywww.clemson.edu/sccoastasyst/newb/siteassessm.htm or contact S.C. Sea Grant at 843/953-2078 for a free copy
S.C. Department of Health and Environmental Control – Bureau of Waterwww.scdhec.gov/environment/water
S.C. Department of Health and Environmental Control – Office of Ocean and CoastalResource Managementwww.scdhec.gov/environment/ocrm
South Carolina Native Plant Societywww.scnps.org
Low Impact Development Center, Inc.www.lowimpactdevelopment.org
U.S. Environmental Protection Agency– Office of Wetlands, Oceans, and Watershedswww.epa.gov/owow
1 Allen, J. & K. Lu. 2003. Modeling and Prediction of FutureUrban Growth in the Charleston Region of South Carolina:a GIS-based Integrated Approach. Conservation Ecology 8(2):2.www.consecol.org/vol8/iss2/art2
Shellfish bed closure photo/S.C. Sea Grant Extension
Stormwater runoff photo/S.C. Sea Grant Extension
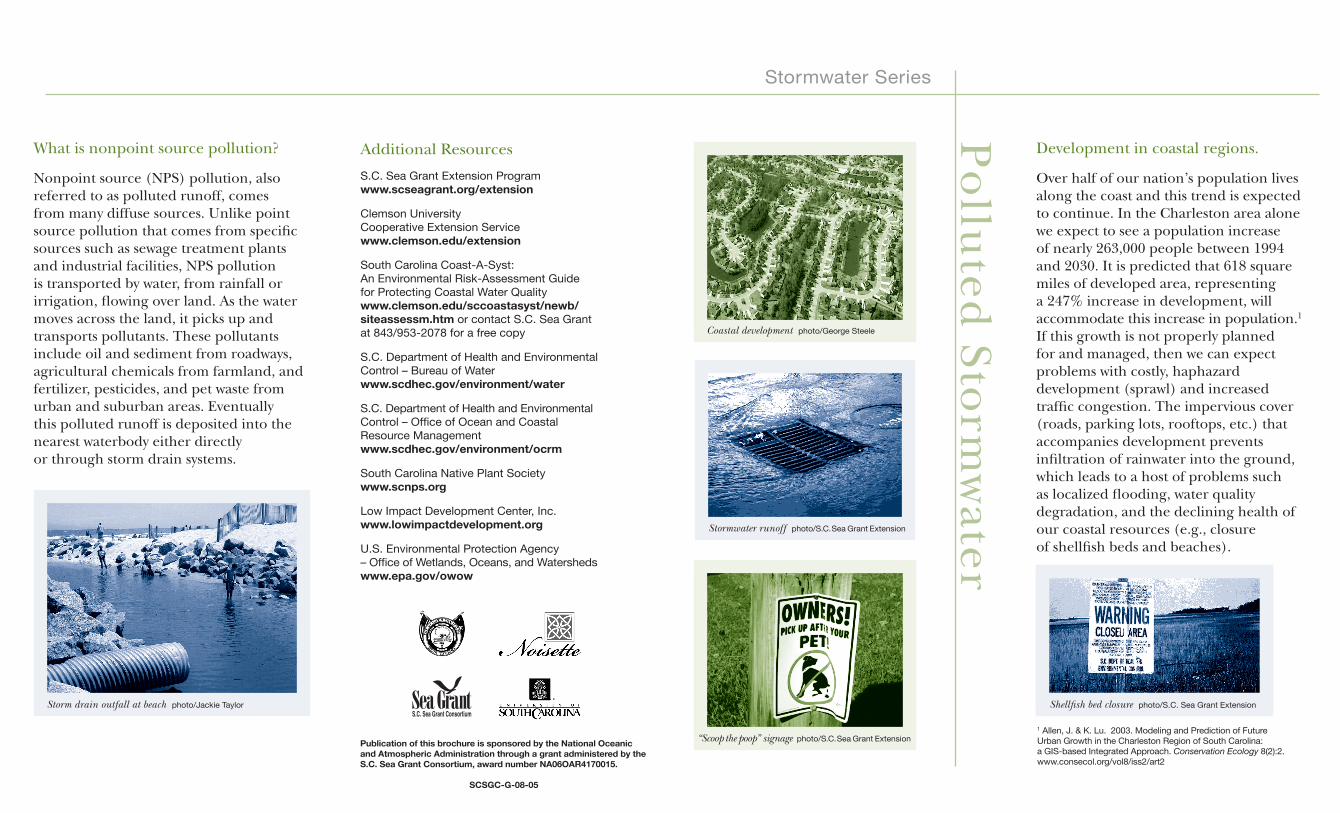
“Scoop the poop” signage photo/S.C. Sea Grant Extension
Coastal development photo/George Steele
Publication of this brochure is sponsored by the National Oceanic and Atmospheric Administration through a grant administered by the S.C. Sea Grant Consortium, award number NA06OAR4170015.
SCSGC-G-08-05
Po
lluted
Storm
water
Storm drain outfall at beach photo/Jackie Taylor
Apply fertilizers and pesticidessparingly and according todirections. For more information,contact your local ClemsonUniversity CooperativeExtension Service atwww.clemson.edu/extension.
Reduce bacteria by picking up after your pets and disposingof the pet waste appropriately.
Wash your car on your lawn(or other pervious areas) where the chemicals can be absorbed into the soil rather than draining into the nearest creek or pond.
Dispose of lawn clippings in a compost pile.
3
Everyone can play a large role in reducing our impact on receiving waterbodies. Limit your load of pollutants into the environment through these activities:
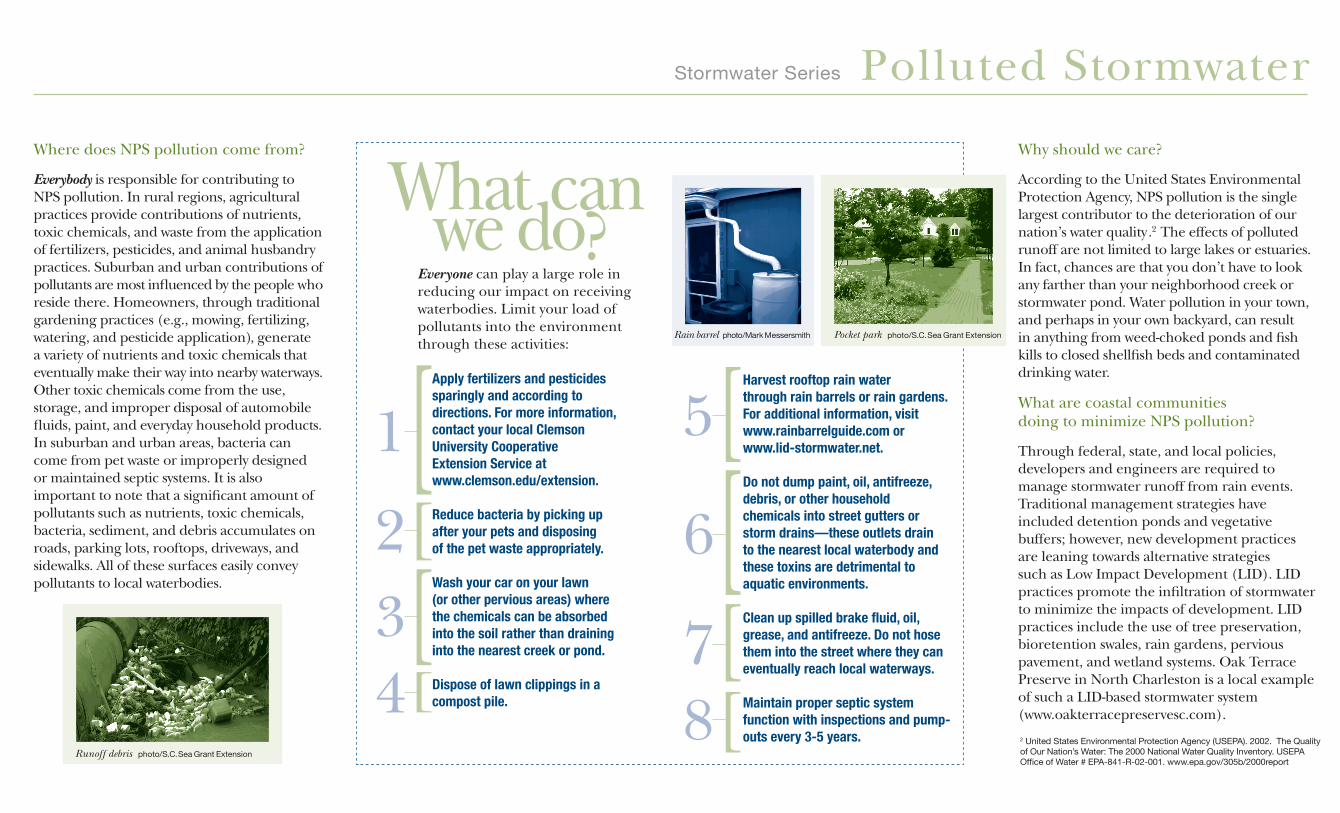
Harvest rooftop rain waterthrough rain barrels or rain gardens. For additional information, visitwww.rainbarrelguide.com orwww.lid-stormwater.net.
Do not dump paint, oil, antifreeze, debris, or other householdchemicals into street gutters or storm drains—these outlets drain to the nearest local waterbody and these toxins are detrimental to aquatic environments.
Clean up spilled brake fluid, oil, grease, and antifreeze. Do not hose them into the street where they can eventually reach local waterways.
Maintain proper septic system function with inspections and pump-outs every 3-5 years.
[[
[[[[[4
[
What can we do?Where does NPS pollution come from?
Everybody is responsible for contributing to NPS pollution. In rural regions, agricultural practices provide contributions of nutrients, toxic chemicals, and waste from the application of fertilizers, pesticides, and animal husbandry practices. Suburban and urban contributions of pollutants are most influenced by the people who reside there. Homeowners, through traditional gardening practices (e.g., mowing, fertilizing, watering, and pesticide application), generate a variety of nutrients and toxic chemicals that eventually make their way into nearby waterways. Other toxic chemicals come from the use, storage, and improper disposal of automobile fluids, paint, and everyday household products. In suburban and urban areas, bacteria can come from pet waste or improperly designed or maintained septic systems. It is also important to note that a significant amount of pollutants such as nutrients, toxic chemicals, bacteria, sediment, and debris accumulates on roads, parking lots, rooftops, driveways, and sidewalks. All of these surfaces easily convey pollutants to local waterbodies.
Stormwater Series
Why should we care?
According to the United States EnvironmentalProtection Agency, NPS pollution is the single largest contributor to the deterioration of our nation’s water quality.2 The effects of pollutedrunoff are not limited to large lakes or estuaries.In fact, chances are that you don’t have to look any farther than your neighborhood creek or stormwater pond. Water pollution in your town, and perhaps in your own backyard, can result in anything from weed-choked ponds and fish kills to closed shellfish beds and contaminated drinking water.
What are coastal communitiesdoing to minimize NPS pollution?
Through federal, state, and local policies, developers and engineers are required to manage stormwater runoff from rain events. Traditional management strategies have included detention ponds and vegetative buffers; however, new development practices are leaning towards alternative strategies such as Low Impact Development (LID). LID practices promote the infiltration of stormwater to minimize the impacts of development. LID practices include the use of tree preservation, bioretention swales, rain gardens, pervious pavement, and wetland systems. Oak Terrace Preserve in North Charleston is a local example of such a LID-based stormwater system(www.oakterracepreservesc.com).
2 United States Environmental Protection Agency (USEPA). 2002. The Quality of Our Nation’s Water: The 2000 National Water Quality Inventory. USEPA Office of Water # EPA-841-R-02-001. www.epa.gov/305b/2000report
Polluted Stormwater
Runoff debris photo/S.C. Sea Grant Extension
Rain barrel photo/Mark Messersmith Pocket park photo/S.C. Sea Grant Extension